Embed Size (px)
Citation preview


a more prosperous and secure future
Our Missionfinancial solutions to create and nurture long-term relationships with our
customers. In doing so, we ensure that our shareholders can investwith confidence in us
Our ValuesThe standards and principles which determine our behavior and how we
interact with our customers and each other
Credit Rating

Board of Directors
Audit Committee
3
ChairmanMemberMemberMember

4 5
Directors’ Report - March 2020
Rs. in Million
On behalf of the Board of Directors, weare pleased to place before you, the unconsolidated condensed interim financial statements of MCB Bank Limited(MCB) for the three months period ended March31, 2020.
Introduction
The COVID - 19 pandemic has taken a toll on all economies and emerged as a contagion risk around the globe, including Pakistan. To reduce the impact on businesses and economies in general, regulators / governments across the globe have introduced a host of measures on both the fiscal and economic fronts. The State Bank of Pakistan (SBP) has also responded to the crisis by cutting the Policy Rate by 225 basis points to 11% in March 2020 and again by 200 basis points to 9% on April 16, 2020. Moreover, few schemes covering principal deferments, loan restructuring and salary re-financing have been announced to provide overall relief to borrowers in these testing times.
The Bank is closely monitoring the situation and has invoked required actions to ensure the safety and security of Bank staff whileuninterrupted service to its large customer base. The senior management of the Bank is continuously monitoring the situation and is taking timely decisions to resolve any concerns. The risks and related measures adopted by the Bank to mitigate the impact associated with the outbreak of COVID-19 are detailed in note 6 of the unconsolidated financial statements.
Performance Review
10,8654,346
6,519
55,778
22
55,800 62,319
652
5,925
6,557
55,742
Profit Before Taxation
Taxation
Profit After Taxation
Un-appropriated Profit Brought ForwardTransfer in respect of incremental depreciation from surplus on revaluation of fixed assets to unappropriated profit - net of tax
Profit Available for Appropriation
Appropriations:
Statutory Reserve
Final Cash Dividend at Rs. 5.0 per share - December 2019
Total Appropriations
Un-appropriated Profit Carried Forward
MCB's Profit After Tax (PAT) for the three months period ended March 31, 2020 increased by 28% to Rs. 6.519 billion. The strategic maturity profiling of the investments based on the anticipated interest rate calls resulted in a gradual shift from shorter to longer term investments over the last 12 months period, thereby capitalizing on the significant opportunity available. Net interest income rose to Rs. 16.31 billion, 21% higher than the corresponding last period. Analysis of the interest earning assets highlights that income on advances increased by Rs. 1.8 billion, primarily on account of increase in yield of 176bps. On the investment side, gross markup income increased by Rs. 10.94 billion, due to increased average volume by Rs. 207 billion and improved yield of 312bps. On the interest bearing liabilities side, the cost of deposits increased by 197bps as compared to corresponding last period.
On the operating expenses side excluding pension fund, despite the surge in inflationary pressures, the Bank was able to contain the growth in administrative expenses and reported a net decrease of Rs. 24 million as compared to corresponding last period. The control in administrative expense base is resultant of the expense management drive undertaken by the Bank in 2019. The stock market has responded to the COVID-19 pandemic with worrying volatility; resultantly, Bank has recorded a charge of Rs. 765 million against equity investment portfolio. The quality of the loan book is duly reflected in a muted net charge of Rs. 47.3 million for the first quarter 2020.
On the financial position side, the total asset base of the Bank on an unconsolidated basis was reported at Rs. 1.56 trillion depicting an increase of 3% over December 2019. Analysis of the asset mix highlights that net investments increased by Rs. 88
billion (12%) whereas gross advances decreased by Rs 15.5 billion (-3%) over December 2019.
The Non-performing loan (NPLs) base of the Bank recorded a marginal increase of Rs. 511 million and was reported at Rs. 49.93 billion. The Increase was primarily on account of currency devaluation impact of foreign currency denominated NPLs with no significant accretion in the number of cases. The Bank has not taken FSV benefit in calculation of specific provision. The coverage and infection ratios of the Bank were reported at 87.30% and 9.52% respectively.
On the liabilities side, the deposit base of the Bank registered an increase of Rs. 39.38 billion (+3.44%) over December 2019 whereas CASA base increase by 5.35%.
Return on Assets and Return on Equity improved to 1.70% and 17.88% respectively, whereas book value per share was reported at Rs. 123.57.
While complying with the regulatory capital requirements, The Bank's total Capital Adequacy Ratio is 19.51% against the requirement of 11.50% (including capital conservation buffer of 1.50% as reduced under the BPRD Circular Letter No. 12 of 2020). Quality of the capital is evident from Bank's Common Equity Tier-1 (CET1) to total risk weighted assets ratio which comes to 15.38% against the requirement of 6.00%. Bank's capitalization also resulted in a leverage ratio of 6.94% which is well above the regulatory limit of 3.0%. The Bank reported Liquidity Coverage Ratio (LCR) of 218.11% and Net Stable Funding Ratio (NSFR) of 157.55% against requirement of 100.
The Board of Directors has declared interim cash dividend of Rs 5 per share.Earnings per share (EPS) for the period ended March 31, 2020 was Rs. 5.50 per share as compared to Rs. 4.29 for comparative period.
RatingsThe Bank enjoys highest local credit ratings of AAA / A1+ categories for long term and short term respectively, based on PACRA notification dated June 27, 2019.
Economy ReviewThe first quarter of 2020 proved to be challenging for the government due to the outbreak of Novel Coronavirus in Pakistan and the subsequent lock down in the country. The macro-economic variables took a hit in the last month of the quarter despite continued efforts of the government and central bank to combat issues on both, domestic and external fronts.
On the external front, during the first two months of 2020, exports declined by 2.5% while imports contracted by 5%. Workers' remittances, on the other hand, showed a significant growth of 15%, consequently, the current account deficit dropped by 35%. During the first eight months of FY20, current account deficit declined by 71%. In spite of the consistent improvement in the current account, the pressure on the foreign exchange reserves increased towards the end of the quarter because of uncertainty surrounding the impact of coronavirus on the economy. Out of the total investment of USD 3.49bn in government debt during the current fiscal year, foreign investors divested USD 1.8bn in March, 2020. On account of the portfolio outflows and external debt repayments, total foreign exchange reserves of the country declined by USD 1.5bn, while the reserves of SBP decreased by USD 1.6bn in March.
As a result, PKR depreciated by 8.1% against the US Dollar during March, 2020 and stood at PKR 166.7037 at the end of the quarter. During the three month period, PKR recorded a total depreciation of 7.6%. On a fiscal year to date basis, PKR depreciated by 4.2%.
On the domestic front, the government imposed a partial lockdown in the country in March to contain the spread of coronavirus. Consequently, FBR tax collection during the month fell short of its target by Rs261 billion. Moreover, government announced an Economic Relief Package worth PKR 1.2 trillion to combat the impact of the virus on the economy.

7
6
Meanwhile, Headline Inflation (Base Year 2015-2016) touched a peak of 14.6% in January, 2020 before dropping to 10.2% in March, 2020. On average, National CPI stood at 12.4% in Q1 of 2020. Declining inflationary trend in the economy due to constrained demand coupled with the need to support the ailing economy under lockdown, the SBP cut its policy rate by a cumulative 225 basis points during the month of March The current policy rate and again by 200 basis points on April 16, 2020.now stands at 9%.
Future OutlookDespite improvement appearing on the macroeconomic front during the first two months of 2020, the remaining year may pose new challenges for the economy of Pakistan as a result of Novel Coronavirus. The main issues that the government has to tackle are the containment of the disease in the country and minimization of economic losses owing to the shutdown of the businesses in the country. The persisting lockdown in Pakistan and major economies across the world is expected to have a negative impact on the projected GDP growth of Pakistan. Other contributors of downward growth projections include decline in imports and exports, reduction in remittances, loss in FBR's revenue, and disruption in food supplies.
Appreciation and AcknowledgementsThe Board of Directors of MCB Bank Limited would like to thank the Government of Pakistan, the State Bank of Pakistan, the Securities & Exchange Commission of Pakistan and other regulatory bodies for their continued support, all shareholders and customers of the Bank for their trust, and our employees for their continuous dedication and commitment.
For and on behalf of the Board of Directors,
Imran Maqbool
April 22, 2020
Mian Umer Mansha
Director

8 9

Note Unaudited March 31, 2020
Audited December 31, 2019
ASSETS
Cash and balances with treasury banks 7 94,129,555
132,704,797
Balances with other banks 8 15,169,519
12,542,239
Lendings to financial institutions 9 9,576,504
1,090,058
Investments 10 836,659,605
748,764,502
Advances 11 480,925,150
496,678,874
Fixed assets 12 58,019,668
58,271,245
Intangible assets 13 941,079
957,552
Deferred tax assets -
-
Other assets 14 59,794,559
64,142,748
1,555,215,639
1,515,152,015
LIABILITIES
Bills payable 16 7,972,205
11,821,698
Borrowings 17 88,651,775 89,505,892
Deposits and other accounts 18 1,184,138,883 1,144,763,259 Liabilities against assets subject to finance lease - - Subordinated debt - - Deferred tax liabilities 19 10,425,017 5,850,645 Other liabilities 20 85,381,963
94,295,738
1,376,569,843
1,346,237,232
178,645,796
168,914,783
Share capital 11,850,600
11,850,600
Reserves 21 78,842,984
77,591,253
Surplus on revaluation of assets 22 32,210,546
23,695,441
Unappropriated profit 55,741,666
55,777,489
178,645,796
168,914,783
23
The annexed notes 1 to 41 form an integral part of these unconsolidated condensed interim financial statements.
---------Rupees in '000---------
Unconsolidated Condensed Interim Statement of Financial PositionAs at March 31, 2020
10 11
For the three months period ended March 31, 2020
Note
Three months ended March
31, 2020
Three months ended March
31, 2019
Mark-up / return / interest earned 25 39,099,628
27,381,919
Mark-up / return / interest expensed 26 22,791,928 13,903,165
Net mark-up / interest income 16,307,700 13,478,754
Fee and commission income 27 2,845,649 2,814,218
Dividend income 223,600 189,382
Foreign exchange income 725,167 441,325
(Loss) / income from derivatives (10,405) 15,730
Gain on securities 28 71,139 11,433
Other Income 29 32,535 42,367
Total non-markup / interest Income 3,887,685 3,514,455
Total Income 20,195,385 16,993,209
Operating expenses 30 8,161,432 8,170,226
Workers welfare fund 217,299 181,587
Other charges 31 209,255 46,195
Total non-markup / interest expenses 8,587,986 8,398,008
11,607,399 8,595,201
Provisions / (reversals) and write offs - net 32 742,462 (484,157)
Extra ordinary / unusual items - -
10,864,937 9,079,358
Taxation 33 4,345,911 3,999,499
6,519,026 5,079,859
Basic and diluted earnings per share 34 5.50 4.29
The annexed notes 1 to 41 form an integral part of these unconsolidated condensed interim financial statements.
---------Rupees in '000---------
Rupees
Hammad Khalid
Chief Financial Officer Masood Ahmed Puri
Director Salman Khalid Butt
Director Imran Maqbool
Mian Umer Mansha
Director President / CEO Hammad Khalid
Chief Financial Officer Masood Ahmed Puri
Director Salman Khalid Butt
Director Imran Maqbool
Mian Umer Mansha
Director President / CEO

12
13
Other comprehensive income
Effect of translation of net investment in foreign branches
Movement in surplus on revaluation of investments - net of tax
Total comprehensive income
The annexed notes 1 to 41 form an integral part of these unconsolidated condensed interim financial statements.
Three months ended March 31,
2020
Three months ended March 31,
2019
6,519,026
5,079,859
599,828 327,826 8,537,459
493,155
9,137,287
820,981
15,656,313
5,900,840
---------Rupees in '000---------
Unconsolidated Condensed Interim Statement of Comprehensive Income (Un-audited) Unconsolidated Condensed Interim Statement of Changes in Equity (Un-audited)
Reve
nue
rese
rve
Inve
stm
ents
Fixe
d / n
on-
bank
ing
asse
ts
Bala
nce
as a
t Dec
embe
r 31,
201
811
,850
,600
23,7
51,1
14
908,
317
1,62
9,54
3
29,2
59,0
07
18,6
00,0
00
(2,7
58,1
44)
12,5
05,2
4853
,532
,044
149,
277,
729
Tota
l com
preh
ensi
ve in
com
e fo
r the
per
iod
ende
d M
arch
31,
201
9
Prof
it af
ter t
axat
ion
for t
he p
erio
d en
ded
Mar
ch 3
1, 2
019
-
-
-
-
-
-
--
5,07
9,85
95,
079,
859
Oth
er c
ompr
ehen
sive
inco
me
- net
of t
ax-
-
-
327,
826
-
-
493,
155
--
820,
981
-
-
-
327,
826
-
-
493,
155
-5,
079,
859
5,90
0,84
0
Tran
sfer
to s
tatu
tory
rese
rve
-
-
-
-
507,
986
-
--
(507
,986
)-
Tra
nsfe
r in
resp
ect o
f inc
rem
enta
l dep
recia
tion
from
sur
plus
on
reva
luat
ion
of
fixed
ass
ets
to u
napp
ropr
iate
d pr
ofit
- net
of t
ax-
-
-
-
-
-
-(1
3,35
0)13
,350
-
Tran
sact
ions
with
ow
ners
, rec
orde
d di
rect
ly in
equ
ity
Fina
l cas
h di
viden
d at
Rs.
4.0
per
sha
re -
Dece
mbe
r 31,
201
8-
-
-
-
-
-
--
(4,7
40,2
40)
(4,7
40,2
40)
-
-
-
-
-
-
--
(4,7
40,2
40)
(4,7
40,2
40)
Bala
nce
as a
t Mar
ch 3
1, 2
019
11,8
50,6
00
23,7
51,1
14
908,
317
1,95
7,36
9
29,7
66,9
93
18,6
00,0
00
(2,2
64,9
89)
12,4
91,8
9853
,377
,027
150,
438,
329
Chan
ge in
equ
ity fo
r nin
e m
onth
s pe
riod
ende
d De
cem
ber 3
1, 2
019
Tota
l com
preh
ensi
ve in
com
e fo
r the
nin
e m
onth
s pe
riod
ende
d De
cem
ber 3
1, 2
019
Prof
it af
ter t
axat
ion
for t
he n
ine
mon
ths
perio
d en
ded
Dece
mbe
r 31,
201
9-
-
-
-
-
-
--
18,8
96,9
8018
,896
,980
Oth
er c
ompr
ehen
sive
inco
me
- net
of t
ax-
-
-
717,
762
-
-
6,48
2,73
67,
074,
117
(474
,421
)13
,800
,194
-
-
-
717,
762
-
-
6,48
2,73
67,
074,
117
18,4
22,5
5932
,697
,174
Tran
sfer
to s
tatu
tory
rese
rve
-
-
-
-
1,88
9,69
8
-
--
(1,8
89,6
98)
-
Tra
nsfe
r in
resp
ect o
f inc
rem
enta
l dep
recia
tion
from
sur
plus
on
reva
luat
ion
of
fixed
ass
ets
to u
napp
ropr
iate
d pr
ofit
- net
of t
ax-
-
-
-
-
-
-(3
9,89
8)39
,898
-
Sur
plus
real
ized
on d
ispos
al o
f rev
alue
d fix
ed a
sset
s - n
et o
f tax
-
-
-
-
-
-
-(1
0,56
0)10
,560
-
Sur
plus
real
ized
on d
ispos
al o
f non
-ban
king
asse
ts -
net o
f tax
-
-
-
-
-
-
-(3
7,86
3)37
,863
-
Tran
sact
ions
with
ow
ners
, rec
orde
d di
rect
ly in
equ
ity-
Inte
rim c
ash
divid
end
at R
s. 4
.0 p
er s
hare
- M
arch
31,
201
9-
-
-
-
-
-
--
(4,7
40,2
40)
(4,7
40,2
40)
Inte
rim c
ash
divid
end
at R
s. 4
.0 p
er s
hare
- Ju
ne 3
0, 2
019
-
-
-
-
-
-
--
(4,7
40,2
40)
(4,7
40,2
40)
Inte
rim c
ash
divid
end
at R
s. 4
.0 p
er s
hare
- Se
ptem
ber 3
0, 2
019
-
-
-
-
-
-
--
(4,7
40,2
40)
(4,7
40,2
40)
-
-
-
-
-
-
--
(14,
220,
720)
(14,
220,
720)
Bala
nce
as a
t Dec
embe
r 31,
201
911
,850
,600
23,7
51,1
14
908,
317
2,67
5,13
1
31,6
56,6
91
18,6
00,0
00
4,21
7,74
719
,477
,694
55,7
77,4
8916
8,91
4,78
3
Tota
l com
preh
ensi
ve in
com
e fo
r the
per
iod
ende
d M
arch
31,
202
0
Prof
it af
ter t
axat
ion
for t
he p
erio
d en
ded
Mar
ch 3
1, 2
020
-
-
-
-
-
-
--
6,51
9,02
66,
519,
026
Oth
er c
ompr
ehen
sive
inco
me
- net
of t
ax-
--
599,
828
--
8,53
7,45
9-
-9,
137,
287
--
-59
9,82
8-
-8,
537,
459
-6,
519,
026
15,6
56,3
13
Tran
sfer
to s
tatu
tory
rese
rve
--
--
651,
903
--
-(6
51,9
03)
-
Tra
nsfe
r in
resp
ect o
f inc
rem
enta
l dep
recia
tion
from
sur
plus
on
reva
luat
ion
of
fixed
ass
ets
to u
napp
ropr
iate
d pr
ofit
- net
of t
ax-
--
--
--
(22,
354)
22,3
54-
Tran
sact
ions
with
ow
ners
, rec
orde
d di
rect
ly in
equ
ity
Fina
l cas
h di
viden
d at
Rs.
5.0
per
sha
re -
Dece
mbe
r 31,
201
9-
--
--
--
-(5
,925
,300
)(5
,925
,300
)
--
--
--
--
(5,9
25,3
00)
(5,9
25,3
00)
Bala
nce
as a
t Mar
ch 3
1, 2
020
11,8
50,6
0023
,751
,114
908,
317
3,27
4,95
932
,308
,594
18,6
00,0
0012
,755
,206
19,4
55,3
4055
,741
,666
178,
645,
796
For d
etai
ls of
divi
dend
dec
lara
tion
and
appr
opria
tions
, ple
ase
refe
r not
e 39
to th
ese
unco
nsol
idat
ed c
onde
nsed
inte
rim f
inan
cial s
tate
men
ts.
For d
etai
ls of
rese
rves
, ple
ase
refe
r not
e 21
to th
ese
unco
nsol
idat
ed c
onde
nsed
inte
rim f
inan
cial s
tate
men
ts.
The
anne
xed
note
s 1
to 4
1 fo
rm a
n in
tegr
al p
art o
f the
se u
ncon
solid
ated
con
dens
ed in
terim
fin
ancia
l sta
tem
ents
.
------
------
------
------
------
------
------
------
------
------
------
------
------
------
------
-----R
upees
in '0
00---
------
------
------
------
------
------
------
------
------
------
------
------
------
------
------
--
Capi
tal r
eser
ve S
tatu
tory
rese
rve
Sha
re c
apita
l
Surp
lus/
(def
icit)
on re
valu
atio
n of
Sha
re p
rem
ium
No
n- d
istrib
utab
le
capi
tal r
eser
ve
Exch
ange
trans
latio
n re
serv
e G
ener
al re
serv
e
Una
ppro
pria
ted
prof
it T
otal
For the three months period ended March 31, 2020 For the three months period ended March 31, 2020
Hammad Khalid
Chief Financial Officer Masood Ahmed Puri
Director Salman Khalid Butt
Director Imran Maqbool
Mian Umer Mansha
Director President / CEO Hammad Khalid
Chief Financial Officer Masood Ahmed Puri
Director Salman Khalid Butt
Director Imran Maqbool
Mian Umer Mansha
Director President / CEO

14 15
Unconsolidated Condensed Interim Cash Flow Statement (Un-audited) Notes to the Unconsolidated Condensed Interim Financial Statements (Un-audited)
Note Three months ended March 31,
2020
Three months ended March 31,
2019----------Rupees in '000--------
Profit before taxation 10,864,937 9,079,358
Less: Dividend income (223,600)
(189,382)
10,641,337
8,889,976
Adjustments:
Depreciation on fixed assets 30 492,818
474,861
Depreciation on right of use assets 30 301,049
-
Depreciation on non-banking assets acquired in satisfaction of claims 30 8,074
12,062
Amortization 30 76,553
56,409
Provisions / (reversals) and write offs - net 32 742,462
(484,157)
Workers welfare fund 217,299
181,587
Gain on sale of fixed assets and non-banking assets acquired-net 29 (17,360)
(21,245)
Charge for defined benefit plans 57,000
42,000
Interest expensed on lease liability against right-of-use assets 276,782 -
Unrealized (gain)/loss on revaluation of investments classified as held for trading 28 (692) 4,320
2,153,985 265,837
12,795,322 9,155,813 Decrease / (increase) in operating assets
Lendings to financial institutions (8,486,446) (166,777,017) Held-for-trading securities (5,430,713) 8,156,215 Advances 15,747,700 3,829,183 Others assets (excluding advance taxation) 4,104,608 (1,045,139)
5,935,149 (155,836,758) Increase / (decrease) in operating liabilities Bills Payable (3,849,493)
(5,320,860)
Borrowings from financial institutions (2,562,249)
(144,806,507)
Deposits 39,375,624
16,975,039 Other liabilities (excluding current taxation) (10,069,437)
(4,449,473)
22,894,445
(137,601,801) Defined benefits paid (82,171)
(84,302)
Income tax paid (3,062,100)
(1,130,889)
Net cash flow from operating activities 38,480,645
(285,497,937)
Net investments in available-for-sale securities (82,284,093)
291,504,392
Net investments in held-to-maturity securities 12,202,230
235,795
Dividends received 124,297
92,893
Investments in fixed assets (494,111)
(1,499,289)
Investments in Intangible assets (61,707)
(37,753)
Proceeds from sale of fixed assets 25,356
24,338
Effect of translation of net investment in foreign branches 599,828
327,826
Net cash flow used in investing activities (69,888,200)
290,648,202
Payment of lease liability against right-of-use-assets (382,191)
-
Dividend paid (5,866,348)
(46,257)
Net cash flow used in financing activities (6,248,539)
(46,257)
(37,656,094)
5,104,008
Increase in cash and cash equivalentsCash and cash equivalents at beginning of the period 143,897,589 113,181,408
Cash and cash equivalents at end of the period 106,241,495 118,285,416
The annexed notes 1 to 41 form an integral part of these unconsolidated condensed interim financial statements.
For the three months period ended March 31, 2020 For the three months period ended March 31, 2020
1.
2.
2.1
2.2
2.3
3.
3.1
In accordance with the directives of the Federal Government regarding the shifting of the banking system to Islamic modes, the State Bank of Pakistan has issued various circulars from time to time. Permissible forms of trade-related modes of financing include purchase of goods by banks from their customers and immediate resale to them at appropriate profit in price on deferred payment basis. The purchases and sales arising under these arrangements are not reflected in these unconsolidated condensed interim financial statements as such but are restricted to the amount of facility actually utilized and the appropriate portion of profit thereon.
The unconsolidated condensed interim financial statements are presented in Pak Rupees, which is the Bank's functional and presentation currency. The amounts are rounded off to the nearest thousand.
2.4 These unconsolidated condensed interim financial statements have been prepared under the historical cost convention except that certain classes of fixed assets and non-banking assets acquired in satisfaction of claims are stated at revalued amounts and certain investments and derivative financial instruments have been marked to market and are carried at fair value. In addition, obligations in respect of staff retirement benefits are carried at present value.
These unconsolidated condensed interim financial statements have been prepared in accordance with the accounting and reporting standards as applicable in Pakistan for interim financial reporting. The accounting and reporting standards as applicable in Pakistan for interim financial reporting comprise of:
- Provisions of and directives issued under the Banking Companies Ordinance, 1962 and the Companies Act, 2017; and
3.2
3.3
3.4
3.5
There are certain new standards and interpretations of and amendments to existing accounting standards that have become applicable to the Bank for accounting periods beginning on or after January 1, 2020. These are considered either to not be relevant or not to have any significant impact on the Bank's unconsolidated condensed interim financial statements.
Amendments to approved accounting standards that are effective in the current period
Hammad Khalid
Chief Financial Officer Masood Ahmed Puri
Director Salman Khalid Butt
Director Imran Maqbool
Mian Umer Mansha
Director President / CEO

16 17
Notes to the Unconsolidated Condensed Interim Financial Statements (Un-audited) Notes to the Unconsolidated Condensed Interim Financial Statements (Un-audited)For the three months period ended March 31, 2020 For the three months period ended March 31, 2020
3.6 Standards, interpretations of and amendments to approved accounting standards that are not yet effective
The following new standards and amendments to existing accounting standards will be effective from the dates mentioned below against the respective standard or amendment:
Effective date (annual periodsbeginning on or after)
IAS 1, Presentation of Financial Statements (Amendments)
IFRS 17, Insurance Contracts
JANUARY 1, 2022
JANUARY 1, 2021
The SECP, through SRO 229(I)/2019 dated February 14, 2019, has notified that IFRS 9, Financial Instruments, is applicable for accounting periods ending on or after June 30, 2019. However, as per BPRD Circular No. 04 of 2019 dated October 23, 2019 of SBP, effective date of IFRS 9 implementation is January 01, 2021.
IFRS 9, Financial Instruments: Classification and Measurement, addresses recognition, classification, measurement and derecognition of financial assets and financial liabilities. The standard has also introduced a new impairment model for financial assets which requires recognition of impairment charge based on an 'expected credit losses' (ECL) approach rather than the 'incurred credit losses' approach as currently followed. The ECL approach has an impact on all assets of the Bank which are exposed to credit risk. The Bank is in the process of assessing the full impact of this standard.
There are other new and amended standards and interpretations that are mandatory for the Bank's accounting periods beginning on or after January 1, 2021 but are considered not to be relevant or do not have any significant effect on the Bank's operations and are therefore not detailed in these unconsolidated financial statements.
4 SIGNIFICANT ACCOUNTING POLICIES
The significant accounting policies and methods of computation adopted in the preparation of these unconsolidated condensed interim financial statements are consistent with those applied in the preparation of the audited annual unconsolidated financial statements of the Bank for the year ended December 31, 2019.
The Risk Management function of the Bank is regularly conducting assessments of the credit portfolio to identify borrowers most likely to get affected due to changes in the business and economic environment. The Bank has further strengthened its risk appetite and related credit review procedures in the light of COVID-19, which would insulate the Bank from any unforeseen shock .
6.1
5 CRITICAL ACCOUNTING ESTIMATES AND JUDGMENTS
The basis for accounting estimates adopted in the preparation of these unconsolidated condensed interim financial statements are the same as that applied in the preparation of the unconsolidated financial statements for the year ended December 31, 2019.
6 FINANCIAL RISK MANAGEMENT
Credit Risk Management
The financial risk management objectives and policies adopted by the Bank are consistent with those disclosed in the unconsolidated financial statements for the year ended December 31, 2019. These risk management policies continue to remain robust and the Bank is reviewing its portfolio regularly and conducts rapid portfolio reviews in line with emerging risks.
The COVID - 19 pandemic has taken a toll on all economies and emerged as a contagion risk around the globe, including Pakistan. To reduce the impact on businesses and economies in general, regulators / governments across the globe have introduced a host of measures on both the fiscal and economic fronts.
The State Bank of Pakistan (SBP) has also responded to the crisis by cutting the Policy Rate by 225 basis points to 11% in March 2020 and again by 200 basis points to 9% on April 16, 2020. Other regulatory measures to provide an impetus to economic activity include the following:
– Reduction in the capital conservation buffer by 100 basis points to 1.5%;– Increasing the regulatory limit on extension of credit to SMEs to Rs 180 million;– Relaxing the debt burden ratio for consumer loans from 50% to 60%;– Allowing banks to defer borrowers’ principal loan payments by one year; and– Relaxing regulatory criteria for restructured/rescheduled loans for borrowers who require relief of principal repayment exceeding one year and / or mark-up.
COVID 19 has impacted the banks in Pakistan from various facets which include muted credit risk increase reduced fee income due to slowdown in economic activity, branch closures and cyber security threat management.
The Asset and Liability Committee (ALCO) of the Bank is continuously monitoring the liquidity position and the Bank is confident that the liquidity buffer currently maintained is sufficient to address any requirement, as reflected by the cushion in liquidity ratios above the statutory requirement.
6.2 Liquidity Risk Management
During the current quarter the Pakistan Stock Exchange fell by 28%, triggering an impairment of Rs 3,053.209 million. The Bank has only recorded an impairment of Rs 765.363 million in the first quarter and has deferred the recognition of the remaining impairment to the remainder part of the calendar year 2020 as allowed State Bank of Pakistan.
6.3 Equity Risk Management
The Bank is closely monitoring the situation and has invoked required actions to ensure the safety and security of Bank staff while ensuring uninterrupted service to customers. The senior management of the Bank is continuously monitoring the situation and is taking timely decisions to resolve any concerns.
6.4
Operational Risk Management
Business Continuity Plans (BCP) for respective areas are in place and duly tested. The Bank has significantly enhanced monitoring of cyber security risk during these times. The remote work capabilities were enabled for staff, where required and related risk and control measures were assessed to ensure that the Bank’s assets are protected from emerging cyber threats and comply with the regulatory protocols. The Bank is communicating with its customers for their financial transactions to be conducted through digital channel offerings. The Bank has taken all measures to ensure that service levels are maintained, customer complaints are resolved and turnaround times are monitored to meet customer requirements and expectations.
In order to encourage Banks to continue lending, the SBP has relaxed the Capital Conversion Buffer (CCB) requirements to 1.5%, resulting in a 1% decline in CAR requirements for all Tiers.
6.5 Capital Adequacy Ratio (CAR)
18 19
Notes to the Unconsolidated Condensed Interim Financial Statements (Un-audited)For the three months period ended March 31, 2020
Notes to the Unconsolidated Condensed Interim Financial Statements (Un-audited)For the three months period ended March 31, 2020
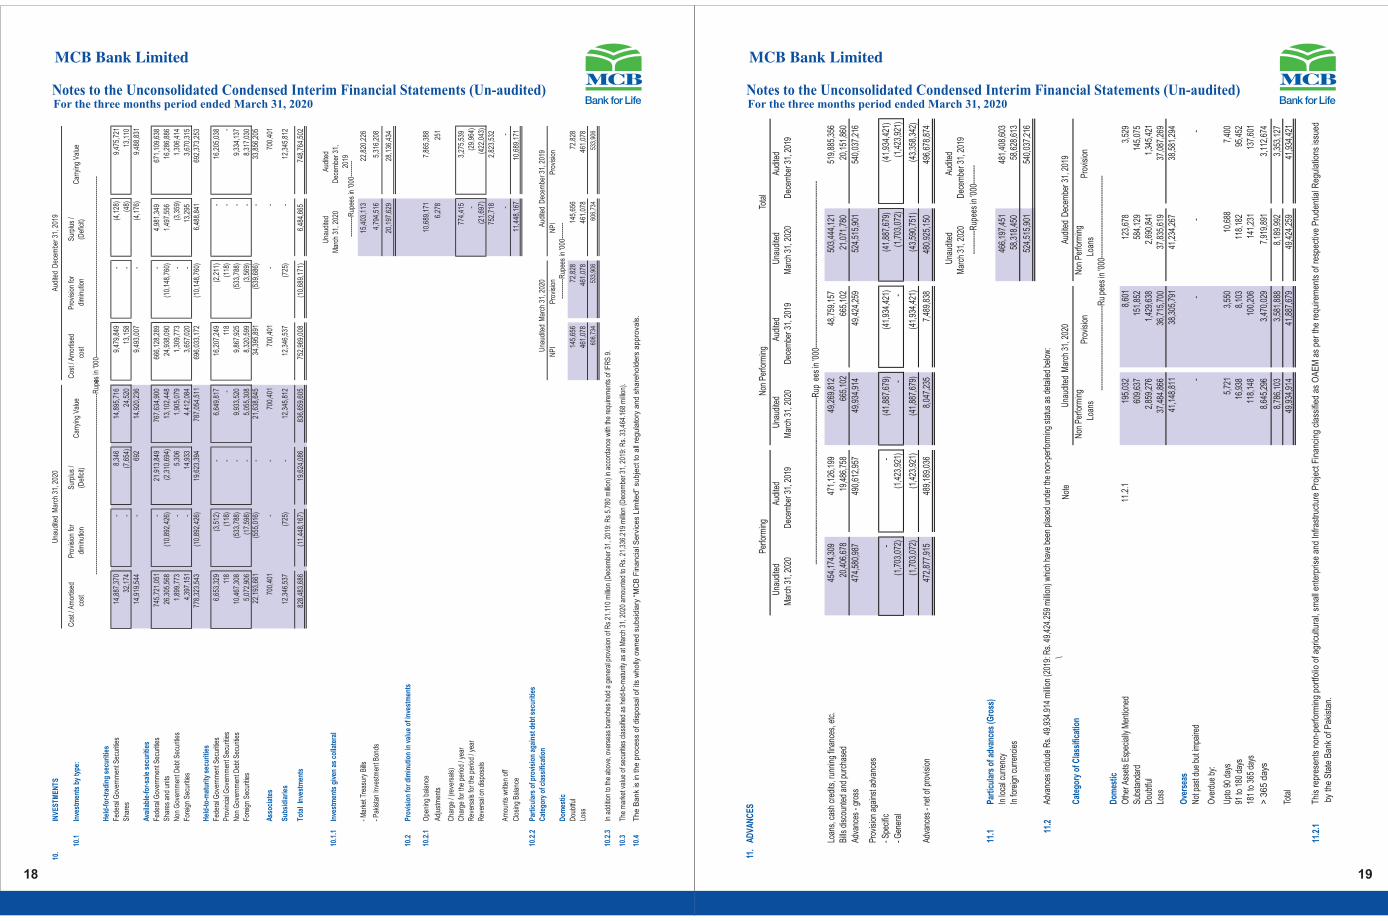
11.
AD
VAN
CES
Loan
s, c
ash
cred
its, r
unni
ng fi
nanc
es, e
tc.
454,
174,
309
471,
126,
199
49,2
69,8
12
48,7
59,1
57
503,
444,
121
519,
885,
356
Bills
dis
coun
ted
and
purc
hase
d 20
,406
,678
19,4
86,7
58
665,
102
665,
102
21,0
71,7
80
20,1
51,8
60
Adva
nces
- gr
oss
474,
580,
987
490,
612,
957
49,9
34,9
14
49,4
24,2
59
524,
515,
901
540,
037,
216
Prov
isio
n ag
ains
t adv
ance
s
- Spe
cific
-
-
(41,
887,
679)
(41,
934,
421)
(41,
887,
679)
(41,
934,
421)
- Gen
eral
(1,7
03,0
72)
(1,4
23,9
21)
-
-
(1,7
03,0
72)
(1,4
23,9
21)
(1,7
03,0
72)
(1,4
23,9
21)
(41,
887,
679)
(41,
934,
421)
(43,
590,
751)
(43,
358,
342)
Adva
nces
- ne
t of p
rovi
sion
472,
877,
915
489,
189,
036
8,04
7,23
5
7,48
9,83
8
480,
925,
150
496,
678,
874
Una
udite
d M
arch
31,
202
0Au
dite
d D
ecem
ber 3
1, 2
019
11.1
Part
icul
ars
of a
dvan
ces
(Gro
ss)
In lo
cal c
urre
ncy
466,
197,
451
481,
408,
603
In fo
reig
n cu
rren
cies
58,3
18,4
50
58,6
28,6
13
524,
515,
901
540,
037,
216
11.2
\N
ote
Non
Per
form
ing
Loan
sPr
ovis
ion
Non
Per
form
ing
Loan
sPr
ovis
ion
Dom
estic
Oth
er A
sset
s Es
peci
ally
Men
tione
d11
.2.1
195,
032
8,60
1
123,
678
3,52
9
Subs
tand
ard
609,
637
151,
852
584,
129
145,
075
Dou
btfu
l2,
859,
276
1,42
9,63
8
2,69
0,84
1
1,34
5,42
1
Loss
37,4
84,8
66
36,7
15,7
00
37,8
35,6
19
37,0
87,2
69
41,1
48,8
11
38,3
05,7
91
41,2
34,2
67
38,5
81,2
94
Ove
rsea
s
Not
pas
t due
but
impa
ired
-
-
-
-
Ove
rdue
by:
Upt
o 90
day
s5,
721
3,55
0
10,6
88
7,40
0
91 to
180
day
s16
,938
8,10
3
118,
182
95,4
52
181
to 3
65 d
ays
118,
148
100,
206
141,
231
137,
601
˃ 3
65 d
ays
8,64
5,29
6
3,47
0,02
9
7,91
9,89
1
3,11
2,67
4
8,78
6,10
3
3,58
1,88
8
8,18
9,99
2
3,35
3,12
7
Tota
l49
,934
,914
41,8
87,6
79
49,4
24,2
59
41,9
34,4
21
11.2
.1
------
------
------
------
------
------
------
------
------
------
------
-----R
upee
s in
'000
------
------
------
------
------
------
------
------
------
------
------
-----
Perfo
rmin
gN
on P
erfo
rmin
gTo
tal
Audi
ted
Dec
embe
r 31,
201
9U
naud
ited
Mar
ch 3
1, 2
020
Audi
ted
Dec
embe
r 31,
201
9U
naud
ited
Mar
ch 3
1, 2
020
Audi
ted
Dec
embe
r 31,
201
9U
naud
ited
Mar
ch 3
1, 2
020
------
----R
upee
s in
'000
------
--
Adva
nces
incl
ude
Rs.
49,
934.
914
mill
ion
(201
9: R
s. 4
9,42
4.25
9 m
illio
n) w
hich
hav
e be
en p
lace
d un
der t
he n
on-p
erfo
rmin
g st
atus
as
deta
iled
belo
w:
------
------
------
------
------
------
Ru
pees
in '0
00---
------
------
------
------
------
--
Thi
s re
pres
ents
non
-per
form
ing
port
folio
of a
gric
ultu
ral,
smal
l ent
erpr
ise
and
Infr
astr
uctu
re P
roje
ct F
inan
cing
cla
ssifi
ed a
s O
AE
M a
s pe
r th
e re
quire
men
ts o
f res
pect
ive
Pru
dent
ial R
egul
atio
ns is
sued
by
the
Sta
te B
ank
of P
akis
tan.
Una
udite
d M
arch
31,
202
0Au
dite
d D
ecem
ber 3
1, 2
019
10.
INV
ES
TME
NT
S
10.1
Inve
stm
ents
by
type
:
Hel
d-fo
r-tr
adin
g se
curi
ties
Fede
ral G
over
nmen
t Sec
uriti
es14
,887
,370
-
8,34
6
14
,895
,716
9,47
9,84
9
-
(4,1
28)
9,47
5,72
1
Sha
res
32,1
74
-
(7,6
54)
24,5
20
13,1
58
-
(48)
13,1
10
14,9
19,5
44
-
692
14,9
20,2
36
9,49
3,00
7
-
(4,1
76)
9,48
8,83
1
Ava
ilabl
e-fo
r-sa
le s
ecur
ities
Fede
ral G
over
nmen
t Sec
uriti
es74
5,72
1,05
1
-
21,9
13,8
49
767,
634,
900
666,
128,
289
-
4,98
1,34
9
671,
109,
638
Sha
res
and
units
26,3
05,5
68
(10,
892,
426)
(2,3
10,6
94)
13,1
02,4
48
24,9
38,0
90
(10,
148,
760)
1,49
7,55
6
16,2
86,8
86
Non
Gov
ernm
ent D
ebt S
ecur
ities
1,89
9,77
3
-
5,30
6
1,90
5,07
9
1,30
9,77
3
-
(3,3
59)
1,30
6,41
4
Fore
ign
Sec
uriti
es4,
397,
151
-
14,9
33
4,41
2,08
4
3,65
7,02
0
-
13,2
95
3,67
0,31
577
8,32
3,54
3
(10,
892,
426)
19,6
23,3
94
787,
054,
511
696,
033,
172
(10,
148,
760)
6,48
8,84
1
692,
373,
253
Hel
d-to
-mat
urity
sec
uriti
es
Fede
ral G
over
nmen
t Sec
uriti
es6,
653,
329
(3,5
12)
-
6,64
9,81
7
16,2
07,2
49
(2,2
11)
-
16,2
05,0
38
Pro
vinc
ial G
over
nmen
t Sec
uriti
es11
8
(118
)
-
-
118
(118
)
-
-
Non
Gov
ernm
ent D
ebt S
ecur
ities
10,4
67,3
08
(533
,788
)
-
9,93
3,52
0
9,86
7,92
5
(533
,788
)
-
9,33
4,13
7
Fore
ign
Sec
uriti
es5,
072,
906
(17,
598)
-
5,05
5,30
8
8,32
0,59
9
(3
,569
)
-
8,31
7,03
022
,193
,661
(5
55,0
16)
-
21,6
38,6
45
34
,395
,891
(539
,686
)
-
33,8
56,2
05
Ass
ocia
tes
700,
401
-
-
70
0,40
1
700,
401
-
-
70
0,40
1
Sub
sidi
arie
s12
,346
,537
(7
25)
-
12
,345
,812
12
,346
,537
(7
25)
-
12,3
45,8
12
Tota
l In
vest
men
ts
828,
483,
686
(11,
448,
167)
19,6
24,0
86
83
6,65
9,60
5
752,
969,
008
(10,
689,
171)
6,
484,
665
748,
764,
502
10.1
.1In
vest
men
ts g
iven
as
colla
tera
l U
naud
ited
Mar
ch 3
1, 2
020
Aud
ited
Dec
embe
r 31,
2019
- Mar
ket T
reas
ury
Bills
15,4
03,1
13
22,8
20,2
26
- Pak
ista
n In
vest
men
t Bon
ds4,
794,
516
5,31
6,20
8
20,1
97,6
29
28,1
36,4
34
10.2
Pro
visi
on fo
r di
min
utio
n in
val
ue o
f inv
estm
ents
10.2
.1O
peni
ng b
alan
ce10
,689
,171
7,86
5,38
8
Adj
ustm
ents
6,27
8
251
Cha
rge
/ (re
vers
als)
Cha
rge
for t
he p
erio
d / y
ear
774,
415
3,27
5,53
9
Rev
ersa
ls fo
r the
per
iod
/ yea
r-
(29,
964)
Rev
ersa
l on
disp
osal
s(2
1,69
7)
(422
,043
)
752,
718
2,82
3,53
2
Am
ount
s w
ritte
n of
f-
-
Clo
sing
Bal
ance
11,4
48,1
67
10,6
89,1
71
10.2
.2P
artic
ular
s of
pro
visi
on a
gain
st d
ebt s
ecur
ities
NP
IP
rovi
sion
NP
IP
rovi
sion
Dom
estic
Dou
btfu
l14
5,65
672
,828
145,
656
72,8
28
Loss
461,
078
461,
078
461,
078
461,
078
606,
734
533,
906
606,
734
533,
906
10.2
.3In
add
ition
to th
e ab
ove,
ove
rsea
s br
anch
es h
old
a ge
nera
l pro
visi
on o
f Rs
21.1
10 m
illion
(Dec
embe
r 31,
201
9: R
s 5.
780
milli
on) i
n ac
cord
ance
with
the
requ
irem
ents
of I
FRS
9.
10.3
The
mar
ket v
alue
of s
ecur
ities
cla
ssifi
ed a
s he
ld-to
-mat
urity
as
at M
arch
31,
202
0 am
ount
ed to
Rs.
21,
336.
219
milli
on (D
ecem
ber 3
1, 2
019:
Rs.
33,
464.
168
milli
on).
10.4
Th
e B
an
k is
in th
e p
roce
ss o
f d
isp
osa
l of its
wh
olly
ow
ne
d s
ub
sid
iary
“M
CB
Fin
an
cia
l Se
rvic
es
Lim
ited
” su
bje
ct to
all
reg
ula
tory
an
d s
ha
reh
old
ers
ap
pro
vals
.
----
----
--R
upee
s in
'000
----
----
----
----
--R
upee
s in
'000
----
----
Una
udite
d M
arch
31,
202
0A
udite
d D
ecem
ber 3
1, 2
019
----
----
----
----
----
----
----
----
----
----
----
----
----
----
----
----
----
----
----
----
----
----
--R
upees
in '0
00--
----
----
----
----
----
----
----
----
----
----
----
----
----
----
----
----
----
----
----
----
----
----
Una
udite
d M
arch
31,
202
0A
udite
d D
ecem
ber 3
1, 2
019
Pro
visi
on fo
r
dim
inut
ion
Sur
plus
/
(Def
icit)
C
arry
ing
Val
ueC
ost /
Am
ortis
ed
cost
Sur
plus
/
(Def
icit)
C
arry
ing
Val
ueC
ost /
Am
ortis
ed
cost
Pro
visi
on fo
r
dim
inut
ion
20 21
Notes to the Unconsolidated Condensed Interim Financial Statements (Un-audited)For the three months period ended March 31, 2020
Notes to the Unconsolidated Condensed Interim Financial Statements (Un-audited)For the three months period ended March 31, 2020
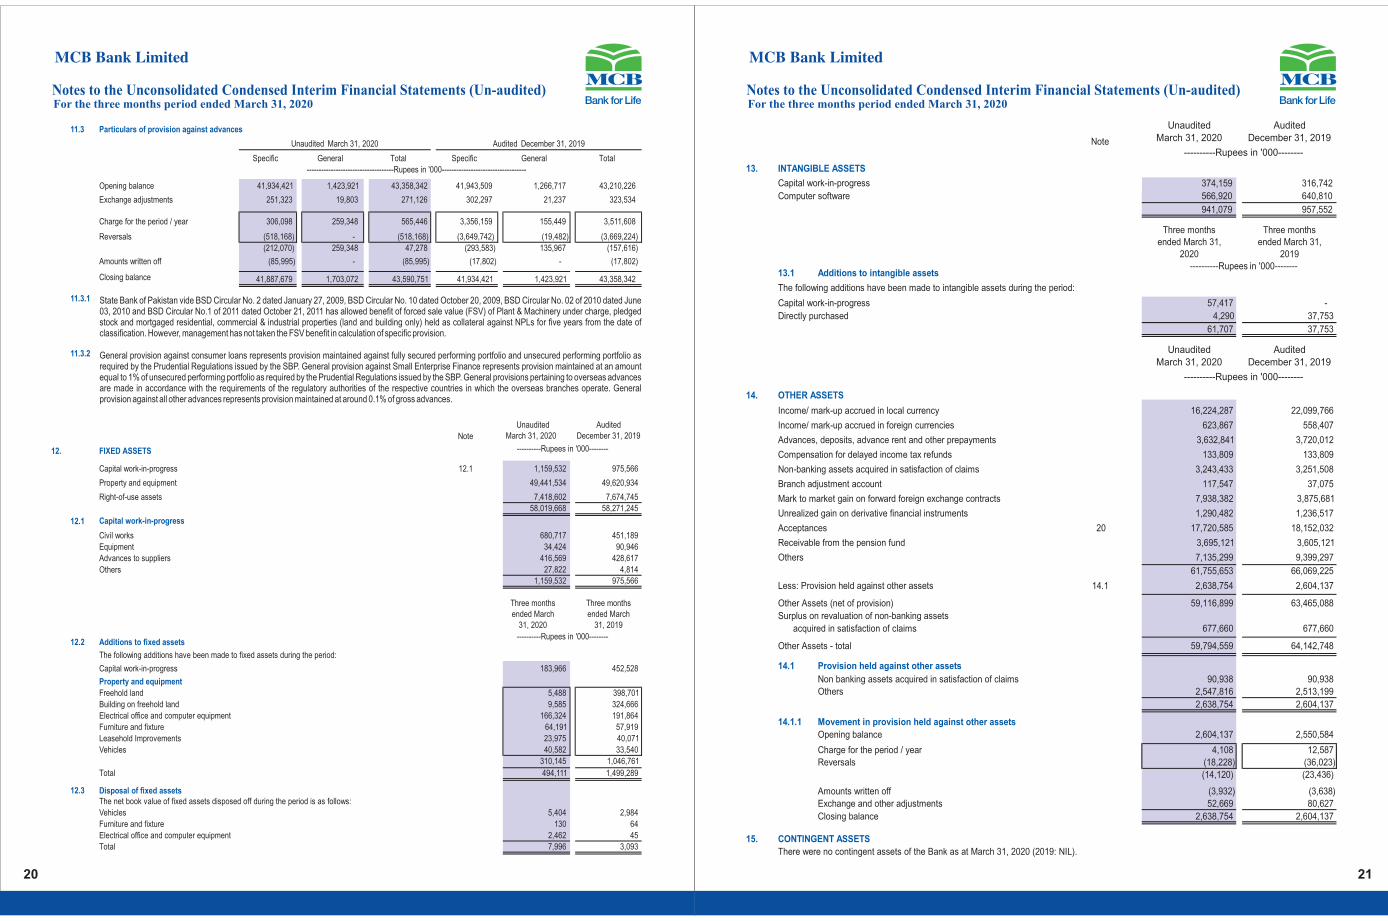
15. CONTINGENT ASSETS
There were no contingent assets of the Bank as at March 31, 2020 (2019: NIL).
Note
13. INTANGIBLE ASSETS
Capital work-in-progress 374,159 316,742
Computer software 566,920 640,810
941,079 957,552
Three months ended March 31,
2020
Three months ended March 31,
2019
13.1 Additions to intangible assets
The following additions have been made to intangible assets during the period:
Capital work-in-progress 57,417
-
Directly purchased 4,290
37,753
61,707 37,753
14. OTHER ASSETS
Income/ mark-up accrued in local currency 16,224,287
22,099,766
Income/ mark-up accrued in foreign currencies 623,867
558,407
Advances, deposits, advance rent and other prepayments 3,632,841
3,720,012
Compensation for delayed income tax refunds 133,809
133,809
Non-banking assets acquired in satisfaction of claims 3,243,433
3,251,508
Branch adjustment account 117,547
37,075
Mark to market gain on forward foreign exchange contracts 7,938,382
3,875,681
Unrealized gain on derivative financial instruments 1,290,482
1,236,517
Acceptances 20 17,720,585
18,152,032
Receivable from the pension fund 3,695,121
3,605,121
Others 7,135,299
9,399,297
61,755,653
66,069,225
Less: Provision held against other assets 14.1 2,638,754
2,604,137
Other Assets (net of provision) 59,116,899
63,465,088
Surplus on revaluation of non-banking assets
acquired in satisfaction of claims 677,660
677,660
Other Assets - total 59,794,559
64,142,748
14.1 Provision held against other assets
Non banking assets acquired in satisfaction of claims 90,938
90,938
Others 2,547,816
2,513,199
2,638,754
2,604,137
14.1.1 Movement in provision held against other assets
Opening balance 2,604,137
2,550,584
Charge for the period / year 4,108
12,587
Reversals (18,228)
(36,023)
(14,120)
(23,436)
Amounts written off (3,932)
(3,638)
Exchange and other adjustments 52,669 80,627
Closing balance 2,638,754 2,604,137
----------Rupees in '000--------
Property and equipment
Freehold land 5,488
398,701
Building on freehold land 9,585
324,666
Electrical office and computer equipment 166,324
191,864
Furniture and fixture 64,191
57,919
Leasehold Improvements 23,975
40,071
Vehicles 40,582
33,540
310,145
1,046,761
Total 494,111
1,499,289
12.3The net book value of fixed assets disposed off during the period is as follows:
Vehicles 5,404 2,984
Furniture and fixture 130 64
Electrical office and computer equipment 2,462 45
Total 7,996 3,093
State Bank of Pakistan vide BSD Circular No. 2 dated January 27, 2009, BSD Circular No. 10 dated October 20, 2009, BSD Circular No. 02 of 2010 dated June 03, 2010 and BSD Circular No.1 of 2011 dated October 21, 2011 has allowed benefit of forced sale value (FSV) of Plant & Machinery under charge, pledged stock and mortgaged residential, commercial & industrial properties (land and building only) held as collateral against NPLs for five years from the date of classification. However, management has not taken the FSV benefit in calculation of specific provision.
General provision against consumer loans represents provision maintained against fully secured performing portfolio and unsecured performing portfolio as required by the Prudential Regulations issued by the SBP. General provision against Small Enterprise Finance represents provision maintained at an amount equal to 1% of unsecured performing portfolio as required by the Prudential Regulations issued by the SBP. General provisions pertaining to overseas advances are made in accordance with the requirements of the regulatory authorities of the respective countries in which the overseas branches operate. General provision against all other advances represents provision maintained at around 0.1% of gross advances.
11.3 Particulars of provision against advances
Specific General Total Specific General Total
Opening balance 41,934,421
1,423,921
43,358,342
41,943,509
1,266,717
43,210,226
Exchange adjustments 251,323
19,803
271,126
302,297
21,237
323,534
Charge for the period / year 306,098
259,348
565,446
3,356,159
155,449
3,511,608
Reversals (518,168)
-
(518,168)
(3,649,742)
(19,482)
(3,669,224)
(212,070)
259,348
47,278
(293,583)
135,967
(157,616)
Amounts written off (85,995)
-
(85,995)
(17,802)
-
(17,802)
Closing balance 41,887,679
1,703,072
43,590,751
41,934,421
1,423,921
43,358,342
11.3.1
11.3.2
Note
Unaudited March 31, 2020
Audited December 31, 2019
12. FIXED ASSETS
Capital work-in-progress 12.1 1,159,532 975,566
Property and equipment 49,441,534 49,620,934
Right-of-use assets 7,418,602 7,674,745 58,019,668 58,271,245
12.1 Capital work-in-progress
Civil works 680,717
451,189
Equipment 34,424
90,946 Advances to suppliers 416,569
428,617
Others 27,822
4,814 1,159,532
975,566
Three months ended March
31, 2020
Three months ended March
31, 2019
12.2
The following additions have been made to fixed assets during the period:
Capital work-in-progress 183,966 452,528
Unaudite d March 31, 2020
----------Rupees in '000--------
Audite d December 31, 2019
----------Rupees in '000--------
------------------------------------Rupees in '000-----------------------------------
Unaudited Audited March 31, 2020 December 31, 2019
----------Rupees in '000--------
Unaudited Audited March 31, 2020 December 31, 2019
----------Rupees in '000--------
22 23
NoteUnaudited
March 31, 2020Audited
December 31, 2019
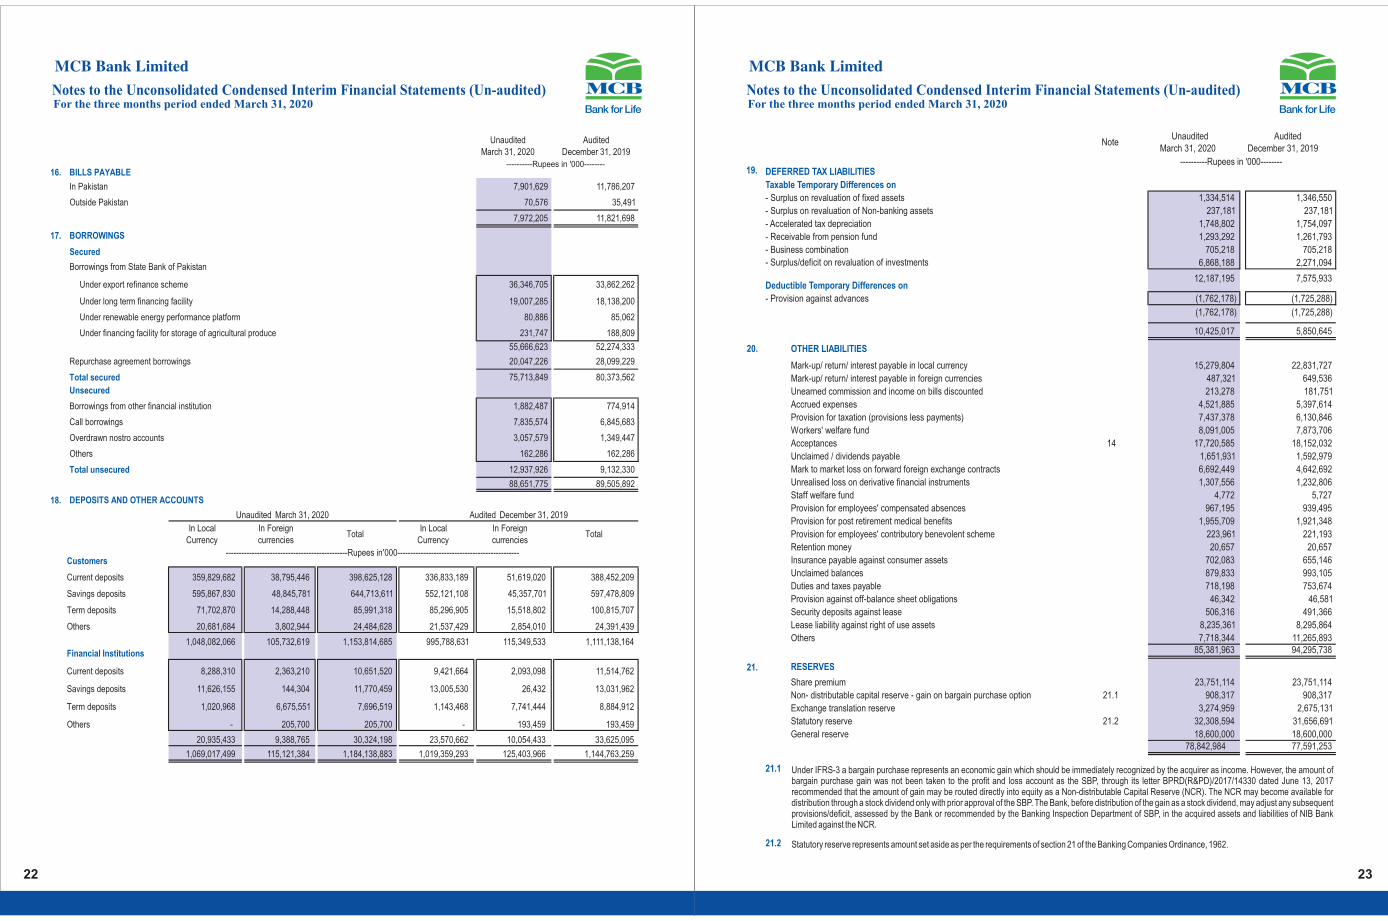
19. DEFERRED TAX LIABILITIES
Taxable Temporary Differences on
- Surplus on revaluation of fixed assets 1,334,514
1,346,550
- Surplus on revaluation of Non-banking assets 237,181
237,181
- Accelerated tax depreciation 1,748,802
1,754,097
- Receivable from pension fund 1,293,292
1,261,793
- Business combination 705,218
705,218
- Surplus/deficit on revaluation of investments 6,868,188
2,271,094
12,187,195
7,575,933
Deductible Temporary Differences on
- Provision against advances (1,762,178)
(1,725,288)
(1,762,178)
(1,725,288)
10,425,017
5,850,645
20. OTHER LIABILITIES
Mark-up/ return/ interest payable in local currency 15,279,804
22,831,727
Mark-up/ return/ interest payable in foreign currencies 487,321
649,536
Unearned commission and income on bills discounted 213,278
181,751
Accrued expenses 4,521,885
5,397,614
Provision for taxation (provisions less payments) 7,437,378
6,130,846
Workers' welfare fund 8,091,005
7,873,706
Acceptances 14 17,720,585
18,152,032
Unclaimed / dividends payable 1,651,931
1,592,979
Mark to market loss on forward foreign exchange contracts 6,692,449 4,642,692
Unrealised loss on derivative financial instruments 1,307,556 1,232,806 Staff welfare fund 4,772 5,727 Provision for employees' compensated absences 967,195 939,495 Provision for post retirement medical benefits 1,955,709
1,921,348
Provision for employees' contributory benevolent scheme 223,961
221,193
Retention money 20,657
20,657
Insurance payable against consumer assets 702,083
655,146
Unclaimed balances 879,833
993,105
Duties and taxes payable 718,198
753,674
Provision against off-balance sheet obligations 46,342
46,581
Security deposits against lease 506,316
491,366
Lease liability against right of use assets 8,235,361
8,295,864
Others 7,718,344
11,265,893
85,381,963
94,295,738
21. RESERVES
Share premium 23,751,114
23,751,114
Non- distributable capital reserve - gain on bargain purchase option 21.1 908,317
908,317
Exchange translation reserve 3,274,959
2,675,131
Statutory reserve 21.2 32,308,594 31,656,691
General reserve 18,600,000 18,600,00078,842,984 77,591,253
21.1
21.2
----------Rupees in '000--------
Under IFRS-3 a bargain purchase represents an economic gain which should be immediately recognized by the acquirer as income. However, the amount of bargain purchase gain was not been taken to the profit and loss account as the SBP, through its letter BPRD(R&PD)/2017/14330 dated June 13, 2017 recommended that the amount of gain may be routed directly into equity as a Non-distributable Capital Reserve (NCR). The NCR may become available for distribution through a stock dividend only with prior approval of the SBP. The Bank, before distribution of the gain as a stock dividend, may adjust any subsequent provisions/deficit, assessed by the Bank or recommended by the Banking Inspection Department of SBP, in the acquired assets and liabilities of NIB Bank Limited against the NCR.
Statutory reserve represents amount set aside as per the requirements of section 21 of the Banking Companies Ordinance, 1962.
7,901,629 11,786,207
70,576 35,491
7,972,205
11,821,698
36,346,705
33,862,262
19,007,285
18,138,200
80,886
85,062
231,747
188,809
55,666,623
52,274,333
20,047,226
28,099,229
75,713,849
80,373,562
1,882,487 774,914
7,835,574 6,845,683
3,057,579 1,349,447
162,286 162,286 12,937,926
9,132,330
88,651,775
89,505,892
16. BILLS PAYABLE
In Pakistan
Outside Pakistan
17. BORROWINGS
Secured
Borrowings from State Bank of Pakistan
Under export refinance scheme
Under long term financing facility
Under renewable energy performance platform
Under financing facility for storage of agricultural produce
Repurchase agreement borrowings
Total secured
Unsecured
Borrowings from other financial institution
Call borrowings
Overdrawn nostro accounts
Others
Total unsecured
18. DEPOSITS AND OTHER ACCOUNTS
In Local Currency
In Foreign currencies
TotalIn Local
CurrencyIn Foreign currencies
Total
Customers
Current deposits 359,829,682
38,795,446
398,625,128
336,833,189
51,619,020
388,452,209
Savings deposits 595,867,830
48,845,781
644,713,611
552,121,108
45,357,701
597,478,809
Term deposits 71,702,870
14,288,448
85,991,318
85,296,905
15,518,802
100,815,707
Others 20,681,684
3,802,944
24,484,628
21,537,429
2,854,010
24,391,439
1,048,082,066
105,732,619
1,153,814,685
995,788,631
115,349,533
1,111,138,164
Financial Institutions
Current deposits 8,288,310
2,363,210
10,651,520
9,421,664
2,093,098
11,514,762
Savings deposits 11,626,155
144,304
11,770,459
13,005,530
26,432
13,031,962
Term deposits 1,020,968 6,675,551 7,696,519 1,143,468 7,741,444 8,884,912
Others - 205,700 205,700 - 193,459 193,459
20,935,433 9,388,765 30,324,198 23,570,662 10,054,433 33,625,095
1,069,017,499 115,121,384 1,184,138,883 1,019,359,293 125,403,966 1,144,763,259
Unaudited Audited March 31, 2020 December 31, 2019
----------Rupees in '000--------
Unaudite d March 31, 2020 Audite d December 31, 2019
-----------------------------------------------Rupees in '000-----------------------------------------------
Notes to the Unconsolidated Condensed Interim Financial Statements (Un-audited)For the three months period ended March 31, 2020
Notes to the Unconsolidated Condensed Interim Financial Statements (Un-audited)For the three months period ended March 31, 2020

24 25
Note
Three months ended March 31,
2020
Three months ended March 31,
2019
----------Rupees in '000--------25. MARK-UP/RETURN/INTEREST EARNED
Loans and advances 14,220,965
12,423,261
Investments 24,598,226
13,662,139
Lendings to financial institutions 197,272
1,182,657
Balances with banks 83,165
113,862
39,099,628
27,381,919
26. MARK-UP/RETURN/INTEREST EXPENSED
Deposits 19,669,296
12,577,344
Borrowings 2,169,783
843,476
Subordinated debt -
112,000
Cost of foreign currency swaps against foreign currency deposits / borrowings 676,067
370,345
Unwinding cost of liability against right-of-use assets 276,782
-
22,791,928
13,903,165
23.2.4
Note
23.3 Other contingent liabilities
Claims against the Bank not acknowledged as debts 23.3.1 29,636,109 27,920,652
23.3.1
23.4 Taxation
24. DERIVATIVE INSTRUMENTS
Notional Notional Notional
Principal Principal Principal
Total
Hedging 3,758,405
1,260,702
316,500
6,536
751,950
23,244
Market Making 3,966,487
(1,284,312)
-
-
751,950
(23,244)
Total
Hedging 4,428,663 1,218,634 316,500 11,510 431,449 2,683Market Making 4,636,745 (1,226,433) - - 431,449 (2,683)
-------------------------------------------Rupees in '000-------------------------------------------
Audite d December 31, 2019
-------------------------------------------Rupees in '000-------------------------------------------
Unaudite d March 31, 2020
Interest Rate Swaps FX Options Cross Currency Swaps
Mark to market gain / loss
Mark to market gain / loss
Mark to market gain / loss
The Bank makes commitments to extend credit in the normal course of its business but these being revocable commitments do not attract any significant penalty or expense if the facility is unilaterally withdrawn.
These represent certain claims by third parties against the Bank, which are being contested in the Courts of law. The management is of the view that these relate to the normal course of business and the possibility of an outflow of economic resources is remote.
For assessment year 1988-89 through tax year 2018, the tax department disputed Bank's treatment on certain issues, where the Bank's appeals are pending at various appellate forums, entailing an additional tax liability of Rs. 1,487 million (2019: Rs. 1,487 million). Such issues inter alia principally include disallowance of expenses for non deduction of withholding tax and non availability of underlying records, provision for non performing loans, attribution of expenses to heads of income other than income from business and disallowance of credit for taxes paid in advance / deducted at source.
The Bank has filed appeals which are pending at various appellate forums. In addition, certain decisions made in favour of the Bank are being contested by the department at higher forums. No provision has been made in the financial statements regarding the aforesaid additional tax demand and already issued favourable decisions where the department is in appeal, as the management is of the view that the issues will be decided in the Bank's favour as and when these are taken up by the Appellate Authorities.
Note
10.1 19,623,394 6,488,841
20,349,375 20,383,765
677,660
677,660
40,650,429
27,550,266
6,868,188
2,271,094
1,334,514
1,346,550
237,181
237,181
8,439,883
3,854,825
32,210,546
23,695,441
23.1 181,027,971
173,535,128
23.2 465,485,966
649,690,990
22. SURPLUS ON REVALUATION OF ASSETS
Surplus / (deficit) on revaluation of
- Available for sale securities
- Fixed Assets
- Non-banking assets acquired in satisfaction of claims
Deferred tax on surplus / (deficit) on revaluation of:
- Available for sale securities
- Fixed Assets
- Non-banking assets acquired in satisfaction of claims
23. CONTINGENCIES AND COMMITMENTS
-Guarantees
-Commitments
-Other contingent liabilities 23.3 29,636,109
27,920,652
676,150,046
851,146,770
23.1 Guarantees:
Financial guarantees 148,895,852
141,181,839
Performance guarantees 30,676,988
30,401,373
Other guarantees 1,455,131
1,951,916
181,027,971
173,535,128
23.2 Commitments:
Documentary credits and short-term trade-related transactions
- letters of credit 149,918,005 145,217,983
Commitments in respect of:
- forward foreign exchange contracts 23.2.1 296,346,966 405,615,318 - forward government securities transactions 23.2.2 8,740,729 87,696,638 - derivatives 23.2.3 9,545,292
10,244,806
Commitments for acquisition of:
- operating fixed assets 900,182
859,953
- intangible assets 34,792
56,292
465,485,966
649,690,990
23.2.1 Commitments in respect of forward foreign exchange contracts
Purchase 161,094,140
217,809,539
Sale 135,252,826
187,805,779
296,346,966
405,615,318
23.2.2 Commitments in respect of forward government securities transactions
Purchase 8,740,729
82,284,304
Sale -
5,412,334
8,740,729
87,696,638
23.2.3 Commitments in respect of derivatives
FX options (notional)
Purchase 751,950
431,449
Sale 751,950
431,449
1,503,900
862,898
Cross Currency Swaps (notional)
Purchase 3,758,405
4,428,663
Sale 3,966,487
4,636,745
7,724,892 9,065,408Interest Rate Swaps (notional)
Purchase 316,500 316,500
9,545,292 10,244,806
Notes to the Unconsolidated Condensed Interim Financial Statements (Un-audited)For the three months period ended March 31, 2020
Notes to the Unconsolidated Condensed Interim Financial Statements (Un-audited)For the three months period ended March 31, 2020
Unaudited Audited March 31, 2020 December 31, 2019
----------Rupees in '000--------
Unaudited Audited March 31, 2020 December 31, 2019
----------Rupees in '000--------

26 27
Other operating expenses
Directors' fees and allowances 12,004 10,126 Legal and professional charges 86,032 100,158 Outsourced services costs 167,502
178,164
Travelling and conveyance 69,082
80,275
NIFT clearing charges 46,278
35,882 Depreciation 208,852
195,433
Depreciation on non-banking assets acquired in satisfaction of claims 8,074
12,062
Training and development 7,961
13,157
Postage and courier charges 65,057
59,337
Communication 82,150
90,641
Stationery and printing 147,968
182,614
Marketing, advertisement & publicity 160,266
175,000
Donations 5,000
-
Auditors' remuneration 8,493
10,047
Cash transportation charges 183,901
184,191
Repair and maintenance 81,241
90,112
Subscription 8,476
3,008
Entertainment 52,553
60,051
Remittance charges 48,527
39,908
Brokerage expenses 10,454
6,283
Card related expenses 225,705
185,723
CNIC verification charges 34,725
38,776
Insurance 369,876
354,541
Others 61,192 61,968
2,151,369 2,167,457
8,161,432 8,170,226
NoteThree months
ended March 31, 2020
Three months ended March 31,
2019
182,818 789 26,437
45,406
209,255
46,195
(2,160)
6,378
10.2.1 752,718
(25,900)
11.3 47,278 (404,798)
14.1.1 (14,120) (11,765)
(41,254) (48,072) 742,462 (484,157)
4,368,632
3,143,600 -
450,438
(22,721)
405,461
4,345,911
3,999,499
6,519,026
5,079,859
1,185,060,006
1,185,060,006
31. OTHER CHARGESPenalties of State Bank of Pakistan
VAT & National Building tax & Crop Insurance Levy
32. PROVISIONS / (REVERSALS) & WRITE OFFS - NET
(Reversals) / provisions against balance with Banks
Provisions / (reversals) for diminution in value of investments
Reversals against loans & advances
Reversals against other assets
Recovery of written off / charged off bad debts
33. TAXATION
Current
Prior years
Deferred
34. BASIC AND DILUTED EARNINGS PER SHARE
Profit after tax
Weighted average number of ordinary shares
Basic and diluted earnings per share 5.50 4.29
----------Rupees in '000--------
----------Rupees in '000--------
----------Number--------
----------Rupees-------
27. FEE & COMMISSION INCOME
Branch banking customer fees
Consumer finance related fees
Card related fees (debit and credit cards)
Credit related fees
Investment banking fee
Commission on trade
Commission on guarantees
Commission on cash management
Commission on remittances including home remittances
Commission income - Bancassurance
Rent on lockers
Commission on utility bills
Commission on investments services
Other Commission
28. GAIN ON SECURITIES, NET
Realised
Unrealised - held for trading
28.1 Realised gain / (loss) on:
Federal Government Securities
Shares
Others
29. OTHER INCOME
Rent on property
Gain on sale of fixed assets and non-banking assets acquired-net
485,807
525,714
92,753
70,228
819,150
723,916
5,660 60,433
34,156 22,600
347,234 340,447 137,052 185,790 158,317 150,761 282,078
258,122
365,261
333,012
56,393
64,118
20,416
24,943
7,040
11,955
34,332
42,179
2,845,649
2,814,218
28.1 70,447
15,753
10.1 692
(4,320)
71,139
11,433
75,320
10,797
(11,295)
4,956
6,422
-
70,447
15,753
15,175 21,122
17,360 21,245
32,535 42,367
Three months ended March 31,
2020
Three months ended March 31,
2019
----------Rupees in '000--------
30. OPERATING EXPENSES
Total compensation expense 3,987,600 3,597,672
Property expense
Rent and taxes 37,868
438,928
Insurance 5,662
5,295
Utilities cost 239,266
249,452
Fuel expense generators 100,692
119,421
Security (including guards) 311,229
401,951
Repair and maintenance (including janitorial charges) 161,379
255,732
Depreciation on right-of-use assets 301,049
-
Depreciation 151,165
135,578
1,308,310
1,606,357
Information technology expenses
Software maintenance 285,593
345,912
Hardware maintenance 66,640
98,478
Depreciation 132,801
143,849
Amortisation 76,553
56,409
Network charges 151,658
153,304
Insurance 908
788
714,153
798,740
Notes to the Unconsolidated Condensed Interim Financial Statements (Un-audited)For the three months period ended March 31, 2020
Notes to the Unconsolidated Condensed Interim Financial Statements (Un-audited)For the three months period ended March 31, 2020

28 29
The table below analyses the financial and non-financial assets carried at fair values, by valuation methods. For financial assets, the Bank essentially carries its investments in debt and equity securities at fair values. Valuation of investments is carried out as per guidelines specified by the SBP. In case of non-financial assets, the Bank has adopted revaluation model (as per IAS 16) in respect of land and building.
Unaudite d March 31, 2020
Carrying value Level 1 Level 2 Level 3 Total
Financial assets - measured at fair value
Investments
Federal Government Securities 782,530,616
-
782,530,616
-
782,530,616
Shares 11,739,718
11,739,718
-
-
11,739,718
Non-Government Debt Securities 1,553,146
1,553,146
-
1,553,146
Foreign Securities 4,412,084
-
4,412,084
-
4,412,084
Financial assets - disclosed but not measured at fair value
36,424,041 - - - - Cash and balances with treasury banks 94,129,555
-
-
-
-
Balances with other banks 15,169,519
-
-
-
-
Lendings to financial institutions 9,576,504
-
-
-
-
Advances 480,925,150
-
-
-
-
Other assets 48,385,086
-
-
-
-
Non - Financial Assets measured at fair value
Operating fixed assets (land and buildings) 43,430,687
-
43,430,687
-
43,430,687
Non-banking assets 3,921,093
-
3,921,093
-
3,921,093
Forward purchase of foreign exchange 161,094,140
-
7,915,363
-
7,915,363
Forward sale of foreign exchange 135,252,826
-
6,669,430
-
6,669,430
Derivatives purchase 4,826,855
-
1,290,482
-
1,290,482
Derivatives sale 4,718,437
-
1,307,556
-
1,307,556
Audite d December 31, 2019
Carrying value Level 1 Level 2 Level 3 Total
Financial assets - measured at fair value
Investments
Federal Government Securities 680,585,359
-
680,585,359
-
680,585,359
Shares 14,912,747
14,912,747
-
-
14,912,747
Non-Government Debt Securities 1,306,414
1,306,414
-
1,306,414 Foreign Securities 3,663,065
-
3,663,065
-
3,663,065
-
Financial assets - disclosed but not measured at fair value -
48,296,917 - - - -
Cash and balances with treasury banks 132,704,797 - - - - Balances with other banks 12,542,239 - - - - Lendings to financial institutions 1,090,058 - - - -
Advances 496,678,874
-
-
-
-
Other assets 52,808,501
-
-
-
-
Non - Financial Assets measured at fair value
Operating fixed assets (land and buildings) 43,552,234
-
43,552,234
-
43,552,234 Non-banking assets 3,838,230
-
3,838,230
-
3,838,230
- - Forward purchase of foreign exchange 217,809,539 - 4,146,908 - 4,146,908
Forward sale of foreign exchange 187,805,779 - 3,379,897 - 3,379,897-
Derivatives purchase 5,176,612 - 1,232,827 - 1,232,827
Derivatives sale 5,068,194 - 1,229,116 - 1,229,116
------------------------------------------Rupees in '000--------------------------------------
Investments (HTM, unlisted ordinary shares, subsidiaries and associates)
Investments (HTM, unlisted ordinary shares, subsidiaries and associates)
------------------------------------------Rupees in '000--------------------------------------
35. FAIR VALUE MEASUREMENTS
35.1
Level 1:
Level 2:
Level 3:
(a) Financial instruments in level 1
(b) Financial instruments in level 2
(c) Financial instruments in level 3
Foreign exchange contracts
Derivatives
Operating fixed assets (land and building) & NBA
Term Finance and Bonds
Item
The fair values of Federal Government securities are determined using the PKRV rates.
Valuation approach and input used
Federal Government securities
The fair value of traded investments is based on quoted market prices, except for tradable securities classified by the Bank as 'held to maturity'. Quoted securities classified as held to maturity are carried at amortised cost. Fair value of unquoted equity investments other than investments in associates and subsidiaries is determined on the basis of break up value of these investments as per the latest available financial statements.
Fair value of fixed term loans, other assets, other liabilities, fixed term deposits and borrowings cannot be calculated with sufficient reliability due to absence of current and active market for such assets and liabilities and reliable data regarding market rates for similar instruments.
In the opinion of the management, the fair value of the financial assets and financial liabilities are not significantly different from their carrying values since assets and liabilities are either short-term in nature or re-priced over short term.
The Bank measures fair values using the following fair value hierarchy that reflects the significance of the inputs used in making the measurements:
Fair value measurements using inputs other than quoted prices included within Level 1 that are observable for the assets or liability, either directly (i.e. as prices) or indirectly (i.e. derived from prices).
Fair value measurements using input for the asset or liability that are not based on observable market data (i.e. unobservable inputs).
Fair value measurements using quoted prices (unadjusted) in active markets for identical assets or liabilities.
Investments in debt securities (comprising term finance certificates, bonds and any other security issued by a company or a body corporate for the purpose of raising funds in the form of redeemable capital) are valued on the basis of the rates announced by the Mutual Funds Association of Pakistan (MUFAP) in accordance with the methodology prescribed by the Securities and Exchange Commission of Pakistan.
The valuation has been determined by interpolating the mid rates announced by the State Bank of Pakistan.
The fair values of derivatives which are not quoted in active markets are determined by using valuation techniques. The valuation techniques take into account the relevant underlying parameters including foreign currency involved, interest rates, yield curves, volatilities, contracts duration etc.
Land and buildings are revalued every three years using professional valuers on the panel of Pakistan Banker's Association. The valuation is based on their assessment of market value of the properties.
The Bank's policy is to recognise transfers into and out of the different fair value hierarchy levels at the date the event or change in circumstances that caused the transfer occurred. There were no transfers between levels 1 and 2 during the year.
Financial instruments included in level 1 comprise of investments in listed ordinary shares and units of mutual funds.
Financial instruments included in level 2 comprise of Sukuk Bonds, Pakistan Investment Bonds, Market Treasury Bills, Term Finance certificates, FX options, Cross Currency Swaps, Interest Rate Swaps and Forward Exchange Contracts.
Currently, no financial instruments are classified in level 3.
Notes to the Unconsolidated Condensed Interim Financial Statements (Un-audited)For the three months period ended March 31, 2020
Notes to the Unconsolidated Condensed Interim Financial Statements (Un-audited)For the three months period ended March 31, 2020

30 31
37RE
LATE
D PA
RTY
TRAN
SACT
IONS
Dire
ctor
sKe
y M
anag
emen
t Pe
rson
nel
Subs
idia
ries
Ass
ocia
tes
Oth
er R
elat
ed
Parti
esDi
rect
ors
Key
Man
agem
ent
Pers
onne
lSu
bsid
iarie
s A
ssoc
iate
s O
ther
Rel
ated
Pa
rties
Bala
nces
with
oth
er b
anks
In c
urre
nt a
ccou
nts
-
-
-
-
-
-
-
-
-14
,389
-
-
-
-
-
-
-
-
-
14,3
89
Lend
ings
to F
inan
cial
Inst
itutio
ns
Ope
ning
bal
ance
-
-
880,
853
-
-
-
-
63
1,35
1
--
Addi
tion
durin
g th
e pe
riod
/ yea
r-
-
8,
403,
928
-
-
-
-
22,3
55,3
49
--
Repa
id d
urin
g th
e pe
riod
/ yea
r-
-
(3
,402
,032
)
-
-
-
-
(2
2,10
5,84
7)
--
Clos
ing
bala
nce
-
-
5,88
2,74
9
-
-
-
-
880,
853
--
Inve
stm
ents
Ope
ning
bal
ance
-
-
12,3
46,5
37
700,
401
25
4,25
3
-
-
12,0
46,5
12
700,
401
254,
253
Inve
stm
ent m
ade
durin
g th
e pe
riod
/ yea
r-
-
-
-
-
-
-
35
0,00
0
--
Adju
stm
ent u
nder
am
alga
mat
ion
sche
me
-
-
-
-
-
-
-
(49,
975)
-
-
Clos
ing
bala
nce
-
-
12,3
46,5
37
700,
401
25
4,25
3
-
-
12,3
46,5
37
700,
401
254,
253
Prov
isio
n fo
r dim
inut
ion
in v
alue
of i
nves
tmen
ts-
-
72
5
-
5,00
0
-
-
725
-
5,00
0
Adva
nces
Ope
ning
bal
ance
1,72
212
9,04
988
9,81
1-
339,
520
658
141,
390
366,
872
-1,
050,
277
Addi
tion
/ exc
hang
e ad
just
men
t dur
ing
the
perio
d / y
ear
4,76
16,
301
(33,
369)
-30
5,34
029
,148
62,2
1652
2,93
9-
1,64
2,43
4
Repa
id d
urin
g th
e pe
riod
/ yea
r(6
,407
)(6
,993
)-
-(2
45,2
31)
(28,
084)
(55,
470)
--
(1,5
58,4
81)
Tran
sfer
in /
(out
)-
469
--
--
(19,
087)
--
(794
,710
)
Clos
ing
bala
nce
7612
8,82
685
6,44
2-
399,
629
1,72
212
9,04
988
9,81
1-
339,
520
Prov
ision
hel
d ag
ains
t adv
ance
s-
--
--
--
--
-
------
------
------
------
------
------
------
------
------
------
------
------
------
------
------
------
(Rup
ees
in '0
00)--
------
------
------
------
------
------
------
------
------
------
------
------
------
------
------
----
The
Bank
has
rela
ted
party
rela
tions
hip
with
its
subs
idia
ries,
ass
ocia
tes,
em
ploy
ee b
enef
it pl
ans,
its
dire
ctor
s an
d ke
y m
anag
emen
t per
sonn
el a
nd th
eir c
lose
fam
ily m
embe
rs.
Deta
ils o
f tra
nsac
tions
with
rela
ted
parti
es d
urin
g th
e pe
riod,
oth
er th
an th
ose
which
hav
e be
en d
isclo
sed
else
wher
e in
thes
e un
cons
olid
ated
con
dens
ed in
terim
fina
ncia
l sta
tem
ents
are
as
follo
ws:
Unau
dite
d M
arch
31,
202
0Au
dite
d De
cem
ber 3
1, 2
019
The
Ban
ks e
nter
s in
to tr
ansa
ctio
ns w
ith re
late
d pa
rtie
s in
the
ordi
nary
cou
rse
of b
usin
ess
and
on s
ubst
antia
lly th
e sa
me
term
s as
for c
ompa
rabl
e tr
ansa
ctio
ns w
ith p
erso
n of
sim
ilar s
tand
ing.
Con
trib
utio
ns to
and
acc
rual
s in
resp
ect o
f sta
ff re
tirem
ent b
enef
its a
nd o
ther
be
nefit
pla
ns a
re m
ade
in a
ccor
danc
e w
ith th
e ac
tuar
ial v
alua
tions
/ te
rms
of th
e co
ntrib
utio
n pl
an. R
emun
erat
ion
to th
e ex
ecut
ives
/ of
ficer
s is
det
erm
ined
in a
ccor
danc
e w
ith th
e te
rms
of th
eir a
ppoi
ntm
ent.
36 SEGMENT INFORMATION
36.1 Segment details with respect to business activities
The segment analysis with respect to business activity is as follows:
Retail BankingConsumer
banking
Corporate
BankingTreasury
International
Bankingothers Sub-total Eliminations Total
Net mark-up/return/profit (16,090,155) 691,123 9,577,037
21,762,473
367,222
-
16,307,700
-
16,307,700
Inter segment revenue - net 28,833,802
(215,624)
(8,422,244)
(22,976,757)
(37,747)
2,818,570
-
-
-
Non mark-up / return / interest income 1,589,015
559,212
732,565
670,873
196,501
139,519
3,887,685
-
3,887,685
Total Income 14,332,662
1,034,711
1,887,358
(543,411)
525,976
2,958,089
20,195,385
-
20,195,385
Segment direct expenses 5,844,524
448,880
183,979
136,199
352,900
1,621,504
8,587,986
-
8,587,986
Inter segment expense allocation -
-
-
-
-
-
-
-
-
Total expenses 5,844,524
448,880
183,979
136,199
352,900
1,621,504
8,587,986
-
8,587,986
Provisions (57,077)
(11,743)
100,000
748,442
32,036
(69,196)
742,462
-
742,462
Profit before tax 8,545,215
597,574
1,603,379
(1,428,052)
141,040
1,405,781
10,864,937
-
10,864,937
Balance Sheet
Cash & Bank balances 45,954,279
134,183
1,709,324
42,909,247
18,342,531
249,510
109,299,074
-
109,299,074
Investments 11,841,294
813,921,055
10,897,256
836,659,605
-
836,659,605
Net inter segment lending 973,715,995
-
-
-
-
189,198,395
1,162,914,390
(1,162,914,390)
-
Lendings to financial institutions -
-
-
5,882,750
3,693,754
-
9,576,504
-
9,576,504
Advances - performing 91,965,327
24,356,165
331,790,172
-
24,766,251
-
472,877,915
-
472,877,915
- non performing 1,123,365
116,689
1,355,036
-
5,204,215
247,930
8,047,235
-
8,047,235
Others 36,618,340
2,150,167
27,208,255
8,370,852
1,953,723
42,453,969
118,755,306
-
118,755,306
Total Assets 1,149,377,306
26,757,204
373,904,081
871,083,904
64,857,730
232,149,804
2,718,130,029
(1,162,914,390)
1,555,215,639
Borrowings 48,747,208
-
7,081,704
27,333,956
5,488,907
-
88,651,775
-
88,651,775
Deposits & other accounts 1,075,145,917
17,737,881
47,134,981
-
43,109,132
1,010,972
1,184,138,883
-
1,184,138,883
Net inter segment borrowing -
6,507,215
301,477,153
841,977,925
12,952,097
-
1,162,914,390
(1,162,914,390)
-
Others 25,484,181
2,512,108
18,210,243
1,772,023
3,307,594
52,493,036
103,779,185
-
103,779,185
Total liabilities 1,149,377,306
26,757,204
373,904,081
871,083,904
64,857,730
53,504,008
2,539,484,233
(1,162,914,390)
1,376,569,843
Equity -
-
-
-
-
178,645,796
178,645,796
-
178,645,796
Total Equity & liabilities 1,149,377,306
26,757,204
373,904,081
871,083,904
64,857,730
232,149,804
2,718,130,029
(1,162,914,390)
1,555,215,639
Contingencies & Commitments 59,448,350
263,334,673
307,333,679
15,150,586
30,882,758
676,150,046
-
676,150,046
Retail BankingConsumer
banking
Corporate
BankingTreasury
International
Bankingothers Sub-total Eliminations Total
Net mark-up/return/profit (9,324,648)
891,247
7,902,589
13,589,574
419,992
-
13,478,754
-
13,478,754
Inter segment revenue - net 19,469,256
(552,062)
(6,704,419)
(14,446,652)
(10,580)
2,244,457
-
-
-
Non mark-up / return / interest income 1,573,510
484,013
755,418
417,557
207,546
76,411
3,514,455
-
3,514,455
Total Income 11,718,118
823,198
1,953,588
(439,521)
616,958
2,320,868
16,993,209
-
16,993,209
Segment direct expenses 5,761,326
364,019
213,232
107,242
271,186
1,681,003
8,398,008
-
8,398,008
Inter segment expense allocation -
-
-
-
-
-
-
-
-
Total expenses 5,761,326
364,019
213,232
107,242
271,186
1,681,003
8,398,008
-
8,398,008
Provisions 12,804
(15,600)
(173,488)
(25,619)
32,844
(315,098)
(484,157)
-
(484,157)
Profit before tax 5,943,988
474,779
1,913,844
(521,144)
312,928
954,963
9,079,358
-
9,079,358
Balance Sheet
Cash & Bank balances 50,154,942
21,483
676,139
65,572,277
28,149,362
672,833
145,247,036
-
145,247,036
Investments -
-
10,638,292
723,114,519
15,011,691
-
748,764,502
-
748,764,502
Net inter segment lending 940,015,024
-
-
-
164,292,627
1,104,307,651
(1,104,307,651)
-
Lendings to financial institutions -
-
-
880,853
209,205
-
1,090,058
-
1,090,058Advances - performing 98,464,054
24,342,756
341,191,287
-
25,190,939
-
489,189,036
-
489,189,036- non performing 1,074,787
113,148
1,237,494
-
4,836,865
227,544
7,489,838
-
7,489,838
Others 34,759,963
1,882,259
25,393,004
13,804,786
2,368,790
45,162,743
123,371,545
-
123,371,545
Total Assets 1,124,468,770
26,359,646
379,136,216
803,372,435
75,766,852
210,355,747
2,619,459,666
(1,104,307,651)
1,515,152,015
Borrowings 45,355,965
-
7,057,504
33,572,200
3,520,223
-
89,505,892
-
89,505,892
Deposits & other accounts 1,033,804,761
-
55,425,048
-
55,523,627
9,823
1,144,763,259
-
1,144,763,259
Net inter segment borrowing -
24,124,908
299,650,838
768,067,183
12,464,722
-
1,104,307,651
(1,104,307,651)
-
Others 45,308,044
2,234,738
17,002,826
1,733,052
4,258,280
41,431,141
111,968,081
-
111,968,081
Total liabilities 1,124,468,770
26,359,646
379,136,216
803,372,435
75,766,852
41,440,964
2,450,544,883
(1,104,307,651)
1,346,237,232
Equity - - - - 168,914,783 168,914,783 - 168,914,783
Total Equity & liabilities 1,124,468,770 26,359,646 379,136,216 803,372,435 75,766,852 210,355,747 2,619,459,666 (1,104,307,651) 1,515,152,015
Contingencies & Commitments 48,973,361 - 262,455,692 496,556,621 14,015,586 29,145,510 851,146,770 - 851,146,770
36.2
Audite d December 31, 2019
Transactions between reportable segments are based on an appropriate transfer pricing mechanism using agreed rates. Furthermore, segment assets and liabilities include intersegment balances. Costs which are not allocated to segments are included in the Head office. Income taxes are managed at bank level and are not allocated to operating segments.
Un audited three months period ended March 31, 2020
Un audited three months period ended March 31, 2019
----------------------------------------------------------------------Ru pees in '000----------------------------------------------------------------------
Unaudited ended March 31, 2020
----------------------------------------------------------------------Ru pees in '000----------------------------------------------------------------------
-
Notes to the Unconsolidated Condensed Interim Financial Statements (Un-audited)For the three months period ended March 31, 2020
Notes to the Unconsolidated Condensed Interim Financial Statements (Un-audited)For the three months period ended March 31, 2020

32 33
RELA
TED
PART
Y TR
ANSA
CTIO
NS
Dire
ctor
sKe
y M
anag
emen
t Pe
rson
nel
Subs
idia
ries
Ass
ocia
tes
Oth
er R
elate
d Pa
rties
Dire
ctor
sKe
y M
anag
emen
t Pe
rson
nel
Subs
idia
ries
Ass
ocia
tes
Oth
er R
elat
ed
Parti
es
Inco
me
Mar
kup
/ ret
urn
/ int
eres
t ear
ned
-
4,48
7
42,9
96
-
8,41
9
-
4,89
1
69,1
80
-
5,87
5
Fee
and
com
miss
ion
inco
me
-
-
7,07
0
324,
743
248
-
-
11,9
86
298,
655
2,40
1
Divid
end
inco
me
-
-
36,9
57
-
7,93
3
-
-
-
-
-(L
oss)
/ G
ain
on fo
rwar
d fo
reign
exc
hang
e co
ntra
cts
mat
ured
dur
ing th
e pe
riod
/ yea
r-
-
-
-
(14,
882)
-
-
-
-
5,52
2
Net g
ain
/ (lo
ss) o
n sa
le o
f sec
uritie
s72
33
-
235
322
-
(0.5
)
-
-
2,44
6
Gai
n on
sal
e of
fixe
d as
sets
-
5
-
-
-
-
36
-
-
-
Rent
inco
me
and
reim
burs
emen
t of o
ther
exp
ense
s-
-
9,78
8
2,28
5
570
-
-
10,8
08
965
1,01
3
Expe
nse
Mar
kup
/ ret
urn
/ int
eres
t exp
ense
d15
,223
516
886
94,8
70
68,1
88
68,6
54
178
359
38,8
72
78,7
82
Oth
er O
pera
ting
expe
nses
Clea
ring
expe
nses
pai
d to
NIF
T-
-
-
-
46,2
78
-
-
-
-
35,8
82
Cont
ribut
ion
to p
rovid
ent f
und
-
-
-
-
99,8
58
-
-
-
-
92,5
17
Rent
exp
ense
s-
-
2,61
3
11,3
96
10,7
45
-
-
2,37
6
-
9,36
4
Cash
sor
ting
expe
nses
-
-
-
-
33,4
81
-
-
-
-
38,5
27
Stat
ione
ry e
xpen
ses
-
-
-
-
69,0
84
-
-
-
-
60,4
55
Secu
rity g
uard
s ex
pens
es-
-
-
-
82,6
40
-
-
-
-
96,9
44
Rem
uner
atio
n to
key
exe
cutiv
es a
nd n
on-e
xecu
tive
dire
ctor
s fe
e80
,299
238,
710
-
-
-
66,7
86
205,
961
-
-
-
Out
sour
cing
serv
ice e
xpen
ses
-
-
-
67,7
35
-
-
-
-
64,5
75
-
E-di
viden
d pr
oces
sing
fee
and
CDC
char
ges
-
-
-
-
702
-
-
-
-
703
Trav
ellin
g Ex
pens
es-
-
-
-
11,2
14
-
-
-
-
7,25
7
Hote
l sta
y ex
pens
es-
-
-
-
889
-
-
-
-
56
Repa
ir &
Main
tena
nce
Char
ges
-
-
-
-
445
-
-
-
-
-
Adve
rtise
men
t Exp
ense
s-
-
-
-
3,13
2
-
-
-
-
-
Misc
ella
neou
s ex
pens
es a
nd p
aym
ents
-
-
-
-
561
-
-
-
-
335
Insu
ranc
e pr
emium
-net
of r
efun
d-
-
-
266,
437
-
-
-
-
369,
359
-
Insu
ranc
e cla
im s
ettle
d-
-
-
16,9
91
-
-
-
-
24,4
62
-
Oth
er T
rans
actio
ns
Proc
eeds
from
sal
e of
fixe
d as
sets
-
5
-
-
-
-
36
-
-
-
Purc
hase
of f
ixed
asse
ts-
-
-
2,34
7
-
-
-
-
46,3
39
20,0
03
Sale
of f
orei
gn c
urre
ncy
-
-
12,3
56,4
36
-
-
-
-
5,22
8,39
1
-
-
Purc
hase
of f
orei
gn c
urre
ncy
-
-
9,55
0,83
5
-
-
-
-
3,23
6,05
9
-
-
Paym
ents
aga
inst
hom
e re
mitt
ance
s-
-
690,
618
-
-
-
-
646,
749
-
-
Sale
of g
over
nmen
t sec
uritie
s79
,760
34,8
38
-
1,79
1,47
9
770,
297
-
30,5
28
-
1,13
9,93
0
29,8
03,8
33
Purc
hase
of g
over
nmen
t sec
uritie
s19
,827
--
631,
712
440,
478
-12
,491
-1,
990,
297
39,3
07,7
24
Forw
ard
exch
ange
con
tract
s m
atur
ed d
urin
g th
e pe
riod
--
--
4,76
6,94
9-
--
-5,
077,
573
The
Chai
rman
has
been
prov
ided
with
free
use
ofth
eBa
nkm
aint
aine
dca
r.Th
eCh
ief
Exec
utive
and
certa
inex
ecut
ives
are
prov
ided
with
free
use
ofth
eBa
nk's
mai
ntai
ned
cars
and
hous
ehol
deq
uipm
ent
inac
cord
ance
with
the
term
s of
thei
r em
ploy
men
t.
Unau
dite
d th
ree
mon
ths
ende
d M
arch
31,
202
0Un
audi
ted
thre
e m
onth
s en
ded
Mar
ch 3
1, 2
019
------
------
------
------
------
------
------
------
------
------
------
------
------
------
------
------
(Rup
ees
in '0
00)--
------
------
------
------
------
------
------
------
------
------
------
------
------
------
------
----
Direc
tors
Key
Mana
geme
nt Pe
rsonn
elSu
bsidi
aries
Ass
ociat
es
Othe
r Rela
ted
Partie
sDi
rector
sKe
y Ma
nage
ment
Perso
nnel
Subs
idiari
es A
ssoc
iates
Ot
her R
elated
Pa
rties
Othe
r As
sets
Marku
p rec
eivab
le-
2,610
31,46
4
-
6,692
-
3,2
02
31,55
2
-
5,191
Adva
nces
, dep
osits
, adv
ance
rent
and o
ther p
repay
ments
-
-
13,07
7
342,2
53
41,01
6
-
-
5,322
246,7
20
27,08
0
Rece
ivable
from
Pens
ion Fu
nd-
-
-
-
3,695
,121
-
-
-
-
3,605
,121
Unrea
lized
gain
on fo
rward
forei
gn ex
chan
ge co
ntrac
ts - o
utstan
ding
-
-
975
-
76,09
7
-
-
27,49
3
-
-
Prov
ision
held
again
st oth
er as
sets
-
-
-
-
-
-
-
-
-
-
Borro
wing
s
Open
ing ba
lance
-
-
3,903
-
69,16
6
-
-
19,14
6
-
-
Borro
wing
s / ex
chan
ge ad
justm
ent d
uring
the p
eriod
/ yea
r-
-
116,7
61
-
11,27
7
-
-
386,2
28
-
144,1
66
Settle
d duri
ng th
e peri
od / y
ear
-
-
(114,4
29)
-
-
-
-
(401,4
71)
-
(75,00
0)
Clos
ing ba
lance
-
-
6,235
-
80,44
3
-
-
3,903
-
69,16
6
Depo
sits a
nd ot
her a
ccou
nts
Open
ing ba
lance
602,3
81
140,7
61
54,48
2
3,657
,552
4,179
,849
3,745
,457
168,5
28
65,93
3
3,339
,847
3,212
,620
Rece
ived d
uring
the p
eriod
/ yea
r18
9,691
363,3
26
4,184
,087
24,73
5,193
40,94
5,756
9,889
,584
866,7
66
4,513
,372
22,23
4,251
62,26
3,273
With
drawn
durin
g the
perio
d / ye
ar(26
9,036
)
(383,2
02)
(4,20
1,716
)
(25,28
8,176
)
(38,39
0,641
)
(13,02
5,336
)
(884,5
32)
(4,51
5,594
)
(21,91
6,546
)
(61,42
3,281
)
Tran
sfer in
/ (ou
t) - ne
t-
(7,95
9)
-
-
299
(7,32
4)
(10,00
1)
(9,22
9)
-
127,2
37
Clos
ing ba
lance
523,0
36
112,9
26
36,85
3
3,104
,569
6,735
,263
602,3
81
140,7
61
54,48
2
3,657
,552
4,179
,849
Othe
r Liab
ilities
Marku
p pay
able
5,203
270
366
52,61
7
39,10
7
7,263
556
158
50,53
5
66,90
6
Accru
ed ex
pens
es an
d othe
r pay
able
2,070
-
22,55
6
130,3
84
573
15,32
6
-
23,13
4
62,40
2
50
Paya
ble to
MCB
Emp
loyee
Sec
urity
Servi
ces
-
-
-
-
24,44
0
-
-
-
-
24,56
5
Adva
nce r
eceiv
ed ag
ainst
sale
of pro
perty
-
-
20,00
0
-
-
-
-
20,00
0
-
-
Cont
ingen
cies a
nd C
ommi
tmen
ts
Comm
itmen
ts an
d con
tinge
nt lia
bilitie
s - ou
tstan
ding
--
-10
,606
240,7
69-
--
10,44
474
6,868
Forw
ard fo
reign
exch
ange
contr
acts
(Noti
onal)
- outs
tandin
g-
-2,1
40,98
7-
4,771
,124
--
2,044
,093
--
Bank
guara
ntee
--
100,5
58-
--
-26
,711
--
Unau
dited
Marc
h 31,
2020
Audit
ed D
ecem
ber 3
1, 20
19
------
------
------
------
------
------
------
------
------
------
------
------
------
------
------
------
(Rup
ees i
n '00
0)----
------
------
------
------
------
------
------
------
------
------
------
------
------
------
------
--
Notes to the Unconsolidated Condensed Interim Financial Statements (Un-audited)For the three months period ended March 31, 2020
Notes to the Unconsolidated Condensed Interim Financial Statements (Un-audited)For the three months period ended March 31, 2020

34 35
Unaudited Audited
38 CAPITAL ADEQUACY, LEVERAGE RATIO & LIQUIDITY REQUIREMENTS
38.1 Capital Adequacy
Minimum Capital Requirement (MCR):
Paid-up capital (net of losses)
Capital Adequacy Ratio (CAR):
Eligible Common Equity Tier 1 (CET 1) CapitalEligible Additional Tier 1 (ADT 1) Capital
Total Eligible Tier 1 Capital
Eligible Tier 2 Capital
Total Eligible Capital (Tier 1 + Tier 2)
Risk Weighted Assets (RWAs):
Credit Risk
Market Risk
Operational Risk
Total
Common Equity Tier 1 Capital Adequacy ratio
Tier 1 Capital Adequacy Ratio
Total Capital Adequacy Ratio
38.2 Leverage Ratio (LR):
Eligible Tier-1 Capital
Total ExposuresLeverage Ratio
38.3 Liquidity Requirements
Liquidity Coverage Ratio (LCR):
Total High Quality Liquid Assets
Total Net Cash Outflow
Liquidity Coverage Ratio
Net Stable Funding Ratio (NSFR):
Total Available Stable Funding
Total Required Stable FundingNet Stable Funding Ratio
March 31, 2020 December 31, 2019
11,850,600
11,850,600
137,048,479
136,256,771
- -
137,048,479 136,256,771
36,748,098 27,354,014
173,796,577 163,610,785
647,849,898 638,492,645
122,139,570 108,276,486
120,887,137 120,887,137
890,876,605 867,656,268
15.38% 15.70%
15.38% 15.70%
19.51% 18.86%
137,048,479 136,256,771 1,973,433,174 1,928,383,315
6.94% 7.07%
837,023,551
713,965,089 383,766,497
362,188,259
218.11% 197.13%
1,044,731,925
983,364,374 663,125,807
699,043,391
157.55% 140.67%
----------Rupees in '000-------
39 EVENTS AFTER THE REPORTING DATE
*40 GENERAL
41 DATE OF AUTHORIZATION FOR ISSUE
The Board of Directors in its meeting held on April 22, 2020 has announced a cash dividend in respect of three months period ended March 31, 2020 of Rs.5.00 per share (March 31, 2019: Rs. 4.00 per share). These unconsolidated condensed interim financial statements for the period ended March 31, 2020 do not include the effect of these appropriations which will be accounted for subsequent to the period end.
Figures have been rounded off to the nearest thousand of rupees unless otherwise stated.
These unconsolidated condensed interim financial statements were authorized for issue by the Board of Directors of the Bank in their meeting held on April 22, 2020.
Notes to the Unconsolidated Condensed Interim Financial Statements (Un-audited)For the three months period ended March 31, 2020
Notes to the Unconsolidated Condensed Interim Financial Statements (Un-audited)For the three months period ended March 31, 2020
Hammad Khalid
Chief Financial Officer Masood Ahmed Puri
Director Salman Khalid Butt
Director Imran Maqbool
Mian Umer Mansha
Director President / CEO

36 37
Note Unaudited March 31, 2020
Audited December 31, 2019
ASSETS
Cash and balances with treasury banks 7 112,366,406
142,957,358
Balances with other banks 8 20,779,308
21,371,753
Lendings to financial institutions 9 10,122,544
6,060,869
Investments 10 843,722,556
757,441,590
Advances 11 541,280,969
548,472,860
Fixed assets 12 63,986,871
64,201,807
Intangible assets 13 1,936,140
1,978,975
Deferred tax assets -
-
Other assets 14 65,374,134
69,729,659
1,659,568,928
1,612,214,871
LIABILITIES
Bills payable 16 8,968,788 12,795,325
Borrowings 17 93,900,399 92,859,968
Deposits and other accounts 18 1,271,950,183 1,226,593,025 Liabilities against assets subject to finance lease - - Subordinated debt - - Deferred tax liabilities 19 10,531,117 6,214,223 Other liabilities 20 93,659,262 102,405,513
1,479,009,749
1,440,868,054
NET ASSETS 180,559,179
171,346,817
REPRESENTED BY
Share capital 11,850,600
11,850,600
Reserves 21 79,159,653
77,894,829
Surplus on revaluation of assets 22 32,679,023
24,752,206
Unappropriated profit 56,178,259
56,108,779
179,867,535
170,606,414
Non-controlling interest 691,644
740,403
180,559,179
171,346,817
CONTINGENCIES AND COMMITMENTS 23
The annexed notes 1 to 42 form an integral part of these consolidated condensed interim financial statements.
---------Rupees in '000---------
(Consolidated Condensed Interim Financial Statements for the three months period ended March 31, 2020)
Consolidated Condensed Interim Statement of Financial PositionAs at March 31, 2020
Hammad Khalid
Chief Financial Officer Masood Ahmed Puri
Director Salman Khalid Butt
Director Imran Maqbool
Mian Umer Mansha
Director President / CEO
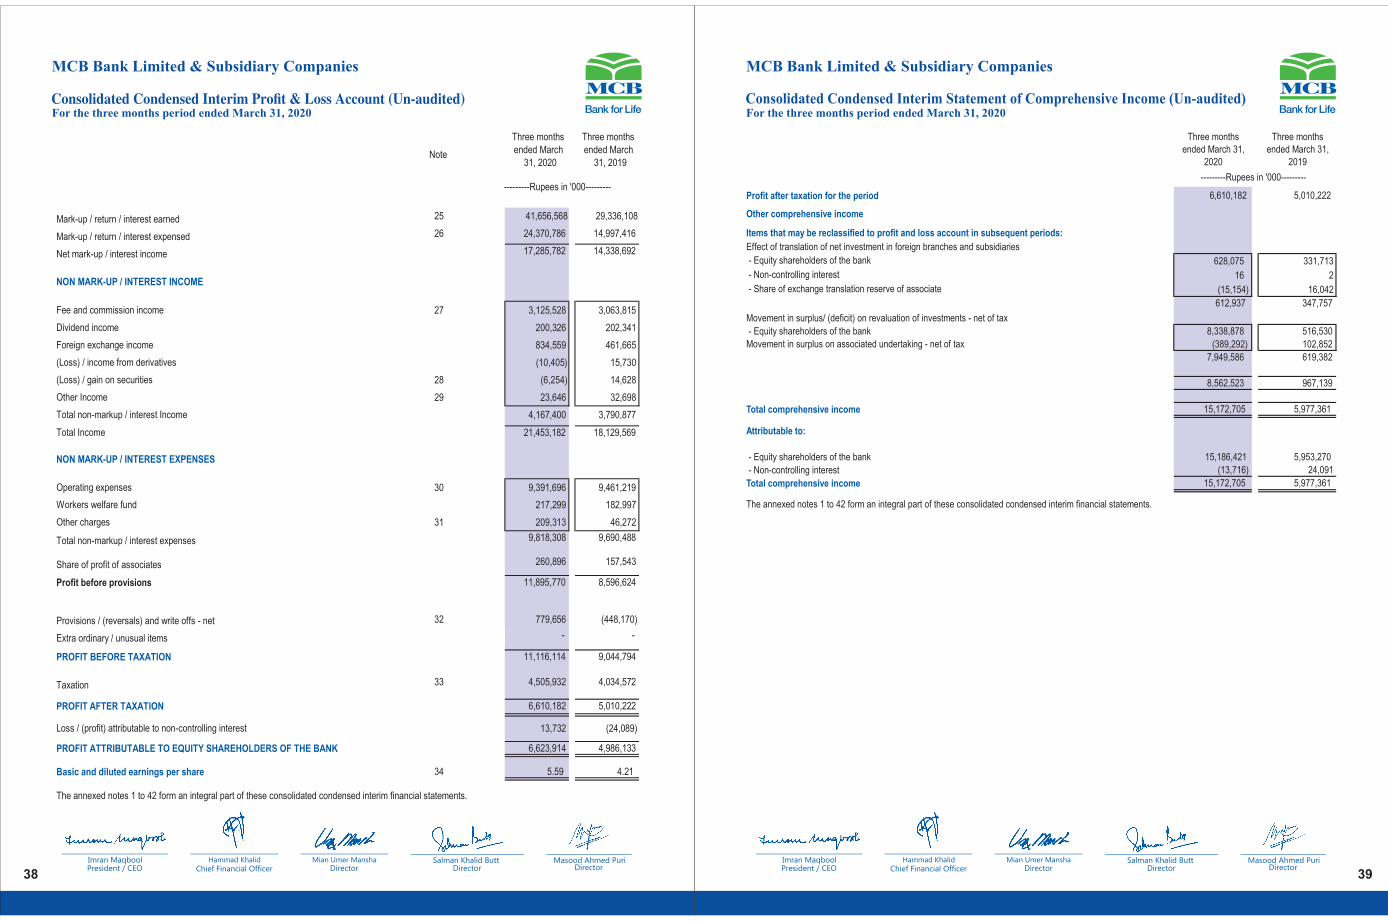
38 39
MCB Bank Limited & Subsidiary Companies
MCB Bank Limited & Subsidiary Companies
For the three months period ended March 31, 2020
Note
Three months ended March
31, 2020
Three months ended March
31, 2019
Mark-up / return / interest earned 25 41,656,568
29,336,108
Mark-up / return / interest expensed 26 24,370,786 14,997,416
Net mark-up / interest income 17,285,782 14,338,692
NON MARK-UP / INTEREST INCOME
Fee and commission income 27 3,125,528 3,063,815
Dividend income 200,326 202,341
Foreign exchange income 834,559 461,665
(Loss) / income from derivatives (10,405) 15,730
(Loss) / gain on securities 28 (6,254) 14,628
Other Income 29 23,646 32,698
Total non-markup / interest Income 4,167,400 3,790,877
Total Income 21,453,182 18,129,569
NON MARK-UP / INTEREST EXPENSES
Operating expenses 30 9,391,696 9,461,219
Workers welfare fund 217,299 182,997
Other charges 31 209,313 46,272
Total non-markup / interest expenses 9,818,308 9,690,488
Share of profit of associates 260,896 157,543
11,895,770 8,596,624
Provisions / (reversals) and write offs - net 32 779,656 (448,170)
Extra ordinary / unusual items - -
PROFIT BEFORE TAXATION 11,116,114 9,044,794
Taxation 33 4,505,932 4,034,572
PROFIT AFTER TAXATION 6,610,182 5,010,222
Loss / (profit) attributable to non-controlling interest 13,732 (24,089)
PROFIT ATTRIBUTABLE TO EQUITY SHAREHOLDERS OF THE BANK 6,623,914 4,986,133
Basic and diluted earnings per share 34 5.59 4.21
The annexed notes 1 to 42 form an integral part of these consolidated condensed interim financial statements.
---------Rupees in '000---------
Three months ended March 31,
2020
Three months ended March 31,
2019
6,610,182
5,010,222
Other comprehensive income
Effect of translation of net investment in foreign branches and subsidiaries
- Equity shareholders of the bank 628,075
331,713
- Non-controlling interest 16
2
- Share of exchange translation reserve of associate (15,154) 16,042
612,937 347,757
Movement in surplus/ (deficit) on revaluation of investments - net of tax
- Equity shareholders of the bank 8,338,878 516,530 Movement in surplus on associated undertaking - net of tax (389,292) 102,852
7,949,586 619,382
8,562,523
967,139
Total comprehensive income 15,172,705
5,977,361
Attributable to:
- Equity shareholders of the bank 15,186,421
5,953,270
- Non-controlling interest (13,716)
24,091
Total comprehensive income 15,172,705
5,977,361
The annexed notes 1 to 42 form an integral part of these consolidated condensed interim financial statements.
---------Rupees in '000---------
Consolidated Condensed Interim Statement of Comprehensive Income (Un-audited)For the three months period ended March 31, 2020
Hammad Khalid
Chief Financial Officer Masood Ahmed Puri
Director Salman Khalid Butt
Director Imran Maqbool
Mian Umer Mansha
Director President / CEO Hammad Khalid
Chief Financial Officer Masood Ahmed Puri
Director Salman Khalid Butt
Director Imran Maqbool
Mian Umer Mansha
Director President / CEO

Consolidated Condensed Interim Statement of Changes In Equity (Un-audited)For the three months period ended March 31, 2020
40 41
For the three months period ended March 31, 2020
Note Three months Three months ended March 31,
2020ended March 31,
2019
----------Rupees in '000--------CASH FLOW FROM OPERATING ACTIVITIESProfit before taxation 11,116,114
9,044,794
Less: Dividend income and share of profit of associates (461,222) (359,884)
10,654,892 8,684,910 Adjustments:
Depreciation on fixed assets 30 583,177 546,044
Depreciation on right of use assets 30 422,219 - Depreciation on non-banking assets acquired in satisfaction of claims 30 8,074 12,062 Amortization 30 109,581 86,441 Provisions / (reversals) and write offs - net 32 779,656 (448,170) Workers welfare fund 217,299 182,997 Gain on sale of fixed assets and non-banking assets acquired-net 29 (17,386) (21,247) Charge for defined benefit plans 57,000
42,000
Interest expensed on lease liability against right-of-use assets 375,369
-
Unrealized loss on revaluation of investments classified as held for trading 28 (3,514)
19,691
2,531,475
419,818 13,186,367
9,104,728
Decrease / (increase) in operating assets
Lendings to financial institutions (4,061,675)
(163,187,629) Held-for-trading securities (5,395,951)
8,108,313
Advances 7,148,673
4,431,305
Others assets (excluding advance taxation) 4,120,539
(1,433,636)
1,811,586
(152,081,647)
Increase / (decrease) in operating liabilities Bills Payable (3,826,537)
(5,558,365)
Borrowings from financial institutions (666,437)
(145,663,225)
Deposits 45,357,158
21,664,213
Other liabilities (excluding current taxation) (10,100,686)
(3,951,921)
30,763,498
(133,509,298)
Defined benefits paid (82,171)
(84,302)
Income tax paid (3,125,477)
(1,218,549)
Net cash flow from operating activities 42,553,803
(277,789,068)
CASH FLOW FROM INVESTING ACTIVITIES
Net investments in available-for-sale securities (81,461,963)
286,578,698
Net investments in held-to-maturity securities 12,259,730
(1,247,596)
Dividends received 101,023
105,852
Investments in fixed assets (557,401)
(1,737,240)
Investments in Intangible assets (68,504)
(126,597)
Proceeds from sale of fixed assets 27,190
25,082
Effect of translation of net investment in foreign branches & subsidiaries 612,921
331,715
Net cash flow used in investing activities (69,087,004)
283,929,914
CASH FLOW FROM FINANCING ACTIVITIESPayment of lease liability against right-of-use-assets (527,673)
-
Dividend paid (5,829,391)
(46,327)
Net cash flow used in financing activities (6,357,064)
(46,327)
(32,890,265)
6,094,519
Increase in cash and cash equivalentsCash and cash equivalents at beginning of the period 162,986,508 121,557,017
Cash and cash equivalents at end of the period 130,096,243 127,651,536
The annexed notes 1 to 42 form an integral part of these consolidated condensed interim financial statements.
Consolidated Condensed Interim Cash Flow Statement (Un-audited)
Reve
nue r
eserv
e
Inves
tmen
tsAs
socia
teFix
ed / n
on-
bank
ing as
sets
Balan
ce as
at D
ecem
ber 3
1, 20
1811
,850,6
0023
,973,0
2490
8,317
1,607
,782
29,28
5,450
18,60
0,000
(2,81
2,615
)25
1,246
12,97
9,244
53,97
1,079
150,6
14,12
770
8,752
151,3
22,87
9
Total
comp
rehe
nsive
inco
me fo
r the
perio
d end
ed M
arch
31, 2
019
Profi
t afte
r taxa
tion f
or the
perio
d end
ed M
arch 3
1, 20
19-
--
--
--
--
4,986
,133
4,986
,133
24,08
95,0
10,22
2Ot
her c
ompre
hens
ive in
come
- net
of tax
-
-
-
347,7
55
-
-
516,5
30
102,8
52
-
-
967,1
37
296
7,139
-
-
-
347,7
55
-
-
516,5
30
102,8
52
-
4,986
,133
5,953
,270
24,09
15,9
77,36
1
Tran
sfer to
statu
tory r
eserv
e-
-
-
-
507,9
86
-
-
-
-
(507,9
86)
-
--
Tran
sfer in
resp
ect o
f incre
menta
l dep
reciat
ion fro
m su
rplus
on re
valua
tion o
f fixe
d ass
ets to
unap
propri
ated p
rofit -
net o
f tax
-
-
-
-
-
-
-
-
(13,56
1)
13,56
1
-
--
Tran
sacti
ons w
ith ow
ners
, rec
orde
d dire
ctly i
n equ
ity
Final
cash
divid
end a
t Rs.
4.0 pe
r sha
re - D
ecem
ber 3
1, 20
18-
-
-
-
-
-
-
-
-
(4,74
0,240
)
(4,74
0,240
)
-(4,
740,2
40)
-
-
-
-
-
-
-
-
-
(4,74
0,240
)
(4,74
0,240
)
-(4,
740,2
40)
Balan
ce as
at M
arch 3
1, 20
1911
,850,6
00
23,97
3,024
908,3
17
1,955
,537
29,79
3,436
18,60
0,000
(2,29
6,085
)
354,0
98
12,96
5,683
53,72
2,547
151,8
27,15
7
732,8
4315
2,560
,000
Chan
ge in
equit
y for
nine
mon
ths p
eriod
ende
d Dec
embe
r 31,
2019
Total
comp
rehe
nsive
inco
me fo
r the
nine
mon
ths p
eriod
ende
d Dec
embe
r 31,
2019
Profi
t afte
r taxa
tion f
or the
nine
mon
ths pe
riod e
nded
Dec
embe
r 31,
2019
-
-
-
-
-
-
-
-
-
18,88
2,116
18,88
2,116
54,87
318
,936,9
89Ot
her c
ompre
hens
ive in
come
- net
of tax
-
-
-
774,8
17
-
-
6,622
,336
(9,33
6)
7,204
,465
(474,4
21)
14,11
7,861
1814
,117,8
79-
-
-
774,8
17
-
-
6,622
,336
(9,33
6)
7,204
,465
18,40
7,695
32,99
9,977
54,89
133
,054,8
68
Tran
sfer to
statu
tory r
eserv
e-
-
-
-
1,889
,698
-
-
-
-
(1,88
9,698
)
-
--
Tran
sfer in
resp
ect o
f incre
menta
l dep
reciat
ion fro
m su
rplus
on re
valua
tion o
f fixe
d ass
ets to
unap
propri
ated p
rofit -
net o
f tax
-
-
-
-
-
-
-
(40,53
2)
40,53
2
-
--
Surp
lus re
alize
d on d
ispos
al of
revalu
ed fix
ed as
sets
- net
of tax
-
-
-
-
-
-
-
(10,56
0)
10,56
0
-
--
Surp
lus re
alize
d on d
ispos
al of
non-b
ankin
g ass
ets - n
et of
tax
-
-
-
-
-
-
-
(37,86
3)
37,86
3
-
--
Tran
sacti
ons w
ith ow
ners
, rec
orde
d dire
ctly i
n equ
ity-
Interi
m ca
sh di
viden
d at R
s. 4.0
per s
hare
- Marc
h 31,
2019
-
-
-
-
-
-
-
-
(4,74
0,240
)
(4,74
0,240
)
-(4,
740,2
40)
Interi
m ca
sh di
viden
d at R
s. 4.0
per s
hare
- Jun
e 30,
2019
-
-
-
-
-
-
-
-
(4,74
0,240
)
(4,74
0,240
)
-(4,
740,2
40)
Interi
m ca
sh di
viden
d at R
s. 4.0
per s
hare
- Sep
tembe
r 30,
2019
-
-
-
-
-
-
-
-
(4,74
0,240
)
(4,74
0,240
)
-(4,
740,2
40)
-
-
-
-
-
-
-
-
-
(14,22
0,720
)
(14,22
0,720
)
-(14
,220,7
20)
Share
of di
viden
d attri
butab
le to
Non-c
ontro
lling i
nteres
t-
-
-
-
-
-
-
-
-
-
-
(47,33
1)(47
,331)
Balan
ce as
at D
ecem
ber 3
1, 20
1911
,850,6
00
23,97
3,024
908,3
17
2,730
,354
31,68
3,134
18,60
0,000
4,326
,251
344,7
62
20,08
1,193
56,10
8,779
170,6
06,41
4
740,4
0317
1,346
,817
Total
comp
rehe
nsive
inco
me fo
r the
perio
d end
ed M
arch
31, 2
020
Profi
t afte
r taxa
tion f
or the
perio
d end
ed M
arch 3
1, 20
20-
-
-
-
-
-
-
-
6,623
,914
6,623
,914
(13,73
2)6,6
10,18
2Ot
her c
ompre
hens
ive in
come
- net
of tax
-
-
-
612,9
21
-
-
8,338
,878
(389,2
92)
-
-
8,562
,507
168,5
62,52
3-
-
-
612,9
21
-
-
8,338
,878
(389,2
92)
-
6,623
,914
15,18
6,421
(13,71
6)15
,172,7
05
Tran
sfer to
statu
tory r
eserv
e-
-
-
-
651,9
03
-
-
-
(651,9
03)
-
--
Tran
sfer in
resp
ect o
f incre
menta
l dep
reciat
ion fro
m su
rplus
on re
valua
tion o
f fixe
d ass
ets to
unap
propri
ated p
rofit -
net o
f tax
-
-
-
-
-
-
-
(22,76
9)
22,76
9
-
--
Tran
sacti
ons w
ith ow
ners
, rec
orde
d dire
ctly i
n equ
ity
Final
cash
divid
end a
t Rs.
5.0 pe
r sha
re - D
ecem
ber 3
1, 20
19-
--
--
--
-(5,
925,3
00)
(5,92
5,300
)-
(5,92
5,300
)-
--
--
--
--
(5,92
5,300
)(5,
925,3
00)
-(5,
925,3
00)
Share
of di
viden
d attri
butab
le to
Non-c
ontro
lling i
nteres
t-
--
--
--
--
--
(35,04
3)(35
,043)
Balan
ce as
at M
arch 3
1, 20
2011
,850,6
0023
,973,0
2490
8,317
3,343
,275
32,33
5,037
18,60
0,000
12,66
5,129
(44,53
0)20
,058,4
2456
,178,2
5917
9,867
,535
691,6
4418
0,559
,179
For d
etails
of di
viden
d dec
larati
on an
d app
ropria
tions
, plea
se re
fer no
te 40
to th
ese c
onso
lidate
d con
dens
ed in
terim
finan
cial s
tatem
ents.
For d
etails
of re
serve
s, ple
ase r
efer n
ote 21
to th
ese c
onso
lidate
d con
dens
ed in
terim
finan
cial s
tatem
ents.
The a
nnex
ed no
tes 1
to 42
form
an in
tegral
part o
f thes
e con
solid
ated c
onde
nsed
inter
im fin
ancia
l stat
emen
ts.
Non
contr
olling
intere
st G
rand T
otal
------
------
------
------
------
------
------
------
------
------
------
------
------
------
------
-----R
upee
s in
'000
------
------
------
------
------
------
------
------
------
------
------
------
------
------
------
-----
Capit
al res
erve
Stat
utory
reserv
e S
hare
capit
al
Surpl
us/(d
eficit
) on r
evalu
ation
of S
hare
premi
um
Non-
distrib
utable
capit
al res
erve
Exch
ange
trans
lation
rese
rve G
enera
l rese
rve
Una
pprop
riated
profit
Total
MCB Bank Limited & Subsidiary Companies MCB Bank Limited & Subsidiary Companies
Hammad Khalid
Chief Financial Officer Masood Ahmed Puri
Director Salman Khalid Butt
Director Imran Maqbool
Mian Umer Mansha
Director President / CEO Hammad Khalid
Chief Financial Officer Masood Ahmed Puri
Director Salman Khalid Butt
Director Imran Maqbool
Mian Umer Mansha
Director President / CEO
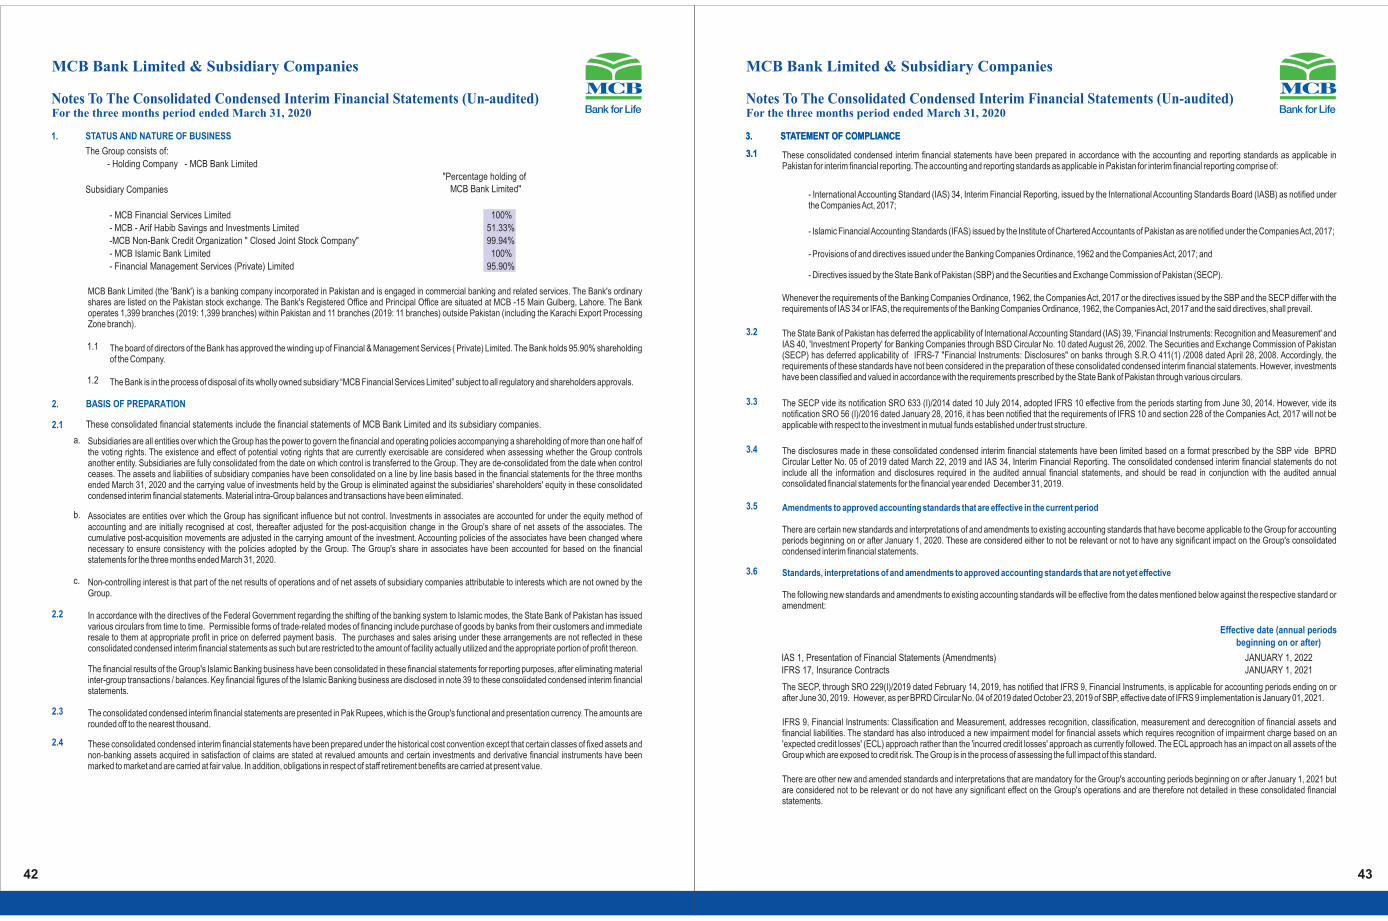
2. BASIS OF PREPARATION
2.1
a.
These consolidated financial statements include the financial statements of MCB Bank Limited and its subsidiary companies.
1.1
1.2
42 43
For the three months period ended March 31, 2020Notes To The Consolidated Condensed Interim Financial Statements (Un-audited)
For the three months period ended March 31, 2020Notes To The Consolidated Condensed Interim Financial Statements (Un-audited)
1. STATUS AND NATURE OF BUSINESS
The Group consists of:
Subsidiary Companies
- MCB Financial Services Limited
- MCB - Arif Habib Savings and Investments Limited
- MCB Islamic Bank Limited
- Financial Management Services (Private) Limited
100%
95.90%
- Holding Company - MCB Bank Limited
"Percentage holding of MCB Bank Limited"
100%
51.33%
-MCB Non-Bank Credit Organization " Closed Joint Stock Company" 99.94%
MCB Bank Limited (the 'Bank') is a banking company incorporated in Pakistan and is engaged in commercial banking and related services. The Bank's ordinary shares are listed on the Pakistan stock exchange. The Bank's Registered Office and Principal Office are situated at MCB -15 Main Gulberg, Lahore. The Bank operates 1,399 branches (2019: 1,399 branches) within Pakistan and 11 branches (2019: 11 branches) outside Pakistan (including the Karachi Export Processing Zone branch).
The board of directors of the Bank has approved the winding up of Financial & Management Services ( Private) Limited. The Bank holds 95.90% shareholding of the Company.
The Bank is in the process of disposal of its wholly owned subsidiary “MCB Financial Services Limited” subject to all regulatory and shareholders approvals.
Subsidiaries are all entities over which the Group has the power to govern the financial and operating policies accompanying a shareholding of more than one half of the voting rights. The existence and effect of potential voting rights that are currently exercisable are considered when assessing whether the Group controls another entity. Subsidiaries are fully consolidated from the date on which control is transferred to the Group. They are de-consolidated from the date when control ceases. The assets and liabilities of subsidiary companies have been consolidated on a line by line basis based in the financial statements for the three months ended March 31, 2020 and the carrying value of investments held by the Group is eliminated against the subsidiaries' shareholders' equity in these consolidated condensed interim financial statements. Material intra-Group balances and transactions have been eliminated.
b. Associates are entities over which the Group has significant influence but not control. Investments in associates are accounted for under the equity method of accounting and are initially recognised at cost, thereafter adjusted for the post-acquisition change in the Group's share of net assets of the associates. The cumulative post-acquisition movements are adjusted in the carrying amount of the investment. Accounting policies of the associates have been changed where necessary to ensure consistency with the policies adopted by the Group. The Group's share in associates have been accounted for based on the financial statements for the three months ended March 31, 2020.
Non-controlling interest is that part of the net results of operations and of net assets of subsidiary companies attributable to interests which are not owned by the Group.
c.
2.2 In accordance with the directives of the Federal Government regarding the shifting of the banking system to Islamic modes, the State Bank of Pakistan has issued various circulars from time to time. Permissible forms of trade-related modes of financing include purchase of goods by banks from their customers and immediate resale to them at appropriate profit in price on deferred payment basis. The purchases and sales arising under these arrangements are not reflected in these consolidated condensed interim financial statements as such but are restricted to the amount of facility actually utilized and the appropriate portion of profit thereon.
The financial results of the Group's Islamic Banking business have been consolidated in these financial statements for reporting purposes, after eliminating material inter-group transactions / balances. Key financial figures of the Islamic Banking business are disclosed in note 39 to these consolidated condensed interim financial statements.
2.3 The consolidated condensed interim financial statements are presented in Pak Rupees, which is the Group's functional and presentation currency. The amounts are rounded off to the nearest thousand.
2.4 These consolidated condensed interim financial statements have been prepared under the historical cost convention except that certain classes of fixed assets and non-banking assets acquired in satisfaction of claims are stated at revalued amounts and certain investments and derivative financial instruments have been marked to market and are carried at fair value. In addition, obligations in respect of staff retirement benefits are carried at present value.
3. STATEMENT OF COMPLIANCE
3.1 These consolidated condensed interim financial statements have been prepared in accordance with the accounting and reporting standards as applicable in Pakistan for interim financial reporting. The accounting and reporting standards as applicable in Pakistan for interim financial reporting comprise of:
- International Accounting Standard (IAS) 34, Interim Financial Reporting, issued by the International Accounting Standards Board (IASB) as notified under the Companies Act, 2017;
- Islamic Financial Accounting Standards (IFAS) issued by the Institute of Chartered Accountants of Pakistan as are notified under the Companies Act, 2017;
- Provisions of and directives issued under the Banking Companies Ordinance, 1962 and the Companies Act, 2017; and
- Directives issued by the State Bank of Pakistan (SBP) and the Securities and Exchange Commission of Pakistan (SECP).
Whenever the requirements of the Banking Companies Ordinance, 1962, the Companies Act, 2017 or the directives issued by the SBP and the SECP differ with the requirements of IAS 34 or IFAS, the requirements of the Banking Companies Ordinance, 1962, the Companies Act, 2017 and the said directives, shall prevail.
3.2 The State Bank of Pakistan has deferred the applicability of International Accounting Standard (IAS) 39, 'Financial Instruments: Recognition and Measurement' and IAS 40, 'Investment Property' for Banking Companies through BSD Circular No. 10 dated August 26, 2002. The Securities and Exchange Commission of Pakistan (SECP) has deferred applicability of IFRS-7 "Financial Instruments: Disclosures" on banks through S.R.O 411(1) /2008 dated April 28, 2008. Accordingly, the requirements of these standards have not been considered in the preparation of these consolidated condensed interim financial statements. However, investments have been classified and valued in accordance with the requirements prescribed by the State Bank of Pakistan through various circulars.
3.3 The SECP vide its notification SRO 633 (I)/2014 dated 10 July 2014, adopted IFRS 10 effective from the periods starting from June 30, 2014. However, vide its notification SRO 56 (I)/2016 dated January 28, 2016, it has been notified that the requirements of IFRS 10 and section 228 of the Companies Act, 2017 will not be applicable with respect to the investment in mutual funds established under trust structure.
3.4 The disclosures made in these consolidated condensed interim financial statements have been limited based on a format prescribed by the SBP vide BPRD Circular Letter No. 05 of 2019 dated March 22, 2019 and IAS 34, Interim Financial Reporting. The consolidated condensed interim financial statements do not include all the information and disclosures required in the audited annual financial statements, and should be read in conjunction with the audited annual consolidated financial statements for the financial year ended December 31, 2019.
3.5 Amendments to approved accounting standards that are effective in the current period
There are certain new standards and interpretations of and amendments to existing accounting standards that have become applicable to the Group for accounting periods beginning on or after January 1, 2020. These are considered either to not be relevant or not to have any significant impact on the Group's consolidated condensed interim financial statements.
3.6 Standards, interpretations of and amendments to approved accounting standards that are not yet effective
The following new standards and amendments to existing accounting standards will be effective from the dates mentioned below against the respective standard or amendment:
Effective date (annual periodsbeginning on or after)
IAS 1, Presentation of Financial Statements (Amendments)IFRS 17, Insurance Contracts
JANUARY 1, 2022JANUARY 1, 2021
The SECP, through SRO 229(I)/2019 dated February 14, 2019, has notified that IFRS 9, Financial Instruments, is applicable for accounting periods ending on or after June 30, 2019. However, as per BPRD Circular No. 04 of 2019 dated October 23, 2019 of SBP, effective date of IFRS 9 implementation is January 01, 2021.
IFRS 9, Financial Instruments: Classification and Measurement, addresses recognition, classification, measurement and derecognition of financial assets and financial liabilities. The standard has also introduced a new impairment model for financial assets which requires recognition of impairment charge based on an 'expected credit losses' (ECL) approach rather than the 'incurred credit losses' approach as currently followed. The ECL approach has an impact on all assets of the Group which are exposed to credit risk. The Group is in the process of assessing the full impact of this standard.
There are other new and amended standards and interpretations that are mandatory for the Group's accounting periods beginning on or after January 1, 2021 but are considered not to be relevant or do not have any significant effect on the Group's operations and are therefore not detailed in these consolidated financial statements.
3. STATEMENT OF COMPLIANCE
3.1
MCB Bank Limited & Subsidiary Companies MCB Bank Limited & Subsidiary Companies

44 45
For the three months period ended March 31, 2020Notes To The Consolidated Condensed Interim Financial Statements (Un-audited)
For the three months period ended March 31, 2020Notes To The Consolidated Condensed Interim Financial Statements (Un-audited)
4. SIGNIFICANT ACCOUNTING POLICIES
The significant accounting policies and methods of computation adopted in the preparation of these consolidated condensed interim financial statements are consistent with those applied in the preparation of the audited annual consolidated financial statements of the Bank for the year ended December 31, 2019.
5. CRITICAL ACCOUNTING ESTIMATES AND JUDGMENTS
The basis for accounting estimates adopted in the preparation of these consolidated condensed interim financial statements are the same as that applied in the preparation of the consolidated financial statements for the year ended December 31, 2019.
6. FINANCIAL RISK MANAGEMENT
The financial risk management objectives and policies adopted by the Group are consistent with those disclosed in the consolidated financial statements for the year ended December 31, 2019. These risk management policies continue to remain robust and the Group is reviewing its portfolio regularly and conducts rapid portfolio reviews in line with emerging risks.
The COVID - 19 pandemic has taken a toll on all economies and emerged as a contagion risk around the globe, including Pakistan. To reduce the impact on businesses and economies in general, regulators / governments across the globe have introduced a host of measures on both the fiscal and economic fronts.
The State Bank of Pakistan (SBP) has also responded to the crisis by cutting the Policy Rate by 225 basis points to 11% in March 2020 and again by 200 basis points to 9% on April 16, 2020. Other regulatory measures to provide an impetus to economic activity include the following:
– Reduction in the capital conservation buffer by 100 basis points to 1.5%;– Increasing the regulatory limit on extension of credit to SMEs to Rs 180 million;– Relaxing the debt burden ratio for consumer loans from 50% to 60%;– Allowing banks to defer borrowers’ principal loan payments by one year; and– Relaxing regulatory criteria for restructured/rescheduled loans for borrowers who require relief of principal repayment exceeding one year and / or mark-up.
COVID 19 has impacted the banks in Pakistan from various facets which include muted credit risk increase reduced fee income due to slowdown in economic activity, branch closures and cyber security threat management.
6.1 Credit Risk Management
The Risk Management function of the Group is regularly conducting assessments of the credit portfolio to identify borrowers most likely to get affected due to changes in the business and economic environment. The Group has further strengthened its risk appetite and related credit review procedures in the light of COVID-19, which would insulate the Group from any unforeseen shock .
6.2 Liquidity Risk Management
The Asset and Liability Committee (ALCO) of the Group is continuously monitoring the liquidity position and the Group is confident that the liquidity buffer currently maintained is sufficient to address any requirement, as reflected by the cushion in liquidity ratios above the statutory requirement.
6.3 Equity Risk Management
During the current quarter the Pakistan Stock Exchange fell by 28%, triggering an impairment of Rs 3,053.209 million. The Group has only recorded an impairment of Rs 765.363 million in the first quarter and has deferred the recognition of the remaining impairment to the remainder part of the calendar year 2020 as allowed State Bank of Pakistan.
6.4 Operational Risk Management
The Group is closely monitoring the situation and has invoked required actions to ensure the safety and security of Group staff while ensuring uninterrupted service to customers. The senior management of the Bank is continuously monitoring the situation and is taking timely decisions to resolve any concerns.
Business Continuity Plans (BCP) for respective areas are in place and duly tested. The Group has significantly enhanced monitoring of cyber security risk during these times. The remote work capabilities were enabled for staff, where required and related risk and control measures were assessed to ensure that the Group’s assets are protected from emerging cyber threats and comply with the regulatory protocols. The Group is communicating with its customers for their financial transactions to be conducted through digital channel offerings. The Group has taken all measures to ensure that service levels are maintained, customer complaints are resolved and turnaround times are monitored to meet customer requirements and expectations.
6.5 Capital Adequacy Ratio (CAR)
In order to encourage Group to continue lending, the SBP has relaxed the Capital Conversion Buffer (CCB) requirements to 1.5%, resulting in a 1% decline in CAR requirements for all Tiers.
Unaudited March 31, 2020
Audited December 31,
2019
7. CASH AND BALANCES WITH TREASURY BANKS
In hand
Local currency 27,663,433
20,833,520
Foreign currencies 3,542,220
2,802,190
31,205,653
23,635,710
With State Bank of Pakistan in
Local currency current accounts 49,844,485
62,180,493
Foreign currency current accounts 613,683
599,384
Foreign currency deposit accounts 14,681,428
14,320,863
65,139,596
77,100,740
With other central banks in
Foreign currency current accounts 4,719,906
16,220,148
With National Bank of Pakistan in
Local currency current accounts 11,163,193
25,666,525
Prize bonds 138,058 334,235
112,366,406 142,957,358 8. BALANCES WITH OTHER BANKS
In Pakistan
In current account 9,303
9,183 In deposit account 3,003,128
4,378,142
3,012,431
4,387,325
Outside Pakistan
In current accounts 12,159,102
12,845,556
In deposit accounts 5,607,775
4,138,872
17,766,877
16,984,428
20,779,308
21,371,753
9. LENDINGS TO FINANCIAL INSTITUTIONS
Call / clean money lendings 3,676,136
-
Repurchase agreement lendings (Reverse Repo) 17,618
209,205
Musharaka arrangements 5,600,000 2,480,000
Bai Muajjal receivable - with State Bank of Pakistan 828,790 3,371,664
10,122,544 6,060,869
----------Rupees in '000--------
MCB Bank Limited & Subsidiary Companies MCB Bank Limited & Subsidiary Companies
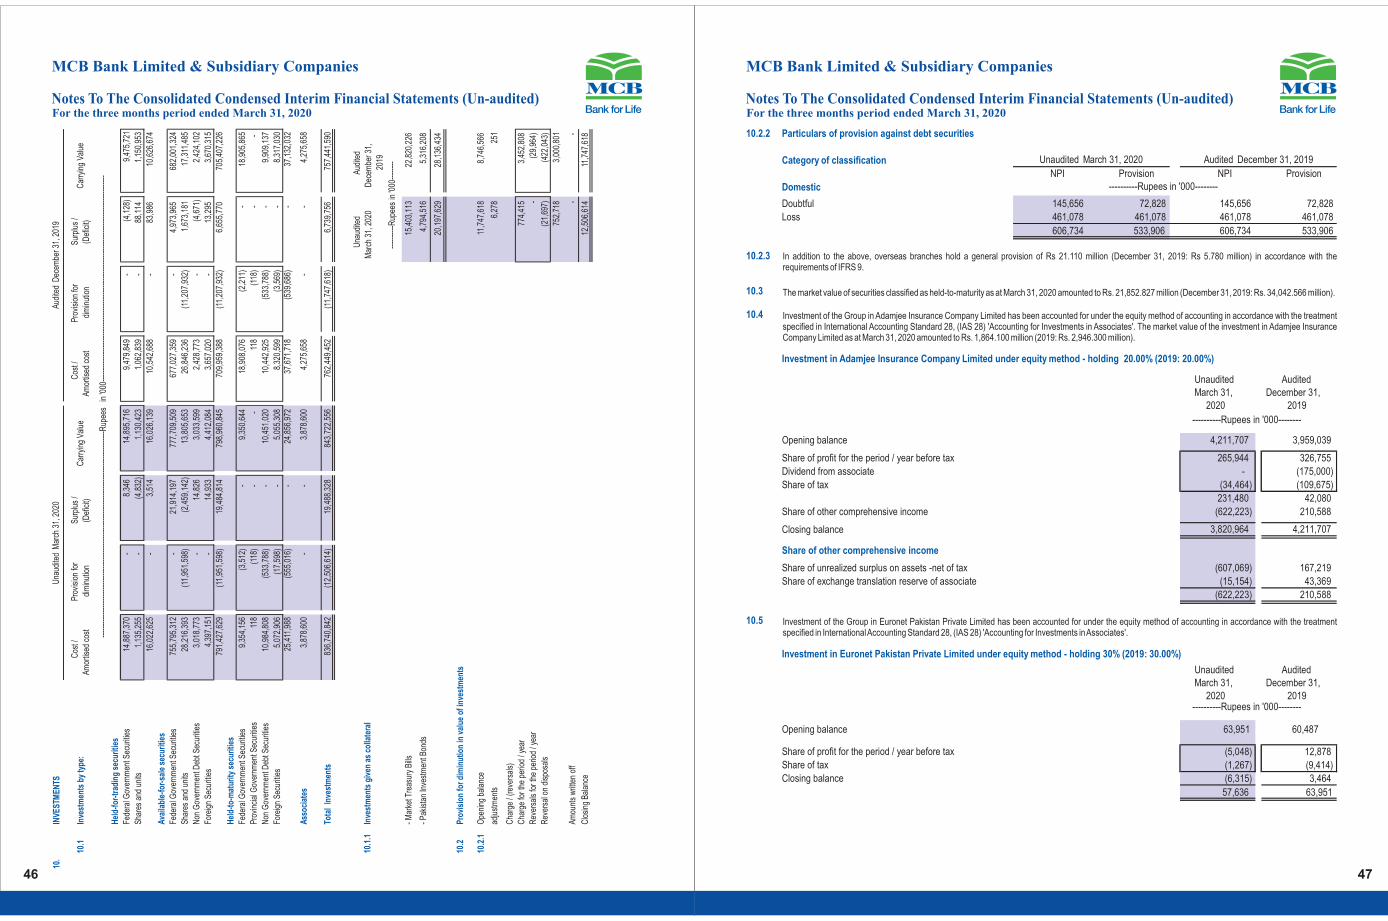
46 47
For the three months period ended March 31, 2020Notes To The Consolidated Condensed Interim Financial Statements (Un-audited)
For the three months period ended March 31, 2020Notes To The Consolidated Condensed Interim Financial Statements (Un-audited)
In addition to the above, overseas branches hold a general provision of Rs 21.110 million (December 31, 2019: Rs 5.780 million) in accordance with the requirements of IFRS 9.
10.2.3
The market value of securities classified as held-to-maturity as at March 31, 2020 amounted to Rs. 21,852.827 million (December 31, 2019: Rs. 34,042.566 million).
Investment of the Group in Adamjee Insurance Company Limited has been accounted for under the equity method of accounting in accordance with the treatment specified in International Accounting Standard 28, (IAS 28) 'Accounting for Investments in Associates'. The market value of the investment in Adamjee Insurance Company Limited as at March 31, 2020 amounted to Rs. 1,864.100 million (2019: Rs. 2,946.300 million).
10.3
10.4
Investment in Adamjee Insurance Company Limited under equity method - holding 20.00% (2019: 20.00%)
Unaudited March 31,
2020
Audited December 31,
2019
Opening balance 4,211,707 3,959,039
Share of profit for the period / year before tax 265,944 326,755 Dividend from associate - (175,000) Share of tax (34,464) (109,675)
231,480
42,080
Share of other comprehensive income (622,223) 210,588
Closing balance 3,820,964
4,211,707
Share of other comprehensive income
Share of unrealized surplus on assets -net of tax (607,069) 167,219
Share of exchange translation reserve of associate (15,154) 43,369
(622,223) 210,588
----------Rupees in '000--------
10.5
Unaudited March 31,
2020
Audited December 31,
2019
Opening balance 63,951 60,487
Share of profit for the period / year before tax (5,048)
12,878
Share of tax (1,267) (9,414)
Closing balance (6,315) 3,464
57,636 63,951
Investment in Euronet Pakistan Private Limited under equity method - holding 30% (2019: 30.00%)
----------Rupees in '000--------
Investment of the Group in Euronet Pakistan Private Limited has been accounted for under the equity method of accounting in accordance with the treatment specified in International Accounting Standard 28, (IAS 28) 'Accounting for Investments in Associates'.
10.2.2 Particulars of provision against debt securities
NPI Provision NPI Provision
Domestic
Doubtful 145,656
72,828
145,656
72,828
Loss 461,078
461,078
461,078
461,078
606,734
533,906
606,734
533,906
Unaudite d March 31, 2020 Audite d December 31, 2019
----------Rupees in '000--------
10.
INVE
STM
ENTS
10.1
Inve
stm
ents
by
type
:
Hel
d-fo
r-tr
adin
g se
curit
ies
Fede
ral G
over
nmen
t Sec
uriti
es14
,887
,370
-
8,
346
14,8
95,7
16
9,
479,
849
-
(4
,128
)9,
475,
721
Shar
es a
nd u
nits
1,13
5,25
5
-
(4
,832
)
1,13
0,42
3
1,
062,
839
-
88,1
141,
150,
953
16,0
22,6
25
-
3,
514
16,0
26,1
39
10,5
42,6
88
-
83
,986
10,6
26,6
74
Ava
ilabl
e-fo
r-sa
le s
ecur
ities
Fede
ral G
over
nmen
t Sec
uriti
es75
5,79
5,31
2
-
21
,914
,197
77
7,70
9,50
9
677,
027,
359
-
4,97
3,96
568
2,00
1,32
4
Shar
es a
nd u
nits
28,2
16,3
93
(11,
951,
598)
(2,4
59,1
42)
13
,805
,653
26
,846
,236
(1
1,20
7,93
2)
1,
673,
181
17,3
11,4
85
Non
Gov
ernm
ent D
ebt S
ecur
ities
3,01
8,77
3
-
14
,826
3,03
3,59
9
2,
428,
773
-
(4,6
71)
2,42
4,10
2
Fore
ign
Secu
ritie
s4,
397,
151
-
14
,933
4,41
2,08
4
3,
657,
020
-
13,2
953,
670,
315
791,
427,
629
(11,
951,
598)
19,4
84,8
14
798,
960,
845
70
9,95
9,38
8
(1
1,20
7,93
2)
6,
655,
770
705,
407,
226
Hel
d-to
-mat
urity
sec
uriti
es
Fede
ral G
over
nmen
t Sec
uriti
es9,
354,
156
(3
,512
)
-
9,35
0,64
4
18
,908
,076
(2
,211
)
-
18,9
05,8
65
Prov
inci
al G
over
nmen
t Sec
uriti
es11
8
(1
18)
-
-
11
8
(1
18)
-
-
Non
Gov
ernm
ent D
ebt S
ecur
ities
10,9
84,8
08
(533
,788
)
-
10,4
51,0
20
10,4
42,9
25
(533
,788
)
-9,
909,
137
Fore
ign
Secu
ritie
s5,
072,
906
(17,
598)
-
5,05
5,30
8
8,32
0,59
9
(3,5
69)
-8,
317,
030
25,4
11,9
88
(555
,016
)
-
24,8
56,9
72
37,6
71,7
18
(539
,686
)
-37
,132
,032
Ass
ocia
tes
3,87
8,60
0
-
-
3,87
8,60
0
4,27
5,65
8
-
-4,
275,
658
Tota
l In
vest
men
ts
836,
740,
842
(12,
506,
614)
19,4
88,3
28
843,
722,
556
76
2,44
9,45
2
(11,
747,
618)
6,73
9,75
675
7,44
1,59
0
10.1
.1In
vest
men
ts g
iven
as
colla
tera
l U
naud
ited
Mar
ch 3
1, 2
020
Aud
ited
Dec
embe
r 31,
2019
- Mar
ket T
reas
ury
Bills
15,4
03,1
1322
,820
,226
- Pak
ista
n In
vest
men
t Bon
ds4,
794,
516
5,31
6,20
8
20,1
97,6
2928
,136
,434
10.2
Prov
isio
n fo
r dim
inut
ion
in v
alue
of i
nves
tmen
ts
10.2
.1O
peni
ng b
alan
ce11
,747
,618
8,74
6,56
6
adju
stm
ents
6,27
825
1
Cha
rge
/ (re
vers
als)
Cha
rge
for t
he p
erio
d / y
ear
774,
415
3,45
2,80
8
Rev
ersa
ls fo
r the
per
iod
/ yea
r-
(29,
964)
Rev
ersa
l on
disp
osal
s(2
1,69
7)(4
22,0
43)
752,
718
3,00
0,80
1
Amou
nts
writ
ten
off
--
Clo
sing
Bal
ance
12,5
06,6
1411
,747
,618
----
----
--R
upee
s in
'000
----
----
----
----
----
----
----
----
----
----
----
----
----
----
----
----
----
----
----
----
----
----
----
----
--R
upee
s in
'000
----
----
----
----
----
----
----
----
----
----
----
----
----
----
----
----
----
----
----
----
----
----
--
Una
udite
d M
arch
31,
202
0Au
dite
d D
ecem
ber 3
1, 2
019
Prov
isio
n fo
r
dim
inut
ion
Sur
plus
/
(Def
icit)
C
arry
ing
Valu
eC
ost /
Amor
tised
cos
t
Sur
plus
/
(Def
icit)
C
arry
ing
Valu
eC
ost /
Amor
tised
cos
t
Prov
isio
n fo
r
dim
inut
ion
MCB Bank Limited & Subsidiary Companies MCB Bank Limited & Subsidiary Companies

48 49
For the three months period ended March 31, 2020Notes To The Consolidated Condensed Interim Financial Statements (Un-audited)
For the three months period ended March 31, 2020Notes To The Consolidated Condensed Interim Financial Statements (Un-audited)
11.3 Particulars of provision against advances
Specific General Total Specific General Total
Opening balance 41,937,761
1,461,011
43,398,772
41,944,267
1,292,113
43,236,380
Exchange adjustments 251,323
20,244
271,567
302,297
23,426
325,723
Charge for the period / year 313,392
289,248
602,640
3,359,542
174,710
3,534,252
Reversals (518,168)
-
(518,168)
(3,649,841)
(29,238)
(3,679,079)
(204,776)
289,248
84,472
(290,299)
145,472
(144,827)
Amounts written off (86,796)
-
(86,796)
(18,504)
-
(18,504)
Closing balance 41,897,512
1,770,503
43,668,015
41,937,761
1,461,011
43,398,772
11.3.1
11.3.2
Note
Unaudited March 31, 2020
Audited December 31,
2019
FIXED ASSETS
Capital work-in-progress 12.1 1,289,146 1,068,429 Property and equipment 52,221,741 52,466,540 Right-of-use assets 10,475,984
10,666,838
63,986,871
64,201,807
12.1 Capital work-in-progress
Civil works 723,306
476,799
Equipment 34,424
90,946
Advances to suppliers 426,442
491,968
Others 104,974
8,716
1,289,146
1,068,429
Three months ended March
31, 2020
Three months ended March
31, 2019
12.2
The following additions have been made to fixed assets during the period:
Capital work-in-progress 220,717
612,886
Property and equipment
Freehold land 5,488
403,179
Building on freehold land 9,585
324,666
Electrical office and computer equipment 184,027
238,423
Furniture and fixture 68,144
61,974
Leasehold Improvements 26,325
57,097
Vehicles 43,115 39,015
336,684 1,124,354
Total 557,401 1,737,240
Unaudite d March 31, 2020
----------Rupees in '000--------
Audite d December 31, 2019
----------Rupees in '000--------
------------------------------------Rup ees in '000-----------------------------------
State Bank of Pakistan vide BSD Circular No. 2 dated January 27, 2009, BSD Circular No. 10 dated October 20, 2009, BSD Circular No. 02 of 2010 dated June 03, 2010 and BSD Circular No.1 of 2011 dated October 21, 2011 has allowed benefit of forced sale value (FSV) of Plant & Machinery under charge, pledged stock and mortgaged residential, commercial & industrial properties (land and building only) held as collateral against NPLs for five years from the date of classification. The Bank (holding company) has not taken the FSV benefit in calculation of specific provision. However, one of the subsidiary of the Bank has availed benefit of forced sale values amounting to Rs.198.219 million (December 31, 2019: Rs.178.374 million) in determining the provisioning against non-performing Islamic financing and related assets as at March 31, 2020. The additional benefit on the Bank's statement of profit and loss arising from availing the FSV benefit - net of tax amounts to Rs 128.842 million as at March 31, 2020 (December 31, 2019: Rs 115.943 million). However, the additional impact on profitability arising from availing the benefit of forced sales value is not available for payment of cash or stock dividends to shareholders.
General provision against consumer loans represents provision maintained against fully secured performing portfolio and unsecured performing portfolio as required by the Prudential Regulations issued by the SBP. General provision against Small Enterprise Finance represents provision maintained at an amount equal to 1% of unsecured performing portfolio as required by the Prudential Regulations issued by the SBP. General provisions pertaining to overseas advances are made in accordance with the requirements of the regulatory authorities of the respective countries in which the overseas branches operate. General provision against all other advances represents provision maintained at around 0.1% of gross advances.
12.3
The net book value of fixed assets disposed off during the period is as follows:
Vehicles
Furniture and fixture
Electrical office and computer equipment
Leasehold ImprovementsTotal
5,404
601
1,313
2,4869,804
2,984
67
784
-3,835
12.
11.
AD
VA
NC
ES
Loan
s, c
ash
cred
its, r
unni
ng fi
nanc
es, e
tc.
454,
777,
971
471,
613,
945
49,2
69,8
12
48,7
59,1
57
504,
047,
783
520,
373,
102
Isla
mic
fina
ncin
g an
d re
late
d as
sets
59,3
57,9
71
50,9
65,2
43
471,
450
381,
427
59,8
29,4
21
51,3
46,6
70
Bill
s di
scou
nted
and
pur
chas
ed
20,4
06,6
78
19,4
86,7
58
665,
102
665,
102
21,0
71,7
80
20,1
51,8
60
Adv
ance
s -
gros
s53
4,54
2,62
0
542,
065,
946
50,4
06,3
64
49,8
05,6
86
584,
948,
984
591,
871,
632
Pro
visi
on a
gain
st a
dvan
ces
- S
peci
fic-
-
(41,
897,
512)
(41,
937,
761)
(41,
897,
512)
(41,
937,
761)
- G
ener
al(1
,770
,503
)
(1,4
61,0
11)
-
-
(1,7
70,5
03)
(1,4
61,0
11)
(1,7
70,5
03)
(1,4
61,0
11)
(41,
897,
512)
(41,
937,
761)
(43,
668,
015)
(43,
398,
772)
Adv
ance
s -
net o
f pro
visi
on53
2,77
2,11
7
540,
604,
935
8,50
8,85
2
7,86
7,92
5
541,
280,
969
548,
472,
860
Una
udite
d M
arch
31,
202
0A
udite
d D
ecem
ber
31, 2
019
11.1
Par
ticu
lars
of
adva
nce
s (G
ross
)In
loca
l cur
renc
y52
6,02
6,87
2
532,
760,
442
In fo
reig
n cu
rren
cies
58,9
22,1
12
59
,111
,190
584,
948,
984
59
1,87
1,63
2
11.2
\N
ote
Non
Per
form
ing
Loan
sP
rovi
sion
Non
Per
form
ing
Loan
sP
rovi
sion
Do
mes
tic
Oth
er A
sset
s E
spec
ially
Men
tione
d11
.2.1
201,
967
8,60
1
138,
432
3,52
9
Sub
stan
dard
707,
683
156,
462
591,
832
146,
872
Dou
btfu
l3,
224,
621
1,43
3,73
7
3,04
8,94
6
1,34
6,09
9
Loss
37,4
85,9
90
36,7
16,8
24
37,8
36,4
84
37,0
88,1
34
41
,620
,261
38,3
15,6
24
41,6
15,6
94
38,5
84,6
34
Ove
rsea
s
Not
pas
t due
but
impa
ired
-
-
-
-
O
verd
ue b
y:
Upt
o 90
day
s5,
721
3,55
0
10,6
88
7,40
0
91 to
180
day
s16
,938
8,10
3
118,
182
95,4
52
181
to 3
65 d
ays
118,
148
100,
206
141,
231
137,
601
˃ 3
65 d
ays
8,64
5,29
6
3,47
0,02
9
7,91
9,89
1
3,11
2,67
4
8,78
6,10
3
3,58
1,88
8
8,18
9,99
2
3,35
3,12
7
Tota
l50
,406
,364
41,8
97,5
12
49,8
05,6
86
41,9
37,7
61
11.2
.1
----
----
--R
upee
s in
'000
----
----
Adv
ance
s in
clud
e R
s. 5
0,40
6.36
4 m
illio
n (2
019:
Rs.
49,
805.
686
mill
ion)
whi
ch h
ave
been
pla
ced
unde
r th
e no
n-pe
rfor
min
g st
atus
as
deta
iled
belo
w:
----
----
----
----
----
----
----
----
----
Ru
pees
in '0
00--
----
----
----
----
----
----
----
----
-
Thi
sre
pres
ents
non-
perf
orm
ing
port
folio
ofag
ricul
tura
l,sm
all
ente
rpris
ean
dIn
fras
truc
ture
Pro
ject
Fin
anci
ngcl
assi
fied
asO
AE
Mas
per
the
requ
irem
ents
ofre
spec
tive
Pru
dent
ial
Reg
ulat
ions
issu
ed b
y th
e S
tate
Ban
k of
Pak
ista
n.
Una
udite
d M
arch
31,
202
0A
udite
d D
ecem
ber
31, 2
019
----
----
----
----
----
----
----
----
----
----
----
----
----
----
----
----
----
---R
upee
s in
'000
----
----
----
----
----
----
----
----
----
----
----
----
----
----
----
----
----
---
Per
form
ing
Non
Per
form
ing
Tota
l
Aud
ited
Dec
embe
r 31
, 201
9U
naud
ited
Mar
ch 3
1, 2
020
Aud
ited
Dec
embe
r 31
, 201
9U
naud
ited
Mar
ch 3
1, 2
020
Aud
ited
Dec
embe
r 31
, 201
9U
naud
ited
Mar
ch 3
1, 2
020
MCB Bank Limited & Subsidiary Companies MCB Bank Limited & Subsidiary Companies
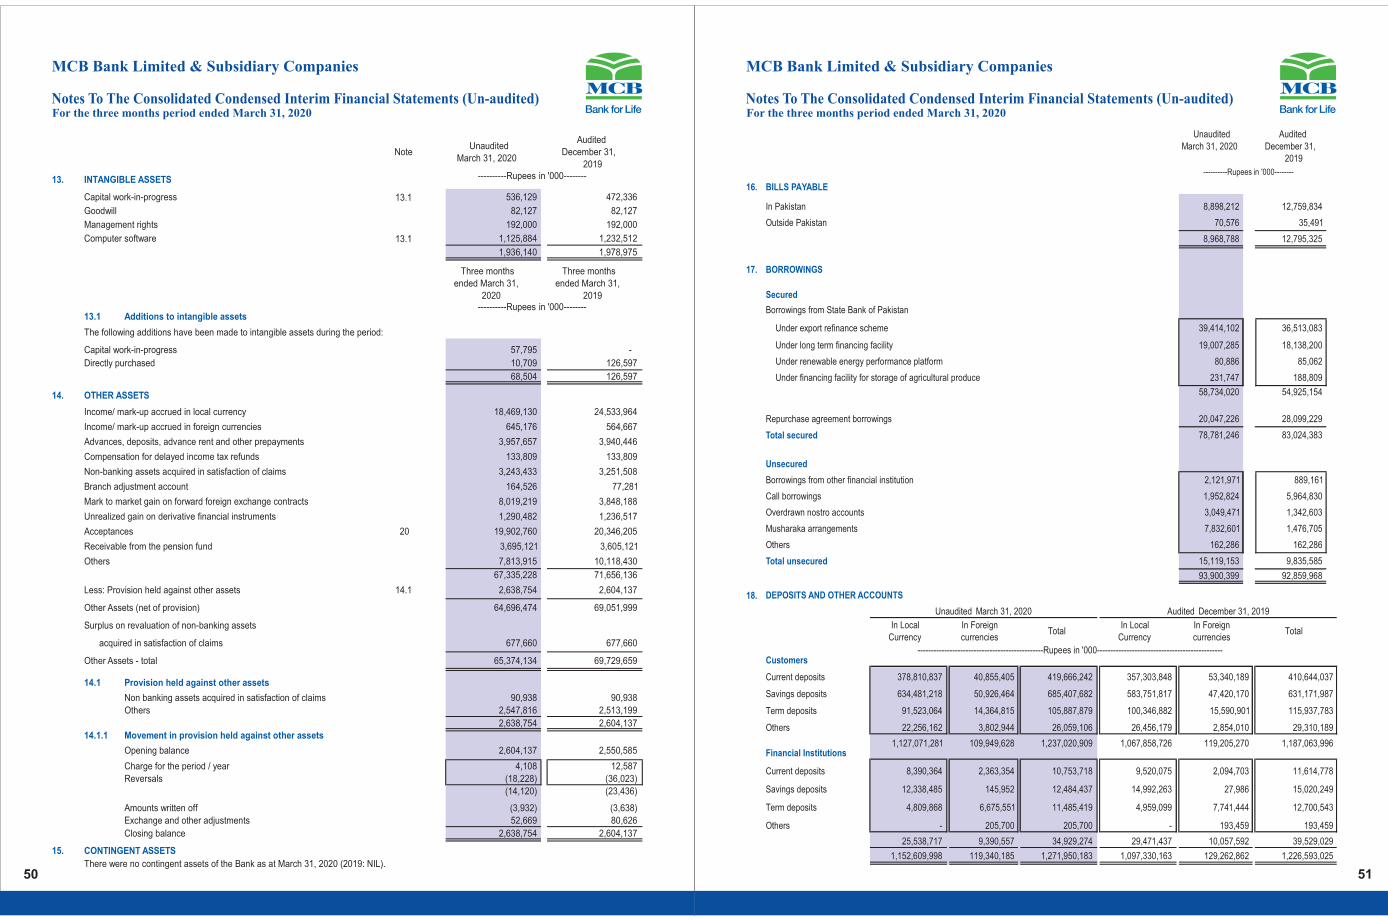
50 51
For the three months period ended March 31, 2020Notes To The Consolidated Condensed Interim Financial Statements (Un-audited)
For the three months period ended March 31, 2020Notes To The Consolidated Condensed Interim Financial Statements (Un-audited)
Unaudited March 31, 2020
Audited December 31,
2019
16. BILLS PAYABLE
In Pakistan 8,898,212
12,759,834
Outside Pakistan 70,576
35,491
8,968,788 12,795,325
17. BORROWINGS
Secured
Borrowings from State Bank of Pakistan
Under export refinance scheme 39,414,102
36,513,083
Under long term financing facility 19,007,285
18,138,200
Under renewable energy performance platform 80,886
85,062
Under financing facility for storage of agricultural produce 231,747
188,809
58,734,020
54,925,154
Repurchase agreement borrowings 20,047,226
28,099,229
Total secured 78,781,246
83,024,383
Unsecured
Borrowings from other financial institution 2,121,971
889,161
Call borrowings 1,952,824 5,964,830
Overdrawn nostro accounts 3,049,471 1,342,603
Musharaka arrangements 7,832,601 1,476,705 Others 162,286
162,286
Total unsecured 15,119,153
9,835,585
93,900,399
92,859,968
18. DEPOSITS AND OTHER ACCOUNTS
In Local Currency
In Foreign currencies
TotalIn Local
CurrencyIn Foreign currencies
Total
Customers
Current deposits 378,810,837
40,855,405
419,666,242
357,303,848
53,340,189
410,644,037
Savings deposits 634,481,218
50,926,464
685,407,682
583,751,817
47,420,170
631,171,987
Term deposits 91,523,064
14,364,815
105,887,879
100,346,882
15,590,901
115,937,783
Others 22,256,162
3,802,944
26,059,106
26,456,179
2,854,010
29,310,189
1,127,071,281
109,949,628
1,237,020,909
1,067,858,726
119,205,270
1,187,063,996
Financial Institutions
Current deposits 8,390,364
2,363,354
10,753,718
9,520,075
2,094,703
11,614,778
Savings deposits 12,338,485
145,952
12,484,437
14,992,263
27,986
15,020,249
Term deposits 4,809,868 6,675,551 11,485,419 4,959,099 7,741,444 12,700,543
Others - 205,700 205,700 - 193,459 193,459
25,538,717 9,390,557 34,929,274 29,471,437 10,057,592 39,529,029
1,152,609,998 119,340,185 1,271,950,183 1,097,330,163 129,262,862 1,226,593,025
----------Rupees in '000--------
Unaudite d March 31, 2020 Audite d December 31, 2019
-----------------------------------------------Rupees in '000-----------------------------------------------
NoteUnaudited
March 31, 2020
Audited
December 31,
2019
13. INTANGIBLE ASSETS
Capital work-in-progress 13.1 536,129 472,336
Goodwill 82,127 82,127
Management rights 192,000 192,000
Computer software 13.1 1,125,884
1,232,512
1,936,140 1,978,975
Three months
ended March 31,
2020
Three months
ended March 31,
2019
13.1 Additions to intangible assets
The following additions have been made to intangible assets during the period:
Capital work-in-progress 57,795
-
Directly purchased 10,709
126,597 68,504
126,597
14. OTHER ASSETS
Income/ mark-up accrued in local currency 18,469,130
24,533,964
Income/ mark-up accrued in foreign currencies 645,176
564,667
Advances, deposits, advance rent and other prepayments 3,957,657
3,940,446
Compensation for delayed income tax refunds 133,809
133,809
Non-banking assets acquired in satisfaction of claims 3,243,433
3,251,508
Branch adjustment account 164,526
77,281
Mark to market gain on forward foreign exchange contracts 8,019,219
3,848,188
Unrealized gain on derivative financial instruments 1,290,482
1,236,517
Acceptances 20 19,902,760
20,346,205
Receivable from the pension fund 3,695,121
3,605,121
Others 7,813,915
10,118,430
67,335,228
71,656,136
Less: Provision held against other assets 14.1 2,638,754
2,604,137
Other Assets (net of provision) 64,696,474
69,051,999
Surplus on revaluation of non-banking assets
acquired in satisfaction of claims 677,660
677,660
Other Assets - total 65,374,134
69,729,659
14.1 Provision held against other assets
Non banking assets acquired in satisfaction of claims 90,938
90,938
Others 2,547,816
2,513,199
2,638,754
2,604,137
14.1.1 Movement in provision held against other assets
Opening balance 2,604,137
2,550,585
Charge for the period / year 4,108
12,587
Reversals (18,228)
(36,023)
(14,120)
(23,436)
Amounts written off (3,932)
(3,638)
Exchange and other adjustments 52,669 80,626
Closing balance 2,638,754 2,604,137
15. CONTINGENT ASSETS
There were no contingent assets of the Bank as at March 31, 2020 (2019: NIL).
----------Rupees in '000--------
----------Rupees in '000--------
MCB Bank Limited & Subsidiary Companies MCB Bank Limited & Subsidiary Companies

52 53
NoteUnaudited
March 31, 2020
Audited December 31,
2019
22. SURPLUS ON REVALUATION OF ASSETS
Surplus / (deficit) on revaluation of
- Available for sale securities 10.1 19,484,814
6,655,770
- Fixed Assets 20,996,230
21,031,256
- Non-banking assets acquired in satisfaction of claims 677,657
677,660
- Associated undertaking 4,177
611,247
41,162,878
28,975,933
Deferred tax on surplus / (deficit) on revaluation of:
- Available for sale securities 6,819,685
2,329,519
- Fixed Assets 1,378,282
1,390,542
- Non-banking assets acquired in satisfaction of claims 237,181
237,181
- Associated undertaking 48,707
266,485
8,483,855
4,223,727
32,679,023
24,752,206
23. CONTINGENCIES AND COMMITMENTS
-Guarantees 23.1 188,318,894
180,002,174
-Commitments 23.2 479,400,188
657,101,777
-Other contingent liabilities 23.3 30,018,405
28,352,091
697,737,487
865,456,042
23.1 Guarantees:
Financial guarantees 148,895,852
141,181,839
Performance guarantees 34,876,628 33,833,099 Other guarantees 4,546,414 4,987,236
188,318,894 180,002,174 23.2 Commitments:
Documentary credits and short-term trade-related transactions
- letters of credit 157,708,336
153,036,304
Commitments in respect of:
- forward foreign exchange contracts 23.2.1 302,069,299
404,891,089
- forward government securities transactions 23.2.2 8,740,729
87,696,638
- derivatives 23.2.3 9,545,292
10,244,806
- commitments to extent credit 382,296
307,755
Commitments for acquisition of:
- operating fixed assets 900,182
859,953
- intangible assets 54,054
65,232
479,400,188
657,101,777
23.2.1 Commitments in respect of forward foreign exchange contracts
Purchase 163,575,051
216,647,656
Sale 138,494,248
188,243,433
302,069,299
404,891,089
23.2.2 Commitments in respect of forward government securities transactions
Purchase 8,740,729
82,284,304
Sale -
5,412,334
8,740,729
87,696,638
23.2.3 Commitments in respect of derivatives
FX options (notional)
Purchase 751,950
431,449
Sale 751,950
431,449
1,503,900
862,898
Cross Currency Swaps (notional)
Purchase 3,758,405
4,428,663
Sale 3,966,487 4,636,745
7,724,892 9,065,408
Interest Rate Swaps (notional)
Purchase 316,500 316,500
9,545,292 10,244,806
----------Rupees in '000--------
NoteUnaudited
March 31, 2020
Audited December 31,
201919. DEFERRED TAX LIABILITIES
Taxable Temporary Differences on
- Surplus on revaluation of fixed assets 1,378,282
1,390,542
- Surplus on revaluation of Non-banking assets 237,181
237,181
- Accelerated tax depreciation 1,956,060
1,961,113
- Receivable from pension fund 1,293,292
1,261,793
- Business combination 705,218
705,218
- Investments in associated undertaking 1,110,580
1,247,340
- Surplus on revaluation of investments 6,819,685
2,329,519
13,500,298
9,132,706
Deductible Temporary Differences on
- Tax losses carried forward (919,516)
(949,800)
- Provision against advances (1,765,223)
(1,726,151)
- Others (284,442)
(242,532)
(2,969,181)
(2,918,483)
10,531,117
6,214,223
20. OTHER LIABILITIES
Mark-up/ return/ interest payable in local currency 15,957,416
23,511,019
Mark-up/ return/ interest payable in foreign currencies 496,372 664,130 Unearned commission and income on bills discounted 295,282 252,842 Accrued expenses 5,028,156 6,310,392 Provision for taxation (provisions less payments) 7,351,687 6,045,948 Workers' welfare fund 8,091,005
7,873,706
Acceptances 14 19,902,760
20,346,205
Unclaimed / dividends payable 1,736,075
1,605,123 Mark to market loss on forward foreign exchange contracts 6,692,449
4,638,011
Unrealised loss on derivative financial instruments 1,307,556
1,232,806
Staff welfare fund 4,772
5,727
Provision for employees' compensated absences 967,195
939,495
Provision for post retirement medical benefits 1,955,709
1,921,348
Provision for employees' contributory benevolent scheme 223,961
221,193
Retention money 20,657
20,657
Insurance payable against consumer assets 702,083
655,146
Unclaimed balances 879,833
993,105
Duties and taxes payable 1,171,028
775,694
Charity fund balance 61,042
54,782
Provision against off-balance sheet obligations 46,342
46,581
Security deposits against lease 1,485,219
1,497,296
Lease liability against right of use assets 11,515,694
11,436,633
Others 7,766,969
11,357,674
93,659,262
102,405,513
21. RESERVES
Share premium 23,973,024
23,973,024
Non- distributable capital reserve - gain on bargain purchase option 21.1 908,317
908,317
Exchange translation reserve 3,343,275
2,730,354
Statutory reserve 21.2 32,335,037 31,683,134General reserve 18,600,000 18,600,000
79,159,653 77,894,829
21.1
----------Rupees in '000--------
Under IFRS-3 a bargain purchase represents an economic gain which should be immediately recognized by the acquirer as income. However, the amount of bargain purchase gain was not been taken to the profit and loss account as the SBP, through its letter BPRD(R&PD)/2017/14330 dated June 13, 2017 recommended that the amount of gain may be routed directly into equity as a Non-distributable Capital Reserve (NCR). The NCR may become available for distribution through a stock dividend only with prior approval of the SBP. The Bank, before distribution of the gain as a stock dividend, may adjust any subsequent provisions/deficit, assessed by the Bank or recommended by the Banking Inspection Department of SBP, in the acquired assets and liabilities of NIB Bank Limited against the NCR.
Statutory reserve represents amount set aside as per the requirements of section 21 of the Banking Companies Ordinance, 1962.21.2
For the three months period ended March 31, 2020Notes To The Consolidated Condensed Interim Financial Statements (Un-audited)
For the three months period ended March 31, 2020Notes To The Consolidated Condensed Interim Financial Statements (Un-audited)
MCB Bank Limited & Subsidiary Companies MCB Bank Limited & Subsidiary Companies

54 55
Rent on property 6,260 11,451
Gain on sale of fixed assets and non-banking assets acquired-net 17,386 21,247
23,646 32,698
29. OTHER INCOME
Federal Government Securities 75,684
13,037
Shares (91,874) 21,282
Others 6,422 -
(9,768) 34,319
Realised 28.1 (9,768)
34,319
Unrealised - held for trading 10.1 3,514
(19,691)
(6,254) 14,628
28.1 Realised (loss) / gain on:
28. GAIN ON SECURITIES, NET
Branch banking customer fees 488,874
528,879
Consumer finance related fees 96,298
75,240
Card related fees (debit and credit cards) 834,841
739,330
Credit related fees 8,464 60,433
Investment banking fee 37,050 24,297
Commission on trade 363,622 357,852 Commission on guarantees 147,499 190,016 Commission on cash management 158,431 150,761 Commission on remittances including home remittances 284,664
260,149
Commission income - Bancassurance 378,226
349,241
Rent on lockers 58,812
66,494
Commission on utility bills 20,416
24,943
Commission on investments services 201,558
194,105
Other Commission 46,773
42,075
3,125,528 3,063,815
27. FEE & COMMISSION INCOME
Deposits 21,069,430 13,534,980
Borrowings 2,249,920
980,091
Subordinated debt -
112,000
Cost of foreign currency swaps against foreign currency deposits / borrowings 676,067
370,345
Unwinding cost of liability against right-of-use assets 375,369
-
24,370,786
14,997,416
26. MARK-UP/RETURN/INTEREST EXPENSED
16,130,253
25,118,811
257,059
150,445
41,656,568
14,044,114
13,948,971
1,217,265
125,758
29,336,108
Note
Three months ended March 31,
2020
Three months ended March 31,
2019
----------Rupees in '000--------
25. MARK-UP/RETURN/INTEREST EARNED
Loans and advances
Investments
Lendings to financial institutions
Balances with banks
23.2.4
NoteUnaudited
March 31, 2020
Audited December 31,
2019
23.3 Other contingent liabilities
Claims against the Bank not acknowledged as debts 23.3.1 30,018,405
28,352,091
23.3.1
23.4 Taxation
24. DERIVATIVE INSTRUMENTS
Notional Notional Notional
Principal Principal Principal
Total
Hedging 3,758,405
1,260,702
316,500
6,536
751,950
23,244
Market Making 3,966,487
(1,284,312)
-
-
751,950
(23,244)
Total
Hedging 4,428,663 1,218,634 316,500 11,510 431,449 2,683Market Making 4,636,745 (1,226,433) - - 431,449 (2,683)
-------------------------------------------Rupees in '000-------------------------------------------
Audite d December 31, 2019
-------------------------------------------Rupees in '000-------------------------------------------
Unaudite d March 31, 2020
Interest Rate Swaps FX Options Cross Currency Swaps
Mark to market gain / loss
Mark to market gain / loss
Mark to market gain / loss
----------Rupees in '000--------
The Group makes commitments to extend credit in the normal course of its business but these being revocable commitments do not attract any significant penalty or expense if the facility is unilaterally withdrawn.
These represent certain claims by third parties against the Group, which are being contested in the Courts of law. The management is of the view that these relate to the normal course of business and the possibility of an outflow of economic resources is remote.
For assessment year 1988-89 through tax year 2018, the tax department disputed Bank's treatment on certain issues, where the Bank's appeals are pending at various appellate forums, entailing an additional tax liability of Rs. 1,487 million (2019: Rs. 1,487 million). Such issues inter alia principally include disallowance of expenses for non deduction of withholding tax and non availability of underlying records, provision for non performing loans, attribution of expenses to heads of income other than income from business and disallowance of credit for taxes paid in advance / deducted at source.
The Bank has filed appeals which are pending at various appellate forums. In addition, certain decisions made in favour of the Bank are being contested by the department at higher forums. No provision has been made in the financial statements regarding the aforesaid additional tax demand and already issued favourable decisions where the department is in appeal, as the management is of the view that the issues will be decided in the Bank's favour as and when these are taken up by the Appellate Authorities.
For the three months period ended March 31, 2020Notes To The Consolidated Condensed Interim Financial Statements (Un-audited)
For the three months period ended March 31, 2020Notes To The Consolidated Condensed Interim Financial Statements (Un-audited)
MCB Bank Limited & Subsidiary Companies MCB Bank Limited & Subsidiary Companies

56 57
34. BASIC AND DILUTED EARNINGS PER SHARE
Profit after tax attributable to equity shareholders
Weighted average number of ordinary shares
Basic and diluted earnings per share
Current
Prior years
Deferred
Share of tax of associates
33. TAXATION
(Reversals) / provisions against balance with Banks
Provisions / (reversals) for diminution in value of investments
Reversals against loans & advances
Reversals against other assets
Recovery of written off / charged off bad debts
32. PROVISIONS / (REVERSALS) & WRITE OFFS - NET
Penalties of State Bank of Pakistan
VAT & National Building tax & Crop Insurance Levy
31. OTHER CHARGES
NoteThree months
ended March 31, 2020
Three months ended March 31,
2019
----------Rupees in '000--------
10.2.1
11.3
14.1.1
6,623,914
4,986,133
1,185,060,006
1,185,060,006
5.59 4.21
----------Rupees in '000--------
----------Number--------
----------Rupees-------
4,431,215
3,186,920 -
450,668
38,986
353,717
35,731
43,267
4,505,932
4,034,572
(2,160)
6,783
752,718
(63,154)
84,472
(331,962)
(14,120) (11,765)
(41,254) (48,072) 779,656 (448,170)
182,878 814
26,435 45,458
209,313
46,272
Three months ended March 31,
2020
Three months ended March 31,
2019
4,593,058
4,239,093
46,765
600,701
13,665
14,267
260,515
295,936
100,692
119,421
357,732
458,910
187,997
282,873
422,219
-
199,871
170,173
1,589,456
1,942,281
301,122
246,489
105,167
106,612
161,881
131,858
109,581
86,441
178,385
188,158
1,505
1,470
857,641 761,028
13,879 10,126 99,839 109,163
216,014
225,387
82,392
101,952 51,241
41,222
221,425
244,013
8,074
12,062
9,074
16,929
74,219
71,227
85,265
92,740
161,217
198,707
166,065
206,653
5,000
-
10,287
11,260
183,901
184,791
100,635
202,302
13,768
2,846
62,881
75,958
48,527
40,795
15,993
13,784
225,705
185,723
34,725
38,776
387,365 363,892
30. OPERATING EXPENSES
Total compensation expense
Property expense
Rent and taxes
Insurance
Utilities cost
Fuel expense generators
Security (including guards)
Repair and maintenance (including janitorial charges)
Depreciation on right-of-use assets
Depreciation
Information technology expenses
Software maintenance
Hardware maintenance
Depreciation
Amortisation
Network charges
Insurance
Other operating expenses
Directors' fees and allowances
Legal and professional charges
Outsourced services costs
Travelling and conveyance
NIFT clearing charges
Depreciation
Depreciation on non-banking assets acquired in satisfaction of claims
Training and development
Postage and courier charges
Communication
Stationery and printing
Marketing, advertisement & publicity
Donations
Auditors' remuneration
Cash transportation charges
Repair and maintenance
Subscription
Entertainment
Remittance charges
Brokerage expenses
Card related expenses
CNIC verification charges
Insurance
Others 74,050 68,509
2,351,541 2,518,817
9,391,696 9,461,219
----------Rupees in '000--------
For the three months period ended March 31, 2020Notes To The Consolidated Condensed Interim Financial Statements (Un-audited)
For the three months period ended March 31, 2020Notes To The Consolidated Condensed Interim Financial Statements (Un-audited)
MCB Bank Limited & Subsidiary Companies MCB Bank Limited & Subsidiary Companies

58 59
The table below analyses the financial and non-financial assets carried at fair values, by valuation methods. For financial assets, the Group essentially carries its investments in debt and equity securities at fair values. Valuation of investments is carried out as per guidelines specified by the SBP. In case of non-financial assets, the Group has adopted revaluation model (as per IAS 16) in respect of land and building.
Unaudite d March 31, 2020
Carrying value Level 1 Level 2 Level 3 Total
Financial assets - measured at fair value
Investments
Federal Government Securities 792,605,225
-
792,605,225
-
792,605,225
Shares 13,548,826
13,548,826
-
-
13,548,826
Non-Government Debt Securities 2,681,666
2,681,666
-
2,681,666
Foreign Securities 4,412,084
-
4,412,084
-
4,412,084
Financial assets - disclosed but not measured at fair value
30,474,755
-
-
-
-
Cash and balances with treasury banks 112,366,406
-
-
-
-
Balances with other banks 20,779,308
-
-
-
-
Lendings to financial institutions 10,122,544
-
-
-
-
Advances 541,280,969
-
-
-
-
Other assets 53,592,866
-
-
-
-
Non - Financial Assets measured at fair value
Operating fixed assets (land and buildings) 43,430,687
-
43,430,687
-
43,430,687
Non-banking assets 3,921,093
-
3,921,093
-
3,921,093
Forward purchase of foreign exchange 163,575,051 - 7,996,200 - 7,996,200
Forward sale of foreign exchange 138,494,248 - 6,669,430 - 6,669,430
Derivatives purchase 4,826,855 - 1,290,482 - 1,290,482 Derivatives sale 4,718,437 - 1,307,556 - 1,307,556
Audite d December 31, 2019
Carrying value Level 1 Level 2 Level 3 Total
Financial assets - measured at fair value
Investments
Federal Government Securities 691,477,045
-
691,477,045
-
691,477,045
Shares 17,075,189
17,075,189
-
-
17,075,189
Non-Government Debt Securities 2,424,102 2,424,102 - 2,424,102
Foreign Securities 3,663,065
-
3,663,065
-
3,663,065
Financial assets - disclosed but not measured at fair value
-
Investments (HTM, unlisted ordinary shares,and associates) 42,802,189
-
-
-
-
Cash and balances with treasury banks 142,957,358
-
-
-
-
Balances with other banks 21,371,753
-
-
-
-
Lendings to financial institutions 6,060,869
- - - -
Advances 548,472,860
-
-
-
-
Other assets 58,219,618
-
-
-
-
Non - Financial Assets measured at fair value
Operating fixed assets (land and buildings) 44,882,204
-
44,882,204
-
44,882,204
Non-banking assets 3,838,230
-
3,838,230
-
3,838,230
-
-
-
Forward purchase of foreign exchange 216,647,656 - 4,142,227 - 4,142,227
Forward sale of foreign exchange 188,243,433 - 3,352,404 - 3,352,404-
Derivatives purchase 5,176,612 - 1,232,827 - 1,232,827
Derivatives sale 5,068,194 - 1,229,116 - 1,229,116
------------------------------------------Rupees in '000--------------------------------------
Investments (HTM, unlisted ordinary shares, subsidiaries and associates)
------------------------------------------Rupees in '000--------------------------------------
35. FAIR VALUE MEASUREMENTS
35.1
Level 1:
Level 2:
Level 3:
(a) Financial instruments in level 1
(b) Financial instruments in level 2
(c) Financial instruments in level 3
Term Finance and Bonds
Item
The fair values of Federal Government securities are determined using the PKRV rates.
Valuation approach and input used
Federal Government securities
Financial instruments included in level 1 comprise of investments in listed ordinary shares and units of mutual funds.
Currently, no financial instruments are classified in level 3.
Foreign exchange contracts
Derivatives
Operating fixed assets (land and building) & NBA
The fair value of traded investments is based on quoted market prices, except for tradable securities classified by the Goup as 'held to maturity'. Quoted securities classified as held to maturity are carried at amortised cost. Fair value of unquoted equity investments is determined on the basis of break up value of these investments as per the latest available financial statements.
Fair value of fixed term loans, other assets, other liabilities, fixed term deposits and borrowings cannot be calculated with sufficient reliability due to absence of current and active market for such assets and liabilities and reliable data regarding market rates for similar instruments.
In the opinion of the management, the fair value of the financial assets and financial liabilities are not significantly different from their carrying values since assets and liabilities are either short-term in nature or re-priced over short term.
The Group measures fair values using the following fair value hierarchy that reflects the significance of the inputs used in making the measurements:
Fair value measurements using quoted prices (unadjusted) in active markets for identical assets or liabilities.
Fair value measurements using inputs other than quoted prices included within Level 1 that are observable for the assets or liability, either directly (i.e. as prices) or indirectly (i.e. derived from prices).
Fair value measurements using input for the asset or liability that are not based on observable market data (i.e. unobservable inputs).
Investments in debt securities (comprising term finance certificates, bonds and any other security issued by a company or a body corporate for the purpose of raising funds in the form of redeemable capital) are valued on the basis of the rates announced by the Mutual Funds Association of Pakistan (MUFAP) in accordance with the methodology prescribed by the Securities and Exchange Commission of Pakistan.
The valuation has been determined by interpolating the mid rates announced by the State Bank of Pakistan.
The fair values of derivatives which are not quoted in active markets are determined by using valuation techniques. The valuation techniques take into account the relevant underlying parameters including foreign currency involved, interest rates, yield curves, volatilities, contracts duration etc.
Land and buildings are revalued every three years using professional valuers on the panel of Pakistan Banker's Association. The valuation is based on their assessment of market value of the properties.
The Group's policy is to recognise transfers into and out of the different fair value hierarchy levels at the date the event or change in circumstances that caused the transfer occurred. There were no transfers between levels 1 and 2 during the year.
Financial instruments included in level 2 comprise of Sukuk Bonds, Pakistan Investment Bonds, Market Treasury Bills, Term Finance certificates, FX options, Cross Currency Swaps, Interest Rate Swaps and Forward Exchange Contracts.
For the three months period ended March 31, 2020Notes To The Consolidated Condensed Interim Financial Statements (Un-audited)
For the three months period ended March 31, 2020Notes To The Consolidated Condensed Interim Financial Statements (Un-audited)
MCB Bank Limited & Subsidiary Companies MCB Bank Limited & Subsidiary Companies

60 61
Reta
il Ban
king
Cons
umer
bank
ing
Corp
orat
e
Bank
ingTr
easu
ryIn
tern
atio
nal
Bank
ingIs
lam
ic Ba
nking
Asse
t
Man
agem
ent
othe
rsSu
b-to
tal
Elim
inatio
nsTo
tal
Net m
ark-
up/re
turn
/pro
fit
(9,3
24,6
48)
89
1,24
7
7,90
2,58
9
13
,589
,574
41
9,99
2
840,
036
132
19
,770
14
,338
,692
-
14
,338
,692
Inte
r seg
men
t rev
enue
- ne
t 19
,469
,256
(5
52,0
62)
(6,7
04,4
19)
(1
4,44
6,65
2)
(1
0,58
0)
-
-
2,24
4,45
7
-
-
-
Non
mar
k-up
/ re
turn
/ in
tere
st in
com
e1,
573,
510
484,
013
75
5,41
8
417,
557
20
7,54
6
69,8
05
218,
065
222,
506
3,94
8,42
0
-
3,94
8,42
0
Tota
l Inc
ome
11,7
18,1
18
823,
198
1,
953,
588
(439
,521
)
61
6,95
8
909,
841
218,
197
2,48
6,73
3
18,2
87,1
12
-
18,2
87,1
12
Segm
ent d
irect
exp
ense
s5,
761,
326
364,
019
21
3,23
2
107,
242
27
1,18
6
1,14
0,05
0
148,
524
1,68
4,90
9
9,69
0,48
8
-
9,69
0,48
8
Inte
r seg
men
t exp
ense
allo
catio
n-
-
-
-
-
-
-
-
-
-
-
Tota
l exp
ense
s5,
761,
326
364,
019
21
3,23
2
107,
242
27
1,18
6
1,14
0,05
0
148,
524
1,68
4,90
9
9,69
0,48
8
-
9,69
0,48
8
Prov
ision
s12
,804
(1
5,60
0)
(173
,488
)
(2
5,61
9)
32,8
44
37,4
97
(316
,608
)
(448
,170
)
-
(4
48,1
70)
Prof
it be
fore
tax
5,94
3,98
8
47
4,77
9
1,91
3,84
4
(5
21,1
44)
312,
928
(2
67,7
06)
69
,673
1,11
8,43
2
9,04
4,79
4
-
9,04
4,79
4
Bala
nce
Shee
t
Cash
& B
ank
bala
nces
50,1
54,9
42
21,4
83
676,
139
65
,572
,277
28
,149
,362
19
,075
,532
28
,347
651,
029
164,
329,
111
-
164,
329,
111
Inve
stm
ents
-
-
10
,638
,292
71
0,59
3,71
0
15
,011
,692
16
,309
,796
1,
055,
226
3,83
2,87
4
757,
441,
590
-
757,
441,
590
Net i
nter
seg
men
t len
ding
940,
015,
023
-
-
-
-
-
164,
180,
279
1,10
4,19
5,30
2
(1
,104
,195
,302
) -
Lend
ings
to fi
nanc
ial in
stitu
tions
-
-
-
-
209,
206
5,
851,
663
-
-
6,
060,
869
-
6,
060,
869
Adva
nces
- pe
rform
ing98
,464
,054
24
,342
,756
34
1,19
1,28
7
-
25,1
90,9
39
50,9
31,8
80
5,16
9
478,
850
540,
604,
935
-
540,
604,
935
- non
per
form
ing1,
074,
787
113,
148
1,
237,
494
-
4,83
6,86
5
37
8,08
7
-
227,
544
7,86
7,92
5
-
7,86
7,92
5
Oth
ers
34,7
59,9
67
1,88
2,25
9
25
,393
,004
13
,804
,785
2,
368,
787
11,5
38,1
84
1,06
0,49
6
45,1
02,9
59
135,
910,
441
-
135,
910,
441
Tota
l Ass
ets
1,12
4,46
8,77
3
26,3
59,6
46
379,
136,
216
78
9,97
0,77
2
75
,766
,851
10
4,08
5,14
2
2,
149,
238
21
4,47
3,53
5
2,71
6,41
0,17
3
(1
,104
,195
,302
)
1,61
2,21
4,87
1
Borro
wing
s 45
,355
,966
-
7,
057,
504
32,2
70,4
71
3,52
0,22
2
4,
127,
525
-
52
8,28
0
92
,859
,968
-
92
,859
,968
Depo
sits
& ot
her a
ccou
nts
1,03
3,79
0,83
8
-
55,4
25,0
48
-
55,5
23,6
28
81,8
53,5
11
-
-
1,22
6,59
3,02
5
-
1,
226,
593,
025
Net i
nter
seg
men
t bor
rowi
ng-
24
,124
,908
29
9,65
0,83
8
755,
967,
249
12,4
64,7
22
10,4
66,8
01
1,52
0,78
4
-
1,
104,
195,
302
(1,1
04,1
95,3
02)
-
Oth
ers
45,3
21,9
69
2,23
4,73
8
17
,002
,826
1,
733,
052
4,25
8,27
9
7,
637,
305
62
8,45
4
42
,598
,438
12
1,41
5,06
1
-
12
1,41
5,06
1
Tota
l lia
bilit
ies
1,12
4,46
8,77
3
26,3
59,6
46
379,
136,
216
78
9,97
0,77
2
75
,766
,851
10
4,08
5,14
2
2,
149,
238
43
,126
,718
2,
545,
063,
356
(1,1
04,1
95,3
02)
1,
440,
868,
054
Equi
ty-
-
-
-
-
-
-
17
1,34
6,81
7
171,
346,
817
-
171,
346,
817
Tota
l Equ
ity &
liab
ilitie
s1,
124,
468,
773
26
,359
,646
37
9,13
6,21
6
789,
970,
772
75,7
66,8
51
104,
085,
142
2,14
9,23
8
214,
473,
535
2,
716,
410,
173
(1,1
04,1
95,3
02)
1,
612,
214,
871
Cont
inge
ncie
s &
Com
mitm
ents
48,9
73,3
61-
262,
455,
692
496,
556,
621
14,0
15,5
8618
,397
,458
-25
,057
,324
865,
456,
042
-86
5,45
6,04
2
36.2
Audi
te d
Dec
embe
r 31,
201
9
Tran
sact
ions
betw
een
repo
rtabl
ese
gmen
tsar
eba
sed
onan
appr
opria
tetra
nsfe
rpr
icing
mec
hani
smus
ing
agre
edra
tes.
Furth
erm
ore,
segm
ent
asse
tsan
dlia
biliti
esin
clude
inte
rse
gmen
tba
lanc
es.
Cost
swh
ich a
re n
ot a
lloca
ted
to s
egm
ents
are
inclu
ded
in th
e He
ad o
ffice
. In
com
e ta
xes
are
man
aged
at b
ank
leve
l and
are
not
allo
cate
d to
ope
ratin
g se
gmen
ts.
Un a
udite
d th
ree
mon
ths
perio
d en
ded
Mar
ch 3
1, 2
019
------
------
------
------
------
------
------
------
------
------
------
----R
upee
s in
'000
------
------
------
------
------
------
------
------
------
------
------
----
36SE
GM
ENT
INFO
RM
ATI
ON
36.1
Segm
ent d
etai
ls w
ith re
spec
t to
busi
ness
act
iviti
es
The
segm
ent a
naly
sis
with
resp
ect t
o bu
sine
ss a
ctiv
ity is
as
follo
ws:
Ret
ail B
anki
ngC
onsu
mer
bank
ing
Cor
pora
te
Bank
ing
Trea
sury
Inte
rnat
iona
l
Bank
ing
Isla
mic
Ban
king
Asse
t
Man
agem
ent
othe
rsSu
b-to
tal
Elim
inat
ions
Tota
l
Net
mar
k-up
/retu
rn/p
rofit
(1
6,09
0,15
5)
691,
123
9,57
7,03
7
21,7
62,4
73
367,
222
956,
897
(2,5
22)
23,7
07
17,2
85,7
82-
17,2
85,7
82
Inte
r seg
men
t rev
enue
- ne
t 28
,854
,219
(216
,060
)
(8,4
08,5
61)
(23,
434,
561)
(37,
654)
-
-
3,24
2,61
7
--
-
Non
mar
k-up
/ re
turn
/ in
tere
st in
com
e1,
574,
178
559,
206
811,
330
587,
126
196,
501
193,
240
120,
315
386,
400
4,42
8,29
6-
4,42
8,29
6
Tota
l Inc
ome
14,3
38,2
42
1,03
4,26
9
1,97
9,80
6
(1,0
84,9
62)
526,
069
1,15
0,13
7
117,
793
3,65
2,72
4
21,7
14,0
78-
21,7
14,0
78
Segm
ent d
irect
exp
ense
s5,
949,
896
428,
235
283,
402
136,
026
356,
507
1,09
3,15
9
121,
774
1,44
9,30
9
9,81
8,30
8-
9,81
8,30
8
Inte
r seg
men
t exp
ense
allo
catio
n-
-
-
-
-
-
-
-
--
-
Tota
l exp
ense
s5,
949,
896
428,
235
283,
402
136,
026
356,
507
1,09
3,15
9
121,
774
1,44
9,30
9
9,81
8,30
8-
9,81
8,30
8
Prov
isio
ns41
9,72
6
13,8
46
251,
167
(16,
921)
32,0
36
34,4
24
-
45,3
78
779,
656
-77
9,65
6
Prof
it be
fore
tax
7,96
8,62
0
592,
188
1,44
5,23
7
(1,2
04,0
67)
137,
526
22,5
54
(3,9
81)
2,15
8,03
7
11,1
16,1
14-
11,1
16,1
14
Bal
ance
She
et
Cas
h &
Bank
bal
ance
s45
,954
,279
134,
183
1,70
9,32
4
42,9
09,2
47
18,3
42,5
31
23,8
42,8
09
87,8
39
165,
502
133,
145,
714
-13
3,14
5,71
4
Inve
stm
ents
-
-
11,8
41,2
94
801,
575,
243
10,8
97,2
56
15,1
24,6
61
1,02
0,98
9
3,26
3,11
3
843,
722,
556
-84
3,72
2,55
6
Net
inte
r seg
men
t len
ding
973,
715,
995
-
-
-
-
-
188,
883,
912
1,16
2,59
9,90
7(1
,162
,599
,907
)-
Lend
ings
to fi
nanc
ial i
nstit
utio
ns-
-
-
-
3,69
3,75
4
6,42
8,79
0
-
-
10,1
22,5
44-
10,1
22,5
44
Adva
nces
- pe
rform
ing
91,9
65,3
27
24,3
56,1
65
331,
790,
172
-
24,7
66,2
51
59,2
97,4
78
-
596,
724
532,
772,
117
-53
2,77
2,11
7
- non
per
form
ing
1,12
3,36
5
116,
689
1,35
5,03
6
-
5,20
4,21
5
461,
617
-
247,
930
8,50
8,85
2-
8,50
8,85
2
Oth
ers
36,6
18,3
40
2,15
0,16
7
27,2
08,2
55
8,37
0,85
2
1,95
3,72
3
11,4
89,2
09
1,05
2,59
3
42,4
54,0
06
131,
297,
145
-13
1,29
7,14
5
Tota
l Ass
ets
1,14
9,37
7,30
6
26,7
57,2
04
373,
904,
081
852,
855,
342
64,8
57,7
30
116,
644,
564
2,16
1,42
1
235,
611,
187
2,82
2,16
8,83
5(1
,162
,599
,907
)1,
659,
568,
928
Borro
wing
s 48
,747
,208
-
7,08
1,70
4
21,1
09,6
91
5,48
8,90
7
10,8
99,9
94
-
572,
895
93,9
00,3
99-
93,9
00,3
99
Dep
osits
& o
ther
acc
ount
s1,
075,
145,
917
17,7
37,8
8147
,134
,981
-43
,109
,132
87,8
89,9
56-
932,
316
1,27
1,95
0,18
3-
1,27
1,95
0,18
3
Net
inte
r seg
men
t bor
rowi
ng-
6,50
7,21
530
1,47
7,15
382
9,97
3,62
812
,952
,097
10,2
74,4
231,
415,
391
-1,
162,
599,
907
(1,1
62,5
99,9
07)
-
Oth
ers
25,4
84,1
812,
512,
108
18,2
10,2
431,
772,
023
3,30
7,59
47,
580,
191
746,
030
53,5
46,7
9711
3,15
9,16
7-
113,
159,
167
Tota
l lia
bilit
ies
1,14
9,37
7,30
626
,757
,204
373,
904,
081
852,
855,
342
64,8
57,7
3011
6,64
4,56
42,
161,
421
55,0
52,0
082,
641,
609,
656
(1,1
62,5
99,9
07)
1,47
9,00
9,74
9
Equi
ty-
--
--
--
180,
559,
179
180,
559,
179
-18
0,55
9,17
9
Tota
l Equ
ity &
liab
ilitie
s1,
149,
377,
306
26,7
57,2
0437
3,90
4,08
185
2,85
5,34
264
,857
,730
116,
644,
564
2,16
1,42
123
5,61
1,18
72,
822,
168,
835
(1,1
62,5
99,9
07)
1,65
9,56
8,92
8
Con
tinge
ncie
s &
Com
mitm
ents
59,4
48,3
50-
263,
334,
673
305,
143,
524
15,1
50,5
8623
,777
,596
-30
,882
,758
697,
737,
487
-69
7,73
7,48
7
Un
audi
ted
thre
e m
onth
s pe
riod
ende
d M
arch
31,
202
0
------
------
------
------
------
------
------
------
------
------
------
----R
upee
s in
'000
------
------
------
------
------
------
------
------
------
------
------
----
Una
udite
d en
ded
Mar
ch 3
1, 2
020
-
For the three months period ended March 31, 2020Notes To The Consolidated Condensed Interim Financial Statements (Un-audited)
For the three months period ended March 31, 2020Notes To The Consolidated Condensed Interim Financial Statements (Un-audited)
MCB Bank Limited & Subsidiary Companies MCB Bank Limited & Subsidiary Companies
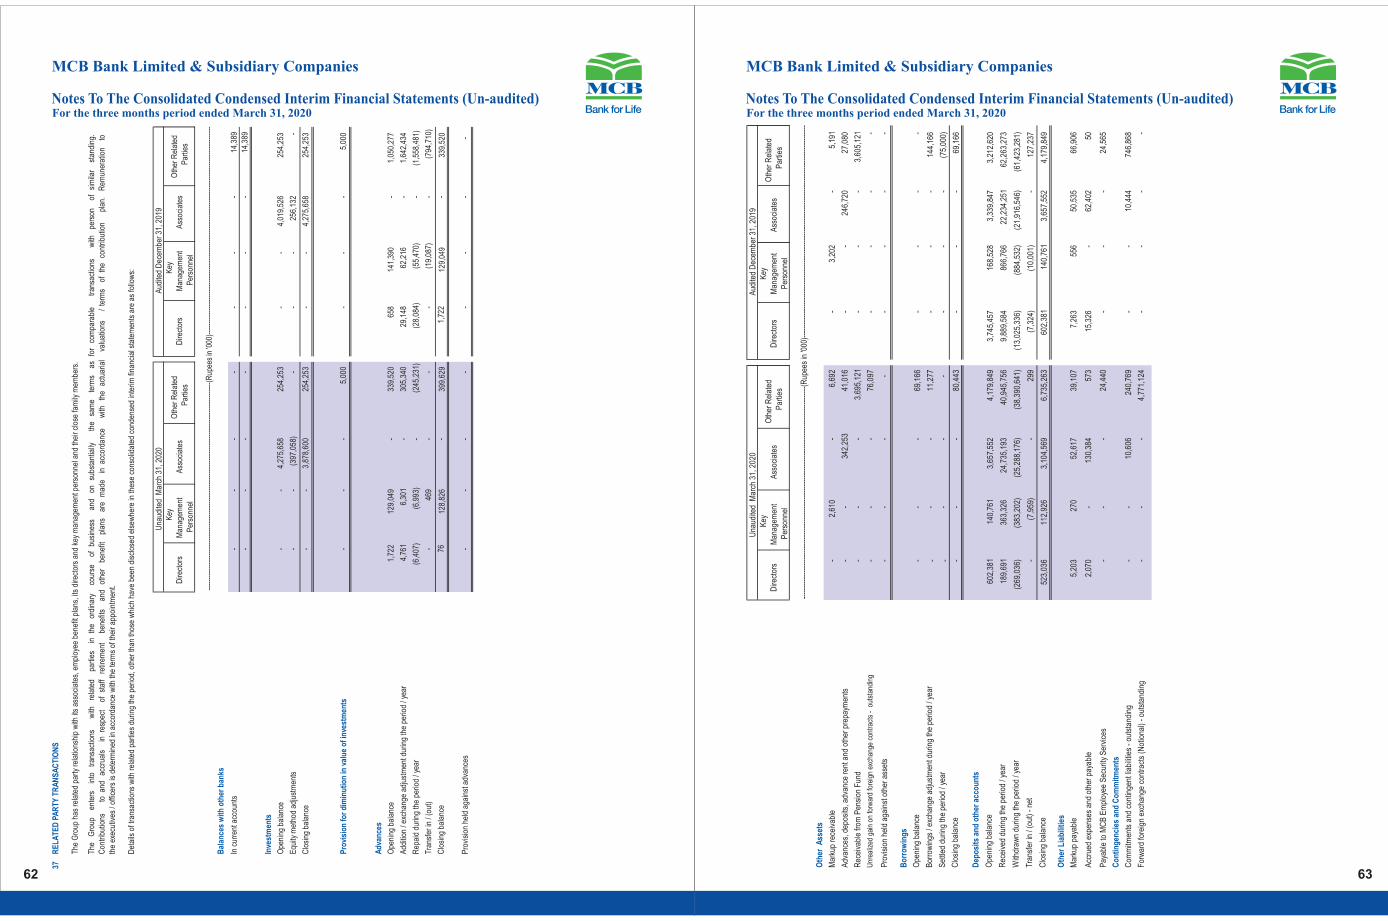
62 63
Dire
ctor
sK
ey
Man
agem
ent
Per
sonn
el A
ssoc
iate
s O
ther
Rel
ated
P
artie
sD
irect
ors
Key
M
anag
emen
t P
erso
nnel
Ass
ocia
tes
Oth
er R
elat
ed
Par
ties
Oth
er A
sset
s
Mar
kup
rece
ivab
le-
2,61
0
-
6,69
2
-
3,20
2
-
5,19
1
Adv
ance
s, d
epos
its, a
dvan
ce r
ent a
nd o
ther
pre
paym
ents
-
-
342,
253
41,0
16
-
-
246,
720
27,0
80
Rec
eiva
ble
from
Pen
sion
Fun
d-
-
-
3,69
5,12
1
-
-
-
3,60
5,12
1
Unr
ealiz
ed g
ain
on fo
rwar
d fo
reig
n ex
chan
ge c
ontr
acts
- o
utst
andi
ng-
-
-
76,0
97
-
-
-
-
Pro
visi
on h
eld
agai
nst o
ther
ass
ets
-
-
-
-
-
-
-
-
Bo
rrow
ings
Ope
ning
bal
ance
-
-
-
69,1
66
-
-
-
-
Bor
row
ings
/ ex
chan
ge a
djus
tmen
t dur
ing
the
perio
d / y
ear
-
-
-
11,2
77
-
-
-
144,
166
Set
tled
durin
g th
e pe
riod
/ yea
r-
-
-
-
-
-
-
(7
5,00
0)
Clo
sing
bal
ance
-
-
-
80,4
43
-
-
-
69,1
66
Dep
osi
ts a
nd
oth
er a
cco
unts
Ope
ning
bal
ance
602,
381
140,
761
3,65
7,55
2
4,17
9,84
9
3,74
5,45
7
16
8,52
8
3,33
9,84
7
3,21
2,62
0
Rec
eive
d du
ring
the
perio
d / y
ear
189,
691
363,
326
24,7
35,1
93
40,9
45,7
56
9,88
9,58
4
866,
766
22,2
34,2
51
62,2
63,2
73
With
draw
n du
ring
the
perio
d / y
ear
(269
,036
)
(383
,202
)
(25,
288,
176)
(38,
390,
641)
(13,
025,
336)
(884
,532
)
(21,
916,
546)
(61,
423,
281)
Tran
sfer
in /
(out
) - n
et-
(7,9
59)
-
299
(7,3
24)
(10,
001)
-
127,
237
Clo
sing
bal
ance
523,
036
112,
926
3,10
4,56
9
6,73
5,26
3
602,
381
140,
761
3,65
7,55
2
4,17
9,84
9
Oth
er L
iabi
litie
s
Mar
kup
paya
ble
5,20
3
270
52,6
17
39,1
07
7,26
3
556
50,5
35
66,9
06
Acc
rued
exp
ense
s an
d ot
her
paya
ble
2,07
0
-
130,
384
573
15,3
26
-
62,4
02
50
Pay
able
to M
CB
Em
ploy
ee S
ecur
ity S
ervi
ces
-
-
-
24,4
40
-
-
-
24,5
65
Co
ntin
gen
cies
an
d C
om
mitm
ents
Com
mitm
ents
and
con
tinge
nt li
abili
ties
- ou
tsta
ndin
g -
-10
,606
240,
769
--
10,4
4474
6,86
8
For
war
d fo
reig
n ex
chan
ge c
ontra
cts
(Not
iona
l) - o
utst
andi
ng-
--
4,77
1,12
4-
--
-
Una
udite
d M
arch
31,
202
0A
udite
d D
ecem
ber 3
1, 2
019
----
----
----
----
----
----
----
----
----
----
----
----
----
----
----
----
----
----
----
----
----
----
----
----
(Rup
ees
in '0
00)-
----
----
----
----
----
----
----
----
----
----
----
----
----
----
----
----
----
----
----
----
----
----
----
---
37R
EL
ATE
D P
AR
TY T
RA
NS
AC
TIO
NS
Dire
ctor
sK
ey
Man
agem
ent
Per
sonn
el A
ssoc
iate
s O
ther
Rel
ated
P
artie
sD
irect
ors
Key
M
anag
emen
t P
erso
nnel
Ass
ocia
tes
Oth
er R
elat
ed
Par
ties
Bal
ance
s w
ith
oth
er b
anks
In c
urre
nt a
ccou
nts
-
-
-
-
-
-
-
14
,389
-
-
-
-
-
-
-
14,3
89
Inve
stm
ents
Ope
ning
bal
ance
-
-
4,
275,
658
254,
253
-
-
4,01
9,52
6
254,
253
Equ
ity m
etho
d ad
just
men
ts-
-
(397
,058
)
-
-
-
256,
132
-
Clo
sing
bal
ance
-
-
3,87
8,60
0
254,
253
-
-
4,27
5,65
8
25
4,25
3
Pro
visi
on fo
r di
min
utio
n in
val
ue
of in
vest
men
ts-
-
-
5,00
0
-
-
-
5,00
0
Adv
ance
s
Ope
ning
bal
ance
1,72
2
129,
049
-
339,
520
658
141,
390
-
1,05
0,27
7
Add
ition
/ ex
chan
ge a
djus
tmen
t dur
ing
the
perio
d / y
ear
4,76
1
6,30
1
-
305,
340
29,1
48
62,2
16
-
1,64
2,43
4
Rep
aid
durin
g th
e pe
riod
/ yea
r(6
,407
)
(6,9
93)
-
(245
,231
)
(28,
084)
(55,
470)
-
(1,5
58,4
81)
Tran
sfer
in /
(out
)-
469
-
-
-
(19,
087)
-
(794
,710
)
Clo
sing
bal
ance
7612
8,82
6-
399,
629
1,72
212
9,04
9-
339,
520
Pro
visi
on h
eld
agai
nst a
dvan
ces
--
--
--
--
----
----
----
----
----
----
----
----
----
----
----
----
----
----
----
----
----
----
----
----
----
----
----
----
(Rup
ees
in '0
00)-
----
----
----
----
----
----
----
----
----
----
----
----
----
----
----
----
----
----
----
----
----
----
----
---
The
Gro
up h
as re
late
d pa
rty
rela
tions
hip
with
its
asso
ciat
es, e
mpl
oyee
ben
efit
plan
s, it
s di
rect
ors
and
key
man
agem
ent p
erso
nnel
and
thei
r clo
se fa
mily
mem
bers
.
The
Gro
upen
ters
into
tran
sact
ions
with
rela
ted
parti
esin
the
ordi
nary
cour
seof
busi
ness
and
onsu
bsta
ntia
llyth
esa
me
term
sas
for
com
para
ble
tran
sact
ions
with
pers
onof
sim
ilar
stan
ding
.C
ontr
ibut
ions
toan
dac
crua
lsin
resp
ect
ofst
aff
retir
emen
tbe
nefit
san
dot
her
bene
fitpl
ans
are
mad
ein
acco
rdan
cew
ithth
eac
tuar
ial
valu
atio
ns/
term
sof
the
cont
ribut
ion
plan
.R
emun
erat
ion
toth
e ex
ecut
ives
/ of
ficer
s is
det
erm
ined
in a
ccor
danc
e w
ith th
e te
rms
of th
eir a
ppoi
ntm
ent.
Det
ails
of t
rans
actio
ns w
ith r
elat
ed p
artie
s du
ring
the
perio
d, o
ther
than
thos
e w
hich
hav
e be
en d
iscl
osed
els
ewhe
re in
thes
e co
nsol
idat
ed c
onde
nsed
inte
rim fi
nanc
ial s
tate
men
ts a
re a
s fo
llow
s:
Una
udite
d M
arch
31,
202
0A
udite
d D
ecem
ber 3
1, 2
019
For the three months period ended March 31, 2020Notes To The Consolidated Condensed Interim Financial Statements (Un-audited)
For the three months period ended March 31, 2020Notes To The Consolidated Condensed Interim Financial Statements (Un-audited)
MCB Bank Limited & Subsidiary Companies MCB Bank Limited & Subsidiary Companies

64 65
38 CAPITAL ADEQUACY, LEVERAGE RATIO & LIQUIDITY REQUIREMENTS
38.1 Capital Adequacy
Minimum Capital Requirement (MCR):
Paid-up capital (net of losses)
Capital Adequacy Ratio (CAR):
Eligible Common Equity Tier 1 (CET 1) CapitalEligible Additional Tier 1 (ADT 1) Capital
Total Eligible Tier 1 Capital
Eligible Tier 2 Capital
Total Eligible Capital (Tier 1 + Tier 2)
Risk Weighted Assets (RWAs):
Credit Risk
Market Risk
Operational Risk
Total
Common Equity Tier 1 Capital Adequacy ratio
Tier 1 Capital Adequacy Ratio
Total Capital Adequacy Ratio
38.2 Leverage Ratio (LR):
Eligible Tier-1 Capital
Total ExposuresLeverage Ratio
38.3 Liquidity Requirements
Liquidity Coverage Ratio (LCR):
Total High Quality Liquid Assets
Total Net Cash Outflow
Liquidity Coverage Ratio
Net Stable Funding Ratio (NSFR):
Total Available Stable Funding
Total Required Stable FundingNet Stable Funding Ratio
Unaudited March 31, 2020
Audited December 31,
2019
11,850,600
11,850,600
133,759,574
132,504,188
-
-
133,759,574
132,504,188
37,352,322
28,503,091
171,111,896
161,007,279
675,851,728
662,366,497
126,487,974
113,394,030
126,966,330
126,966,330
929,306,032
902,726,857
14.39% 14.68%
14.39% 14.68%
18.41% 17.84%
133,759,574
132,504,188
2,090,947,791
2,037,241,480
6.40% 6.50%
858,550,627
734,587,045
402,311,590
379,626,249
213.40% 193.50%
1,113,357,213 1,045,877,006
712,341,783 745,689,676
156.30% 140.26%
----------Rupees in '000-------
RE
LA
TED
PA
RTY
TR
AN
SA
CT
ION
S
Dire
ctor
sK
ey
Man
agem
ent
Per
sonn
el A
ssoc
iate
s O
ther
Rel
ated
P
artie
sD
irect
ors
Key
M
anag
emen
t P
erso
nnel
Ass
ocia
tes
Oth
er R
elat
ed
Par
ties
Inco
me
Mar
kup
/ ret
urn
/ int
eres
t ear
ned
-
4,48
7
-
8,41
9
-
4,
891
-
5,87
5
Fee
and
com
mis
sion
inco
me
-
-
324,
743
248
-
-
298,
655
2,40
1
Div
iden
d in
com
e-
-
-
7,93
3
-
-
-
-
(Los
s) /
Gai
n on
forw
ard
fore
ign
exch
ange
con
trac
ts m
atur
ed d
urin
g th
e pe
riod
/ yea
r-
-
-
(14,
882)
-
-
-
5,52
2
Net
gai
n / (
loss
) on
sale
of s
ecur
ities
72
33
235
322
-
(0.5
)
-
2,
446
Gai
n on
sal
e of
fixe
d as
sets
-
5
-
-
-
36
-
-
Ren
t inc
ome
and
reim
burs
emen
t of o
ther
exp
ense
s-
-
2,28
5
570
-
-
965
1,01
3
Exp
ense
Mar
kup
/ ret
urn
/ int
eres
t exp
ense
d15
,223
516
94,8
70
68,1
88
68,6
54
178
38,8
72
78,7
82
Oth
er O
pera
ting
exp
ense
s
Cle
arin
g ex
pens
es p
aid
to N
IFT
-
-
-
46,2
78
-
-
-
35,8
82
Con
trib
utio
n to
pro
vide
nt fu
nd-
-
-
99
,858
-
-
-
92,5
17
Ren
t exp
ense
s-
-
11,3
96
10,7
45
-
-
-
9,36
4
Cas
h so
rtin
g ex
pens
es-
-
-
33
,481
-
-
-
38,5
27
Sta
tione
ry e
xpen
ses
-
-
-
69,0
84
-
-
-
60,4
55
Sec
urity
gua
rds
expe
nses
-
-
-
82,6
40
-
-
-
96,9
44
Rem
uner
atio
n to
key
exe
cutiv
es a
nd n
on-e
xecu
tive
dire
ctor
s fe
e80
,299
23
8,71
0
-
-
66
,786
205,
961
-
-
Out
sour
cing
ser
vice
exp
ense
s-
-
67,7
35
-
-
-
64
,575
-
E-d
ivid
end
proc
essi
ng fe
e an
d C
DC
cha
rges
-
-
-
702
-
-
-
70
3
Trav
ellin
g E
xpen
ses
-
-
-
11,2
14
-
-
-
7,
257
Hot
el s
tay
expe
nses
-
-
-
889
-
-
-
56
Rep
air
& M
aint
enan
ce C
harg
es-
-
-
445
-
-
-
-
Adv
ertis
emen
t Exp
ense
s-
-
-
3,13
2
-
-
-
-
Mis
cella
neou
s ex
pens
es a
nd p
aym
ents
-
-
-
561
-
-
-
335
Insu
ranc
e pr
emiu
m-n
et o
f ref
und
-
-
266,
437
-
-
-
369,
359
-
Insu
ranc
e cl
aim
set
tled
-
-
16,9
91
-
-
-
24,4
62
-
Oth
er T
ran
sact
ions
Pro
ceed
s fr
om s
ale
of fi
xed
asse
ts-
5
-
-
-
36
-
-
Pur
chas
e of
fixe
d as
sets
-
-
2,34
7
-
-
-
46,3
39
20,0
03
Sal
e of
fore
ign
curr
ency
-
-
-
-
-
-
-
-
Pur
chas
e of
fore
ign
curr
ency
-
-
-
-
-
-
-
-
Pay
men
ts a
gain
st h
ome
rem
ittan
ces
-
-
-
-
-
-
-
-
Sal
e of
gov
ernm
ent s
ecur
ities
79,7
60
34,8
38
1,79
1,47
9
770,
297
-
30
,528
1,
139,
930
29,8
03,8
33
Pur
chas
e of
gov
ernm
ent s
ecur
ities
19,8
27-
631,
712
440,
478
-12
,491
1,99
0,29
739
,307
,724
For
war
d ex
chan
ge c
ontr
acts
mat
ured
dur
ing
the
perio
d -
--
4,76
6,94
9-
--
5,07
7,57
3
The
Cha
irman
has
been
prov
ided
with
free
use
ofth
eG
roup
mai
ntai
ned
car.
The
Chi
efE
xecu
tive
and
cert
ain
exec
utiv
esar
epr
ovid
edw
ithfr
eeus
eof
the
Gro
up's
mai
ntai
ned
cars
and
hous
ehol
deq
uipm
ent i
n ac
cord
ance
with
the
term
s of
thei
r em
ploy
men
t.
Una
udite
d th
ree
mon
ths
ende
d M
arch
31,
202
0U
naud
ited
thre
e m
onth
s en
ded
Mar
ch 3
1, 2
019
----
----
----
----
----
----
----
----
----
----
----
----
----
----
----
----
----
----
----
----
----
----
----
----
(Rup
ees
in '0
00)-
----
----
----
----
----
----
----
----
----
----
----
----
----
----
----
----
----
----
----
----
----
----
----
---
For the three months period ended March 31, 2020Notes To The Consolidated Condensed Interim Financial Statements (Un-audited)
For the three months period ended March 31, 2020Notes To The Consolidated Condensed Interim Financial Statements (Un-audited)
MCB Bank Limited & Subsidiary Companies MCB Bank Limited & Subsidiary Companies

66 67
Profit / return earned
Profit / return expensed
Net Profit / return
Other income
Fee and Commission Income
Dividend Income
Foreign Exchange Income
(loss) / Gain on securities
Other Income
Total other income
Total Income
Other expenses
Operating expenses
Workers Welfare Fund
Other charges
Total other expenses
Profit / (loss) before provisions
Provisions and write offs - net
Profit / (loss) before taxation
Taxation
Profit / (loss) after taxation
39.1 DUE FROM FINANCIAL INSTITUTIONS
Secured
Bai Muajjal receivable - with State Bank of Pakistan
Unsecured
Musharaka arrangements
39.1.1
39.1.2
The profit and loss account of the Group's Islamic banking branches for the three months period ended March 31, 2020 is as follows:
Note
Three months ended March 31,
2020
Three months ended March 31,
2019
39.6 2,561,764
1,994,892
39.7 1,604,867
1,154,856
956,897
840,036
70,505
65,608
7,766
11,425
109,299
20,515
364
(32,809)
5,306
5,066
193,240
69,805
1,150,137
909,841
1,091,428
1,139,973
1,671
-
60
77
1,093,159
1,140,050
56,978
(230,209)
34,424
37,497
22,554
(267,706)
16,352
(70,581)
6,202
(197,125)
828,790
5,600,000
6,428,790
This represents Bai Muajjal with State Bank of Pakistan carrying profit at average rate of 9.14% per annum (December 31, 2019: 10.34%) and having maturity till January 29, 2021.
This represents Musharaka arrangements with banks carrying profit at expected rates ranging from 3.50% to 7.50% per annum (December 31,2019: 10.80% to 11.00% per annum) and having maturity till April 20, 2020.
39 ISLAMIC BANKING BUSINESS
Note
Unaudited
March 30, 2020
Audited
December 31, 2019
ASSETS
Cash and balances with treasury banks 18,236,813 10,252,547
Balances with other banks 5,605,996 8,822,985
Due from financial institutions 39.1 6,428,790 5,851,664
Investments - net 39.2 15,124,661 16,309,800
Islamic financing and related assets - net 39.3 59,759,095 51,309,967
Fixed assets 5,814,233 5,779,772
Intangible assets 696,290 719,723
Deferred tax assets - net 1,052,918 921,017
Other assets - net 4,983,584 5,049,786
Total Assets 117,702,380 105,017,261
LIABILITIES
Bills payable 996,583 973,627
Due to financial institutions 10,899,998 4,127,526
Deposits and other accounts 39.4 87,889,956 81,853,511 Liabilities against assets subject to finance lease -
-
Sub-ordinated debts -
-
Deferred tax liabilities - net -
-
Other liabilities 7,641,420 7,595,796
107,427,957 94,550,460
NET ASSETS 10,274,423 10,466,801
REPRESENTED BY
Share capital 11,550,000
11,550,000
Reserves 26,444
26,444
Surplus on revaluation of assets - net of tax 223,330
422,326
Accumulated loss (1,525,351)
(1,531,969)
10,274,423
10,466,801
CONTINGENCIES AND COMMITMENTS 39.5
The Group through a wholly owned subsidiary (MCB Islamic Bank Limited ) is operating 185 branches in Pakistan (December 31, 2019: 185 branches). The statement of financial position of the Group's Islamic Banking Business as at March 31, 2020 is as follows:
----------Rupees in '000-------
For the three months period ended March 31, 2020Notes To The Consolidated Condensed Interim Financial Statements (Un-audited)
For the three months period ended March 31, 2020Notes To The Consolidated Condensed Interim Financial Statements (Un-audited)
MCB Bank Limited & Subsidiary Companies MCB Bank Limited & Subsidiary Companies
----------Rupees in '000-------
Unaudited March 31, 2020
----------Rupees in '000-------

68
39.2 Investments by type:
Available-for-sale securities
Federal Government securities 10,074,261
-
348
10,074,609
10,899,070
-
(7,384)
10,891,686
Shares 1,910,825
1,059,172
(148,448)
703,205
1,908,146
1,059,172
175,625
1,024,599
Non Government securities 1,119,000
-
9,520
1,128,520
1,119,000
-
(1,312)
1,117,688
13,104,086
1,059,172
(138,580)
11,906,334
13,926,216
1,059,172
166,929
13,033,973
Held-to-maturity securities
Federal Government securities 2,700,827
-
-
2,700,827
2,700,827
-
-
2,700,827
Non Government securities 517,500
-
-
517,500
575,000
-
-
575,000
3,218,327
-
-
3,218,327
3,275,827
-
-
3,275,827
Total Investments 16,322,413
1,059,172
(138,580)
15,124,661
17,202,043
1,059,172
166,929
16,309,800
39.3
Murabaha
Musawamah
Istisna
Salam
Ijarah
Running Musharaka
Diminishing Musharaka
Staff finance
Gross Islamic financing and related assets
Less: provision against Islamic financings
- Specific
- General
Islamic financing and related assets - net of provision
-------------------------------------------------------------Rupees in '000-------------------------------------------------------------
Unaudited March 31, 2020Audited
December 31, 2019
Cost/ Amortised cost
Provision for diminution
Surplus / (Deficit)
Carrying Value
Cost /Amortised
cost
Provision for diminution
Surplus / (Deficit)
Carrying Value
Unaudited March 31,
2020
Audited December 31,
2019
11,521,449 7,609,830
- 2,000
3,714,797 2,603,493
82,913 111,287
4,647,868 4,881,400
20,532,518 16,669,096
18,069,868 18,176,482
1,260,008 1,293,082
59,829,421 51,346,670
(9,833) (3,340)
(60,493) (33,363)
(70,326) (36,703)
59,759,095 51,309,967
----------Rupees in '000-------
39.4 Deposits
Customers
Current deposits
Savings deposits
Term deposits
Others
Financial Institutions
Current deposits
Savings deposits
Term deposits
21,041,114
40,772,727
19,896,561
1,574,478
83,284,880
102,198
713,978
3,788,900
4,605,076
87,889,956
22,191,828
33,716,605
15,122,076
4,918,750
75,949,259
100,334
1,988,287
3,815,631
5,904,252
81,853,511
For the three months period ended March 31, 2020Notes To The Consolidated Condensed Interim Financial Statements (Un-audited)
For the three months period ended March 31, 2020Notes To The Consolidated Condensed Interim Financial Statements (Un-audited)
MCB Bank Limited & Subsidiary Companies MCB Bank Limited & Subsidiary Companies
39.5 Contingencies and Commitments
39.6 Unaudited
March 31,
2020
Audited
December 31,
2019
Profit earned on:
Financing 1,879,764
1,600,682
Investments 520,585
286,832
Musharaka arrangements with financial institutions 95,140
96,157
Deposits with financial institutions 66,275
11,221
2,561,764
1,994,892
39.7
Deposits and other accounts 1,400,134
957,636
Musharaka arrangements with the State Bank of Pakistan under IERS 13,687
12,859
Musharaka arrangements with other financial institutions 92,086
184,308
Musharaka arrangements with other institution 1,372
53
Unwinding of liability against ROU asset 97,588
-
1,604,867
1,154,856
Unaudited
March 31,
2020
Audited
December 31,
2019
39.8
Opening Balance (1,531,969)
(1,289,202)
22,554
(243,612)
Less: Taxation 16,352 -
Add: Reserves 416 845
6,618 (242,767)
Closing Balance (1,525,351) (1,531,969)
Add: Islamic Banking loss for the period / year
-Guarantees
-Commitments
-Other contingent liabilities
----------Rupees in '000-------
----------Rupees in '000-------
Movement during the period / year
7,290,923 6,467,046 16,055,209 11,498,973
431,464
431,439
23,777,596
18,397,458
Unaudited March 31,
2020
Audited
2019
----------Rupees in '000-------
December 31,
The Board of Directors in its meeting held on April 22, 2020 has announced a cash dividend in respect of three months period ended March 31, 2020 of Rs.5.00 per share (March 31, 2019: Rs. 4.00 per share). These consolidated condensed interim financial statements for the period ended March 31, 2020 do not include the effect of these appropriations which will be accounted for subsequent to the period end.
40 EVENTS AFTER THE REPORTING DATE
Figures have been rounded off to the nearest thousand of rupees unless otherwise stated.
41 GENERAL
These consolidated condensed interim financial statements were authorized for issue by the Board of Directors of the Group in their meeting held on April 22, 2020.
42 DATE OF AUTHORIZATION FOR ISSUE
Hammad Khalid
Chief Financial Officer Masood Ahmed Puri
Director Salman Khalid Butt
Director Imran Maqbool
Mian Umer Mansha
Director President / CEO69