Embed Size (px)
Citation preview

4-1
THOMAS L. WHEELEN J. DAVID HUNGER
CHAPTER 4 Environmental Scanning and Industry Analysis
Continuation of last session’s lecture
Prentice Hall, Inc. © 2008 4-2
Porter’s Approach to Industry Analysis
Rivalry Among Existing Firms –
–Number of competitors–Rate of industry growth–Product or service characteristics–Amount of fixed costs–Capacity–Height of exit barriers–Diversity of rivals

Overall customer care market shares for 2009
• The customer care market generated USD2.118 billion in revenue in 2009, 3.1% higher than the USD2.055 billion in 2008. The revenue for 2008 is higher than was reported last year (USD1.186 billion) because it was restated. The difference came primarily from a restatement of the size of the customer care market in China, of which we gained substantial visibility this year.
• Customer care is more consolidated than many other BSS and OSS markets, and two vendors, Oracle and Amdocs, clearly dominate. However, 50 suppliers command revenue of several million dollars in this market. Two vendors, Huawei and AsiaInfo, dominate the Chinese market and there are many other smaller, geographically focused suppliers.
• The customer care market is driven by greater competition in the emerging markets, the increasingly complex services and service bundles being offered by CSPs, the strong desire of consumers for instant service, the increasing need of CSPs to offer many new services quickly and the need to reduce customer support costs.
Executive summary
Figure 1: Customer care market shares by revenue, worldwide, 2009 [Source: Analysys Mason, 2010]
Total revenue: USD2118 million
Oracle26%
Amdocs19%
Convergys6%
Huawei6%
SAP4%
Other36%
AsiaInfo3%

Overall service fulfilment market shares for 2009
• The service fulfilment market generated USD2.233 billion in revenue in 2009, up by 2.8% from USD2.173 billion in 2008. This represents slightly more growth than we forecasted last year (2.3%).
• Service fulfilment continues to be a very fragmented market. The top-six vendors accounted for only 44% of the market, while more than 30 other vendors achieved over USD10 million in revenue.
• The service fulfilment market grew more than some other areas of BSS/OSS since it is considered to be related to revenue generation.
• Growth in the service fulfilment market was driven by network evolution towards optical/packet technology, the push towards instant availability for complex service bundles, the need to operate in uncertain and changing business environments, deregulation of broadband and mobile in growth markets and the increasing desire to meet the needs of SMEs.
Executive summary
Figure 1: Service fulfilment market shares by revenue, worldwide, 2009 [Source: Analysys Mason, 2010]
Total revenue: USD2.233 billion
Telcordia10.1%
Oracle9.5%
Amdocs9.2%
NEC7.0%
Other56.0%
HP4.3%
Comptel4.0%

Prentice Hall, Inc. © 2008 4-5
International Risk Assessment
Continuum of International Industries
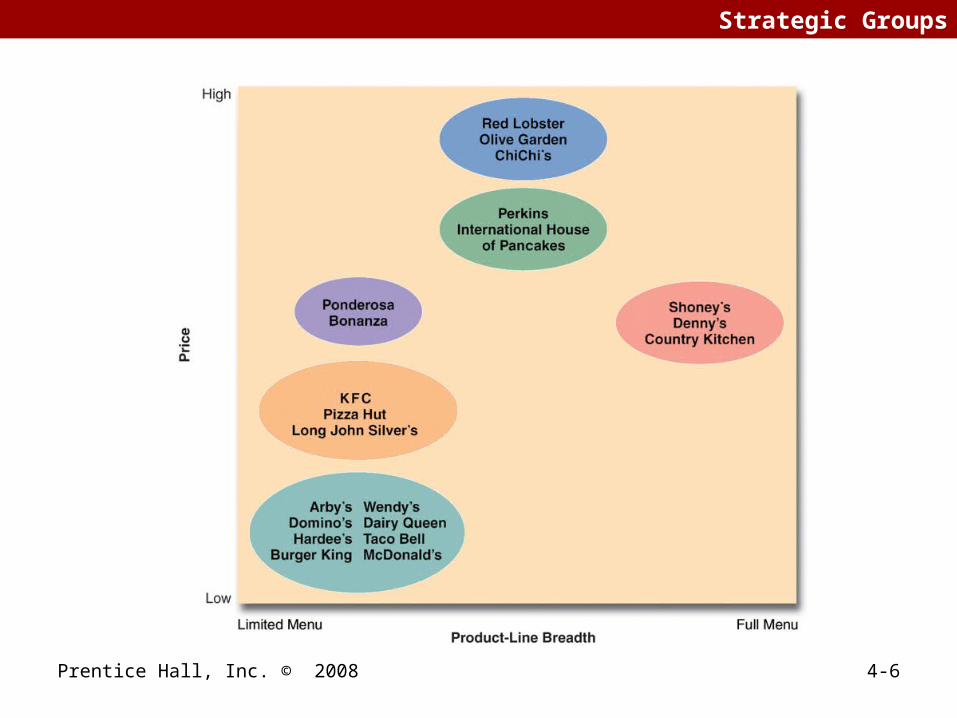
Prentice Hall, Inc. © 2008 4-6
Strategic Groups
Proprietary - Mortensen Consulting Group and DAX Technologies
71 February 2008
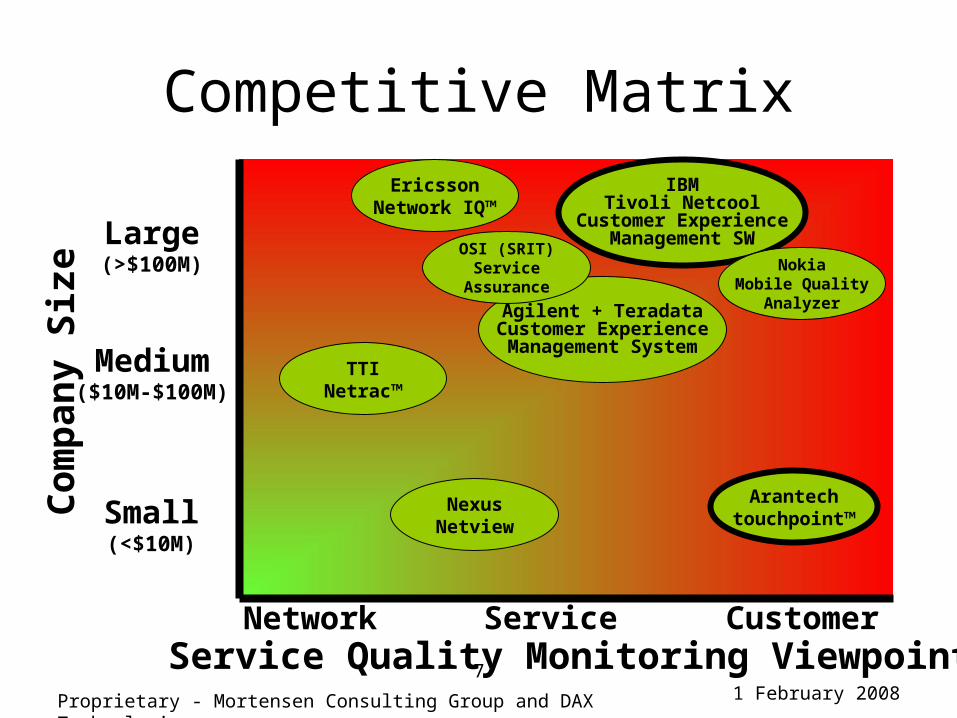
Competitive Matrix
Network Service Customer
Large(>$100M)
Medium($10M-$100M)
Small(<$10M)
Service Quality Monitoring Viewpoint
Co
mp
any
Siz
e
Arantechtouchpoint™
Agilent + TeradataCustomer ExperienceManagement System
IBMTivoli Netcool
Customer ExperienceManagement SW
TTINetrac™
EricssonNetwork IQ™
NexusNetview
OSI (SRIT)Service
AssuranceNokia
Mobile QualityAnalyzer
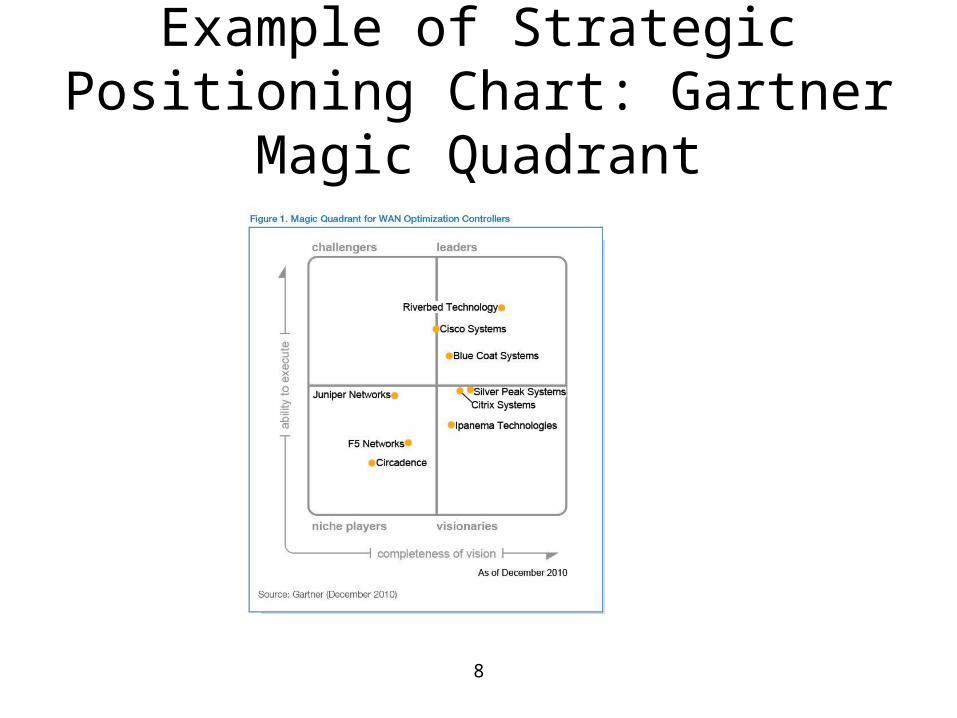
Example of Strategic Positioning Chart: Gartner Magic Quadrant
8
4-9
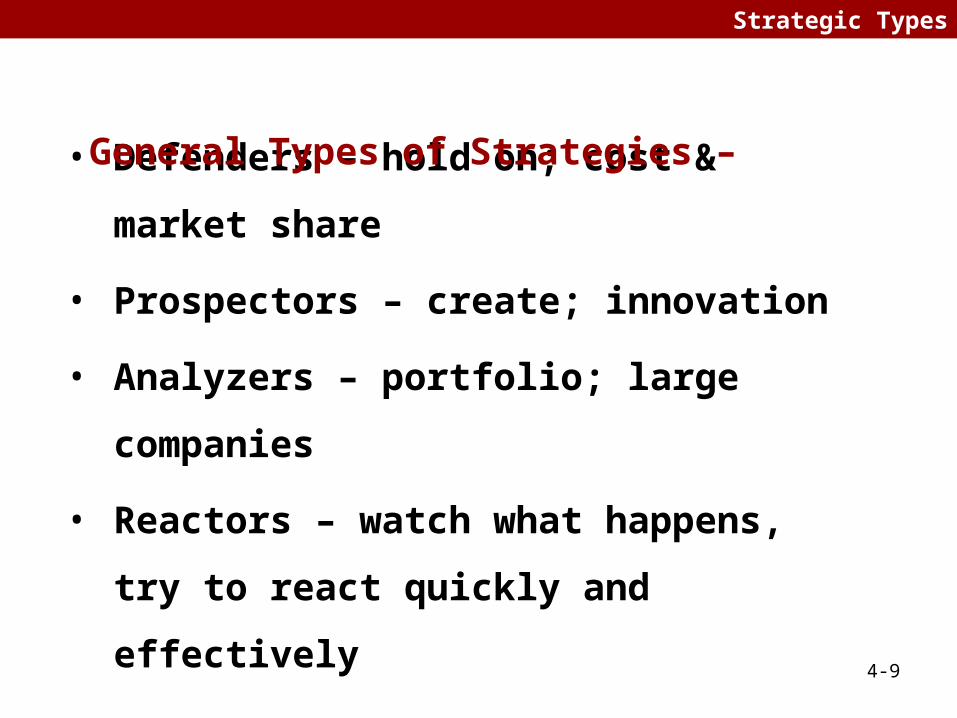
Strategic Types
• Defenders – hold on; cost & market share
• Prospectors – create; innovation
• Analyzers – portfolio; large companies
• Reactors – watch what happens, try to
react quickly and effectively
General Types of Strategies –
Prentice Hall, Inc. © 2008 4-10
Competitive Intelligence
Competitive Intelligence is often called business intelligence
Gathering information on a company’s competitors• Product/offering – features, functionality, pricing, targets, etc.•Company – size, profitability, margins, target markets, apparent strategy, etc.
4-11
Forecasting
Forecasting Techniques --
•Extrapolation – from the past to the future•Brainstorming – informed people mapping out possibilities•Expert opinion – buy reports or commission a study•Delphi technique – structured polling technique; ‘The Wisdom of Crowds”•Statistical modeling – projecting past patterns into the future•Scenario planning – a formal technique for mapping out futures, of various probabilities
Prentice Hall, Inc. © 2008 4-12
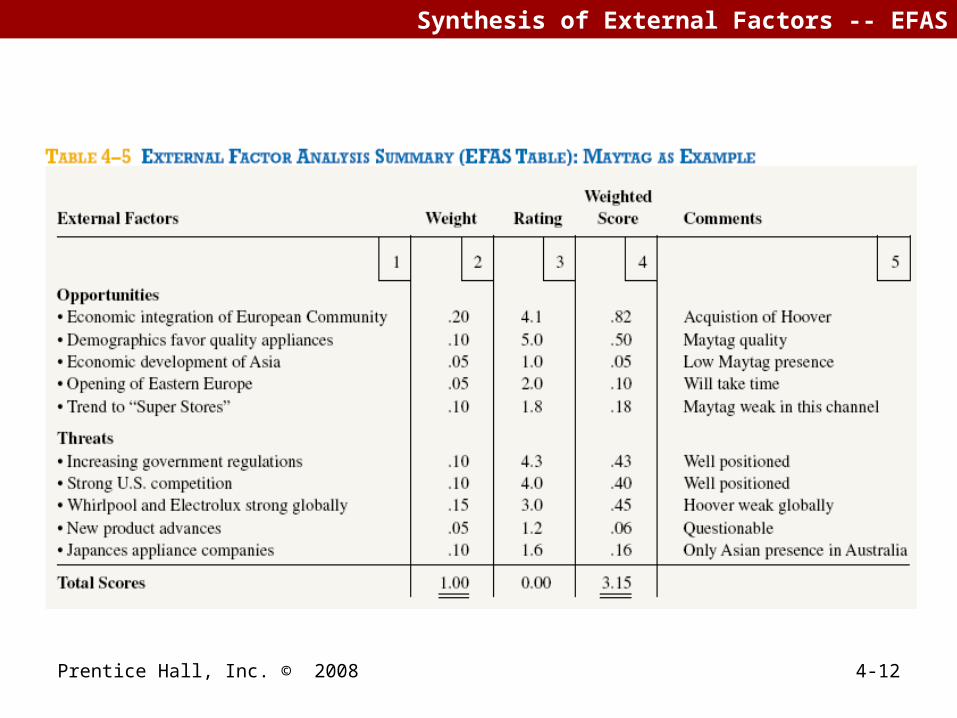
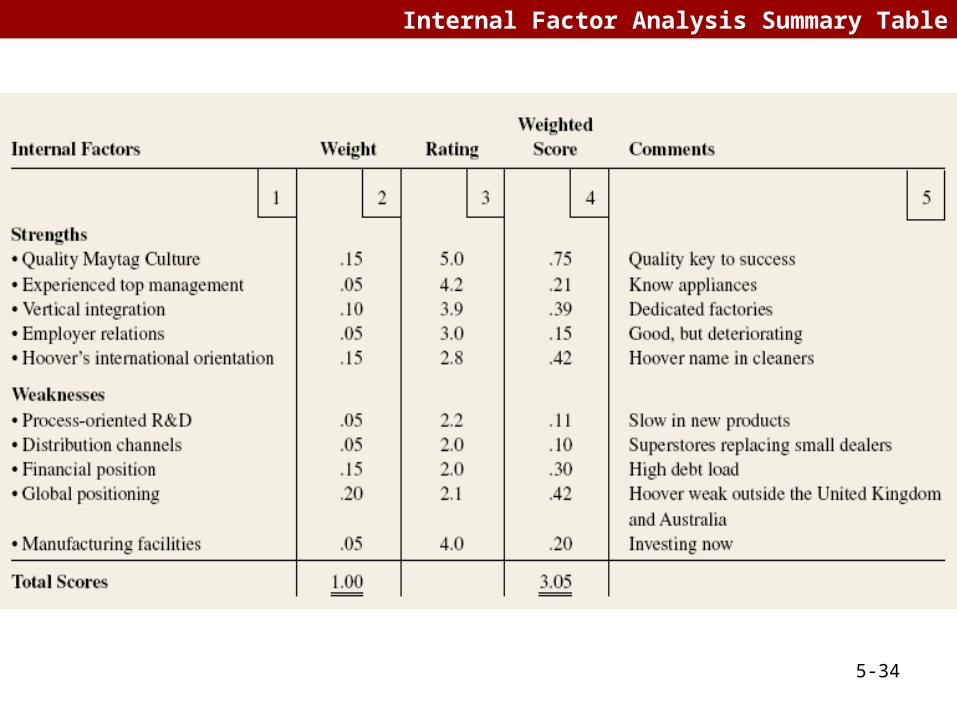
Synthesis of External Factors -- EFAS

5-13
STRATEGIC MANAGEMENT & BUSINESS POLICY13TH EDITION
THOMAS L. WHEELEN J. DAVID HUNGER
CHAPTER 5Internal Scanning: Organizational Analysis
5-14
Resource-Based Approach to Organizational Analysis
Internal strategic factors --
–Critical strengths and weaknesses that are likely to determine if the firm will be able to take advantage of opportunities while avoiding threats
•Resources•Capabilities•Competency•Core competency•Distinctive competency
5-15
Core and Distinctive Competencies
VRIO Framework --
–Value
–Rareness
–Imitability
–Organization

5-16
Resource-Based Approach to Organizational Analysis
5-Step Approach Strategy Analysis --
1. Identify and classify resources2. Combine strengths into capabilities3. Appraise profit potential of capabilities4. Select strategy that best exploits 5. Identify resource gaps invest in weaknesses
5-17
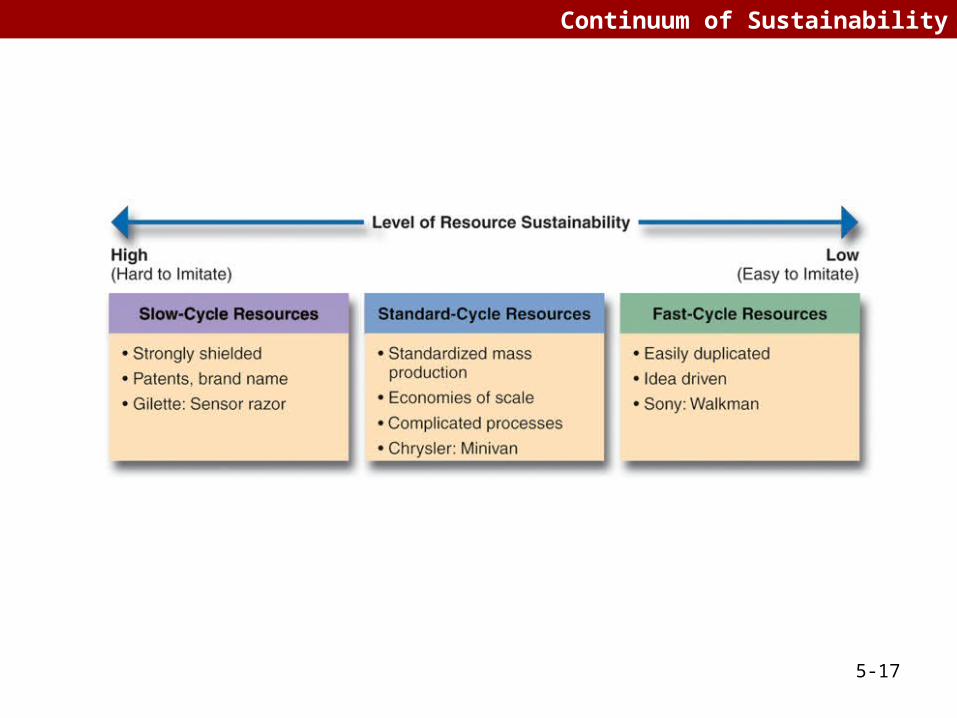
Continuum of Sustainability
5-18
Sustainability of Advantage
Durability --
–Rate at which a firm’s underlying resources and capabilities depreciate or become obsolete
Imitability --
–Rate at which a firm’s underlying resources and capabilities can be duplicated by others

5-19
Sustainability of Advantage
Core Competency can be imitated --
–Transparency–Transferability–Replicability
5-20
Business Models
BUSINESS MODEL:Company’s method for making money in the current business environment.

5-21
Business Models
Types of Business Models --
–Customer Solutions Model–Profit Pyramid Model–Multi-Component System/Installed Base Model–Advertising Model–Switchboard Model
5-22
Business Models
Types of Models --
–Time Model–Efficiency Model–Blockbuster Model–Profit Multiplier Model–Entrepreneurial Model–De Facto Standard Model
5-23
Value-Chain Analysis
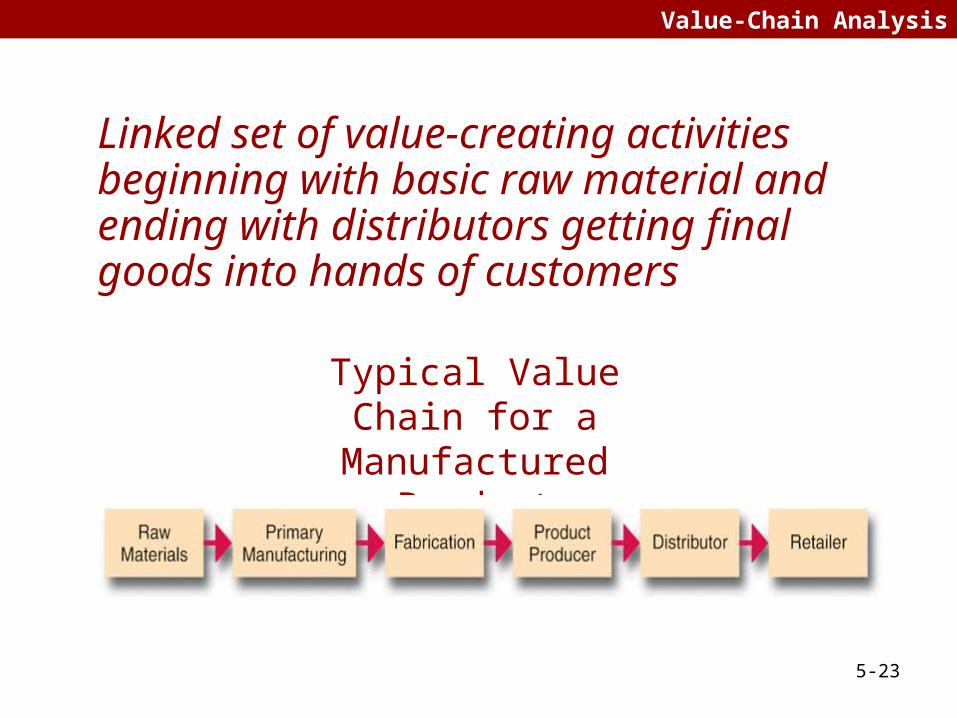
Typical Value Chain for a Manufactured Product
Linked set of value-creating activities beginning with basic raw material and ending with distributors getting final goods into hands of customers
5-24
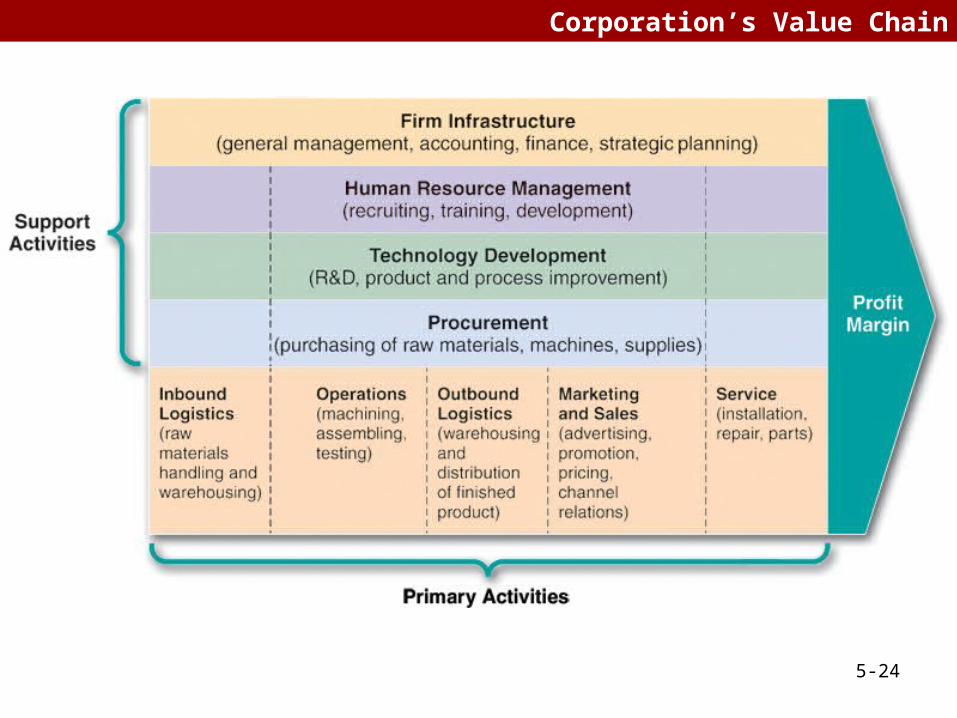
Corporation’s Value Chain
5-25
Scanning Functional Resources & Capabilities
Basic Organizational Structures --
–Simple structure–Functional structure–Divisional structure–Strategic business units (SBU’s)–Conglomerate structure

5-26
Basic Organizational Structures
5-27
Corporate Culture
Collection of beliefs, expectations, and values learned and shared by a corporation’s members and transmitted from one generation of employees to another
5-28
Strategic Marketing Issues
–Market Position & Segmentation–Marketing Mix–Product Life Cycle–Brand & Corporate Reputation
5-29
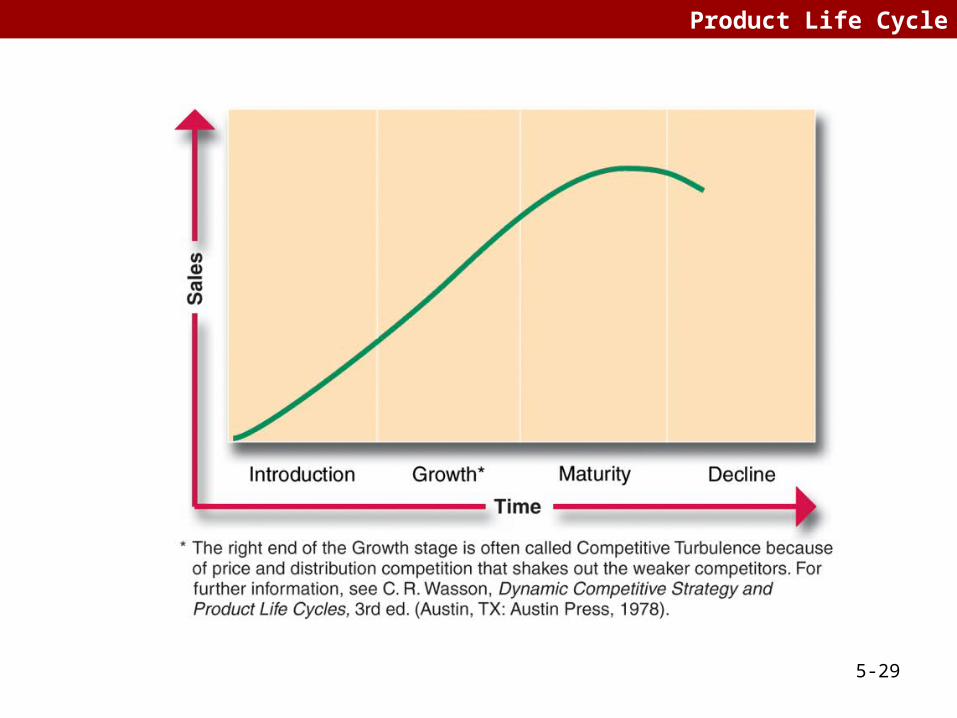
Product Life Cycle

5-30
Strategic Financial Issues
–Financial leverage
–Capital budgeting
5-31
Strategic Research & Development Issues
–R&D Intensity
–Technological Competence
–Technology Transfer

5-32
Technological Discontinuity
5-33
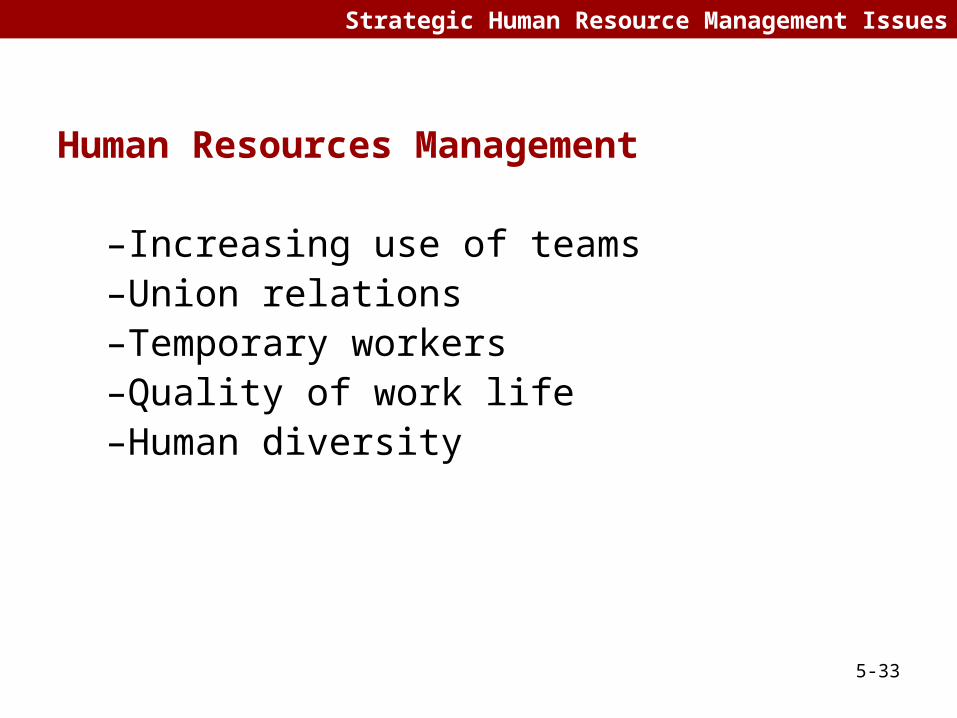
Strategic Human Resource Management Issues
Human Resources Management
–Increasing use of teams–Union relations –Temporary workers–Quality of work life–Human diversity
5-34
Internal Factor Analysis Summary Table