Embed Size (px)
Citation preview
1
Jun Chen1, 2
National Geomatics Center of China �NGCC�
2International Society for Photogrammetry and Remote
Sensing �ISPRS�
May12, 2017, Kunming
Contents
Role and Utilization
Introduction
GlobeLand30 as Example
Outlook

2
Geospatial Data for SDGs
A number of SDG indicators may be measured using
geospatial data and their integration with statistical data.
Obtaining reliable geospatial
data is becoming crucial for
preparing national reports and
global reporting.
Geospatial Data for SDGs
In principle, reliable geospatial data be collected by each member
nation with a set of technical requirements.(i.e., spatial resolutions, thematic accuracy and temporal periodicity)
Some countries may have a shortage of these core data, while some others
might lack the requisite data capture capacities.
Example of core geospatial data
���� ����� � � ���� ���

3
Contribution of International (Global) Data
One possible solution is to utilize international (global) data to
augment or even provide the data for certain SDG indicators
Examine possible contribution of international (global) data by
� Examine GlobeLand30 as an example
� Discuss the role and utilization
National data
� Official data products
generated by authoritative
agencies of a nation
� Covering the nation’s
territory
International (Global) Data
� Developed by international/national
organizations and private
companies
� Covering the whole earth or large
regions
Contents
Role and Utilization
Introduction
GlobeLand30 as Example
Outlook

4
2.1 GlobeLand30
1st 30-m earth land cover map with 10classes and
two years (2000,2010)
Chen et.al. 2015. Global land cover mapping at 30m resolution: a POK-based operational approach�ISPRS J. P&RS , 103 (2015): 7-27
www.GlobeLand30.org
Kunming

5
Kunming
����������
Shangri-La (香格里拉)

6
Dali (大理)
����������
��
��
1st Turning of Yangtze River (长江第一湾)
��
��
�� ! "#�$%&'&%( )%*&+�,&-./0

7
2.2 Accuracy Assessment
2010
Class User acc. Area % Total accur.
croplands 83.06% 0.1619
83.50%
10.18%
forest 89.00% 0.0174
grass 76.88% 0.2910
shrub 72.52% 0.0869
wetland 79.63% 0.0340
water 92.09% 0.0264
artificial 86.97% 0.0100
bareland 77.33% 0.1830
Ice 75.86% 0.0203
Region Map sheets samples
Asia 26 60165
Europe 6 12792
Africa 18 25656
America 25 45822
Oceanic 5 9635
Total 80 154070
Third-party experts selected more than 150,000 samples and
gave a global accuracy around 80%
Accuracy Assessment
regional Sample size accuracy Investigators sources
Water ,N. Europe 91% ETH/IIASA GIM, Dec., 2014
Country/area Accuracy Sources
Germany 92% Int. J Digital Earth, 2016(on line)
Greece(Thessaly Region ) 91% Land, 2015, 4,1-18
Iran(6 study sites ) 77.9% Habitat International,2016,1-7
Italy(8 areas) >80% Remote Sensing, 2015(7), 2107-2122
China 82.3% ISPRS J P&RS2 2017
Some other experts conducted national or regional
accuracy assessments

8
2.3 GlobeLand30’s Users
Globeland30 was donated to UN in Sept. 2014, New York,
by Chinese government, and has so far more than 6000
users from 120 countries
345 6789
Chen et.al., 2014, China: Open access to Earth land-cover map, Nature, 514:434, 23 Oct. 2014
Examples of International Users
� Over 260 agencies
� More than 300 Univ.(49 in Times TOP 100, 7 in TOP 10)
Users Name of Organizations
UN systemsFAO:UNEP:UNCCD:UN-Habitat:UNMIS:ESCAP:UN
Unit in Mali:UNESCO Islamabad,…
NGOWWF : TNC, The Nature Conservancy) : Conservation
International,…
GOV USGS:NASA:GSFC:USGS:European Commission,…
Research
institutes
JRC:DFZ: IIASA: INPE: Indian Institute of Science:
Space Research Institute of Ukraine:IERSD/NOA,…
Universities Harvard:Yale:Un. Maryland:Colombia Uni., …

9
2.4 Applications
1. Status and change analysis
2. Cause and consequence analysis
3. Coupling with Earth System Models
4. Generating new data sets
1) Status and change analysis
Statistical analysis of global artificial surface
Chen J, et al. 2015. Spatial distribution and ten years change of global built-up areas derived from
GlobeLand30. Acta Geodaetica et Vartographica Sinica, 44(11), 1181-1188.

10
Status and change analysis
Land use change in West Siberia
Kühling, I., et al. 2016. Spatio-temporal analysis of agricultural land-use intensity across the
Western Siberian grain belt. Science of the Total Environment, 544, 271-280
• Cropland (c) intensity for year i
• Grassland (g) intensity for year i
Land use intensity (LUI)
Spatial-temporal of LUI
•Decreasing intensity
on grassland (−0.015
LUI units per year)
• Intensification on
cropland (+0.014 LUI
units per year)
2) Cause and consequence analysis
Land use efficiency analysis: global divergence
Li R, et al., 2016. Spatio-temporal pattern analysis of artificial surface use efficiency based on
Globeland30. Scientia Sinica Terrae, 46: 1436–1445
Artificial surface area per capita
GDP per capita
Rich resource
Transition type
intensive use

11
Cause and consequence analysis
Urban expansion: intrinsic characteristics
Yu X, et al. 2016. A method characterizing urban expansion based on land cover map at 30 m
resolution. Science China Earth Sciences, 59: 1738–1744
Urban expansion
intensity index (UEII)
Peak
FWHM
Characteristics of urban
expansion
Goodness of fitting of cities
Cause and consequence analysis
Relationship between urban form and air quality
She Q, et al., 2017. Air quality and its response to satellite-derived urban form in the Yangtze
River Delta, China. Ecological Indicators, 75, 297-306.
Landscape metricsArtificial surface from GlobeLand30
Relationship between urban form and air quality

12
3) Coupling with Earth System Models
GlobeLand30 in climate model (BCC-CSM)
Shi X L, et al., 2016. Climate effects of the GlobeLand30 on the BCC climate model simulations.
Science China Earth Sciences, 59: 1754–1764
Convert GLC to climate model types Surface temperature difference simulated by 30m and 0.5;GLC
• With the new 30m LC data, the model biases between
simulations and observations in the BCC climate model
with original LC datasets were effectively reduced.
Coupling with Earth System Models
GlobeLand30 for SWAT model
Soil and Water Assessment Tool (SWAT) model
Water Yield Water Consumption
Sun, F., et al. 2016. Mapping water vulnerability of the Yangtze River Basin: 1994-2013.
Environment Management, 58:857-872.

13
4) Generating new data sets
Create integrated global land cover map
Tsendbazar et al., 2016, Integrating global land cover datasets for deriving user specific maps.
International Journal of Digital Earth
Globecover
LC-CCI
MODIS
GlobeLand30
Probability
multinomial
logistic
regression
Simple
kriging
Integration
Generating new data sets
Nepal land cover mapping and statistics
Cao X, et al. 2016. Land Cover Mapping and spatial pattern analysis with remote sensing in Nepal.
Journal of Geo-information Science, 18(10): 1384-1398.
Forest, Shrub, Grassland, Wetland, Cropland, Artificial surface, Snow/ice

14
Contents
Role and Utilization
Introduction
GlobeLand30 as Example
Outlook
National versus International (Global) Data
National data :generated by
national experts and can be expected
to be more accurate and have a
better thematic resolution than
global products.
International (Global) Data:may have higher consistency across
space, thereby allowing a better
comparability across countries and
easier data handling as a single
dataset.
Global data sets may
have some limitations ,
such as lower temporal
resolution and fewer
thematic classes.

15
3.1 Role of International (Global) Data
1) as Supplement to National Data: Global datasets with
relatively fine spatial resolution can offer a potential alternative
when reliable national data not available
It is also possible to integrate national and global data sets for more effective
SDGs monitoring, especially if the data have similar spatial resolutions
Role of International (Global) Data
Natural disasters, displaced
populations, environmental
change, water shortages,
pandemics, and widespread
malnutrition do not stop at
national borders or the water’s
edge.
2) Used for Trans-boundary or Cross-border areas: High quality
global data sets facilitate operations that cover the trans-
boundary or cross-border area
<=> ?>@A B=C D=> EDBC

16
Role of International (Global) Data
3) Supporting Global Reporting : Global data sets can serve as a
sound basis for supporting the preparation of global reporting.
Cao X, et al. 2014. Preliminary analysis of spatiotemporal pattern of global land
surface water. Science China: Earth Sciences, 57:2330–2339
3.2 Utilisation of International (Global) Data
There are several issues to be considered when selecting
suitable international (global) data sources for use in the
computation of SDG indicators and national reporting:
� Data quality
� Data conversion/ augmentation
� Scale and integration
� Measure issues
� Securing national ownership

17
4.1 Data Quality
Data quality refers to geometric, thematic accuracy, as well as
temporal aspects, and has significant influence on reliability of
measures for SDG indicators
It is necessary to conduct a thorough evaluation of the uncertainty of
the data before utilisation
SRTM DEM problems: data voids - radar shadows
4.2 Scaling and integration
Some data sets might not be in the appropriate scale for a
particular SDG indicator. � 1) Disaggregation: generate a dataset with a more refined thematic
content by combining global data and ancillary data sources.
Lu Nan, et al., Estimation of 30-m resolution population density for Shandong
Province, Acta Geodaetica et Cartographica Sinica, 2015,44(12)
GlobeLand30 DMSP/OLS 30-m population density
� 2) Aggregation : downscale high-resolution national and international
datasets into desirable scales. This process is also called generalization in
cartographic community.
18
4.3 Scaling and integration
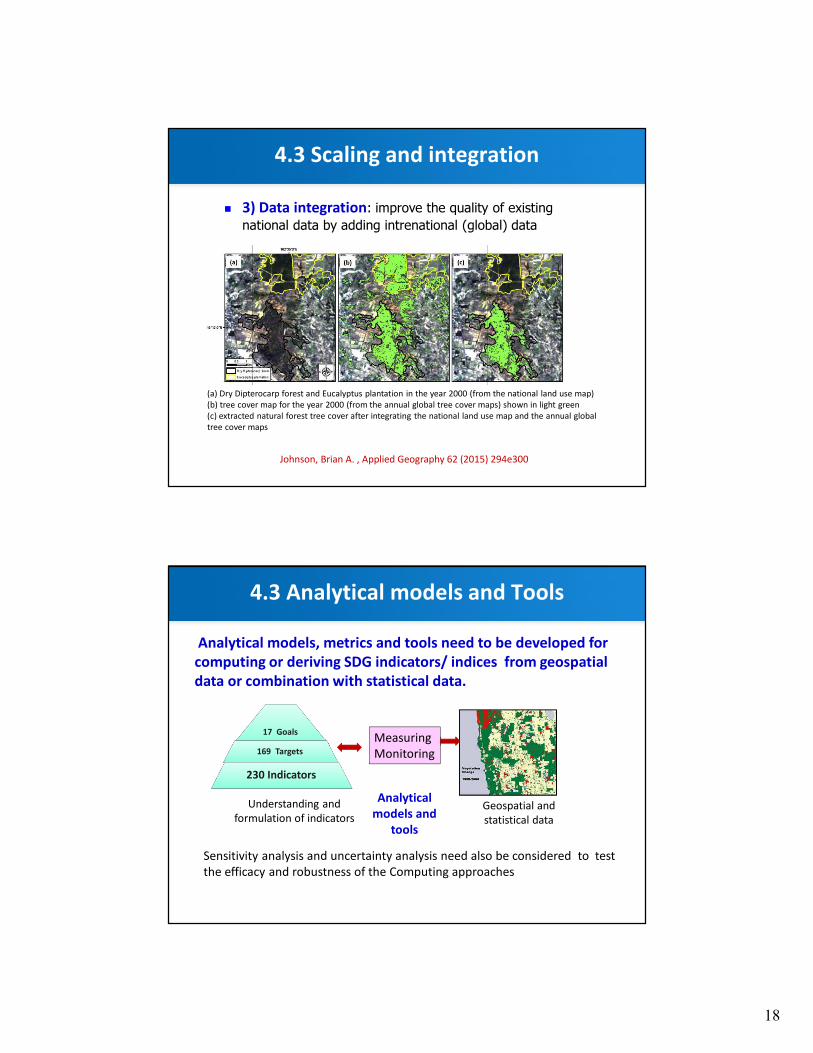
� 3) Data integration: improve the quality of existing
national data by adding intrenational (global) data
(a) Dry Dipterocarp forest and Eucalyptus plantation in the year 2000 (from the national land use map)
(b) tree cover map for the year 2000 (from the annual global tree cover maps) shown in light green
(c) extracted natural forest tree cover after integrating the national land use map and the annual global
tree cover maps
Johnson, Brian A. , Applied Geography 62 (2015) 294e300
4.3 Analytical models and Tools
Analytical models, metrics and tools need to be developed for
computing or deriving SDG indicators/ indices from geospatial
data or combination with statistical data.
Sensitivity analysis and uncertainty analysis need also be considered to test
the efficacy and robustness of the Computing approaches
Analytical
models and
tools
17 Goals
169 Targets
230 Indicators
Understanding and
formulation of indicators
Measuring
Monitoring
Geospatial and
statistical data

19
4.4 Securing national ownership
In cases of unavailability of national data sources, national
involvement needs to be secured in the information flow
� Encourage and support
national authorities to join
the validation and even
production of the
international (global) data
ASEAN(10 Countries), South Asia(8Countries), Central Asia (5 Countries),
Western Asia(15 Countries), Eastern Africa (18 Countries)
Develop GlobeLand30- 2015
Contents
Role and Utilization
Introduction
GlobeLand30 as Example
Outlook

20
5.1 Global Status Surveying
Topographic map is the most fundamental data, and a joint
survey was completed by UN-GGIM and ISPRS in 2015.
� Various scale ranges have greatly increased between 1986 and 2012
� 113 countries/regions
replied the UNGGIM-
ISPRS Questionnaire by
2015
[Konecny et al., 2015].
Global Topographic Mapping
Topographic map is the most fundamental data, and a joint
survey was completed by UN-GGIM and ISPRS in 2015.
A number of countries are capable of updating their national topographic data
at one- to two-year cycle, some other countries may be from 10 to 30 years old.
Estimated global coverage
� 30% for 1:25,000
topographic map
� 75% for 1:50 000
mapping.

21
Land Cover Data
Global land cover mapping has witnessed significant progress in
spatial and temporal resolutions, as well as thematic accuracy,
Product Spatial
resolution
Coverage of years Contents/ accuracy
GlobeLand30 30 m 2000, 2010 10 classes/ 80.3%
Global tree cover 30m Annual (2000-) One class(forest)/
ESA Land Cover
CCI
300m 1998-2002, 2003-2007 and
2008-2012
22 classes/ 74%(2008-
2012)
Global Land Cover data sets with fine resolution
DEM Data
DEM datasets have been collected at a global scale with the help
of earth observation sensors
Dowman, 2017, Digital Earth
Product Spacing Vertical
accuracy
Year Remarks
SRTM 30m/90m 10–15 m 2000 Generated by Shuttle IfSAR, covering 56FN to 60F
ASTER
GDEM
30m 7–14 m 2009-
2011
Generated by ASTER and gaps filled with SRTM
World
DEM
12m 2m (rel) 4m
(abs)
2014 Generated by TanDEM-X; DSM and DTM commercially
available at cost
ALOS
World 3D
30m 5 m 2016 Generated by LOS PRISM; freely available and based on
5 m global DEM which is available commercially at cost
Global DEM data sets available

22
Image Data
Another main data source is satellite imagery in many different
formats/resolutions and with often quite frequent updates.
Examples of free satellite dataSatellite Spatial resolution SDG
Landsat 8 � 15 meters/30 meters/100 meters
(panchromatic/multispectral/thermal)
� SDG-6: Water
� SDG-15: Forest
Sentinel 1 �Strip Map Mode: 80 km swath, 5 x 5 m
�Interferometric Wide Swath: 250 km swath, 5 x 20
m spatial
�Extra-Wide Swath Mode: 400 km swath, 20 x 40 m
spatial
�Wave-Mode: 20 x 20 km, 5 x 5 m spatial resolution.
� SDG-6: Water
� SDG-15: Forest
Sentinel 2 �13 spectral bands: four bands at 10 m, six bands at
20 m and three bands at 60 m spatial resolution.
The orbital swath width is 290 km.
� SDG-6: Water
� SDG-15: Forest
ZY
5.2 Collaborative Information Service
A ‘one-stop’ community-based collaborative information
service needs to be set up by connecting all available global,
regional and national geospatial data services.
� An implementation could be started developed from a collaborative
global land cover information service (CoGland).
Chen et al.,2017. Digital Earth
Service-Oriented Computing
Users UsersCoGland
Corine AfricaGlobeLand30Data USGS CDL
…
Download updatingBrowsing TaggingValidationStatistics Discovery

23
Questions and
comments?
Questions and
comments?


![1. k]π$Nr[ L°$ ]y$NÆr[ dp h p A¨[fd ° Apcpfu R>° · 3. dfZ ∆h__y¨ Ad©[ R>°. Mf°Mf iy¨ dfZ Mfpb gpN° R>° ? A°L$ fu[° rhQpfuA° [p° dfZ Mfpb _\u gpN[y¨. Ofdp¨ Ap`Zp¨](https://img.pdfslide.net/doc/110x75/5f0e6bc07e708231d43f297b/1-knr-l-ynr-dp-h-p-afd-apcpfu-r-3-dfz-ahy-ad.jpg)