Embed Size (px)
Citation preview
4-4 Functions, Tables, and Graphs
Course 2
Warm UpWarm Up
Problem of the DayProblem of the Day
Lesson PresentationLesson Presentation
Warm UpSolve.
1. x + 4 = 19
2. y – 2.3 = 7.8
3. 4z = 120
4. = 8
x = 15
y = 10.1
z = 30
Course 2
4-4 Functions, Tables, and Graphs
w9 w = 72
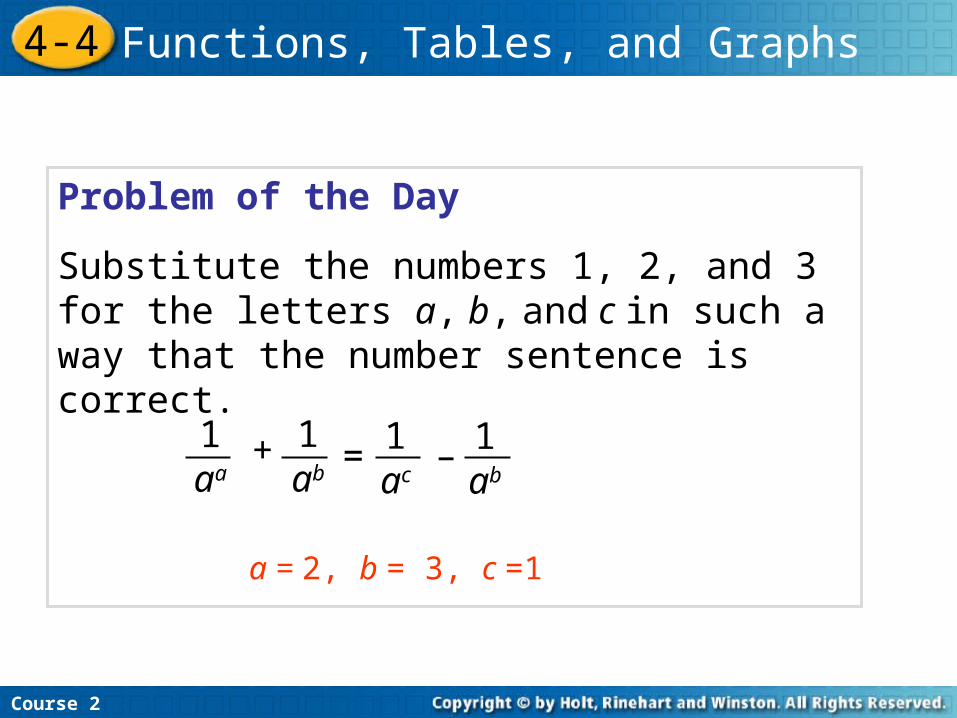
Problem of the Day
Substitute the numbers 1, 2, and 3 for the letters a, b, and c in such a way that the number sentence is correct.
a = 2, b = 3, c =1
1aa
+ 1ab = 1
ac
1ab
–
Course 2
4-4 Functions, Tables, and Graphs
Learn to use function tables to generate and graph ordered pairs.
Course 2
4-4 Functions, Tables, and Graphs

Vocabulary
function
input
output
Insert Lesson Title Here
Course 2
4-4 Functions, Tables, and Graphs
Rube Goldberg, a famous cartoonist, invented machines that perform ordinary tasks in extraordinary ways. Each machine operates according to a rule, or a set of steps, to produce a particular output.
In mathematics, a function operates according to a rule to produce exactly one output value for each input value. The input is the value substituted into the function. The output is the value that results from the substitution of a given input into the function.
Course 2
4-4 Functions, Tables, and Graphs
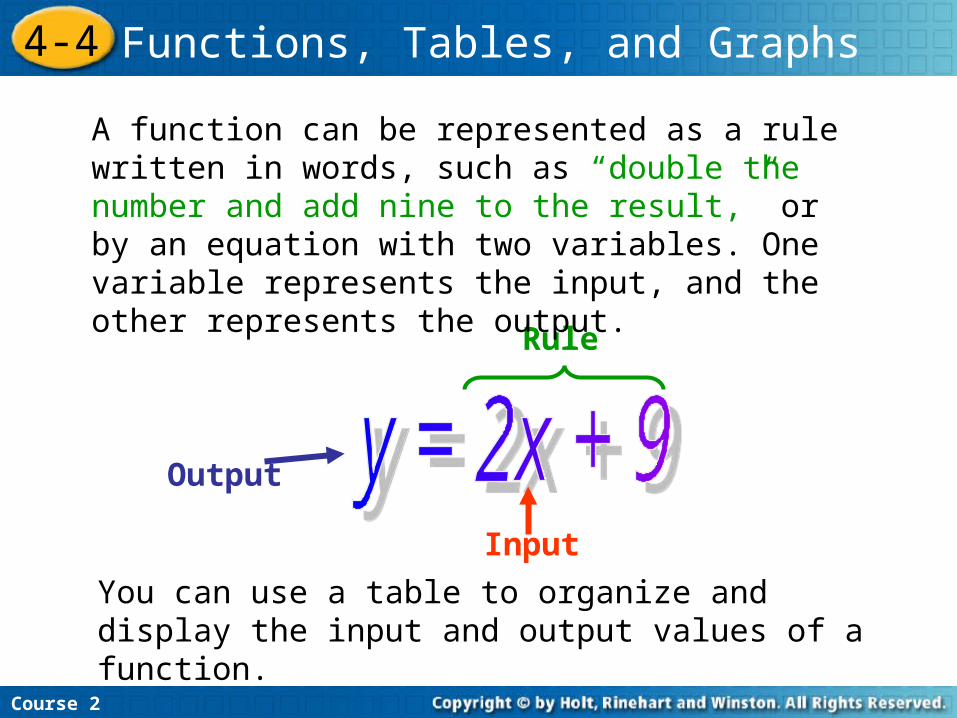
Rule
Output
Input
You can use a table to organize and display the input and output values of a function.
Course 2
4-4 Functions, Tables, and Graphs
A function can be represented as a rule written in words, such as “double the number and add nine to the result,” or by an equation with two variables. One variable represents the input, and the other represents the output.
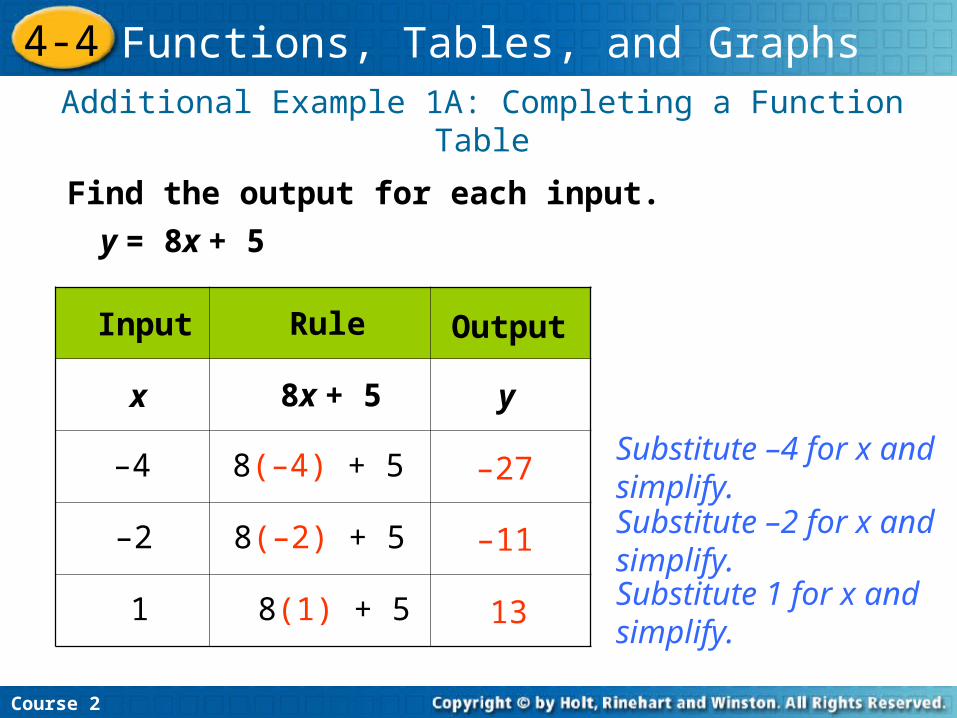
Additional Example 1A: Completing a Function Table
Substitute –4 for x and simplify.Substitute –2 for x and simplify.Substitute 1 for x and simplify.
Find the output for each input.
Input
y = 8x + 5
Rule Output
x 8x + 5 y
–4
–2
1
8(–4) + 5
8(–2) + 5
8(1) + 5
–27
–11
13
Course 2
4-4 Functions, Tables, and Graphs
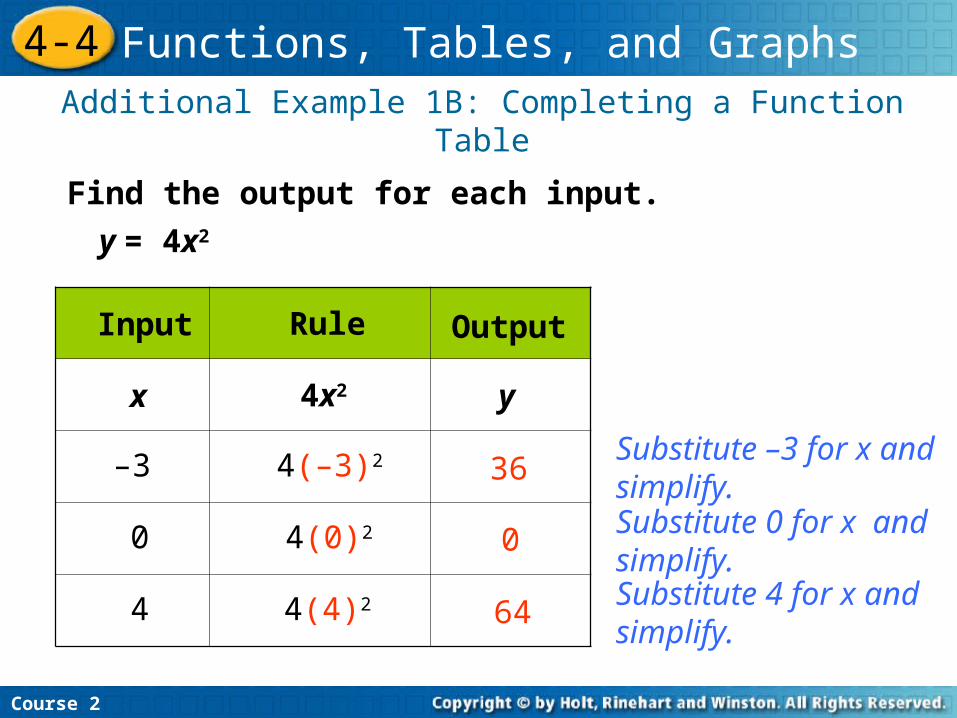
Additional Example 1B: Completing a Function Table
Substitute –3 for x and simplify.Substitute 0 for x and simplify.Substitute 4 for x and simplify.
Find the output for each input.
Input
y = 4x2
Rule Output
x 4x2 y
–3
0
4
4(–3)2
4(0)2
4(4)2
36
0
64
Course 2
4-4 Functions, Tables, and Graphs

Check It Out: Example 1A
Substitute –6 for x and simplify.Substitute –3 for x and simplify.Substitute 3 for x and simplify.
Find the output for each input.
Input
y = 5x + 3
Rule Output
x 5x + 3 y
–6
–3
3
5(–6) + 3
5(–3) + 3
5(3) + 3
–27
–12
18
Course 2
4-4 Functions, Tables, and Graphs

Check It Out: Example 1B
Substitute –2 for x and simplify.Substitute 0 for x and simplify.Substitute 5 for x and simplify.
Find the output for each input.
Input
y = 3x2
Rule Output
x 3x2 y
–2
0
5
3(–2)2
3(0)2
3(5)2
12
0
75
Course 2
4-4 Functions, Tables, and Graphs
An ordered pair is a pair of numbers that represents a point on a graph.
Remember!
You can also use a graph to represent afunction. The corresponding input and output values together form unique ordered pairs.
Course 2
4-4 Functions, Tables, and Graphs

When writing an ordered pair, write the input value first and then the output value.
Helpful Hint
Course 2
4-4 Functions, Tables, and Graphs
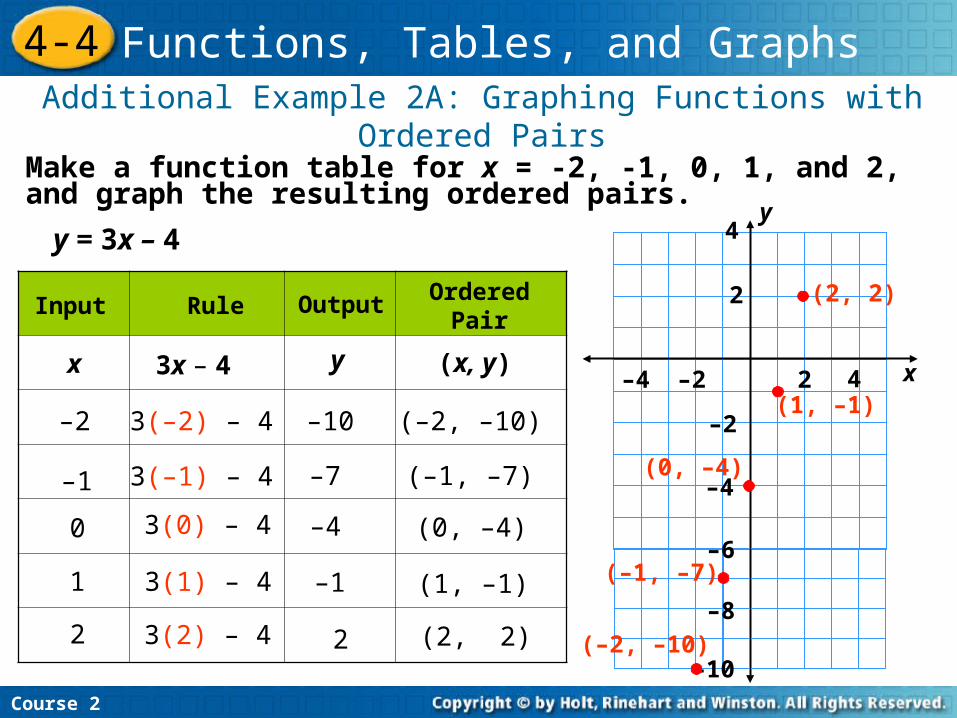
Make a function table for x = -2, -1, 0, 1, and 2, and graph the resulting ordered pairs.
Additional Example 2A: Graphing Functions with Ordered Pairs
x
y
RuleInput Output OrderedPair
3(–2) – 4
x 3x – 4 y
(–2, –10)
2
4
–2
–1
0
1
2
3(–1) – 4
3(0) – 4
3(1) – 4
3(2) – 4
–10
–7
–4
–1
2
(–1, –7)
(0, –4)
(1, –1)
(2, 2)
(x, y)2 4–2
–2
–4
–10
–6
–8
–4
y = 3x – 4
(–2, –10)
(–1, –7)
(0, –4)
(1, –1)
(2, 2)
Course 2
4-4 Functions, Tables, and Graphs
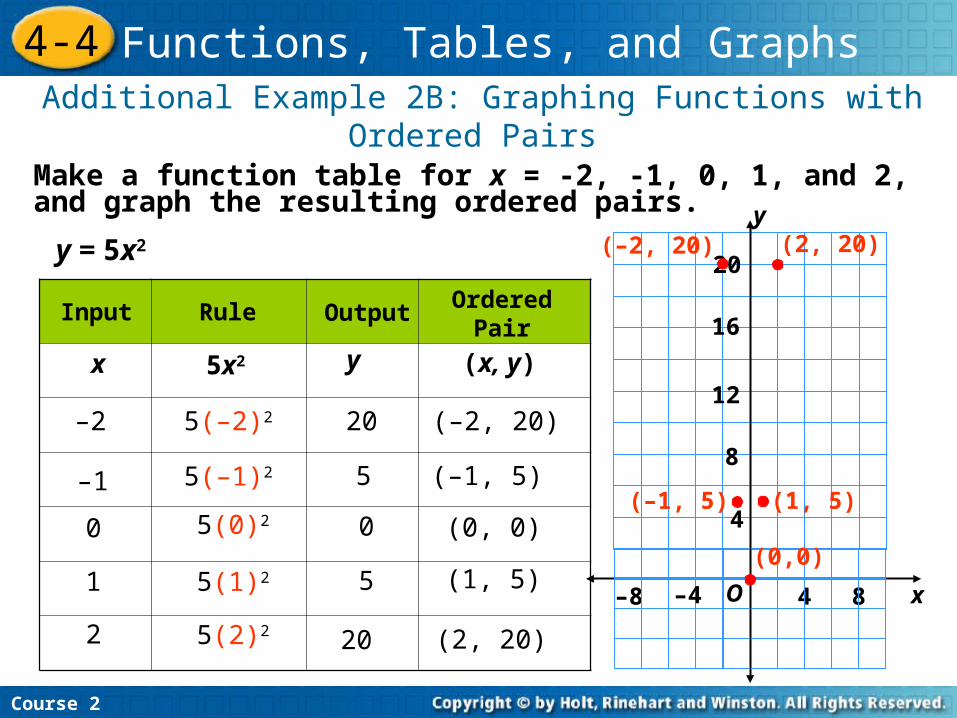
Additional Example 2B: Graphing Functions with Ordered Pairs
y = 5x2
Make a function table for x = -2, -1, 0, 1, and 2, and graph the resulting ordered pairs.
RuleInput Output OrderedPair
5(–2)2
x 5x2 y
(–2, 20)–2
–1
0
1
2
5(–1)2
5(0)2
5(1)2
5(2)2
20
5
0
5
20
(–1, 5)
(0, 0)
(1, 5)
(2, 20)
(x, y)
x
16
20
4 8–8
12
8
O
4
–4
(0,0)
(–1, 5) (1, 5)
(2, 20)y
(–2, 20)
Course 2
4-4 Functions, Tables, and Graphs
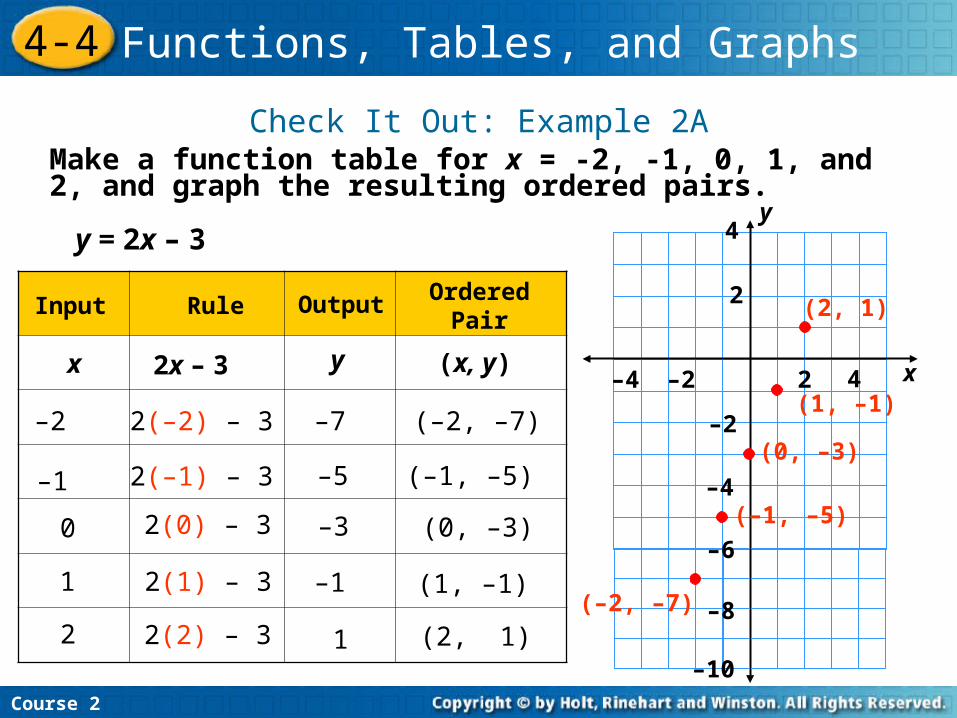
Make a function table for x = -2, -1, 0, 1, and 2, and graph the resulting ordered pairs.
x
y
RuleInput Output OrderedPair
2(–2) – 3
x 2x – 3 y
(–2, –7)
2
4
–2
–1
0
1
2
2(–1) – 3
2(0) – 3
2(1) – 3
2(2) – 3
–7
–5
–3
–1
1
(–1, –5)
(0, –3)
(1, –1)
(2, 1)
(x, y)2 4–2
–2
–4
–10
–6
–8
–4
y = 2x – 3
(–2, –7)
(–1, –5)
(0, –3)
(1, –1)
(2, 1)
Check It Out: Example 2A
Course 2
4-4 Functions, Tables, and Graphs
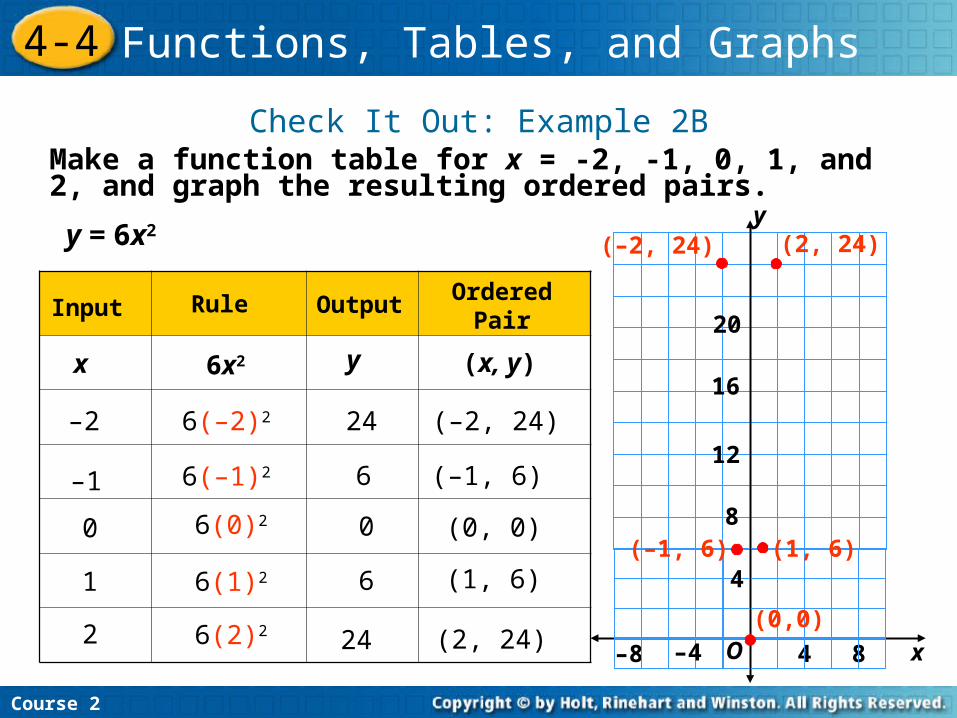
y = 6x2
Make a function table for x = -2, -1, 0, 1, and 2, and graph the resulting ordered pairs.
RuleInput Output OrderedPair
6(–2)2
x 6x2 y
(–2, 24)–2
–1
0
1
2
6(–1)2
6(0)2
6(1)2
6(2)2
24
6
0
6
24
(–1, 6)
(0, 0)
(1, 6)
(2, 24)
(x, y)
x
16
20
4 8–8
12
8
O
4
–4(0,0)
(–1, 6) (1, 6)
(2, 24)y
(–2, 24)
Check It Out: Example 2B
Course 2
4-4 Functions, Tables, and Graphs
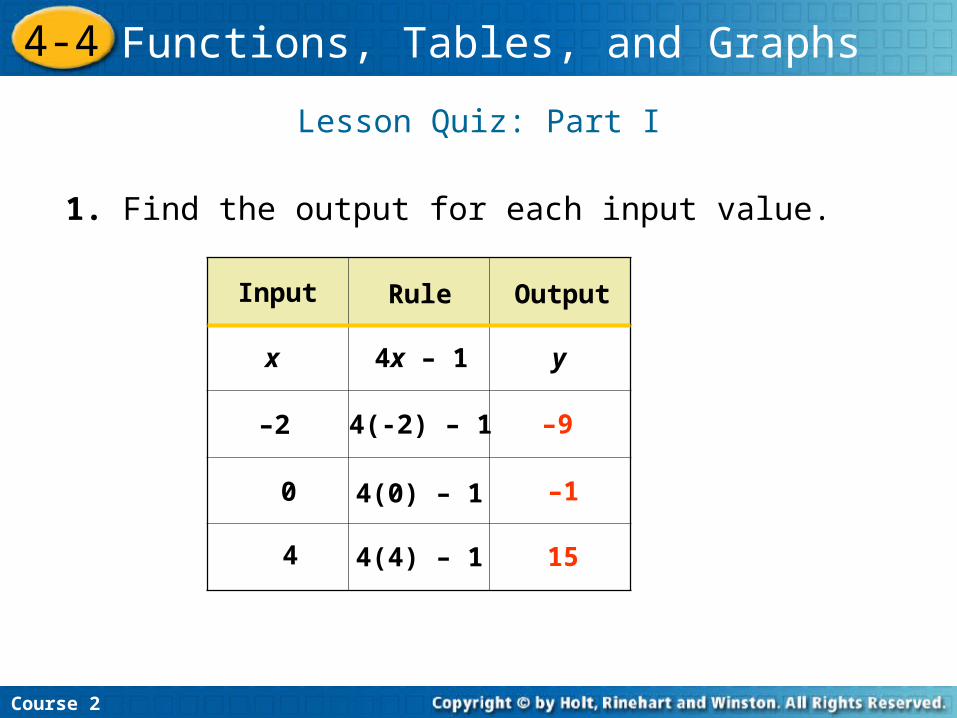
Lesson Quiz: Part I
1. Find the output for each input value.
Insert Lesson Title Here
Input Rule Output
4x – 1 yx
–2
0
4
–9
–1
15
Course 2
4-4 Functions, Tables, and Graphs
4(-2) – 1
4(0) – 1
4(4) – 1
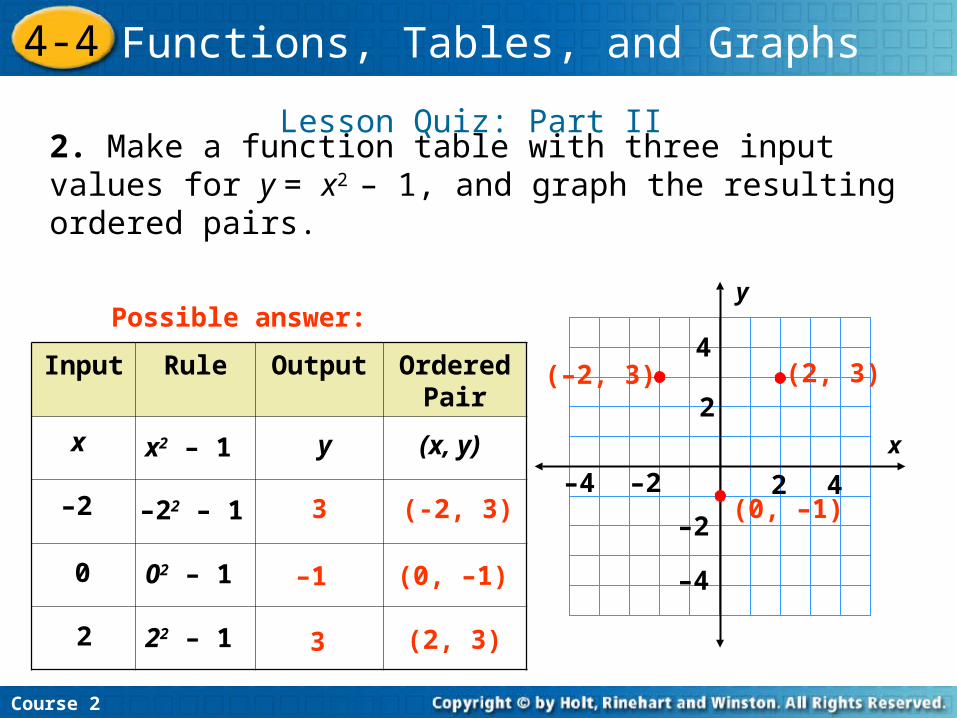
Lesson Quiz: Part II2. Make a function table with three input values for y = x2 – 1, and graph the resulting ordered pairs.
Insert Lesson Title Here
Possible answer:
x
y
–2
–2
2
2–4
–4
4
4(–2, 3) (2, 3)
(0, –1)
Course 2
4-4 Functions, Tables, and Graphs
Input Rule Output Ordered Pair
x2 – 1 yx
–2
0
2
3
–1
322 – 1
–22 – 1
02 – 1
(x, y)
(-2, 3)
(0, –1)
(2, 3)