Embed Size (px)
Citation preview

______________________________________________________________________
58
4 A New Microscopic Technique for Quantitative
Analysis of Paper Structure at the Fibre Level
4.1 Introduction
Chapter 2 has reviewed how researchers have attempted to describe the strength
properties of paper in terms of the structural properties of the fibre network and the
mechanical properties of the fibres (Cox 1952; Page 1969; Kallmes 1977). Fibre
dimensions and 3-dimensional orientation have been shown to be very important for
paper strength in these studies. However, no technique is available to obtain
quantitative data of fibre dimensions and this 3-dimensional orientation in situ to fully
verify these network models. In recent studies on the paper mechanics, it has also been
shown that better understanding of the structure of paper at the fibre level is required.
This project starts from analysis of paper structure as the basis for development of a
new model for the tensile strength of paper.
It is essential to expose and image the internal structure of paper for structure analysis
and many techniques have been used for doing this. The most commonly used
technique to expose internal structure is thin sectioning (microtomy). Some examples
of the successful use of thin sectioning to study paper structure, using both transmitted
light and electron microscopy are given in references (Page 1965; Quackenbush 1971;
Nanko 1989; Szikla 1989). The main problem of thin sectioning is that the sample
structure can be distorted during mechanical sectioning. Its use for quantitative analysis
of paper structure is therefore problematical.
Williams et al (Williams 1994) and Williams and Drummond (Williams 2000) recently
developed a new technique in which samples were embedded in resin and the cross-
sections of the samples were then exposed by grinding the block surface using
progressively finer abrasive papers. In order to get proper topographic contrast for
scanning electron microscope (SEM) viewing, chemicals were used to etch away a layer
of the supporting resin from the block surface. The Williams et al technique avoids
exposing the sample to the compressive and shear forces developed during the thin
sectioning. However, great care must be taken during surface resin removal with

Chapter 4 A New Microscopic Technique for Quantitative Analysis of Paper Structure
at the Fibre Level
______________________________________________________________________
______________________________________________________________________ 59
chemicals to avoid swelling of the exposed fibres and paper surface. In addition to this,
the SEM can only obtain the image of the cross-sectional surface, and this may not be
free of artifacts of sample preparation. Using this technique, Forseth and Helle (Forseth
1997) quantified the change in fibre lumen area in paper during moistening. In their
study, only fibres cut more or less parallel to the fibre length direction were measured to
prevent overestimation of the fibre wall thickness.
Confocal laser scanning microscopy has been commonly used in qualitative analysis of
paper structure in recent years (Li 1997; Moss 1997; Ting 1997). The major feature of
the CLSM is its optical sectioning capability, which can be used to obtain three-
dimensional images of fibre and paper non-destructively. However, the signal intensity
diminishes rapidly with increasing depth in the sample (Li 1999). Therefore these
studies, which looked through the in-plane surface of the samples, could not obtain a
complete view of a sheet cross-section. (Li 1997; Moss 1997; Ting 1997).
More recently, Dickson (Dickson 2000a; Dickson 2000b) conducted successful
quantitative analysis of paper cross-sections using a combination of the sample
preparation technique developed by Williams and Drummond (Williams 2000) and the
confocal laser scanning microscopy technique. Complete cross-sections of paper were
imaged with CLSM just below the cross-sectional surface to avoid the artifacts on the
surface (Dickson 2000a). Dickson quantified the profile properties of the paper cross-
section including the wall area, the total pore area, interfibre pore area and lumen area.
The dimensions of individual fibres in the sheet were not measured in any of these
studies.
Fibre orientation has often been measured by tracing a fraction of dyed fibres in a sheet
(Perkins 1981; Rigdahl 1983). The fibre orientation measured by this technique is the
in-plane orientation and the fibres traced are always limited to the paper surface.
Another technique is to split a sheet into thin, transparent layers and then measure the
fibre orientation with image analysis in all these layers (Erikkila 1998). This technique
allows the in-plane fibre orientation in different layers to be measured but not the out-
of-plane fibre orientation. A more accurate and relatively easy technique is still required
for measurement of overall fibre orientation.

Chapter 4 A New Microscopic Technique for Quantitative Analysis of Paper Structure
at the Fibre Level
______________________________________________________________________
______________________________________________________________________ 60
In this chapter, we present a new method for quantifying paper structure. The
dimensions and orientations of individual fibres in a sheet are measured simultaneously
using a combination of resin embedding and confocal laser scanning microscopy. This
is the first technique that can simultaneously obtain all this information directly in situ.
Based on this technique, we further developed a technique for measuring the properties
of fibre-fibre contacts including the nature of fibre contact, the number of fibre-fibre
contacts, the length of free fibre segment and the out-of-plane angle of each free fibre
segment. This work is presented in Chapter 7. This is also the first technique that can
simultaneously measure all these quantities directly in paper.
4.2 Basic idea of the new technique
The basic idea of this new technique is to examine the individual fibres in paper directly
by using a confocal microscope. Paper samples were arranged vertically and embedded
in resin. The sample cross-section was exposed by grinding the resin block with
abrasive paper. It is critically important that the sample is thoroughly penetrated by the
resin to provide sufficient support to the paper structure. Once quality images of the
paper cross-section was obtained, measurement of fibre dimensions, fibre orientation
and fibre-fibre contacts was carried out in these images by using different macros
written in the commercial software package Optimas 6.1.
4.3 Experimental equipment and methods
4.3.1 Confocal microscope
A confocal laser scanning microscope (CLSM) was used to measure the cross-sectional
dimensions of fibres on glass slides and in paper. The CLSM used in this project was
the Optiscan F900e that was fitted to an Olympus BH2 optical microscope. The CLSM
can operate in either reflectance or fluorescence mode. In reflectance mode the image is
the light that has been reflected from the sample while in fluorescence mode,
fluorescence excited by the incident laser beam is detected. To use the fluorescence

Chapter 4 A New Microscopic Technique for Quantitative Analysis of Paper Structure
at the Fibre Level
______________________________________________________________________
______________________________________________________________________ 61
mode, the sample must either be naturally fluorescent or fluorescent dye must be added.
This mode was used for all of the confocal work presented in this thesis.
The Optiscan F900e uses an optic fibre to deliver the laser light through the optic
system of the microscope and to collect the light signal from the excited fluorescent dye
contained in the fibres.
Figure 4-1 schematically shows the principle of the confocal microscope. The laser
used was an Argon-Ion laser operating at a wavelength of 480nm. The signal from the
excited fluorescent dye is passed back through the optical path and through a small
aperture, the confocal pinhole, before reaching an electronic detector or photo-multiplier
tube (PMT). The PMT converts the light into a digital image displayed on a computer
monitor. Because of the confocal pinhole, only light returning from on or very near the
focal plane is permitted to pass through to the PMT. Light returning from other than the
specific optical plane is blocked. This process creates an extremely thin optical section
that can be positioned within a specimen to potentially provide a sharp image with a
significantly higher resolution than a conventional microscope.
For optimum performance in the confocal microscopy, it is necessary to keep to a
minimum, the degree of refractive index mismatch between the object being
investigated and its surrounding medium. If there is a large refractive index mismatch
between the fibres then the refraction of light from irregular surfaces in the object will
cause lower levels of signal to be sent back to the PMT, something that will affect the
image quality. This will be compounded when attempting to obtain images below the
sample surface (scanning inside the sample). Therefore, full saturation of the fibre
samples with oil of similar refractive index (RI) and removal of the air trapped in the
fibres are essential for obtaining quality images. The immersion oil used had an RI of
1.51. It was specially designed for oil objective lenses.

Chapter 4 A New Microscopic Technique for Quantitative Analysis of Paper Structure
at the Fibre Level
______________________________________________________________________
______________________________________________________________________ 62
Figure 4-1 Schematic showing the basic principle of the optical system of the
Optiscan F900e system (From Optiscan Pty Ltd)
4.3.2 Sample preparation
Recycled pulp of commercial plaster line board and laboratory made never dried radiata
pine kraft pulp (kappa no. 95) (refer to Appendix A for details of these pulp) were used
in the experiments for development and validation of the new technique.
4.3.2.1 Staining of pulp fibres and handsheet formation
The fibres were stained in a stock divider at a consistency of 1.5 % prior to handsheet
formation. The dye (Acridine Orange) was added at a rate of 0.0005% w/w water.
From each pulp, three sets of square handsheets were made on a Moving Belt Sheet
Former (Xu and Parker 2000). Each set of the handsheets from each pulp were pressed
dynamically using the Sheet Roll Press at one of three pressing levels, viz P1, P2 and P3
(see Subsection 5.2.1). The handsheets made from the recycled pulp were denoted as
R0, RL and RH, and those made from the kraft pulp were denoted correspondingly as
Kp0, KpL and KpH.

Chapter 4 A New Microscopic Technique for Quantitative Analysis of Paper Structure
at the Fibre Level
______________________________________________________________________
______________________________________________________________________ 63
4.3.2.2 Sample embedding – Initial technique
The sample embedding technique presented in this subsection was used only at the
beginning of the project when the new microscopic technique was verified. It was
found that it could be improved during verification of the new technique. The improved
technique will be discussed in the next subsection.
The resin used for sample embedding was Epofix (from (Struers)). This resin met the
following criteria:
a. no reaction with fibres
b. good penetration into the fibres
c. refractive index of the resin block is 1.57, which is close to the fibre refractive index
1.53.
Samples were first placed directly in 100% resin and degassed overnight so that the
resin could penetrate into the paper structure and expel gas in the paper. The samples
were then taken out of the resin and put on a plate for about 5 minutes to allow the resin
at the sample surfaces to drain away. The samples were then put into a plastic mould,
and a pre-degassed mixture of resin and hardener (15 parts of resin and 2 parts of
hardener) was poured into the mould and the whole sample was put into a vacuum
apparatus and left until the resin cured into block. It is very important to ensure that all
gas is removed from the samples and the internal structure of the paper is thoroughly
penetrated by the mixture of resin and hardener. The cross-sections of the samples were
then exposed by abrading the block surface with a range of abrasive papers of
decreasing roughness (P400, P600, P800 P1200, P1500 and P2400). Figure 4-2 shows
an embedded sample ready for examination in the confocal microscope.
4.3.2.3 Sample embedding – improved technique
As will be discussed later in this chapter, the embedding technique outlined in the above
subsection may not provide a thorough penetration of the resin and hardener mixture
into the sample structure. A new rig, a vacuum impregnation apparatus, as illustrated in

Chapter 4 A New Microscopic Technique for Quantitative Analysis of Paper Structure
at the Fibre Level
______________________________________________________________________
______________________________________________________________________ 64
Figure 4-3, was designed and used to improve the sample embedding technique. The
improved technique was used in the subsequent experimental work.
Figure 4-2 Embedded sample ready for examination in confocal microscope
The pre-cut sample was vertically put into the mould. The sample and the mould were
then put into the container. Valve 2 is closed and valve 1 is opened. The vacuum is
applied for at least for 4 hours to first remove air trapped in the sample structure. Then
valve 1 is closed and valve 2 is opened to suck the resin and hardener mixture into the
mould. A vacuum impregnation is created with this procedure, which can provide a
thorough penetration of the mixture into the sample structure. When enough resin
mixture has been sucked into the mould, valve 2 is closed and valve 1 is opened to
apply vacuum to the whole system for at least another 4 hours to further remove air in
the sample and the resin mixture.

Chapter 4 A New Microscopic Technique for Quantitative Analysis of Paper Structure
at the Fibre Level
______________________________________________________________________
______________________________________________________________________ 65
Connect to avacuum pump Suck in resin
Material isPerspex
15cm
15cm
Valve#1
Connect to avacuum pump Suck in resin
Valve#2
Figure 4-3 Schematic drawing of the vacuum impregnation apparatus
4.4 Quantitative analysis of paper structure
4.4.1 Measurements of fibre orientation and shape
4.4.1.1 Imaging and image analysis
Imaging was performed with the Optiscan C900e confocal laser scanning microscope
using a 60×oil immersion lens (see Figure 4-4). The inspection area of each image
frame was 100×100 µm with a resolution of 512×512 pixels.
For each region of interest, a group of images of the region was captured at different
depths from the cross-sectional surface. Fifty groups of cross-sectional images of each
sample were captured and processed for measurement of fibre orientation and fibre
cross-sectional dimensions. A typical group of cross-sectional images of the paper is
given in Figure 4-5. The images shown in Figure 4-5 were obtained using the initial
embedding technique as discussed in subsection 4.3.2.2. The data used for verification
of the new technique in this chapter were measured in images of samples embedded
using the initial embedding technique. In the rest of the project, the improved
embedding technique was used for sample preparation. The image with 0-depth was

Chapter 4 A New Microscopic Technique for Quantitative Analysis of Paper Structure
at the Fibre Level
______________________________________________________________________
______________________________________________________________________ 66
captured just below the exposed surface of the sample. The depths of the other images
are measured with respect to the 0-depth image. It can be seen that the image brightness
decreases with increasing depth. The maximum scanning depth used in this study was
10µm. Scanning deeper led to a rapid deterioration of image quality.
Figure 4-4 Picture showing a sample on the stage of a confocal microscope
Figure 4-5 Cross-sectional images of paper acquired at depth of 0, 4, 8 and 10µm
(for the explanation of the depth see text).
Fibre 1 Fibre 1
Fibre 1 Fibre 2 Fibre 1
Fibre 2
Fibre 2 Fibre 2
*the scale bar is 10µm
0µm depth
8µm depth 10µm depth
4µm depth

Chapter 4 A New Microscopic Technique for Quantitative Analysis of Paper Structure
at the Fibre Level
______________________________________________________________________
______________________________________________________________________ 67
The image analysis was conducted using the commercial image analysis software
(OPTIMAS 6.1). The analysis sequence used was: 1) select a region of interest; 2)
smooth the image with a 3×3 Gaussian filter; 3) adjust the threshold level; and 4) extract
features including fibre wall area, mass centre of fibre cross-sectional area, fibre width
( wD ) and fibre hight ( hD ). A macro was written in the software for performing the
above process automatically (see Appendix D). The boundary of a fibre was identified
by manually adjusting the threshold. For those fibres that touched each other, a line was
drawn between them to separate the fibres but keep the features of the fibre of interest
unchanged. The following subsections discuss the quantities of paper structure were
measured directly in the paper cross-section by using the new microscopic technique.
Some of the quantities are defined for the first time in this project.
4.4.1.2 Fibre orientation
Fibre orientation was measured by following the positions of individual fibres in sheet
cross-sections scanned at 0µm depth and 10µm depth. The position of the mass centre
of the fibre cross-section was determined by the distance from the mass centre to a
reference point in the Y and Z directions. As shown in Figure 4.6, the mass centre of
the fibre cross-section in the 0-depth image is (Y1, Z1), and in the 10µm depth image is
(Y2, Z2). The angle θ that the fibre makes to the X direction (the plane of the paper) can
then be calculated from geometry. For example, in Figure 4-5, the position of fibre 1
has no apparent change when scanning down from 0-depth inside the sample to 10µm
deep. This indicates fibre 1 is almost perpendicular to the exposed surface. However,
the position of fibre 2 shifts markedly indicating that fibre 2 sits at an angle other than
90o to the exposed surface of the sample.

Chapter 4 A New Microscopic Technique for Quantitative Analysis of Paper Structure
at the Fibre Level
______________________________________________________________________
______________________________________________________________________ 68
Figure 4-6 Depiction of Measurement of fibre orientation in paper.
4.4.1.3 Fibre in and out of plane angle
The fibre orientation angle, θ , measured by using the above method is the overall
angle. As shown in Figure 4-6, if needed the out of plane angle (the Z-angle), and the
in-plane angle (the Y-angle) can also be calculated from geometry.
4.4.1.4 Fibre wall area
For the work in this Chapter, the wall areas of fibres from both pulps were measured
from both the 0µm and 4µm depth images. In the rest of the project, when the
improved sample embedding technique was used, the fibre dimensions were measured
in images acquired just below the sample surface. If the fibre is not perpendicular to the
paper cross-section, the wall area will be enlarged by a factor of θcos/1 . The
measured wall area of each individual fibre has been corrected by this factor.
The fibre wall areas of the two pulps were also measured on freely dried fibres on glass
sides using the confocal laser scanning microscope following a procedure described by
(Xu, Conn et al. 1998). Details of sample preparation and image analysis for this
measurement is given in Appendix B. These results were compared with the fibre wall
areas measured in situ on fibres in paper sheets for the purpose of verification of the
new technique.
Z
Z2
Y1
Y2
Z1
The second
image (10µm
from the top
image)
The first image (0µm) Fibre Y O1
O2
X
θ
Z-angle Y-angle

Chapter 4 A New Microscopic Technique for Quantitative Analysis of Paper Structure
at the Fibre Level
______________________________________________________________________
______________________________________________________________________ 69
4.4.1.5 Fill factor, Shape factor and twist angle
As discussed in Chapter 3, the fill factor is defined for the purpose of modelling the
structure of paper. The fill factor, hf , is defined as the ratio of the fibre wall area, fA ,
to the area of the smallest rectangle bounding box, bfA , that can completely enclose the
irregular shape of the fibre and with its one side parallel to the paper plane (see Figure
3-3). The fill factor was calculated by the measured fibre wall area divided by the area
of the rectangular bonding box for each individual fibre. The rectangular bonding box
was generated automatically by running the macro (refer to Appendix D).
In order to quantify the degree of fibre collapse, an additional shape factor is defined.
As shown in Figure 4-7, the shape factor, mf , is defined as the ratio of the fibre wall
area, fA , to the area of the smallest rectangular bounding box, bmA , that can
completely enclose the irregular shape of the fibre. The two axes of the rectangular box
are then defined as the major and minor axes of the fibre cross-section. When the fibre
is in a cross-section of paper, the angle between the major axis of the fibre and the paper
plane is defined as the twist angle of the fibre cross-section.
Figure 4-7 Definition of the fibre shape factor and twist angle
In order to measure mf and the twist angle, β , we need firstly to create the smallest
rectangle that encloses the irregular shape of the fibre. In practice, it is difficult to
calculate this smallest rectangle. The bounding box used in this study was a rectangle
with its major axis parallel and equal in length to the longest dimension of the fibre
cross-section. For most types of fibre shape this bounding box is very similar to the
Paper plane
major axis
β twist angle
Dws
Dhs fibre wall area
minor axis Z (thickness)
direction of the
sample
Bounding box for the shape
factor
Bounding box for the fill
factor
Dwf
Dhf

Chapter 4 A New Microscopic Technique for Quantitative Analysis of Paper Structure
at the Fibre Level
______________________________________________________________________
______________________________________________________________________ 70
smallest rectangle in the definition of mf . The measurement error is significant only for
square shaped fibres. However, the square shaped fibres were rare in the pulp used in
this study and were discarded during measurement. The percentage of the fibres been
discarded for the particular samples will be given in Chapter 6.
The twist angle used was the measured angle between the longest dimension of the fibre
cross-section and the horizontal frame of the image. This reference direction has to be
used because the position of the paper plane is unknown during the measurement.
However, if the horizontal frame of the image is at an angle α− to the paper plane, then
it can be shown that, for a randomly oriented handsheet, αβ = . We estimated the angle
α by averaging the measured twist angles. The twist angle was also corrected by the
angle, θ , that the fibre is sitting to the surface of the paper cross-section. If the fibre
length axis is not perpendicular to the paper cross-section, then one axis of the fibre
image will be lengthened by a factor of θcos/1 . Thus unless 0=β , this distortion of
one axis will cause an error in the measured value of β . It can be shown from
geometry that the true angle β is given by )cossinarcsin(
θββ m= , where mβ is the
measured twist angle. All measured twist angles were first corrected by the angle α
and then by the angle θ using the above formula.
4.4.2 Measurement of fibre-fibre contacts
The measured parameters associated with the fibre-fibre contacts included the nature of
fibre contact, the number of fibre-fibre contacts, the lengths of the free fibre segments
and the out-of-plane angle of each free fibre segment. These parameters were measured
directly in images of paper cross-sections. For each sample, 70 frames of cross-
sectional images were obtained consecutively along the sample cross-section using the
confocal laser-scanning microscope and the 60x oil-immersion lens. The inspection
area of each image was 200x200µm2, and the resolution was 512x512 pixels. The 70
images were then joined together in consecutive order during the measurements,
therefore a 14mm length of the sample cross-section was imaged in this way. Some
fibres or fibre segments in the sample cross-section were imaged along their long axes.

Chapter 4 A New Microscopic Technique for Quantitative Analysis of Paper Structure
at the Fibre Level
______________________________________________________________________
______________________________________________________________________ 71
These fibres were chosen as the fibre of interest for the measurements of fibre-fibre
contacts. Two images of such fibres are shown in Figure 4-8. When such a fibre was
chosen, the number of fibres in contact with the fibre of interest was counted, and a line
was drawn between the centres of two neighbouring contacts along the fibre axis. The
length of the line is the free fibre length and the angle between the line and the
horizontal frame of the image is the measured out-of-plane angle of the free fibre
segment. If the horizontal frame of the image is at an angle α− to the paper plane, then
it can be shown that, for a randomly oriented handsheet, the average value of the out-of-
plane angles of all the free fibre segments in the paper is equal to α . We estimated the
angle α by averaging the measured out-of-plane angles and we then corrected all the
measured out-of-plane angles by the angle α .
To identify fibre-fibre contacts, the cross-sectional images of the samples were first
thresholded manually, and then binaried into black and white images. In the binary
images, fibre-fibre contacts could easily be identified. If there is no black gap between
two fibre surfaces, we defined that a contact has been made between these two fibres.
Otherwise, there is no contact between them. In this project, fibre-fibre contacts were
classified into full contacts and partial contacts. The cross-section of a fibre is assumed
to have two long sides and two short sides. When one of the long sides is totally in
contact with the fibre of interest, this contact is a full contact. Otherwise, the contact is
a partial contact (see Figure 4-9). All these image analysis and measurements were
conducted using the Optimas 6.1 software.

Chapter 4 A New Microscopic Technique for Quantitative Analysis of Paper Structure
at the Fibre Level
______________________________________________________________________
______________________________________________________________________ 72
* the size bar is 10µm
Figure 4-8 Images of paper cross-sections (A is sample Rej-P0 and B is Rej-PH)
* the size bar is 20µm
Figure 4-9 Cross-section image before (A) and after (B) thresholding and
binarisation. Fibre 2 and 3 in (B) make two full contacts, fibre 1 makes a partial
contact, and fibre 4 is not in contact with the fibre of interest.
The measured results of fibre-fibre contacts will be discussed in detail in Chapter 7.
A
B
A B

Chapter 4 A New Microscopic Technique for Quantitative Analysis of Paper Structure
at the Fibre Level
______________________________________________________________________
______________________________________________________________________ 73
4.5 Validation of the new technique
The new technique for microscopic analysis of paper structure was validated by
comparing the fibre dimensions measured by the new technique in paper with those
measured on fibres dried on slides by the route confocal microscopy method. The
validity of the new technique was further checked by comparing the measured fibre
orientation with the theoretical value of a random sheet.
4.5.1 Comparison of the fibre wall area measured in paper with that
measured on slide
Table 4-1 summarizes the fibre dimensions and the sheet properties measured in this
study. As can been seen from Table 4-1, the average fibre wall areas of the recycled
pulp samples R0, RL and RH are very close to each other, especially for those
measurements acquired 4µm below the sample surface. A similar situation is shown for
the kraft pulp samples Kp0, KpL and KpH. This is as expected because wet pressing
should not change the wall areas of fibres in the sheets.
Table 4-1 A summary of the experimental results
Pulp
Sample
Handsheet
Sample
Code
Apparent
density
(kg/m3)
Tensile
index
(kNm/kg)
Fibre wall
area (µm2)
(at 0µm
depth )
Fibre wall
area (µm2)
(at 4µm
depth)
Fill factor
(at cross-
sectional
surface)
Fill factor
(at 4 µm
depth)
Fibre angle
to X-
direction
(degree)
Number
of fibre
measured
R0 234 17.3 220±9* 181±9* 0.56±0.01 0.54±0.01 25.8 147
RL 334 22.9 223±9 179±9 0.53±0.01 0.55±0.01 24.6 146 Recycled
pulp RH 380 22.3 209±10 172±9 0.56±0.01 0.57±0.01 26.0 147
Recycled
pulp fibres
dried on
slides
/ / / 170±8 170±8 / / / 319
Kp0 112 13.1 312±9 266±9 0.45±0.01 0.46±0.01 28.1 176
KpL 215 29.2 295±10 256±9 0.50±0.01 0.48±0.01 25.2 192 Kraft pulp
KpH 393 51.0 294±10 260±9 0.55±0.01 0.56±0.01 26.9 180
Kraft pulp
fibres
dried on
slides
/ / /
249±9
249±9 / / / 338
± is 95% confidence interval.
Chapter 4 A New Microscopic Technique for Quantitative Analysis of Paper Structure
at the Fibre Level
______________________________________________________________________
______________________________________________________________________ 74
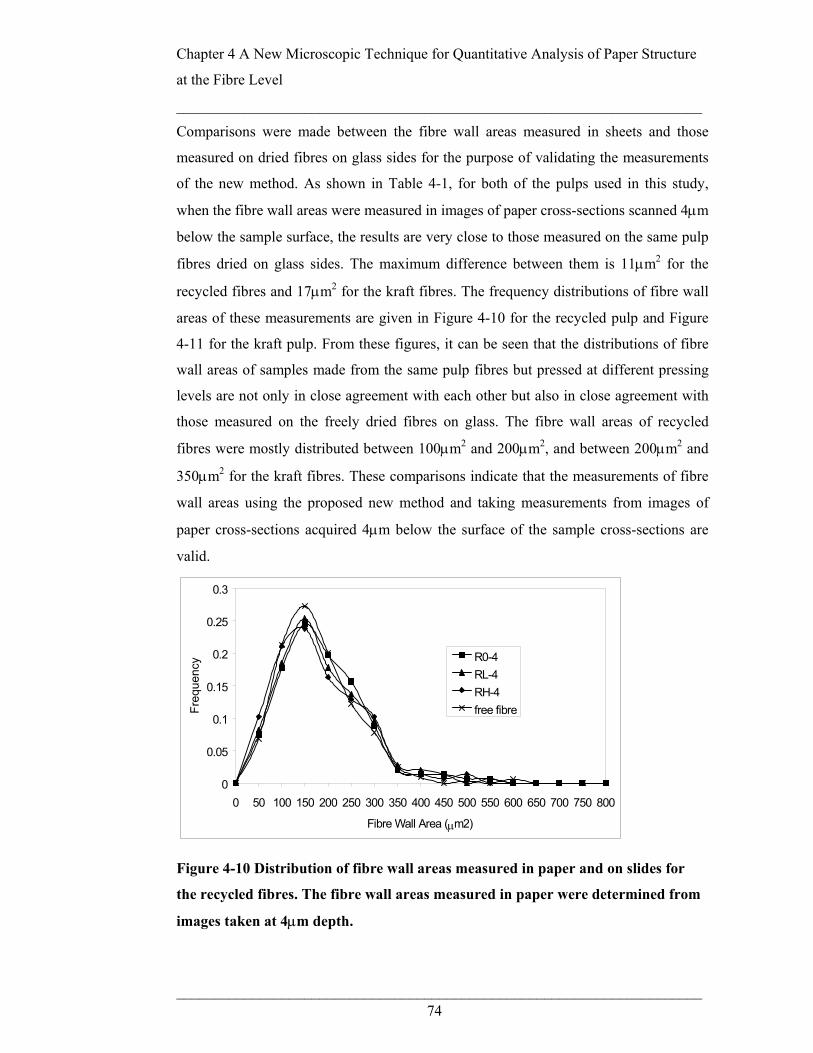
Comparisons were made between the fibre wall areas measured in sheets and those
measured on dried fibres on glass sides for the purpose of validating the measurements
of the new method. As shown in Table 4-1, for both of the pulps used in this study,
when the fibre wall areas were measured in images of paper cross-sections scanned 4µm
below the sample surface, the results are very close to those measured on the same pulp
fibres dried on glass sides. The maximum difference between them is 11µm2 for the
recycled fibres and 17µm2 for the kraft fibres. The frequency distributions of fibre wall
areas of these measurements are given in Figure 4-10 for the recycled pulp and Figure
4-11 for the kraft pulp. From these figures, it can be seen that the distributions of fibre
wall areas of samples made from the same pulp fibres but pressed at different pressing
levels are not only in close agreement with each other but also in close agreement with
those measured on the freely dried fibres on glass. The fibre wall areas of recycled
fibres were mostly distributed between 100µm2 and 200µm2, and between 200µm2 and
350µm2 for the kraft fibres. These comparisons indicate that the measurements of fibre
wall areas using the proposed new method and taking measurements from images of
paper cross-sections acquired 4µm below the surface of the sample cross-sections are
valid.
0
0.05
0.1
0.15
0.2
0.25
0.3
0 50 100 150 200 250 300 350 400 450 500 550 600 650 700 750 800
Fibre Wall Area (µm2)
Freq
uenc
y R0-4RL-4RH-4free fibre
Figure 4-10 Distribution of fibre wall areas measured in paper and on slides for
the recycled fibres. The fibre wall areas measured in paper were determined from
images taken at 4µm depth.

Chapter 4 A New Microscopic Technique for Quantitative Analysis of Paper Structure
at the Fibre Level
______________________________________________________________________
______________________________________________________________________ 75
0
0.05
0.1
0.15
0.2
0.25
0.3
0 50 100 150 200 250 300 350 400 450 500 550 600 650 700 750 800
Fibre Wall Area (µm2)
Freq
uenc
yKp0-4KpL-4KpH-4Free fibre
Figure 4-11 Distribution of fibre wall areas measured in the sheet and on slide for
the kraft fibres. The fibre wall areas measured in paper were determined from
images taken at 4µm depth.
0
0.05
0.1
0.15
0.2
0.25
0 50 100 150 200 250 300 350 400 450 500 550 600 650 700 750 800
Fibre Wall Area (µm2)
Freq
uenc
y
Kp0
KpL
KpH
Free Fibre
Figure 4-12 Distribution of fibre wall areas measured in the sheet and on slide for
the kraft fibres. The fibre wall areas measured in paper were determined from the
surface images.
Chapter 4 A New Microscopic Technique for Quantitative Analysis of Paper Structure
at the Fibre Level
______________________________________________________________________
______________________________________________________________________ 76
0
0.05
0.1
0.15
0.2
0.25
0.3
0 50 100 150 200 250 300 350 400 450 500 550 600 650 700 750 800
Fibre Wall Area (µm2)
Freq
uenc
y
R0RLRHFree Fibres
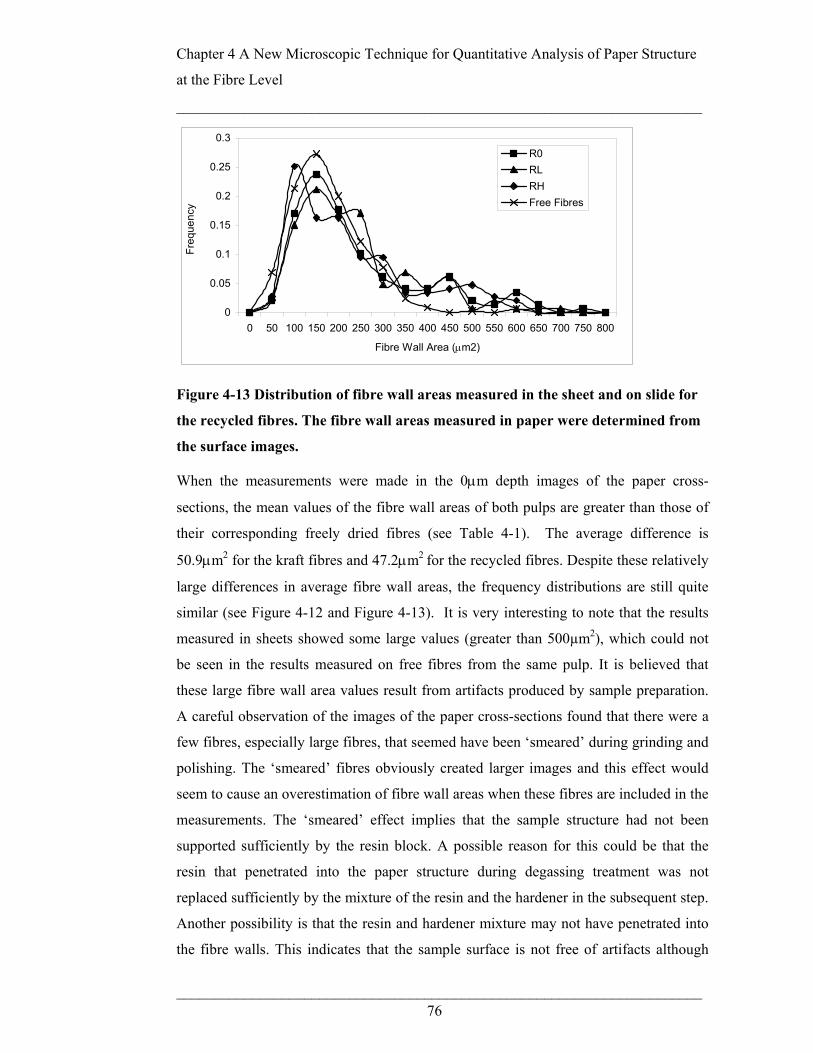
Figure 4-13 Distribution of fibre wall areas measured in the sheet and on slide for
the recycled fibres. The fibre wall areas measured in paper were determined from
the surface images.
When the measurements were made in the 0µm depth images of the paper cross-
sections, the mean values of the fibre wall areas of both pulps are greater than those of
their corresponding freely dried fibres (see Table 4-1). The average difference is
50.9µm2 for the kraft fibres and 47.2µm2 for the recycled fibres. Despite these relatively
large differences in average fibre wall areas, the frequency distributions are still quite
similar (see Figure 4-12 and Figure 4-13). It is very interesting to note that the results
measured in sheets showed some large values (greater than 500µm2), which could not
be seen in the results measured on free fibres from the same pulp. It is believed that
these large fibre wall area values result from artifacts produced by sample preparation.
A careful observation of the images of the paper cross-sections found that there were a
few fibres, especially large fibres, that seemed have been ‘smeared’ during grinding and
polishing. The ‘smeared’ fibres obviously created larger images and this effect would
seem to cause an overestimation of fibre wall areas when these fibres are included in the
measurements. The ‘smeared’ effect implies that the sample structure had not been
supported sufficiently by the resin block. A possible reason for this could be that the
resin that penetrated into the paper structure during degassing treatment was not
replaced sufficiently by the mixture of the resin and the hardener in the subsequent step.
Another possibility is that the resin and hardener mixture may not have penetrated into
the fibre walls. This indicates that the sample surface is not free of artifacts although

Chapter 4 A New Microscopic Technique for Quantitative Analysis of Paper Structure
at the Fibre Level
______________________________________________________________________
______________________________________________________________________ 77
great care has been taken during sample preparation. When measurements were taken
4µm below the sample surface, there were only a few large values (as shown in Figure
4-10 and Figure 4-11) and the measured mean values of fibre wall areas were close to
the results obtained for the free fibres. It appears that any artifacts at the sample cross-
sectional surface are eliminated by taking measurements at 4 microns below the sample
cross-section. As mentioned before, the sample embedding technique was later
improved by using a vacuum impregnation rig to allow the mixture of resin and
hardener to penetrate the paper structure thoroughly. Figure 4-14 gives a group of paper
cross-sectional images obtained from the sample embedded by the improved technique.
As can be seen in Figure 4-14, the quality of images has been improved compare with
those shown in Figure 4-5, and the ‘smeared’ effect cannot be seen in the image
acquired at the sample surface. All of the later measurements were conducted in the
0µm images acquired by the improved technique.
Figure 4-14 Cross-sectional images of paper acquired when the vacuum
impregnation rig was used for sample embedding.
4.5.2 Comparison of the measured fibre orientation with the
theoretical value
The average values of the angles of fibres to the X direction (Figure 4-5) are given in
Table 4 1. The fibre orientation measured in this study was actually the orientation of
fibre segments. In fact it is almost impossible to properly define the fibre orientation
because fibres are not straight in a sheet. However, the orientation of fibre segments
might be more important for paper properties than the average orientation of entire
fibres.
* The size bar is 10 µm
0µm 4µm depth 8µm depth 10µm depth

Chapter 4 A New Microscopic Technique for Quantitative Analysis of Paper Structure
at the Fibre Level
______________________________________________________________________
______________________________________________________________________ 78
In this study the measurement for fibre orientation calculation included any position
shift of the fibre, in any direction, between the surface and 10µm depth into the paper
cross-section. The fibres measured were sampled randomly through the whole
thickness of the paper. Therefore, the fibre orientation measured is an overall fibre
orientation. Although the position shift of fibres in sheets are not calculated in this
chapter (such calculations will be shown in Chapter 6), in fact the positions of fibres
were most likely to shift in both Y and Z directions (see Figure 4-5), although the shift
in the Z direction was usually very small. If the position shift in the Z direction was
zero, it indicates that the fibre is in-plane with respect to paper surface. Otherwise the
fibre is out-of-plane. The small shift in the Z direction indicates that the out of plane
movement of the fibres in the handsheets used in this study is small.
If θ is the in-plane fibre angle to any given line within the plane in the direction
perpendicular to the exposed surface (the X direction in Figure 2), then from simple
geometry the average value for a randomly oriented sheet, avθ , is given by Equation
4.1. Integrating equation (1) gives an average value of π/2-1, or 32.7o.
∫∫
= 2/
0
2/
0
cos
cos π
π
θθ
θθθθ
d
dav 4. 1
From Table 4-1, there is about an 8o difference between the average measured value and
this theoretical value of fibre orientation. This difference is considered to be reasonable
because the theoretical value includes all fibres with angles between 0o and 90o but in
this study fibres with high angles were excluded. After examining the raw data of fibre
angles carefully, it was found that all the measured values seldom included fibres with
angles over 80o. The reason for this is that the ‘high angle fibres’ are likely to be
sectioned along the fibre axis and were treated as 90o fibres and not included in the
measurements. This difference between the measured average fibre angle and the
theoretical average value does not affect the validity of the angle measurements using
the new technique. It appears that the effect of the out of plane movements of fibres in
the sheets used in this study on the overall fibre orientation is negligible.

Chapter 4 A New Microscopic Technique for Quantitative Analysis of Paper Structure
at the Fibre Level
______________________________________________________________________
______________________________________________________________________ 79
This study made no attempt at measuring the distribution of fibre orientation through
the thickness of a sheet, however, the new technique could be used as needed to
measure the distribution of fibre orientation through the thickness of a sheet.
4.6 Application of the New Technique
One possible application of the new technique is to quantify the behaviour of individual
fibres in a sheet after wet pressing. Consolidation of the paper structure during pressing
will occur through a combination of compressing fibres closer together and collapse of
the fibres. How much the fibres are collapsed and brought closer together in wet
pressing and how much these changes in individual fibres contribute to the densification
of the sheet is still not clear. It is only possible to quantify these changes when the fibre
dimensions in the sheet can be measured. The mechanisms of sheet densification will
be studied in Chapter 6.
The new term, fibre fill factor, as defined in subsection 3.4.1 was used to quantify the
collapse degree of fibres in sheets. As shown in Table 4-1, the fill factors of the
recycled fibres in sheets show no significant change with increasing intensity of wet
pressing. Additionally, the value of the fill factor measured in the 0µm depth images
and that measured in the 4µm-depth images shows no significant difference. These
results indicate that the collapse degree of the recycled fibres is not increased in wet
pressing.
In the case of the kraft pulp fibres, the fill factor increases steadily as the pressing
intensity is increased. This means that wet pressing has increased the degree of collapse
of the kraft fibres in the sheets. The collapse behavior of the kraft fibres in wet pressing
is different to that of the recycled fibres. A possible explanation for this difference is
that the recycled fibres have already been collapsed to a certain degree during the
previous papermaking process. It is therefore not easy to collapse these fibres further
by wet pressing. The kraft pulp fibres were never dried and most of the fibres are
uncollapsed. Therefore they are more likely to be collapsed in wet pressing.

Chapter 4 A New Microscopic Technique for Quantitative Analysis of Paper Structure
at the Fibre Level
______________________________________________________________________
______________________________________________________________________ 80
The fibres in a sheet move closer together in wet pressing, forming more bonds.
However other types of movement of fibres in wet pressing must still be clarified. One
additional type of movement that was observed when the sheet was pressed was that the
fibres were twisted so that they lay flat and became closer to each other. The new
technique presented here can be used to quantify this twist of fibres in wet pressing.
The twist angle defined in subsection 4.4.1.5 is used to quantifying the twist of fibres in
wet pressing. The measured results of the twist angle will be discussed in Chapter 6.
Basing on the new technique, we have further developed a new technique for measuring
fibre-fibre contacts in paper. The measured results will be outlined and discussed in
Chapter 7.
4.7 Conclusions
Fibre dimensions, fibre orientation and fibre collapse have been measured directly in
paper using a combined technique of resin embedding and confocal laser scanning
microscopy. This is the first time a technique has been demonstrated for quantifying
paper structure at the fibre level. Comparisons between the measured values of fibre
wall areas by the new technique in paper with those measured by the routine confocal
microscopy technique on free fibres show close agreement. The fibre orientation
measured in the handsheets compares reasonably well with the theoretical value of fibre
orientation of a random sheet. These results show that the measurements made by the
new technique are valid.
Based on the new technique, new techniques for measuring fibre-fibre contacts have
been developed. The new technique makes it possible to quantify the changes of
individual fibres in paper in wet pressing and measure the fibre-fibre contacts directly in
paper.