Embed Size (px)
Citation preview
63
4 C h a p t e r 4
CoP As An Acid-Stable Active Electrocatalyst For The
Hydrogen-Evolution Reaction: Electrochemical Synthesis,
Interfacial Characterization And Performance Evaluation
Saadi, F. H.; Carim, A. I.; Verlage, E.; Hemminger, J. C.; Lewis, N. S.; Soriaga, M. P. The
Journal of Physical Chemistry C 2014, 118, 29294. DOI: 10.1021/jp5054452
4.1 Introduction
The previous two chapters have focused on acid-stable, earth-abundant HER
catalysts that consist of Group VI transition metals and chalcogenides. Another family of
promising hydrogen evolution catalysts that was discovered during my time at Caltech is
the transition metal phosphide group. Recently, crystalline nanoparticles of Ni2P, MoP,
and CoP have been reported as acid-compatible HER catalysts that exhibit low
overpotentials in acidic electrolytes.16-21 Additionally, Ni-P and Co-P alloys have been
studied as alkaline-stable HER catalysts, although the exact compositions and activities
were irreproducible among different samples.22-26 In this chapter we describe a facile
electrochemical method for the synthesis of a cobalt phosphide film that displays high
HER activity and significant operando acid-stability.

64
4.2 Cobalt phosphide electrodeposition and characterization
4.2.1 Characterization of films prior to electrocatalysis
Scanning-electron micrographs (SEM) of the as-deposited thin film (Figures
4.1A, 4.1B, and 4.1C) showed the surfaces to be relatively smooth but with micron-sized
spherical clusters randomly and loosely distributed throughout. Energy-dispersive X-ray
spectroscopy (EDS) indicated that the surface was composed primarily of cobalt and a
minor amount of phosphorous in a Co:P ratio of 20:1 (Figure 4.2). EDS also yielded the
same 20:1 ratio for the clusters.
Figure 4.1: Scanning-electron micrographs of the films before (A, B, and C) and after
(D, E, and F) voltammetry. A: An As-deposited thin film showed the presence of quasi-
spherical clusters on the surface. B and C: The film underneath the particles appeared

65
uniformly roughened. D: Post-electrolysis film showed close-packed plateau-topped
islands on the surface. E and F: The tops of the mesa-like islands were flat and relatively
smooth.
Figure 4.2: Energy-dispersive X-ray spectroscopy of the films before and after
voltammetry. The Co:P atomic ratio decreased from 20:1 to 1:1 after the voltammetric
experiments.
Figures 4.3A and 4.3B show high-resolution X-ray photoelectron spectra of the
samples in the Co and P regions, respectively. The peaks at 778 eV and 793 eV in Figure

66
4.3A correspond to the 2p3/2 and 2p1/2 peaks of zerovalent Co. All of the other peaks are
associated with oxidized cobalt, Co3O4 (CoO.Co2O3).28-31 The large peak in Figure 4.3B
at 133 eV is assigned to orthophosphate, probably as the cobalt salt Co3(PO4)2.32,33 The
observed broadening is consistent with an unresolved overlap of the 2p3/2 and 2p1/2
states.34 Based on Equation (4.1), the Co:P atomic ratio was determined to be 8:1. The
latter is considerably smaller than the EDS-determined ratio (20:1) because X-rays
emanate deeper from the sample bulk compared to photoemitted electrons. This
difference in the Co:P ratio implies surface segregation of phosphorus in the as-prepared
sample.

67
Figure 4.3: High-resolution X-ray photoelectron spectra of (A) Co 2p region of the as-
deposited thin film; (B) P 2p region of the as-deposited thin film; (C) Co 2p region after
voltammetry; (D) P 2p region after voltammetry.
The Raman spectrum of the as-deposited cobalt phosphide film (Figure 4.4)
exhibited a broad, asymmetric band centered at 590 cm-1 which is characteristic of
amorphous cobalt oxide35. The shoulders at 487, 522, and 690 cm-1 are consistently
assigned to Co3O4 stretching modes (Eg, F2g, and A1g).36 Additional peaks at 925, 98,1
and 1067 cm-1 were also observed and are consistent with P-O stretching modes (ν1
symmetric, ν1 symmetric, and ν3 anti-symmetric respectively).37,38

68
Figure 4.4: Raman spectra before and after voltammetry. The peaks at ca. 600 cm-1
correspond to Co-O vibrational modes, whereas those at ca. 1100 cm-1 are attributable to
P-O modes.
4.2.2 Electrochemistry
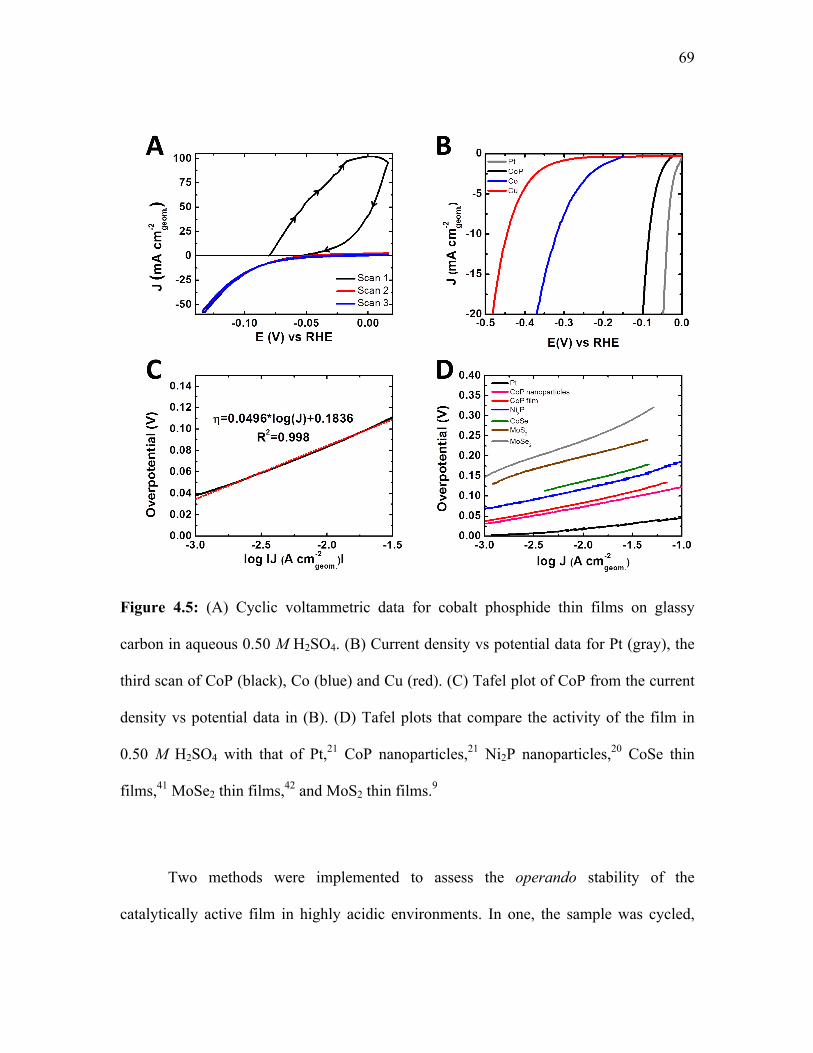
Figure 4.5 displays the cyclic current vs. potential data for the cobalt phosphide
thin film in aqueous 0.500 M H2SO4. In the first scan (Figure 4.5A), initially from the
open-circuit potential (-0.075 V) to 0.025 V vs RHE, a large anodic current was observed
that was not replicated in subsequent runs. After that first cycle, in all experiments, the
overpotential (η) needed to drive 10 mA cm-2 of cathodic current was 85 mV (RHE). This
overpotential was significantly lower than those observed for the Co-on-Cu and pure-Cu
control experiments (Figure 4.5B). Figure 4.5C shows a representative steady-state Tafel
plot for the cobalt-phosphide film, which yielded a slope of 50 mV dec-1 and an exchange
current density of 0.20 mA cm-2. Figure 4.5D compares the Tafel plot of the subject
compound with those of other HER catalysts. Only platinum outperformed the
electrodeposited cobalt-phosphide film under the stated test conditions.
69
Figure 4.5: (A) Cyclic voltammetric data for cobalt phosphide thin films on glassy
carbon in aqueous 0.50 M H2SO4. (B) Current density vs potential data for Pt (gray), the
third scan of CoP (black), Co (blue) and Cu (red). (C) Tafel plot of CoP from the current
density vs potential data in (B). (D) Tafel plots that compare the activity of the film in
0.50 M H2SO4 with that of Pt,21 CoP nanoparticles,21 Ni2P nanoparticles,20 CoSe thin
films,41 MoSe2 thin films,42 and MoS2 thin films.9
Two methods were implemented to assess the operando stability of the
catalytically active film in highly acidic environments. In one, the sample was cycled,

70
uninterrupted, between 0.0 V and -0.14 V vs RHE in 0.5 M H2SO4 for 24 h and the
ensuing cyclic voltammogram (CV) was compared with that for first cycle (Figure 4.6A).
The CV data indicated an increase in η from 85 mV to 100 mV after the day-long test.
The other stability-assessment method was based on chronopotentiometry, in which a
constant current density of 10 mA cm-2 was delivered over 24 h while the electrode
potential, i.e. the value of η, was monitored (Figure 4.6B). The average increase in η
from the two methods was 17.5 ± 4.5 mV.
Figure 4.6: (A) Current density vs potential data in 0.50 M H2SO4, for the first cycle and
after uninterrupted scans over 24 h. (B) Chronopotentiometry in 0.50 M H2SO4 at a
constant current density of 10 mA cm-2.
4.2.3 Post-electrochemistry film characterization
Figures 4.1D, 4.1E, and 4.1F show SEM images of the film obtained after the
HER catalysis experiments. The most notable difference between these images and the
pre-electrochemistry images of Figures 4.1A, 4.1B, and 4.1C is that the film surface was

71
no longer marred with loosely distributed quasi-spheres but was instead covered with
close-packed plateau-topped particles that resembled micron-sized mesas. The tops of the
mesa-like particles were relatively flat and smooth. Post-electrochemistry EDS
measurements (Figure 4.2) indicated that Co:P ratio in the film decreased twenty-fold to
1:1.
Figures 4.3C and 4.3D, respectively, show high-resolution XPS spectra of the
sample in the Co and P regions. Comparison of Figure 4.3C with Figure 4.3A clearly
indicates that all peaks attributable to cobalt oxides have diminished; the two major peaks
represent Co 2p3/2 and Co 2p1/2 states in the stoichiometric CoP.21,32,39 Close inspection
of Figures 4.3B and 4.3D reveals that the relative intensities of the post-electrochemistry
phosphide peaks at 129 and 131 eV increased, whereas that of the phosphate peak at 133
eV decreased significantly. Based on Equation (4.1), the atomic ratio of cobalt and
phosphorous after the hydrogen-evolution experiments decreased from 8:1 to 1:1, in
agreement with the EDS results.
The Raman spectrum (Figure 4.4) after electrochemistry showed the absence of
peaks at 600 cm-1, thus providing clear evidence that the catalytically active film did not
contain cobalt oxide.
4.3 Discussion
When a clean copper disk electrode is immersed in an aqueous solution of 0.15 M
H3BO3, 0.10 M NaCl, 0.30 M NaPO2H2, and 0.2 M CoCl2 and applied with a potential of
-1.2 V, the following deposition reactions are expected to occur:40
Co2+ + 2e– → Co E° = -0.28 V (4.2)

72
H2PO2– + 2H+ + e– → P + 2H2O E° = -0.248 V (4.3)
A spontaneous Co-P compound formation reaction then occurs to give the net reaction:
Co2+ + H2PO2
– + 2H+ + 3e– → CoP + 2H20 E° ≈ -0.28 V (4.4)
While a few stoichiometric compositions of cobalt phosphide are known (e.g.,
Co3P and Co2P),25,32 the 1:1 ratio explicitly shown in Equation (4.2) is based upon the
post-electrocatalysis XPS, and EDS results. The as-deposited film, whether examined by
EDS, XPS or Raman spectroscopy, showed a preponderance of higher-valent Co and P
species such as Co2O3, CoO, and orthophosphate salts. This behavior may be a
consequence of the air-oxidation of the sample when removed from the deposition
solution, rinsed with Nanopure water, and transferred to the XPS instrument.
The large anodic current observed in the first voltammetric cycle is consistent
with expectations for the quantitative anodic dissolution of metallic cobalt to the divalent
cation, Co2+, which is desorbed into solution. Under HER conditions, dissolution of CoO
and Co2O3 evidently also takes place as indicated by the complete loss of cobalt oxides,
as well as by the significant decrease in the Co:P atomic ratio observed in the post-
catalysis XPS and EDS data. The magnitude of the orthophosphate XPS peak in the as-
prepared sample was substantially diminished after the HER cycles. This decrease was
consistent with expectations for the cathodic reduction of interfacial orthophosphate
species; when the film was removed from solution, in the absence of applied potential,
the reduced products readily reverted to the orthophosphates. Thus, ex-situ surface
spectroscopy showed non-zero, but substantially diminished, orthophosphate coverage;
this is as expected for samples that were briefly exposed to air during sample transfer.
The net result is an example of an operando purification, with the deposit changing

73
chemically from a composite of active and inert substances to solely the catalytically
functional material.
For the electrodeposited cobalt phosphide film, spectral results from XPS showed
that the binding energy of cobalt was significantly lower than either the Co2+ or Co3+
species. This is to be expected since a previous study on metal monophosphides has
revealed the covalent nature of the cobalt-phosphorous bond.39 The covalently bonded
CoP is better represented as Coδ+Pδ-, where δ+ and δ- denote partial, non-integer, charges;
consequently, the Co peaks would be closer to those of the zerovalent metal. If the
interaction between cobalt and phosphorus were purely ionic, the designation would have
been [Co3+][P3-], and the Co peak would be that for the Co3+ species.
The overpotential (η) necessary to deliver a proton-reduction current density of 10
mA cm-2, a catalytic-activity metric that is an order of magnitude higher than in natural
photosynthesis, was 85 mV for electrodeposited CoP. In addition, the CoP electrodeposits
displayed stability in acidic environments, in that after 24 h of uninterrupted HER-
voltammetric cycles, η increased by only 17.5 ± 4.5 mV. The results for the
electrodeposited CoP micron-sized particles are comparable to those obtained using CoP
nanoparticles.21 In terms of η, the comparative catalytic performance of the CoP film is as
follows (Figure 4.5): ηPt < ηCoP Film = ηCoP NP, ηNi2P < ηCoSe2 < ηMoS2 < ηMoSe2.
4.4 Conclusion
Cobalt phosphide was prepared, as a film on a copper substrate, by cathodic
deposition from a boric acid solution of Co2+ and H2PO2–. Surface structural and

74
compositional analysis of the film prior to the electrocatalysis measurements indicated
that the film consisted of micron-sized spherical clusters located randomly and loosely on
a slightly rough surface. The composition of both the clusters and surface consisted of
cobalt in the metallic, phosphide, and amorphous-oxide forms (CoO•Co2O3), and of
phosphorus as phosphide and orthophosphate. The higher-valent species that originated
from air-oxidation were remediated upon HER electrocatalysis in sulfuric acid. The
operando film purification yielded a functional electrocatalyst with a Co:P stoichiometric
ratio of 1:1. The post-HER surface was densely packed with micron-sized mesa-like
particles whose tops were flat and smooth. The CoP eletrodeposit showed an overvoltage
of 85 mV at a current density of 10 mA cm-2, and exhibited operando stability in acidic
solution, characterized by an increase in η of 18 mV after 24 h of uninterrupted operation.
In terms of η, the comparative catalytic performance of CoP is: ηPt < ηCoP Film ≤ ηCoP NP,
ηNi2P < ηCoSe2 < ηMoS2 < ηMoSe2.
4.5 Experimental
All chemical reagents were analytical grade and used without further purification.
Ultra-clean water with resistivity higher than 18.2 MΩ cm was generated from a
Barnstead Nanopure system (Thermo Scientific, Asheville, NC). Unless otherwise
specified, all experiments were performed under ambient laboratory conditions.
Rotating-disk electrode substrates. Copper disks (Alfa Aesar, Ward Hill, MA)
that were used as deposition substrates were 5 mm diameter, 4 mm thickness, and 99.999
% purity. The disks were metallographically burnished on a LaboPol-5 polisher (Struers

75
Inc., Cleveland, OH), initially with 15-µ SiC (Buehler, Lake Bluff, IL) and subsequently
with progressively decreased grit size (9, 6, 3 to 1 µ) diamond paste. The disks were then
cleaned with a 0.06-µ colloidal suspension of silica and sonicated for 5 min in Nanopure
water.
Electrochemistry. Electrochemical experiments were performed in a 100-mL
four-port glass cell that was equipped with a 99%-pure graphite rod (Alfa Aesar) that
served as a counter electrode, and a saturated calomel electrode (SCE) (CH Instruments,
Austin, TX) as reference. The SCE was calibrated (266 mV) against a reversible
hydrogen electrode (RHE) in 0.5 M H2SO4. Potential control was accomplished with a
BioLogic SP-200 potentiostat (Biologic, Grenoble, France). The uncompensated cell
resistance was determined from a single-point high-frequency impedance measurement
and was compensated (85 %) by the built-in positive-feedback software.
The cobalt phosphide film was electrodeposited onto a Cu disk from a 250-mL
solution that consisted of 0.928 g (0.15 M) of boric acid, H3BO3, (Alfa Aesar), 0.584 g
(0.10 M) sodium chloride, NaCl, (Macron Fine Chemicals, Center Valley, PA), 3.48 g
(0.30 M) sodium hypophosphite, NaPO2H2, Alfa Aesar) and 4.759 g (0.2 M) cobalt
chloride, CoCl2, (Alfa Aesar). The pH of the solution, prior to and after the
electrodeposition experiments, was 5.0. The rotating disk electrode (RDE) was rotated at
a frequency of 6.67 Hz (400 rpm) with the potential maintained at -1.2 V vs SCE for 15
min. For control experiments, a cobalt-only film was prepared based on the same
procedure but in the absence of NaPO2H2.
Hydrogen-evolution catalysis measurements were performed in a 0.50 M H2SO4
solution that was prepared from 18 M H2SO4 (Sigma Aldrich, St. Louis, MO) by use of

76
ultrapure water. In the HER experiments, the solution and the RDE cell were saturated
with 99.999 % H2(g) (Air Liquide, Plumsteadville, PA) and the RDE was rotated at 26.67
Hz (1600 rpm). Voltammetric data were obtained by cycling the potential between 0.0 V
and -0.14 V vs RHE at a scan rate of 1 mV s-1. The operando stability of the films was
evaluated by continuous cyclic voltammetry over a 24 h period. Chronopotentiometry at
constant current density of 10 mA cm-2 was also performed during which the potential of
the cobalt phosphide film was monitored over a 24 h period.
Interfacial Characterization
Scanning-electron micrographs were obtained using a Nova NanoSEM 450
microscope (FEI, Hillsboro, OR) with an accelerating voltage of 15 kV and a working
distance of 5.0 mm. Low-magnification micrographs (> 10 nm per pixel) were acquired
with an Everhart-Thornley detector whereas higher-magnification micrographs were
obtained with a through-the-lens detector. Energy-dispersive X-ray spectra (EDS) were
collected in the SEM at an accelerating voltage of 15 kV using a silicon drift detector
(Oxford Instruments, Abingdon, United Kingdom). Inca software (Oxford Instruments,
Abingdon, United Kingdom) was used to interpret the EDS spectra.
XPS data were obtained using an AXIS Ultra DLD instrument (Kratos Analytical,
Manchester, UK) at a background pressure of 1 × 10⁻⁹ Torr. High-intensity excitation was
provided by monochromatic Al Kα X-rays, 1486.6 eV in energy and 0.2-eV resolution at
full width at half maximum. Photoelectrons were collected at 0º from the surface normal
at a retarding (pass) energy of 80 eV for the survey scans, whereas a pass energy of 20
eV was used for the high-resolution scans. The peak energies were calibrated against the
binding energy EB of the adventitious C 1s peak. For quantitative analysis, the XPS peaks

77
were fitted using CasaXPS software (CASA Ltd, Teignmouth, United Kingdom) to
symmetric Voigt line shapes composed of Gaussian (70%) and Lorentzian (30%)
functions that employed a Shirley background.27 For both the Co and P peaks, the fitting
was constrained to maintain a 2:1 ratio between the areas of the 2p3/2 and 2p1/2 peaks,
with EB separations of 0.85 eV and 15 eV for P and Co, respectively. The atomic or
molar ratio between Co and P was obtained from Equation (4.1):
"#$"%
= (#$ )#$(% )%
(4.1)
*Co*P=.Co/Co.P/P (4.1) where N is the number of atoms, A is the total area of the photoemission peaks, and S the
sensitivity factor. Values for S (0.486 for P and 3.59 for Co) were provided by the
instrument manufacturer.
Raman spectra of the films were obtained with a Renishaw inVia Raman
microprobe (Renishaw, Wotton Under Edge, United Kingdom) equipped with a Leica
DM 2500M microscope (Leica Microsystems, Buffalo Grove, IL), a Leica N Plan 50x
objective (numerical aperture = 0.75), a 1800 lines mm-1 grating and a CCD detector
configured in a 180° backscatter geometry. A 532-nm diode-pumped solid-state laser
(Renishaw RL532C50) was used as the excitation and a 20-µW radiant flux was incident
onto the surface of the sample.

78
4.6 References
(1) Lewis, N. S.; Nocera, D. G. Powering the Planet: Chemical Challenges in Solar
Energy Utilization. Proc. Natl. Acad. Sci. U. S. A. 2006, 103, 15729-15735.
(2) Lewis, N. S. Toward Cost-Effective Solar Energy Use. Science 2007, 315, 798-801.
(3) Turner, J.; Sverdrup, G.; Mann, M. K.; Maness, P.-C.; Kroposki, B.; Ghirardi, M.;
Evans, R. J.; Blake, D. Renewable Hydrogen Production. Int. J. Energ. Res. 2008, 32,
379-407.
(4) Walter, M. G.; Warren, E. L.; McKone, J. R.; Boettcher, S. W.; Mi, Q.; Santori, E.
A.; Lewis, N. S. Solar Water Splitting Cells. Chem. Rev. (Washington, DC, U. S.) 2010,
110, 6446-6473.
(5) Gray, H. B. Powering the Planet with Solar Fuel. Nature Chem. 2009, 1, 7-7.
(6) Merki, D.; Hu, X. Recent Developments of Molybdenum and Tungsten Sulfides as
Hydrogen Evolution Catalysts. Energy Environ. Sci. 2011, 4, 3878-3888.
(7) Laursen, A. B.; Kegnæs, S.; Dahl, S.; Chorkendorff, I. Molybdenum Sulfides—
Efficient and Viable Materials for Electro - and Photoelectrocatalytic Hydrogen
Evolution. Energy Environ. Sci. 2012, 5, 5577-5591.
(8) Vrubel, H.; Hu, X. Growth and Activation of an Amorphous Molybdenum Sulfide
Hydrogen Evolving Catalyst. ACS Catal. 2013, 2002-2011.
(9) Benck, J. D.; Chen, Z.; Kuritzky, L. Y.; Forman, A. J.; Jaramillo, T. F. Amorphous
Molybdenum Sulfide Catalysts for Electrochemical Hydrogen Production: Insights into
the Origin of Their Catalytic Activity. ACS Catal. 2012, 2, 1916-1923.

79
(10) Kibsgaard, J.; Chen, Z.; Reinecke, B. N.; Jaramillo, T. F. Engineering the Surface
Structure of MoS2 to Preferentially Expose Active Edge Sites For electrocatalysis. Nat.
Mater. 2012, 11, 963-969.
(11) Bonde, J.; Moses, P. G.; Jaramillo, T. F.; Nørskov, J. K.; Chorkendorff, I. Hydrogen
Evolution on Nano-Particulate Transition Metal Sulfides. Faraday Discuss. 2009, 140,
219-231.
(12) Kong, D.; Wang, H.; Cha, J. J.; Pasta, M.; Koski, K. J.; Yao, J.; Cui, Y. Synthesis of
MoS2 and MoSe2 Films with Vertically Aligned Layers. Nano Lett. 2013, 13, 1341-1347.
(13) Velazquez, J. M.; Saadi, F. H.; Pieterick, A. P.; Spurgeon, J. M.; Soriaga, M. P.;
Brunschwig, B. S.; Lewis, N. S. Synthesis and Hydrogen-Evolution Activity of Tungsten
Selenide Thin Films Deposited on Tungsten Foils. J. Electroanal. Chem. 2014, 716, 45-
48.
(14) Kong, D.; Cha, J. J.; Wang, H.; Lee, H. R.; Cui, Y. First-Row Transition Metal
Dichalcogenide Catalysts for Hydrogen Evolution Reaction. Energy Environ. Sci. 2013,
6, 3553-3558.
(15) Chen, W. F.; Wang, C. H.; Sasaki, K.; Marinkovic, N.; Xu, W.; Muckerman, J. T.;
Zhu, Y.; Adzic, R. R. Highly Active and Durable Nanostructured Molybdenum Carbide
Electrocatalysts for Hydrogen Production. Energy Environ. Sci. 2013, 6, 943-951.
(16) Liu, Q.; Tian, J.; Cui, W.; Jiang, P.; Cheng, N.; Asiri, A. M.; Sun, X. Carbon
Nanotubes Decorated with CoP Nanocrystals: A Highly Active Non-Noble-Metal
Nanohybrid Electrocatalyst for Hydrogen Evolution. Angew. Chem. 2014

80
(17) Tian, J.; Liu, Q.; Asiri, A. M.; Sun, X. Self-Supported Nanoporous Cobalt
Phosphide Nanowire Arrays: An Efficient 3D Hydrogen-Evolving Cathode over the
Wide Range of pH 0–14. J. Am. Chem. Soc. 2014, 136, 7587-7590.
(18) Wang, X.; Xiao, P.; Thia, L.; Alam Sk, M.; Lim, R. J.; Ge, X.; Wang, J.-Y.; Lim, K.
H. Molybdenum Phosphide as an Efficient Electrocatalyst for Hydrogen Evolution
Reaction. Energy Environ. Sci. 2014.
(19) Feng, L.; Vrubel, H.; Bensimon, M.; Hu, X. Easily-Prepared Dinickel Phosphide
(Ni2P) Nanoparticles as an Efficient and Robust Electrocatalyst for Hydrogen Evolution.
Phys. Chem. Chem. Phys. 2014, 16, 5917-5921.
(20) Popczun, E. J.; McKone, J. R.; Read, C. G.; Biacchi, A. J.; Wiltrout, A. M.; Lewis,
N. S.; Schaak, R. E. Nanostructured Nickel Phosphide as an Electrocatalyst for the
Hydrogen Evolution Reaction. J. Am. Chem. Soc. 2013, 135, 9267-9270.
(21) Popczun, E. J.; Read, C. G.; Roske, C. W.; Lewis, N. S.; Schaak, R. E. Highly
Active Electrocatalysis of the Hydrogen Evolution Reaction by Cobalt Phosphide
Nanoparticles. Angewandte Chemie International Edition 2014, 53, 5427-5430.
(22) Burchardt, T. The Hydrogen Evolution Reaction on NiPx Alloys. Int. J. Hydrogen
Energy 2000, 25, 627-634.
(23) Burchardt, T.; Hansen, V.; Våland, T. Microstructure and Catalytic Activity
Towards the Hydrogen Evolution Reaction of Electrodeposited NiPx Alloys. Electrochim.
Acta 2001, 46, 2761-2766.
(24) Paseka, I. Evolution of Hydrogen and Its Sorption on Remarkable Active
Amorphous Smooth Ni-P(X) Electrodes. Electrochim. Acta 1995, 40, 1633-1640.

81
(25) Paseka, I.; Velicka, J. Hydrogen Evolution and Hydrogen Sorption on Amorphous
Smooth Me-P(X) (Me=Ni, Co and Fe-Ni) Electrodes. Electrochim. Acta 1997, 42, 237-
242.
(26) Morikawa, T.; Nakade, T.; Yokoi, M.; Fukumoto, Y.; Iwakura, C. Electrodeposition
of Ni-P Alloys from Ni-Citrate Bath. Electrochim. Acta 1997, 42, 115-118.
(27) Shirley, D. A. High-Resolution X-ray Photoemission Spectrum of the Valence
Bands of Gold. Phys. Rev. B 1972, 5, 4709-4714.
(28) Biesinger, M. C.; Payne, B. P.; Grosvenor, A. P.; Lau, L. W. M.; Gerson, A. R.;
Smart, R. S. C. Resolving Surface Chemical States in XPS Analysis of First Row
Transition Metals, Oxides and Hydroxides: Cr, Mn, Fe, Co and Ni. Appl. Surf. Sci. 2011,
257, 2717-2730.
(29) McIntyre, N. S.; Cook, M. G. X-Ray Photoelectron Studies on Some Oxides and
Hydroxides of Cobalt, Nickel, and Copper. Anal. Chem. 1975, 47, 2208-2213.
(30) McIntyre, N. S.; Johnston, D. D.; Coatsworth, L. L.; Davidson, R. D.; Brown, J. R.
X-ray Photoelectron Spectroscopic Studies of Thin Film Oxides of Cobalt and
Molybdenum. Surf. Interface Anal. 1990, 15, 265-272.
(31) Tan, B. J.; Klabunde, K. J.; Sherwood, P. M. A. XPS Studies of Solvated Metal
Atom Dispersed (SMAD) Catalysts. Evidence for Layered Cobalt-Manganese Particles
on Alumina and Silica. J. Am. Chem. Soc. 1991, 113, 855-861.
(32) Nemoshalenko, V. V.; Didyk, V. V.; Senekevich, A. I. Russ. J. Org. Chem. 1983,
28, 2182.
(33) Cobo, S.; Heidkamp, J.; Jacques, P.-A.; Fize, J.; Fourmond, V.; Guetaz, L.;
Jousselme, B.; Ivanova, V.; Dau, H.; Palacin, S.; Fontecave, M.; Artero, V. A Janus

82
Cobalt-Based Catalytic Material for Electro-Splitting of Water. Nat. Mater. 2012, 11,
802-807.
(34) Okamoto, Y.; Nitta, Y.; Imanaka, T.; Teranishi, S. Surface Characterisation of
Nickel Boride and Nickel Phosphide Catalysts by X-ray Photoelectron Spectroscopy.
Journal of the Chemical Society, Faraday Transactions 1: Physical Chemistry in
Condensed Phases 1979, 75, 2027-2039.
(35) Tyczkowski, J.; Kapica, R.; Łojewska, J. Thin Cobalt Oxide Films for Catalysis
Deposited by Plasma-Enhanced Metal–Organic Chemical Vapor Deposition. Thin Solid
Films 2007, 515, 6590-6595.
(36) Hadjiev, V. G.; Iliev, M. N.; Vergilov, I. V. The Raman Spectra of Co3O4. J. Phys.
C 1988, 21, L199.
(37) Frost, R. L. An Infrared and Raman Spectroscopic Study of Natural Zinc
Phosphates. Spectrochimica Acta Part A: Molecular and Biomolecular Spectroscopy
2004, 60, 1439-1445.
(38) Mitchell, P. C. H.; Parker, S. F.; Simkiss, J.; Simmons, J.; Taylor, M. G. Hydrated
Sites in Biogenic Amorphous Calcium Phosphates: An Infrared, Raman, and Inelastic
Neutron Scattering Study. J. Inorg. Biochem. 1996, 62, 183-197.
(39) Grosvenor, A. P.; Wik, S. D.; Cavell, R. G.; Mar, A. Examination of the Bonding in
Binary Transition-Metal Monophosphides MP (M = Cr, Mn, Fe, Co) by X-ray
Photoelectron Spectroscopy. Inorg. Chem. 2005, 44, 8988-8998.
(40) Plambeck, J. A.; Bard, A. J.; Henning, L. Encyclopedia of Electrochemistry of the
Elements. Vol. 3 Vol. 3, 1973.

83
(41) Carim, A. I.; Saadi, F. H.; Soriaga, M. P.; Lewis, N. S. Electrocatalysis of the
Hydrogen-Evolution Reaction by Electrodeposited Amorphous Cobalt Selenide Films. J.
Mater. Chem. A 2014, 2, 13835-13839.
(42) Saadi, F. H.; Carim, A. I.; Velazquez, J. M.; Baricuatro, J. H.; McCrory, C. C. L.;
Soriaga, M. P.; Lewis, N. S. Operando Synthesis of Macroporous Molybdenum
Diselenide Films for Electrocatalysis of the Hydrogen-Evolution Reaction. ACS Catal.
2014, 2866-2873.