Embed Size (px)
Citation preview

4. Energy Resources

Figure 4.1 Technically Recoverable Crude Oil and Natural Gas Resource Estimates, 2009
Crude Oil and Lease Condensate, Total Technically Dry Natural Gas, Total Technically Recoverable ResourcesRecoverable Resources
Crude Oil and Lease Condensate by Type Dry Natural Gas by Type
88 U.S. Energy Information Administration / Annual Energy Review 2011
58%25%
18%
48 States¹ Onshore48 States¹ OffshoreAlaska
20%
13%
13%
54%
48 States¹ Onshore48 States¹ Offshore GasAlaskaTight Gas, Shale Gas, and CoalbedMethane
Total220 billion barrels
Reserves Resources TechnicallyRecoverableResources
Total2,203 trillion cubic feet
22
198
220
Proved Unproved Total0
50
100
150
200
250
Bill
ion
Bar
rels
273
1,931
2,203
Proved Unproved Total0
500
1,000
1,500
2,000
2,500
Trill
ion
Cub
ic F
eet
Reserves TechnicallyRecoverableResources
Resources
1 “48 States” is the United States excluding Alaska and Hawaii.Note: Sum of components may not equal 100 percent due to independent rounding.
Source: Table 4.1.
U.S. Energy Information Administration / Annual Energy Review 2011 89
Table 4.1 Technically Recoverable Crude Oil and Natural Gas Resource Estimates, 2009
Region Proved Reserves 1 Unproved ResourcesTotal Technically
Recoverable Resources 2
Crude Oil and Lease Condensate (billion barrels)
48 States 3 Onshore ........................................................................... 14.2 112.6 126.7 48 States 3 Offshore ........................................................................... 4.6 50.3 54.8 Alaska ................................................................................................. 3.6 35.0 38.6
Total U.S. ........................................................................................... 22.3 197.9 220.2 .......................
Dry Natural Gas 4 (trillion cubic feet)
Conventionally Reservoired Fields 5 ............................................. 105.5 904.0 1,009.5 48 States 3 Onshore Gas 6 ............................................................. 81.4 369.7 451.1 48 States 3 Offshore Gas 7 ............................................................. 15.0 262.6 277.6 Alaska ............................................................................................. 9.1 271.7 280.8
Tight Gas, 8 Shale Gas, 9 and Coalbed Methane 10 ....................... 167.1 1,026.7 1,193.8
Total U.S. .......................................................................................... 272.5 1,930.7 2,203.3
1 See "Proved Reserves, Crude Oil," "Proved Reserves, Lease Condensate," and "Proved Reserves,Natural Gas" in Glossary.
2 "Technically recoverable" resources are those that are producible using current technology withoutreference to the economic viability thereof.
3 "48 States" is the United States excluding Alaska and Hawaii.4 Excludes natural gas plant liquids. See "Natural Gas, Dry" in Glossary.5 Conventionally reservoired deposits are discrete subsurface accumulations of crude oil or natural gas
usually defined, controlled, or limited by hydrocarbon/water contacts.6 Includes associated-dissolved (AD) natural gas that occurs in crude oil reservoirs either as free gas
(associated) or as gas in solution with crude oil (dissolved gas).7 Includes Federal offshore and State offshore waters (near-shore, shallow-water areas under State
jurisdiction).8 Natural gas produced from a non-shale formation with extremely low permeability.
9 See "Shale Gas" in Glossary.10 See "Coalbed Methane" in Glossary.Notes: • See Tables 4.2 and 4.3 for more recent proved reserves data. • Data are at end of year.
• Resources in areas where drilling is officially prohibited are not included. Estimates of the resources inthe Northern Atlantic, Northern and Central Pacific, and within a 50-mile buffer off the Mid and SouthernAtlantic Outer Continental Shelf (OCS) are also excluded from the technically recoverable volumes.• Totals may not equal sum of components due to independent rounding.
Sources: Proved Reserves: U.S. Energy Information Administration (EIA), U.S. Crude Oil, NaturalGas, and Natural Gas Liquids Proved Reserves, 2010 (August 2012). Unproved Resources: U.S.Geological Survey National Oil and Gas Resource Assessment Team, with adjustments made to the shalegas data by EIA, Office of Energy Analysis. Total Technically Recoverable Resources: Calculated asthe sum of proved reserves and unproved resources.

Figure 4.2 Crude Oil and Natural Gas Cumulative Production and Proved Reserves, 1977-2010
Crude Oil Natural Gas (Dry)
Cumulative Production and Proved Reserves, Indexed
90 U.S. Energy Information Administration / Annual Energy Review 2011
Notes: • Data are at end of year. • Crude oil includes lease condensate. Source: Table 4.2.
Natural Gas (Dry) Cumulative Production
Crude Oil Cumulative Production
Natural Gas (Dry) Proved Reserves
Crude Oil Proved Reserves
1977 1980 1983 1986 1989 1992 1995 1998 2001 2004 2007 20100
50
100
150
200
250
Inde
x: 1
977=
100
1977 1980 1983 1986 1989 1992 1995 1998 2001 2004 2007 20100
300
600
900
1,200
1,500
Trill
ion
Cub
ic F
eet
1977 1980 1983 1986 1989 1992 1995 1998 2001 2004 2007 20100
50
100
150
200
250
Bill
ion
Bar
rels
Cumulative Production Cumulative Production
Proved Reserves Proved Reserves

U.S. Energy Information Administration / Annual Energy Review 2011 91
Table 4.2 Crude Oil and Natural Gas Cumulative Production and Proved Reserves, 1977-2010
Year
Crude Oil and Lease Condensate 1 Natural Gas (Dry)
Cumulative Production Proved Reserves 2 Cumulative Production Proved Reserves 3
Billion Barrels Trillion Cubic Feet
1977 118.1 31.8 514.4 207.41978 121.3 31.4 533.6 208.01979 124.4 31.2 553.2 201.01980 127.5 31.3 572.6 199.01981 130.7 31.0 591.8 201.71982 133.8 29.5 609.6 201.51983 137.0 29.3 625.7 200.21984 140.2 30.0 643.2 197.51985 143.5 29.9 659.6 193.41986 146.7 28.3 675.7 191.61987 149.7 28.7 692.3 187.21988 152.7 28.2 709.4 168.01989 155.5 27.9 726.7 167.11990 158.2 27.6 744.5 169.31991 160.9 25.9 762.2 167.11992 163.5 25.0 780.1 165.01993 166.0 24.1 798.2 162.41994 168.4 23.6 817.0 163.81995 170.8 23.5 835.6 165.11996 173.2 23.3 854.5 166.51997 175.6 23.9 873.4 167.21998 177.8 22.4 892.4 164.01999 180.0 23.2 911.2 167.42000 182.1 23.5 930.4 177.42001 184.2 23.8 950.0 183.52002 186.3 24.0 968.9 186.92003 188.4 23.1 988.0 189.02004 190.4 22.6 1,006.6 192.52005 192.3 23.0 1,024.7 204.42006 194.1 22.3 1,043.2 211.12007 196.0 22.8 1,062.4 237.72008 197.8 20.6 1,082.6 244.72009 199.8 22.3 1,103.2 272.52010 201.8 25.2 1,124.6 304.6
1 Lease condensate is the portion of natural gas liquids that is separated from the wellhead gas streamat a lease or field separation facility.
2 See "Proved Reserves, Crude Oil" and "Proved Reserves, Lease Condensate" in Glossary.3 See "Proved Reserves, Natural Gas" in Glossary.Note: Data are at end of year.Web Pages: See http://www.eia.gov/petroleum/ and http://www.eia.gov/naturalgas/ for related
information.Sources: Cumulative Production: Calculated from U.S. Energy Information Administration (EIA),
Petroleum Supply Annual, annual reports and Natural Gas Annual, annual reports. Proved Reserves:• 1977-2000—EIA, U.S. Crude Oil, Natural Gas, and Natural Gas Liquids Reserves, annual reports.• 2001-2010—EIA, Summary: U.S. Crude Oil, Natural Gas, and Natural Gas Liquids Proved Reserves2010 (August 2012), Table 7.

Figure 4.3 Crude Oil, Natural Gas, and Natural Gas Liquids Proved Reserves
Total, 1949-2010 By Type, 2010
By Type, 1949-2010
92 U.S. Energy Information Administration / Annual Energy Review 2011
1 COE=crude oil equivalent.² To the extent that lease condensate is measured or estimated it is included in “Natural Gas
Liquids”; otherwise, lease condensate is included in “Crude Oil.”
Notes: • Data are at end of year. • API=American Petroleum Institute. AGA=American GasAssociation. EIA=U.S. Energy Information Administration.
Source: Table 4.3.
EIA Data
API and AGA Data: 1949-1979
EIA Data: 1977-2010
Crude Oil²
Natural Gas
Natural Gas Liquids²
1950 1960 1970 1980 1990 2000 20100
25
50
75
100
Bill
ion
Bar
rels
CO
E¹
API and AGA Data
54
23
8
Natural Gas Crude Oil² Natural Gas Liquids²0
10
20
30
40
50
60
Bill
ion
Bar
rels
CO
E¹
Natural Gas
Crude Oil²
Natural Gas Liquids²
1950 1955 1960 1965 1970 1975 1980 1985 1990 1995 2000 2005 20100
20
40
60
Bill
ion
Bar
rels
CO
E¹

U.S. Energy Information Administration / Annual Energy Review 2011 93
Table 4.3 Crude Oil, Natural Gas, and Natural Gas Liquids Proved Reserves, Selected Years, 1949-2010
Year
Crude Oil 1 Natural Gas (Dry) Natural Gas Liquids 1 Total
Billion Barrels Trillion Cubic Feet 2 Billion Barrels COE 3 Billion Barrels Billion Barrels COE 3 Billion Barrels COE 3
American Petroleum Institute and American Gas Association Data
1949 24.6 179.4 32.0 3.7 3.1 59.71950 25.3 184.6 32.9 4.3 3.5 61.71955 30.0 222.5 39.7 5.4 4.4 74.11960 31.6 262.3 46.8 6.8 5.4 83.81965 31.4 286.5 51.0 8.0 6.3 88.61970 39.0 290.7 51.7 7.7 5.9 96.61971 38.1 278.8 49.6 7.3 5.5 93.21972 36.3 266.1 47.1 6.8 5.1 88.51973 35.3 250.0 44.0 6.5 4.8 84.11974 34.2 237.1 41.9 6.4 4.7 80.81975 32.7 228.2 40.2 6.3 4.6 77.51976 30.9 216.0 38.0 6.4 4.7 73.61977 29.5 208.9 36.8 6.0 4.4 70.61978 27.8 200.3 35.2 5.9 4.3 67.31979 27.1 194.9 34.3 5.7 4.1 65.5
U.S. Energy Information Administration Data
1977 31.8 207.4 36.5 NA NA NA1978 31.4 208.0 36.5 6.8 5.0 73.01979 29.8 201.0 35.4 6.6 4.9 70.11980 29.8 199.0 35.2 6.7 5.0 70.01981 29.4 201.7 35.7 7.1 5.2 70.41982 27.9 201.5 35.7 7.2 5.3 68.81983 27.7 200.2 35.6 7.9 5.7 69.01984 28.4 197.5 35.1 7.6 5.5 69.01985 28.4 193.4 34.4 7.9 5.6 68.51986 26.9 191.6 34.0 8.2 5.8 66.71987 27.3 187.2 33.3 8.1 5.8 66.31988 26.8 168.0 29.8 8.2 5.8 62.41989 26.5 167.1 29.7 7.8 5.5 61.71990 26.3 169.3 30.0 7.6 5.4 61.71991 24.7 167.1 29.7 7.5 5.3 59.61992 23.7 165.0 29.3 7.5 5.2 58.31993 23.0 162.4 28.8 7.2 5.1 56.81994 22.5 163.8 29.0 7.2 5.0 56.51995 22.4 165.1 29.2 7.4 5.2 56.81996 22.0 166.5 29.4 7.8 5.5 56.91997 22.5 167.2 29.6 8.0 5.6 57.71998 21.0 164.0 29.2 7.5 5.3 55.51999 21.8 167.4 29.6 7.9 5.5 56.92000 22.0 177.4 31.4 8.3 5.8 59.22001 22.4 183.5 32.5 8.0 5.6 60.52002 22.7 186.9 R33.0 8.0 5.6 R61.22003 21.9 189.0 33.5 7.5 5.2 60.62004 21.4 192.5 34.1 7.9 5.5 60.92005 21.8 204.4 36.2 8.2 5.6 63.62006 21.0 211.1 37.4 8.5 5.8 64.22007 21.3 237.7 R42.1 9.1 6.3 R69.72008 19.1 244.7 43.3 9.3 6.4 68.82009 20.7 272.5 48.2 10.2 7.0 75.82010 23.3 304.6 53.7 11.7 8.0 85.0
1 To the extent that lease condensate is measured or estimated it is included in "Natural Gas Liquids";otherwise, lease condensate is included in "Crude Oil."
2 The American Gas Association estimates of natural gas proved reserves include volumes of naturalgas held in underground storage. In 1979, this volume amounted to 4.9 trillion cubic feet. U.S. EnergyInformation Administration (EIA) data do not include natural gas in underground storage.
3 Natural gas is converted to crude oil equivalent (COE) by multiplying by the natural gas dry productionapproximate heat content (see Table A4) and then dividing by the crude oil production approximate heatcontent (see Table A2). The lease condensate portion of natural gas liquids is converted to COE bymultiplying by the lease condensate production approximate heat content (5.5 million Btu per barrel) andthen dividing by the crude oil production approximate heat content. Other natural gas liquids are convertedto COE by multiplying by the natural gas plant liquids production approximate heat content (see Table A2)and then dividing by the crude oil production approximate heat content.
R=Revised. NA=Not available. Notes: • Data are at end of year. • See "Proved Reserves, Crude Oil," "Proved Reserves, Natural
Gas," and "Proved Reserves, Natural Gas Liquids" in Glossary.Web Pages: • See http://www.eia.gov/totalenergy/data/annual/#resources for all data beginning in
1949. • For related information, see http://www.eia.gov/petroleum/.Sources: American Petroleum Institute and American Gas Association Data: American Petroleum
Institute, American Gas Association, and Canadian Petroleum Association (published jointly), Reserves ofCrude Oil, Natural Gas Liquids and Natural Gas in the United States and Canada as of December 31,1979, Volume 34 (June 1980). U.S. Energy Information Administration Data: • 1977-2008—EIA, U.S.Crude Oil, Natural Gas, and Natural Gas Liquids Reserves, annual reports. • 2009 and 2010—EIA,Summary: U.S. Crude Oil, Natural Gas, and Natural Gas Liquids Reserves 2010 (August 2012), Tables 7and 17.

Figure 4.4 Crude Oil and Natural Gas Rotary Rigs in Operation
By Site, 1949-2011 By Site, 2011
By Type, 1949-2011 By Type,¹ 2011
94 U.S. Energy Information Administration / Annual Energy Review 2011
1 Rigs drilling for miscellaneous purposes, such as service wells, injection wells, and stra-tigraphic tests, are not shown.
Source: Table 4.4.
1,846
32
Onshore Offshore0
500
1,000
1,500
2,000
Num
ber o
f Rig
s
1950 1960 1970 1980 1990 2000 20100
1
2
3
4
5
Thou
sand
Rig
s
Total
OffshoreOnshore
1950 1960 1970 1980 1990 2000 20100
1
2
3
4
5
Thou
sand
Rig
s
Natural Gas
Total
887984
Natural Gas Crude Oil0
250
500
750
1,000
1,250
Num
ber o
f Rig
s
Crude Oil
U.S. Energy Information Administration / Annual Energy Review 2011 95
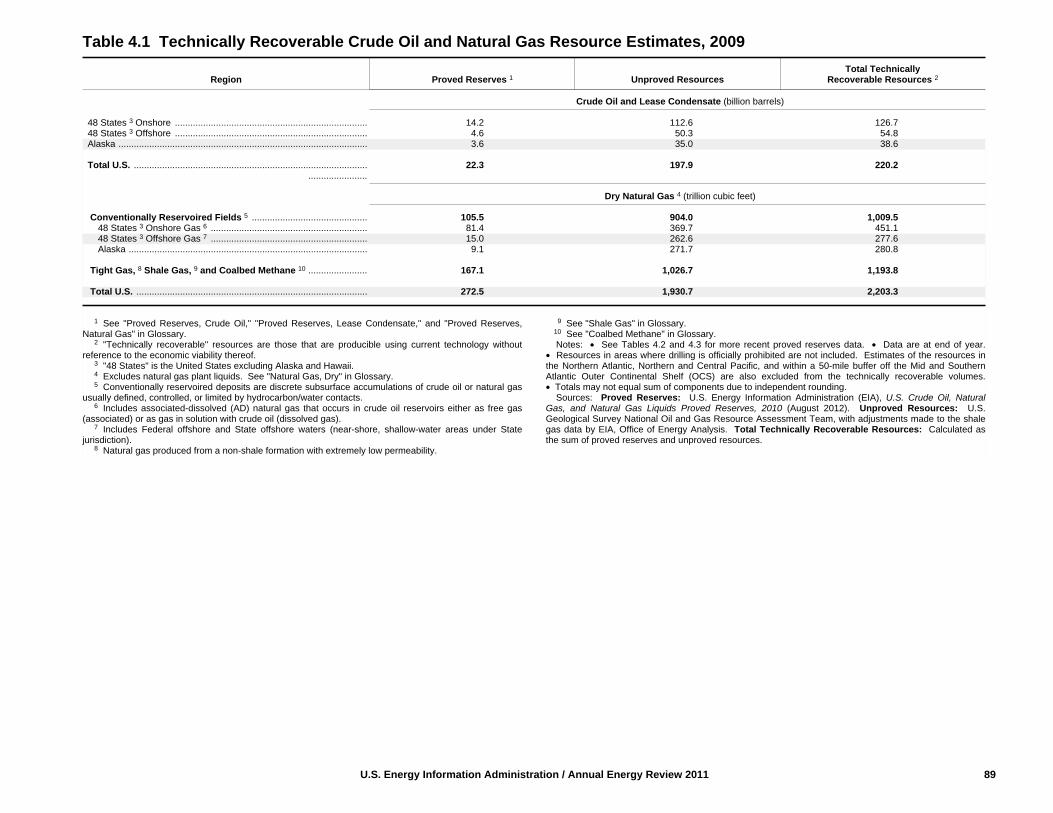
Table 4.4 Crude Oil and Natural Gas Rotary Rigs in Operation, Selected Years, 1949-2011 (Number of Rigs)
Year
By Site By Type
Total 1Onshore Offshore Crude Oil Natural Gas
1949 NA NA NA NA 2,0171950 NA NA NA NA 2,1541955 NA NA NA NA 2,6861960 NA NA NA NA 1,7481965 NA NA NA NA 1,3881970 NA NA NA NA 1,0281975 1,554 106 NA NA 1,6601976 1,529 129 NA NA 1,6581977 1,834 167 NA NA 2,0011978 2,074 185 NA NA 2,2591979 1,970 207 NA NA 2,1771980 2,678 231 NA NA 2,9091981 3,714 256 NA NA 3,9701982 2,862 243 NA NA 3,1051983 2,033 199 NA NA 2,2321984 2,215 213 NA NA 2,4281985 1,774 206 NA NA 1,9801986 865 99 NA NA 9641987 841 95 NA NA 9361988 813 123 554 354 9361989 764 105 453 401 8691990 902 108 532 464 1,0101991 779 81 482 351 8601992 669 52 373 331 7211993 672 82 373 364 7541994 673 102 335 427 7751995 622 101 323 385 7231996 671 108 306 464 7791997 821 122 376 564 9431998 703 123 264 560 8271999 519 106 128 496 6252000 778 140 197 720 9182001 1,003 153 217 939 1,1562002 717 113 137 691 8302003 924 108 157 872 1,0322004 1,095 97 165 1,025 1,1922005 1,287 94 194 1,184 1,3812006 1,559 90 274 1,372 1,6492007 1,695 72 297 1,466 1,7682008 1,814 65 379 1,491 1,8792009 1,046 44 278 801 1,0892010 1,514 31 591 943 1,5462011 1,846 32 984 887 1,879
1 Sum of rigs drilling for crude oil, rigs drilling for natural gas, and other rigs (not shown) drilling formiscellaneous purposes, such as service wells, injection wells, and stratigraphic tests.
NA=Not available. Notes: • Data are not for the exact calendar year but are an average for the 52 or 53 consecutive whole
weeks that most nearly coincide with the calendar year. • Geographic coverage is the 50 States and the
District of Columbia. • Totals may not equal sum of components due to independent rounding.Web Pages: • See http://www.eia.gov/totalenergy/data/monthly/#crude for updated monthly and annual
data. • See http://www.eia.gov/totalenergy/data/annual/#resources for all annual data beginning in 1949.Source: Baker Hughes, Inc., Houston, TX, Rotary Rigs Running—By State, used with permission. See
http://investor.shareholder.com/bhi/rig_counts/rc_index.cfm.

Figure 4.5 Crude Oil and Natural Gas Exploratory and Development Wells
Total Wells Drilled, 1949-2010 Total Wells Drilled by Type, 1949-2010 Successful Wells, 1949-2010
Wells Drilled, 2010 Footage Drilled, 2010 Average Depth, 2010
96 U.S. Energy Information Administration / Annual Energy Review 2011
1 Data are for exploratory and development wells combined. Sources: Tables 4.5–4.7.
Total¹
1950 1960 1970 1980 1990 2000 20100
25
50
75
100
Thou
sand
Wel
ls
1950 1960 1970 1980 1990 2000 20100
10
20
30
40
50
Thou
sand
Wel
ls
1950 1960 1970 1980 1990 2000 20100
20
40
60
80
100
Per
cent
Total¹
Development
Exploratory
Development
Exploratory
Natural Gas Wells
Crude Oil Wells
Dry Holes
16.317.0
4.3
15.6 15.9
3.2
0.7 1.0 1.1
Crude Oil Natural Gas Dry Holes0
5
10
15
20
Thou
sand
Wel
ls
ExploratoryDevelopmentTotal
101
147
22
95
138
166 9 6
Crude Oil Natural Gas Dry Holes0
50
100
150
200
Mill
ion
Feet
ExploratoryDevelopmentTotal¹
6.2
8.7
5.1
6.1
8.6
4.9
9.1 8.8
5.7
Crude Oil Natural Gas Dry Holes0
3
6
9
12
Thou
sand
Fee
t per
Wel
l
ExploratoryDevelopmentTotal¹

U.S. Energy Information Administration / Annual Energy Review 2011 97
Table 4.5 Crude Oil and Natural Gas Exploratory and Development Wells, Selected Years, 1949-2010
Year
Wells DrilledSuccessful
Wells
Footage Drilled 1 Average Footage Drilled
Crude Oil 2 Natural Gas 3 Dry Holes 4 Total Crude Oil 2 Natural Gas 3 Dry Holes 4 Total Crude Oil 2 Natural Gas 3 Dry Holes 4 Total
Number Percent Thousand Feet Feet per Well
1949 21,352 3,363 12,597 37,312 66.2 79,428 12,437 43,754 135,619 3,720 3,698 3,473 3,6351950 23,812 3,439 14,799 42,050 64.8 92,695 13,685 50,977 157,358 3,893 3,979 3,445 3,7421955 30,432 4,266 20,452 55,150 62.9 121,148 19,930 85,103 226,182 3,981 4,672 4,161 4,1011960 22,258 5,149 18,212 45,619 60.1 86,568 28,246 77,361 192,176 3,889 5,486 4,248 4,2131965 18,065 4,482 16,226 38,773 58.2 73,322 24,931 76,629 174,882 4,059 5,562 4,723 4,5101970 12,968 4,011 11,031 28,010 60.6 56,859 23,623 58,074 138,556 4,385 5,860 5,265 4,9431975 16,948 8,127 13,646 38,721 64.8 66,819 44,454 69,220 180,494 3,943 5,470 5,073 4,6611976 17,688 9,409 13,758 40,855 66.3 68,892 49,113 68,977 186,982 3,895 5,220 5,014 4,5771977 18,745 12,122 14,985 45,852 67.3 75,451 63,686 76,728 215,866 4,025 5,254 5,120 4,7081978 19,181 14,413 16,551 50,145 67.0 77,041 75,841 85,788 238,669 4,017 5,262 5,183 4,7601979 20,851 15,254 16,099 52,204 69.2 82,688 80,468 81,642 244,798 3,966 5,275 5,071 4,6891980 32,959 17,461 20,785 71,205 70.8 125,262 92,106 99,575 316,943 3,801 5,275 4,791 4,4511981 43,887 20,250 27,953 92,090 69.6 172,167 108,353 134,934 415,454 3,923 5,351 4,827 4,5111982 39,459 19,076 26,379 84,914 68.9 149,674 107,149 123,746 380,569 3,793 5,617 4,691 4,4821983 37,366 14,684 24,355 76,405 68.1 136,849 78,108 105,222 320,179 3,662 5,319 4,320 4,1911984 42,906 17,338 25,884 86,128 69.9 162,653 91,480 119,860 373,993 3,791 5,276 4,631 4,3421985 35,261 14,324 21,211 70,796 70.0 137,728 76,293 100,388 314,409 3,906 5,326 4,733 4,4411986 19,213 8,599 12,799 40,611 68.5 76,825 45,039 60,961 182,825 3,999 5,238 4,763 4,5021987 16,210 8,096 11,167 35,473 68.5 66,358 42,584 53,588 162,530 4,094 5,260 4,799 4,5821988 13,646 8,578 10,119 32,343 68.7 58,639 45,363 52,517 156,519 4,297 5,288 5,190 4,8391989 10,230 9,522 8,236 27,988 70.6 43,266 49,081 42,099 134,446 4,229 5,154 5,112 4,8041990 12,839 11,246 8,245 32,330 74.5 R56,591 R57,028 R42,433 R156,052 R4,408 R5,071 R5,147 R4,8271991 12,588 9,793 7,481 29,862 74.9 R56,196 R51,032 R37,750 R144,978 R4,464 R5,211 R5,046 R4,8551992 9,402 8,163 5,862 23,427 75.0 R45,748 R44,727 R29,451 R119,926 R4,866 R5,479 R5,024 R5,1191993 8,856 9,839 6,096 24,791 75.4 R44,236 R58,240 R31,018 R133,494 R4,995 R5,919 R5,088 R5,3851994 7,348 9,375 5,096 21,819 76.6 R38,620 R58,340 R27,771 R124,731 R5,256 R6,223 R5,450 R5,7171995 8,248 8,082 4,814 21,144 77.2 R41,076 R49,746 R26,349 R117,171 R4,980 R6,155 R5,473 R5,5421996 8,836 9,027 4,890 22,753 78.5 R42,472 R56,042 R27,851 R126,365 R4,807 R6,208 R5,696 R5,5541997 11,206 11,498 5,874 28,578 79.4 R56,371 R71,270 R33,640 R161,281 R5,030 R6,198 R5,727 R5,6441998 7,682 11,639 4,761 24,082 80.2 R38,579 R70,099 R28,540 R137,218 R5,022 R6,023 R5,995 R5,6981999 4,805 12,027 3,550 20,382 82.6 R22,024 R60,217 R20,608 R102,849 4,584 R5,007 R5,805 R5,0462000 8,090 17,051 4,146 29,287 85.8 R36,745 R83,618 R24,076 R144,439 R4,542 R4,904 R5,807 R4,9322001 8,888 22,072 4,598 35,558 87.1 R43,172 R110,734 R26,221 R180,127 R4,857 R5,017 R5,703 R5,0662002 6,775 17,342 3,754 27,871 86.5 R30,892 R93,041 R21,232 R145,165 R4,560 R5,365 R5,656 R5,2082003 8,129 20,722 3,982 32,833 87.9 R38,588 R115,916 R22,744 R177,248 R4,747 R5,594 R5,712 R5,3982004 8,789 24,186 4,082 37,057 89.0 R42,109 R138,449 R23,714 R204,272 R4,791 R5,724 R5,809 R5,5122005 10,779 R28,590 4,653 R44,022 89.4 R51,449 R163,820 R25,044 R240,313 R4,773 R5,730 R5,382 R5,4592006 R13,404 R32,838 R5,206 R51,448 89.9 R63,340 R191,646 R27,778 R282,764 R4,725 R5,836 R5,336 R5,4962007 R13,361 R32,719 R4,978 R51,058 90.3 R64,792 R208,907 R27,754 R301,453 R4,849 R6,385 R5,575 R5,9042008 R16,645 R32,274 R5,428 R54,347 R90.0 R82,646 R223,224 R28,572 R334,442 R4,965 R6,917 R5,264 R6,1542009 R11,261 R18,234 R3,552 R33,047 R89.3 R62,771 R156,200 R20,520 R239,491 R5,574 R8,566 R5,777 R7,2472010 R16,254 R16,973 R4,277 R37,504 R88.6 R100,682 R146,973 R21,719 R269,374 R6,194 R8,659 R5,078 R7,183
1 See "Footage Drilled" in Glossary.2 See "Crude Oil Well" in Glossary.3 See "Natural Gas Well" in Glossary.4 See "Dry Hole" in Glossary.R=Revised. Notes: • 2011 data for this table were not available in time for publication. • Data are estimates.
• Data are for exploratory and development wells combined; see Table 4.6 for exploratory wells only, andTable 4.7 for development wells only. • Service wells, stratigraphic tests, and core tests are excluded.• For 1949–1959, data represent wells completed in a given year. For 1960–1969, data are for wellcompletion reports received by the American Petroleum Institute during the reporting year. For 1970forward, the data represent wells completed in a given year. The as-received well completion data forrecent years are incomplete due to delays in the reporting of wells drilled. The U.S. Energy Information
Administration (EIA) therefore statistically imputes the missing data. • Totals may not equal sum ofcomponents due to independent rounding. Average depth may not equal average of components due toindependent rounding.
Web Pages: • See http://www.eia.gov/totalenergy/data/monthly/#crude for updated monthly and annualdata. • See http://www.eia.gov/totalenergy/data/annual/#resources for all annual data beginning in 1949.• See http://www.eia.gov/petroleum/ for related information.
Sources: • 1949-1965—Gulf Publishing Company, World Oil, "Forecast-Review" issue.• 1966-1969—American Petroleum Institute (API), Quarterly Review of Drilling Statistics for the UnitedStates, annual summaries and monthly reports. • 1970-1989—EIA computations based on well reportssubmitted to the API. • 1990 forward—EIA computations based on well reports submitted to IHS, Inc.,Denver, CO.

Figure 4.6 Crude Oil and Natural Gas Exploratory Wells, 1949-2010
Exploratory Wells Drilled by Well Type Exploratory Footage Drilled by Well Type
Exploratory Wells Average Depth, All Wells Exploratory Wells Average Depth by Well Type
98 U.S. Energy Information Administration / Annual Energy Review 2011
Note: These graphs depict exploratory wells only; see Figure 4.5 for all wells and Figure 4.7for development wells only.
Source: Table 4.6.
Dry Holes
1950 1960 1970 1980 1990 2000 20100
3
6
9
12
15
Thou
sand
Wel
ls
1950 1960 1970 1980 1990 2000 20100
20
40
60
80
Mill
ion
Feet
Crude Oil Wells
Natural Gas Wells
Crude Oil Wells
Natural GasWells
Dry Holes
Crude Oil Wells
Natural Gas Wells
Dry Holes
1950 1960 1970 1980 1990 2000 20100
2
4
6
8
10
Thou
sand
Fee
t Per
Wel
l
1950 1960 1970 1980 1990 2000 20100
2
4
6
8
10
Thou
sand
Fee
t per
Wel
l

U.S. Energy Information Administration / Annual Energy Review 2011 99
Table 4.6 Crude Oil and Natural Gas Exploratory Wells, Selected Years, 1949-2010
Year
Wells DrilledSuccessful
Wells
Footage Drilled 1 Average Footage Drilled
Crude Oil 2 Natural Gas 3 Dry Holes 4 Total Crude Oil 2 Natural Gas 3 Dry Holes 4 Total Crude Oil 2 Natural Gas 3 Dry Holes 4 Total
Number Percent Thousand Feet Feet per Well
1949 1,406 424 7,228 9,058 20.2 5,950 2,409 26,439 34,798 4,232 5,682 3,658 3,8421950 1,583 431 8,292 10,306 19.5 6,862 2,356 30,957 40,175 4,335 5,466 3,733 3,8981955 2,236 874 11,832 14,942 20.8 10,774 5,212 53,220 69,206 4,819 5,964 4,498 4,6321960 1,321 868 9,515 11,704 18.7 6,829 5,466 43,535 55,831 5,170 6,298 4,575 4,7701965 946 515 8,005 9,466 15.4 5,366 3,757 40,081 49,204 5,672 7,295 5,007 5,1981970 757 477 6,162 7,396 16.7 4,729 3,678 35,123 43,530 6,247 7,695 5,700 5,8851975 982 1,248 7,129 9,359 23.8 5,806 8,422 40,448 54,677 5,913 6,748 5,674 5,8421976 1,086 1,346 6,772 9,204 26.4 6,527 9,121 37,969 53,617 6,010 6,777 5,607 5,8251977 1,164 1,548 7,283 9,995 27.1 6,870 10,255 40,823 57,949 5,902 6,625 5,605 5,7981978 1,171 1,771 7,965 10,907 27.0 7,105 11,798 46,295 65,197 6,067 6,662 5,812 5,9781979 1,321 1,907 7,437 10,665 30.3 7,941 12,643 42,512 63,096 6,011 6,630 5,716 5,9161980 1,777 2,099 9,081 12,957 29.9 10,177 13,862 50,249 74,288 5,727 6,604 5,533 5,7331981 2,651 2,522 12,400 17,573 29.4 15,515 17,079 69,214 101,808 5,853 6,772 5,582 5,7931982 2,437 2,133 11,307 15,877 28.8 13,413 14,763 60,680 88,856 5,504 6,921 5,367 5,5971983 2,030 1,605 10,206 13,841 26.3 10,437 10,264 48,989 69,690 5,141 6,395 4,800 5,0351984 2,209 1,528 11,321 15,058 24.8 12,294 9,935 58,624 80,853 5,565 6,502 5,178 5,3691985 1,680 1,200 8,954 11,834 24.3 9,854 8,144 47,604 65,602 5,865 6,787 5,317 5,5441986 1,084 797 5,567 7,448 25.3 6,579 5,401 30,325 42,305 6,069 6,777 5,447 5,6801987 926 756 5,052 6,734 25.0 5,652 5,064 26,746 37,462 6,104 6,698 5,294 5,5631988 855 747 4,711 6,313 25.4 5,286 4,992 27,079 37,357 6,182 6,683 5,748 5,9171989 607 706 3,934 5,247 25.0 3,659 4,664 21,947 30,270 6,028 6,606 5,579 5,7691990 778 811 3,652 5,241 30.3 R5,316 R5,740 R20,761 R31,817 R6,833 R7,078 R5,685 R6,0711991 673 649 3,191 4,513 29.3 4,470 R4,619 18,049 R27,138 6,642 R7,117 5,656 6,0131992 571 513 2,384 3,468 31.3 R3,959 3,544 13,058 R20,561 R6,933 6,908 5,477 R5,9291993 539 610 2,334 3,483 33.0 R3,572 R3,950 R13,465 R20,987 R6,627 R6,475 R5,769 R6,0261994 595 782 2,247 3,624 38.0 3,971 R5,121 R13,306 R22,398 6,674 R6,549 5,922 R6,1801995 570 558 2,024 3,152 35.8 R3,927 R3,494 R11,927 R19,348 R6,889 R6,262 5,893 R6,1381996 489 576 1,956 3,021 35.3 R3,650 R3,902 12,137 R19,689 R7,464 R6,774 6,205 R6,5171997 491 562 2,113 3,166 33.3 R3,946 R4,022 R13,485 R21,453 R8,037 R7,157 R6,382 R6,7761998 327 566 1,590 2,483 36.0 2,740 R4,068 R10,836 R17,644 8,379 R7,187 R6,815 R7,1061999 197 570 1,157 1,924 39.9 1,433 R3,997 7,687 R13,117 7,274 R7,012 6,644 R6,8182000 288 657 1,341 2,286 41.3 2,103 R4,798 R9,147 R16,048 7,302 R7,303 R6,821 R7,0202001 357 1,052 1,733 3,142 44.8 R2,608 R7,323 R11,458 R21,389 R7,305 R6,961 R6,612 R6,8072002 258 844 1,282 2,384 46.2 R1,742 R5,701 R8,687 R16,130 R6,752 R6,755 R6,776 R6,7662003 350 997 1,297 2,644 50.9 R2,446 R6,569 R8,810 R17,825 R6,989 R6,589 R6,793 R6,7422004 383 1,671 1,350 3,404 60.3 R3,098 R9,988 R9,331 R22,417 R8,089 R5,977 R6,912 R6,5852005 539 R2,141 1,462 R4,142 64.7 R4,252 R12,208 R9,359 R25,819 R7,889 R5,702 R6,402 R6,2332006 R646 R2,456 R1,547 R4,649 R66.7 R4,710 R13,987 R9,745 R28,442 R7,291 R5,695 R6,299 R6,1182007 R806 R2,794 R1,582 R5,182 R69.5 R5,790 R15,658 R10,102 R31,550 R7,184 R5,604 R6,386 R6,0882008 R892 R2,345 R1,715 R4,952 R65.4 R7,088 R14,276 R10,500 R31,864 R7,946 R6,088 R6,122 R6,4352009 R612 R1,196 R1,052 R2,860 R63.2 R4,711 R8,499 R6,443 R19,653 R7,698 R7,106 R6,125 R6,8722010 R668 R1,044 R1,093 R2,805 R61.0 R6,099 R9,226 R6,192 R21,517 R9,130 R8,837 R5,665 R7,671
1 See "Footage Drilled" in Glossary.2 See "Crude Oil Well" in Glossary.3 See "Natural Gas Well" in Glossary.4 See "Dry Hole" in Glossary.R=Revised. Notes: • 2011 data for this table were not available in time for publication. • Data are estimates.
• Data are for exploratory wells only; see Table 4.5 for exploratory and development wells combined, andTable 4.7 for development wells only. • For 1949–1959, data represent wells completed in a given year.For 1960–1969, data are for well completion reports received by the American Petroleum Institute (API)during the reporting year. For 1970 forward, the data represent wells completed in a given year. Theas-received well completion data for recent years are incomplete due to delays in the reporting of wells
drilled. The U.S. Energy Information Administration (EIA) therefore statistically imputes the missing data.• Totals may not equal sum of components due to independent rounding. Average depth may not equalaverage of components due to independent rounding.
Web Pages: • See http://www.eia.gov/totalenergy/data/monthly/#crude for updated monthly and annualdata. • See http://www.eia.gov/totalenergy/data/annual/#resources for all annual data beginning in 1949.• See http://www.eia.gov/petroleum/ for related information.
Sources: • 1949-1965—Gulf Publishing Company, World Oil, "Forecast-Review" issue.• 1966-1969—American Petroleum Institute (API), Quarterly Review of Drilling Statistics for the UnitedStates, annual summaries and monthly reports. • 1970-1989—EIA computations based on well reportssubmitted to the API. • 1990 forward—EIA computations based on well reports submitted to IHS, Inc.,Denver, CO.

Figure 4.7 Crude Oil and Natural Gas Development Wells, 1949-2010
Development Wells Drilled by Well Type Development Footage Drilled by Well Type
Development Wells Average Depth, All Wells Development Wells Average Depth by Well Type
100 U.S. Energy Information Administration / Annual Energy Review 2011
Note: These graphs depict development wells only; see Figure 4.5 for all wells and Figure4.6 for exploratory wells only.
Source: Table 4.7.
1950 1960 1970 1980 1990 2000 20100
10
20
30
40
50
Thou
sand
Wel
ls
1950 1960 1970 1980 1990 2000 20100
50
100
150
200
250
Mill
ion
Feet
Crude Oil Wells
Dry Holes
Natural Gas Wells
Crude Oil Wells
Dry Holes
Natural Gas Wells
Dry Holes
1950 1960 1970 1980 1990 2000 20100
2
4
6
8
10
Thou
sand
Fee
t per
Wel
l
1950 1960 1970 1980 1990 2000 20100
2
4
6
8
10
Thou
sand
Fee
t per
Wel
l
Natural Gas Wells
Crude Oil Wells

U.S. Energy Information Administration / Annual Energy Review 2011 101
Table 4.7 Crude Oil and Natural Gas Development Wells, Selected Years, 1949-2010
Year
Wells DrilledSuccessful
Wells
Footage Drilled 1 Average Footage Drilled
Crude Oil 2 Natural Gas 3 Dry Holes 4 Total Crude Oil 2 Natural Gas 3 Dry Holes 4 Total Crude Oil 2 Natural Gas 3 Dry Holes 4 Total
Number Percent Thousand Feet Feet per Well
1949 19,946 2,939 5,369 28,254 81.0 73,478 10,028 17,315 100,821 3,684 3,412 3,225 3,5681950 22,229 3,008 6,507 31,744 79.5 85,833 11,329 20,020 117,183 3,861 3,766 3,077 3,6911955 28,196 3,392 8,620 40,208 78.6 110,374 14,718 31,883 156,976 3,915 4,339 3,699 3,9041960 20,937 4,281 8,697 33,915 74.4 79,739 22,780 33,826 136,345 3,809 5,321 3,889 4,0201965 17,119 3,967 8,221 29,307 71.9 67,956 21,174 36,548 125,678 3,970 5,337 4,446 4,2881970 12,211 3,534 4,869 20,614 76.4 52,130 19,945 22,951 95,026 4,269 5,644 4,714 4,6101975 15,966 6,879 6,517 29,362 77.8 61,013 36,032 28,772 125,817 3,821 5,238 4,415 4,2851976 16,602 8,063 6,986 31,651 77.9 62,365 39,992 31,008 133,365 3,756 4,960 4,439 4,2141977 17,581 10,574 7,702 35,857 78.5 68,581 53,431 35,905 157,917 3,901 5,053 4,662 4,4041978 18,010 12,642 8,586 39,238 78.1 69,936 64,043 39,493 173,472 3,883 5,066 4,600 4,4211979 19,530 13,347 8,662 41,539 79.1 74,747 67,825 39,130 181,702 3,827 5,082 4,517 4,3741980 31,182 15,362 11,704 58,248 79.9 115,085 78,244 49,326 242,655 3,691 5,093 4,214 4,1661981 41,236 17,728 15,553 74,517 79.1 156,652 91,274 65,720 313,646 3,799 5,149 4,226 4,2091982 37,022 16,943 15,072 69,037 78.2 136,261 92,386 63,066 291,713 3,681 5,453 4,184 4,2251983 35,336 13,079 14,149 62,564 77.4 126,412 67,844 56,233 250,489 3,577 5,187 3,974 4,0041984 40,697 15,810 14,563 71,070 79.5 150,359 81,545 61,236 293,140 3,695 5,158 4,205 4,1251985 33,581 13,124 12,257 58,962 79.2 127,874 68,149 52,784 248,807 3,808 5,193 4,306 4,2201986 18,129 7,802 7,232 33,163 78.2 70,246 39,638 30,636 140,520 3,875 5,080 4,236 4,2371987 15,284 7,340 6,115 28,739 78.7 60,706 37,520 26,842 125,068 3,972 5,112 4,390 4,3521988 12,791 7,831 5,408 26,030 79.2 53,353 40,371 25,438 119,162 4,171 5,155 4,704 4,5781989 9,623 8,816 4,302 22,741 81.1 39,607 44,417 20,152 104,176 4,116 5,038 4,684 4,5811990 12,061 10,435 4,593 27,089 83.0 R51,275 R51,288 R21,672 R124,235 R4,251 R4,915 R4,718 R4,5861991 11,915 9,144 4,290 25,349 83.1 R51,726 R46,413 R19,701 R117,840 R4,341 R5,076 R4,592 R4,6491992 8,831 7,650 3,478 19,959 82.6 R41,789 R41,183 R16,393 R99,365 R4,732 R5,383 R4,713 R4,9781993 8,317 9,229 3,762 21,308 82.3 R40,664 R54,290 R17,553 R112,507 R4,889 R5,883 R4,666 R5,2801994 6,753 8,593 2,849 18,195 84.3 R34,649 R53,219 R14,465 R102,333 R5,131 R6,193 R5,077 R5,6241995 7,678 7,524 2,790 17,992 84.5 R37,149 R46,252 R14,422 R97,823 R4,838 R6,147 R5,169 R5,4371996 8,347 8,451 2,934 19,732 85.1 R38,822 R52,140 R15,714 R106,676 R4,651 R6,170 R5,356 R5,4061997 10,715 10,936 3,761 25,412 85.2 R52,425 R67,248 R20,155 R139,828 R4,893 R6,149 R5,359 R5,5021998 7,355 11,073 3,171 21,599 85.3 R35,839 R66,031 R17,704 R119,574 R4,873 R5,963 R5,583 R5,5361999 4,608 11,457 2,393 18,458 87.0 R20,591 R56,220 R12,921 R89,732 4,469 R4,907 R5,399 R4,8612000 7,802 16,394 2,805 27,001 89.6 R34,642 R78,820 R14,929 R128,391 R4,440 R4,808 5,322 R4,7552001 8,531 21,020 2,865 32,416 91.2 R40,564 R103,411 R14,763 R158,738 R4,755 R4,920 R5,153 R4,8972002 6,517 16,498 2,472 25,487 90.3 R29,150 R87,340 R12,545 R129,035 R4,473 R5,294 R5,075 R5,0632003 7,779 19,725 2,685 30,189 91.1 R36,142 R109,347 R13,934 R159,423 R4,646 R5,544 R5,190 R5,2812004 8,406 22,515 2,732 33,653 91.9 R39,011 R128,461 R14,383 R181,855 R4,641 R5,706 R5,265 R5,4042005 10,240 26,449 3,191 39,880 92.0 R47,197 R151,612 R15,685 R214,494 R4,609 R5,732 R4,915 R5,3782006 R12,758 R30,382 R3,659 R46,799 92.2 R58,630 R177,659 R18,033 R254,322 R4,596 R5,848 R4,928 R5,4342007 R12,555 R29,925 R3,396 R45,876 R92.6 R59,002 R193,249 R17,652 R269,903 R4,699 R6,458 R5,198 R5,8832008 R15,753 R29,929 R3,713 R49,395 R92.5 R75,558 R208,948 R18,072 R302,578 R4,796 R6,981 R4,867 R6,1262009 R10,649 R17,038 R2,500 R30,187 91.7 R58,060 R147,701 R14,077 R219,838 R5,452 R8,669 R5,631 R7,2832010 R15,586 R15,929 R3,184 R34,699 R90.8 R94,583 R137,747 R15,527 R247,857 R6,068 R8,648 R4,877 R7,143
1 See "Footage Drilled" in Glossary.2 See "Crude Oil Well" in Glossary.3 See "Natural Gas Well" in Glossary.4 See "Dry Hole" in Glossary.R=Revised. Notes: • 2011 data for this table were not available in time for publication. • Data are estimates.
• Data are for development wells only; see Table 4.5 for exploratory and development wells combined, andTable 4.6 for exploratory wells only. • Service wells, stratigraphic tests, and core tests are excluded.• For 1949–1959, data represent wells completed in a given year. For 1960–1969, data are for wellcompletion reports received by the American Petroleum Institute during the reporting year. For 1970forward, the data represent wells completed in a given year. The as-received well completion data forrecent years are incomplete due to delays in the reporting of wells drilled. The U.S. Energy Information
Administration (EIA) therefore statistically imputes the missing data. • Totals may not equal sum ofcomponents due to independent rounding. Average depth may not equal average of components due toindependent rounding.
Web Pages: • See http://www.eia.gov/totalenergy/data/monthly/#crude for updated monthly and annualdata. • See http://www.eia.gov/totalenergy/data/annual/#resources for all annual data beginning in 1949.• See http://www.eia.gov/petroleum/ for related information.
Sources: • 1949-1965—Gulf Publishing Company, World Oil, "Forecast-Review" issue.• 1966-1969—American Petroleum Institute (API), Quarterly Review of Drilling Statistics for the UnitedStates, annual summaries and monthly reports. • 1970-1989—EIA computations based on well reportssubmitted to the API. • 1990 forward—EIA computations based on well reports submitted to IHS, Inc.,Denver, CO.
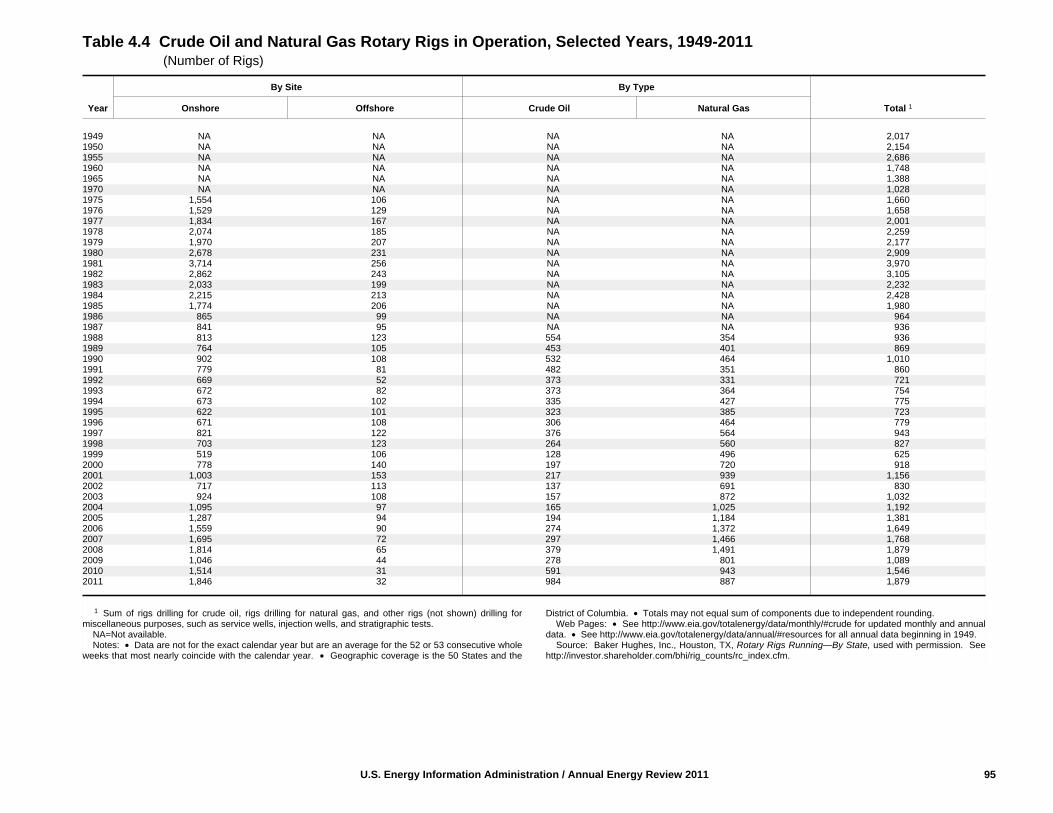
Figure 4.8 Coal Demonstrated Reserve Base, January 1, 2011
By Key State By Region
West and East of the Mississippi By Mining Method By Rank
102 U.S. Energy Information Administration / Annual Energy Review 2011
Source: Table 4.8.
119
104
61
32 29 27 2316 12 12 9
Montana Illinois Wyo- West Ken- Penn- Ohio Colo- Texas New Indiana0
20
40
60
80
100
120
140
Bill
ion
Sho
rt To
ns
230
156
98
Western Interior Appalachian0
50
100
150
200
250
300
350
Bill
ion
Sho
rt To
ns
ming Virginia tucky sylvania rado Mexico
257
177
43
8
Bitu- Subbitu- Lignite Anthracite0
50
100
150
200
250
300
Bill
ion
Sho
rt To
ns
254231
West of the East of the0
50
100
150
200
250
300
Bill
ion
Sho
rt To
ns
Mississippi
331
153
Underground Surface0
50
100
150
200
250
300
350
Bill
ion
Sho
rt To
ns
Mississippi minous minous

U.S. Energy Information Administration / Annual Energy Review 2011 103
Table 4.8 Coal Demonstrated Reserve Base, January 1, 2011 (Billion Short Tons)
Region and State
Anthracite Bituminous Coal Subbituminous Coal Lignite Total
Underground Surface Underground Surface Underground Surface Surface 1 Underground Surface Total
Appalachian .............................................. 4.0 3.3 68.2 21.9 0.0 0.0 1.1 72.1 26.3 98.4 Alabama ................................................... .0 .0 .9 2.1 .0 .0 1.1 .9 3.1 4.0 Kentucky, Eastern .................................... .0 .0 .8 9.1 .0 .0 .0 .8 9.1 9.8 Ohio .......................................................... .0 .0 17.4 5.7 .0 .0 .0 17.4 5.7 23.1 Pennsylvania ............................................ 3.8 3.3 18.9 .8 .0 .0 .0 22.7 4.2 26.9 Virginia ...................................................... .1 .0 .9 .5 .0 .0 .0 1.0 .5 1.5 West Virginia ............................................ .0 .0 28.3 3.4 .0 .0 .0 28.3 3.4 31.7 Other 2 ...................................................... .0 .0 1.1 .3 .0 .0 .0 1.1 .3 1.4
Interior ....................................................... .1 (s) 116.6 27.1 .0 .0 12.6 116.7 39.6 156.4 Illinois ........................................................ .0 .0 87.6 16.5 .0 .0 .0 87.6 16.5 104.2 Indiana ...................................................... .0 .0 8.6 .6 .0 .0 .0 8.6 .6 9.2 Iowa .......................................................... .0 .0 1.7 .5 .0 .0 .0 1.7 .5 2.2 Kentucky, Western ................................... .0 .0 15.6 3.6 .0 .0 .0 15.6 3.6 19.2 Missouri .................................................... .0 .0 1.5 4.5 .0 .0 .0 1.5 4.5 6.0 Oklahoma ................................................. .0 .0 1.2 .3 .0 .0 .0 1.2 .3 1.5 Texas ........................................................ .0 .0 .0 .0 .0 .0 12.1 .0 12.1 12.1 Other 3 ...................................................... .1 (s) .3 1.1 .0 .0 0.4 .4 1.5 1.9
Western ..................................................... (s) .0 21.2 2.3 121.2 55.9 29.2 142.4 87.4 229.7 Alaska ....................................................... .0 .0 .6 .1 4.8 .6 (s) 5.4 .7 6.1 Colorado ................................................... (s) .0 7.5 .6 3.7 .0 4.2 11.2 4.8 15.9 Montana .................................................... .0 .0 1.4 .0 69.6 32.3 15.8 70.9 48.0 119.0 New Mexico .............................................. (s) .0 2.7 .9 3.4 5.0 .0 6.1 5.9 12.0 North Dakota ............................................ .0 .0 .0 .0 .0 .0 8.9 .0 8.9 8.9 Utah .......................................................... .0 .0 4.9 .3 (s) .0 .0 4.9 .3 5.2 Washington ............................................... .0 .0 .3 .0 1.0 .0 (s) 1.3 (s) 1.3 Wyoming ................................................... .0 .0 3.8 .5 38.6 18.1 .0 42.5 18.5 61.0 Other 4 ...................................................... .0 .0 (s) .0 (s) (s) .4 (s) .4 .4
U.S. Total ................................................... 4.1 3.4 206.0 51.2 121.1 55.9 42.8 331.2 153.3 484.5 States East of the Mississippi River ......... 4.0 3.3 180.0 42.6 .0 .0 1.1 184.0 47.0 231.0 States West of the Mississippi River ........ .1 (s) 25.9 8.6 121.1 55.9 41.7 147.2 106.3 253.5
1 Lignite resources are not mined underground in the United States.2 Georgia, Maryland, North Carolina, and Tennessee.3 Arkansas, Kansas, Louisiana, and Michigan.4 Arizona, Idaho, Oregon, and South Dakota.(s)=Less than 0.05 billion short tons. Notes: • See U.S. Coal Reserves: 1997 Update on the Web Page for a description of the methodology
used to produce these data. • Data represent remaining measured and indicated coal resources, analyzed
and on file, meeting minimum seam and depth criteria, and in the ground as of January 1, 2011. Thesecoal resources are not totally recoverable. Net recoverability with current mining technologies ranges from0 percent (in far northern Alaska) to more than 90 percent. Fifty-four percent of the demonstrated reservebase of coal in the United States is estimated to be recoverable. • Totals may not equal sum ofcomponents due to independent rounding.
Web Page: For related information, see http://www.eia.gov/coal/.Source: U.S. Energy Information Administration, Coal Reserves Database.
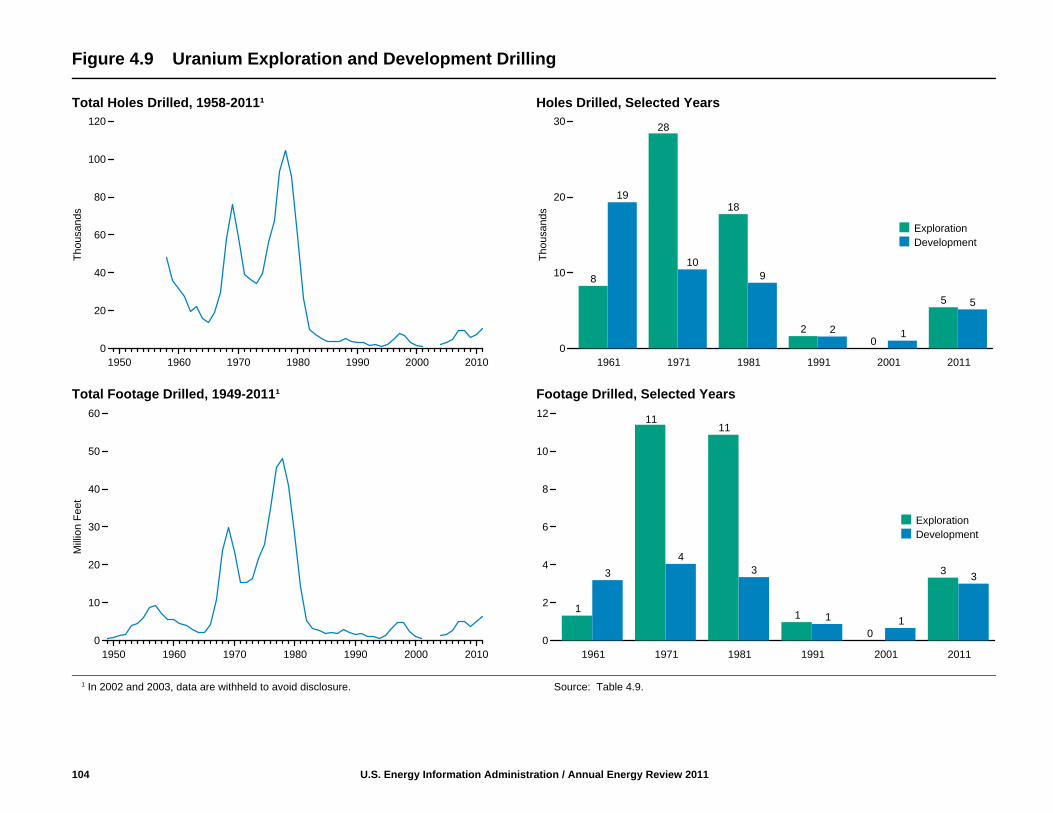
Figure 4.9 Uranium Exploration and Development Drilling
Total Holes Drilled, 1958-2011¹ Holes Drilled, Selected Years
Total Footage Drilled, 1949-2011¹ Footage Drilled, Selected Years
104 U.S. Energy Information Administration / Annual Energy Review 2011
1 In 2002 and 2003, data are withheld to avoid disclosure. Source: Table 4.9.
19
109
2 1
5
8
28
18
20
5
1961 1971 1981 1991 2001 20110
10
20
30
Thou
sand
s
ExplorationDevelopment
1950 1960 1970 1980 1990 2000 20100
20
40
60
80
100
120
Thou
sand
s
34
3
1 1
3
1
1111
1
0
3
1961 1971 1981 1991 2001 20110
2
4
6
8
10
12
ExplorationDevelopment
1950 1960 1970 1980 1990 2000 20100
10
20
30
40
50
60
Mill
ion
Feet

U.S. Energy Information Administration / Annual Energy Review 2011 105
Table 4.9 Uranium Exploration and Development Drilling, Selected Years, 1949-2011
Year
Exploration 1 Development 2 Total
Holes Drilled Footage Drilled Holes Drilled Footage Drilled Holes Drilled Footage Drilled
Thousands Million Feet Thousands Million Feet Thousands Million Feet
1949 NA 0.36 NA 0.05 NA 0.411950 NA .57 NA .21 NA .781955 NA 5.27 NA .76 NA 6.031960 7.34 1.40 24.40 4.21 31.73 5.611965 6.23 1.16 7.33 .95 13.56 2.111970 43.98 17.98 14.87 5.55 58.85 23.531975 34.29 15.69 21.60 9.73 55.89 25.421976 40.41 20.36 27.23 14.44 67.64 34.801977 62.60 27.96 30.86 17.62 93.45 45.581978 75.07 28.95 29.29 19.15 104.35 48.101979 60.46 28.07 30.19 13.01 90.65 41.081980 39.61 19.60 20.19 8.59 59.80 28.191981 17.75 10.87 8.67 3.35 26.42 14.221982 6.97 4.23 3.00 1.13 9.97 5.361983 4.29 2.09 3.01 1.08 7.30 3.171984 4.80 2.26 .72 .29 5.52 2.551985 2.88 1.42 .77 .34 3.65 1.761986 1.99 1.10 1.85 .97 3.83 2.071987 1.82 1.11 1.99 .86 3.81 1.971988 2.03 1.28 3.18 1.73 5.21 3.011989 2.09 1.43 1.75 .80 3.84 2.231990 1.51 .87 1.91 .81 3.42 1.681991 1.62 .97 1.57 .87 3.20 1.841992 .94 .56 .83 .50 1.77 1.061993 .36 .22 1.67 .89 2.02 1.111994 .52 .34 .48 .32 1.00 .661995 .58 .40 1.73 .95 2.31 1.351996 1.12 .88 3.58 2.16 4.70 3.051997 1.94 1.33 5.86 3.56 7.79 4.881998 1.37 .89 5.23 3.75 6.60 4.641999 .27 .18 2.91 2.33 3.18 2.502000 W W W W 1.55 1.022001 .00 .00 1.02 .66 1.02 .662002 W W W W W W2003 NA NA NA NA W W2004 W W W W 2.19 1.252005 W W W W 3.14 1.672006 1.47 .82 3.43 1.89 4.90 2.712007 4.35 2.20 5.00 2.95 9.35 5.152008 5.20 2.54 4.16 2.55 9.36 5.092009 1.79 1.05 3.89 2.69 5.68 3.742010 2.44 1.46 4.77 3.44 7.21 4.902011 5.44 3.32 5.16 3.00 10.60 6.33
1 Includes surface drilling in search of new ore deposits or extensions of known deposits and drilling atthe location of a discovery up to the time the company decides sufficient ore reserves are present to justifycommercial exploitation.
2 Includes all surface drilling on an ore deposit to determine more precisely size, grade, andconfiguration subsequent to the time that commercial exploitation is deemed feasible.
NA=Not available. W=Value withheld to avoid disclosure of individual company data. Note: Totals may not equal sum of components due to independent rounding.
Web Pages: • See http://www.eia.gov/totalenergy/data/annual/#resources for all data beginning in1949. • For related information, see http://www.eia.gov/nuclear/.
Sources: • 1949-1981—U.S. Department of Energy, Grand Junction Office, Statistical Data of theUranium Industry, January 1, 1983, Report No. GJO-100 (1983), Table VIII-5. • 1982-2002—U.S. EnergyInformation Administration (EIA), Uranium Industry Annual, annual reports. • 2003-2005—EIA, "DomesticUranium Production Report," annual reports. • 2006 forward—EIA, "2011 Domestic Uranium ProductionReport" (May 2012), Table 1.

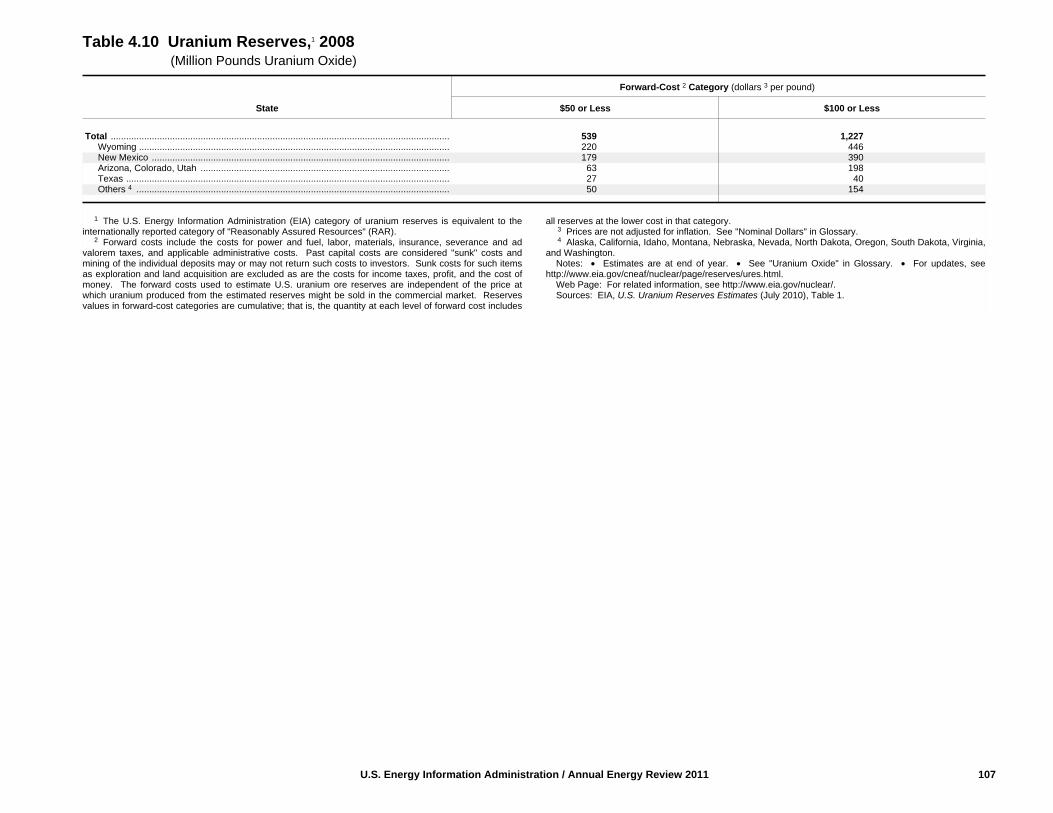
Figure 4.10 Uranium Reserves, 2008
By State Total Reserves
106 U.S. Energy Information Administration / Annual Energy Review 2011
1 See “Nominal Dollars” in Glossary.2 Alaska, California, Idaho, Montana, Nebraska, Nevada, North Dakota, Oregon, South Dakota,
Virginia, and Washington.
Notes: • See “Uranium Oxide” in Glossary. • Data are at end of year.Source: Table 4.10.
Forward-Cost Category(dollars¹ per pound)
539
1,227
$50 or Less $100 or Less
0
500
1,000
1,500
Mill
ion
Pou
nds
Ura
nium
Oxi
de
Forward-Cost Category(dollars¹ per pound)
Colorado,Utah
446
390
198
40
154
220
179
63
27
50
Wyoming New Arizona, Texas Others²
0
100
200
300
400
500
Mill
ion
Pou
nds
Ura
nium
Oxi
de
$50 or Less$100 or Less
Mexico
U.S. Energy Information Administration / Annual Energy Review 2011 107
Table 4.10 Uranium Reserves,1 2008 (Million Pounds Uranium Oxide)
State
Forward-Cost 2 Category (dollars 3 per pound)
$50 or Less $100 or Less
Total .................................................................................................................................... 539 1,227 Wyoming ......................................................................................................................... 220 446 New Mexico .................................................................................................................... 179 390 Arizona, Colorado, Utah ................................................................................................. 63 198 Texas .............................................................................................................................. 27 40 Others 4 .......................................................................................................................... 50 154
1 The U.S. Energy Information Administration (EIA) category of uranium reserves is equivalent to theinternationally reported category of "Reasonably Assured Resources" (RAR).
2 Forward costs include the costs for power and fuel, labor, materials, insurance, severance and advalorem taxes, and applicable administrative costs. Past capital costs are considered "sunk" costs andmining of the individual deposits may or may not return such costs to investors. Sunk costs for such itemsas exploration and land acquisition are excluded as are the costs for income taxes, profit, and the cost ofmoney. The forward costs used to estimate U.S. uranium ore reserves are independent of the price atwhich uranium produced from the estimated reserves might be sold in the commercial market. Reservesvalues in forward-cost categories are cumulative; that is, the quantity at each level of forward cost includes
all reserves at the lower cost in that category.3 Prices are not adjusted for inflation. See "Nominal Dollars" in Glossary.4 Alaska, California, Idaho, Montana, Nebraska, Nevada, North Dakota, Oregon, South Dakota, Virginia,
and Washington. Notes: • Estimates are at end of year. • See "Uranium Oxide" in Glossary. • For updates, see
http://www.eia.gov/cneaf/nuclear/page/reserves/ures.html.Web Page: For related information, see http://www.eia.gov/nuclear/.Sources: EIA, U.S. Uranium Reserves Estimates (July 2010), Table 1.

Figure 4.11 Concentrating Solar Resources
108 U.S. Energy Information Administration / Annual Energy Review 2011
Notes: • Annual average direct normal solar resource data are shown. • kWh/m2/Day =kilowatthours per square meter per day.
Web Page: For related information, see http://www.nrel.gov/gis/maps.html.Sources: This map was created by the National Renewable Energy Laboratory for the
Department of Energy (October 20, 2008). The data for Hawaii and the 48 contiguous Statesare a 10-kilometer (km) satellite modeled dataset (SUNY/NREL, 2007) representing data from1998-2005. The data for Alaska are a 40-km dataset produced by the Climatological SolarRadiation Model (NREL, 2003).

Figure 4.12 Photovoltaic Solar Resources
U.S. Energy Information Administration / Annual Energy Review 2011 109
Notes: • Annual average solar resource data are shown for a tilt=latitude collector. • kWh/m2/Day =kilowatthours per square meter per day.
Web Page: For related information, see http://www.nrel.gov/gis/maps.html.
Sources: This map was created by the National Renewable Energy Laboratory for the Depart-ment of Energy (October 20, 2008). The data for Hawaii and the 48 contiguous States are a10-kilometer (km) satellite modeled dataset (SUNY/NREL, 2007) representing data from 1998-2005. The data for Alaska are a 40-km dataset produced by the Climatological Solar RadiationModel (NREL, 2003).

Figure 4.13 Onshore Wind Resources
110 U.S. Energy Information Administration / Annual Energy Review 2011
Notes: • Data are annual average wind speed at 80 meters. • m/s = meters per second.Web Page: For related information, see http://www.nrel.gov/gis/maps.html.Sources: This map was created by the National Renewable Energy Laboratory for the
Department of Energy (April 1, 2011). Wind resource estimates developed by AWS
Truepower, LLC for windNavigator®. See http://www.windnavigator.com and http://www.awstruepower.com. Spatial resolution of wind resource data: 2.5 kilometers.Projection: Albers Equal Area WGS84.

Figure 4.14 Offshore Wind Resources
U.S. Energy Information Administration / Annual Energy Review 2011 111
Notes: • Data are annual average wind speed at 90 meters. • m/s = meters per second. • mph = miles per hour.
Web Page: For related information, see http://www.nrel.gov/gis/maps.html.Source: This map was created by the National Renewable Energy Laboratory for the
Department of Energy (January 10, 2011).

Figure 4.15 Geothermal Resources
112 U.S. Energy Information Administration / Annual Energy Review 2011
Notes: • Data are for locations of identified hydrothermal sites and favorability of deepenhanced geothermal systems (EGS). • Map does not include shallow EGS resourceslocated near hydrothermal sites or USGS assessment of undiscovered hydrothermalresources. • *”N/A” regions have temperatures less than 150°C at 10 kilometers (km) depthand were not assessed for deep EGS potential. • **Temperature at depth data for deep EGSin Alaska and Hawaii not available.
Web Page: For related information, see http://www.nrel.gov/gis/maps.html.
Sources: This map was created by the National Renewable Energy Laboratory for theDepartment of Energy (October 13, 2009). Source data for deep EGS includes tempera-ture at depth from 3 to 10 km provided by Southern Methodist University GeothermalLaboratory (Blackwell & Richards, 2010) and analyses (for regions with temperatures150°C) performed by NREL (2009). Source data for identified hydrothermal sites fromUSGS Assessment of Moderate- and High-Temperature Geothermal Resources of theUnited States (2008).

Figure 4.16 Biomass Resources
U.S. Energy Information Administration / Annual Energy Review 2011 113
Notes: • Data are for total biomass per square kilometer. • km2 = square kilometer. • Thisstudy estimates the biomass resources currently available in the United States by county. Itincludes the following feedstock categories: crop residues (5 year average: 2003-2007), forestand primary mill residues (2007), secondary mill and urban wood waste (2002), methane emis-sions from landfills (2008), domestic wastewater treatment (2007), and animal manure (2002).For more information on the data development, please refer to http://www.nrel.gov/docs/fy06osti/39181.pdf.
Although, the document contains the methodology for the development of an older assessment,the information is applicable to this assessment as well. The difference is only in the data’s timeperiod.
Web Page: For related information, see http://www.nrel.gov/gis/maps.html.Source: This map was created by the National Renewable Energy Laboratory for the Depart-
ment of Energy (September 23, 2009).

THIS PAGE INTENTIONALLY LEFT BLANK