Embed Size (px)
Citation preview
_______________________________________________________________
Route 79/I-195 Interchange Reconstruction Project Fall River, MA
PART 1 NEPA
Environmental Assessment
4. EXISTING ENVIRONMENT
4.1 Introduction
Terminology: The existing interchange is a complex system of roads and ramps. Readers are directed to Section 4.3 for a detailed description of the existing interchange and roadway network. In Section 4.3, photos, figures, and text explain the roadways, bridges, and ramp system, as well as roadway and ramp nomenclature. The terms at-grade and grade-separated are discussed in Section 1.1.
FHWA NEPA guidance documents, the MassGIS database, literature searches, and site investigations were used to identify environmental elements within the project area.
Some categories of potential environmental effect are not present within the project area. The project area does not contain farmland, state or federal rare and endangered species, or drinking water resources. Additionally, since the natural soils and geology have been highly modified during the development of the mills, railroad, and highway system, soils and geology are not discussed as part of the existing environment except relative to oil and hazardous material contamination.
4.2 Land Use
4.2.1 History and Geography
The City of Fall River is located in southeastern Massachusetts in Bristol County. The city was built on a series of terraces down to the Taunton River. Geography can often influence, if not determine, a city’s future. In the case of Fall River, it can be said that geography not only determined the city’s future development but gave it its name. The Quequechan River (discussed separately in Section 4.8) is a Wampanoag word meaning Falling River. The river gave both its name and water power to the city. The Quequechan River flows westerly through the city, historically dropping steeply through a series of falls west of Plymouth Avenue to the Taunton River and Mount Hope Bay. That water power, combined with the navigation and port facilities on the Taunton River, made Fall River an industrial giant and the leading textile manufacturing center in the United States in the 19th and early 20th centuries. The water power of Quequechan River was harnessed as mills were built next to and even over the river. Although textile manufacturing is no longer the dominant industry, its impact on the city's landscape and culture is still evident with the many brick mill buildings near the waterfront.
In the early 1960s, I-195 was completed during the period of extensive construction for the interstate highway system. To accommodate the I-195 roadway, the open water
Existing Environment 4-1
_______________________________________________________________
Route 79/I-195 PART 1 Interchange Reconstruction Project NEPA Fall River, MA Environmental Assessment
section of the Quequechan River west of Plymouth Avenue was realigned in a series of underground culverts and control structures which connected to the existing control structures and underground culverts under the mill buildings. West of the mill buildings, the Quequechan River was put in an open channel which flows under the Braga Bridge. The river continues in an open channel under the Central Street Bridge and into Battleship Cove. The alignment of the Quequechan River can be seen on Figure 4-16.
East of Plymouth Avenue, a portion of the Quequechan River was filled for the construction of I-195. Mills and other buildings, including the old city hall, were demolished to construct I-195 through the center of the city.
The Route 79/I-195 Interchange is within the city’s working waterfront and recreational area, an area that also includes manufacturing and mixed residential and commercial areas.
Fall River is host to many ethnic festivals which celebrate its heritage as well as the diversity of the city. Today, the city strives to diversify and strengthen its economy by maintaining long standing historical industries such as chemicals, while encouraging new industries, such as wind turbine blades.
4.2.2 Zoning and the Central Business District
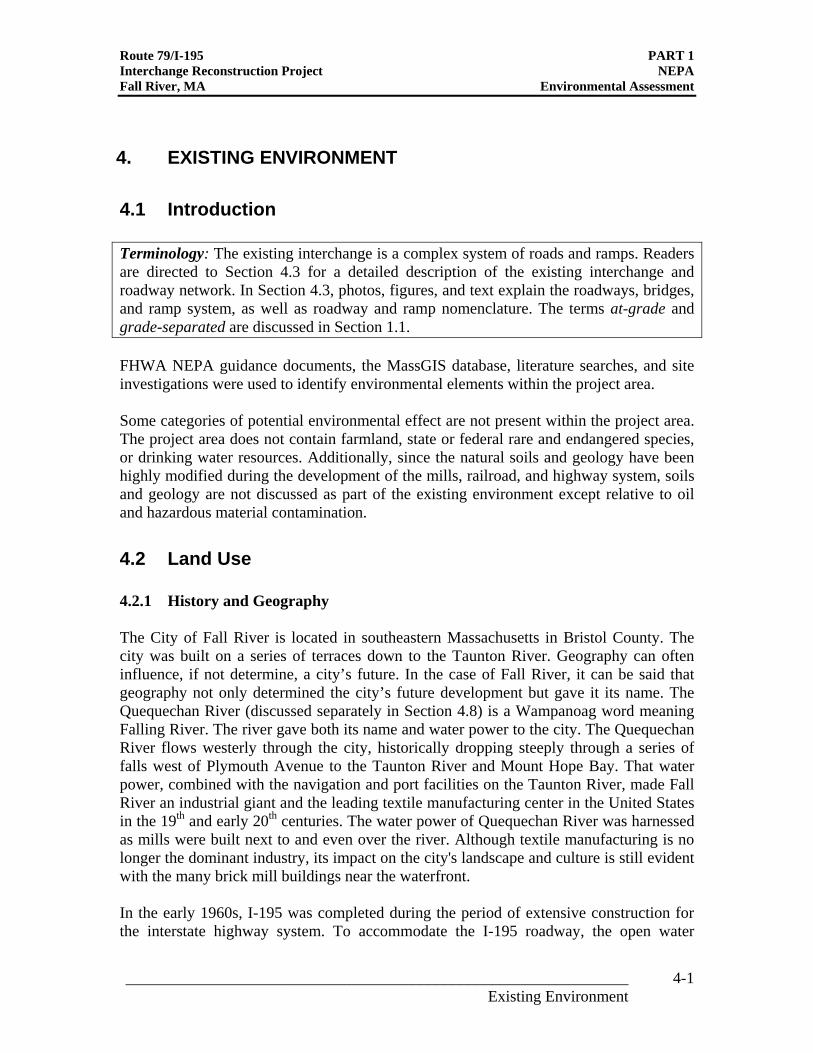
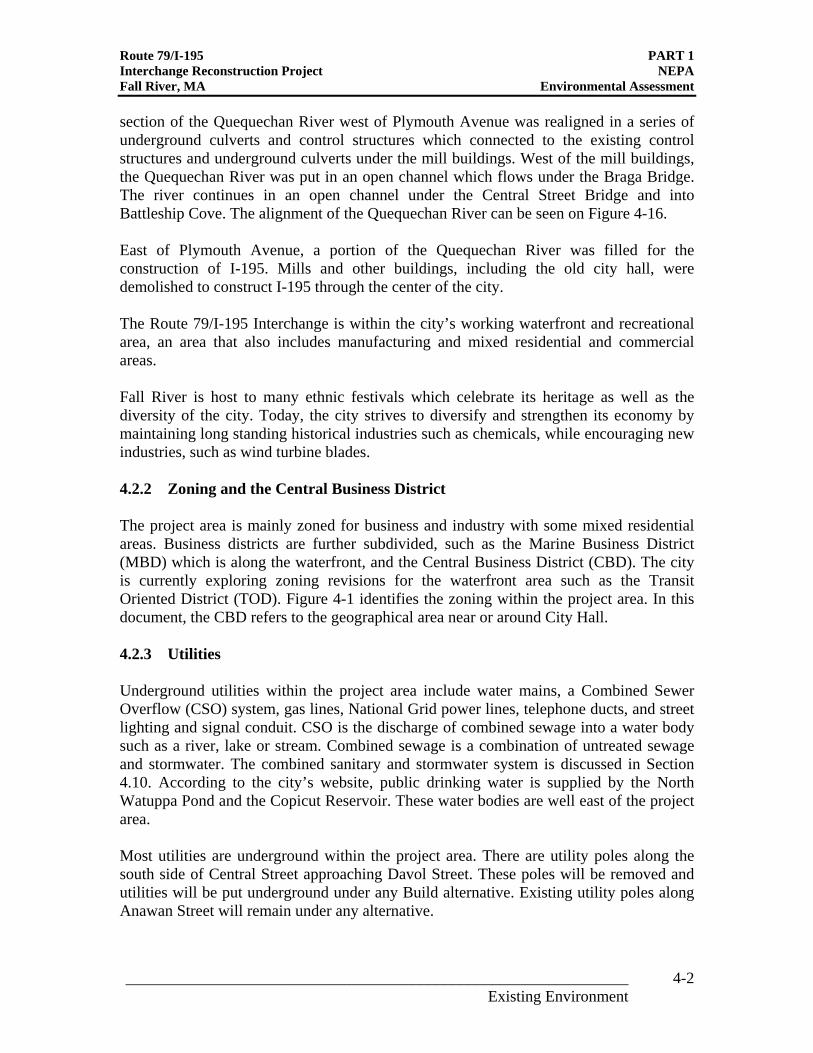
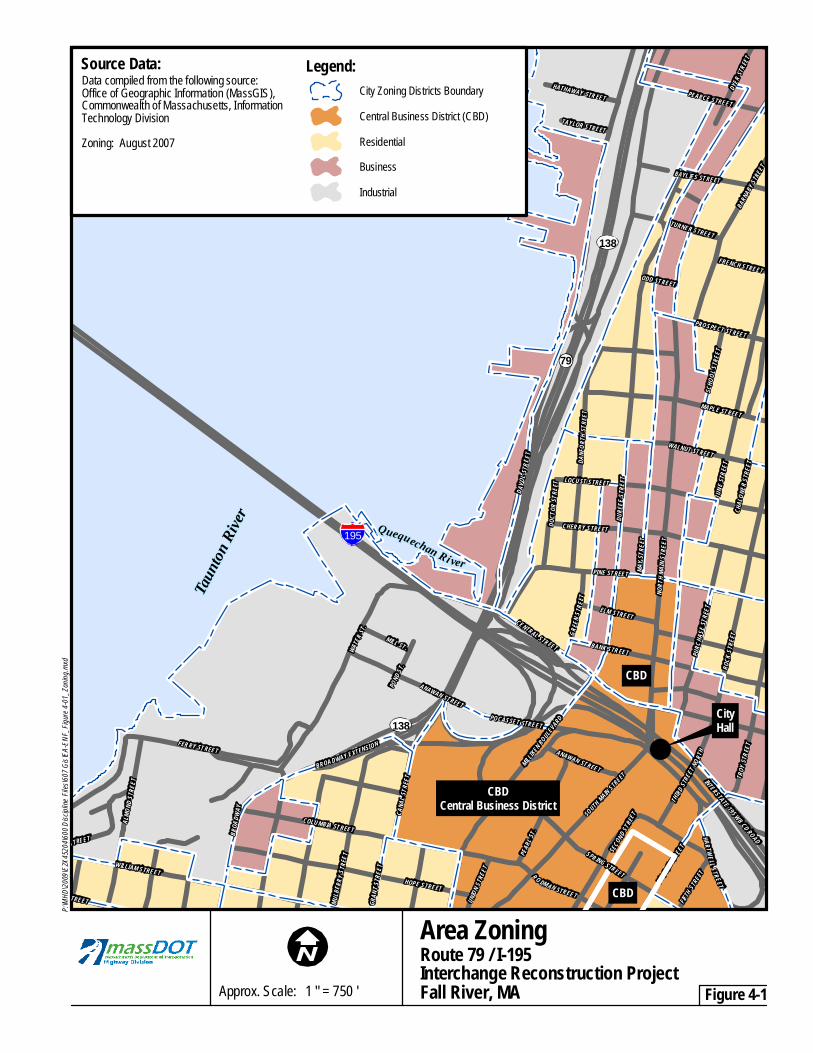
The project area is mainly zoned for business and industry with some mixed residential areas. Business districts are further subdivided, such as the Marine Business District (MBD) which is along the waterfront, and the Central Business District (CBD). The city is currently exploring zoning revisions for the waterfront area such as the Transit Oriented District (TOD). Figure 4-1 identifies the zoning within the project area. In this document, the CBD refers to the geographical area near or around City Hall.
4.2.3 Utilities
Underground utilities within the project area include water mains, a Combined Sewer Overflow (CSO) system, gas lines, National Grid power lines, telephone ducts, and street lighting and signal conduit. CSO is the discharge of combined sewage into a water body such as a river, lake or stream. Combined sewage is a combination of untreated sewage and stormwater. The combined sanitary and stormwater system is discussed in Section 4.10. According to the city’s website, public drinking water is supplied by the North Watuppa Pond and the Copicut Reservoir. These water bodies are well east of the project area.
Most utilities are underground within the project area. There are utility poles along the south side of Central Street approaching Davol Street. These poles will be removed and utilities will be put underground under any Build alternative. Existing utility poles along Anawan Street will remain under any alternative.
Existing Environment 4-2
CLUB
PRESIDENT AVENUE
DIVISION
BAY STREET
DURF
EEST
REET
NORT
H MAIN
STRE
ET
JUNE
STRE
ET
D AVO
L STR
E ET
ROCK
STRE
ET
PINE STREET
HOPE STREET
WILLIAM STREET
COLUMBIA STREET
BANK STREET WATE
R ST .
CHERRY STREET
LOCUST STREET
CENTRAL STREET
MAPLE STREET
DANF
ORTH
STRE
ETSOUTH
MAIN STREET
BARN
ABY STR
EET
SPRING STREET
ALMO
NDST
REET
PURC
HASE
STRE
ET
MILLIKEN BOULEVARD
BROA DWAY EXTENSION FERRY STREET
M ULB
E RR Y
S TRE
E T
CANA
L STR
EET
BROA
DWAY
POCASSET STREET
STREET
PEAR
L ST.
TROY
STRE
ET
PEARCE STREET
SECOND
STRE
ET
FOURTH
STREE
T
DYER
STREE
T
ELM STREET
GREE
N STR
EET
STREET
THI RD
STREE
T NORT
H
PROSPECT STREET
HAR TWE LLSTR EET
SCHO
OLST
REET
GRAN
T STR
EET
ANAWAN STREET
R O DMAN STREET IF FTHSTR
EET
MILL ST.
UNION
STRE
ET
INTERSTATE 195 WB CD ROAD
HATHAWAY STREET
FRENCH STREET
MAY S
TREE
T
TURNER STREET
TAYLOR STREET
ODD STREET
POND
ST.
DOCT
ORST
REET
CHAL
ONER
STRE
ET
BAYLIES STREET
ANAWAN STREET
WALNUT STREET
Taunto
n Rive
r
Quequechan Ri ver
Source Data: Legend:Data compiled from the following source:Office of Geographic Information (MassGIS), City Zoning Districts BoundaryCommonwealth of Massachusetts, InformationTechnology Division Central Business District (CBD)Zoning: August 2007 Residential
Business Industrial
138
79
195
P:\MH
D\2009
\E2X4
5204\6
00 Dis
cipline
Files
\607 G
is\EA-E
NF_F
igure
4-01_
Zoning
.mxd
CBD
138 CitHal
yl
CBDCentral Business District
Area ZoningRoute 79 / I-195Interchange Reconstruction Project
Approx. Scale: 1 " = 750 ' Fall River, MA Figure 4-1
CBD
_______________________________________________________________
Route 79/I-195 PART 1 Interchange Reconstruction Project NEPA Fall River, MA Environmental Assessment
4.3 Transportation Network
4.3.1 Introduction and Terminology
Introduction
The transportation network within the project area includes interstate, regional, and local roadway facilities, as well as transit facilities and non-vehicular modes of transportation facilities for cyclists and pedestrians.
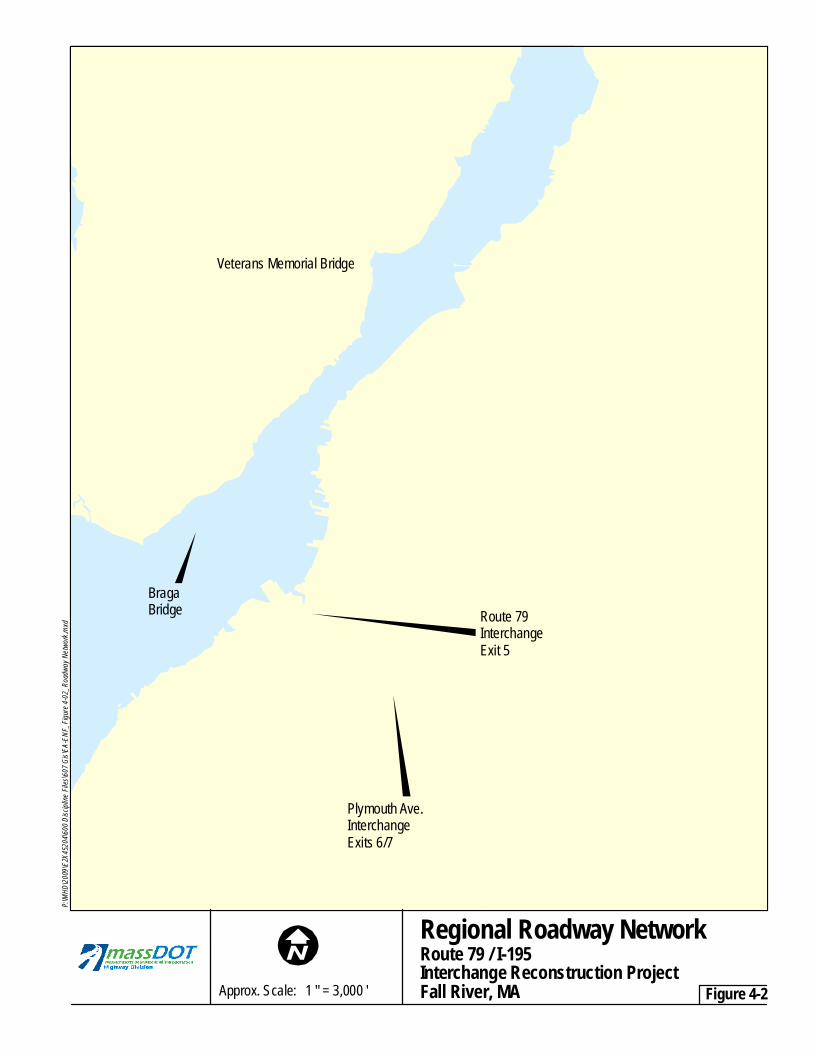
Roadways include Interstate 195 in the east-west direction, state Routes 79 and 138 in the north-south direction and Route 24 in the north-south direction east of the project area. These and other local roadways in the region are discussed below and can be located on Figures 4-2, 4-3, 4-4, and 4-5. Transit facilities are discussed in Section 4.3.7 and bicycle and pedestrian accommodations are discussed in Section 4.5.
Roadway and Traffic Terminology
Although we all use the transportation network everyday as drivers, pedestrians, or cyclists, the terms used to describe roadway geometry, traffic operations and the various parts of the roadway system may not be familiar. Some roadway terms used in this document are defined below. Other terms are defined throughout the document.
Acceleration lane: An auxiliary lane at the end of an entrance ramp that allows entering traffic to increase speed before merging into the main travel lanes, at which point the auxiliary lane terminates.
At-grade roadway: Roadway which intersects with other roadways requiring traffic control (traffic signals or stop signs etc.).
Auxiliary lane: A lane with a relatively short length that can be used to both enter and exit the highway.
Deceleration lane: An auxiliary lane at the beginning of an exit ramp with enough length for a vehicle to reduce travel speed in order to safely maneuver along ramp curvature.
Diverge junction: An exit ramp diverging from the mainline along the same general direction.
Grade-separated: Two roadways in the vicinity of each other that do not intersect because of different roadway elevations.
Horizontal alignment: A description of the roadway horizontal curvature connecting the straight sections of road, known as tangents. If a horizontal curve has a high speed and a
Existing Environment 4-4
_______________________________________________________________
Route 79/I-195 PART 1 Interchange Reconstruction Project NEPA Fall River, MA Environmental Assessment
small radius of curvature, an increased superelevation (bank) is needed in order to aid in safe steering of motor vehicles on curved roadways.
Interchange: A grade-separated junction of two roadways with full or partial access between them. The term "interchange" can refer to a junction between a freeway and a surface street or a junction between a freeway and another freeway.
Merge junction: An entrance ramp and a mainline merging together in the same general direction.
Ramp: A short section of road (either for an on-ramp and off-ramp) which allows vehicles to enter or exit a freeway or arterial.
Roadway geometry: Road design features related to the curvature of the roadway (horizontal and vertical alignment) and the roadway cross section (number of lanes and lane width, presence of shoulders and curbs) that relate to the roadway’s operation and safety.
Ramp junction: The point of connection of a ramp with a roadway.
Terminus: Either end of a transportation route.
Tangent section: Straight section of road.
Vertical alignment: A description of the roadway vertical curvature which is used to provide a gradual change so that vehicles may smoothly navigate uphill and downhill.
Weave lane: A lane used to both enter and exit the highway.
Weaving: A situation in which vehicles maneuvering right to take an off-ramp, and vehicles maneuvering left from an on-ramp must cross paths within a limited distance. In highly urban areas, there frequently is not enough space to locate the ramps further apart or provide frontage roads to avoid weaving sections.
4.3.2 Regional Roadways
Interstate 195 I-195 runs east-west from Providence, Rhode Island, through Fall River and New Bedford, ending at I-495 in Wareham, MA. It was constructed between the late 1950s and the early 1970s. Parts of the then-called "Cape Cod Expressway" and the "Providence Connection" were included in the Interstate Highway System. The route received a preliminary designation of I-95E, as a spur off the mainline I-95 and was soon after designated as I-195.
Existing Environment 4-5
P:\MH
D\2009
\E2X4
5204\6
00 Dis
cipline
Files
\607 G
is\EA-E
NF_F
igure
4-02_
Roadw
ay Ne
twork.m
xd Source Data:Data compiled from the following source:Office of Geographic Information (MassGIS), Commonwealthof Massachusetts, Information Technology Division
Legend: Interstate - Limited Access Highway U.S. Highway State Route Major Road
195
6
6
79
24
81
103
138
138
138
24
6
79
F a l l R i v e r
S o m e r s e t
Wes t
p or t
Veterans Memorial Bridge
BrB
agaridge Route 79
Interchange Ex it 5
Plymouth Ave. IEx nterchange
its 6/7
Interchange Reconstruction ProjectApprox. Scale: 1 " = 3,000 ' Fall River, MA -Figure 4 2
Regional Roadway Network Route 79 / I-195
PRESIDENT AVENUE
BAY STREET
DURF
EEST
REET
NORT
H MAIN
STRE
ET
DAVO
L STR
EET S
.B.
ROCK
STRE
ET
PINE STREET
HOPE STREET
WILLIAM STREET
COLUMBIA STREET
CHERRY STREET
LOCUST STREET
CENTRAL STREET
MAPLE STREET
DANF
ORTH
ST.
SOUTH MAIN ST.
BARN
ABY ST.
SPRING STREET
PURC
HASE
STRE
ET
MILLIKEN
BOULEVARD
BROADWAY EXTENSION FERRY STREET
MULB
ERRY
ST.
CANA
L STR
EET
BROA
DWAY
POCASSET ST.
PEAR
L ST.
TROY
STRE
ET
PEARCE STREET
FOUN
TAIN
ST.
SECON
D STREET
GREE
N ST.
THIRD
STREE
T NOR
TH
PROSPECT ST.
HARTWELL STREET
CEDAR STREET
SCHO
OLST
.
GRAN
T ST
ANAWAN ST.
R ODMAN STREET
MILL ST.
UNION
ST.
HATHAWAY STREET TAYLOR STREET
POND
ST.
BAYLIES STREET
ANAWAN STREET
WATE
R ST.
FERRY ST.
HARB
OR TERR.
DAVO
L STR
EET N
.B.
PONTA
DELGAD
A BLVD
.
WALNUT STREET
TURNER ST.
BRAGA BRIDGE
ODD ST.
SPRING ST.
Taun
tonRiv
er
Source Data:Data compiled from the following source:Office of Geographic Information (MassGIS), Commonwealthof Massachusetts, Information Technology Division
!(
U138V79
DAVOL STREETTURNAROUND
§̈¦195
P:\MH
D\2009
\E2X4
5204\6
00 Dis
cipline
Files\
607 Gi
s\EA-E
NF_F
igure
4-03_S
treet L
ocus M
ap.mx
d
!(79
U138V
CONNECTORSTREET
I Route 79 / I-195Interchange Reconstruction Project
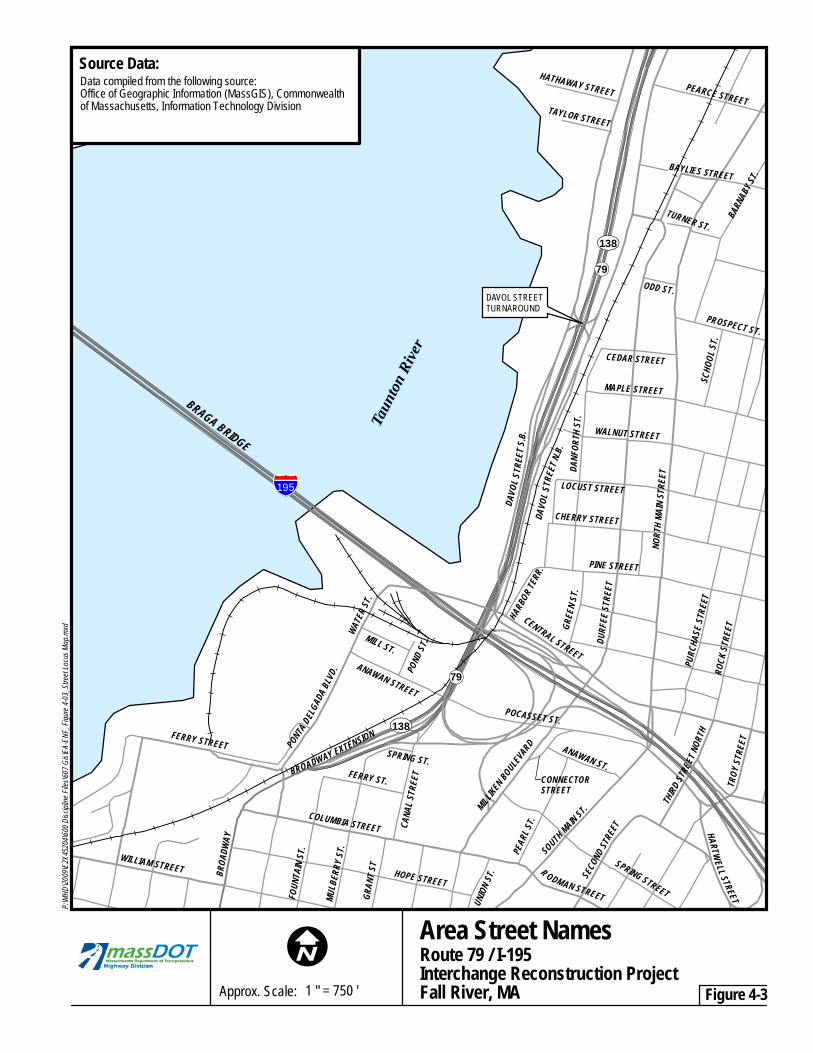
Approx. Scale: 1 " = 750 ' Fall River, MA -Figure 4 31"=750'
Area Street Names
Route 79/I-195 PART 1 Interchange Reconstruction Project NEPA Fall River, MA Environmental Assessment
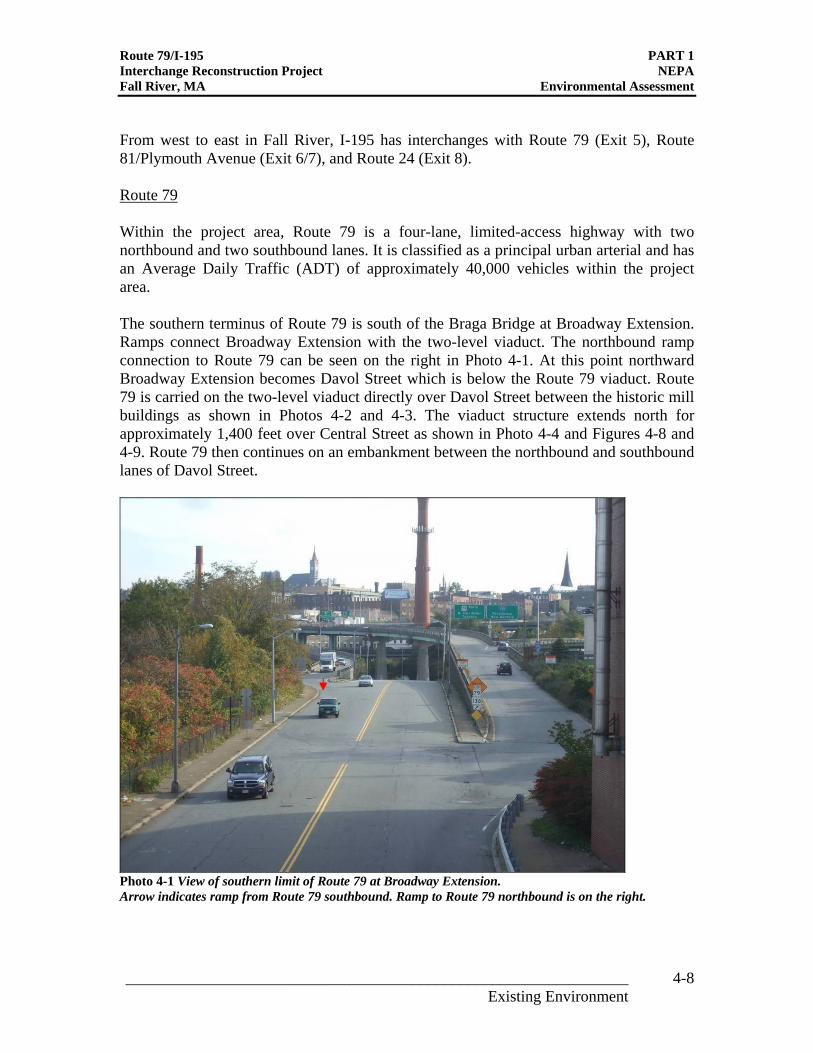
From west to east in Fall River, I-195 has interchanges with Route 79 (Exit 5), Route 81/Plymouth Avenue (Exit 6/7), and Route 24 (Exit 8). Route 79 Within the project area, Route 79 is a four-lane, limited-access highway with two northbound and two southbound lanes. It is classified as a principal urban arterial and has an Average Daily Traffic (ADT) of approximately 40,000 vehicles within the project area. The southern terminus of Route 79 is south of the Braga Bridge at Broadway Extension. Ramps connect Broadway Extension with the two-level viaduct. The northbound ramp connection to Route 79 can be seen on the right in Photo 4-1. At this point northward Broadway Extension becomes Davol Street which is below the Route 79 viaduct. Route 79 is carried on the two-level viaduct directly over Davol Street between the historic mill buildings as shown in Photos 4-2 and 4-3. The viaduct structure extends north for approximately 1,400 feet over Central Street as shown in Photo 4-4 and Figures 4-8 and 4-9. Route 79 then continues on an embankment between the northbound and southbound lanes of Davol Street.
Photo 4-1 View of southern limit of Route 79 at Broadway Extension. Arrow indicates ramp from Route 79 southbound. Ramp to Route 79 northbound is on the right.
_______________________________________________________________ Existing Environment
4-8
_______________________________________________________________ 4-9 Existing Environment
Route 79/I-195 PART 1 Interchange Reconstruction Project NEPA Fall River, MA Environmental Assessment
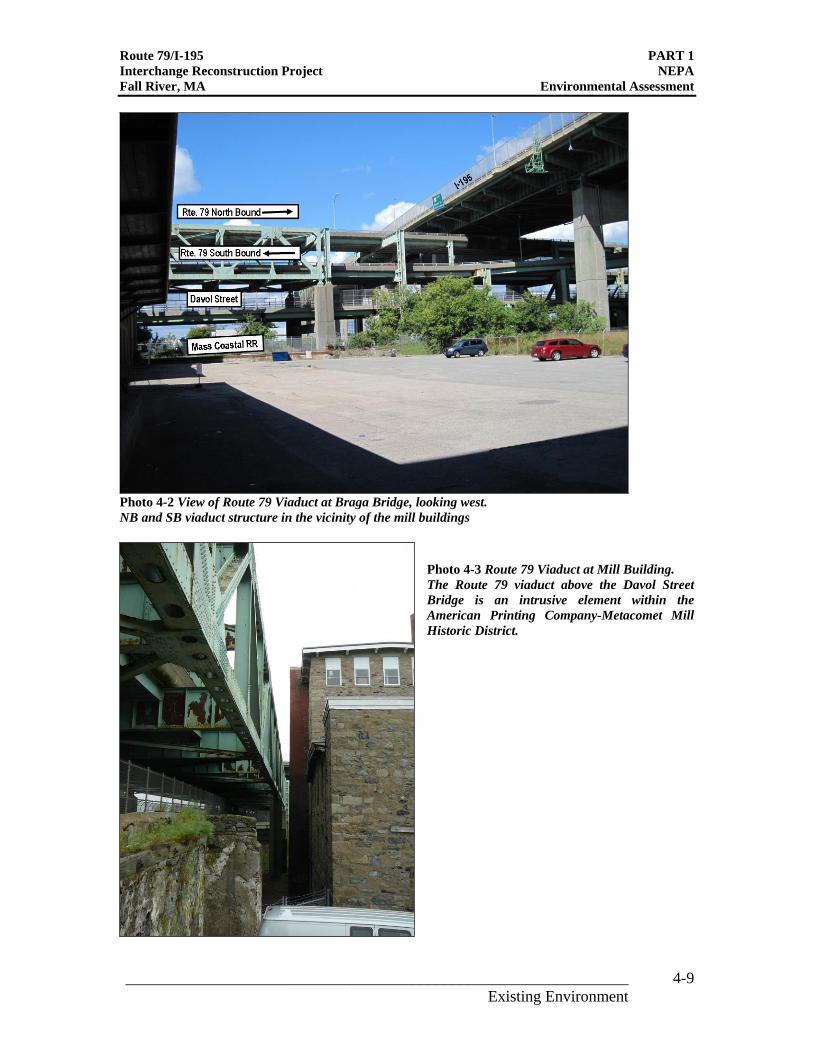
Photo 4-2 View of Route 79 Viaduct at Braga Bridge, looking west. NB and SB viaduct structure in the vicinity of the mill buildings
Photo 4-3 Route 79 Viaduct at Mill Building. The Route 79 viaduct above the Davol Street Bridge is an intrusive element within the American Printing Company-Metacomet Mill Historic District.
Route 79/I-195 PART 1 Interchange Reconstruction Project NEPA Fall River, MA Environmental Assessment
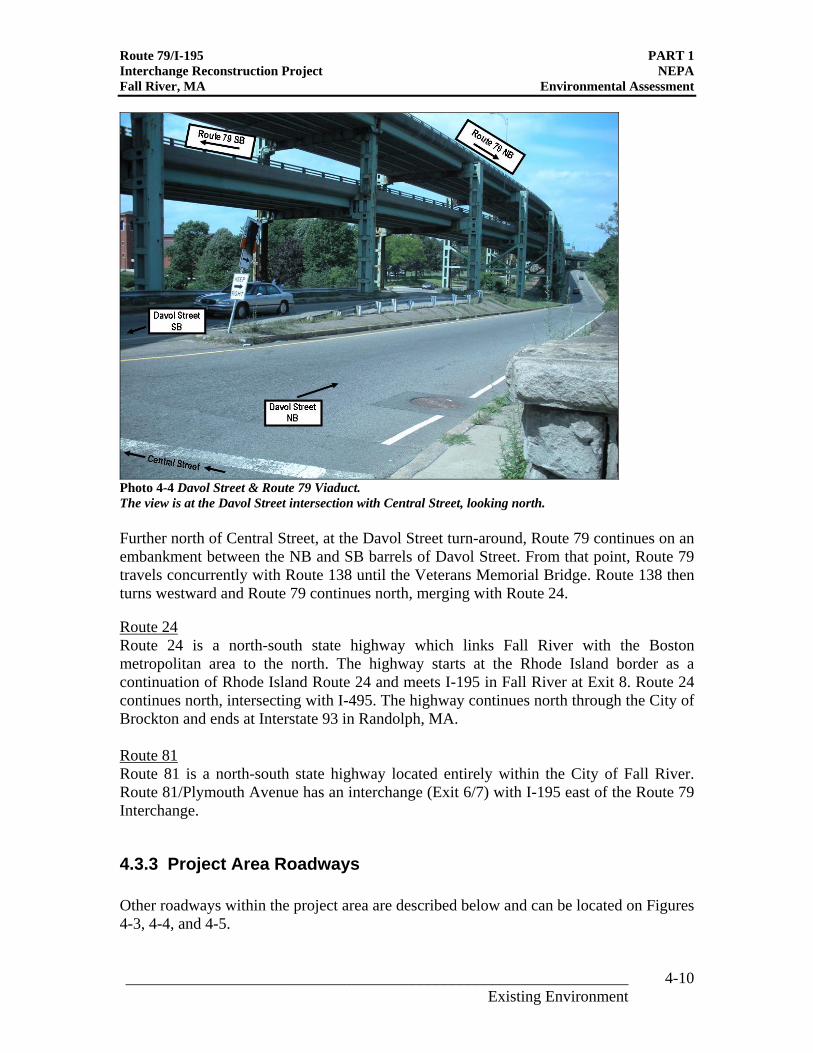
Photo 4-4 Davol Street & Route 79 Viaduct. The view is at the Davol Street intersection with Central Street, looking north. Further north of Central Street, at the Davol Street turn-around, Route 79 continues on an embankment between the NB and SB barrels of Davol Street. From that point, Route 79 travels concurrently with Route 138 until the Veterans Memorial Bridge. Route 138 then turns westward and Route 79 continues north, merging with Route 24. Route 24 Route 24 is a north-south state highway which links Fall River with the Boston metropolitan area to the north. The highway starts at the Rhode Island border as a continuation of Rhode Island Route 24 and meets I-195 in Fall River at Exit 8. Route 24 continues north, intersecting with I-495. The highway continues north through the City of Brockton and ends at Interstate 93 in Randolph, MA. Route 81 Route 81 is a north-south state highway located entirely within the City of Fall River. Route 81/Plymouth Avenue has an interchange (Exit 6/7) with I-195 east of the Route 79 Interchange.
4.3.3 Project Area Roadways Other roadways within the project area are described below and can be located on Figures 4-3, 4-4, and 4-5.
_______________________________________________________________ 4-10 Existing Environment
Route 79/I-195 PART 1 Interchange Reconstruction Project NEPA Fall River, MA Environmental Assessment
Route 138/Broadway Extension is a two-way north-south arterial with its northern terminus at Anawan/Pocasset Street. Its southern terminus is at the Rhode Island state line where it becomes RI Route 138. The facility primarily services low density commercial and retail. North of Anawan Street, Route 138/Broadway Extension becomes Davol Street. At that point Route 138 runs concurrently with Route 79. It then turns westward and Route 79 continues north, merging with Route 24.
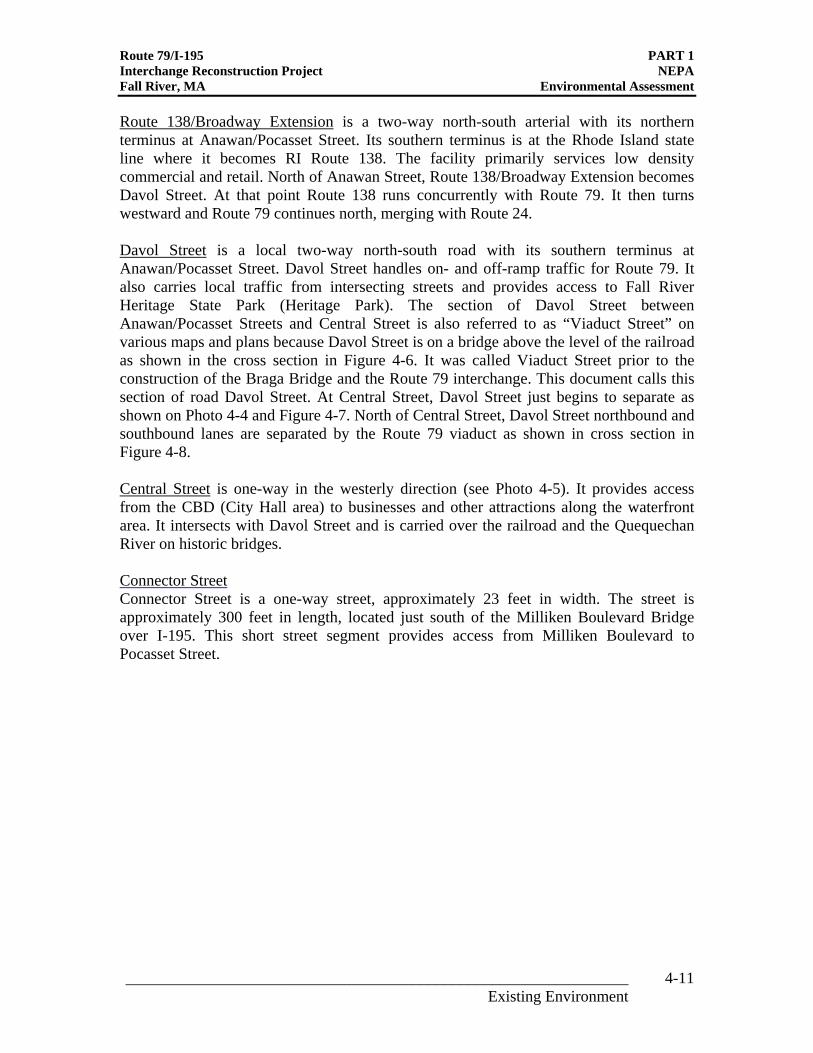
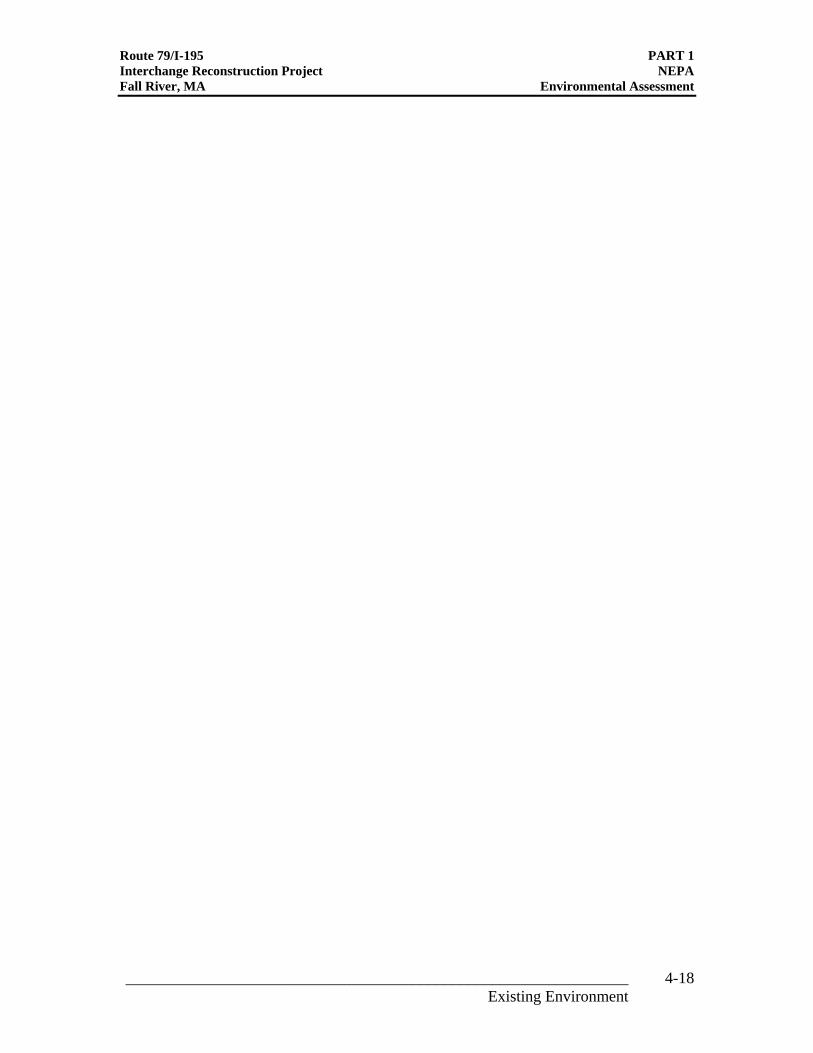
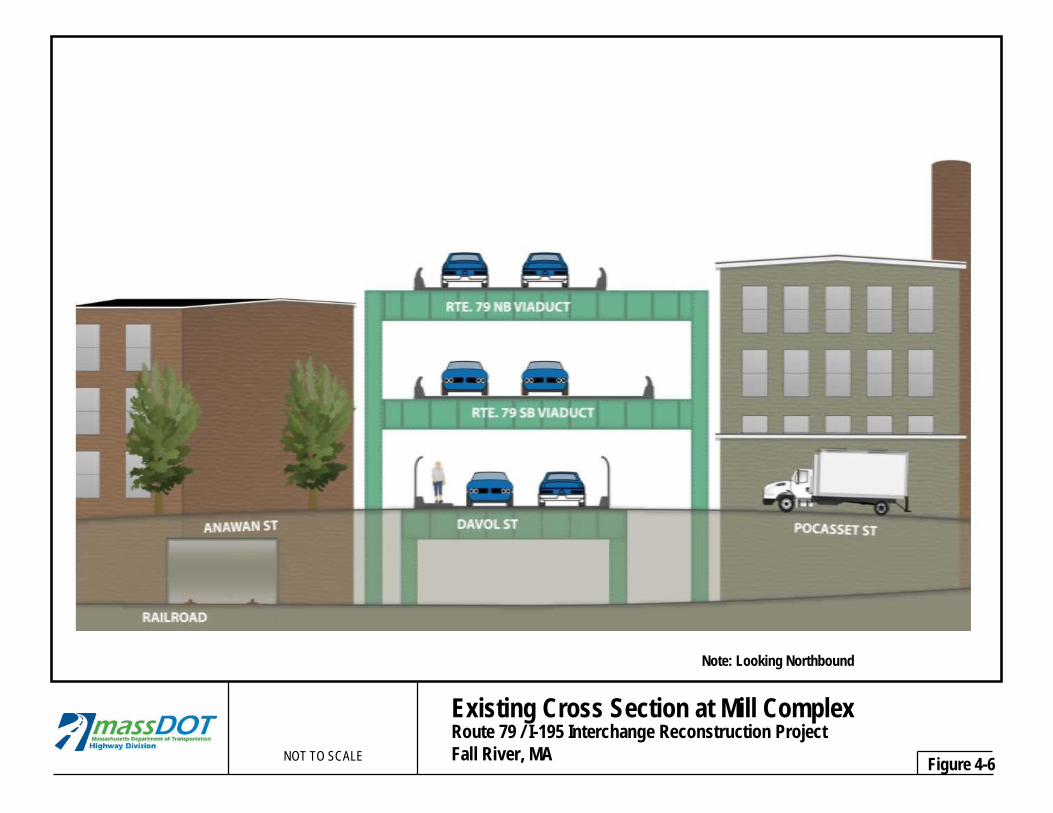
Davol Street is a local two-way north-south road with its southern terminus at Anawan/Pocasset Street. Davol Street handles on- and off-ramp traffic for Route 79. It also carries local traffic from intersecting streets and provides access to Fall River Heritage State Park (Heritage Park). The section of Davol Street between Anawan/Pocasset Streets and Central Street is also referred to as “Viaduct Street” on various maps and plans because Davol Street is on a bridge above the level of the railroad as shown in the cross section in Figure 4-6. It was called Viaduct Street prior to the construction of the Braga Bridge and the Route 79 interchange. This document calls this section of road Davol Street. At Central Street, Davol Street just begins to separate as shown on Photo 4-4 and Figure 4-7. North of Central Street, Davol Street northbound and southbound lanes are separated by the Route 79 viaduct as shown in cross section in Figure 4-8. Central Street is one-way in the westerly direction (see Photo 4-5). It provides access from the CBD (City Hall area) to businesses and other attractions along the waterfront area. It intersects with Davol Street and is carried over the railroad and the Quequechan River on historic bridges. Connector Street Connector Street is a one-way street, approximately 23 feet in width. The street is approximately 300 feet in length, located just south of the Milliken Boulevard Bridge over I-195. This short street segment provides access from Milliken Boulevard to Pocasset Street.
_______________________________________________________________ 4-11 Existing Environment
Anawan and Pocasset Streets are local two-way streets that run east-west and intersect with Broadway Extension/Davol Street. They provide access from the CBD to businesses along the waterfront area. West of Davol Street, the road is Anawan Street. East of Davol Street, it is Pocasset Street. Milliken Boulevard is a local two-way street in the north-south direction that provides access between Columbia Street and Central Street/City Hall. Water Street/Ponta Delgada Boulevard is a local two-way street in the north-south direction adjacent to the waterfront. This street primarily serves low density commercial and industrial uses and connects, at its northerly end, with Central Street at Battleship Cove. It intersects with Columbia Street to the south. South of its intersection with Anawan Street, Water Street becomes Ponta Delgada Boulevard. Canal Street is a two-way local street in the north-south direction between Columbia Street and Broadway Extension. It primarily serves a low to medium density residential neighborhood. Harbor Terrace is a local two-way street that connects Central Street to Pine Street. It primarily serves traffic for the adjacent Fall River Housing Authority Development.
Route 79/I-195 PART 1 Interchange Reconstruction Project NEPA Fall River, MA Environmental Assessment
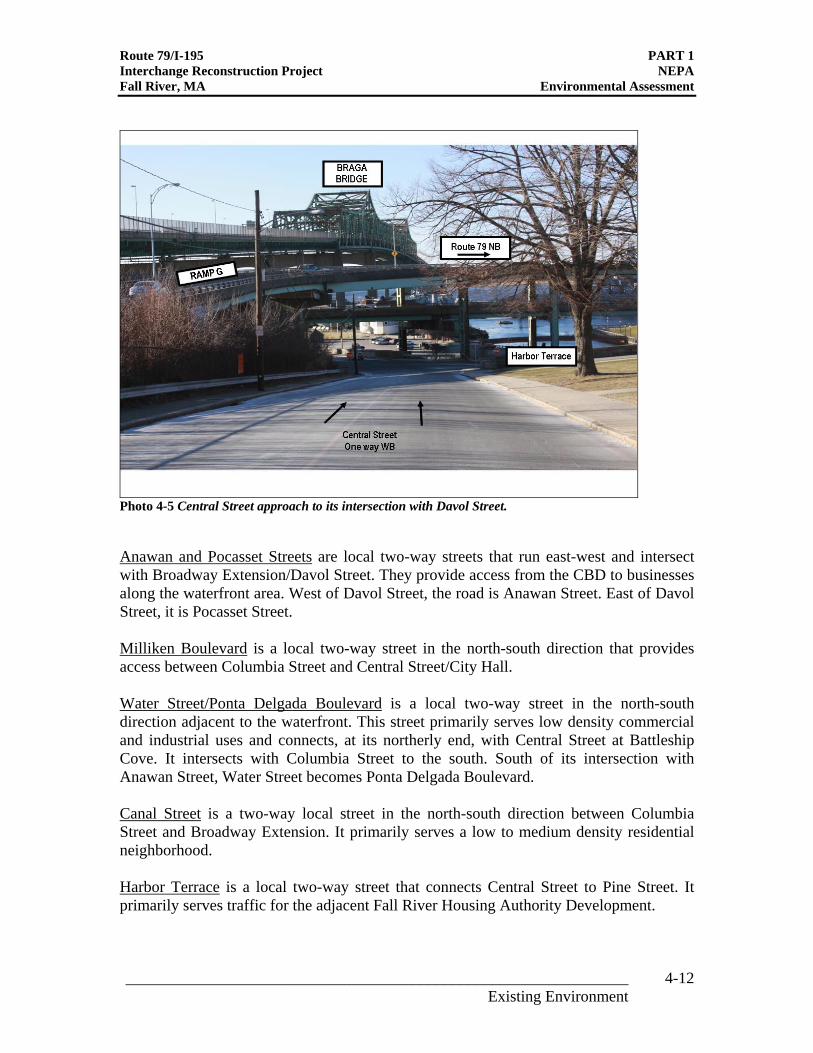
Photo 4-5 Central Street approach to its intersection with Davol Street.
_______________________________________________________________ 4-12 Existing Environment
Route 79/I-195 PART 1 Interchange Reconstruction Project NEPA Fall River, MA Environmental Assessment
4.3.4 Interchange and Ramps
The Route 79/I-195 Interchange (Exit 5) connects I-195 with the southern terminus of Route 79. "Spaghetti Junction" is a nickname sometimes given to an intertwined, multilevel roadway interchange that resembles a plate of spaghetti. The ramps for the I-195, Route 79, and Davol Street connections are often called the spaghetti ramps. The ramps are either on structures or filled embankments. The ramps (and ramp directions) are discussed below and identified on Figures 4-4 and 4-5, as well as on the project plans at the end of the document. Table 4.1 lists the existing ramp connections. I-195 Off-ramps At Exit 5, drivers traveling eastbound on I-195 can take Ramp A which connects to Route 79 northbound. Drivers can also connect to Milliken Boulevard by taking Ramp Y which splits off Ramp A. Drivers traveling westbound on I-195 take Ramp G which connects to Route 79 northbound. Drivers can also connect to Route 79 southbound by taking Ramp F which splits off Ramp G. I-195 On-ramps Drivers traveling southbound on Route 79 can take Ramp D to connect to I-195. Ramp D merges with Ramp C. To connect with I-195 westbound, drivers stay on Ramp C. Drivers heading to I-195 westbound get off Ramp C onto Ramp E. Drivers traveling north on Broadway Extension can easily take the ramp for Route 79 northbound and then take Ramp C to connect with I-195. However, drivers traveling south on Broadway Extension must make a potentially dangerous U-turn to connect with I-195 as illustrated in Photo 4-5. Drivers traveling west on Central Street can take Ramp L and merge with Ramp C to connect with I-195 westbound. Route 79 Ramp Connections with Davol Street Drivers on Route 79 northbound take Ramp R to connect with Davol Street northbound. Driver traveling southbound on Davol Street can take Ramp P to connect with Route 79 southbound.
_______________________________________________________________ 4-13 Existing Environment
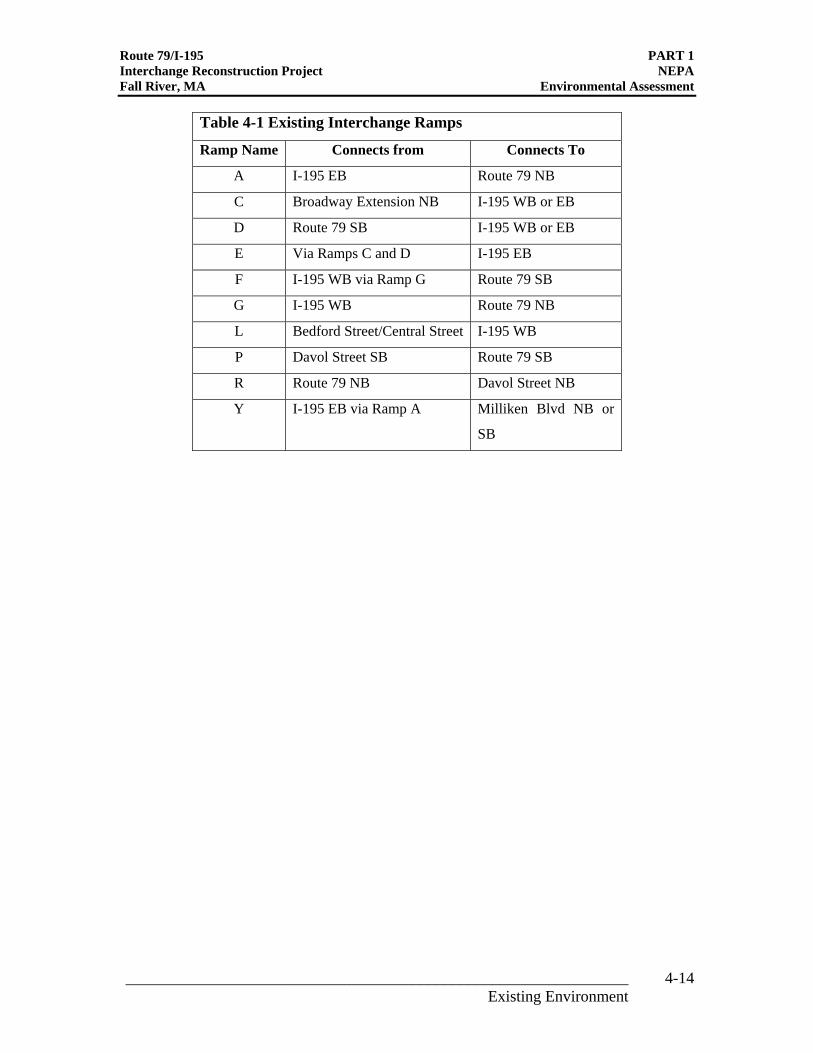
Table 4-1 Existing Interchange Ramps
Ramp Name Connects from Connects To A I-195 EB Route 79 NB
C Broadway Extension NB I-195 WB or EB
D Route 79 SB I-195 WB or EB E Via Ramps C and D I-195 EB
F I-195 WB via Ramp G Route 79 SB
G I-195 WB Route 79 NB
L Bedford Street/Central Street I-195 WB
P Davol Street SB Route 79 SB
R Route 79 NB Davol Street NB
Y I-195 EB via Ramp A Milliken Blvd NB or
SB
Route 79/I-195 PART 1 Interchange Reconstruction Project NEPA Fall River, MA Environmental Assessment
_______________________________________________________________ 4-14 Existing Environment
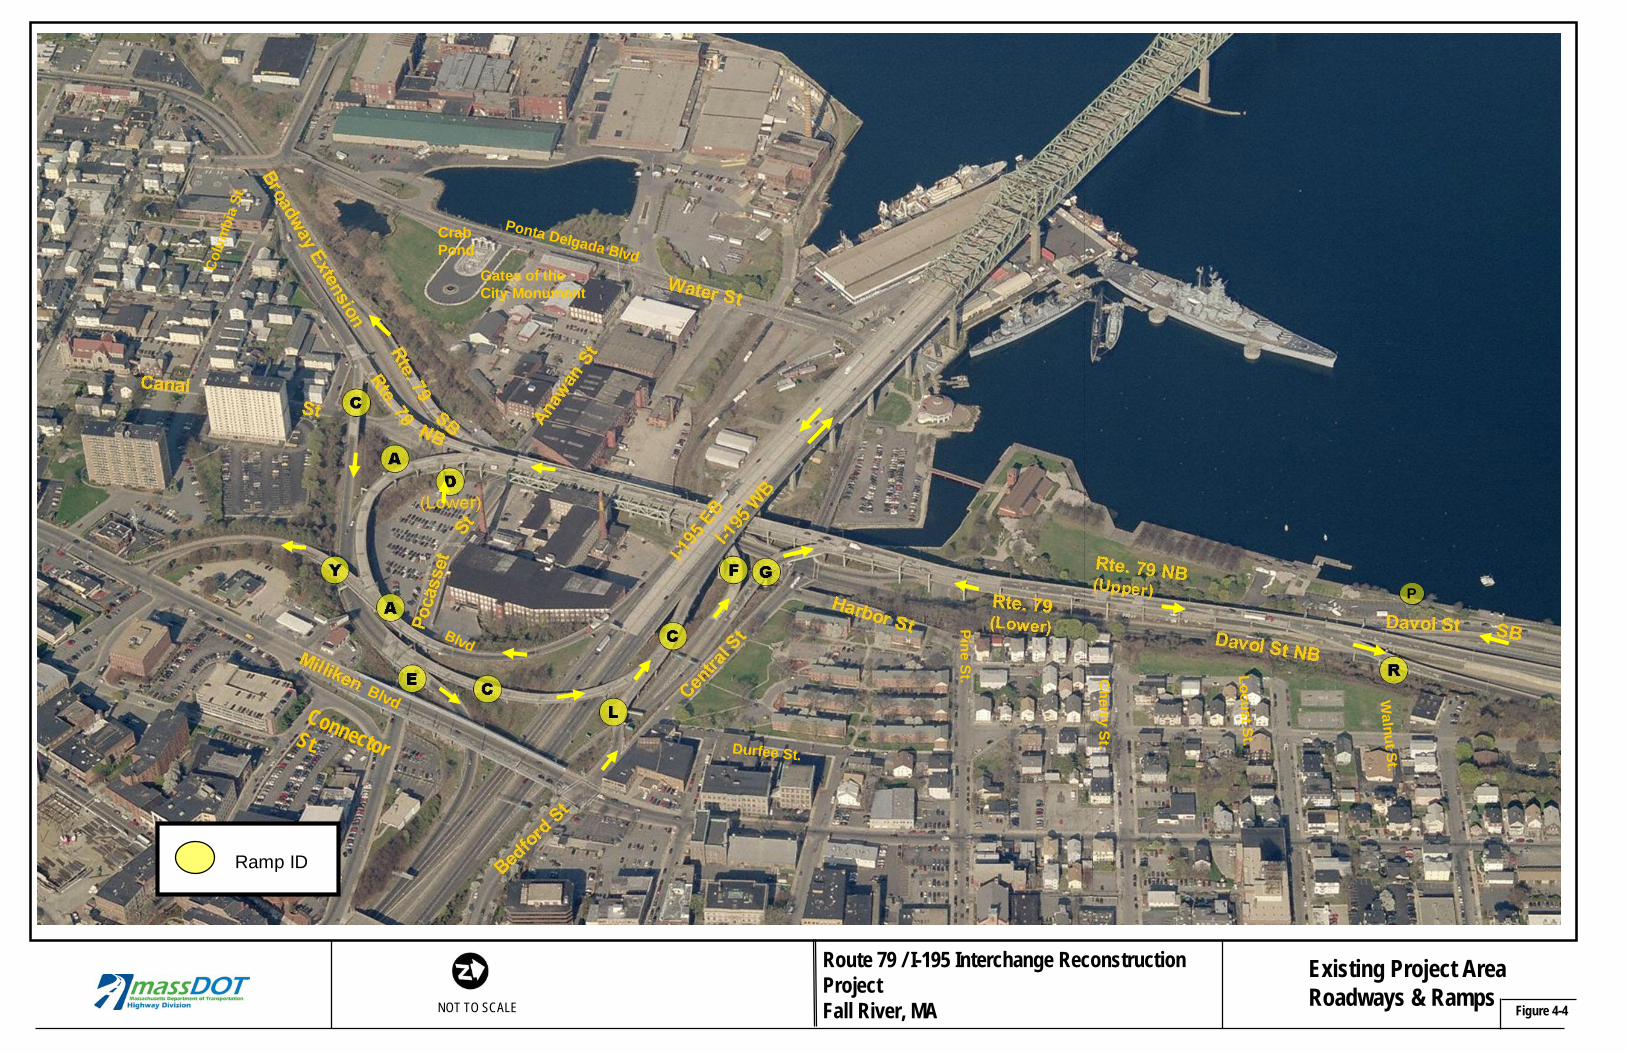
Existing Project Area Roadways & Ramps
Figure 4-4 NOT TO SCALE
Route 79 / I-195 Interchange Reconstruction Project Fall River, MA
ConnectorSt.
Blvd
Blvd
Gates of the City Monument
Crab Pond
Durfee St.
Colu
mbi
a St
.
P
Ponta Delgada Blvd
Pine St. Cherry St.
Locust St.
Walnut St.
Ramp ID

Route 79/I-195 PART 1 Interchange Reconstruction Project NEPA Fall River, MA Environmental Assessment
_______________________________________________________________ 4-16 Existing Environment
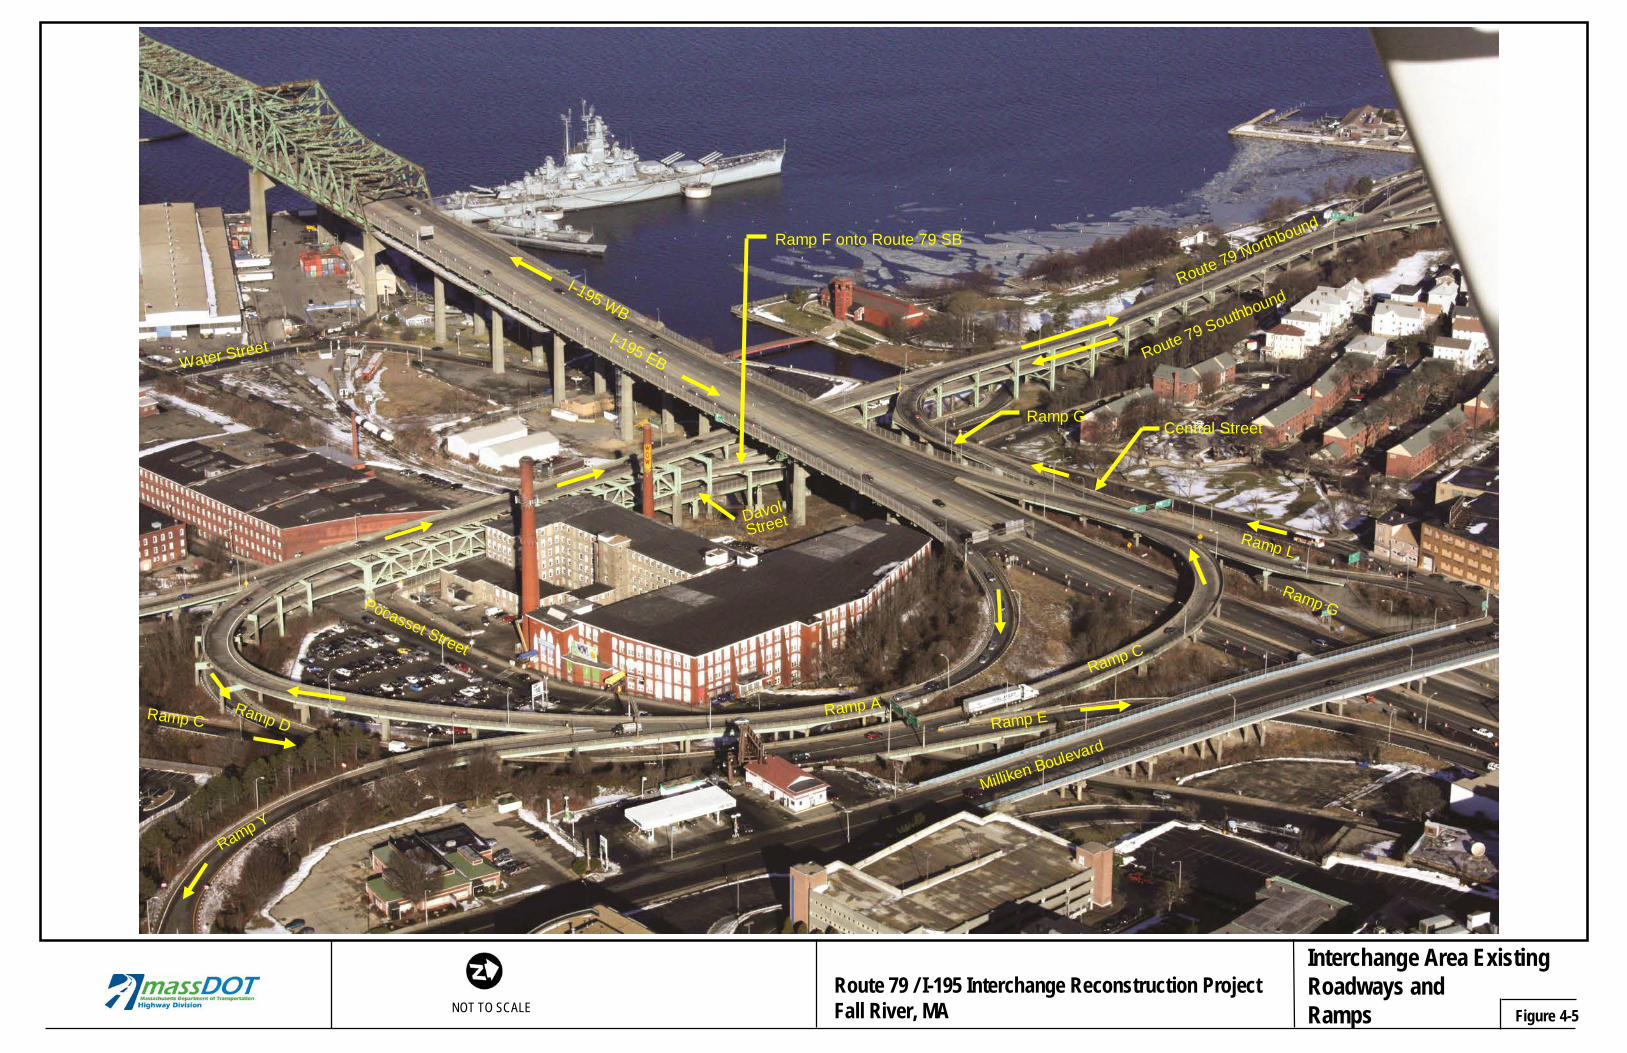
Interchange Area Existing Roadways and Ramps Figure 4-5 NOT TO SCALE
Route 79 / I-195 Interchange Reconstruction Project Fall River, MA
Route 79 Northbound
Route 79 Southbound
Milliken Boulevard
Ramp C
DavolStreet
Ra m p E
I-195 WBI-195 EB
Centr a l Street
Pocasset Street
W ater Str ee t
Ramp Y
R amp C Ramp D
Ramp L
Ram p G
Ram p F onto Rout e 79 SB
Ramp G
Ra m p A
Route 79/I-195 PART 1 Interchange Reconstruction Project NEPA Fall River, MA Environmental Assessment
_______________________________________________________________ 4-18 Existing Environment
Note: Looking Northbound
Existing Cross Section at Mill ComplexRoute 79 / I-195 Interchange Reconstruction Project Fall River, MA NOT TO SCALE Figure 4-6
Note: Looking Northbound
Existing Cross Section at Central Street Route 79 / I-195 Interchange Reconstruction Project
NOT TO SCALE Fall River, MA Figure 4-7
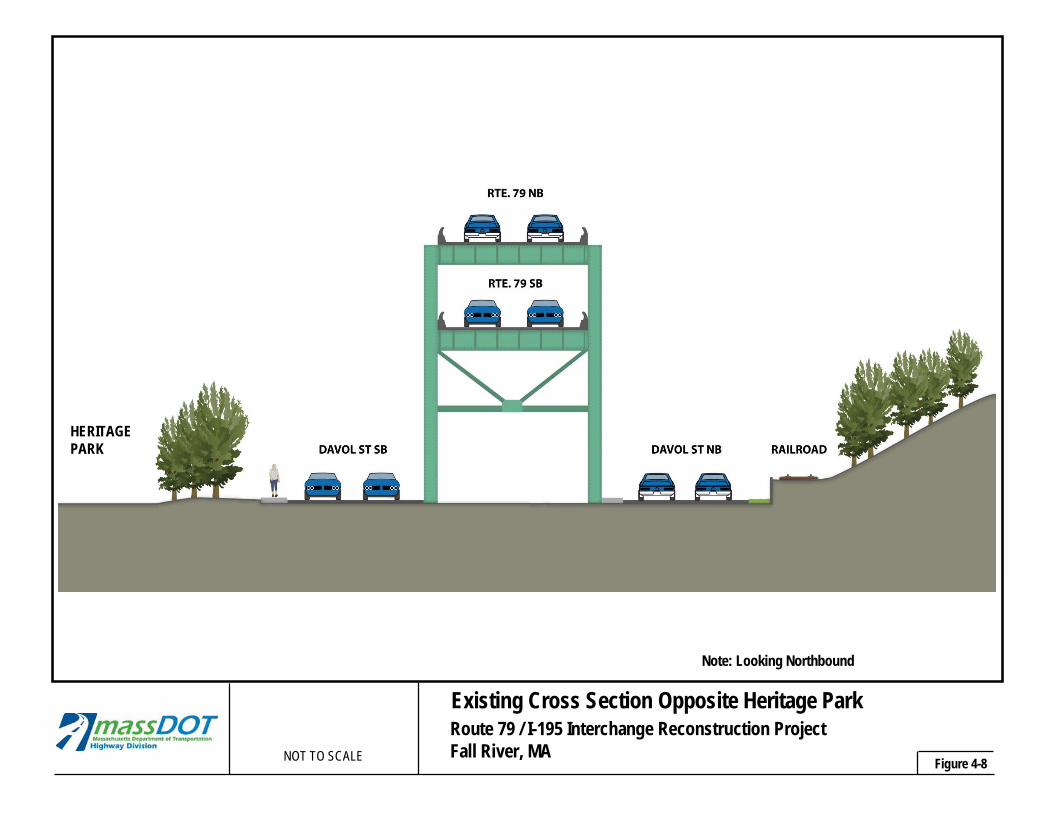
HERITAGE PARK
Note: Looking Northbound
Existing Cross Section Opposite Heritage Park Route 79 / I-195 Interchange Reconstruction Project Fall River, MA NOT TO SCALE Figure 4-8
Route 79/I-195 PART 1 Interchange Reconstruction Project NEPA Fall River, MA Environmental Assessment
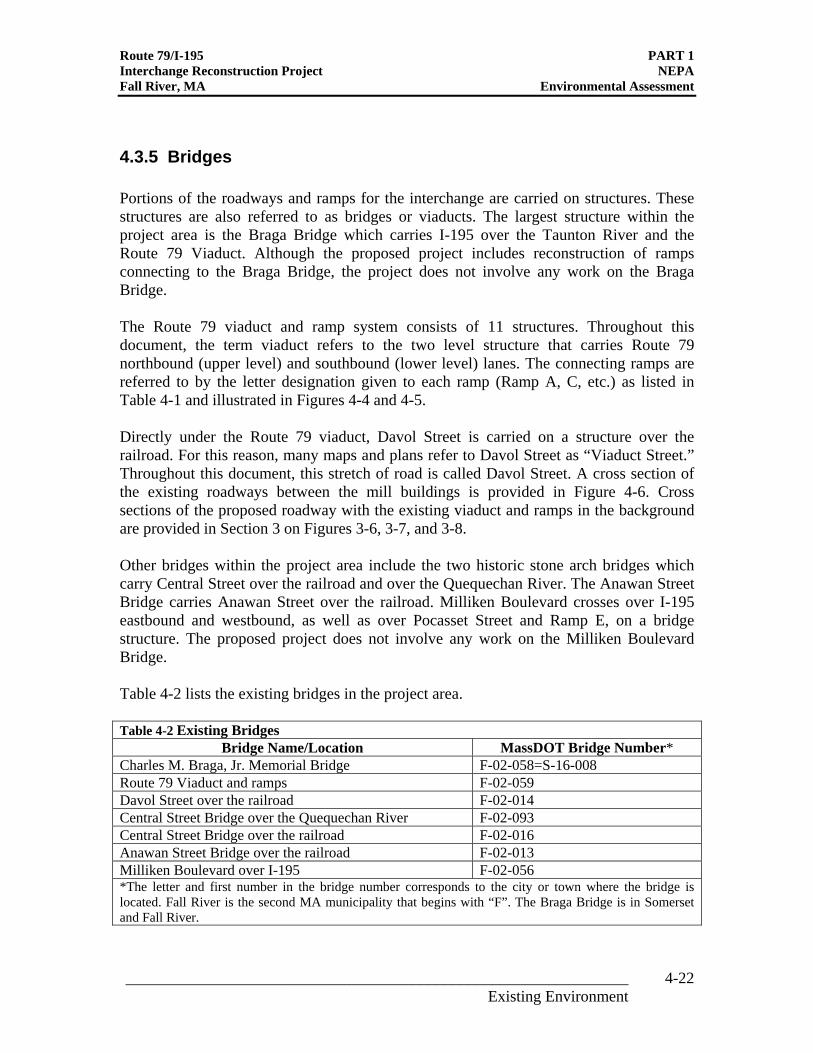
4.3.5 Bridges
Portions of the roadways and ramps for the interchange are carried on structures. These structures are also referred to as bridges or viaducts. The largest structure within the project area is the Braga Bridge which carries I-195 over the Taunton River and the Route 79 Viaduct. Although the proposed project includes reconstruction of ramps connecting to the Braga Bridge, the project does not involve any work on the Braga Bridge.
The Route 79 viaduct and ramp system consists of 11 structures. Throughout this document, the term viaduct refers to the two level structure that carries Route 79 northbound (upper level) and southbound (lower level) lanes. The connecting ramps are referred to by the letter designation given to each ramp (Ramp A, C, etc.) as listed in Table 4-1 and illustrated in Figures 4-4 and 4-5.
Directly under the Route 79 viaduct, Davol Street is carried on a structure over the railroad. For this reason, many maps and plans refer to Davol Street as “Viaduct Street.” Throughout this document, this stretch of road is called Davol Street. A cross section of the existing roadways between the mill buildings is provided in Figure 4-6. Cross sections of the proposed roadway with the existing viaduct and ramps in the background are provided in Section 3 on Figures 3-6, 3-7, and 3-8.
Other bridges within the project area include the two historic stone arch bridges which carry Central Street over the railroad and over the Quequechan River. The Anawan Street Bridge carries Anawan Street over the railroad. Milliken Boulevard crosses over I-195 eastbound and westbound, as well as over Pocasset Street and Ramp E, on a bridge structure. The proposed project does not involve any work on the Milliken Boulevard Bridge.
Table 4-2 lists the existing bridges in the project area.
Table 4-2 Existing Bridges Bridge Name/Location MassDOT Bridge Number*
Charles M. Braga, Jr. Memorial Bridge F-02-058=S-16-008 Route 79 Viaduct and ramps F-02-059 Davol Street over the railroad F-02-014 Central Street Bridge over the Quequechan River F-02-093 Central Street Bridge over the railroad F-02-016 Anawan Street Bridge over the railroad F-02-013 Milliken Boulevard over I-195 F-02-056 *The letter and first number in the bridge number corresponds to the city or town where the bridge is located. Fall River is the second MA municipality that begins with “F”. The Braga Bridge is in Somerset and Fall River.
_______________________________________________________________ 4-22 Existing Environment
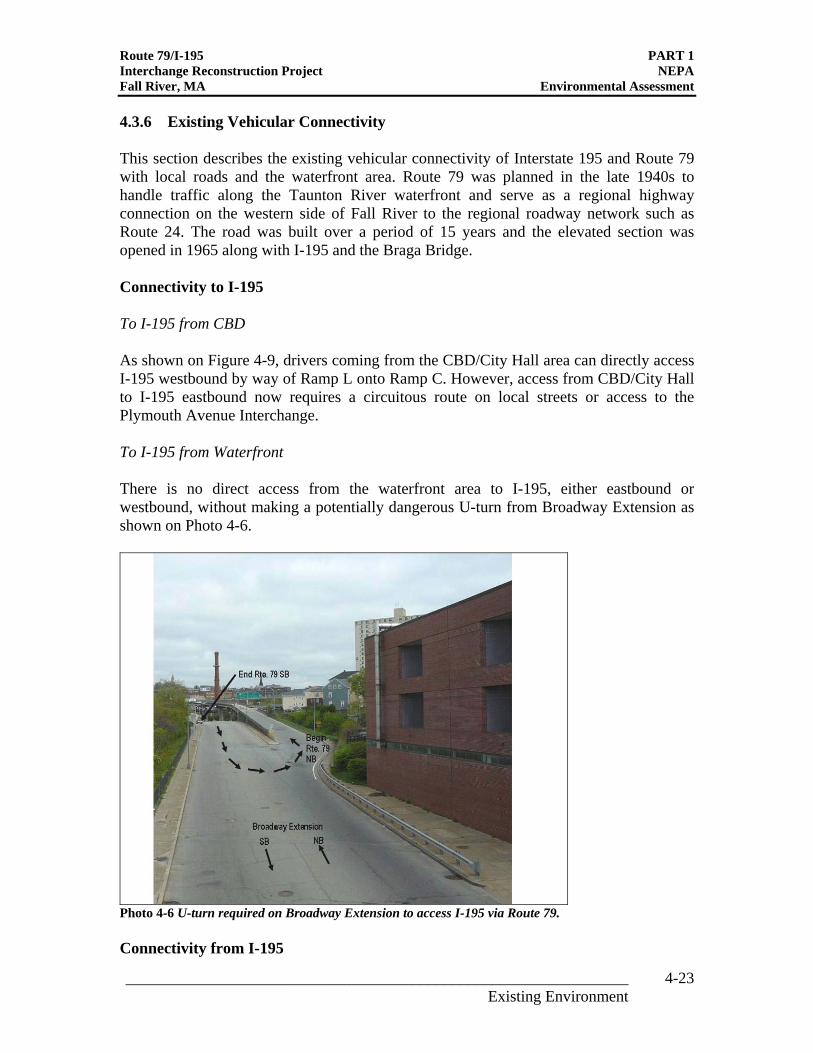
Photo 4-6 U-turn required on Broadway Extension to access I-195 via Route 79.
Connectivity from I-195
Route 79/I-195 PART 1 Interchange Reconstruction Project NEPA Fall River, MA Environmental Assessment
4.3.6 Existing Vehicular Connectivity
This section describes the existing vehicular connectivity of Interstate 195 and Route 79 with local roads and the waterfront area. Route 79 was planned in the late 1940s to handle traffic along the Taunton River waterfront and serve as a regional highway connection on the western side of Fall River to the regional roadway network such as Route 24. The road was built over a period of 15 years and the elevated section was opened in 1965 along with I-195 and the Braga Bridge.
Connectivity to I-195
To I-195 from CBD
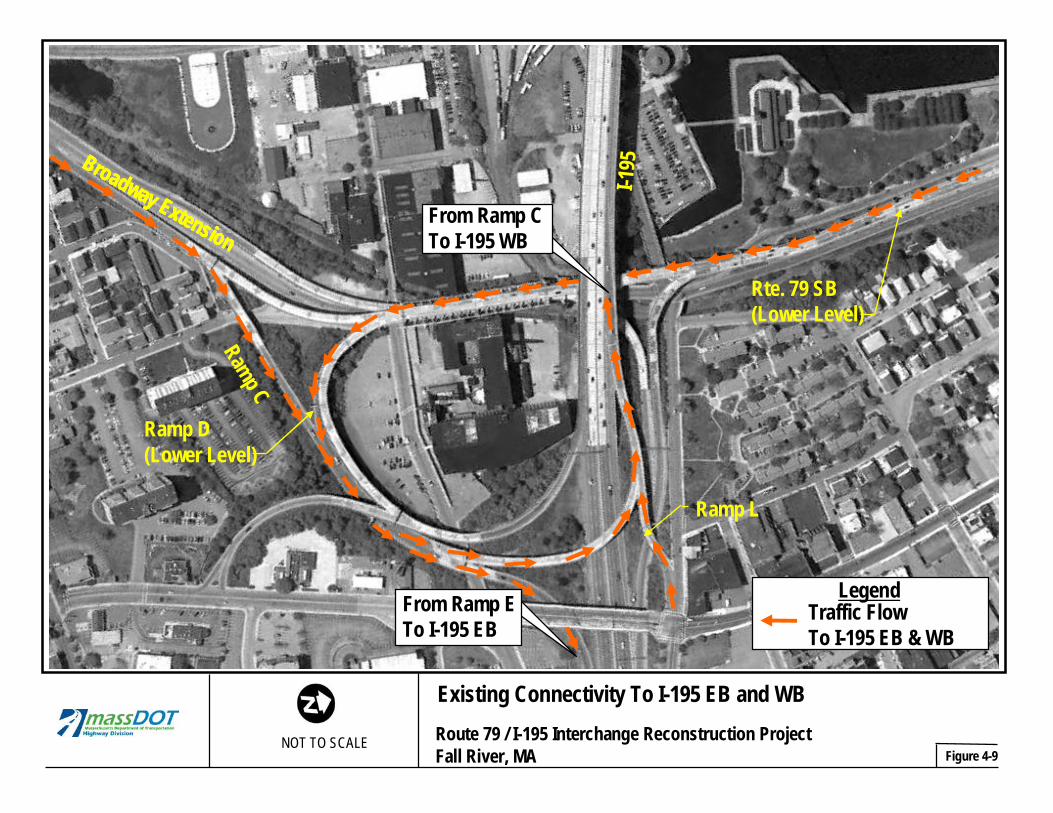
As shown on Figure 4-9, drivers coming from the CBD/City Hall area can directly access I-195 westbound by way of Ramp L onto Ramp C. However, access from CBD/City Hall to I-195 eastbound now requires a circuitous route on local streets or access to the Plymouth Avenue Interchange.
To I-195 from Waterfront
There is no direct access from the waterfront area to I-195, either eastbound or westbound, without making a potentially dangerous U-turn from Broadway Extension as shown on Photo 4-6.
_______________________________________________________________ 4-23 Existing Environment
Route 79/I-195 PART 1 Interchange Reconstruction Project NEPA Fall River, MA Environmental Assessment
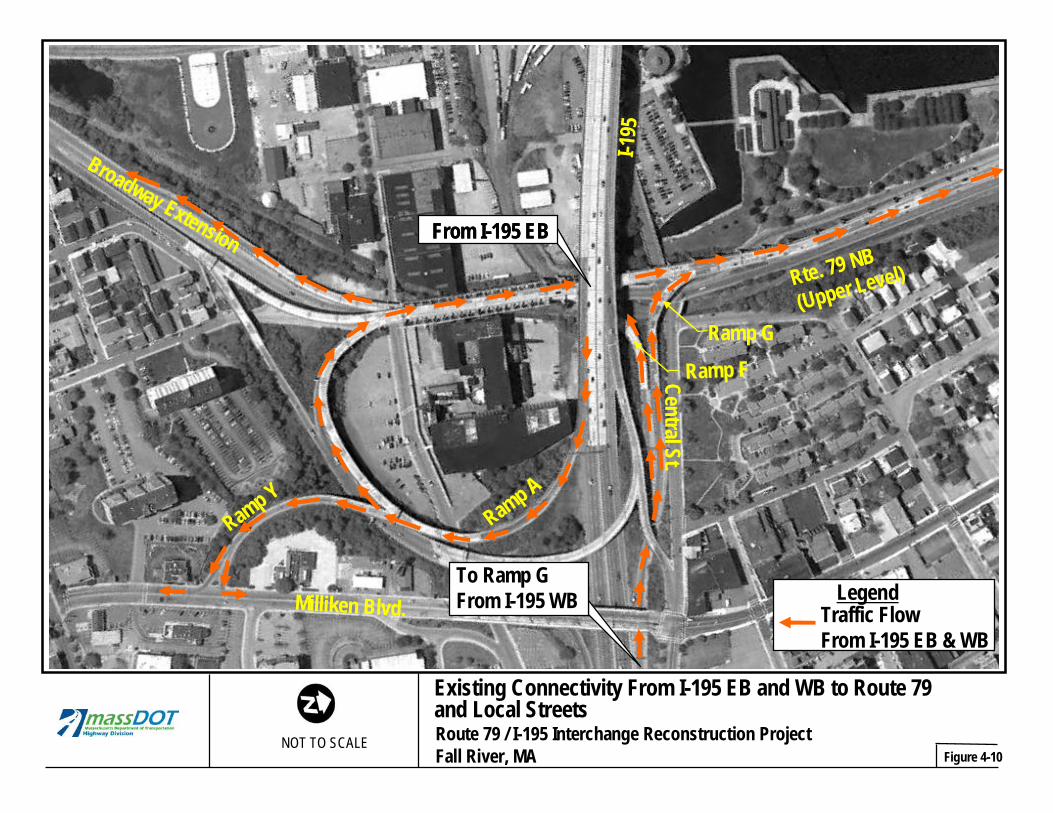
From I-195 Eastbound
As shown on Figure 4-10, drivers on I-195 eastbound can go north on Route 79 by way of Ramp A. However, drivers wishing to access the waterfront and Heritage Park need to continue north on Route 79 well past the area and loop backwards to the waterfront via Davol Street. Another option to reach the waterfront area from I-195 eastbound is to take Ramp Y, off Ramp A, to Milliken Boulevard, if drivers are familiar with local streets.
From I-195 Westbound
Drivers traveling west on I-195 westbound can directly connect to Route 79 northbound by way of Ramp G. Drivers wishing to go south can take Ramp F off Ramp G and access Davol Street.
Route 79 Connectivity
Successful navigation from Route 79 to local Fall River destinations such as Battleship Cove and Heritage Park requires drivers to be alert to the limited signage and visual aids. Drivers approaching the area on Route 79 southbound must exit 1.5 miles north of the area at Brightman Street / Route 6 in order to get onto Davol Street.
4.3.7 Transit and Mass Coastal Railroad
Southeastern Regional Transit Authority (SRTA)
The Southeastern Regional Transit Authority (SRTA) was established in 1974 in response to state legislation which authorized the establishment of regional transit authorities. SRTA serves Acushnet, Dartmouth, Fairhaven, Fall River, Freetown, Mattapoisett, New Bedford, Somerset, Swansea, and Westport.
Several bus routes run from the Fall River bus terminal that serve Fall River and other destinations. Some bus routes travel along Milliken Boulevard and across the Braga Bridge to Somerset and the Swansea Mall.
Mass Coastal Railroad
The Mass Coastal Railroad runs on north-south tracks through the project area under Anawan Street, Davol Street and Central Street. Mass Coastal is a Massachusetts-based freight railroad company which, since January 2008, has had a contract to operate on MassDOT rail lines. Mass Coastal provides freight service to the Borden & Remington Corporation facility on the waterfront near the state pier (tracks on right in Photo 4-7). The two tracks on the left of Photo 4-7 continue south under the Anawan Street Bridge.
_______________________________________________________________ 4-24 Existing Environment
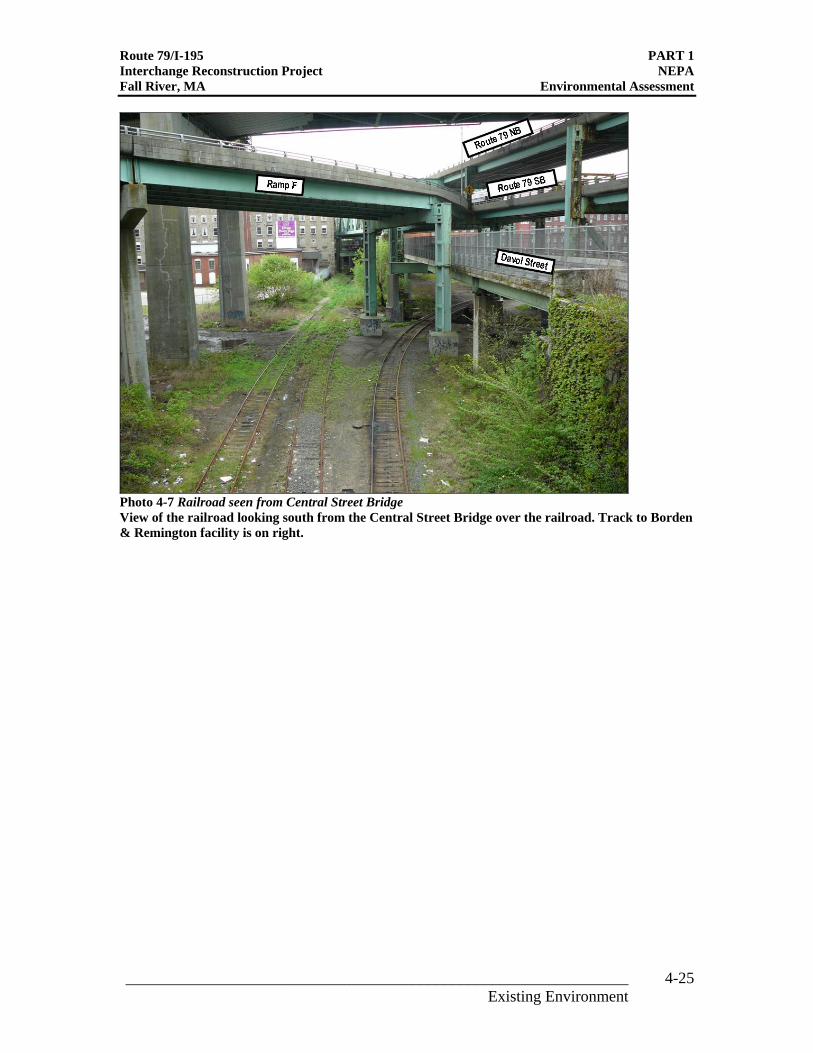
Photo 4-7 Railroad seen from Central Street Bridge View of the railroad looking south from the Central Street Bridge over the railroad. Track to Borden & Remington facility is on right.
Route 79/I-195 PART 1 Interchange Reconstruction Project NEPA Fall River, MA Environmental Assessment
_______________________________________________________________ 4-25 Existing Environment
Rte. 79 SB (Lower Level)
Broadway Extension
Ramp D (Lower Level)
Broadway Extension
Broadway Extension
Broadway Extension
I-195
Ramp L
Ramp C
From Ramp C To I-195 WB
From Ramp E To I-195 EB
LegendTraffic Flow To I-195 EB & WB
Existing Connectivity To I-195 EB and WB Route 79 / I-195 Interchange Reconstruction ProjectNOT TO SCALE
Figure 4-9Fall River, MA
Legend
Ramp G
Milliken Blvd.
Ramp Y Ramp A
Central St.Ramp F
Broadway Extension
I-195
To Ramp G From I-195 WB
From I-195 EB
Traffic Flow From I-195 EB & WB
Rte. 79 NB
(Upper Level)
From I-195 EB
Existing Connectivity From I-195 EB and WB to Route 79and Local Streets Route 79 / I-195 Interchange Reconstruction ProjectNOT TO SCALE
Figure 4-10Fall River, MA
Route 79/I-195 PART 1 Interchange Reconstruction Project NEPA Fall River, MA Environmental Assessment
4.4 Traffic Operations
4.4.1 Existing (2009) Traffic Operations
Existing traffic operations (Level of Service) for the I-195 freeway sections, weave sections, ramp junctions and local intersections have been evaluated and are discussed below in terms of Level of Service (LOS) for the AM and PM peak hour. Additional information can be found in the Traffic Study in Appendix 1.
Level of Service (LOS) is a measure that reflects the relative ease of traffic flow. This scale denotes different operating conditions that occur under various traffic volume loads. It is a qualitative measure of the effect of factors such as roadway configuration, speed, travel delay, freedom to maneuver, and safety. LOS is divided into a range of six letter grades, ranging from A to F, with A being the best and F the worst.
FHWA uses the American Association of State Highway Transportation Officials (AASHTO) guidelines for determining which criteria apply to the performance of an intersection. MassDOT uses its Design Guide for the same purpose. In urban areas, traffic operations of LOS D are generally considered adequate according to AASHTO and MassDOT guidance, while LOS E or F is considered inadequate.
In summary, in the project area, I-195 freeway, weave and ramp junctions operate with adequate conditions in the AM and PM peak hour. Four intersections (listed in Table 4-3) have some turning movements that are inadequate but, for the most part, the intersections currently operate with adequate “overall” conditions.
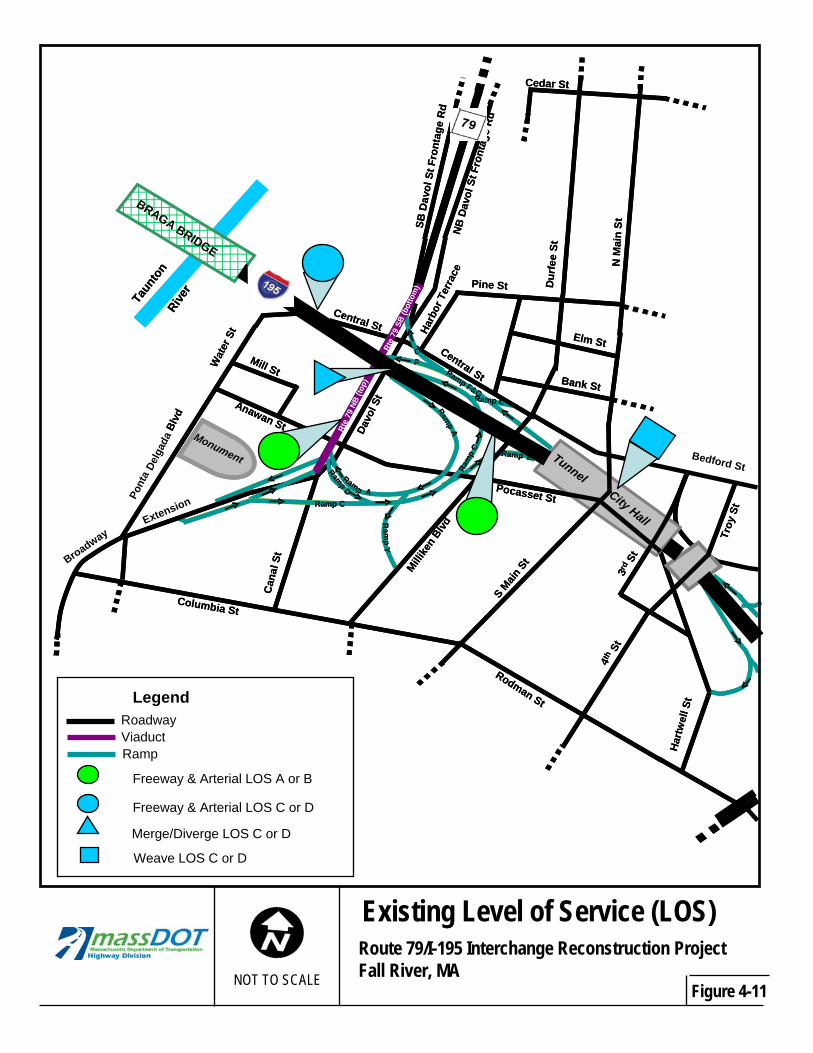
Existing Freeway LOS LOS analysis for traffic on freeway sections is based upon density of vehicles. Density is measured in passenger cars per mile per lane (pc/mi/ln). The freeway sections of I-195 in the study area were evaluated and all sections currently operate with adequate levels of service in both the AM and PM peak hour, as illustrated in Figure 4-11.
Existing Weave LOS A weave section of a highway is the length of the highway where vehicles in two lanes traveling in the same direction are changing lanes in order to either exit the roadway or enter the highway from an on-ramp. Weaving areas form along a roadway when a merge area (on-ramp) is closely followed by a diverge area (off-ramp).
Similar to Freeway LOS analysis, weave section LOS is based upon density of vehicles, measured in passenger cars per mile per lane (pc/mi/ln). The weave sections of I-195 in the study area were evaluated and all sections currently operate with adequate levels of service in both the AM and PM peak hour as illustrated in Figure 4-11.
_______________________________________________________________ 4-28 Existing Environment
Route 79/I-195 PART 1 Interchange Reconstruction Project NEPA Fall River, MA Environmental Assessment
Existing Ramp LOS Vehicles entering a highway must merge with the existing traffic flow from an on-ramp. Vehicles exiting a highway must change lanes to diverge from the existing traffic flow onto an off-ramp. The LOS for on- and off-ramp junctions (merge and diverge points) are based upon the density of vehicles prior to the merge point and after the diverge point. The interchange ramp junctions in the project area were analyzed and found to operate with adequate levels of service in the AM and PM peak hour existing conditions as illustrated in Figure 4-11.
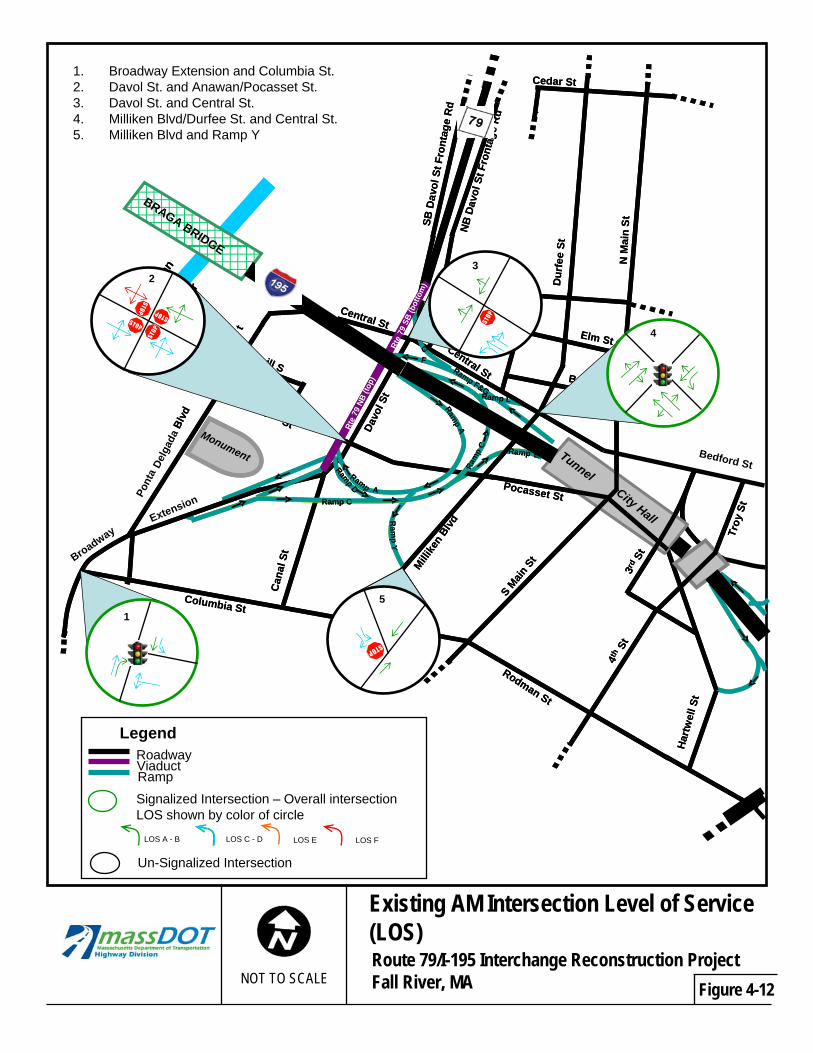
Existing Intersection LOS LOS designation is defined by average seconds of delay. The average vehicle delay thresholds for LOS are slightly different between signalized and unsignalized intersections.
Five intersections within the project interchange, two of which are currently signalized, were evaluated. Existing traffic operations during the AM and PM peak hours for these intersections are discussed below and summarized in Table 4-3 and on Figures 4-12 and 4-13 respectively.
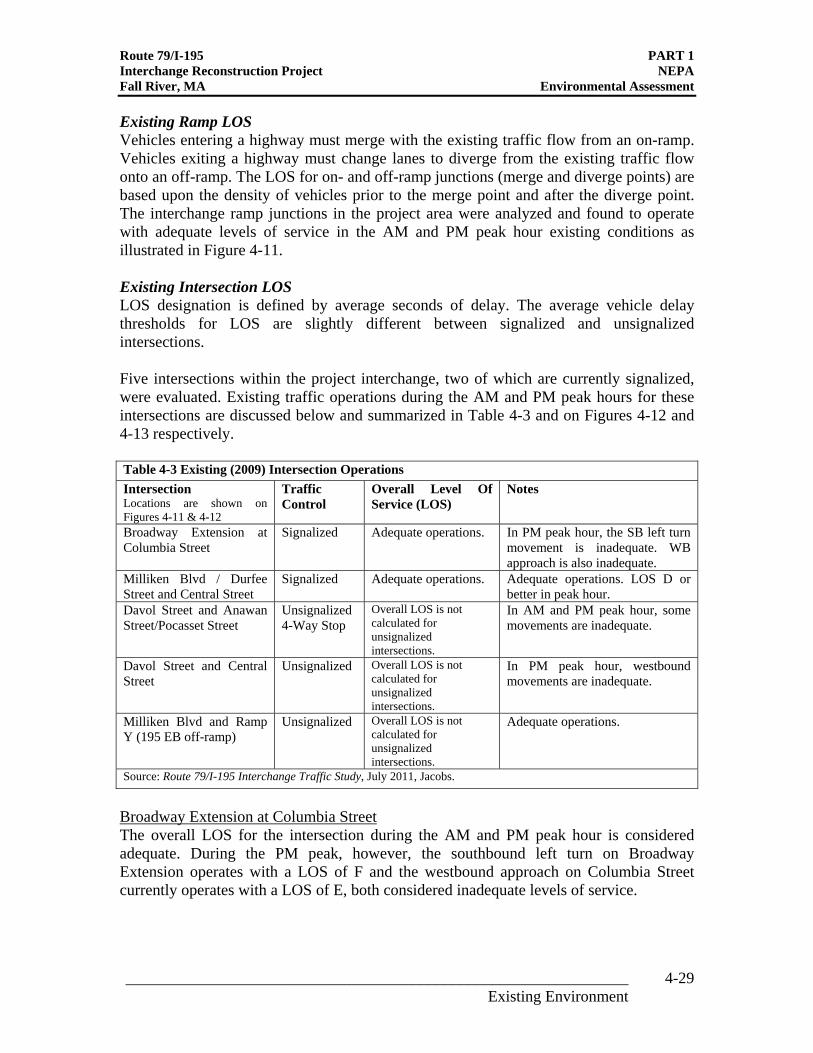
Table 4-3 Existing (2009) Intersection Operations Intersection Locations are shown on Figures 4-11 & 4-12
Traffic Control
Overall Level Of Service (LOS)
Notes
Broadway Extension at Columbia Street
Signalized Adequate operations. In PM peak hour, the SB left turn movement is inadequate. WB approach is also inadequate.
Milliken Blvd / Durfee Street and Central Street
Signalized Adequate operations. Adequate operations. LOS D or better in peak hour.
Davol Street and Anawan Street/Pocasset Street
Unsignalized 4-Way Stop
Overall LOS is not calculated for unsignalized intersections.
In AM and PM peak hour, some movements are inadequate.
Davol Street and Central Street
Unsignalized Overall LOS is not calculated for unsignalized intersections.
In PM peak hour, westbound movements are inadequate.
Milliken Blvd and Ramp Y (195 EB off-ramp)
Unsignalized Overall LOS is not calculated for unsignalized intersections.
Adequate operations.
Source: Route 79/I-195 Interchange Traffic Study, July 2011, Jacobs.
Broadway Extension at Columbia Street The overall LOS for the intersection during the AM and PM peak hour is considered adequate. During the PM peak, however, the southbound left turn on Broadway Extension operates with a LOS of F and the westbound approach on Columbia Street currently operates with a LOS of E, both considered inadequate levels of service.
_______________________________________________________________ 4-29 Existing Environment
Route 79/I-195 PART 1 Interchange Reconstruction Project NEPA Fall River, MA Environmental Assessment
Milliken Blvd/Durfee Street and Central Street The intersection operates with adequate levels of service of A and B during both peak hours.
Davol Street at Anawan Street/Pocasset Street The southbound lane on Davol Street operates with inadequate LOS of F during the morning and evening peak hour. The eastbound lane on Anawan Street at the intersection currently operates with inadequate LOS E during the evening peak hour.
Davol Street at Central Street In the evening peak hour, all three westbound lanes on Central Street at Davol Street currently operate with inadequate LOS of E and F.
Milliken Blvd and Ramp Y (I-195 EB off-ramp) The intersection operates with adequate LOS C during both peak hours.
_______________________________________________________________ 4-30 Existing Environment
onument
BRAGA BRIDGE
City Hall
Tunnel
City Hall
Tunnel
Existing Level of Service (LOS)
Weave LOS C or D
LegendRoadwayViaductRamp
Wat
erSt
Anawan St
Columbia St
Rodman St
Central St
Pocasset St
Hartw
ell S
t
Pine St Dur
fee
St
Taun
ton
River
Ram
pY
Bank St
Cedar St
Millike
nBlvd
3rd St
Central St
Davo
l St
Ramp E
Can
alSt
Elm StF
G
Ramp D
SMain
St
4th St
SBD
avol
StFr
onta
geR
dNB
Davo
l St F
ront
age
Rd
M
NM
ain
St
Rte
79NB
(top)
Rte
79SB
(bot
tom
)
Ramp L
Ramp F&G
Broadway
Mill St
Ramp C
Ram
pC
Ramp
A
Ramp A
Troy
St
Delg
ada
Blvd
Harb
orTe
rrac
e
Wat
erSt
Anawan St
Columbia St
Rodman St
Central St
Bedford St
Pocasset St
Hartw
ell S
t
Pine St Dur
fee
St
Taun
ton
River
Ram
p Y
Bank St
Cedar St
Millike
nBlvd
3rd St
Central St
Davo
l St
Ramp ERamp E
Can
alSt
Elm St F
G
Ramp D
SMain
St
4th St
SBD
avol
StFr
onta
geR
d NB
Davo
l St F
ront
age
Rd
M o n u me n t
N M
ain
St
Rte
79NB
(top)
Rte
79SB
(bot
tom
)
Ramp L
Ramp F&G
Extension
Mill St
BRAGA BRIDGE
Ramp CRamp C
Ram
pC
Ramp
A
Ramp A
Troy
St
Pont
a
Blvd
Harb
orTe
rrac
e
City Hall
Tunnel
Merge/Diverge LOS C or DFreeway & Arterial LOS C or D
NOT TO SCALE Figure 4-11
Route 79/I-195 Interchange Reconstruction Project Fall River, MA
Freeway & Arterial LOS A or B
Wat
er S
Ana an
Taun
tRive
onument
M t
BRAGA BRIDGE
City Hall
Tunnel
Wat
er S
Ana an
Taun
tRive
M t
City Hall
Tunnel
t
wSt
Columbia St
Rodman St
Central St
Pocasset St
Hartw
ell S
t
Pine St Dur
fee
St
on
r
Ram
pY
Bank St
Cedar St
Millike
nBlvd
3rd St
Central St
Davo
l St
Ramp E
Can
alSt
Elm StF
G
Ramp D
SMain
St
4th St
SBD
avol
StFr
onta
geR
dNB
Davo
l St F
ront
age
Rd
M
NM
ain
St
Rte
79NB
(top)
Rte
79SB
(bot
tom
)
Ramp L
Ramp F&G
Broadway
ill S
Ramp C
Ram
pC
Ramp
A
Ramp A
Troy
St
Delg
ada
Blvd
Harb
orTe
rrac
e
t
w St
Columbia St
Rodman St
Central St
Bedford St
Pocasset St
Hartw
ell S
t
Pine St Dur
fee
St
on
r
Ram
p Y
Bank St
Cedar St
Millike
nBlvd
3rd St
Central St
Davo
l St
Ramp ERamp E
Can
alSt
Elm St F
G
Ramp D
SMain
St
4th St
SBD
avol
StFr
onta
geR
d NB
Davo
l St F
ront
age
Rd
M o n u me n t
N M
ain
St
Rte
79NB
(top)
Rte
79SB
(bot
tom
)
Ramp L
Ramp F&G
Extension
ill S
BRAGA BRIDGE
Ramp CRamp C
Ram
pC
Ramp
A
Ramp A
Troy
St
Pont
a
Blvd
Harb
orTe
rrac
e
City Hall
Tunnel
184 (341)
1
2 3
4
5
1. Broadway Extension and Columbia St.2. Davol St. and Anawan/Pocasset St.3. Davol St. and Central St.4. Milliken Blvd/Durfee St. and Central St.5. Milliken Blvd and Ramp Y
Signalized Intersection – Overall intersectionLOS shown by color of circle
LOS E LOS F
LegendRoadwayViaductRamp
Un-Signalized Intersection LOS A - B LOS C - D
Existing AM Intersection Level of Service (LOS) Route 79/I-195 Interchange Reconstruction Project
NOT TO SCALE Fall River, MA Figure 4-12

Wat
er S
t
n
Taun
tRive
onument
Mi St
BRAGA BRIDGE
City Hall
Tunnel
Wat
er S
t
n
Taun
tRive
Mi St
City Hall
Tunnel
1. Broadway Extension and Columbia St.2. Davol St. and Anawan/Pocasset St.3. Davol St. and Central St.4. Milliken Blvd/Durfee St. and Central St.5. Milliken Blvd and Ramp Y
A awan St
Columbia St
Rodman St
Central St
Pocasset St
Hartw
ell S
t
Pine St Dur
fee
St
on
r
Ram
pY
Bank St
Cedar St
Millike
nBlvd
3rd St
Central St
Davo
l St
Ramp E
Can
alSt
Elm StF
G
Ramp D
SMain
St
4th St
SBD
avol
StFr
onta
geR
dNB
Davo
l St F
ront
age
Rd
M
NM
ain
St
Rte
79NB
(top)
Rte
79SB
(bot
tom
)
Ramp L
Ramp F&G
Broadway
ll
Ramp C
Ram
pC
Ramp A
Ramp A
Troy
St
Delg
ada
Blvd
Harb
orTe
rrac
e
A awan St
Columbia St
Rodman St
Central St
Bedford St
Pocasset St
Hartw
ell S
t
Pine St Dur
fee
St
on
r
Ram
p Y
Bank St
Cedar St
Millike
nBlvd
3rd St
Central St
Davo
l St
Ramp ERamp E
Can
alSt
Elm St F
G
Ramp D
SMain
St
4th St
SBD
avol
StFr
onta
geR
d NB
Davo
l St F
ront
age
Rd
M o n u me n t
N M
ain
St
Rte
79NB
(top)
Rte
79SB
(bot
tom
)
Ramp L
Ramp F&G
Extension
ll
BRAGA BRIDGE
Ramp CRamp C
Ram
pC
Ramp A
Ramp A
Troy
St
Pont
a
Blvd
Harb
orTe
rrac
e
City Hall
Tunnel
184 (341)
1
2 3
4
5
Signalized Intersection – Overall intersectionLOS shown by color of circle
LOS E LOS F
LegendRoadwayViaductRamp
Un-Signalized Intersection LOS A - B LOS C - D
Existing PM Intersection Level of Service (LOS) Route 79/I-195 Interchange Reconstruction Project
NOT TO SCALE Fall River, MA Figure 4-13
Route 79/I-195 PART 1 Interchange Reconstruction Project NEPA Fall River, MA Environmental Assessment
4.4.2 Existing Safety Conditions (Crash Analysis)
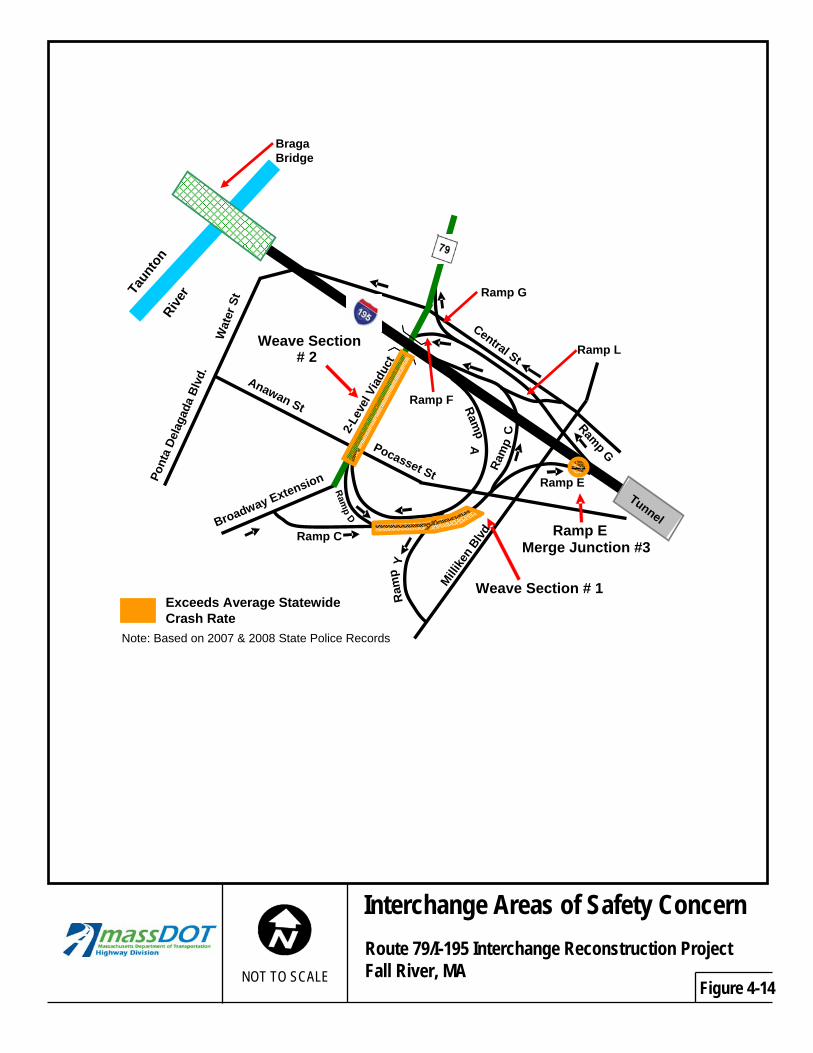
Safety has been evaluated in terms of crash rates (number of crashes weighted by traffic volume and length of roadway) for the project area including three specific areas within the Route 79/I-195 interchange itself that exceed state average rates for similar areas. Databases were reviewed from the years 2006, 2007 and 2008, the latest available at the time of analysis. Two areas are weave sections, and the third area is the merge junction of Ramp E with eastbound I-195. Areas where drivers are either leaving or entering a roadway require intense lane changing maneuvers. Four local intersections within the project area exceed the state average crash rates for intersections. These intersections are discussed below and shown on Figure 4-14.
Interchange Safety Concerns
Ramps D and C have a weave section within the interchange (shown on Figure 4-14 as Weave Section #1) that has a crash rate of 2.51 crashes per Million Vehicle Miles Traveled (MVMT), slightly higher than the state average of 2.3 MVMT.
The section of Route 79 southbound from the entrance of Ramp F to the location of the Ramp D off-ramp and continuing to Broadway Extension also has a weave area (shown on Figure 4-14 as Weave Section #2) with a higher than average crash rate of 4.17 per MVMT, compared to the state average of 2.3 MVMT.
The Ramp E merge with I-195 eastbound (shown on Figure 4-14 as Merge Section #3) has a crash rate of 1.84 per Million Entering Vehicles (MEV). The state average for unsignalized intersections of 0.62 has been used as a substitute for the analysis of the ramp since the state does not have historical crash averages for merge junctions.
Factors that may be contributing to the high crash rates include lack of pavement markings and insufficient weave length. Since the time of analysis, new pavement markings have been provided.
Local Intersection Safety Concerns
Four intersections (located on Figure 4-12) within the project area have higher than average crash rates compared with the state average. These intersections are: • Broadway Extension and Columbia Street • Milliken Blvd/Durfee Street and Central Street • Central Street and Davol Street • Davol Street at Anawan/Pocasset Streets
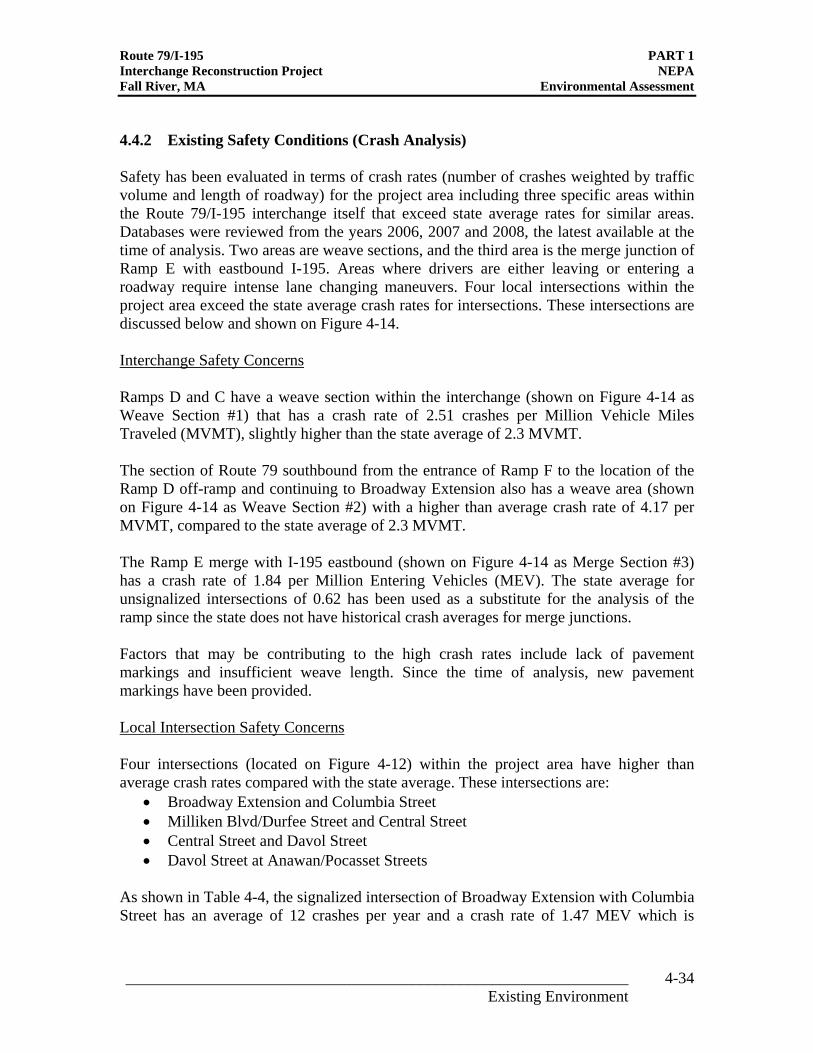
As shown in Table 4-4, the signalized intersection of Broadway Extension with Columbia Street has an average of 12 crashes per year and a crash rate of 1.47 MEV which is
_______________________________________________________________ 4-34 Existing Environment
Route 79/I-195 PART 1 Interchange Reconstruction Project NEPA Fall River, MA Environmental Assessment
almost twice the statewide average of 0.82 for signalized intersections. This high rate may be due to traffic congestion and inadequate signal timing.
Another signalized intersection within the project area that has a higher than average crash rate is the Central Street intersection with Milliken Boulevard and Durfee Street. It has a crash rate of 1.19 MEV which is slightly higher than the statewide average. This may be due to outdated signal equipment and poor intersection operations.
The unsignalized Central Street intersection with Davol Street has a crash rate that is more than 5 times the statewide average for unsignalized intersections. The crash rate is 3.35 compared to an average of 0.62 for the state. There are several factors that contribute to driver confusion and the high crash rate at this location. The geometry of the intersection and the steep grade on Central Street as it approaches Davol Street affect the line of sight and visibility of oncoming cars. Central Street westbound approaching the intersection is a wide approach that has no pavement markings which may cause confusion as drivers must weave as they decide to turn left or right or continue straight, while at the same time judging when to proceed through the unsignalized intersection. Meanwhile, drivers on Davol Street northbound approaching the intersection are faced with the change in road alignment as the NB and SB lanes of Davol Street transition and shift to either side of the Route 79 viaduct structure as shown in Photo 4-5 in Section 4.3.2.
The intersection of Anawan /Pocasset Streets at Davol Street has an average of 3 crashes per year for the years 2005 through 2008 and a crash rate a little higher than the statewide average.
Table 4-4 Intersection Crash Rates Signalized Intersections
Intersection Crash Rate per Million Entering Vehicles (MEV)
Average Rate Statewide
Compared to Average Rate
Broadway Extension and Columbia Street
1.47 0.82 Moderately higher
Milliken Blvd/Durfee Street and Central Street
1.19 0.82 Moderately higher
Unsignalized Intersections
Intersection Crash Rate per Million Entering Vehicles (MEV)
Average Rate Statewide
Compared to Average Rate
Central Street and Davol Street 3.35 0.62 Substantially higher Davol Street at Anawan/Pocasset 0.63 0.62 Slightly higher Source: MassDOT, 2006-2008
_______________________________________________________________ 4-35 Existing Environment
n.t.sNORTH
New Street
Wat
erSt
Millike
nBlvd
Central St Anawan St
Pocasset St
Ram
p Y
Ramp A
Ramp C
Ramp E Ra
mp
Ramp G
Tunnel
Ramp
D
2-Le
vel V
iadu
ct
C
Note: Based on 2007 & 2008 State Police Records
Exceeds Average Statewide Crash Rate
Weave Section # 1
Ramp E Merge Junction #3
Weave Section # 2
Pont
aDe
laga
daBl
vd.
Broadway Extension
Ramp G
Ramp F
Ramp L
Braga Bridge
Taun
ton
River
NOT TO SCALE
Interchange Areas of Safety Concern
Figure 4-14
Route 79/I-195 Interchange Reconstruction Project Fall River, MA
Route 79/I-195 PART 1 Interchange Reconstruction Project NEPA Fall River, MA Environmental Assessment
4.5 Pedestrian / Bicycle Accommodations
Existing accommodations for pedestrians and cyclists within the project area are limited. Although most of the local roadways have sidewalks, they are narrow, in poor condition, and many do not meet the Americans with Disabilities Act (ADA) standards for width, surface texture (firm, stable & slip-resistant), slope (steepness), curb ramps, and obstructions (such as telephone poles). Most intersections are not signalized and therefore do not have signal protected pedestrian movements. There are no bicycle lanes or paths in the project area.
4.6 Air Quality 4.6.1 Introduction
Clean Air Act National Ambient Air Quality Standards
The federal Clean Air Act (CAA) of 1963 established funding for the study and the reduction of air pollution. In 1970, Congress passed a stronger CAA and created the U.S. Environmental Protection Agency (EPA) to carry out the law. The 1970 CAA, amended in 1990, required EPA to establish the National Ambient Air Quality Standards (NAAQS) and to conduct periodic review of the standards. The Clean Air Act established two types of national air quality standards. Primary standards set limits to protect public health, including the health of "sensitive" populations such as people with asthma, children, and the elderly. Secondary standards set limits to protect public welfare, including protection against decreased visibility and damage to animals, crops, vegetation, and buildings.
Criteria pollutants are those pollutants that are common and found all over the United States. EPA uses these "criteria pollutants" as indicators of air quality. The six criteria pollutants are:
Carbon Monoxide Sulfur Dioxide Nitrogen Dioxide Lead Ozone Particulate Matter (PM10 and PM2.5-particle size)
Mobile Source Air Toxics
Mobile source air toxics (MSATs) are compounds emitted from highway vehicles and non-road equipment which are known or suspected to cause cancer or other serious health and environmental effects. In February 2007, EPA finalized a rule to reduce hazardous air pollutants from mobile sources (Control of Hazardous Air Pollutants from Mobile Sources, February 9, 2007). The rule limits the benzene content of gasoline and reduces toxic emissions from passenger vehicles and gas cans. EPA estimates that in 2030 this rule would reduce total emissions of mobile source air toxics by 330,000 tons and VOC emissions (precursors to ozone and can be precursors to PM2.5) by over 1 million tons.
_______________________________________________________________ 4-37 Existing Environment
Route 79/I-195 PART 1 Interchange Reconstruction Project NEPA Fall River, MA Environmental Assessment
4.6.2 Air Quality Monitoring
The Massachusetts Department of Environmental Protection (MassDEP) operates air quality monitoring stations across the state and prepares annual reports on air quality. During 2009 (latest data available at the time of writing), MassDEP operated a network of 29 monitoring stations located in 21 cities and towns. Not all pollutants are monitored at each station. The nearest stations that monitor the criteria pollutants are located in:
• Fall River, Bristol County, at Globe Street • Fairhaven, Bristol County, at Leroy Wood • Milton, Norfolk County, at Blue Hill • Boston, Suffolk County, at Harrison Avenue
With the exception of ozone, Massachusetts is in attainment (meets the standards) for all criteria pollutants including carbon monoxide, lead, nitrogen dioxide, sulfur dioxide, and particulate matter (including PM10 and PM2.5). Eastern Massachusetts is classified as a serious non-attainment area for ozone. The Eastern Massachusetts ozone non-attainment area includes Barnstable, Bristol, Dukes, Essex, Middlesex, Nantucket, Norfolk, Suffolk, and Worcester counties.
Once an area is designated a non-attainment area, a “State Implementation Plan” (SIP) is developed and must include strategies and methods to demonstrate how the state is going to meet the NAAQS. The CAA requires Metropolitan Planning Organizations (MPOs) within non-attainment areas to perform conformity determinations prior to the approval of their Regional Transportation Plans (RTPs) and Transportation Improvement Programs (TIPs). Conformity to a SIP means that a proposed transportation project would not cause or contribute to any new violations of the NAAQS; increase the frequency or severity of NAAQS violations; or delay timely attainment of the NAAQS or any required interim milestone.
4.6.3 Conformity Determination
The conformity determination analysis for the 2012 Regional Transportation Plan and the FFY 2012 Transportation Improvement Program (TIP) was prepared by the Southeastern Massachusetts MPO (SMMPO) in accordance with EPA’s final conformity regulations. The air quality analysis demonstrated that the implementation of the TIP satisfies the conformity criteria where applicable and is consistent with the air quality goals in the Massachusetts SIP. Specifically, the SMMPO has found the emission levels from the FY 2012-2015 TIP, in combination with the emission levels from the other MPOs in its non-attainment area, demonstrate conformity with the SIP. Therefore, the FFY 2012–2015 Transportation Improvement Program (TIP) is in conformity with the SIP.
The Route 79/I-195 Interchange Reconstruction Project has been included in the 2012 RTP and Air Quality Conformity Determination, the TIP for FY 2012-2015, as well as
_______________________________________________________________ 4-38 Existing Environment
Route 79/I-195 PART 1 Interchange Reconstruction Project NEPA Fall River, MA Environmental Assessment
the Massachusetts SIP and STIP. Therefore, this project does not require an air quality conformity determination.
4.7 Noise 4.7.1 Introduction
A traffic noise analysis was completed to establish existing noise levels in the vicinity of the Route 79/I-195 Interchange and to set the baseline for the evaluation of potential impacts from the various alternatives. The project is located within an area that includes residential areas, schools, manufacturing facilities, commercial properties, recreational parkland, and multilevel highways and bridges.
Consistent with FHWA Policy and Guidance and 23 CFR 772, the MassDOT Type I Noise Abatement Program allows for the construction of a noise barrier with the physical alteration of an existing highway if noise sensitive receptors would be impacted by the project and a noise barrier is determined to be feasible and reasonable to construct. Because the proposed improvements would alter existing travel patterns through the interchange as well as the geometric relationship between the roadways and receptors— thereby potentially increasing their exposure to localized traffic noise—the project qualifies as a Type I project.
The tasks involved in the noise study included short-term field measurements accompanied by traffic counts, model validation to compare the predicted sound levels with the field-measured levels, and computer modeling of existing and future conditions for sensitive noise receptors to predict the change in sound levels associated with the project and to determine potential noise impacts. Computer modeling was performed using FHWA’s Traffic Noise Model (TNM) program, Version 2.5.
The analysis was performed following the guidelines of the MassDOT Type I and Type II Noise Abatement Policies and Procedures, effective July 13, 2011, and the recently revised Federal Highway Administration’s (FHWA) Highway Traffic Noise: Analysis and Abatement Guidance, dated July 2010, revised January 2011.
_______________________________________________________________ 4-39 Existing Environment
Route 79/I-195 PART 1 Interchange Reconstruction Project NEPA Fall River, MA Environmental Assessment
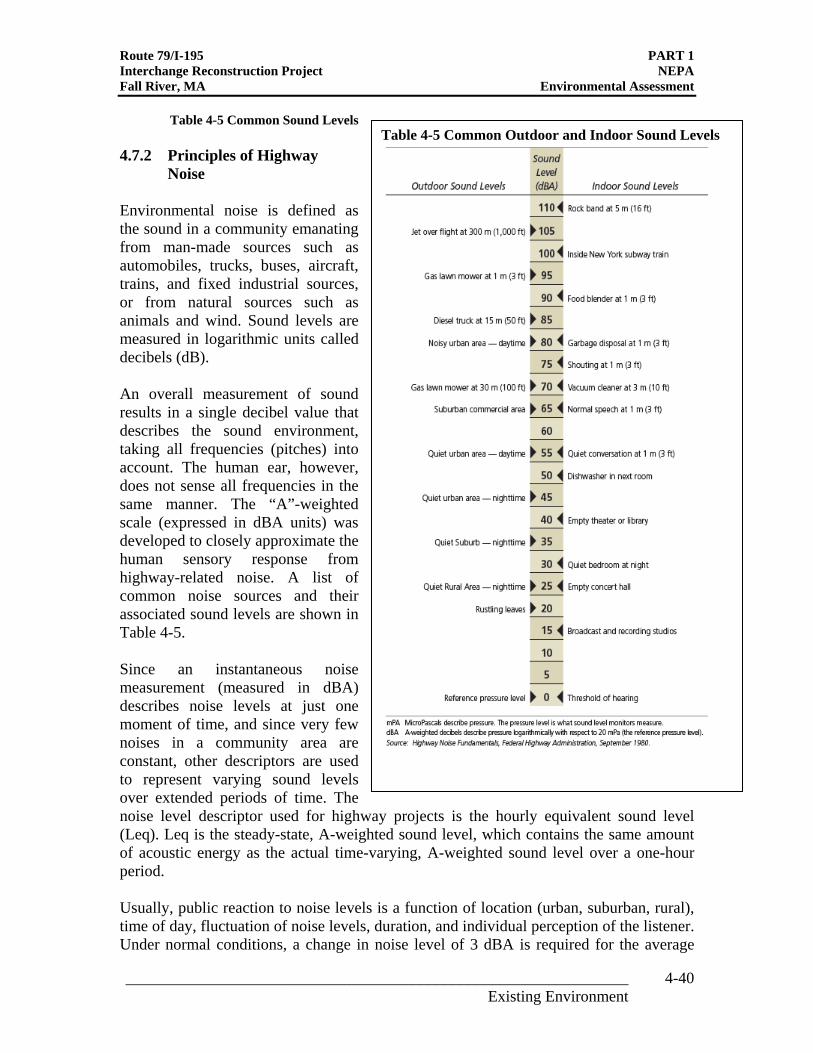
Table 4-5 Common Sound Levels Table 4-5 Common Outdoor and Indoor Sound Levels 4.7.2 Principles of Highway
Noise Environmental noise is defined as the sound in a community emanating from man-made sources such as automobiles, trucks, buses, aircraft, trains, and fixed industrial sources, or from natural sources such as animals and wind. Sound levels are measured in logarithmic units called decibels (dB). An overall measurement of sound results in a single decibel value that describes the sound environment, taking all frequencies (pitches) into account. The human ear, however, does not sense all frequencies in the same manner. The “A”-weighted scale (expressed in dBA units) was developed to closely approximate the human sensory response from highway-related noise. A list of common noise sources and their associated sound levels are shown in Table 4-5. Since an instantaneous noise measurement (measured in dBA) describes noise levels at just one moment of time, and since very few noises in a community area are constant, other descriptors are used to represent varying sound levels over extended periods of time. The noise level descriptor used for highway projects is the hourly equivalent sound level (Leq). Leq is the steady-state, A-weighted sound level, which contains the same amount of acoustic energy as the actual time-varying, A-weighted sound level over a one-hour period. Usually, public reaction to noise levels is a function of location (urban, suburban, rural), time of day, fluctuation of noise levels, duration, and individual perception of the listener. Under normal conditions, a change in noise level of 3 dBA is required for the average
_______________________________________________________________ 4-40 Existing Environment
Route 79/I-195 PART 1 Interchange Reconstruction Project NEPA Fall River, MA Environmental Assessment
person to perceive a difference. A decrease of 10 dBA appears to the listener to be a halving of noise levels, while an increase of 10 dBA appears to be a doubling of the noise.
4.7.3 FHWA Noise Abatement Criteria
The FHWA has established Noise Abatement Criteria (NAC) for various land uses, listed in Table 4-6, to identify noise impacts from roadway projects. Federal regulation 23 CFR 772 states that: “Noise impacts occur when the predicted traffic noise levels approach or exceed the noise abatement criteria levels, or when the predicted traffic noise levels substantially exceed the existing noise levels.” If a project causes a noise impact, noise abatement must be evaluated for mitigation. Noise levels from traffic may increase with a project but not be considered an impact if the noise abatement criteria levels are not reached or exceeded.
Adverse noise impacts are defined by MassDOT in two ways. A noise impact occurs when the computed existing or future sound levels approach (within 1 decibel) or exceed the FHWA NAC. For example, the NAC for residential areas (Activity Category B) is 67 decibels. MassDOT defines an impact for residential areas when sound levels reach or exceed 66 decibels (i.e., within 1 decibel of the NAC). A noise impact also occurs when the computed future sound levels exceed the loudest existing sound levels by 10 decibels or greater. If adverse noise impacts are predicted, noise reduction measures must be evaluated to determine if construction of a noise barrier is feasible and reasonable in accordance with the MassDOT Type I and Type II Noise Abatement Policies and Procedures.
_______________________________________________________________ 4-41 Existing Environment
Route 79/I-195 PART 1 Interchange Reconstruction Project NEPA Fall River, MA Environmental Assessment
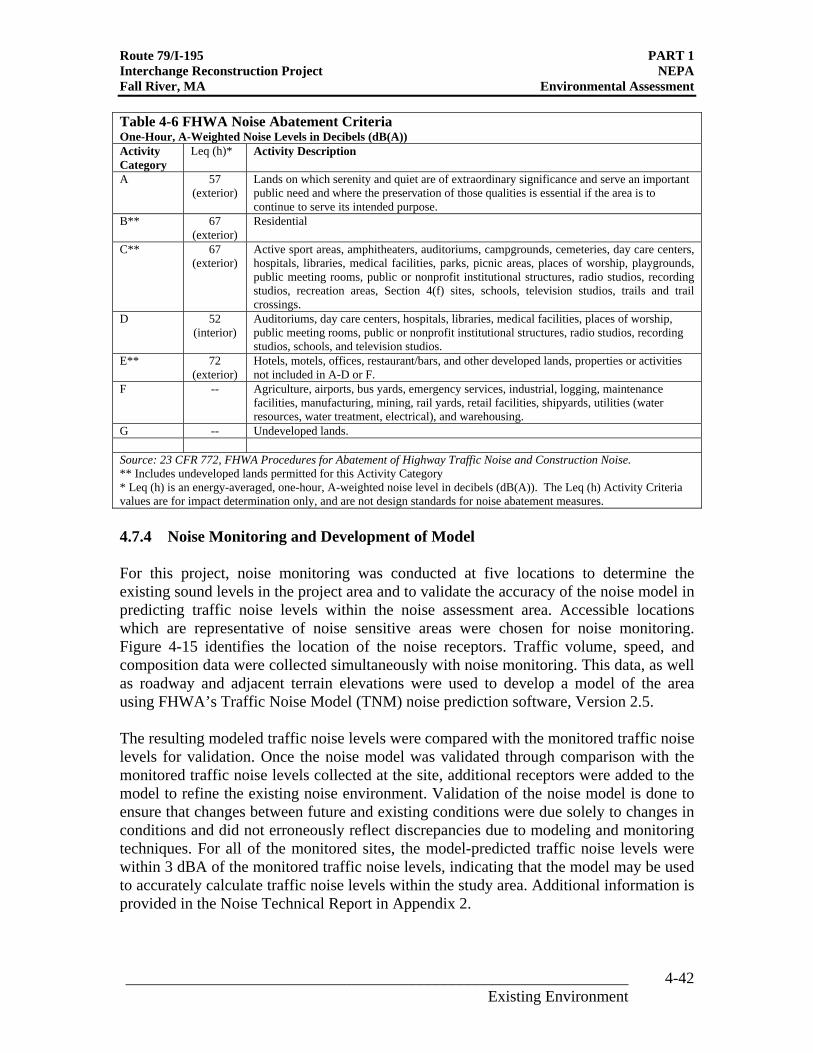
Table 4-6 FHWA Noise Abatement Criteria One-Hour, A-Weighted Noise Levels in Decibels (dB(A)) Activity Category
Leq (h)* Activity Description
A 57 (exterior)
Lands on which serenity and quiet are of extraordinary significance and serve an important public need and where the preservation of those qualities is essential if the area is to continue to serve its intended purpose.
B** 67 (exterior)
Residential
C** 67 (exterior)
Active sport areas, amphitheaters, auditoriums, campgrounds, cemeteries, day care centers, hospitals, libraries, medical facilities, parks, picnic areas, places of worship, playgrounds, public meeting rooms, public or nonprofit institutional structures, radio studios, recording studios, recreation areas, Section 4(f) sites, schools, television studios, trails and trail crossings.
D 52 (interior)
Auditoriums, day care centers, hospitals, libraries, medical facilities, places of worship, public meeting rooms, public or nonprofit institutional structures, radio studios, recording studios, schools, and television studios.
E** 72 (exterior)
Hotels, motels, offices, restaurant/bars, and other developed lands, properties or activities not included in A-D or F.
F -- Agriculture, airports, bus yards, emergency services, industrial, logging, maintenance facilities, manufacturing, mining, rail yards, retail facilities, shipyards, utilities (water resources, water treatment, electrical), and warehousing.
G -- Undeveloped lands.
Source: 23 CFR 772, FHWA Procedures for Abatement of Highway Traffic Noise and Construction Noise. ** Includes undeveloped lands permitted for this Activity Category * Leq (h) is an energy-averaged, one-hour, A-weighted noise level in decibels (dB(A)). The Leq (h) Activity Criteria values are for impact determination only, and are not design standards for noise abatement measures.
4.7.4 Noise Monitoring and Development of Model
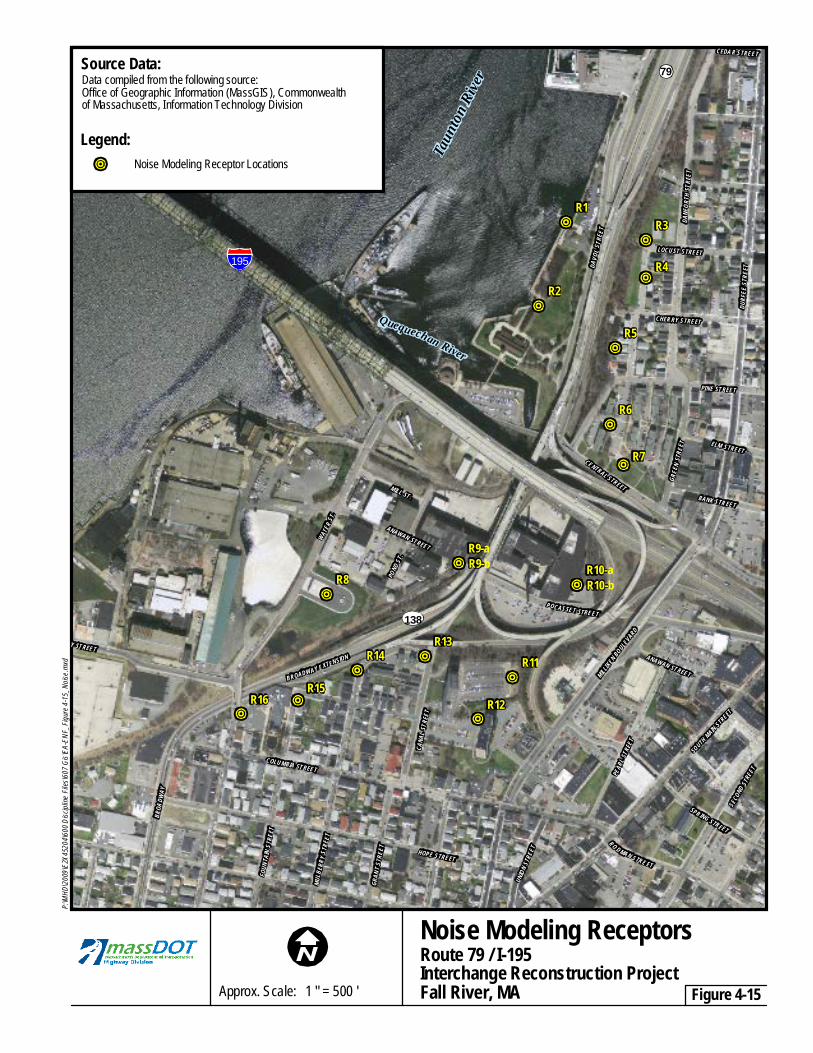
For this project, noise monitoring was conducted at five locations to determine the existing sound levels in the project area and to validate the accuracy of the noise model in predicting traffic noise levels within the noise assessment area. Accessible locations which are representative of noise sensitive areas were chosen for noise monitoring. Figure 4-15 identifies the location of the noise receptors. Traffic volume, speed, and composition data were collected simultaneously with noise monitoring. This data, as well as roadway and adjacent terrain elevations were used to develop a model of the area using FHWA’s Traffic Noise Model (TNM) noise prediction software, Version 2.5.
The resulting modeled traffic noise levels were compared with the monitored traffic noise levels for validation. Once the noise model was validated through comparison with the monitored traffic noise levels collected at the site, additional receptors were added to the model to refine the existing noise environment. Validation of the noise model is done to ensure that changes between future and existing conditions were due solely to changes in conditions and did not erroneously reflect discrepancies due to modeling and monitoring techniques. For all of the monitored sites, the model-predicted traffic noise levels were within 3 dBA of the monitored traffic noise levels, indicating that the model may be used to accurately calculate traffic noise levels within the study area. Additional information is provided in the Noise Technical Report in Appendix 2.
_______________________________________________________________ 4-42 Existing Environment
Route 79/I-195 PART 1 Interchange Reconstruction Project NEPA Fall River, MA Environmental Assessment
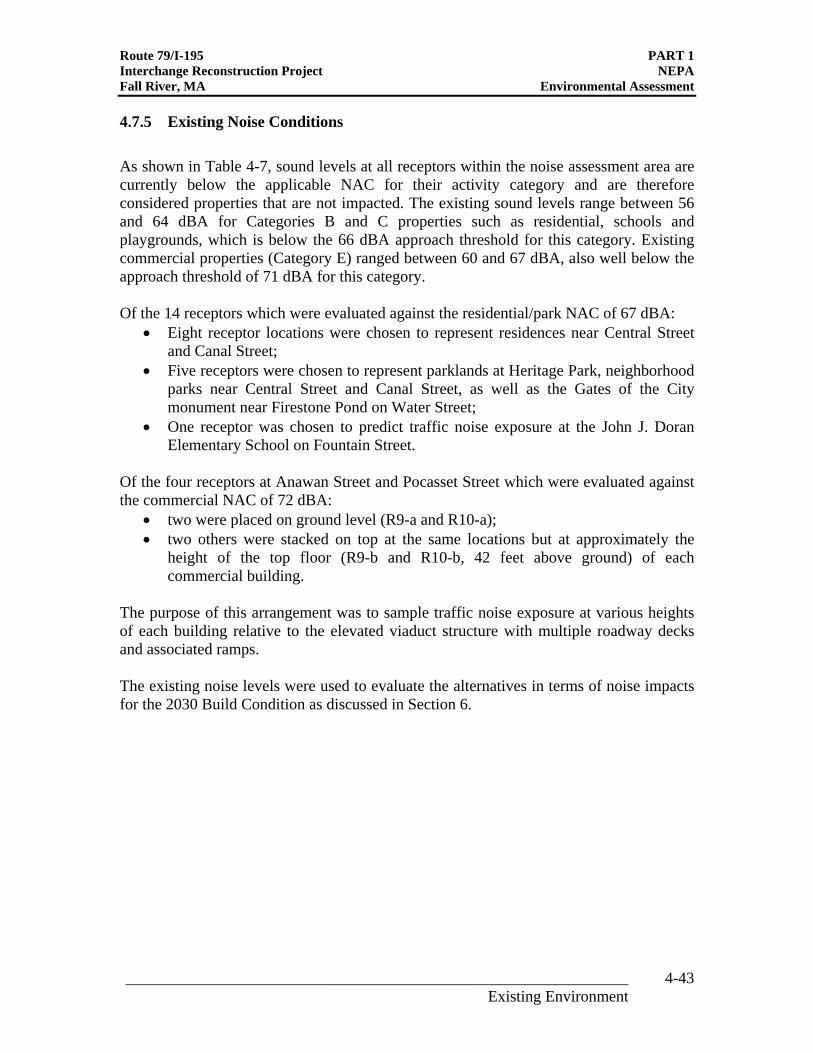
4.7.5 Existing Noise Conditions
As shown in Table 4-7, sound levels at all receptors within the noise assessment area are currently below the applicable NAC for their activity category and are therefore considered properties that are not impacted. The existing sound levels range between 56 and 64 dBA for Categories B and C properties such as residential, schools and playgrounds, which is below the 66 dBA approach threshold for this category. Existing commercial properties (Category E) ranged between 60 and 67 dBA, also well below the approach threshold of 71 dBA for this category.
Of the 14 receptors which were evaluated against the residential/park NAC of 67 dBA: • Eight receptor locations were chosen to represent residences near Central Street
and Canal Street; • Five receptors were chosen to represent parklands at Heritage Park, neighborhood
parks near Central Street and Canal Street, as well as the Gates of the City monument near Firestone Pond on Water Street;
• One receptor was chosen to predict traffic noise exposure at the John J. Doran Elementary School on Fountain Street.
Of the four receptors at Anawan Street and Pocasset Street which were evaluated against the commercial NAC of 72 dBA: • two were placed on ground level (R9-a and R10-a); • two others were stacked on top at the same locations but at approximately the
height of the top floor (R9-b and R10-b, 42 feet above ground) of each commercial building.
The purpose of this arrangement was to sample traffic noise exposure at various heights of each building relative to the elevated viaduct structure with multiple roadway decks and associated ramps.
The existing noise levels were used to evaluate the alternatives in terms of noise impacts for the 2030 Build Condition as discussed in Section 6.
_______________________________________________________________ 4-43 Existing Environment
Route 79/I-195 PART 1 Interchange Reconstruction Project NEPA Fall River, MA Environmental Assessment
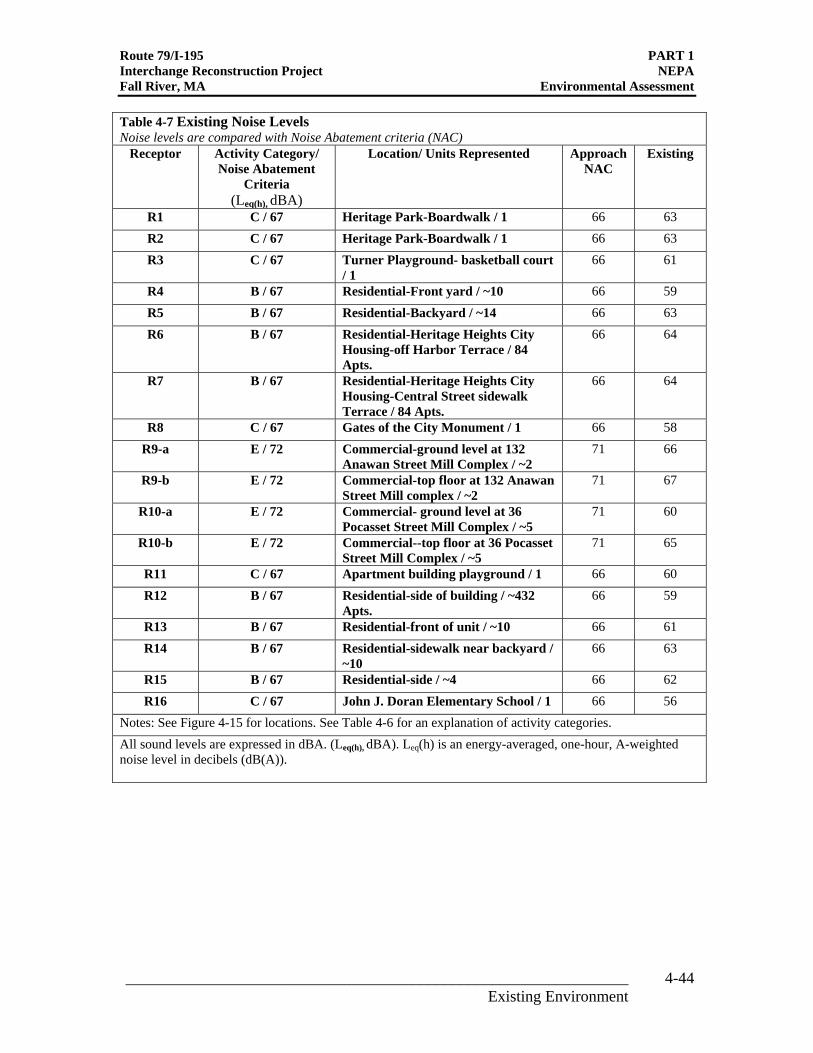
Table 4-7 Existing Noise Levels Noise levels are compared with Noise Abatement criteria (NAC)
Receptor Activity Category/ Noise Abatement
Criteria (Leq(h), dBA)
Location/ Units Represented Approach NAC
Existing
R1 C / 67 Heritage Park-Boardwalk / 1 66 63 R2 C / 67 Heritage Park-Boardwalk / 1 66 63 R3 C / 67 Turner Playground- basketball court
/ 1 66 61
R4 B / 67 Residential-Front yard / ~10 66 59 R5 B / 67 Residential-Backyard / ~14 66 63 R6 B / 67 Residential-Heritage Heights City
Housing-off Harbor Terrace / 84 Apts.
66 64
R7 B / 67 Residential-Heritage Heights City Housing-Central Street sidewalk Terrace / 84 Apts.
66 64
R8 C / 67 Gates of the City Monument / 1 66 58 R9-a E / 72 Commercial-ground level at 132
Anawan Street Mill Complex / ~2 71 66
R9-b E / 72 Commercial-top floor at 132 Anawan Street Mill complex / ~2
71 67
R10-a E / 72 Commercial- ground level at 36 Pocasset Street Mill Complex / ~5
71 60
R10-b E / 72 Commercial--top floor at 36 Pocasset Street Mill Complex / ~5
71 65
R11 C / 67 Apartment building playground / 1 66 60 R12 B / 67 Residential-side of building / ~432
Apts. 66 59
R13 B / 67 Residential-front of unit / ~10 66 61 R14 B / 67 Residential-sidewalk near backyard /
~10 66 63
R15 B / 67 Residential-side / ~4 66 62 R16 C / 67 John J. Doran Elementary School / 1 66 56
Notes: See Figure 4-15 for locations. See Table 4-6 for an explanation of activity categories. All sound levels are expressed in dBA. (Leq(h), dBA). Leq(h) is an energy-averaged, one-hour, A-weighted noise level in decibels (dB(A)).
_______________________________________________________________ 4-44 Existing Environment
NORT
H MAIN
STRE
ET
FER
FOURTH
STREE
T
EE
T
DURF
EEST
REET
DAVO
LSTR
E ET
PINE STREET
HOPE STREET
COLUMBIA STREET
BANK STREET
WATER
ST.
CHERRY STREET
LOCUST STREET
CENTRAL STREET
DANF
ORTH
STRE
ET
SOUTHMAIN STREET
SPRING STREET
MILLIKEN BOULEVARD
BROADWAY EXTENSION RY STREET
MULB
ERR Y
S TRE
ET
CANA
L STR
EET
BROA
DWAY
POCASSET STREET PE
ARL S
TREE
T
FOUN
TAIN
STRE
ET
SECO
NDST
REET
ELM STREET
GREE
N STR
EET
CEDAR STREET
GRAN
T STR
EET
ANAWAN STREET
RO DMAN STRE ET
MILL ST.
UNION
STRE
ET
MAY S
TR
POND
ST.
ANAWAN STREET
Taun
ton Ri
ver
Quequechan River
79Source Data:Data compiled from the following source:Office of Geographic Information (MassGIS), Commonwealthof Massachusetts, Information Technology Division
Legend: Noise Modeling Receptor Locations
R1
195
R3
R4 R2
R5
R6
R7
R8
R9-aR9-b R10-a
R10 b-
P:\MH
D\2009
\E2X4
5204\6
00 Dis
cipline
Files
\607 G
is\EA-E
NF_F
igure
4-15_
Noise
.mxd
R16 R15
138 R13
R14 R11
R12
Noise Modeling ReceptorsRoute 79 / I-195Interchange Reconstruction Project
Approx. Scale: 1 " = 500 ' Fall River, MA Figure 4-15
Route 79/I-195 PART 1 Interchange Reconstruction Project NEPA Fall River, MA Environmental Assessment
4.8 Wetland and Floodplain Resources
The wetland resources in the project area are associated with the Taunton River, the Quequechan River, and Crab Pond. The Taunton River is discussed separately as a designated Wild and Scenic River in Section 4.11. Figure 4-16 gives an overview of the wetlands within the project area.
An Abbreviated Notice of Resource Area Delineation (ANRAD) was submitted to the Fall River Conservation Commission in order to establish the wetland resource area boundaries and state jurisdictional determinations pursuant to the Wetlands Protection Act (WPA) in advance of the final design. The Commission issued an Order of Resource Determination (ORAD DEP File No. SE-24-0607) in April 2011, which is included in Section 10.3.
Coordination was also carried out with the US Army Corps of Engineers in order to obtain the federal jurisdictional status of the Quequechan River Bypass Channel pursuant to the Clean Water Act (CWA). This is discussed further in Section 4.8.2.
4.8.1 Quequechan River
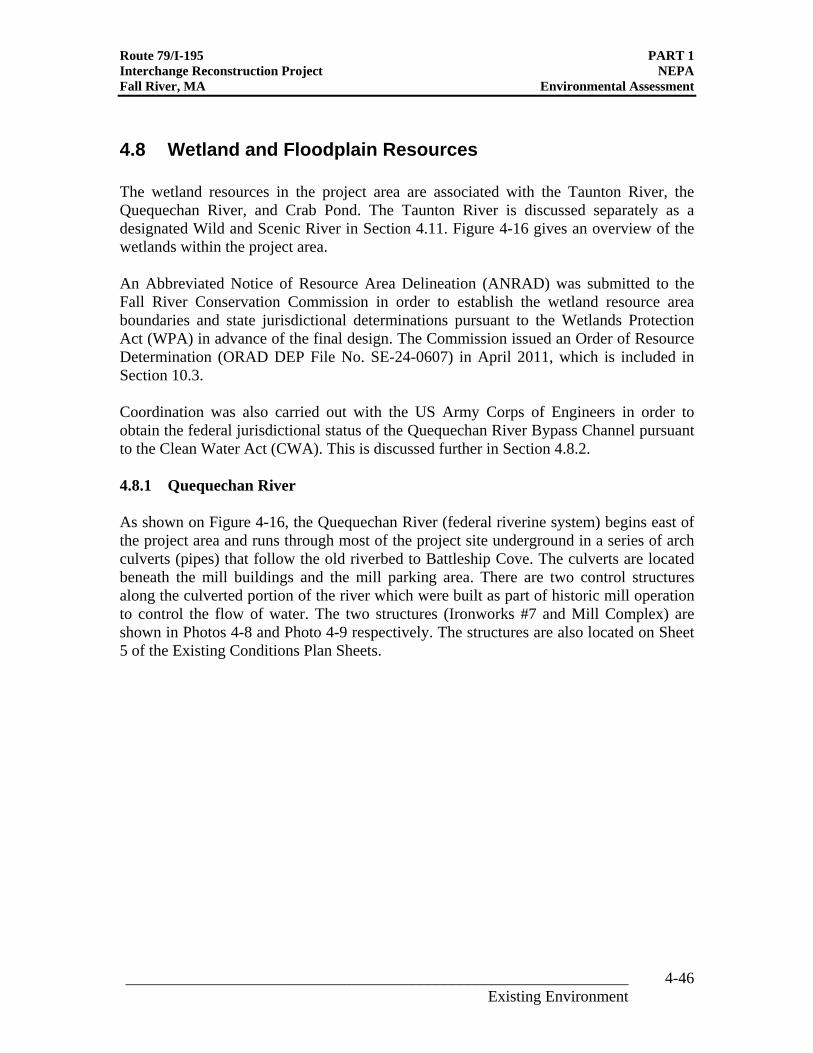
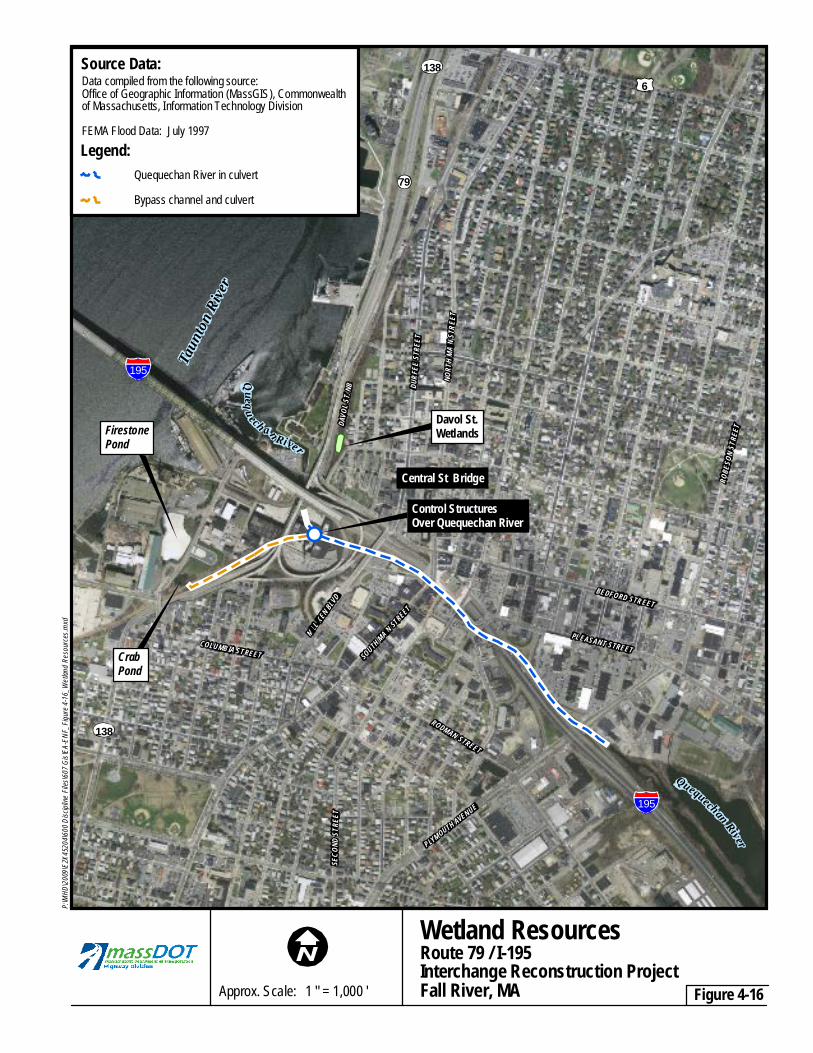
As shown on Figure 4-16, the Quequechan River (federal riverine system) begins east of the project area and runs through most of the project site underground in a series of arch culverts (pipes) that follow the old riverbed to Battleship Cove. The culverts are located beneath the mill buildings and the mill parking area. There are two control structures along the culverted portion of the river which were built as part of historic mill operation to control the flow of water. The two structures (Ironworks #7 and Mill Complex) are shown in Photos 4-8 and Photo 4-9 respectively. The structures are also located on Sheet 5 of the Existing Conditions Plan Sheets.
_______________________________________________________________ 4-46 Existing Environment
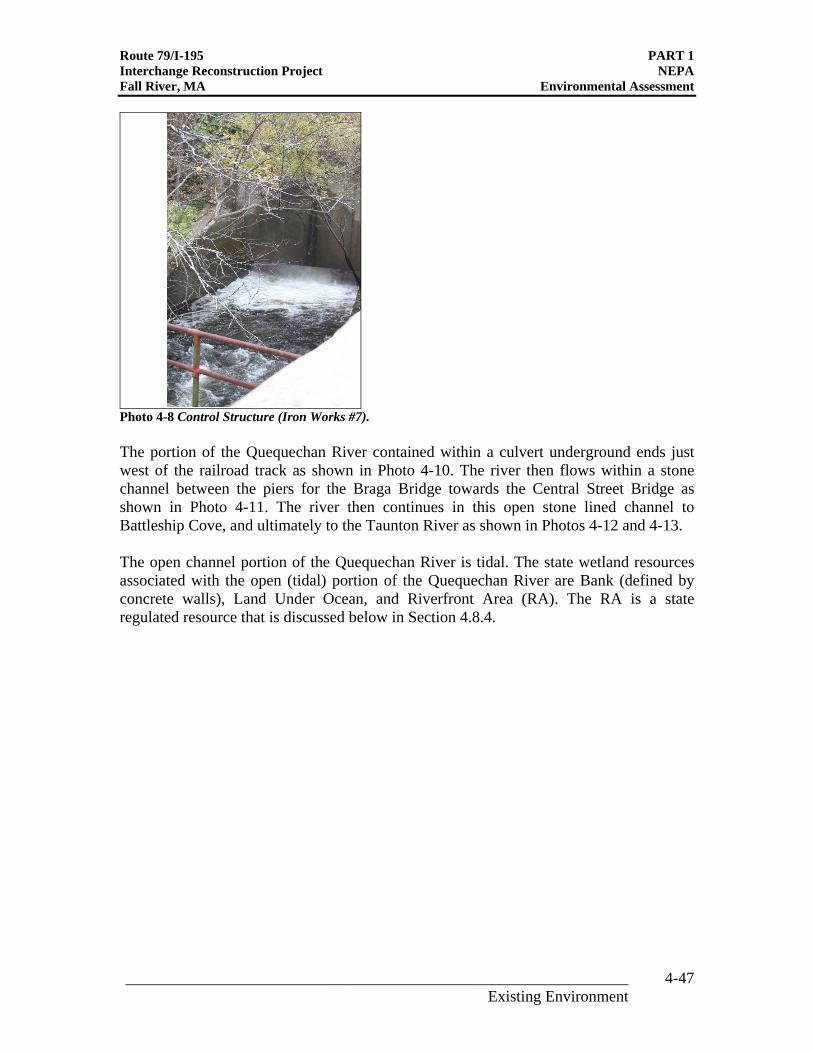
Photo 4-8 Control Structure (Iron Works #7).
Route 79/I-195 PART 1 Interchange Reconstruction Project NEPA Fall River, MA Environmental Assessment
The portion of the Quequechan River contained within a culvert underground ends just west of the railroad track as shown in Photo 4-10. The river then flows within a stone channel between the piers for the Braga Bridge towards the Central Street Bridge as shown in Photo 4-11. The river then continues in this open stone lined channel to Battleship Cove, and ultimately to the Taunton River as shown in Photos 4-12 and 4-13.
The open channel portion of the Quequechan River is tidal. The state wetland resources associated with the open (tidal) portion of the Quequechan River are Bank (defined by concrete walls), Land Under Ocean, and Riverfront Area (RA). The RA is a state regulated resource that is discussed below in Section 4.8.4.
_______________________________________________________________ 4-47 Existing Environment
.
P:\MH
D\2009
\E2X4
5204\6
00 Dis
cipline
Files
\607 G
is\EA-E
NF_F
igure
4-16_
Wetlan
d Reso
urces.
mxd
Taun
tonRiv
er
Quequechan River
Quequ ech an River
NORT
H MAIN
STRE
ET
DURF
EEST
REET
BEDFORD STREET
RODMAN STREET
SOUTHMAIN STREET
ROBE
SON S
TREE
T
SECO
ND ST
REET
COLUMBIA STREET
PLEASANT STREET
PLYMOUTH AVENUE 195
195
6
79
138
138
MILLIKEN BLVD.
DAVO
L ST. N
B
Source Data:Data compiled from the following source:Office of Geographic Information (MassGIS), Commonwealthof Massachusetts, Information Technology Division FEMA Flood Data: July 1997Legend:
Quequechan River in culvert Bypass channel and culvert
FirestPond
one Davol St.Wetlands
CrabPond
We land Resources
Central St Bridge
Control StructuresOver Quequechan River
Approx. Scale: 1 " = 1,000 '
Route 79 / I-195Interchange Reconstruction ProjectFall River, MA Figure 4-16
t
Photo 4-9 Mill Complex Outlet Control Structure
Photo 4-10 The Quequechan River culvert ends past the railroad track. Note that the culvert has collapsed. Looking southeast, upstream. Concrete pier on left is for the Davol Street Bridge.
Route 79/I-195 PART 1 Interchange Reconstruction Project NEPA Fall River, MA Environmental Assessment
_______________________________________________________________ 4-49 Existing Environment
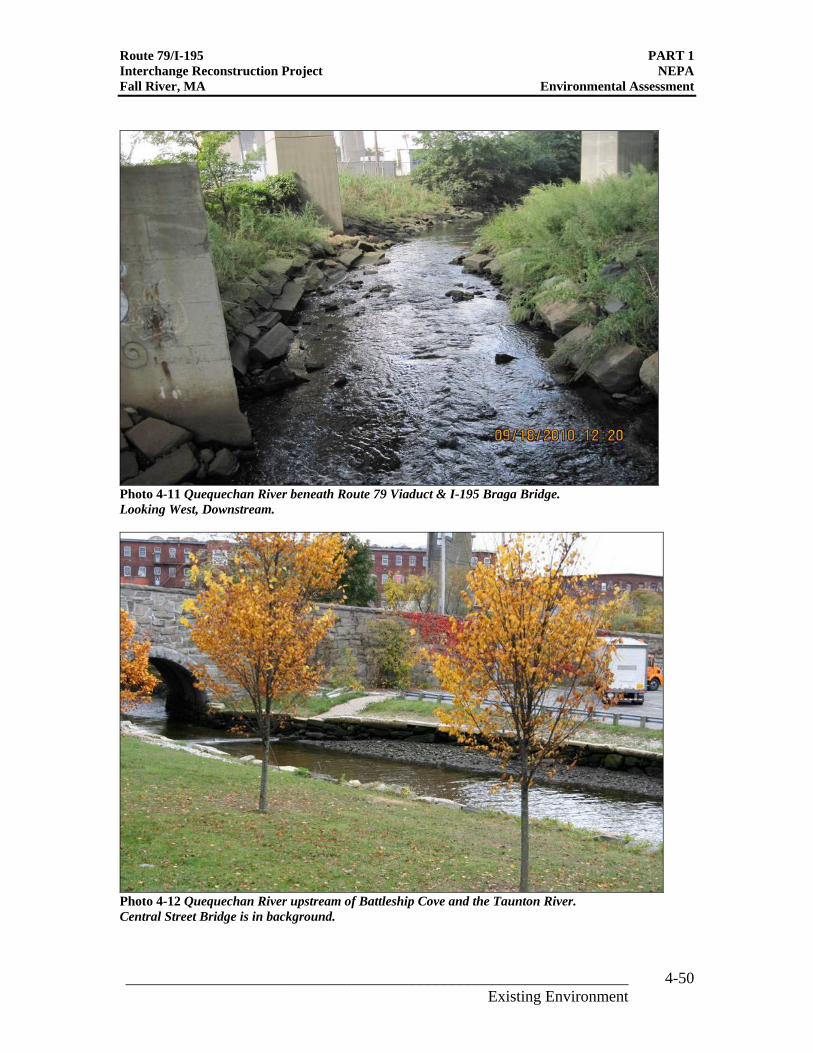
Photo 4-11 Quequechan River beneath Route 79 Viaduct & I-195 Braga Bridge.
Looking West, Downstream.
Photo 4-12 Quequechan River upstream of Battleship Cove and the Taunton River. Central Street Bridge is in background.
Route 79/I-195 PART 1 Interchange Reconstruction Project NEPA Fall River, MA Environmental Assessment
_______________________________________________________________ 4-50 Existing Environment
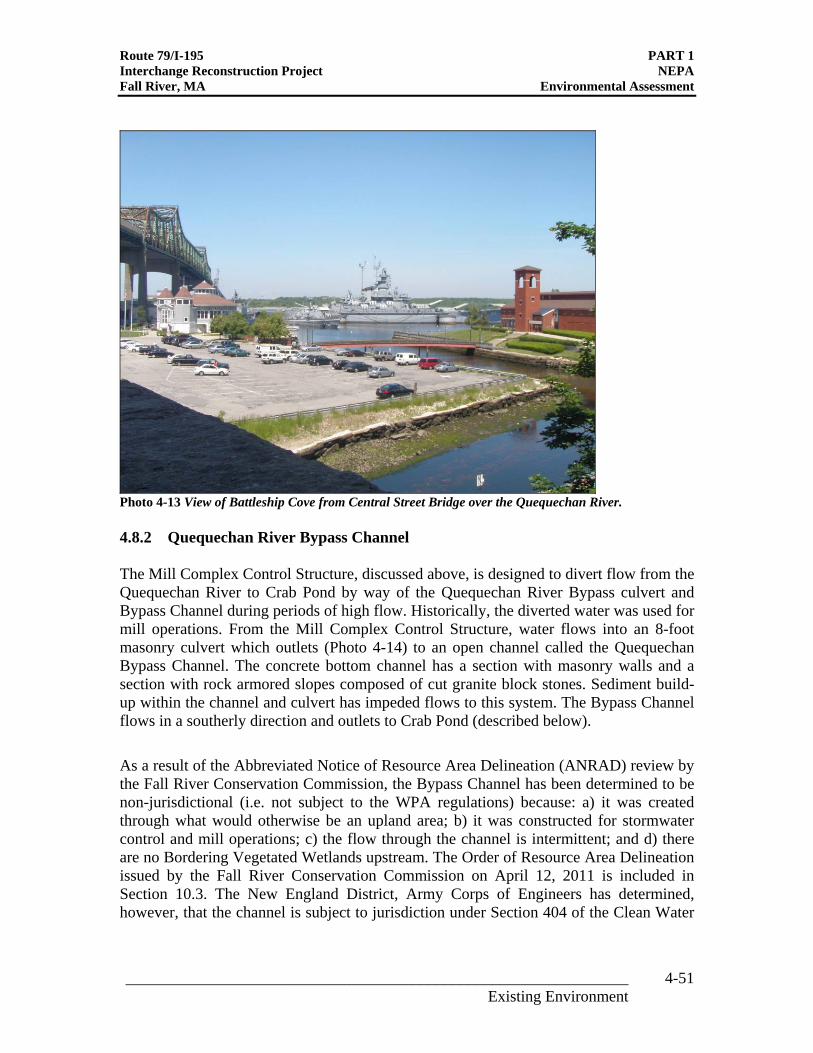
Photo 4-13 View of Battleship Cove from Central Street Bridge over the Quequechan River.
Route 79/I-195 PART 1 Interchange Reconstruction Project NEPA Fall River, MA Environmental Assessment
4.8.2 Quequechan River Bypass Channel
The Mill Complex Control Structure, discussed above, is designed to divert flow from the Quequechan River to Crab Pond by way of the Quequechan River Bypass culvert and Bypass Channel during periods of high flow. Historically, the diverted water was used for mill operations. From the Mill Complex Control Structure, water flows into an 8-foot masonry culvert which outlets (Photo 4-14) to an open channel called the Quequechan Bypass Channel. The concrete bottom channel has a section with masonry walls and a section with rock armored slopes composed of cut granite block stones. Sediment buildup within the channel and culvert has impeded flows to this system. The Bypass Channel flows in a southerly direction and outlets to Crab Pond (described below).
As a result of the Abbreviated Notice of Resource Area Delineation (ANRAD) review by the Fall River Conservation Commission, the Bypass Channel has been determined to be non-jurisdictional (i.e. not subject to the WPA regulations) because: a) it was created through what would otherwise be an upland area; b) it was constructed for stormwater control and mill operations; c) the flow through the channel is intermittent; and d) there are no Bordering Vegetated Wetlands upstream. The Order of Resource Area Delineation issued by the Fall River Conservation Commission on April 12, 2011 is included in Section 10.3. The New England District, Army Corps of Engineers has determined, however, that the channel is subject to jurisdiction under Section 404 of the Clean Water
_______________________________________________________________ 4-51 Existing Environment
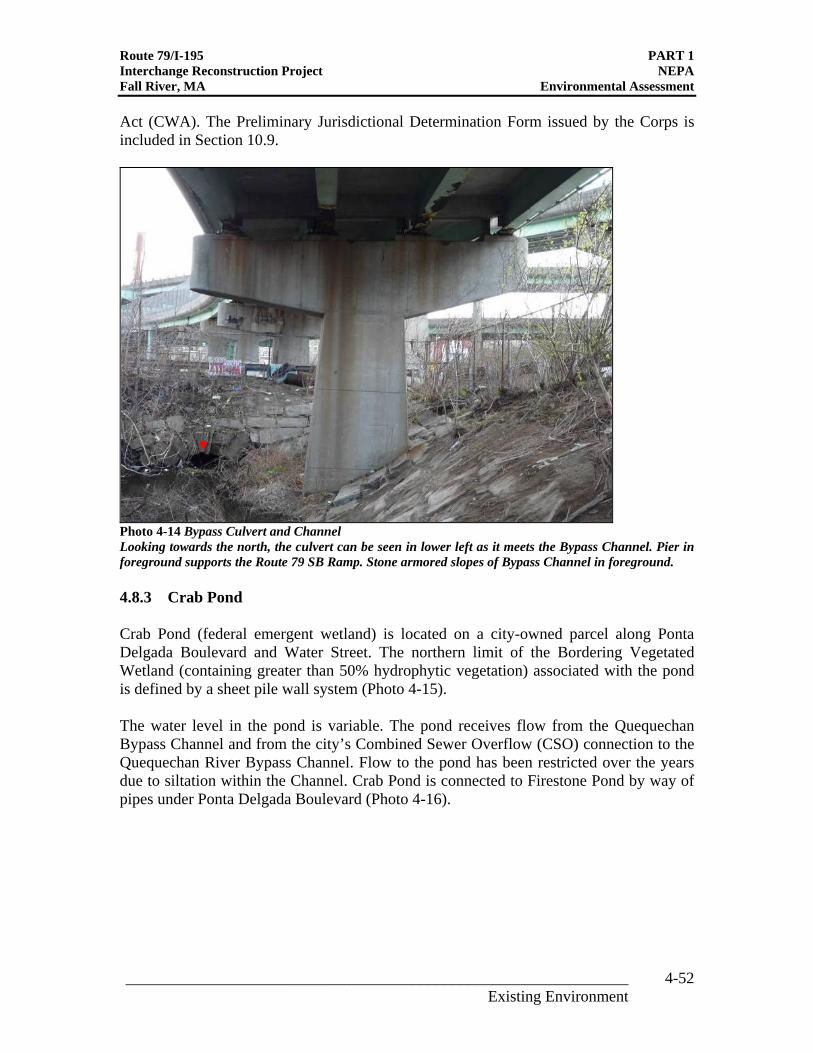
Photo 4-14 Bypass Culvert and Channel Looking towards the north, the culvert can be seen in lower left as it meets the Bypass Channel. Pier in foreground supports the Route 79 SB Ramp. Stone armored slopes of Bypass Channel in foreground.
Route 79/I-195 PART 1 Interchange Reconstruction Project NEPA Fall River, MA Environmental Assessment
Act (CWA). The Preliminary Jurisdictional Determination Form issued by the Corps is included in Section 10.9.
4.8.3 Crab Pond
Crab Pond (federal emergent wetland) is located on a city-owned parcel along Ponta Delgada Boulevard and Water Street. The northern limit of the Bordering Vegetated Wetland (containing greater than 50% hydrophytic vegetation) associated with the pond is defined by a sheet pile wall system (Photo 4-15).
The water level in the pond is variable. The pond receives flow from the Quequechan Bypass Channel and from the city’s Combined Sewer Overflow (CSO) connection to the Quequechan River Bypass Channel. Flow to the pond has been restricted over the years due to siltation within the Channel. Crab Pond is connected to Firestone Pond by way of pipes under Ponta Delgada Boulevard (Photo 4-16).
_______________________________________________________________ 4-52 Existing Environment
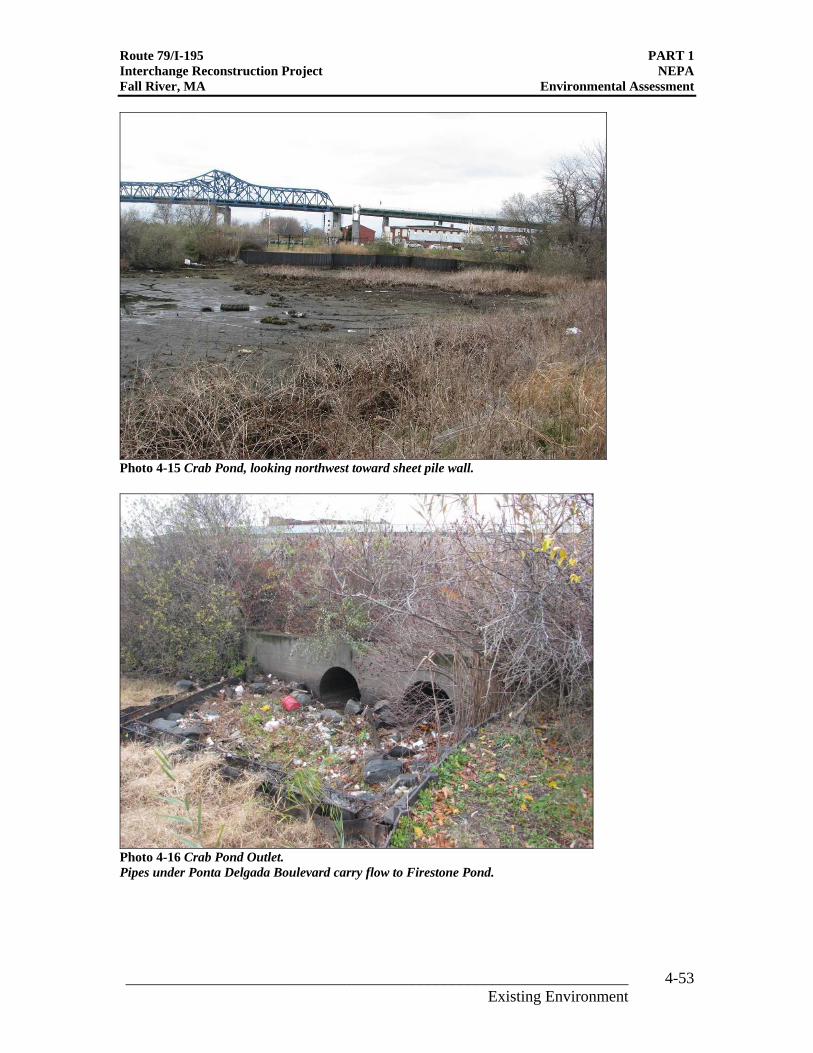
Photo 4-15 Crab Pond, looking northwest toward sheet pile wall.
Photo 4-16 Crab Pond Outlet. Pipes under Ponta Delgada Boulevard carry flow to Firestone Pond.
Route 79/I-195 PART 1 Interchange Reconstruction Project NEPA Fall River, MA Environmental Assessment
_______________________________________________________________ 4-53 Existing Environment
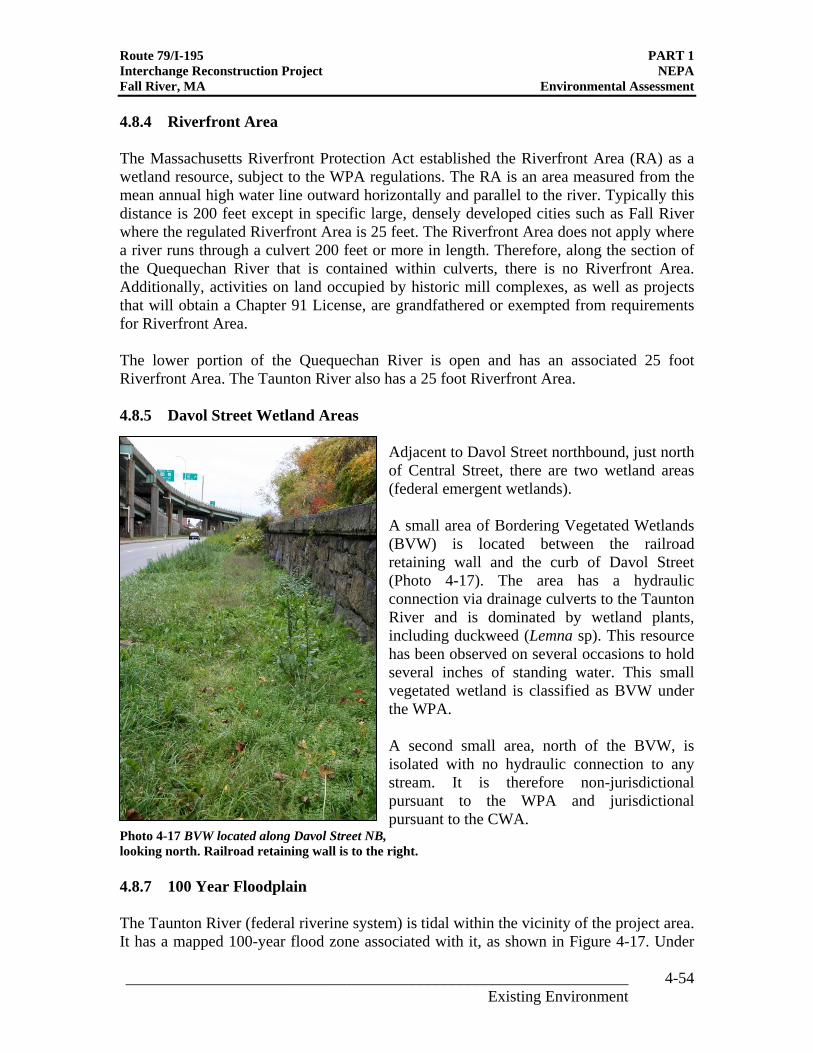
Photo 4-17 BVW located along Davol Street NB,
Route 79/I-195 PART 1 Interchange Reconstruction Project NEPA Fall River, MA Environmental Assessment
4.8.4 Riverfront Area
The Massachusetts Riverfront Protection Act established the Riverfront Area (RA) as a wetland resource, subject to the WPA regulations. The RA is an area measured from the mean annual high water line outward horizontally and parallel to the river. Typically this distance is 200 feet except in specific large, densely developed cities such as Fall River where the regulated Riverfront Area is 25 feet. The Riverfront Area does not apply where a river runs through a culvert 200 feet or more in length. Therefore, along the section of the Quequechan River that is contained within culverts, there is no Riverfront Area. Additionally, activities on land occupied by historic mill complexes, as well as projects that will obtain a Chapter 91 License, are grandfathered or exempted from requirements for Riverfront Area.
The lower portion of the Quequechan River is open and has an associated 25 foot Riverfront Area. The Taunton River also has a 25 foot Riverfront Area.
4.8.5 Davol Street Wetland Areas
Adjacent to Davol Street northbound, just north of Central Street, there are two wetland areas (federal emergent wetlands).
A small area of Bordering Vegetated Wetlands (BVW) is located between the railroad retaining wall and the curb of Davol Street (Photo 4-17). The area has a hydraulic connection via drainage culverts to the Taunton River and is dominated by wetland plants, including duckweed (Lemna sp). This resource has been observed on several occasions to hold several inches of standing water. This small vegetated wetland is classified as BVW under the WPA.
A second small area, north of the BVW, is isolated with no hydraulic connection to any stream. It is therefore non-jurisdictional pursuant to the WPA and jurisdictional pursuant to the CWA.
looking north. Railroad retaining wall is to the right.
4.8.7 100 Year Floodplain
The Taunton River (federal riverine system) is tidal within the vicinity of the project area. It has a mapped 100-year flood zone associated with it, as shown in Figure 4-17. Under
_______________________________________________________________ 4-54 Existing Environment
Route 79/I-195 PART 1 Interchange Reconstruction Project NEPA Fall River, MA Environmental Assessment
the WPA, this area is defined as Land Subject to Coastal Storm Flowage (LSCSF). Land Subject to Coastal Storm Flowage is defined at 310 CMR 10.04 as: "land subject to any inundation caused by coastal storms up to and including that caused by the 100-year storm, surge of record or storm of record, whichever is greater".
The two primary types of flood zones (or special flood hazard areas) included in the Massachusetts Wetlands Protection Act regulations as Land Subject to Coastal Storm Flowage are velocity zones and A-zones. Velocity flood zones, also known as V-zones or coastal high hazard areas, have been identified by the Federal Emergency Management Agency (FEMA) as areas "where wave action and/or high velocity water can cause structural damage in the 100-year flood," a flood with a 1-percent chance of occurring or being exceeded in a given year. A-zones are areas inundated in a 100-year storm event that experience conditions of less severity than conditions experienced in V-zones. Since FEMA flood zones may experience dangerous storm-generated wave action and surges, an accurate determination of the spatial extent of these zones is vital to understanding the level of risk for a particular property or activity.
MassDEP uses the 100-year coastal flooding event as defined and mapped by FEMA, unless recorded storm data reveals a higher flood elevation. Within the project area the flood zone is highly urbanized and includes roadways and railroad rights of way. Natural coastal wetlands, such as salt marsh or coastal dunes are absent from the project area. Areas defined as subject to flooding within the project vicinity include mill buildings along Pocasset Street, all of Mill Street (north of Anawan Street), Heritage Park and almost all of Davol Street.
According to the FEMA mapping, a short segment of the proposed reconstruction of existing Route 79 roadway along the west edge of the corridor and immediately north of the Central Street intersection falls within the 100-year Flood Velocity Hazard Zone on plan view. However, the V Zone flood surge elevation is 19. The existing and proposed roadway is above this elevation. Additionally, the elevation of the roadway in this segment is about 30+ feet higher in vertical elevation than water’s edge of the Quequechan River and about 80 feet east of the river. The Quequechan River is defined and contained by an existing granite block seawall that provides approximately 3 feet of reveal height above normal high water.
The majority of the critical storm surge wave action during a 100 year flood under V-Zone condition will occur further west, about 600 feet away from the limits of the proposed roadway improvements. This is primarily due to the unique configuration of the Quequechan River at Battleship Cove which provides a sheltered waterway area within this zone of the coastline that is not directly impacted by the wave action occurring in greater Mount Hope Bay and the Taunton River.
_______________________________________________________________ 4-55 Existing Environment
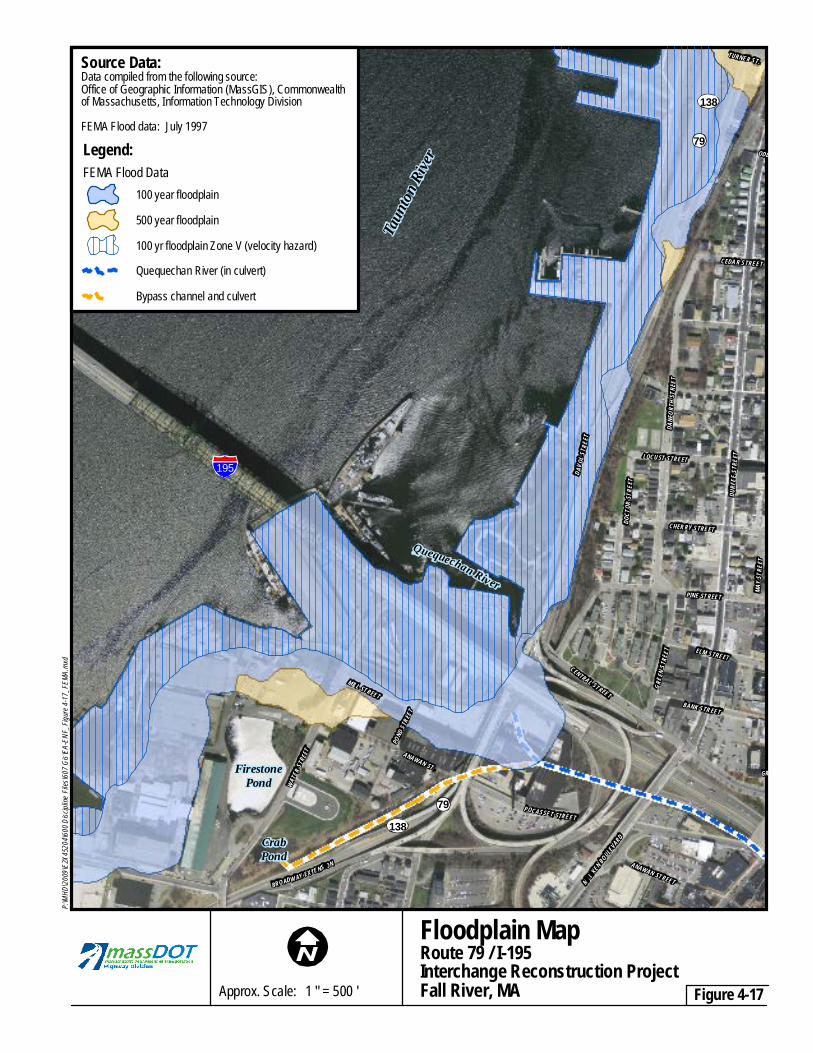
T
Taunto
n Rive
r
195
Quequechan River
WATE
RSTR
EET
MILL STREET
POND
STRE
ET
ANAWAN ST.FirestonePond
DURF
EEST
REET
D AV O
L ST R
EET
PINE STREET
BANK STREET
CHERRY STREET
LOCUST STREET
CENTRAL STREET
DANF
ORTH
STRE
ET
ELM STREETGR
E EN S
TRE E
T
CEDAR STREET
MAY S
TREE
T
ODD
DOCT
ORST
REET
GR
TURNER ST.
79
138
Source Data:Data compiled from the following source:Office of Geographic Information (MassGIS), Commonwealthof Massachusetts, Information Technology Division FEMA Flood data: July 1997Legend:FEMA Flood Data
100 year floodplain 500 year floodplain 100 yr floodplain Zone V (velocity hazard)Quequechan River (in culvert)Bypass channel and culvert
P:\MH
D\2009
\E2X4
5204\6
00 Dis
cipline
Files
\607 G
is\EA-E
NF_F
igure
4-17_
FEMA
.mxd
MILLIKEN BOULEVARD
BROADW AY EXTENSION
POCASSET STREET
ANAWAN STREET
138 79
CrabPond
Floodplain MapRoute 79 / I-195Interchange Reconstruction Project
Approx. Scale: 1 " = 500 ' Fall River, MA -Figure 4 17
NORT
H MAIN
STRE
ET
WALNUT STREET
SOUTHMAIN STREE
BEDFORD STREET
CANA
L STR
EET
STREET
ANITE STREET
Route 79/I-195 PART 1 Interchange Reconstruction Project NEPA Fall River, MA Environmental Assessment
4.9 Wildlife and Fisheries
The project area is located within a highly urbanized area. Most of the upland areas consist of industrial facilities, commercial businesses, roadways, and railroads, except for Heritage Park and the areas around the Gates of the City and Claudio Monuments. Given the nature and small size of any open areas, their isolation from other larger habitat, and their proximity to human activity, their potential for wildlife habitat is limited to a few species common to urban environments.
The Taunton River and the lower portion of the Quequechan River are tidal, although most of the Quequechan River within the project area is within culverts as discussed in Section 4.8. Fisheries data discussed in the Taunton River Watershed 2001 Water Quality Assessment Report identified several coastal fish species including Alewife, Atlantic Silverside, Cunner, Tautog, and Winter Flounder as some of the fish species found in the Taunton River. The Taunton River is also a fish run for anadromous fish, including the state-listed Atlantic Salmon.
The USFWS Federally Listed Endangered and Threatened Species list for Bristol County Massachusetts (revised 6/22/2009) was reviewed. Effective April 6, 2012, Atlantic Sturgeon has been listed as a federally endangered species. This species may occur within the Taunton River, but since there is no work proposed in the river, there is no adverse effect anticipated. MassDOT has been authorized by FHWA to consult directly with the National Marine Fisheries Service (NMFS) as the non-federal representative for the project in a letter from FHWA to NMFS dated April 4, 2012. A Section 7 Consultation letter, dated April 5, 2012, was sent by MassDOT to the Northeast Regional Office of NMFS to solicit comments. In a letter dated April 12, 2012, the NMFS stated that no federally listed or proposed threatened or endangered species and/or designated critical habitat are known to exist within the project area. No further coordination is required. The letters are included in Section 10.10.
According to the 2008 Natural Heritage & Endangered Species Program (NHESP), and confirmed in a letter from NHESP (provided in Section 10.8), the project area is not within any mapped Priority or Estimated Habitat.
4.10 Stormwater Management System and Combined Sewer Overflow
The existing drainage from the viaduct and other roadways within the project area discharges either directly or indirectly into the Quequechan River, Crab Pond, and the Taunton River. Downspouts from the existing overhead viaduct structure either discharge directly to the ground and flow overland into the waterways, or connect into the existing ground level roadway drainage outlets. Sedimentation that has built up at the discharge
_______________________________________________________________ 4-57 Existing Environment
Route 79/I-195 PART 1 Interchange Reconstruction Project NEPA Fall River, MA Environmental Assessment
outlets and within the catch basins compromises the efficiency of the existing drainage system.
The Quequechan River Bypass Channel, discussed in Section 4.8.2, conveys overflow during storm events towards Crab Pond from the Canal Street Combined Sewer Overflow (CSO), identified as wet weather sewage discharge outfall #0019. Fall River has developed a CSO Abatement Program which includes expansion of the Regional Wastewater Treatment Plant on Bay Street approximately 3 miles south of the project and separation of the CSO system. Wastewater collection systems can be "separate" and "combined" sewers. Separate systems are comprised of two independent piping systems: one system for "sanitary" sewage (i.e., sewage from homes and businesses) and one system for stormwater (runoff from roads and other paved surfaces during storms). A combined sewer system conveys both sanitary sewage and stormwater in one piping system.
During normal dry weather conditions, sanitary wastes collected in the combined sewer system are diverted to the Wastewater Treatment Plant. During periods of heavy rainfall, the capacity of a combined sewer may be exceeded. When this occurs, the excess flow, which is a mixture of storm water and sanitary wastes, is discharged directly into the tributary waters. This excess flow is called Combined Sewer Overflow (CSO). Release of this excess flow is necessary to prevent flooding in homes, basements, businesses, and streets.
The Taunton and Quequechan Rivers are considered impaired waters by MassDEP and have Total Maximum Daily Loads (TMDLs) established for pathogens and waterborne bacteria.
4.11 Wild and Scenic Rivers
The Taunton River is located to the west of the project site and is defined by a concrete bank. In March 2009, the Taunton River, from its headwaters in Bridgewater to the Braga Bridge in Fall River, was officially designated as a Wild and Scenic River and was incorporated into the National Park Service's Wild and Scenic River management program. Wild and Scenic River designation includes protection of water quality, historic, cultural, and recreational values.
As part of the process to designate the river a Wild and Scenic River, a Stewardship Management Plan was developed. The Taunton River Stewardship Plan presents a vision and action strategies for management and protection of approximately 40 miles of the River. The major resources for management and protection include agriculture, ecology and biological diversity, the estuary, fisheries, history and archaeology, recreation and scenery. The Plan outlines the resources, objectives and action strategies.
Effective April 6, 2012, Atlantic Sturgeon has been listed as a federally endangered species. This species may occur within the Taunton River, but since there is no work
_______________________________________________________________ 4-58 Existing Environment
Route 79/I-195 PART 1 Interchange Reconstruction Project NEPA Fall River, MA Environmental Assessment
proposed in the river, there is no adverse effect anticipated. Consultation has been initiated with NMFS as discussed in Section 4.9.
4.12 Massachusetts Coastal Zone
The federal Coastal Zone Management Act of 1972 gave states with marine or Great Lakes shorelines the opportunity to develop management plans for coastal resources within the coastal zone and the authority to implement those plans. The project area is within the Massachusetts Coastal Zone as shown on Figure 4-18.
The Massachusetts Coastal Zone Management Office (MCZM) implements the 2011 Massachusetts Coastal Zone Management Policy Guide (Policy Guide) which is a component of the federally approved Massachusetts coastal program and replaces the 2002 Massachusetts Coastal Zone Management Plan. The Policy Guide includes the coastal program polices. MCZM established the Designated Port Area (DPA) program for the purposes of promoting and protecting marine industrial activities and other supporting uses. MCZM ensures consistency with its policies by the federal consistency review process through several laws and regulations such as the Massachusetts Environmental Policy Act (MEPA), the Massachusetts Wetlands Protection Act, and the Massachusetts Public Waterfront Act (Chapter 91).
The Massachusetts coastal zone is the area bounded by the seaward limit of the state’s territorial sea, generally 3 miles from shore to 100 feet landward of major roads, railroads or other visible right-of-way. The South Coastal Region of MCZM includes the coastal communities which border on Buzzard’s Bay, Mount Hope Bay and the Taunton River, including Fall River. The South Coastal Region has two major industrial ports, New Bedford and Fall River (Mount Hope Bay Designated Port Area).
4.12.1 MA Office of Coastal Zone Management’s Coastal Policies
The Massachusetts Office of Coastal Zone Management has established the following program policies that address natural, cultural, social, and economic resources.
Water Quality Water Quality Policy #1 - Ensure that point-source discharges in or affecting the coastal zone are consistent with federally approved state effluent limitations and water quality standards.
Water Quality Policy #2 - Ensure that nonpoint source (NPS) pollution controls promote the attainment of state surface water quality standards in the coastal zone.
Water Quality Policy #3 - Ensure that activities in or affecting the coastal zone conform to applicable state and federal requirements governing subsurface waste discharges.
_______________________________________________________________ 4-59 Existing Environment
Route 79/I-195 PART 1 Interchange Reconstruction Project NEPA Fall River, MA Environmental Assessment
Habitat Habitat Policy #1 - Protect coastal resource areas including salt marshes, shellfish beds, dunes, beaches, barrier beaches, salt ponds, eelgrass beds, and fresh water wetlands for critical wildlife habitat functions as well as other including nutrient and sediment attenuation, wave and storm damage protection, and landform movement and processes.
Habitat Policy #2 - Restore degraded or former wetland resources in coastal areas and ensure that activities in coastal areas do not further wetland degradation but instead take advantage of opportunities to engage in wetland restoration.
Protected Areas Protected Areas Policy #1 - Preserve, restore, and enhance complexes of coastal resources of regional or statewide significance through the Areas of Critical Environmental Concern (ACEC) program.
Protected Areas Policy #2 - Protect state and locally designated scenic rivers and state-classified scenic rivers in the coastal zone.
Protected Areas Policy #3 - Ensure that proposed developments in or near designated or registered historic districts or sites respect the preservation intent of the designation and that potential adverse effects are minimized.
Coastal Hazard Coastal Hazard Policy #1 - Preserve, protect, restore, and enhance the beneficial functions of storm damage prevention and flood control provided by natural coastal landforms, such as dunes, beaches, barrier beaches, coastal banks, land subject to coastal storm flowage, salt marshes, and land under the ocean.
Coastal Hazard Policy #2 - Ensure construction in water bodies and contiguous land areas will minimize interference with water circulation and sediment transport. Approve permits for flood or erosion control projects only when it has been determined that there will be no significant adverse effects on the project site or adjacent or down coast areas.
Coastal Hazard Policy #3 - Ensure that state and federally funded public works projects proposed for location within the coastal zone will: • Not exacerbate existing hazards or damage natural buffers or other natural
resources. • Be reasonably safe from flood and erosion related damage. • Not promote growth and development in hazard-prone or buffer areas, especially
in Velocity zones and ACECs. • Not be used on Coastal Barrier Resource Units for new or substantial
reconstruction of structures in a manner inconsistent with the Coastal Barrier Resource/ Improvement Acts.
_______________________________________________________________ 4-60 Existing Environment
Route 79/I-195 PART 1 Interchange Reconstruction Project NEPA Fall River, MA Environmental Assessment
Coastal Hazard Policy #4 - Prioritize hazard mitigation funds for acquisition of hazardous coastal areas for conservation or recreation use, and relocation of structures out of coastal high hazard areas, giving due consideration to the effects of coastal hazards at the location to the use and manageability of the area.
Ports Ports Policy #1 - Ensure that dredging and disposal of dredged material minimize adverse effects on water quality, physical processes, marine productivity and public health.
Ports Policy #2 - Obtain the widest possible public benefit from channel dredging, ensuring that designated ports and developed harbors are given highest priority in the allocation of federal and state dredging funds. Ensure that this dredging is consistent with marine environment policies.
Ports Policy #3 - Preserve and enhance the capacity of Designated Port Areas (DPAs) to accommodate water-dependent industrial uses, and prevent the exclusion of such uses from tidelands and any other DPA lands over which a state agency exerts control by virtue of ownership, regulatory authority, or other legal jurisdiction.
Ports Management Principle #1 - Encourage, through technical and financial assistance, expansion of water dependent uses in designated ports and developed harbors, redevelopment of urban waterfronts, and expansion of visual access.
Public Access Public Access Policy #1 - Ensure that the adverse impacts of developments proposed near existing public recreation sites are minimized.
Public Access Management Principle #1 - Improve public access to coastal recreation facilities and alleviate auto traffic and parking problems through improvements in public transportation. Link existing coastal recreation sites to each other or to nearby coastal inland facilities via trails for cyclists, hikers, and equestrians, and via rivers for boaters.
Public Access Management Principle #2 - Increase capacity of existing recreation areas by facilitating multiple use and by improving management, maintenance and public support facilities. Resolve conflicting uses whenever possible through improved management rather than through exclusion of uses.
Public Access Management Principle #3 - Provide technical assistance to developers of private recreational facilities and sites that increase public access to the shoreline.
Public Access Management Principle #4 - Expand existing recreation facilities and acquire and develop new public areas for coastal recreational activities. Give highest priority to expansions or new acquisitions in regions of high need or limited site availability. Assure that both transportation access and the recreational facilities are compatible with social and environmental characteristics of surrounding communities.
_______________________________________________________________ 4-61 Existing Environment
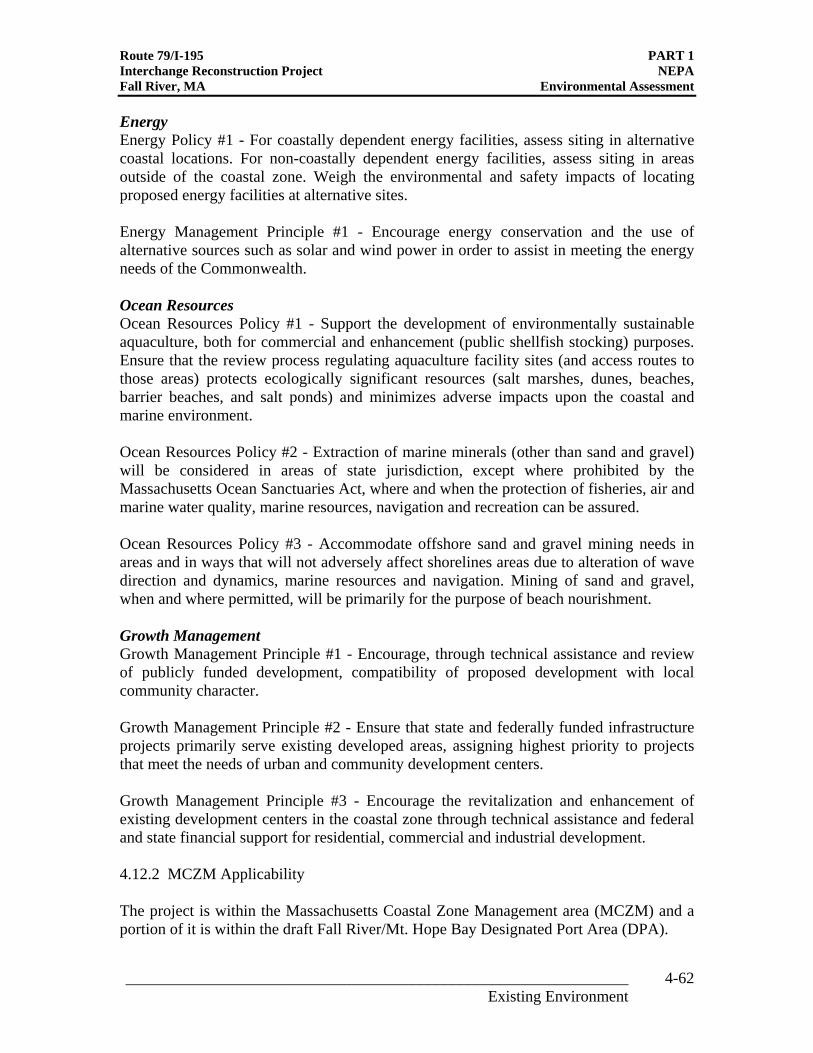
Route 79/I-195 PART 1 Interchange Reconstruction Project NEPA Fall River, MA Environmental Assessment
Energy Energy Policy #1 - For coastally dependent energy facilities, assess siting in alternative coastal locations. For non-coastally dependent energy facilities, assess siting in areas outside of the coastal zone. Weigh the environmental and safety impacts of locating proposed energy facilities at alternative sites.
Energy Management Principle #1 - Encourage energy conservation and the use of alternative sources such as solar and wind power in order to assist in meeting the energy needs of the Commonwealth.
Ocean Resources Ocean Resources Policy #1 - Support the development of environmentally sustainable aquaculture, both for commercial and enhancement (public shellfish stocking) purposes. Ensure that the review process regulating aquaculture facility sites (and access routes to those areas) protects ecologically significant resources (salt marshes, dunes, beaches, barrier beaches, and salt ponds) and minimizes adverse impacts upon the coastal and marine environment.
Ocean Resources Policy #2 - Extraction of marine minerals (other than sand and gravel) will be considered in areas of state jurisdiction, except where prohibited by the Massachusetts Ocean Sanctuaries Act, where and when the protection of fisheries, air and marine water quality, marine resources, navigation and recreation can be assured.
Ocean Resources Policy #3 - Accommodate offshore sand and gravel mining needs in areas and in ways that will not adversely affect shorelines areas due to alteration of wave direction and dynamics, marine resources and navigation. Mining of sand and gravel, when and where permitted, will be primarily for the purpose of beach nourishment.
Growth Management Growth Management Principle #1 - Encourage, through technical assistance and review of publicly funded development, compatibility of proposed development with local community character.
Growth Management Principle #2 - Ensure that state and federally funded infrastructure projects primarily serve existing developed areas, assigning highest priority to projects that meet the needs of urban and community development centers.
Growth Management Principle #3 - Encourage the revitalization and enhancement of existing development centers in the coastal zone through technical assistance and federal and state financial support for residential, commercial and industrial development.
4.12.2 MCZM Applicability
The project is within the Massachusetts Coastal Zone Management area (MCZM) and a portion of it is within the draft Fall River/Mt. Hope Bay Designated Port Area (DPA).
_______________________________________________________________ 4-62 Existing Environment
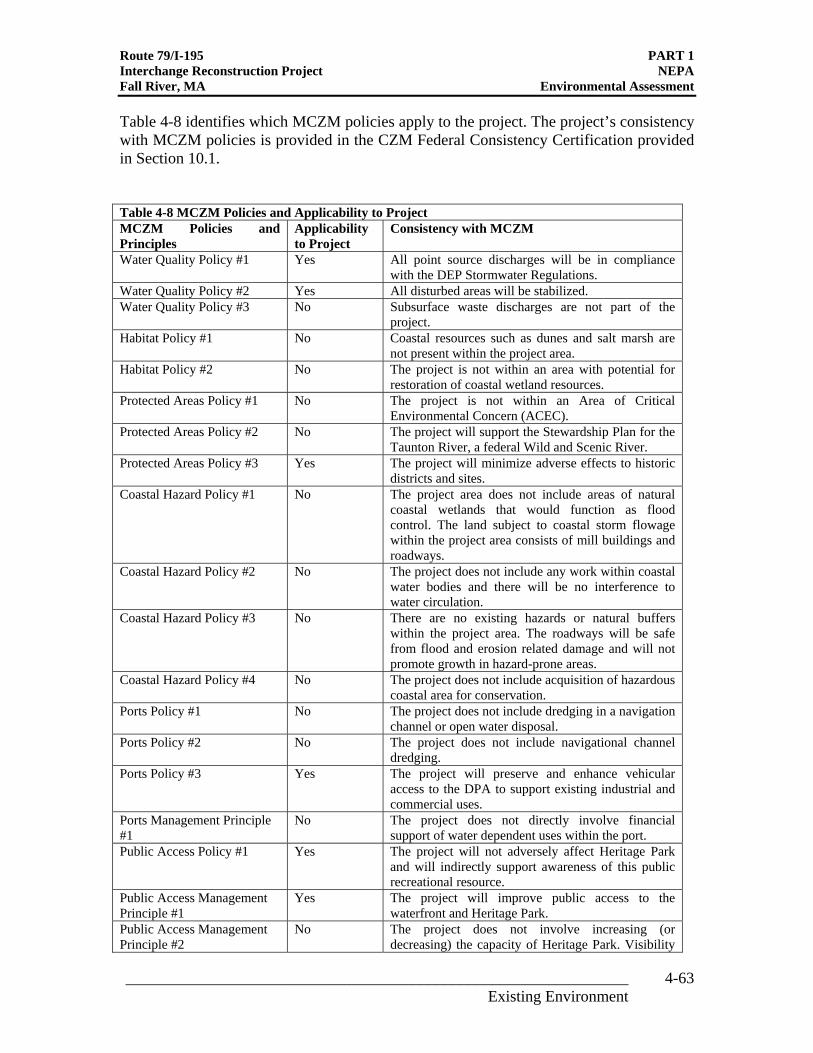
Route 79/I-195 PART 1 Interchange Reconstruction Project NEPA Fall River, MA Environmental Assessment
Table 4-8 identifies which MCZM policies apply to the project. The project’s consistency with MCZM policies is provided in the CZM Federal Consistency Certification provided in Section 10.1.
Table 4-8 MCZM Policies and Applicability to Project MCZM Policies and Principles
Applicability to Project
Consistency with MCZM
Water Quality Policy #1 Yes All point source discharges will be in compliance with the DEP Stormwater Regulations.
Water Quality Policy #2 Yes All disturbed areas will be stabilized. Water Quality Policy #3 No Subsurface waste discharges are not part of the
project. Habitat Policy #1 No Coastal resources such as dunes and salt marsh are
not present within the project area. Habitat Policy #2 No The project is not within an area with potential for
restoration of coastal wetland resources. Protected Areas Policy #1 No The project is not within an Area of Critical
Environmental Concern (ACEC). Protected Areas Policy #2 No The project will support the Stewardship Plan for the
Taunton River, a federal Wild and Scenic River. Protected Areas Policy #3 Yes The project will minimize adverse effects to historic
districts and sites. Coastal Hazard Policy #1 No The project area does not include areas of natural
coastal wetlands that would function as flood control. The land subject to coastal storm flowage within the project area consists of mill buildings and roadways.
Coastal Hazard Policy #2 No The project does not include any work within coastal water bodies and there will be no interference to water circulation.
Coastal Hazard Policy #3 No There are no existing hazards or natural buffers within the project area. The roadways will be safe from flood and erosion related damage and will not promote growth in hazard-prone areas.
Coastal Hazard Policy #4 No The project does not include acquisition of hazardous coastal area for conservation.
Ports Policy #1 No The project does not include dredging in a navigation channel or open water disposal.
Ports Policy #2 No The project does not include navigational channel dredging.
Ports Policy #3 Yes The project will preserve and enhance vehicular access to the DPA to support existing industrial and commercial uses.
Ports Management Principle #1
No The project does not directly involve financial support of water dependent uses within the port.
Public Access Policy #1 Yes The project will not adversely affect Heritage Park and will indirectly support awareness of this public recreational resource.
Public Access Management Principle #1
Yes The project will improve public access to the waterfront and Heritage Park.
Public Access Management Principle #2
No The project does not involve increasing (or decreasing) the capacity of Heritage Park. Visibility
_______________________________________________________________ 4-63 Existing Environment
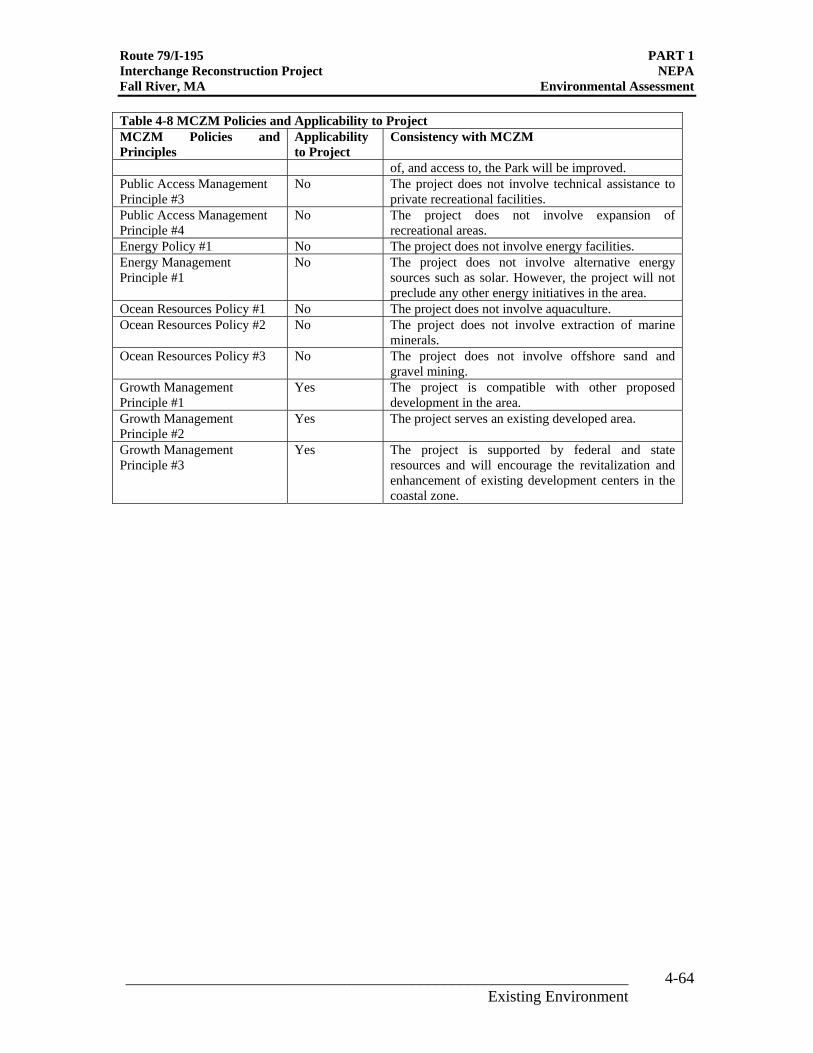
Route 79/I-195 PART 1 Interchange Reconstruction Project NEPA Fall River, MA Environmental Assessment
Table 4-8 MCZM Policies and Applicability to Project MCZM Policies and Principles
Applicability to Project
Consistency with MCZM
of, and access to, the Park will be improved. Public Access Management Principle #3
No The project does not involve technical assistance to private recreational facilities.
Public Access Management Principle #4
No The project does not involve expansion of recreational areas.
Energy Policy #1 No The project does not involve energy facilities. Energy Management Principle #1
No The project does not involve alternative energy sources such as solar. However, the project will not preclude any other energy initiatives in the area.
Ocean Resources Policy #1 No The project does not involve aquaculture. Ocean Resources Policy #2 No The project does not involve extraction of marine
minerals. Ocean Resources Policy #3 No The project does not involve offshore sand and
gravel mining. Growth Management Principle #1
Yes The project is compatible with other proposed development in the area.
Growth Management Principle #2
Yes The project serves an existing developed area.
Growth Management Principle #3
Yes The project is supported by federal and state resources and will encourage the revitalization and enhancement of existing development centers in the coastal zone.
_______________________________________________________________ 4-64 Existing Environment
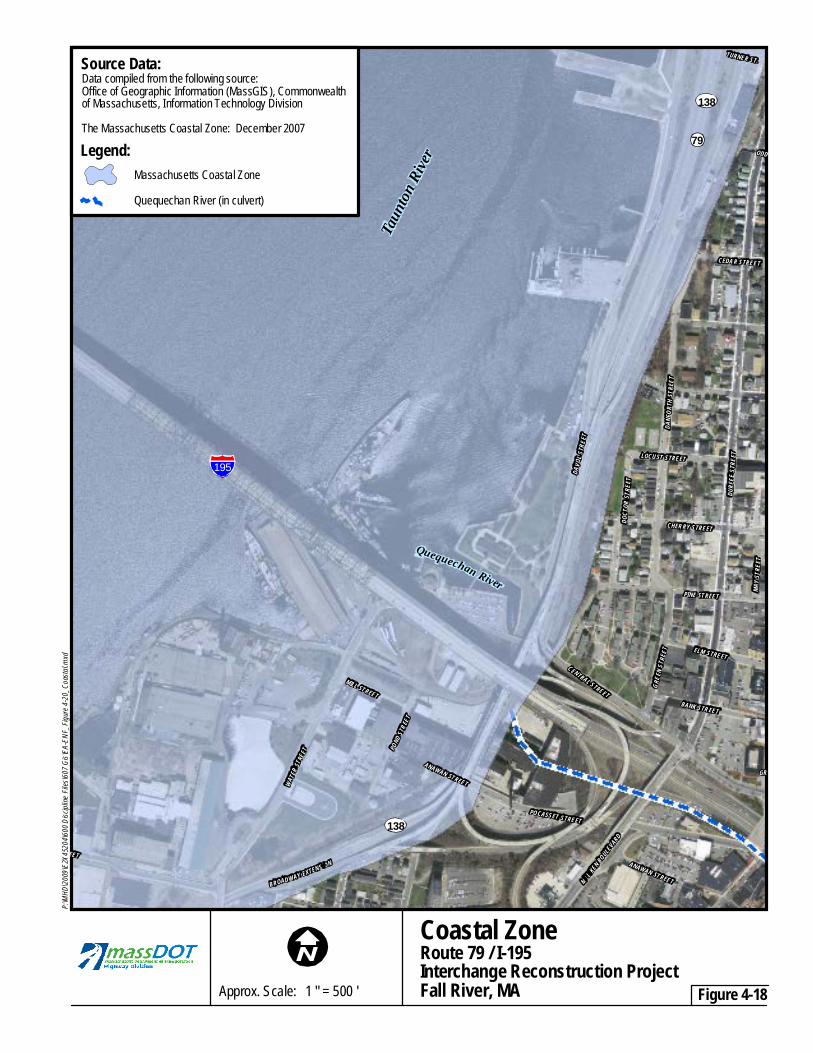
E
R
A
T
Taunto
n Rive
r ODD
TURNER ST.
79
138
CEDAR STREET
EET
DURF
EEST
REET
DAVO
L STR
EET
PINE STREET
BANK STREET
WATE
R STRE
ET
CHERRY STREET
LOCUST STREET
CENTRAL STREET
DANF
ORTH
STRE
ET
MILLIKEN BOULEVARD
BROADWAY EXTENSION
POCASSET STREET
ELM STREETGR
E EN S
T RE E
T
ANAWAN STREET
MILL STREET
MAY S
TREE
T
POND
STRE
ET
DOCT
ORST
REET
GRANAWAN STREET
195
138
Quequechan River
Source Data:Data compiled from the following source:Office of Geographic Information (MassGIS), Commonwealthof Massachusetts, Information Technology Division The Massachusetts Coastal Zone: December 2007Legend:
Massachusetts Coastal Zone Quequechan River (in culvert)
P:\MH
D\2009
\E2X4
5204\6
00 Dis
cipline
Files
\607 G
is\EA-E
NF_F
igure
4-20_
Coast
al.mxd
Coastal ZoneRoute 79 / I-195Interchange Reconstruction Project
Approx. Scale: 1 " = 500 ' Fall River, MA -Figure 4 18
WALNUT STREET
SOUTHMAIN STRE
BEDFORD STREET
FERRY ST
CANA
L STR
EET
STREET
NITE STREET
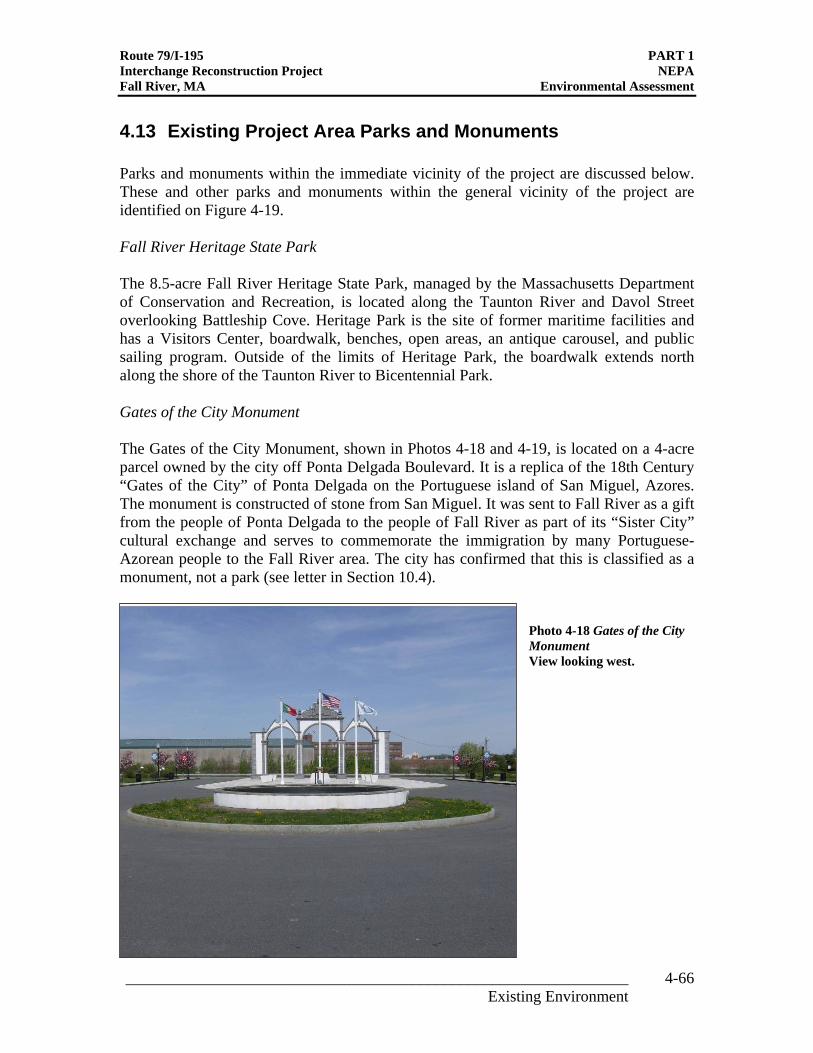
_______________________________________________________________
Photo 4-18 Gates of the City Monument View looking west.
Route 79/I-195 PART 1 Interchange Reconstruction Project NEPA Fall River, MA Environmental Assessment
4.13 Existing Project Area Parks and Monuments
Parks and monuments within the immediate vicinity of the project are discussed below. These and other parks and monuments within the general vicinity of the project are identified on Figure 4-19.
Fall River Heritage State Park
The 8.5-acre Fall River Heritage State Park, managed by the Massachusetts Department of Conservation and Recreation, is located along the Taunton River and Davol Street overlooking Battleship Cove. Heritage Park is the site of former maritime facilities and has a Visitors Center, boardwalk, benches, open areas, an antique carousel, and public sailing program. Outside of the limits of Heritage Park, the boardwalk extends north along the shore of the Taunton River to Bicentennial Park.
Gates of the City Monument
The Gates of the City Monument, shown in Photos 4-18 and 4-19, is located on a 4-acre parcel owned by the city off Ponta Delgada Boulevard. It is a replica of the 18th Century “Gates of the City” of Ponta Delgada on the Portuguese island of San Miguel, Azores. The monument is constructed of stone from San Miguel. It was sent to Fall River as a gift from the people of Ponta Delgada to the people of Fall River as part of its “Sister City” cultural exchange and serves to commemorate the immigration by many Portuguese-Azorean people to the Fall River area. The city has confirmed that this is classified as a monument, not a park (see letter in Section 10.4).
Existing Environment 4-66
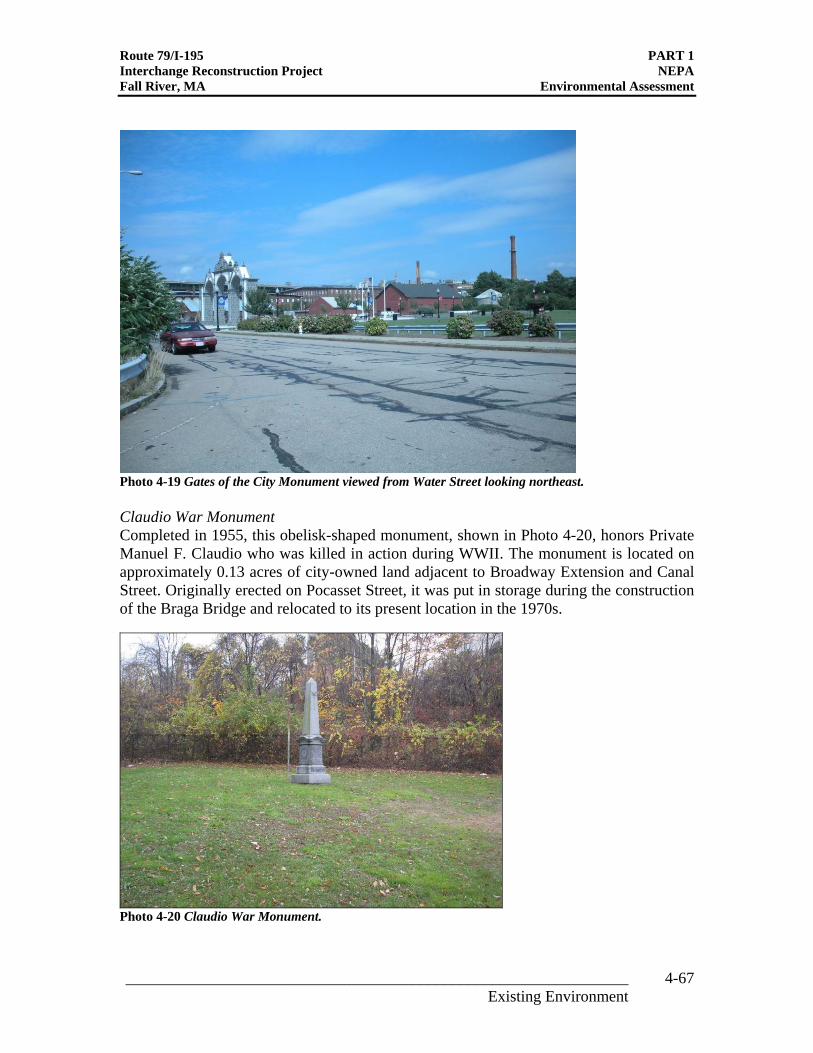
Photo 4-19 Gates of the City Monument viewed from Water Street looking northeast.
Photo 4-20 Claudio War Monument.
Route 79/I-195 PART 1 Interchange Reconstruction Project NEPA Fall River, MA Environmental Assessment
Claudio War Monument Completed in 1955, this obelisk-shaped monument, shown in Photo 4-20, honors Private Manuel F. Claudio who was killed in action during WWII. The monument is located on approximately 0.13 acres of city-owned land adjacent to Broadway Extension and Canal Street. Originally erected on Pocasset Street, it was put in storage during the construction of the Braga Bridge and relocated to its present location in the 1970s.
_______________________________________________________________ 4-67 Existing Environment

DURF
EEST
REET
NORT
H MAIN
STRE
ET
JUNE
STRE
ET
D AV O
L STR
EET
ROCK
STRE
ET
PINE STREET
HOPE STREET
WILLIAM STREET
COLUMBIA STREET
BANK STREET
WATER
STRE
E T
CHERRY STREET
LOCUST STREET
CENTRAL STREET
MAPLE STREET
DANF
ORTH
ST
SOUTHMAIN STREET
BARN
ABY STR
EET
BEDFORD STREET
SPRING STREET
ALMO
NDST
REET
PURC
HASE
STRE
ET
MILLIKEN BOULEVARD
BROADWAY EXTENSION FERRY STREET
EAGL
E STR
EET
MULB
ERRY
STR E
ET
CANA
L STR
EET
BROA
DWAY
POCASSET STREET
CLUB ST REET
HIGH S
TREE
T
PEAR
L ST TROY
STRE
ET
PEARCE STREET
FOUN
TAIN
STRE
ET
SECO
NDSTR
EET
PRESIDENT AVENUE
FOURTH
STREE
T
DYER
STREE
T
ELM STREET
DAVO
L STR
EET GR
E EN S
TRE E
T
DIVISION STREET
THI RD
STR EE
T N ORTH
PROSPECT STREET
HART WEL LSTREE T
CEDAR STREET
SCHO
OLST
REET
GRAN
T STR
EET
ANAWAN STREET
R ODMAN ST. IF FTHSTR
EET
MILL STREET
UNION
STRE
ET
INTERSTATE 195 WB CD ROAD
HATHAWAY STREET
FRENCH STREET
MAY S
TREE
T
TURNER STREET
BAY STREET
TAYLOR STREET
ODD STREET
POND
STRE
ET
CHAL
ONER
STRE
ET
BAYLIES STREET
GRANITE STREET ANAWAN STREET
TURNER STREET
Taun
ton Ri
ver
Quequechan River
6Source Data:Data compiled from the following source:Office of Geographic Information (MassGIS), Commonwealth Bicentennialof Massachusetts, Information Technology Division State Park Protected and Recreational OpenSpace: February 2010
Legend: Monuments Parks Quequechan River (in culvert)
Heritage ParkBoardwalk
Fall RiverHeritage State Park
TurnerPlayground
BattleshiMuseum
p Cove
Fall RiverHeritage State Park
Gates of theCity Monument
Manuel F. ClaudioMonument
138 79
195
P:\MH
D\2009
\E2X4
5204\6
00 Dis
cipline
Files
\607 G
is\EA-E
NF_F
igure
4-19_
Parks
.mxd
138
Parks and MonumentsRoute 79 / I-195Interchange Reconstruction Project
Approx. Scale: 1 " = 800 ' Fall River, MA Figure 4-19
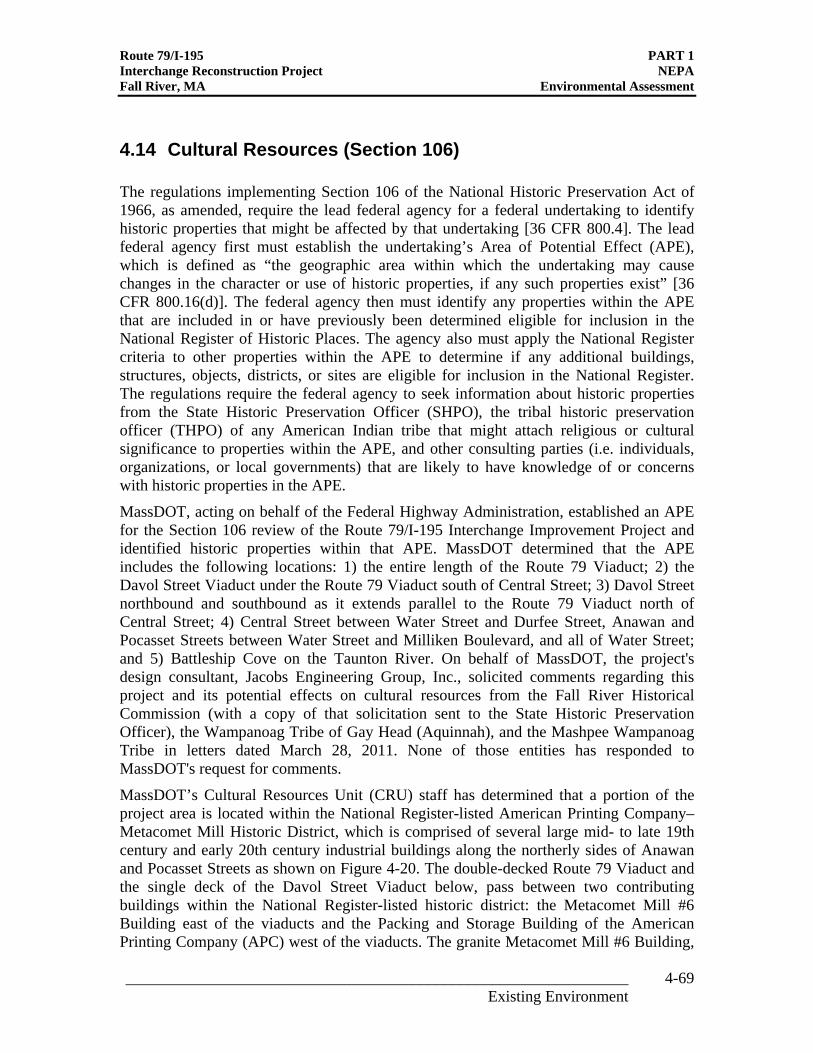
Route 79/I-195 PART 1 Interchange Reconstruction Project NEPA Fall River, MA Environmental Assessment
4.14 Cultural Resources (Section 106)
The regulations implementing Section 106 of the National Historic Preservation Act of 1966, as amended, require the lead federal agency for a federal undertaking to identify historic properties that might be affected by that undertaking [36 CFR 800.4]. The lead federal agency first must establish the undertaking’s Area of Potential Effect (APE), which is defined as “the geographic area within which the undertaking may cause changes in the character or use of historic properties, if any such properties exist” [36 CFR 800.16(d)]. The federal agency then must identify any properties within the APE that are included in or have previously been determined eligible for inclusion in the National Register of Historic Places. The agency also must apply the National Register criteria to other properties within the APE to determine if any additional buildings, structures, objects, districts, or sites are eligible for inclusion in the National Register. The regulations require the federal agency to seek information about historic properties from the State Historic Preservation Officer (SHPO), the tribal historic preservation officer (THPO) of any American Indian tribe that might attach religious or cultural significance to properties within the APE, and other consulting parties (i.e. individuals, organizations, or local governments) that are likely to have knowledge of or concerns with historic properties in the APE.
MassDOT, acting on behalf of the Federal Highway Administration, established an APE for the Section 106 review of the Route 79/I-195 Interchange Improvement Project and identified historic properties within that APE. MassDOT determined that the APE includes the following locations: 1) the entire length of the Route 79 Viaduct; 2) the Davol Street Viaduct under the Route 79 Viaduct south of Central Street; 3) Davol Street northbound and southbound as it extends parallel to the Route 79 Viaduct north of Central Street; 4) Central Street between Water Street and Durfee Street, Anawan and Pocasset Streets between Water Street and Milliken Boulevard, and all of Water Street; and 5) Battleship Cove on the Taunton River. On behalf of MassDOT, the project's design consultant, Jacobs Engineering Group, Inc., solicited comments regarding this project and its potential effects on cultural resources from the Fall River Historical Commission (with a copy of that solicitation sent to the State Historic Preservation Officer), the Wampanoag Tribe of Gay Head (Aquinnah), and the Mashpee Wampanoag Tribe in letters dated March 28, 2011. None of those entities has responded to MassDOT's request for comments.
MassDOT’s Cultural Resources Unit (CRU) staff has determined that a portion of the project area is located within the National Register-listed American Printing Company– Metacomet Mill Historic District, which is comprised of several large mid- to late 19th century and early 20th century industrial buildings along the northerly sides of Anawan and Pocasset Streets as shown on Figure 4-20. The double-decked Route 79 Viaduct and the single deck of the Davol Street Viaduct below, pass between two contributing buildings within the National Register-listed historic district: the Metacomet Mill #6 Building east of the viaducts and the Packing and Storage Building of the American Printing Company (APC) west of the viaducts. The granite Metacomet Mill #6 Building,
_______________________________________________________________ 4-69 Existing Environment
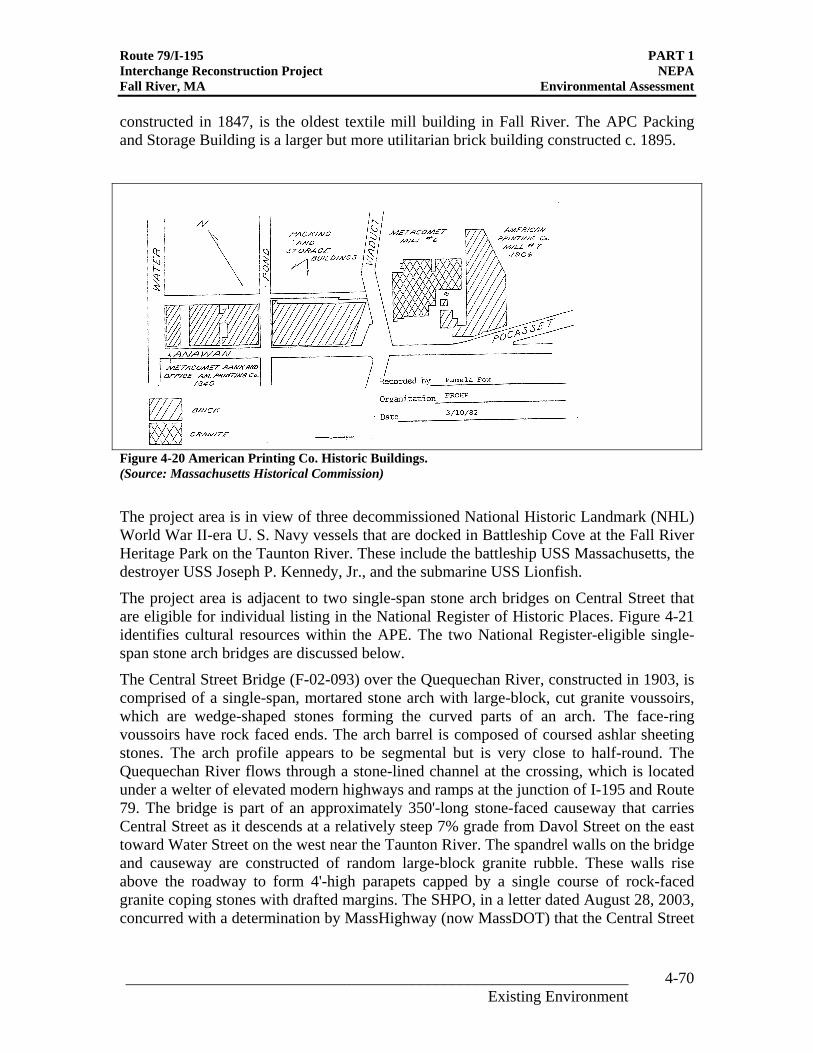
Figure 4-20 American Printing Co. Historic Buildings. (Source: Massachusetts Historical Commission)
Route 79/I-195 PART 1 Interchange Reconstruction Project NEPA Fall River, MA Environmental Assessment
constructed in 1847, is the oldest textile mill building in Fall River. The APC Packing and Storage Building is a larger but more utilitarian brick building constructed c. 1895.
The project area is in view of three decommissioned National Historic Landmark (NHL) World War II-era U. S. Navy vessels that are docked in Battleship Cove at the Fall River Heritage Park on the Taunton River. These include the battleship USS Massachusetts, the destroyer USS Joseph P. Kennedy, Jr., and the submarine USS Lionfish.
The project area is adjacent to two single-span stone arch bridges on Central Street that are eligible for individual listing in the National Register of Historic Places. Figure 4-21 identifies cultural resources within the APE. The two National Register-eligible single-span stone arch bridges are discussed below.
The Central Street Bridge (F-02-093) over the Quequechan River, constructed in 1903, is comprised of a single-span, mortared stone arch with large-block, cut granite voussoirs, which are wedge-shaped stones forming the curved parts of an arch. The face-ring voussoirs have rock faced ends. The arch barrel is composed of coursed ashlar sheeting stones. The arch profile appears to be segmental but is very close to half-round. The Quequechan River flows through a stone-lined channel at the crossing, which is located under a welter of elevated modern highways and ramps at the junction of I-195 and Route 79. The bridge is part of an approximately 350'-long stone-faced causeway that carries Central Street as it descends at a relatively steep 7% grade from Davol Street on the east toward Water Street on the west near the Taunton River. The spandrel walls on the bridge and causeway are constructed of random large-block granite rubble. These walls rise above the roadway to form 4'-high parapets capped by a single course of rock-faced granite coping stones with drafted margins. The SHPO, in a letter dated August 28, 2003, concurred with a determination by MassHighway (now MassDOT) that the Central Street
_______________________________________________________________ 4-70 Existing Environment
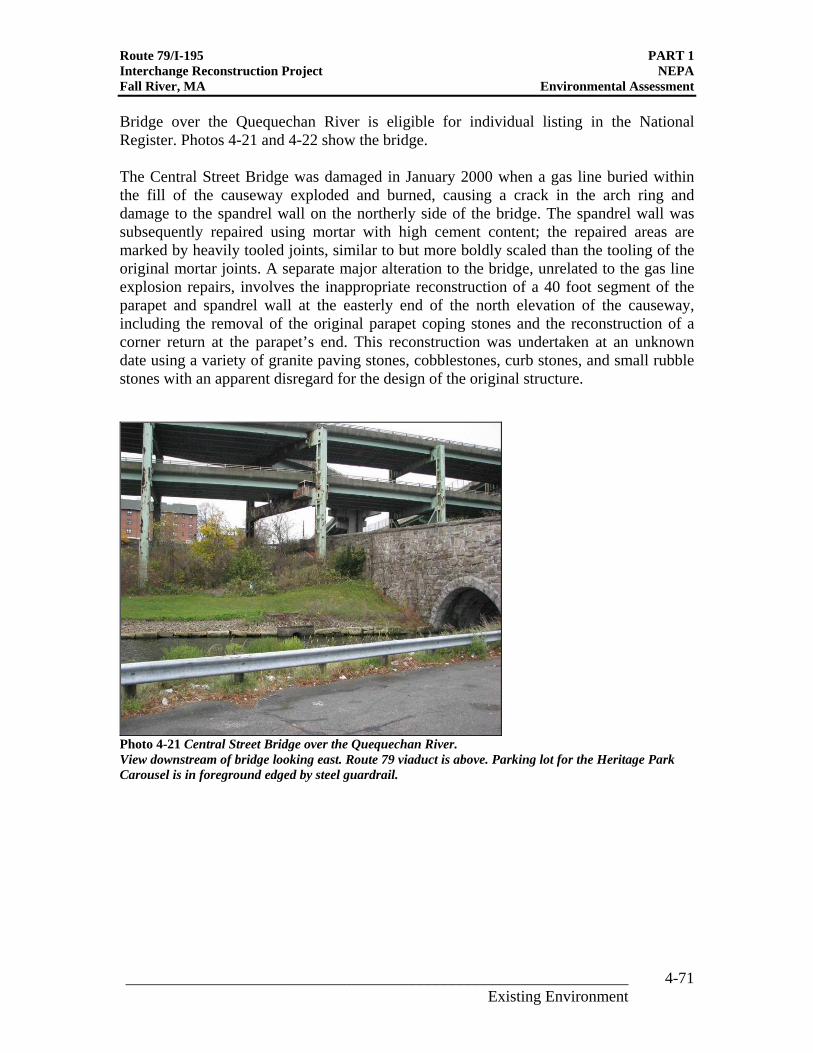
Photo 4-21 Central Street Bridge over the Quequechan River. View downstream of bridge looking east. Route 79 viaduct is above. Parking lot for the Heritage Park Carousel is in foreground edged by steel guardrail.
Route 79/I-195 PART 1 Interchange Reconstruction Project NEPA Fall River, MA Environmental Assessment
Bridge over the Quequechan River is eligible for individual listing in the National Register. Photos 4-21 and 4-22 show the bridge.
The Central Street Bridge was damaged in January 2000 when a gas line buried within the fill of the causeway exploded and burned, causing a crack in the arch ring and damage to the spandrel wall on the northerly side of the bridge. The spandrel wall was subsequently repaired using mortar with high cement content; the repaired areas are marked by heavily tooled joints, similar to but more boldly scaled than the tooling of the original mortar joints. A separate major alteration to the bridge, unrelated to the gas line explosion repairs, involves the inappropriate reconstruction of a 40 foot segment of the parapet and spandrel wall at the easterly end of the north elevation of the causeway, including the removal of the original parapet coping stones and the reconstruction of a corner return at the parapet’s end. This reconstruction was undertaken at an unknown date using a variety of granite paving stones, cobblestones, curb stones, and small rubble stones with an apparent disregard for the design of the original structure.
_______________________________________________________________ 4-71 Existing Environment
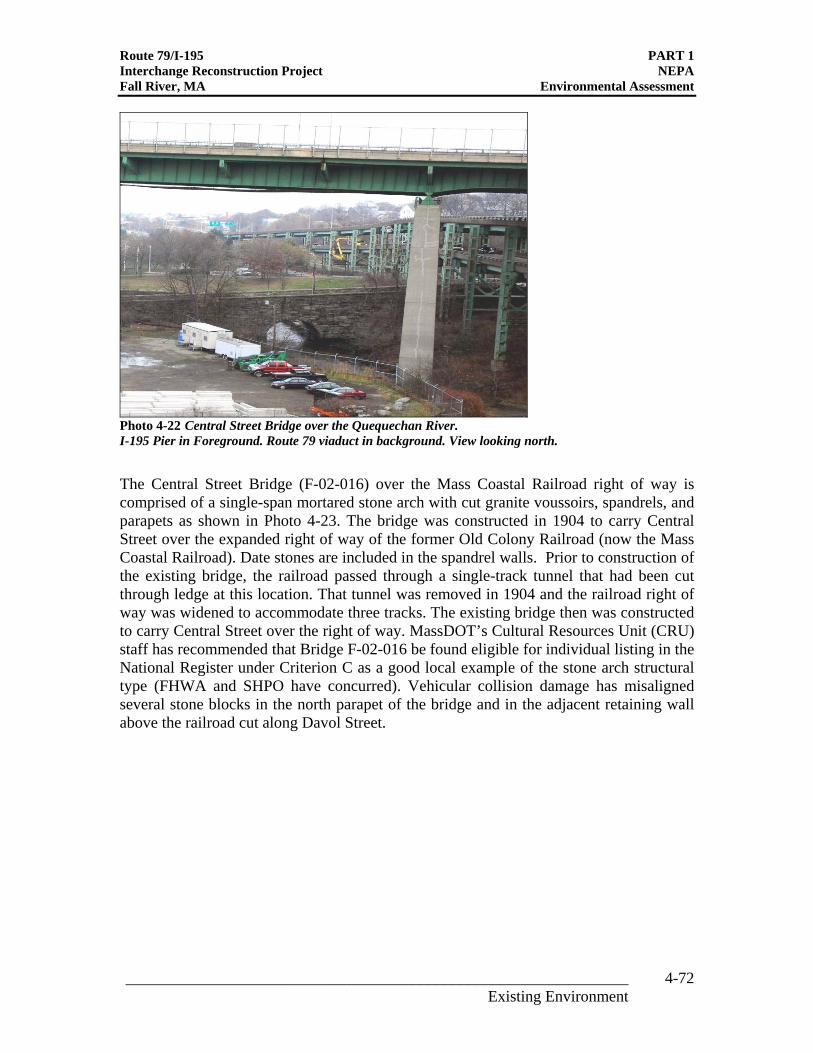
Photo 4-22 Central Street Bridge over the Quequechan River.
I-195 Pier in Foreground. Route 79 viaduct in background. View looking north.
Route 79/I-195 PART 1 Interchange Reconstruction Project NEPA Fall River, MA Environmental Assessment
The Central Street Bridge (F-02-016) over the Mass Coastal Railroad right of way is comprised of a single-span mortared stone arch with cut granite voussoirs, spandrels, and parapets as shown in Photo 4-23. The bridge was constructed in 1904 to carry Central Street over the expanded right of way of the former Old Colony Railroad (now the Mass Coastal Railroad). Date stones are included in the spandrel walls. Prior to construction of the existing bridge, the railroad passed through a single-track tunnel that had been cut through ledge at this location. That tunnel was removed in 1904 and the railroad right of way was widened to accommodate three tracks. The existing bridge then was constructed to carry Central Street over the right of way. MassDOT’s Cultural Resources Unit (CRU) staff has recommended that Bridge F-02-016 be found eligible for individual listing in the National Register under Criterion C as a good local example of the stone arch structural type (FHWA and SHPO have concurred). Vehicular collision damage has misaligned several stone blocks in the north parapet of the bridge and in the adjacent retaining wall above the railroad cut along Davol Street.
_______________________________________________________________ 4-72 Existing Environment
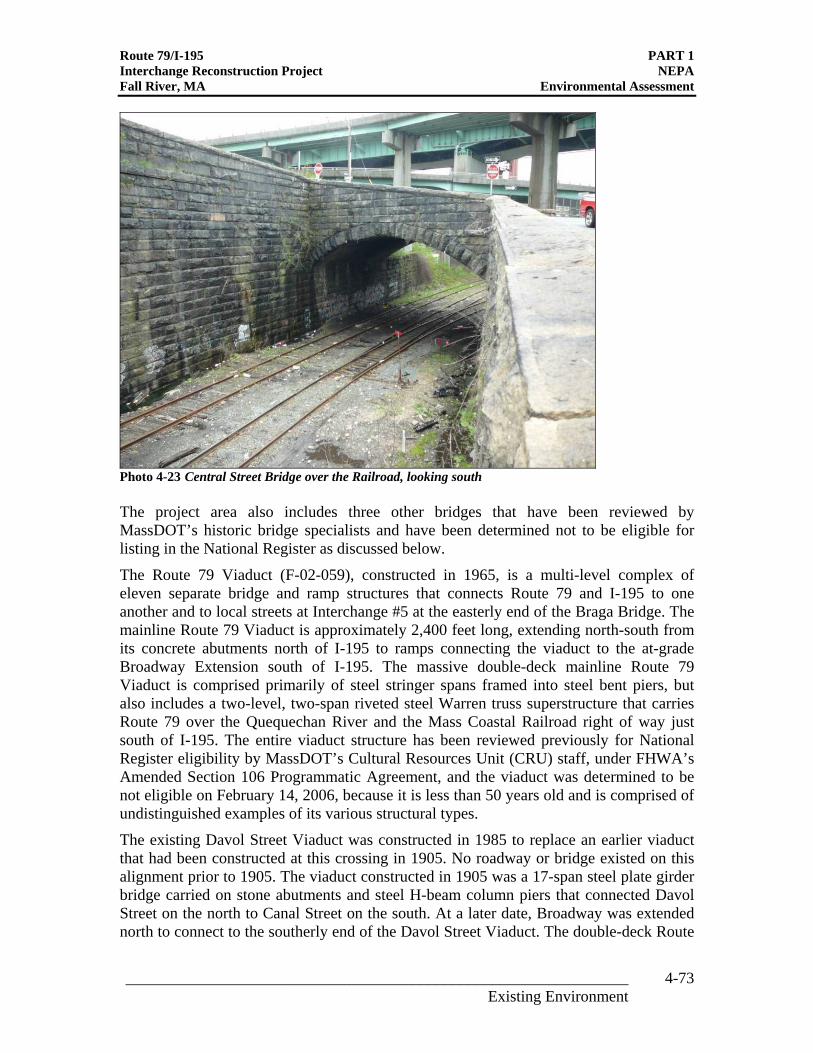
Photo 4-23 Central Street Bridge over the Railroad, looking south
Route 79/I-195 PART 1 Interchange Reconstruction Project NEPA Fall River, MA Environmental Assessment
The project area also includes three other bridges that have been reviewed by MassDOT’s historic bridge specialists and have been determined not to be eligible for listing in the National Register as discussed below.
The Route 79 Viaduct (F-02-059), constructed in 1965, is a multi-level complex of eleven separate bridge and ramp structures that connects Route 79 and I-195 to one another and to local streets at Interchange #5 at the easterly end of the Braga Bridge. The mainline Route 79 Viaduct is approximately 2,400 feet long, extending north-south from its concrete abutments north of I-195 to ramps connecting the viaduct to the at-grade Broadway Extension south of I-195. The massive double-deck mainline Route 79 Viaduct is comprised primarily of steel stringer spans framed into steel bent piers, but also includes a two-level, two-span riveted steel Warren truss superstructure that carries Route 79 over the Quequechan River and the Mass Coastal Railroad right of way just south of I-195. The entire viaduct structure has been reviewed previously for National Register eligibility by MassDOT’s Cultural Resources Unit (CRU) staff, under FHWA’s Amended Section 106 Programmatic Agreement, and the viaduct was determined to be not eligible on February 14, 2006, because it is less than 50 years old and is comprised of undistinguished examples of its various structural types.
The existing Davol Street Viaduct was constructed in 1985 to replace an earlier viaduct that had been constructed at this crossing in 1905. No roadway or bridge existed on this alignment prior to 1905. The viaduct constructed in 1905 was a 17-span steel plate girder bridge carried on stone abutments and steel H-beam column piers that connected Davol Street on the north to Canal Street on the south. At a later date, Broadway was extended north to connect to the southerly end of the Davol Street Viaduct. The double-deck Route
_______________________________________________________________ 4-73 Existing Environment
Route 79/I-195 PART 1 Interchange Reconstruction Project NEPA Fall River, MA Environmental Assessment
79 Viaduct was constructed in 1965 on a similar alignment directly above the Davol Street Viaduct. The Massachusetts State Historic Preservation Officer, in a letter dated August 30, 1984, concurred with the finding of the Massachusetts Department of Public Works (now MassDOT) that the 1905 Davol Street Viaduct was an undistinguished example of a common structural type and was not eligible for individual listing in the National Register of Historic Places.
The existing Davol Street Viaduct is comprised of a 12-span steel stringer superstructure carried on the cut granite abutments and three steel H-beam column piers from the earlier viaduct, supplemented by eight reinforced concrete piers constructed in 1985. MassDOT’s Cultural Resources Unit (CRU) staff has recommended that the 1985 viaduct be found not eligible for individual listing in the National Register based on its recent date of construction and common structural type (FHWA and SHPO have concurred).
Bridge F-02-013, which carries Anawan Street over the Mass Coastal Railroad right of way, was constructed in 1977. The bridge is comprised of a single-span, voided concrete deck beam superstructure carried on earlier stone abutments with concrete bridge seats. The stone abutments are part of the massive cut granite retaining walls along the railroad right of way. The present bridge replaced a 1904 single-span metal pony truss, which is shown at this crossing on the 1905 Sanborn Fire Insurance Company map. MassDOT’s Cultural Resources Unit (CRU) staff has recommended that Bridge F-02-013 be found not eligible for listing in the National Register because it is less than 50 years old and is an undistinguished example of this common structural type (FHWA and SHPO have concurred).
The project area also is adjacent to two previously un-inventoried late 19th century/early 20th century industrial complexes on Anawan Street: the Fall River Gas Works and the Borden & Remington Co. Each of these properties holds some apparent historical interest. MassDOT’s Cultural Resources Unit staff has prepared Massachusetts Historical Commission (MHC) inventory forms for both properties and has submitted those forms to the SHPO.
The Fall River Gas Works Area is comprised of four buildings located on a two acre parcel bounded by Anawan Street on the north, Water Street on the west, Pond Street and the Mass Coastal Railroad right of way on the east, and municipal property containing the c. 2008 Gates of the City Monument on the south. The four buildings include an Office/Storage Building, an Engine Room Building, a Coal House, and a round, reinforced concrete Fuel Storage Tank Building along the railroad right of way, shown in Photo 4-24. The inventoried area is associated with the Fall River Gas Works from the 1880s through the 1920s when that company was involved in the production of coal gas at this location. One of the buildings, the Coal House, may date to the 1870s, when the Fall River Iron Works also appears to have manufactured coal gas at this location. The buildings' functions have been determined by examining Sanborn Fire Insurance maps from 1888, 1893, 1905, and 1933. The area also includes three infill buildings that appear to have been constructed during the second half of the 20th century when the site was operated by the Fall River Gas Co., which was a natural gas distribution company rather than a coal gas production company.
_______________________________________________________________ 4-74 Existing Environment
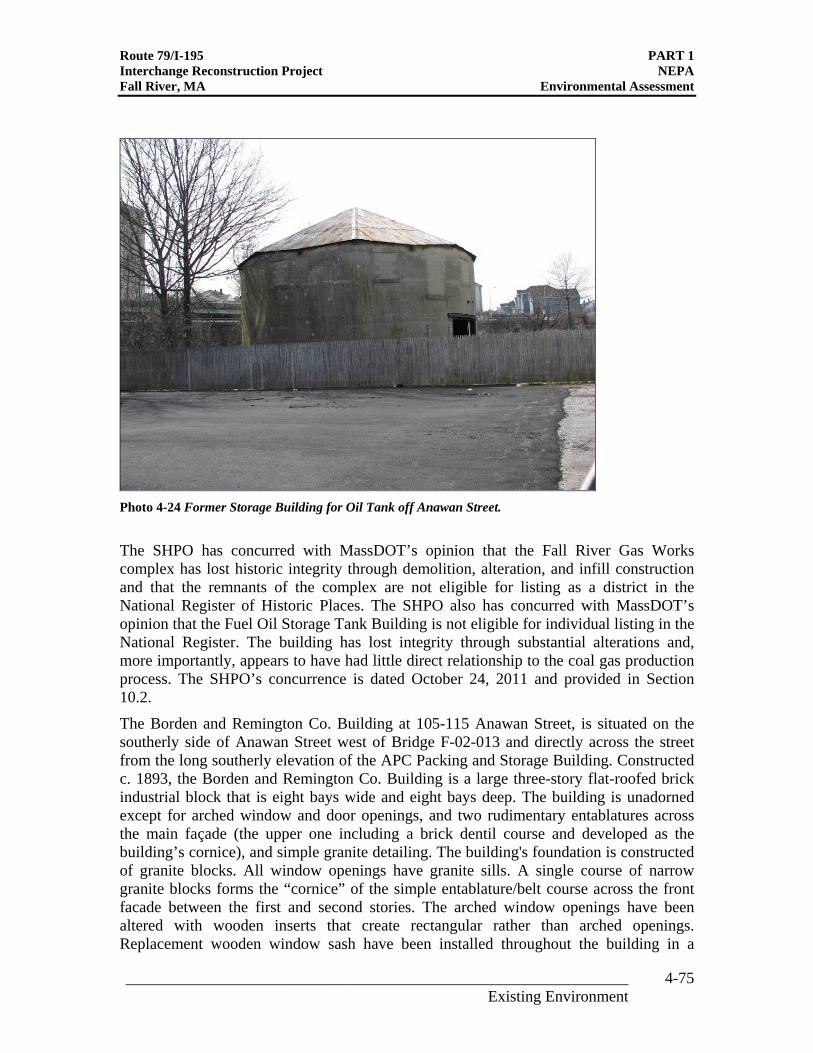
Photo 4-24 Former Storage Building for Oil Tank off Anawan Street.
Route 79/I-195 PART 1 Interchange Reconstruction Project NEPA Fall River, MA Environmental Assessment
The SHPO has concurred with MassDOT’s opinion that the Fall River Gas Works complex has lost historic integrity through demolition, alteration, and infill construction and that the remnants of the complex are not eligible for listing as a district in the National Register of Historic Places. The SHPO also has concurred with MassDOT’s opinion that the Fuel Oil Storage Tank Building is not eligible for individual listing in the National Register. The building has lost integrity through substantial alterations and, more importantly, appears to have had little direct relationship to the coal gas production process. The SHPO’s concurrence is dated October 24, 2011 and provided in Section 10.2.
The Borden and Remington Co. Building at 105-115 Anawan Street, is situated on the southerly side of Anawan Street west of Bridge F-02-013 and directly across the street from the long southerly elevation of the APC Packing and Storage Building. Constructed c. 1893, the Borden and Remington Co. Building is a large three-story flat-roofed brick industrial block that is eight bays wide and eight bays deep. The building is unadorned except for arched window and door openings, and two rudimentary entablatures across the main façade (the upper one including a brick dentil course and developed as the building’s cornice), and simple granite detailing. The building's foundation is constructed of granite blocks. All window openings have granite sills. A single course of narrow granite blocks forms the “cornice” of the simple entablature/belt course across the front facade between the first and second stories. The arched window openings have been altered with wooden inserts that create rectangular rather than arched openings. Replacement wooden window sash have been installed throughout the building in a
_______________________________________________________________ 4-75 Existing Environment
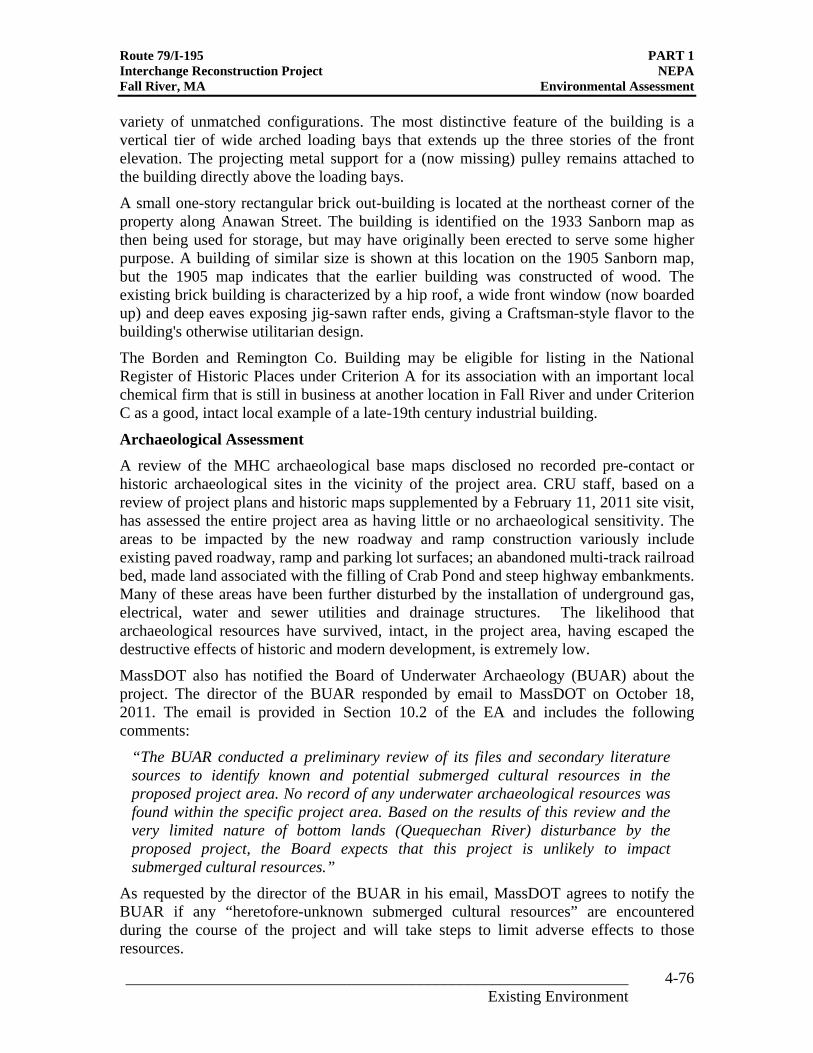
Route 79/I-195 PART 1 Interchange Reconstruction Project NEPA Fall River, MA Environmental Assessment
variety of unmatched configurations. The most distinctive feature of the building is a vertical tier of wide arched loading bays that extends up the three stories of the front elevation. The projecting metal support for a (now missing) pulley remains attached to the building directly above the loading bays.
A small one-story rectangular brick out-building is located at the northeast corner of the property along Anawan Street. The building is identified on the 1933 Sanborn map as then being used for storage, but may have originally been erected to serve some higher purpose. A building of similar size is shown at this location on the 1905 Sanborn map, but the 1905 map indicates that the earlier building was constructed of wood. The existing brick building is characterized by a hip roof, a wide front window (now boarded up) and deep eaves exposing jig-sawn rafter ends, giving a Craftsman-style flavor to the building's otherwise utilitarian design.
The Borden and Remington Co. Building may be eligible for listing in the National Register of Historic Places under Criterion A for its association with an important local chemical firm that is still in business at another location in Fall River and under Criterion C as a good, intact local example of a late-19th century industrial building.
Archaeological Assessment A review of the MHC archaeological base maps disclosed no recorded pre-contact or historic archaeological sites in the vicinity of the project area. CRU staff, based on a review of project plans and historic maps supplemented by a February 11, 2011 site visit, has assessed the entire project area as having little or no archaeological sensitivity. The areas to be impacted by the new roadway and ramp construction variously include existing paved roadway, ramp and parking lot surfaces; an abandoned multi-track railroad bed, made land associated with the filling of Crab Pond and steep highway embankments. Many of these areas have been further disturbed by the installation of underground gas, electrical, water and sewer utilities and drainage structures. The likelihood that archaeological resources have survived, intact, in the project area, having escaped the destructive effects of historic and modern development, is extremely low.
MassDOT also has notified the Board of Underwater Archaeology (BUAR) about the project. The director of the BUAR responded by email to MassDOT on October 18, 2011. The email is provided in Section 10.2 of the EA and includes the following comments:
“The BUAR conducted a preliminary review of its files and secondary literature sources to identify known and potential submerged cultural resources in the proposed project area. No record of any underwater archaeological resources was found within the specific project area. Based on the results of this review and the very limited nature of bottom lands (Quequechan River) disturbance by the proposed project, the Board expects that this project is unlikely to impact submerged cultural resources.”
As requested by the director of the BUAR in his email, MassDOT agrees to notify the BUAR if any “heretofore-unknown submerged cultural resources” are encountered during the course of the project and will take steps to limit adverse effects to those resources.
_______________________________________________________________ 4-76 Existing Environment
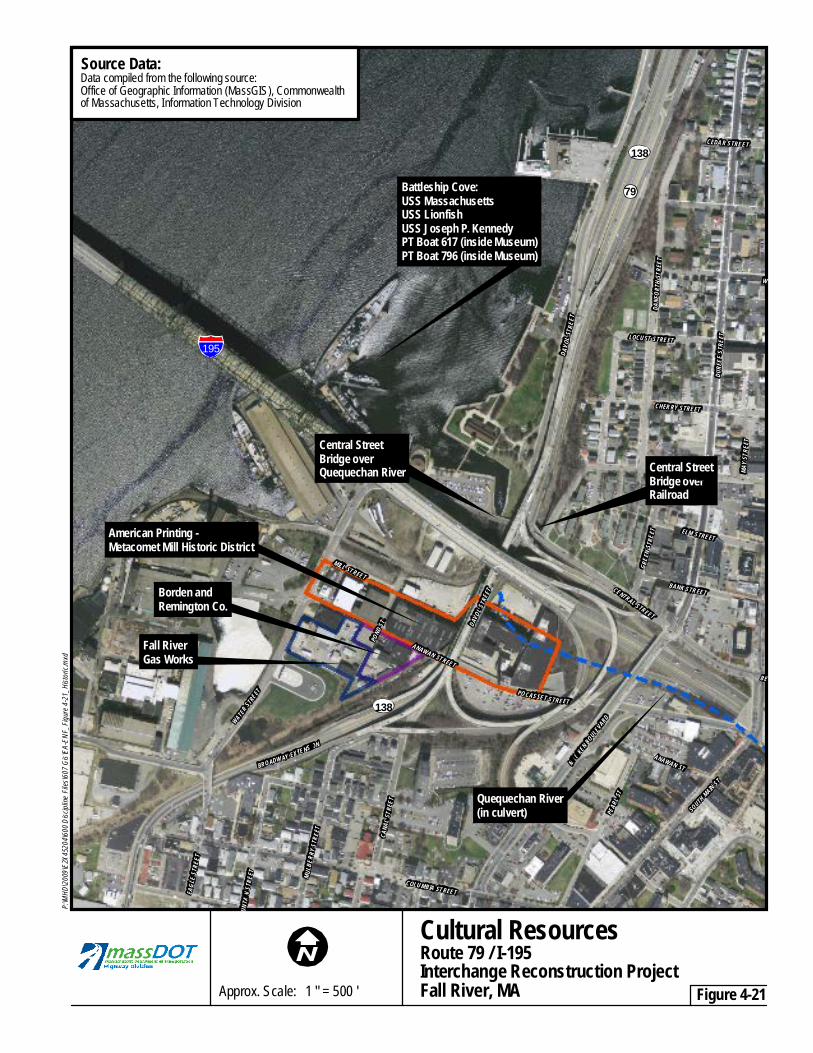
ALNUT STREET
FORD STREET
PRING STREET
FERRY STREET
BROA
DWA F
FOURTH
STREE
T
GRAN
T STR
EET
RODMAN ST.
ODD STREET
TH MA
IN ST
REET
PINE STREET
D
S
Y
O
Battleship Cove:USS MassachusettsUSS LionfishUSS Joseph P. KennedyPT Boat 617 (inside Museum)PT Boat 796 (inside Museum)
Central StreetBridge overQuequechan River
Borden andRemington Co.
Fall RiverGas Works
American Printing -Metacomet Mill Historic District
Central StreetBridge overRailroad
P:\MH
D\2009
\E2X4
5204\6
00 Dis
cipline
Files
\607 G
is\EA-E
NF_F
igure
4-21_
Histor
ic.mxd
DURF
EEST
REET
NOR
D AV O
L ST R
EET
COLUMBIA STREET
BANK STREET
WATERSTRE
ET
CHERRY STREET
LOCUST STREET
CENTRAL STREET
DANF
ORTH
STRE
ET
W
SOUTHMAIN ST
BE
MILLIKEN BOULEVARD
BROADW AY EXTENSION
EAGL
E STR
EET
M ULB
ERRY
STR E
ET
CANA
L STR
EET
POCASSET STREET
PEAR
L ST
UNTA
INST
REET
ELM STREET
DAVO
L STR
EET
GRE E
N STR
E ET
CEDAR STREET
ANAWAN ST
MILL STREET
MAY S
TREE
T
POND
ST.
ANAWAN STREET
195
79
138
138
Source Data:Data compiled from the following source:Office of Geographic Information (MassGIS), Commonwealthof Massachusetts, Information Technology Division
Quequechan River(in culvert)
Route 79 / I-195Interchange Reconstruction Project
Approx. Scale: 1 " = 500 ' Fall River, MA -Figure 4 21
Cultural Resources
Route 79/I-195 PART 1 Interchange Reconstruction Project NEPA Fall River, MA Environmental Assessment
4.15 Socio-Economic
4.15.1 Introduction
This section provides a demographic profile of Fall River, using several factors including population, households, employment, and income. This section discusses key population, business and employment characteristics and trends affecting economic development potential in the project area and the city. The geographic area included in the project area for the socio-economic discussion extends from the Taunton River on the east to Milliken Boulevard on the west and from Cedar Street on the north to Ferry Street on the south. These streets are identified on Figure 1-2 in Section 1. Information was obtained from the US Census Bureau, SRPEDD, and Claritas Site Reports. The 2000 and estimated 2009 census data is the information currently available. Estimates for 2009 population, households, businesses and jobs within the project area are based on information obtained from Claritas Site Reports, a data base that uses baseline US population and economic census data as well as private data sources and proprietary software to produce annually updated estimates of demographic and economic characteristics within any specified geographic area. Claritas Reports provide estimates of demographic and economic characteristics within small geographic areas, such as the project area. It is widely used by professional analysts for transportation, economic development, real estate, and marketing research. Tables 4-9 and 4-10 summarize the information discussed below 4.15.2 Population
The 2000 U.S. Census reported a population of 91,938 residents in the City of Fall River, with 1,901 residents in the project area. In 2009, the estimated population of Fall River was 90,885, with 1,798 residents in the project area, representing an estimated decline of 1.2% and 5.4% respectively since 2000. Statewide, Massachusetts experienced a modest growth rate of 1.7 % from 2000 to 2009, and the population is projected to grow 0.98 % to 6,522,101 residents by 2014. SRPEDD has projected an increase in the city’s population to 99,831 by 2030.
Table 4-9 Population Trends 2000-2014 2000 2009 2014
Projection Change
2009-2014Fall River 91,938 90,885 89,830 -0.80%1
Bristol County
534,678 542,968 547,043 0.75%
Massachusetts 6,349,097 6,459,022 6,522,101 0.98% Source: US Census, Claritas Site Reports.
In 2009, the average age of the population in Fall River was 37.6 years overall with an average of 39.7 years in the project area, similar to the statewide average of 36 years. The project area has a larger percentage of residents aged 65 and older (19.4%) compared to the city-wide average (17.7%), as well as residents under 18 years old (25%) compared to city-wide (22.6%). The city’s racial composition was reported as 86.4% white, 4.1%
_______________________________________________________________ 4-78 Existing Environment
Route 79/I-195 PART 1 Interchange Reconstruction Project NEPA Fall River, MA Environmental Assessment
black, and 6% of Hispanic or Latino origin in 2009. Residents in the project area were 76% white, 10% black, and 15.2% of Hispanic or Latino origin.
4.15.3 Households
In 2000, there were 38,759 households in Fall River, increasing to 38,988 in 2009. Projections estimate a further modest increase to 38,996 in 2014. The project area reported 958 households in 2000, with an estimated 913 households in 2009, and the number of households is projected to total 934 household by 2014. Project area households are slightly smaller (1.96 people per household) than the city-wide average of 2.30 people per household.
There were an average of 1.2 vehicles per Fall River household in 2009, and 0.8 vehicles per household in the project area in 2009. More than one-third of project area households are transit-dependent (34.8% have no vehicle), compared to 20.4% of all city households. The vast majority (88%) of housing units in the project area were renter occupied in 2009 compared with 65% in the City of Fall River. The median value of owner-occupied housing in the project area ($176,200) was about 70% that of all owner-occupied housing in the city ($249,728). Almost half (46.5%) of the project area households live in apartment buildings compared to less than 10% of households in the city overall. One large residential development in the area is the Heritage Heights city-owned housing development that is located on Central Street between Milliken Boulevard and Davol Street.
_______________________________________________________________ 4-79 Existing Environment
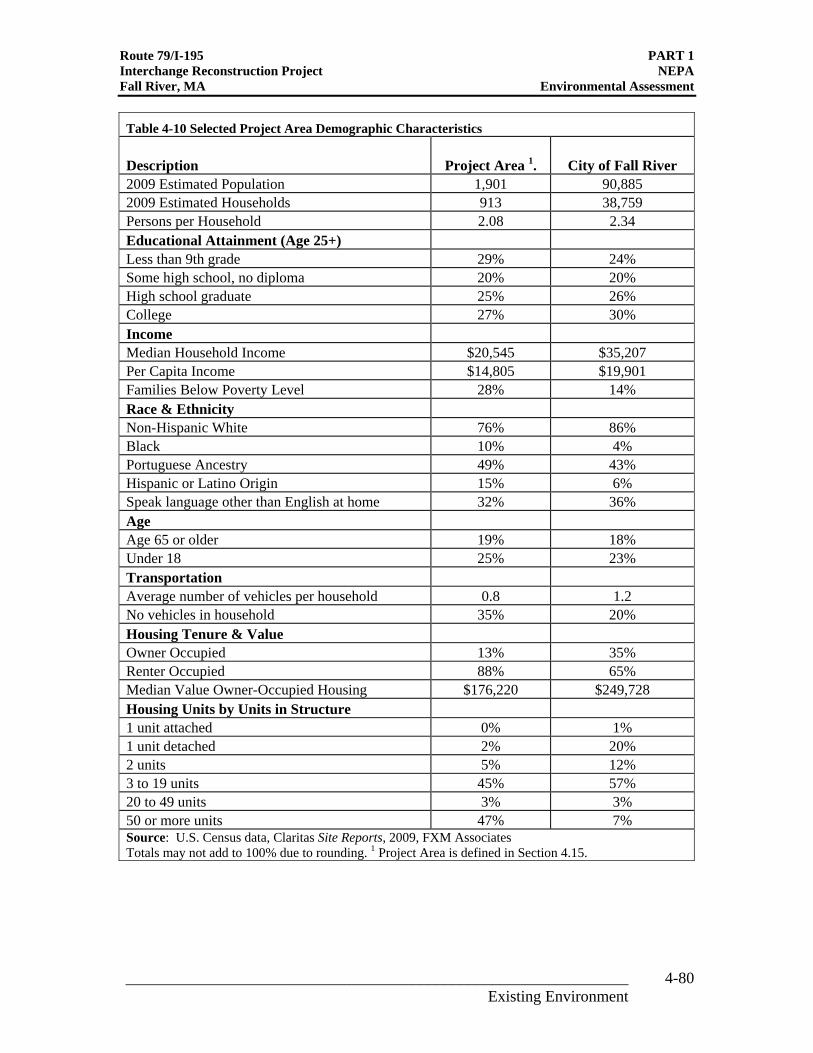
Route 79/I-195 PART 1 Interchange Reconstruction Project NEPA Fall River, MA Environmental Assessment
Table 4-10 Selected Project Area Demographic Characteristics
Description Project Area 1 . City of Fall River 2009 Estimated Population 1,901 90,885 2009 Estimated Households 913 38,759 Persons per Household 2.08 2.34 Educational Attainment (Age 25+) Less than 9th grade 29% 24% Some high school, no diploma 20% 20% High school graduate 25% 26% College 27% 30% Income Median Household Income $20,545 $35,207 Per Capita Income $14,805 $19,901 Families Below Poverty Level 28% 14% Race & Ethnicity Non-Hispanic White 76% 86% Black 10% 4% Portuguese Ancestry 49% 43% Hispanic or Latino Origin 15% 6% Speak language other than English at home 32% 36% Age Age 65 or older 19% 18% Under 18 25% 23% Transportation Average number of vehicles per household 0.8 1.2 No vehicles in household 35% 20% Housing Tenure & Value Owner Occupied 13% 35% Renter Occupied 88% 65% Median Value Owner-Occupied Housing $176,220 $249,728 Housing Units by Units in Structure 1 unit attached 0% 1% 1 unit detached 2% 20% 2 units 5% 12% 3 to 19 units 45% 57% 20 to 49 units 3% 3% 50 or more units 47% 7% Source: U.S. Census data, Claritas Site Reports, 2009, FXM Associates Totals may not add to 100% due to rounding. 1 Project Area is defined in Section 4.15.
_______________________________________________________________ 4-80 Existing Environment
Route 79/I-195 PART 1 Interchange Reconstruction Project NEPA Fall River, MA Environmental Assessment
4.15.4 Income and Education
In 2009, per capita household incomes in Fall River ($35,200), and the project area ($14,805) were significantly lower than the statewide average ($63,400). The Fall River per capita income was only 55% of the state average, and 27.7% of project area family households had incomes below the poverty level compared to 14% in the city overall. The city’s median household income was approximately 39% of statewide median household income and the project area median household income was 33% of the statewide median household income.
Nearly half (48%) of project area residents aged 25+ have not attained a high school level education compared to 43% in the city overall, and 15.4% statewide. Slightly more than one-quarter of project area residents had less than a 9th grade education (28.5%), compared to 23.9% at this level in the city overall. In the project area, 7.7% of residents had earned a bachelor’s degree or higher, compared to 10.6% in the city and 40% in Massachusetts.
4.15.5 Employment
In the midst of the national recession in 2009, the City of Fall River had an unemployment rate of over 14% compared to the statewide rate of 9.2% unemployment.
As shown in Table 4-11, the major sectors of employment in Fall River were Manufacturing, Health Care and Social Services, and Retail Trade. Since 2001, Manufacturing and Retail Trade sectors declined by approximately 60% and 10% respectively, and the Health Care sector grew by 10%. There were an estimated 132 business establishments within the project area which employed more than 900 workers, and generated approximately $119 million in 2009 business sales. The project area accounted for about 2% of total jobs and 3% of total business sales in the City of Fall River. The estimated 21 manufacturers within the project area comprise 11% of all manufacturing establishments in Fall River overall and most are small businesses compared to city-wide averages in the manufacturing sector. Relative to all business types, retail was the smallest industry sector represented in the project area, accounting for less than 1% of city-wide retail jobs and business sales. Insurance companies were the leading generator of business sales with 25% of all project area sales, representing 27% of overall Fall River insurance industry sales.
_______________________________________________________________ 4-81 Existing Environment
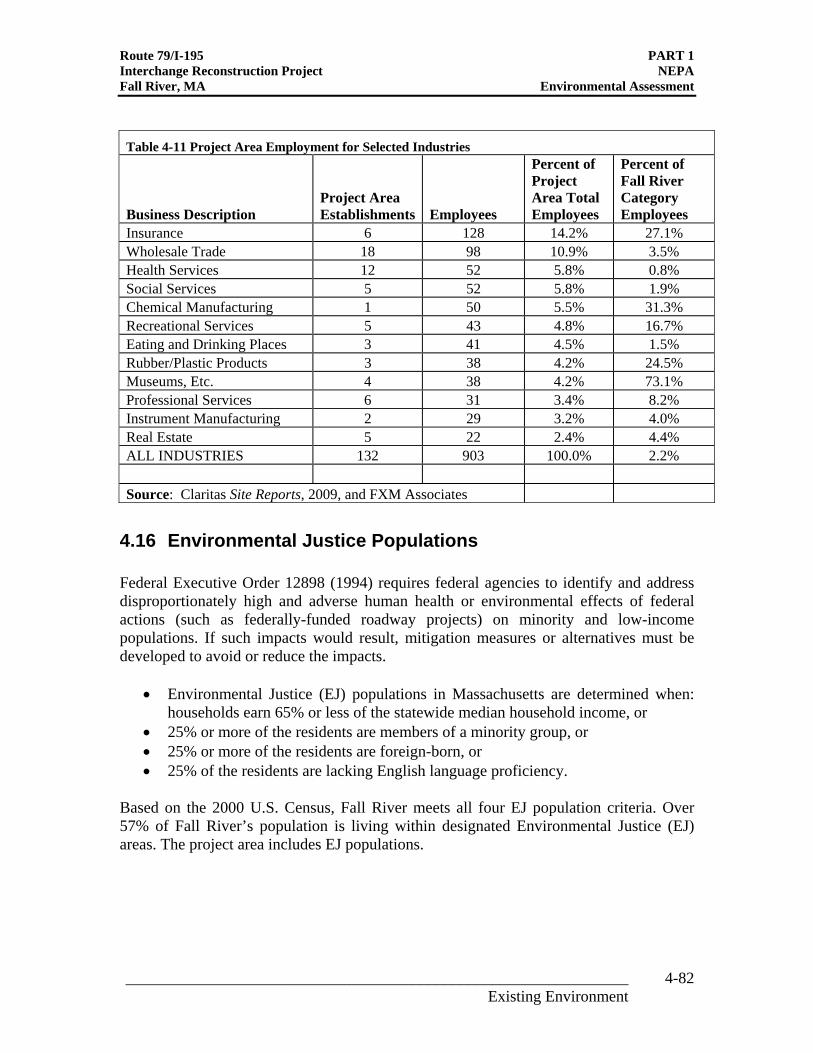
Route 79/I-195 PART 1 Interchange Reconstruction Project NEPA Fall River, MA Environmental Assessment
Table 4-11 Project Area Employment for Selected Industries
Business Description Project Area Establishments Employees
Percent of Project Area Total Employees
Percent of Fall River Category Employees
Insurance 6 128 14.2% 27.1% Wholesale Trade 18 98 10.9% 3.5% Health Services 12 52 5.8% 0.8% Social Services 5 52 5.8% 1.9% Chemical Manufacturing 1 50 5.5% 31.3% Recreational Services 5 43 4.8% 16.7% Eating and Drinking Places 3 41 4.5% 1.5% Rubber/Plastic Products 3 38 4.2% 24.5% Museums, Etc. 4 38 4.2% 73.1% Professional Services 6 31 3.4% 8.2% Instrument Manufacturing 2 29 3.2% 4.0% Real Estate 5 22 2.4% 4.4% ALL INDUSTRIES 132 903 100.0% 2.2%
Source: Claritas Site Reports, 2009, and FXM Associates
4.16 Environmental Justice Populations
Federal Executive Order 12898 (1994) requires federal agencies to identify and address disproportionately high and adverse human health or environmental effects of federal actions (such as federally-funded roadway projects) on minority and low-income populations. If such impacts would result, mitigation measures or alternatives must be developed to avoid or reduce the impacts.
• Environmental Justice (EJ) populations in Massachusetts are determined when: households earn 65% or less of the statewide median household income, or
• 25% or more of the residents are members of a minority group, or • 25% or more of the residents are foreign-born, or • 25% of the residents are lacking English language proficiency.
Based on the 2000 U.S. Census, Fall River meets all four EJ population criteria. Over 57% of Fall River’s population is living within designated Environmental Justice (EJ) areas. The project area includes EJ populations.
_______________________________________________________________ 4-82 Existing Environment
Route 79/I-195 PART 1 Interchange Reconstruction Project NEPA Fall River, MA Environmental Assessment
4.17 Oil and Hazardous Materials (OHM)
The project area includes residential, commercial and industrial properties and has a long history of industrial and transportation land use. Given the current and historical land use, contaminated soils or groundwater may be encountered during construction and/or demolition. The project area has been reviewed for the presence of oil and hazardous material (OHM) in the environment that could be encountered during construction. Historical industrial operations and waste generation/disposal practices were considered and searches were done of environmental databases maintained by Federal and State Environmental Agencies for records of industrial and transportation related spills and releases of OHM. The project does not involve work within or adjacent to any known Superfund site. However, several sites adjacent to the interchange are listed on various databases maintained by the U.S. Environmental Protection Agency and MassDEP. Remedial action has been completed on many of these sites.
A review of documented spills, releases and Federal and State listed hazardous waste sites was completed to determine potential impacts to design and construction phases of the project. A search of environmental information maintained within 47 Federal, 15 State and Local, and 5 Tribal databases, as well as propriety databases, was carried out to identify records indicating where historic releases of Oil and/or Hazardous Material (OHM) has occurred.
Two separate electronic records searches were conducted. One search included records for locations within a one mile radius of the project. To further refine the search and separate out site data, a second search considered only records within the more immediate project area. Over 300 records were identified. These records were reviewed and various types of records were selected to characterize the area. As a result, 11 “sites of interest” that have the potential to impact the project during construction were identified. These records include:
• Emergency Response Notification System (ERNS) • DEP Listed Sites (SHWS) • Leaking Underground Storage Tanks (LUST) • Underground Storage Tanks (UST) • Leaking Above Ground Storage Tank (LAST) • Above ground Storage Tank (AST) • DEP MA Release Tracking (RELEASE) • Spills Reported to MassDEP (SPILLS) • Manufactured Gas Plants (EDR Proprietary Record)
DEP Listed Sites (SHWS) can have a Response Action Outcome (RAO) which is a site/release where an RAO Statement was submitted. An RAO Statement asserts that response actions were sufficient to achieve a level of no significant risk or at least ensure that all substantial hazards were eliminated. The classes of Remedial Action Outcome Statement that can be submitted include:
_______________________________________________________________ 4-83 Existing Environment
Route 79/I-195 PART 1 Interchange Reconstruction Project NEPA Fall River, MA Environmental Assessment
Class A RAO- Remedial work was completed and a level of "no significant risk" has been achieved.
A1: A permanent solution has been achieved. Contamination has been reduced to background or a threat of release has been eliminated. A2: A permanent solution has been achieved. Contamination has not been reduced to background. A3: A permanent solution has been achieved. Contamination has not been reduced to background and an Activity and Use Limitation (AUL) has been implemented. A4: A permanent solution has been achieved. Contamination has not been reduced to background and an Activity and Use Limitation (AUL) has been implemented. Contamination is located at a depth of >15 feet but evaluation has determined that it is not feasible to reduce it.
Class B RAO- Site assessment indicates that "no significant risk" exists. No remedial work was necessary. B1: Remedial actions have not been conducted because a level of No Significant Risk exists.
B2: Remedial actions have not been conducted because a level of No Significant Risk exists, but that level is contingent upon one or more Activity and Use Limitations (AULs) that have been implemented. B3: Remedial actions have not been conducted because a level of No Significant Risk exists, but that level is contingent upon one or more Activity and Use Limitations (AULs) that have been implemented, and contamination is located at a depth of >15 feet but evaluation has determined that it is not feasible to reduce it.
Class C RAO- A temporary cleanup. Although the site does not present a "substantial hazard", it has not reached a level of no significant risk. The site must be evaluated every five years to determine whether a Class A or Class B RAO is possible. All sites are expected eventually to receive a Class A or B RAO.
Table 4-12 lists records of the 11 sites. Figure 4-22 identifies the selected sites of interest within the project area. The complete reports for both searches are provided in Appendix 3.
_______________________________________________________________ 4-84 Existing Environment
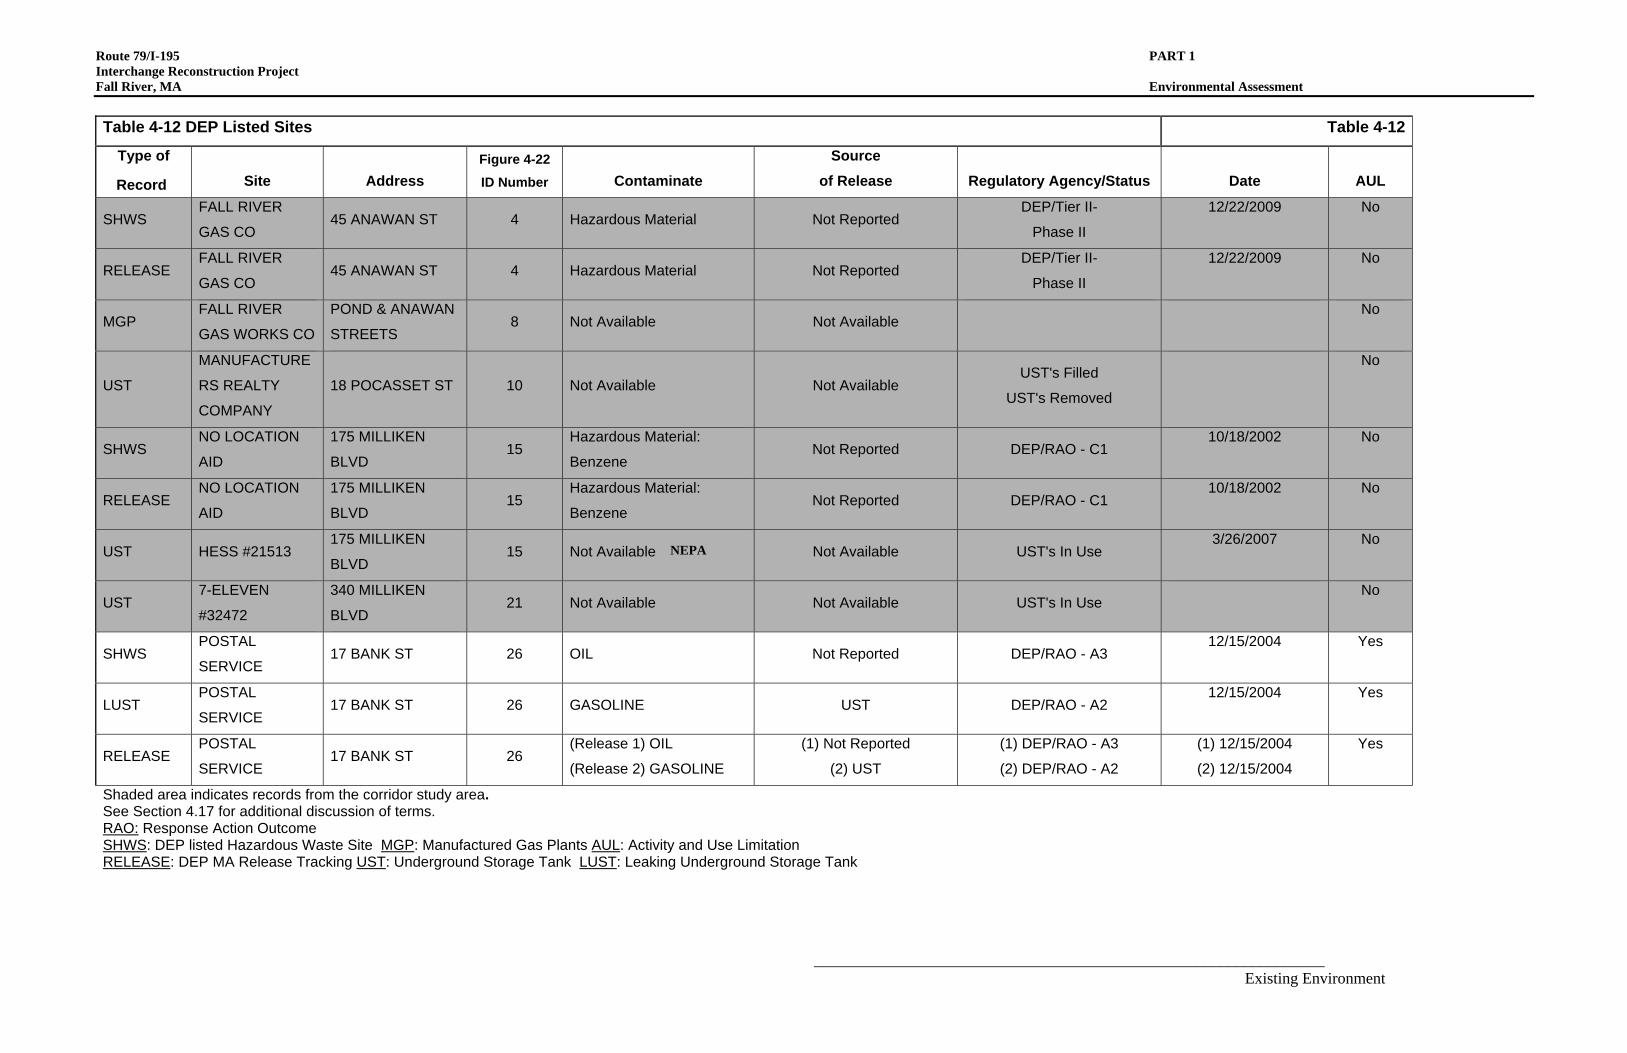
________________________________________________________________
Route 79/I-195 PART 1 Interchange Reconstruction Project
NEPA
Fall River, MA Environmental Assessment
Table 4-12 DEP Listed Sites Table 4-12
Type of
Record Site Address Figure 4-22 ID Number Contaminate
Source of Release Regulatory Agency/Status Date AUL
SHWS FALL RIVER GAS CO 45 ANAWAN ST 4 Hazardous Material Not Reported DEP/Tier II-
Phase II 12/22/2009 No
RELEASE FALL RIVER GAS CO 45 ANAWAN ST 4 Hazardous Material Not Reported DEP/Tier II-
Phase II 12/22/2009 No
MGP FALL RIVER GAS WORKS CO
POND & ANAWAN STREETS 8 Not Available Not Available No
UST MANUFACTURE RS REALTY COMPANY
18 POCASSET ST 10 Not Available Not Available UST's Filled UST's Removed
No
SHWS NO LOCATION AID
175 MILLIKEN BLVD 15 Hazardous Material:
Benzene Not Reported DEP/RAO - C1 10/18/2002 No
RELEASE NO LOCATION AID
175 MILLIKEN BLVD 15 Hazardous Material:
Benzene Not Reported DEP/RAO - C1 10/18/2002 No
UST HESS #21513 175 MILLIKEN BLVD 15 Not Available Not Available UST's In Use 3/26/2007 No
UST 7-ELEVEN #32472
340 MILLIKEN BLVD 21 Not Available Not Available UST's In Use No
SHWS POSTAL SERVICE 17 BANK ST 26 OIL Not Reported DEP/RAO - A3 12/15/2004 Yes
LUST POSTAL SERVICE 17 BANK ST 26 GASOLINE UST DEP/RAO - A2 12/15/2004 Yes
RELEASE POSTAL SERVICE 17 BANK ST 26 (Release 1) OIL
(Release 2) GASOLINE (1) Not Reported
(2) UST (1) DEP/RAO - A3(2) DEP/RAO - A2
(1) 12/15/2004(2) 12/15/2004
Yes
Shaded area indicates records from the corridor study area.See Section 4.17 for additional discussion of terms. RAO:SHWS
Response Action Outcome: DEP listed Hazardous Waste Site MGP: Manufactured Gas Plants AUL: Activity and Use Limitation
RELEASE: DEP MA Release Tracking UST: Underground Storage Tank LUST: Leaking Underground Storage Tank
Existing Environment

Route 79/I-195 PART 1 Interchange Reconstruction Project NEPA Fall River, MA Environmental Assessment
_______________________________________________________________ 4-86 Existing Environment
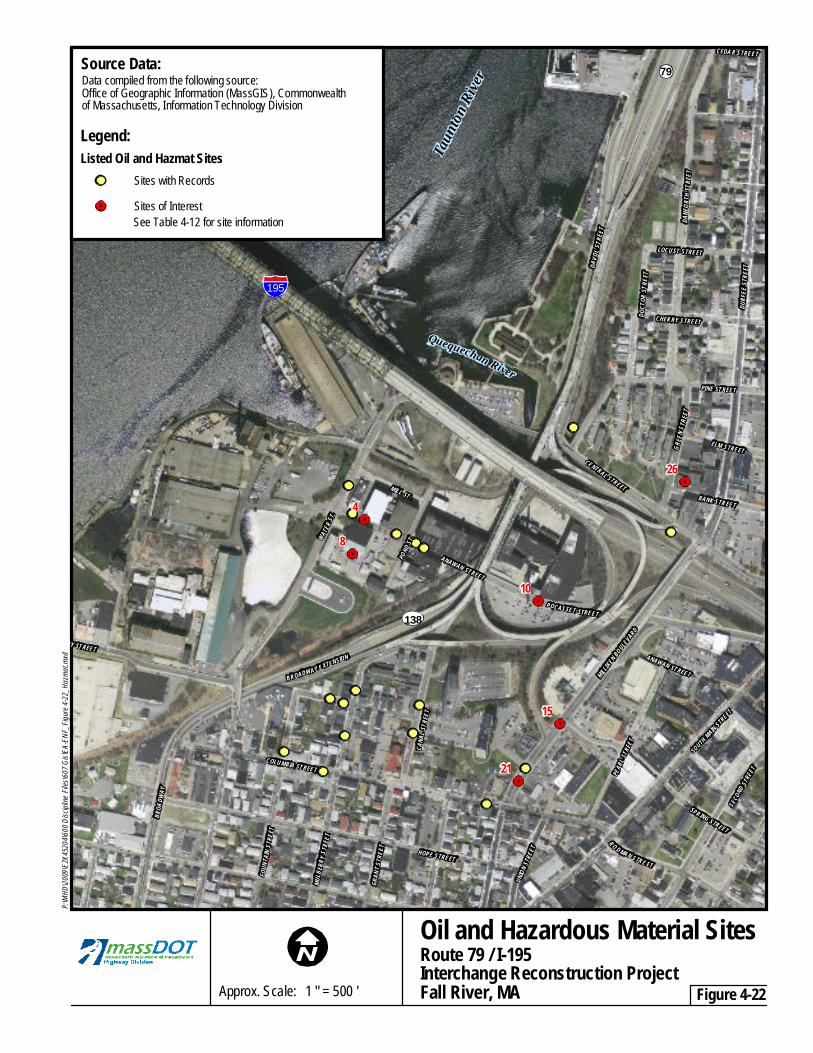
FER
FOURTH
STREE
T
EE
T
DURF
EEST
REET
DAVO
LSTR
E ET
PINE STREET
HOPE STREET
COLUMBIA STREET
BANK STREET
WATER
ST.
CHERRY STREET
LOCUST STREET
CENTRAL STREET
DANF
ORTH
STRE
ET
SOUTHMAIN STREET
SPRING STREET
MILLIKEN BOULEVARD
BROADWAY EXTENSION RY STREET
MULB
ERR Y
S TRE
ET
CANA
L STR
EET
BROA
DWAY
POCASSET STREET PE
ARL S
TREE
T
FOUN
TAIN
STRE
ET
SECO
NDST
REET
ELM STREET GREE
N STR
EET
CEDAR STREET
GRAN
T STR
EET
ANAWAN STREET
RO DMAN STRE ET
MILL ST.
UNION
STRE
ET
MAY S
TR
POND
ST.
DOCT
ORST
REET
ANAWAN STREET
Taun
ton Ri
ver
Quequechan River
79Source Data:Data compiled from the following source:Office of Geographic Information (MassGIS), Commonwealthof Massachusetts, Information Technology Division
Legend:Listed Oil and Hazmat Sites
Sites with Records Sites of InterestSee Table 4-12 for site information
195
4
8
26
10
138
P:\MH
D\2009
\E2X4
5204\6
00 Dis
cipline
Files
\607 G
is\EA-E
NF_F
igure
4-22_
Hazm
at.mx
d
21
15
Oil and Hazardous Material SitesRoute 79 / I-195Interchange Reconstruction Project
Approx. Scale: 1 " = 500 ' Fall River, MA Figure 4-22