Embed Size (px)
Citation preview

4
EXPERIMENTS IN THE FLUX CHAMBER
Introduction
The flux chamber was used to measure the ability of materials, and combinations ofmaterials, to buffer the relative humidity of an enclosure against the effect of a varyingflux of water vapour.
The usual procedure was to evaporate about ten grams of water into the chamber airand then withdraw it again in a sinusoidal cycle of, typically, one day's duration. If thechamber were empty, this flux would cause the relative humidity to cycle betweenabout ten and 90%. An absorbent material within the chamber will diminish theamplitude of the relative humidity cycle because there will be a redistribution of thewater between the air space and the material. A material with a steep sorption curve,that is with a rapidly increasing water content with rising RH, will absorb much of thewater released into the air and thus prevent the RH from varying much.
The other factor that influences the chamber RH is the permeability of the material: if itis very permeable it will be more effective in buffering the RH as water is injected intothe air, because the storage capacity of a greater thickness of material will be availableto buffer the RH.
A relatively minor influence on the chamber RH is the resistance to water vapourtransfer of the boundary layer of air right at the surface of the wall.
The cyclic variation in RH measured in the chamber during the flux cycle is anexpression of the combined porosity and absorptive power of the material, or assemblyof materials, in the test wall. These two independent factors can be separated, inprinciple, by running the experiment with different cycle times, because the absorptioncurve is independent of time.
A complicating factor is the RH dependence of both the absorption and thepermeability. This can in principle be studied by increasing the amplitude of the appliedflux cycle or, more simply, by running several successive flux cycles of smallamplitude, starting from a higher or lower average RH value.
A further complication is that there is some evidence that the permeability is timedependent when the flux is varying.
There are experimental limitations to the cycle time, the flux amplitude or the meanchamber RH. The flux generator has a limited ability to withdraw water vapour fromthe chamber. The chamber has a small leak rate to the room which limits the cycle timeto about five days. The dew point detector has a 15% RH lower limit and the RHsensors that were embedded in the test walls are imprecise below about 25% RH.Finally, at high RH the surfaces of the walls and equipment in the chamber begin tocompete with the absorption by the test wall. These practical limitations are discussedin detail in chapter 2.
4. Experiments in the flux chamber 57

Construction of the test wall
All the test materials are put into the chamber as walls, tilted slightly back to allow safestacking of the individual pieces without any binder.
The ratio of surface area to chamber volume was chosen with care. A vast area of veryabsorbent material will absorb a large flux without the RH of the chamber changing byan amount that can be measured with precision. A small area of poorly absorbentmaterial, on the other hand, will allow the same water flux to swing the RH to suchextreme values that the results will be spoiled by the water absorption of the materialsthat the chamber itself is built of. A standard flux and exposed area of material wouldallow rapid visual comparison of the performance of the various materials. Finally thechamber should imitate a plausible combination of material area, air volume and waterproduction in a dwelling, so that the graphs would show instantly if the material were ofany significance as a moisture buffer.
The compromise wall area used for nearly all the experiments was about one third of asquare metre of exposed surface in the 0.5 cubic metre chamber volume. The ratio wasnot defined exactly because some test constructions occupy more volume than others.
The back of the wall was sealed by aluminium foil and by thick polyethylene sheet. Theexperimental setup imitates the performance of the materials when used as interiorwalls of buildings, in double the quoted thickness. The performance of the outer walls,with their varying temperature gradient, requires much more elaborate equipment. Inthis dissertation the humidity buffering processes occuring in outer walls are illustratedby case histories from real buildings rather than by laboratory experiments. Someinsulating materials were, however, included in the laboratory tests.
58 4. Experiments in the flux chamber
Figure 4.1 The interior of thechamber. The air conditioningassembly is on the right. On theleft is the material under test: inthis example it is woolinsulation faced with vapourretarding paper and backed byaluminium foil and polyethylenefilm. The wires leading to RHsensors within the wool can beseen entering the far edge of theexperimental wall. One of thesmall resistive sensors is seendangling in front of the face ofthe assembly.

The choice of materials for testing
The first experiments in the chamber were designed to find the order of magnitude ofthe buffer performance of a range of building materials. Figure 4.2 combines data fromfive materials, each tested separately. The materials were built as walls, 0.5 m2, 30 mmthick and sealed at the back. The starting equilibrium RH for all materials was between58% and 68%. In the graph the separate experimental curves have been superimposedso that they all start at about 65% RH, for easier comparison.
Water vapour was withdrawn from the chamber at a steady rate that would bring theempty chamber from 100% to 0% RH in twelve hours. The theoretical curve for theempty chamber is shown as the steep dotted line descending at the left. Brick is notmuch better at giving out moisture to buffer the fall in RH than a totally nonabsorbentmaterial. Brick is quite porous and becomes quite absorbent at high RH but at thesemoderate values it has hardly any water absorption. Wooden planks are surprisingly badat buffering the RH. This is because they have a very low permeability to water, thoughthe water capacity is high. Cellular concrete has a moderate buffer capacity. Itspermeability is high but its capacity is not great: notice how the curve is straighteningout as it crosses the curve for wood towards the end of each leg of the cycle, indicatingthat its capacity is becoming exhausted, while wood still has a water reserve availablewhich is being drawn out by the high RH gradient at the surface. Unfired clay brick ismuch superior to burnt brick as a humidity buffer but the best buffer of all is wood cutacross the grain so that the high permeability in this direction can release the high watercapacity of the wood.
Other materials and combinations were tested in later experiments but the set describedabove covers the range of observed buffering by massive materials. One absorbent
4. Experiments in the flux chamber 59
Figure 4.2 A comparison of several building materials, built as walls 0.5 m2 by 30mm thick, sealed on the back. The jagged curves are due to intermittent release ofwater from a condenser to the weighed water tank in an early version of the fluxgenerator. This fault was corrected in later experiments. The curves are extractedand assembled from a series of experiments in which each material in turn wasexposed to repeated cycles in which water was withdrawn at a steady rate for 24hours and then returned to the air in the chamber at the same rate. The RH change isbuffered by desorption and then by re-absorption of water by the materials.

insulator, wool, was also tested. It has a high permeability and high water capacity perkilo but the density of wool insulation is so low that it has a limited buffer capacity inpractice.
In real life the surfaces of these materials exposed to an inhabited room would bedecorated and protected against becoming dirty unreasonably quickly. These finishesincrease the surface resistance to moisture movement and suppress expression of thebehaviour of the material behind. The use of moisture barriers or retarders in outerwalls also prevents absorbent materials from influencing the indoor climate. Theperformance of lime and gypsum plaster and vapour retarding paper was studied butpaint was not included in this study.
Reporting the results
The experimental settings changed according to the material. In particular the positionof RH sensors within the material varied from wall to wall, according to thickness andlayer structure. For this reason I have abandoned the traditional separation ofexperimental results from discussion of their significance. The structure, behaviour andperformance of each material or assemblage is discussed in turn, in a qualitative way, atthe point where the experimental curves are shown. Then there is a page summarisingthe test results for all the single materials, exposed to a daily cycle. In the next chapterselected data from this catalogue of buffer materials are discussed in more detail. Exactvalues of sorption and diffusion coefficients are given. Finally the experimental resultsare compared with results from computer models.
The typical flux cycle
The left half of the graphs in figure 4.2 shows the course of the climate within thechamber during a linear withdrawal of water vapour into the water tank, while thesecond half shows a corresponding return of water vapour to the chamber air. Most ofthe graphs reported in this chapter were, however, obtained with a sinusoidal variationin flux.
60 4. Experiments in the flux chamber
Figure 4.3 An explanation of the typical appearance of the graphs in this chapter.The widest cycle is the RH calculated from the flux acting in the empty chamber.The next curve is the measured RH. The shallower curves show the RH in cavitieshollowed out in the experimental wall.

This provides data that can be studied by models based on an electrical analogy. On amore mundane level, it is much easier to control a sinusoidal variation in flux than thesharp change of flux at the points of a triangular waveform.
The flux cycle imposed on the chamber was usually chosen to give a nearly 100% RHswing over one day in the empty chamber. This basic daily cycle imitates the dailyrhythm of both climate and human activity, but runs were also made with longer andshorter cycles to provide data for the computer simulations designed to separate theinfluences of absorption and diffusion. In these runs the flux was usually adjusted sothat the maximum rate was the same, regardless of cycle time.
In nearly all the graphs in this chapter the imposed flux cycle is presented in the form ofthe expected RH in the empty chamber. It is always the most extreme fluctuation. Theobserved, buffered RH in the chamber is the next in amplitude. A comparison of thesetwo curves gives an immediate visual impression of the ability of materials to moderaterelative humidity. The RH at various depths within the test wall is often shown in other,shallower, curves. Without exception the deepest RH shows the smallest amplitude.
Most of the graphs show just one daily cycle, after the system has settled to a steadyrhythm. Sometimes, however, the approach to the steady cycle reveals interestingdetails of the process, in which case more cycles are shown. Usually the hours elapsedfrom the beginning of the experiment are shown on the horizontal axis, even thoughonly one day's data is shown.
4. Experiments in the flux chamber 61
Figure 4.4 An explanation of why the buffered chamber RH cycles up and down inadvance of the RH calculated for the empty chamber. In the diagram the cycle of thechamber climate has been frozen just as the weight of the water reservoir reaches itsmimimum. This, in the empty chamber, would coincide with the maximum RH.However, the flux has been slackening for some time before the peak RH is reached,while the absorption of water vapour into the test wall is still strong, because of thestill relatively high, though diminishing, RH in the chamber. The absorption rateinto the material exceeds the slackening flux well before the top of the "empty" RHcurve, so the buffered RH is already on the way down before the calculated "empty"RH reaches its peak.
The RH measured within the material lags behind the chamber RH, as expected,because of the relatively slow diffusion of water into the depths of the wall.

The daily cycle is the most relevant. Passive humidity buffering by wall materials inventilated buildings cannot overcome the influence of the outside climate in the longrun, which means about a week. The response of materials to two and four day cyclesis, however, displayed in some graphs in this chapter, because it shows up the differentperformance of materials according to whether they have a high water capacity or ahigh permeability.
Accuracy and precision of the measurements
Contrary to received wisdom, the dew point sensor that measured the chamber RH wasless reliable than the resistive RH sensors embedded in the materials under test. Woodproducts, in particular, release easily condensable vapours that deposit on the cold,damp mirror of the dew point sensor. The indicated RH could rise by 4 percent over thetwo or three weeks required to make a test in the sealed chamber. The mirror wascleaned and the calibration checked each time the chamber was opened. Even so, adetailed comparison of the chamber RH with the RH within the material is not reallypossible. This experimental problem points to a fundamental problem with the use ofbuilding materials to moderate indoor relative humidity: the slow ventilation rate that isnecessary for them to function increases the concentration of pollutants outgassed fromthe materials. This is a serious problem in museums as well as in climate chambers,because the water soluble materials that cause a high indicated dew point on the chilledmirror are precisely the chemicals that absorb water and facilitate the corrosion ofmetals.
Fortunately, the resistive RH sensors used within the test material, and sometimes as acheck on the dew point drift, proved very robust and extremely sensitive to smallchanges in RH, which is all that ever happens inside good moisture buffers. Thecombination of the accuracy of the clean mirror dew point measurement with thereliability and sensitivity of the resistive sensors ensures the overall good accuracy ofthe data.
The sensors buried within the wall occupy a space about 10 x 15 x 5 mm deep. Thecavities enhance the diffusion of water vapour while the sensors obstruct it. The sealingin of the sensors also leaves cracks and inhomogeneities that are not typical of thematerial as a whole. The signals from these sensors cannot therefore be assigned to aprecisely defined depth in the specimen.
The assumption of constant temperature is not quite true. Rapid changes of flux causewarming, or cooling, of the experimental materials through the heat of vaporisation ofwater. Temperature changes of up to half a degree were measured in some experimentsdeliberately run with high flux. These small, temporary temperature differences accountfor some anomalies in the fine structure of the observed RH within specimens, but theassumption of constant temperature does not introduce significant errors ininterpretation.
62 4. Experiments in the flux chamber
The buffer performance of wood cut across the grain
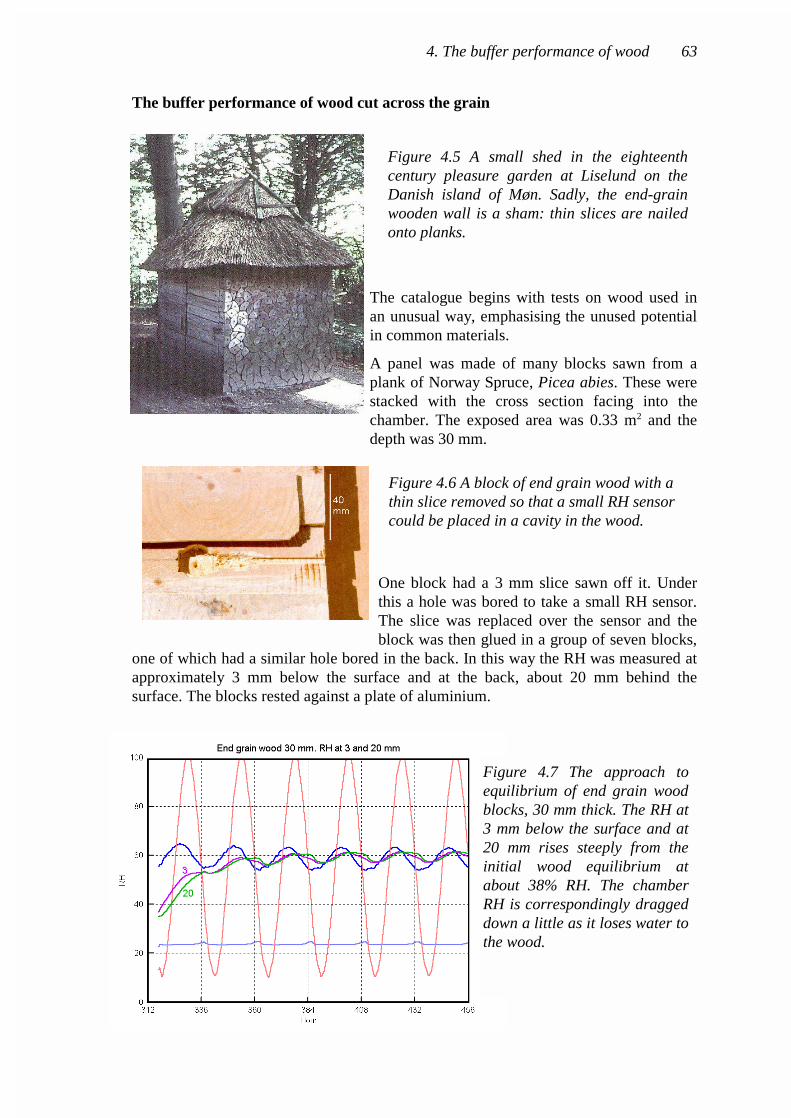
The catalogue begins with tests on wood used inan unusual way, emphasising the unused potentialin common materials.
A panel was made of many blocks sawn from aplank of Norway Spruce, Picea abies. These werestacked with the cross section facing into thechamber. The exposed area was 0.33 m2 and thedepth was 30 mm.
One block had a 3 mm slice sawn off it. Underthis a hole was bored to take a small RH sensor.The slice was replaced over the sensor and theblock was then glued in a group of seven blocks,
one of which had a similar hole bored in the back. In this way the RH was measured atapproximately 3 mm below the surface and at the back, about 20 mm behind thesurface. The blocks rested against a plate of aluminium.
4. The buffer performance of wood 63
Figure 4.5 A small shed in the eighteenthcentury pleasure garden at Liselund on theDanish island of Møn. Sadly, the end-grainwooden wall is a sham: thin slices are nailedonto planks.
Figure 4.6 A block of end grain wood with athin slice removed so that a small RH sensorcould be placed in a cavity in the wood.
Figure 4.7 The approach toequilibrium of end grain woodblocks, 30 mm thick. The RH at3 mm below the surface and at20 mm rises steeply from theinitial wood equilibrium atabout 38% RH. The chamberRH is correspondingly draggeddown a little as it loses water tothe wood.

Figure 4.7 shows the first six daily cycles for the panel. The good stabilisation of therelative humidity is immediately noticeable. The 90% RH swing of the empty chamberis reduced to 10%. The curves for 3 and 20 mm behind the surface are delayed and oflower amplitude but are close to each other. This pattern cannot be exactly reproducedby a model based on Fick's law, however much one varies the three parameters:sorption, diffusion and surface resistance. The matter is taken up in the next chapter.
Note that the chamber RH is the result of the interaction of wood and air. The RH cycleshows a descending tendency because the wood withdraws water until the two phases,wood and air, are in equilibrium, averaged over several cycles. This is the importantdifference between the flux chamber and the usual environmental chamber whichcontrols the RH. It is important to bear in mind that the RH cycle is not controlling themoisture absorption of the wood: the chamber space and the wood are exchangingwater in an attempt to come to equilibrium with each other. The flux cycle forces acontinual disturbance of this equilibrium by supplying water to the air, or bywithdrawing water.
The curves for the RH within the wood are not truly sinusoidal. This is because of thedisturbance in the temperature at times when the flux generator was working hard atcondensing water from the air. The heat generated during this process overcame thetemperature controller. This fault was corrected in later experiments.
Figure 4.8 A single day cycle for end grain wood.
Figure 4.8 shows a close up of one cycle from fig.4.7. Notice the very good stabilisationof the chamber RH. The wood is exchanging water throughout its entire thickness, asshown by the green curve for the 20 mm RH following closely after the curve for RH at3 mm. This indicates very fast diffusion of air through the wood. It also hints thatabsorption of water into the wood substance must be rather slow.
64 4. The buffer performance of wood

The entire thickness of the wood is in play. The 30 mm thickness of this wooden panelis therefore usefully employed in buffering the daily cycle of humidity in a house. Athicker layer would be even more effective. A ceiling made from tiles of wood cutacross the grain would form an excellent humidity buffer. End grain wood is used forflooring but it rapidly clogs with dirt. End grain wood behind a permeable protectivecoating would also be quite effective.
A longer cycle with double the flux amplitude would cause the RH in the emptychamber to reach 100%, followed by condensation on the walls. The wood entirelyprevents this. Notice that the RH within the wood is uniform from 3 to 20 mm and theamplitude is close to that of the RH in the chamber. The phase delay is about 0.2 cycles.At this cycle time a greater thickness of wood would give better performance. The fluxis "seeing through" the wood.
End grain wood is the most effective buffer for relative humidity among the materialstested. It is not, however, without defects. End grain wood panels are physically weakand expand and contract as they exchange water vapour with the air. The woodoutgasses numerous organic chemicals. One of the most abundant, acetic acid, iscorrosive to the base metals, lead and zinc. The cocktail of chemicals within the wooddoes, however, make it resistant to fungal growth, so end grain wood would work wellin a bathroom to absorb the intermittent flux of steam from the shower. The brief periodof raised, but still moderate water content as the wood first absorbs and then releaseswater vapour will not cause fungal growth, whereas intermittent condensation onnon-porous surfaces will eventually result in mould growth.
4. The buffer performance of wood 65
Figure 4.9 A two day cycle with double the flux amplitude.This flux would cause condensation in the empty box butthe wood buffers the RH very effectively.

Wooden planks
A wood surface cut parallel with the cell direction reacts to the water vapour flux muchmore slowly than does end grain wood. Diffusion across the cell direction is about tentimes slower than diffusion along the cell direction. The buffer performance of thewood is now limited by the diffusion rate. Only a thin surface layer is effective inbuffering the daily cycle.
The messy start to this graph is quite informative. It shows how slowly the inside of theplank reaches equilibrium The sensors inside the plank were installed in a room atabout 40% RH. The sensor at the back of the plank, however, was installed at the lastminute in the more humid room containing the experimental wall. At the beginning ofthe run the back sensor slowly fell in RH as it came to equilibrium with the low RH ofthe middle of the plank. Meanwhile the middle of the plank was slowly absorbing waterfrom the front, exposed to the relatively humid chamber. The sensor at 3 mm tookabout 8 days to come to equilibrium with the chamber. During this time the chamberRH showed a steady fall in its mean value as it lost moisture to the wood. After 8 daysthe interior of the wood was still far from equilibrium with the chamber RH.
66 4. The buffer performance of wood
Figure 4.10 The RH sensors within the woodenplanks were installed in shallow holes drilled intoa very oblique section. The thin wires were ledparallel to the surface to the edge of the plank, tominimise movement of air bypassing the hardroute through the solid wood.
Figure 4.11 The initial cycles for wooden planks. Theflux amplitude was changed at the fourth cycle.

The contrast with the behaviour of end grain wood is very striking. The buffer capacityis very moderate. The sorption curve is of course exactly the same as that of end grainwood but the diffusion is so slow that only the outer few millimetres are engaged inreacting to the daily flux cycle. The slow diffusion of water vapour through woodmeans that it actually behaves as a vapour barrier to the daily flux cycle, while allowingthe yearly cycle to reach right through it.
4. The buffer performance of wood 67
Figure 4.12 A single day extracted from figure 4.10. Theinterior of the wood is far from equilibrium and not atall affected by the daily flux cycle in the chamber
Clay tiles
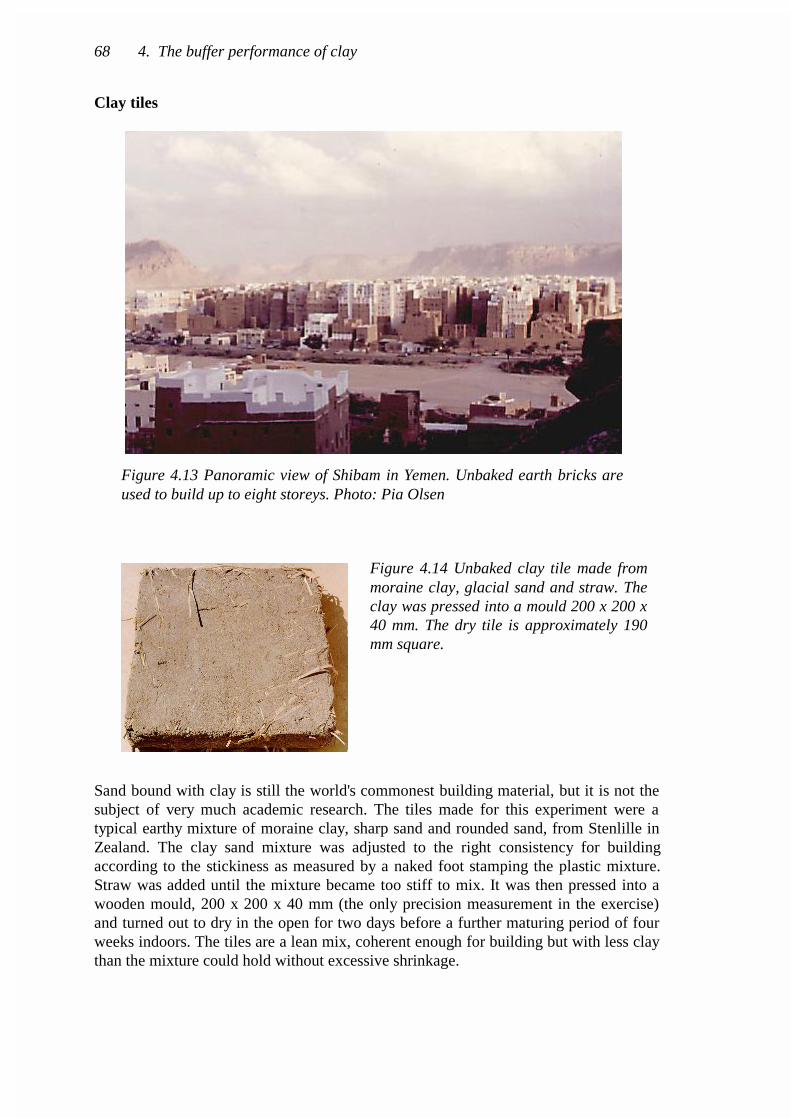
Sand bound with clay is still the world's commonest building material, but it is not thesubject of very much academic research. The tiles made for this experiment were atypical earthy mixture of moraine clay, sharp sand and rounded sand, from Stenlille inZealand. The clay sand mixture was adjusted to the right consistency for buildingaccording to the stickiness as measured by a naked foot stamping the plastic mixture.Straw was added until the mixture became too stiff to mix. It was then pressed into awooden mould, 200 x 200 x 40 mm (the only precision measurement in the exercise)and turned out to dry in the open for two days before a further maturing period of fourweeks indoors. The tiles are a lean mix, coherent enough for building but with less claythan the mixture could hold without excessive shrinkage.
68 4. The buffer performance of clay
Figure 4.13 Panoramic view of Shibam in Yemen. Unbaked earth bricks areused to build up to eight storeys. Photo: Pia Olsen
Figure 4.14 Unbaked clay tile made frommoraine clay, glacial sand and straw. Theclay was pressed into a mould 200 x 200 x40 mm. The dry tile is approximately 190mm square.

Holes were dug in one of the tiles, from the back. RH sensors were inserted and sealedwith plugs of nearly dry clay set in a wet clay mortar. This is why the start of theexperiment shows very high RH for the enclosed sensors. It takes over a week for thesesensors to come to equilibrium, although a minimum of water was used to dampen thetile so that the mortar would seal the cavities well. This hints at a buffer performance
limited by the permeability of the material. The shallowest sensor is at 15 mm. This isbecause the coarse structure of the clay would give very untypical results if the sensorwere placed at the 3 mm depth used in the experiments on wood.
4. The buffer performance of clay 69
Figure 4.15 SEM picture of a brokensurface of a mud brick. In the centre is thesmooth depression where a sand grain haspulled out, leaving a thin wedge of clayand a void behind. The shrinkage cracksin the clay give the porosity that allowsgood humidity buffering. The close contactbetween sand grains gives good resistanceto shrinkage. This is a good buildingquality but less than ideal as a moisturebuffer. Photo: Ulrich Schnell.
Figure 4.16 The first cycles for clay tile. The cycle time is 12hours. The built in sensors start at a high RH because a wetcreamy clay mortar was used to seal the cavities containingthe sensors. The deep sensor comes more quickly toequilibrium because less water was used to install it. Noticehow the average chamber RH rises as the clay dries

The diagram for the single cycle shows that the buffering is moderately good but is onlyengaging the outer layer of the tile. The sensor at 15 mm is hardly reacting at all to thetwelve hour cycle. The efficiency of the buffering at this short cycle time is limited bythe resistance of the boundary layer.
70 4. The buffer performance of clay
Figure 4.17 A single 12 hour cycle from later in the experimentalrun whose start is shown in figure 4.16. The buffering ismoderate, even though the sensor at 15 mm is scarcely reacting.
Figure 4.18 The daily cycle for clay tile. The buffering is good,in spite of the very slight engagement of the material in depth.

The daily cycle also hardly stirs the deeper layers, although the buffering is good. Theclay performance resembles that of the wood planks: the water reserve is there but it isnot readily available to moderate the daily cycle.
The next diagram shows a two day cycle.
The two day flux cycle does stir the deepest layer of the clay tile. The optimumthickness for effective buffering of the daily cycle is about 20 mm. This amount of claycan certainly be used as a plaster over a brick wall, as a substitute for gypsum or limeplaster, which have very little buffer effect, as later graphs will show. The clay tilesused in this experiment were friable and not immediately useful as an interior finish buta combination of clay tile with a thin porous covering of gypsum or lime, maybe in theform of a fresco painting, would be an interesting and practical interior finish.
4. The buffer performance of clay 71
Figure 4.19 A two day cycle does reach down to theback of the clay tile.

A clay tile made specially to function as a humidity buffer
The clay tile investigated in the previous section was just a typical clay brick mixture.Mud brick is always a local product. The moraine clay was not analysed, because anexact description of that particular clay would be no help to anyone building anywhereelse. Its buffering action was quite good, so it seemed worth investigating the possibilityfor developing a well defined clay mixture with superior humidity buffering. A 20 mmlayer of such a clay could be used as an interior wall finish instead of gypsum or limeplaster, which have very poor buffering properties, as will be shown later in this chapter.
A search of the literature suggested that the clay with the best water absorptionproperties is sodium montmorillonite, in the finely divided form known as bentonite.This is a marine clay formed by the weathering of volcanic rock. Denmark has vastsupplies of this clay in a homogeneous deposit extending from Lolland to Fyn.
If one takes the trouble to develop a specialised product as a substitute for an extremelycommon material it makes sense to look at the other ingredients as well. Therequirements for a thin vertical surface layer are rather different from the requirementsfor a brick. The filler and dimensional stabiliser in mud brick is sand, usually quartz.This is heavy, has no moisture absorption and little thermal resistance. A replacementfiller should be light and water absorbent. It should add high porosity to the mixture.One use of bentonite is to waterproof toxic waste dumps and ornamental fountains, so inits pure state it is no good at all for buffering humidity. An effective opening of thestructure is essential to change it from a moisture blocker to a moisture buffer.Bentonite also swells enormously when wetted, so the filler should ideally lock itsparticles together better than sand to withstand the movement of the bentonite.
72 4. Light clay
Figure 4.20 Bentonite clay (left) and Perlite grains of up to 2mm diameter. The bentonite is 80% montmorillonite clay invery finely divided but compact form and is very impermeableindeed. The admixture of perlite opens the structure andmakes the resulting tiles dimensionally stable and porous.

The material chosen as filler has only some of these ideal properties. It is perlite, anartificial glass froth made by heating granules of volcanic glass that contains water thatoriginally was prevented from forming bubbles by the high pressure at the point wherethe glass solidified within the earth. The crushed glass is blown into a flame in a talltube. The glass softens and the trapped water expands into steam, blowing the particleup into a frothy sphere.
The bentonite from the clay pit is a scarcely plastic, dense mass. It is first mixed withone and a half volumes of water to reduce it to a creamy consistency which can bemixed with ten parts by volume of perlite. The final mix occupies only five volumes,because the clay fills in the voids in the perlite and the mixing crushes some of theperlite. This mixture has some straw added at the last moment. A good mixer for thiscombination of materials is a baker's dough mixer. Finally the plastic mix is pressed intomoulds and dried. The shrinkage is about 10%.
4. Light clay 73
Figure 4.22 SEM image of a polished section of a similarstructure to that shown in the previous figure. The clayparticles form a filigree between the rounded outlines of theperlite particles. The clay content is only about one tenth ofthat of perlite by volume. Photo: Inger Søndergaard.
Figure 4.21 SEM picture of an agglommeration of perlitegrains in a perlite - bentonite mixture. The view is about 0.6mm across. Photo: Inger Søndergaard.
One tile was fitted with sensors at 9 mm and at 34 mm from the surface. The structure ismore homogeneous than the ordinary clay tile studied in the previous section, so thesensor could be closer to the surface. This tile was then placed in the middle of a set ofnine tiles which were stacked up against an aluminium back plate.
When the tile dries the bentonite component tries to shrink but is restrained by theperlite fragments. The loose glass shards and the partly crushed frothy particles form avery resistant interlocked mass which stops the tile from shrinking. The bentonite istherefore forced to take up an open porous structure, which is very difficult todistinguish from the perlite shards in a SEM picture. The individual clay particles arewell below the resolution of the SEM and the chemical signature is rather similar to thatof perlite. The section shown in figure 4.22 is chosen to match the structure shown inthe broken surface of figure 4.21. Figure 4.24 shows a more typical area at lowermagnification. This picture has been manipulated to increase the contrast and to showthe solid matter in black. The structure has four components: damaged perlite particlesand curved fragments, voids and an open structure of loosely stacked plates of clayparticle aggregates. The intact perlite grains have closed pores and are impermeable.The humidity buffering is presumably provided by the mesh of poorly organised platesof montmorillonite.
.
74 4. Light clay
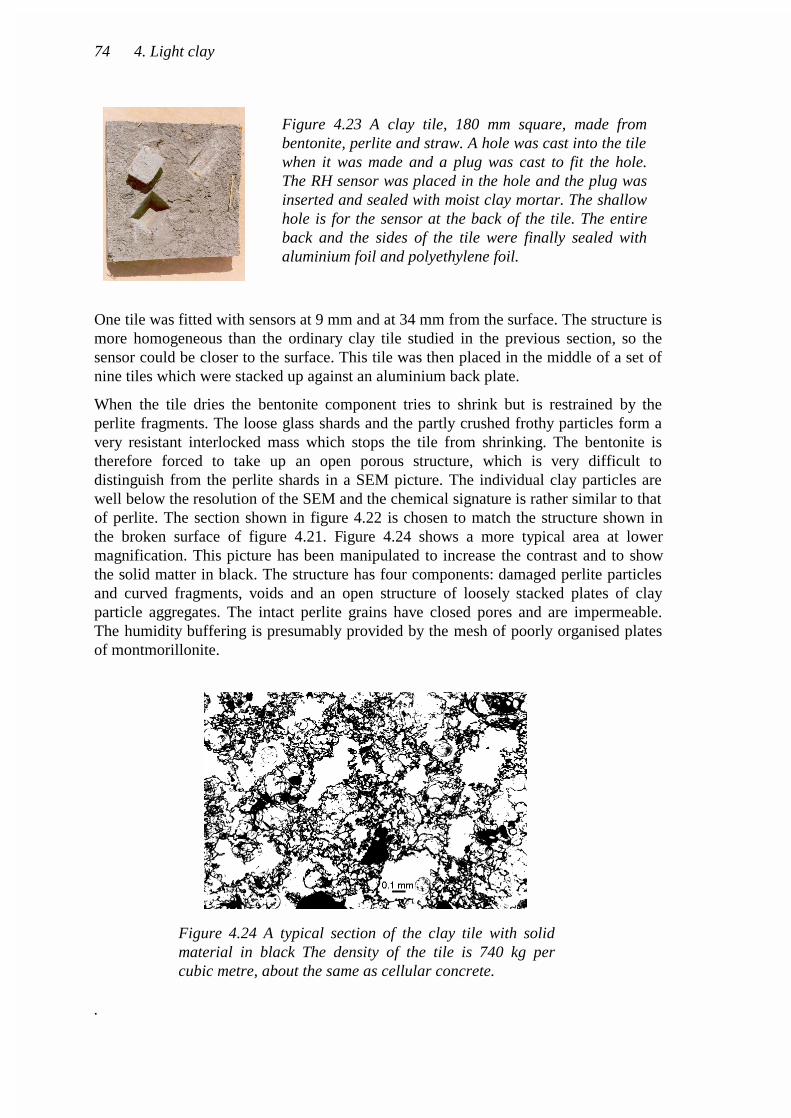
Figure 4.23 A clay tile, 180 mm square, made frombentonite, perlite and straw. A hole was cast into the tilewhen it was made and a plug was cast to fit the hole.The RH sensor was placed in the hole and the plug wasinserted and sealed with moist clay mortar. The shallowhole is for the sensor at the back of the tile. The entireback and the sides of the tile were finally sealed withaluminium foil and polyethylene foil.
Figure 4.24 A typical section of the clay tile with solidmaterial in black The density of the tile is 740 kg percubic metre, about the same as cellular concrete.

Bentonite with perlite is not a mixture recommended by earth builders. The exceptionalshrinkage of bentonite on drying suggest that it will be difficult to use. Thecorresponding expansion on rewetting suggests that it will be unstable once the house isbuilt.
The drying shrinkage indicates that building should be done with clay bricks, rather thanby the cob technique, where globs of plastic clay are piled up and pressed together tomake a wall. The dry stamping technique known as pisé may work but requires that thewet mixture be dried out considerably before stamping begins, introducing an extra,time consuming process.
The lightweight clay tiles are very similar in density to cellular concrete and could beused in much the same way. The compressive strength is quite adequate. Theadvantages over cellular concrete are that it can be recycled and it can be given greatbending strength through incorporating extra, oriented fibres, making it quite suitablefor shelving and arches.
The tiles are surprisingly resistant to water spray. The clay at the surface swells andseals off the interior.
4. Light clay 75
Figure 4.25 The bentonite - perlite mixture shrinks evenly if it isnot restrained (bottom). It is therefore suitable for making claybricks but less suited to cob methods, where the clay is appliedin a plastic state. A formulation suitable for plastering walls hasyet to be developed.

The moisture buffering potential of lightweight clay tile
Figure 4.26 The daily cycle for lightweight clay tile.
The buffering of the daily cycle is so good that the RH at 9 mm hardly changes at all.The observed RH cycle is largely controlled by diffusion across the boundary layerbetween air and tile.
Figure 4.27 The two day cycle for lightweight clay tiles
During the two day cycle the amplitude of the chamber RH is hardly greater than in theone day cycle, in spite of the greater quantity of water injected during the cycle. Thissuggests that the main factor causing the observed RH swing in the one day cycle is thesurface resistance to moisture transfer.
76 4. Light clay
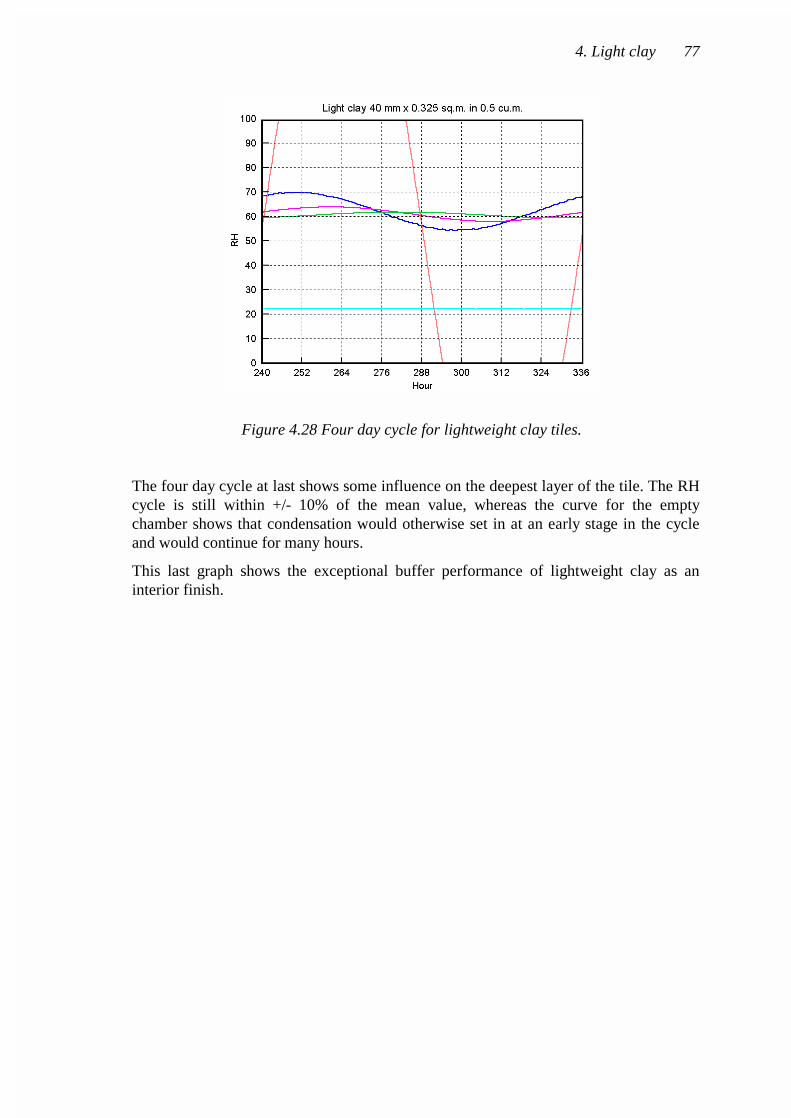
Figure 4.28 Four day cycle for lightweight clay tiles.
The four day cycle at last shows some influence on the deepest layer of the tile. The RHcycle is still within +/- 10% of the mean value, whereas the curve for the emptychamber shows that condensation would otherwise set in at an early stage in the cycleand would continue for many hours.
This last graph shows the exceptional buffer performance of lightweight clay as aninterior finish.
4. Light clay 77
Lime plaster
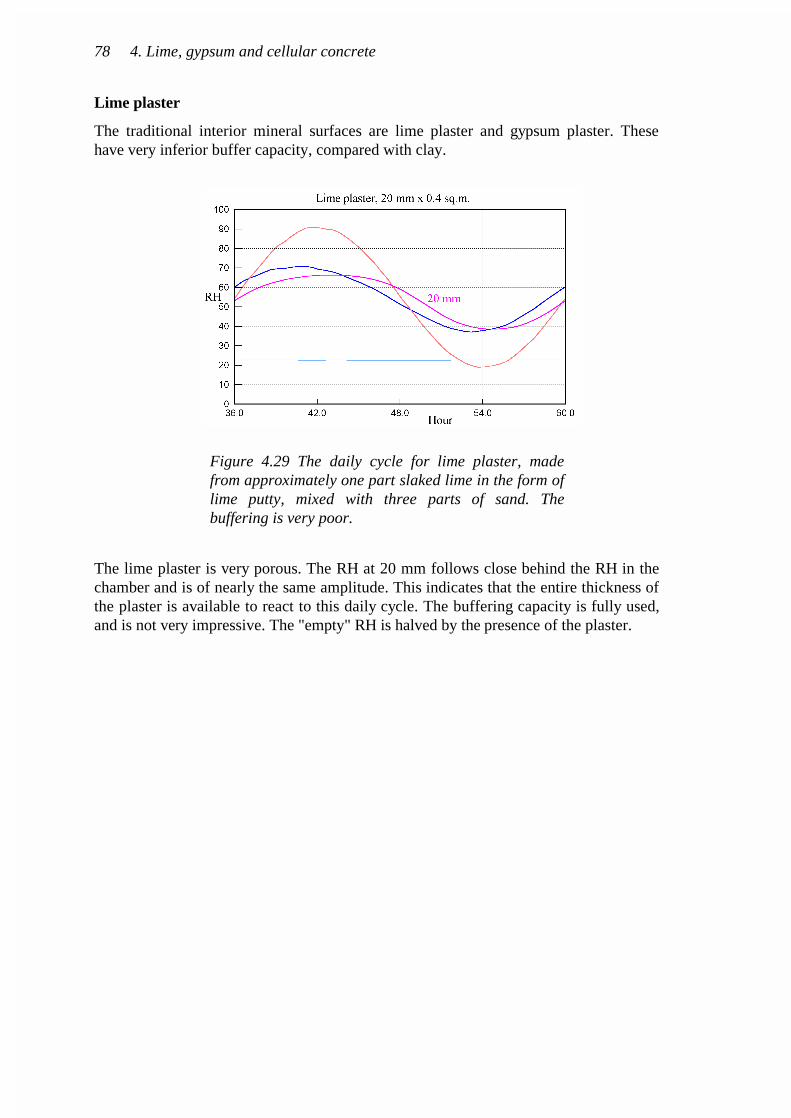
The traditional interior mineral surfaces are lime plaster and gypsum plaster. Thesehave very inferior buffer capacity, compared with clay.
The lime plaster is very porous. The RH at 20 mm follows close behind the RH in thechamber and is of nearly the same amplitude. This indicates that the entire thickness ofthe plaster is available to react to this daily cycle. The buffering capacity is fully used,and is not very impressive. The "empty" RH is halved by the presence of the plaster.
78 4. Lime, gypsum and cellular concrete
Figure 4.29 The daily cycle for lime plaster, madefrom approximately one part slaked lime in the form oflime putty, mixed with three parts of sand. Thebuffering is very poor.
Gypsum plaster
Cellular concrete
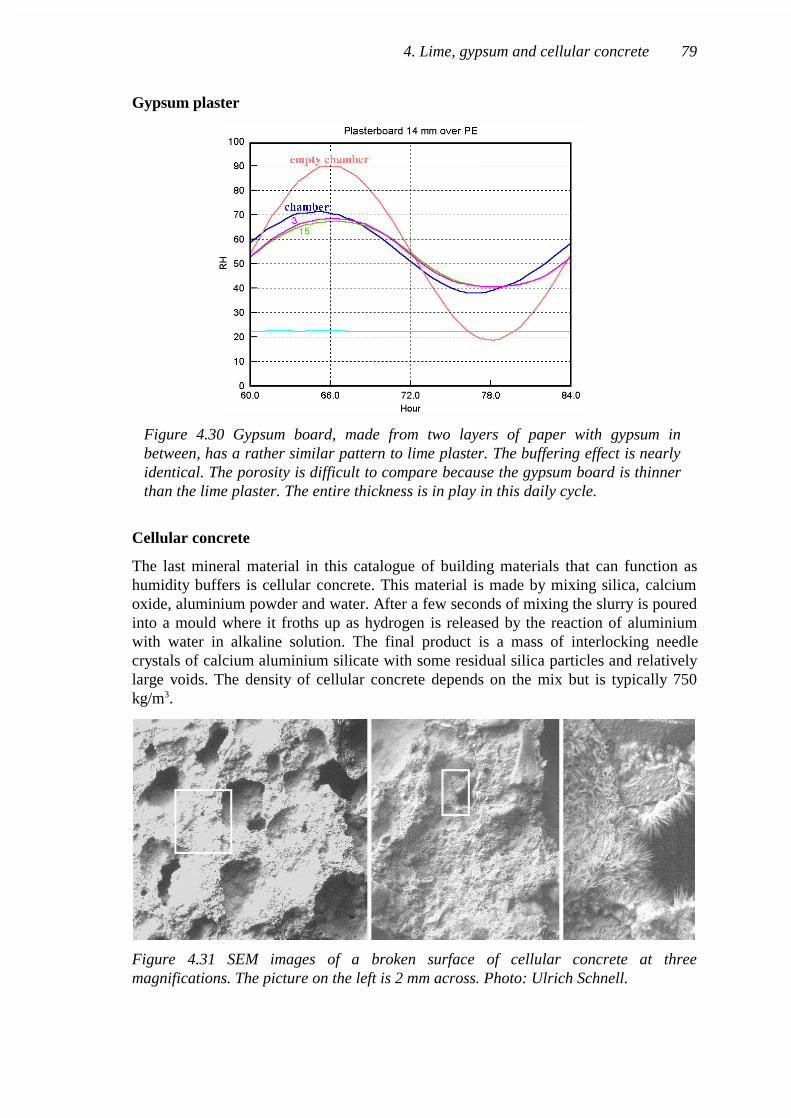
The last mineral material in this catalogue of building materials that can function ashumidity buffers is cellular concrete. This material is made by mixing silica, calciumoxide, aluminium powder and water. After a few seconds of mixing the slurry is pouredinto a mould where it froths up as hydrogen is released by the reaction of aluminiumwith water in alkaline solution. The final product is a mass of interlocking needlecrystals of calcium aluminium silicate with some residual silica particles and relativelylarge voids. The density of cellular concrete depends on the mix but is typically 750kg/m3.
Figure 4.31 SEM images of a broken surface of cellular concrete at threemagnifications. The picture on the left is 2 mm across. Photo: Ulrich Schnell.
4. Lime, gypsum and cellular concrete 79
Figure 4.30 Gypsum board, made from two layers of paper with gypsum inbetween, has a rather similar pattern to lime plaster. The buffering effect is nearlyidentical. The porosity is difficult to compare because the gypsum board is thinnerthan the lime plaster. The entire thickness is in play in this daily cycle.

The enormous surface area gives plenty of sites for water absorption, so cellularconcrete is a moderately good buffer, as the next three diagrams show.
Figure 4.32 Cellular concrete, 24 hour cycle.
Figure 4.33 Cellular concrete, 48 hour cycle
The entire 30 mm thickness of the cellular concrete is working to buffer the 48 hourcycle. The 24 hour cycle also reaches down to the back of the tile, so this thickness isless than the optimal for buffering the daily cycle.
80 4. Lime, gypsum and cellular concrete
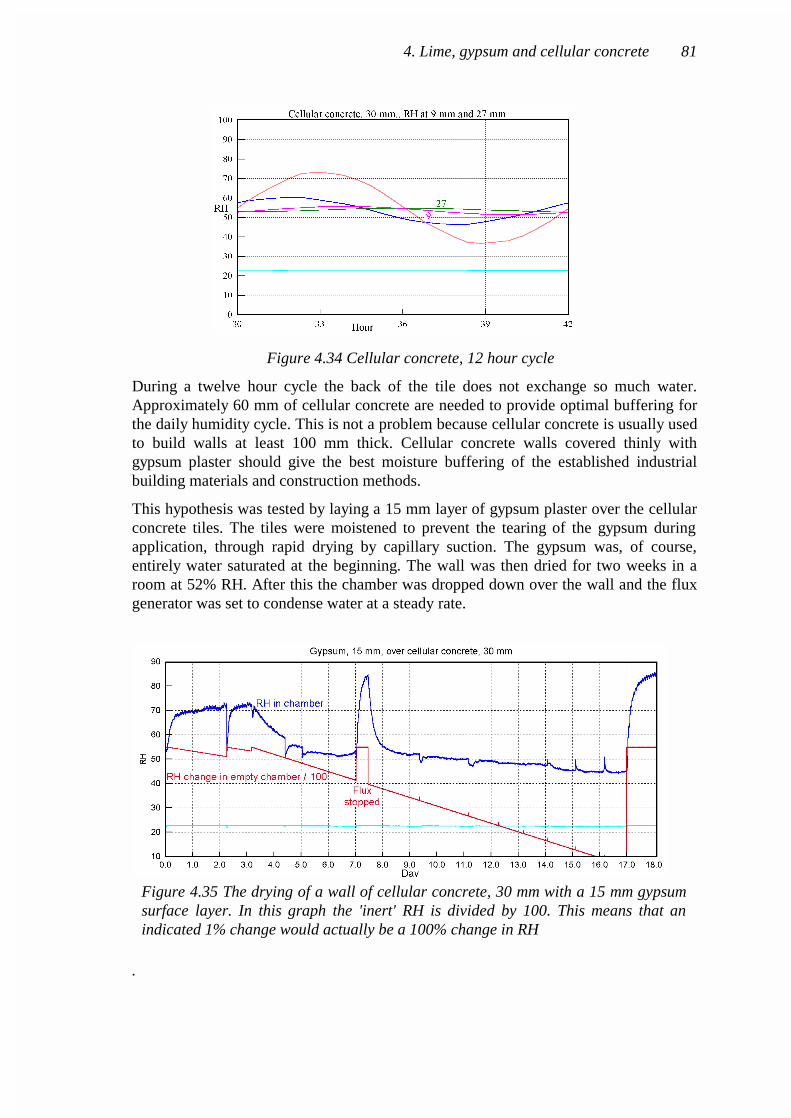
Figure 4.34 Cellular concrete, 12 hour cycle
During a twelve hour cycle the back of the tile does not exchange so much water.Approximately 60 mm of cellular concrete are needed to provide optimal buffering forthe daily humidity cycle. This is not a problem because cellular concrete is usually usedto build walls at least 100 mm thick. Cellular concrete walls covered thinly withgypsum plaster should give the best moisture buffering of the established industrialbuilding materials and construction methods.
This hypothesis was tested by laying a 15 mm layer of gypsum plaster over the cellularconcrete tiles. The tiles were moistened to prevent the tearing of the gypsum duringapplication, through rapid drying by capillary suction. The gypsum was, of course,entirely water saturated at the beginning. The wall was then dried for two weeks in aroom at 52% RH. After this the chamber was dropped down over the wall and the fluxgenerator was set to condense water at a steady rate.
.
4. Lime, gypsum and cellular concrete 81
Figure 4.35 The drying of a wall of cellular concrete, 30 mm with a 15 mm gypsumsurface layer. In this graph the 'inert' RH is divided by 100. This means that anindicated 1% change would actually be a 100% change in RH

The result was surprising. Part of the graph is shown in figure 4.35. A flux of -2 g/hrwas applied (that is 2g/hr of water was condensed into the tank). The RH fell quitequickly to about 50% but then continued to decline very slowly while many tankfuls ofwater were extracted from the wall. Extracting 2g/hr of water would make the RH inthe empty chamber drop from 50% to zero in 2.5 hours, yet the RH only fell from about52% to 48% over a week.
A plausible explanation for this almost constant RH in the chamber is that most of thewater from the gypsum was absorbed into the cellular concrete soon after the setting ofthe plaster. During the initial period of ventilation a relative humidity gradientestablished itself through the gypsum, with 100% RH at the interface with the cellularconcrete and a value at the surface which depends on the flux through the surface. Thisgradient will remain stable for weeks, while the cellular concrete gives up its stock ofcapillary moisture. This condition is due to the different pore size in the two materials:the gypsum has coarser pores.
This unintended experiment demonstrates that humidity buffering at moderate RH byabsorbent porous materials is a minor phenomenon compared with the huge quantitiesof water that can be stored in the capillaries of materials, in a condition where theequilibrium RH remains at 100%, while a large amount of water is released, orabsorbed. The significance of this for the indoor climate is that the process by whichwet gypsum gives up its capillary water to the cellular concrete is not reversible in theway that buffering by a block of one material is reversible. If a brief episode ofcondensation in a bathroom, for example, is absorbed into the gypsum, the water will betransferred by a relatively rapid capillary flow to the cellular concrete. The reverseprocess will be slow because the water changes to vapour at depth within the wall, atthe interface of the two materials. There is no air flow to boost evaporation: the watervapour must diffuse to the surface. This assymetry in the speed of wetting and dryingcan be advantageous if the cellular concrete can evaporate the moisture to the outside ofthe building.
82 4. Lime, gypsum and cellular concrete
Figure 4.36 SEM pictures of cellular concrete, on the left, and gypsum plaster. Eachimage is 25 microns across. Photos: Ulrich Schnell.
Wool insulation
The materials discussed so far in this chapter have been stiff, structural materials. Thecatalogue ends with a soft material: wool.
Absorbent insulators are credited with many virtues and vices, according to which sideof the green line one is standing. Advocates of environmentally friendly, organicinsulation in houses point to the water absorption of wool as an asset, preventingcondensation within walls and moderating the indoor humidity. Opponents from themineral fibre industry argue that the water absorption allows rotting and encouragesinsect attack. I will return to this controversy in a later chapter.
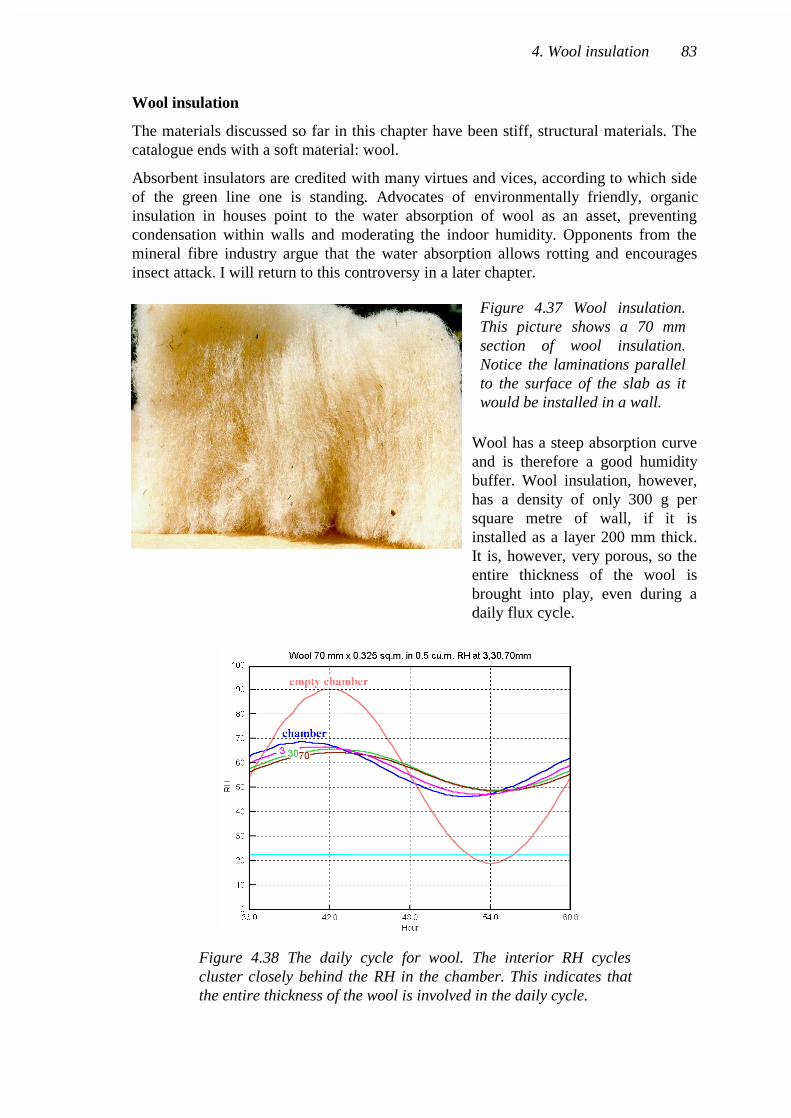
Wool has a steep absorption curveand is therefore a good humiditybuffer. Wool insulation, however,has a density of only 300 g persquare metre of wall, if it isinstalled as a layer 200 mm thick.It is, however, very porous, so theentire thickness of the wool isbrought into play, even during adaily flux cycle.
4. Wool insulation 83
Figure 4.37 Wool insulation.This picture shows a 70 mmsection of wool insulation.Notice the laminations parallelto the surface of the slab as itwould be installed in a wall.
Figure 4.38 The daily cycle for wool. The interior RH cyclescluster closely behind the RH in the chamber. This indicates thatthe entire thickness of the wool is involved in the daily cycle.

All the RH curves, except the empty box one, are going up and down almost identically,with a small phase delay for the sensors embedded in the wool. The buffering isconsiderable, but it is also all that the wool can offer: there is no reserve for longer fluxcycles.
Figure 4.39 Wool insulation: 48 hour cycle
The two day cycle resembles the pattern of the 24 hour cycle with the importantdifference that the amplitude of the chamber RH is greater.
The four day cycle shows an even greater swing, but there is still no danger ofcondensation. The wool is therefore effective as a buffer at any frequency. Its efficiencycontinues to increase with thickness, because the rate of moisture diffusion is muchfaster than that for clay or wood planks. Compacting the wool would also work to someextent, though eventually the greater density would affect the permeability.
84 4. Wool insulation
Figure 4.40 Part of a four day cycle with wool insulation. The RH is now swingingwith a large oscillation, though there is still no danger of condensation. The curvesfor the RH inside the wool are flattened at the extremes (dotted lines) and are nolonger accurate: the sensors are outside their linear range

Wool insulation encapsulated
Walls of exposed wool are a verypresentable form of interior decoration,though expensive. Tapestries have forcenturies been regarded as the mostprestigious wall covering for a grand housein Europe. Curtains are a more mundaneform of wool moisture buffer.
The density per square metre of tapestry isnot so far from that of wool used as
insulation and so its buffer capacity is similar, and very useful because it is immediatelyavailable to fight acute water vapour fluxes.
Sheep's wool is one of the insulating materials that is recommended as anenvironmentally friendly replacement for mineral fibres. Advocates of moistureabsorbent insulators, such as paper and other vegetable fibre and wool, assert that thesematerials give a more pleasant indoor climate, through their moisture buffering action.This effect cannot possibly work if the wall is provided with an impermeable barrier, asis usually recommended to prevent condensation within the wall in heated buildings. Amoisture retarder, which is moderately permeable to water vapour, is thereforerecommended for these insulators.
A typical wall construction would be gypsum board as the interior finish, then a vapourretarder and wool insulation with some permeable outer sheathing to allow ventilationof moisture to the outside.
These materials are examined one by one, and in combination, to see how easily theroom can receive the benefit of moisture absorption by the wool.
4. Wool insulation 85
Figure 4.41 A detail from an 18thcentury French tapestry in the RoyalPalace, Copenhagen. Photo: RobertoFortuna
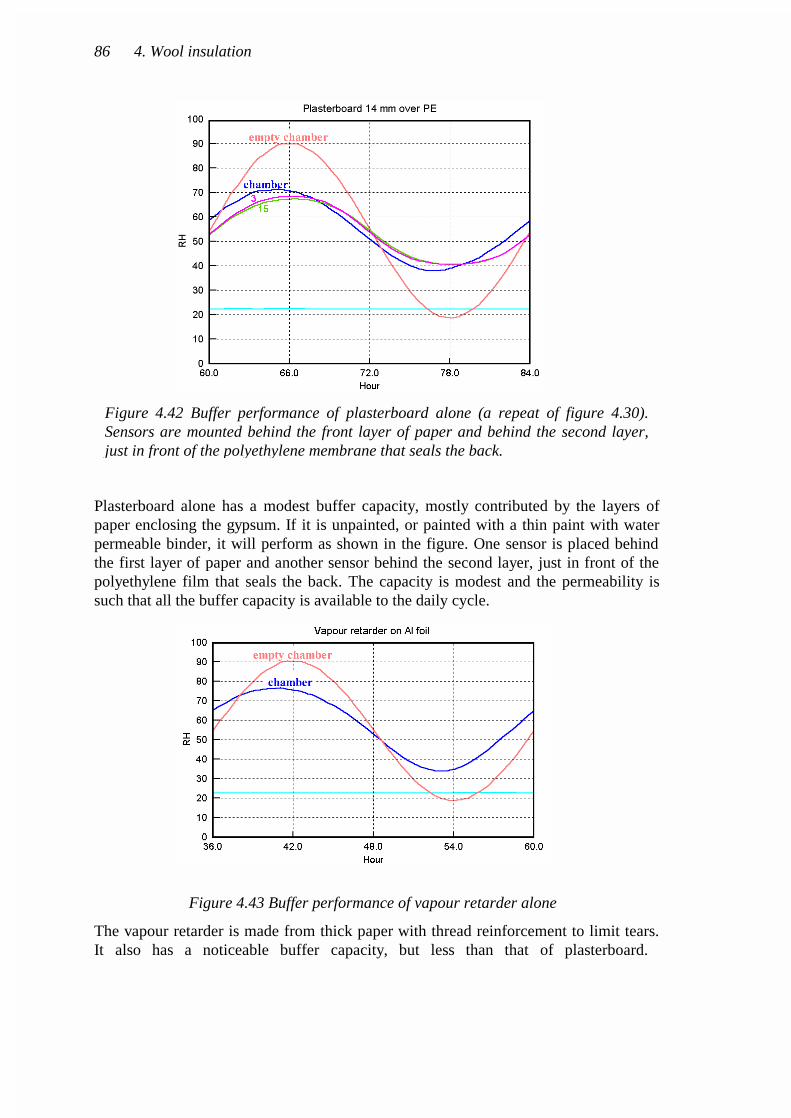
Plasterboard alone has a modest buffer capacity, mostly contributed by the layers ofpaper enclosing the gypsum. If it is unpainted, or painted with a thin paint with waterpermeable binder, it will perform as shown in the figure. One sensor is placed behindthe first layer of paper and another sensor behind the second layer, just in front of thepolyethylene film that seals the back. The capacity is modest and the permeability issuch that all the buffer capacity is available to the daily cycle.
Figure 4.43 Buffer performance of vapour retarder alone
The vapour retarder is made from thick paper with thread reinforcement to limit tears.It also has a noticeable buffer capacity, but less than that of plasterboard.
86 4. Wool insulation
Figure 4.42 Buffer performance of plasterboard alone (a repeat of figure 4.30).Sensors are mounted behind the front layer of paper and behind the second layer,just in front of the polyethylene membrane that seals the back.

Wool behind plasterboard can still influence the indoor climate, but only marginally.The clear swing in RH within the wool is as much due to its low capacity for water as toits buffering of the chamber air.
Wool behind the vapour barrier has a negligible effect on the room climate.
4. Wool insulation 87
Figure 4.44 Plasterboard over wool, sensors behind theplaster, midway through the wool and at the back
Figure 4.45 Wool behind vapour retarder. Sensors behindthe retarder and within the wool at 7 and 15 cm.

When the orthodox combination of plasterboard, vapour retarder and wool is examined,the RH within the wool varies by just a few percent, indicating a negligibleparticipation in the moisture exchange. The plasterboard and the vapour barrier providewhat humidity buffering there is.
Reaction of a wall to a sudden injection of water vapour
The way in which the various components of such a complex wall react in turn to theflux in the room is rather clearly shown by a different experiment in which a suddenpulse of water vapour was injected. The response of the wall is shown in the diagrambelow. At about hour 5 in the graph, water is added to send the empty chamber to"200%" RH, which is roughly the same flux as in the 48 hour cycle in earlier diagrams,but added all at once.
The plaster, more particularly its two layers of paper, does most of the moisturebuffering in the early hours after the water is injected. Then this water diffuses throughto the vapour retarder and eventually to the wool. The peak chamber RH is moderatedto 80% from the expected 100% with intense condensation that the empty chamberwould experience. At this time the wool has hardly noticed the unexpected moisture.When everything has come to equilibrium after about two days the wool has pulled thechamber RH down to less than 60%. Put rather crudely, the plasterboard has moderatedthe RH from about "200" to 80% as a quick buffer. Later, all the wall componentscombine to stabilise the RH at 57%.
88 4. Wool insulation
Figure 4.46 Plasterboard, vapour retarder and wool. Sensors behind theplaster, behind the retarder, half way through the wool and at the back.

Summary of chapter 4
The response to the release of water indoors has been measured for several materialsused in buildings. The material is put in a chamber into which water vapour can beinjected, and then removed in a continuous cycle. The exposed area of material is about0.6 m2 per cubic metre of air. The materials moderate the RH in the chamber, byabsorbing the injected water vapour and then by releasing water vapour to compensatefor that withdrawn from the chamber. A series of graphs gives a visual impression ofthe relative efficiency of different materials in moderating swings in indoor relativehumidity, by comparing the RH swing in the empty chamber with the actual cycle.
All the materials exert some moderating effect. The least effective was lime plaster,which reduces the swing to about half that in the empty chamber. The most effectiveRH buffer is more difficult to define, because it depends on the cycle time. End grainwood is very effective at moderating a daily cycle, because of its great porosity.Bentonite clay tile was excellent at all cycle times because of its very high absorption,combined with moderate porosity. Wool insulation has very high absorption per unitweight and very high permeability but when used as insulation its very low densityreduces its practical usefulness.
The reaction to the daily cycle by the single materials is collected in a summarydiagram in figure 4.48 below. As an aid to translating these sinusoidal curves into thepotential of these materials for moderating the indoor climate one can take as anexample a house in winter. The house is warmed to 23°C and is by chance at 50% RH.The water content is about 10 g/m3. The outside air is at 0°C and 100% RH. Its watercontent is 5 g/m3. The maximum rate of change of moisture content of the inside air inthe diagrams is about 1.6 g/(m3.hr). This is equivalent to 0.3 air changes per hour. This
4. Wool insulation 89
Figure 4.47 The effect of suddenly adding enough water to bring the empty chamberto "200%" RH. The rapid fluctuations at the peak are due to instability of the fluxcontroller. The wall is made of plasterboard, vapour retarder and wool insulation.

is the exchange rate for a fairly well sealed, modern house. It is immediately clear thatthe RH in the non-absorbent house is going to fall quite rapidly, though exponentially,to the 22% RH which is the RH that the outside air will acquire through warming to theroom temperature. The process will be substantially complete within 6 hours, but willbe about ten times slower in a house panelled with end grain wood. The winter in theauthor's latitude is much longer than this, so absorbent walls in houses are strictly formoderating an indoor climate whose average value, measured over a few days, isacceptable. Store houses are another matter: it is quite practical to design them to bufferover the whole year, as reported in a later chapter.
90 4. Wool insulation

Summary of the performance of the materials
4. Wool insulation 91
Figure 4.48 A collection of the 24 hour cycles for the simple materials.

92 4. Wool insulation