Embed Size (px)
Citation preview
4-Log Treatment of Viruses Demonstration Guidance
XXX-XXXX-XXX
COMMONWEALTH OF PENNSYLVANIADepartment of Environmental Protection
For more information, visit DEP’s Web site atwww.depweb.state.pa.us, Keyword: “Drinking Water.”

DEPARTMENT OF ENVIRONMENTAL PROTECTION Bureau of Water Standards and Facility Regulation
Document Number: XXX-XXXX-XXX Title: 4-Log Demonstration Guidance Effective Date: Draft Authority: Pennsylvania’s Safe Drinking Water Act (35 P.S. §721.1 et. seq.) and
regulations at 25 Pa. Code Chapter 109 Policy: Department of Environmental Protection (DEP) staff will follow the
guidance and procedures presented in this document to review and evaluate public water supplier’s 4-Log demonstrations under the drinking water management programs.
DRAFT Purpose: The purpose of this document is to establish a rational and reasonable
basis for staff decisions which will promote quality, timely and consistent service to the public and regulated community. To aid PWS demonstrating to the Department that 4-log treatment of viruses is provided prior to the first customer.
Applicability: This guidance will apply to a PWS using groundwater as a source of
supply demonstrating to the Department that 4-log treatment of viruses is provided prior to the first customer.
Disclaimer: The policies and procedures outlined in this guidance are intended to
supplement existing requirements. Nothing in the policies or procedures shall affect regulatory requirements.
The policies and procedures herein are not an adjudication or a
regulation. There is no intent on the part of DEP to give the rules in these policies that weight or deference. This document establishes the framework within which DEP will exercise its administrative discretion in the future. DEP reserves the discretion to deviate from this policy statement if circumstances warrant.
Page Length: pages Location: Volume 25, Tab 2 Definitions: See 25 Pa. Code Chapter 109
XXX-XXXX-XXX / Date / i

TABLE OF CONTENTS
Page I. General Information ........................................................................................................ 1
II. Chlorine ............................................................................................................................
A. Chlorine Gas ..........................................................................................................
B. Sodium Hypochlorite .............................................................................................
C. Calcium Hypochlorite............................................................................................
D. Application.............................................................................................................
1. Dosage........................................................................................................
2. Contact Time..............................................................................................
3. pH...............................................................................................................
DRAFT A. Sphere ....................................................................................................................
4. Temperature ...............................................................................................
E. Disinfection............................................................................................................
III. Calculation of Volume .....................................................................................................
B. Box.........................................................................................................................
C. Cylinder..................................................................................................................
D. Half-sphere.............................................................................................................
E. Cone .......................................................................................................................
F. Partially Filled Horizontal Cylinder.......................................................................
IV. Selection of Baffling Factor.............................................................................................
A. Determining Contact Time Using Baffling Factors...............................................
B. Prefabricated Tank Design with Baffling Factor Designation...............................
V. Chemical Disinfectants Not Suitable for 4-log Inactivation of Viruses ......................
A. Chloramines ...........................................................................................................
B. Chlorine Dioxide....................................................................................................
C. Peroxone ................................................................................................................
D. Iodine .....................................................................................................................
E. Potassium Permanganate .......................................................................................
XXX-XXXX-XXX / Date / ii

VI. Membrane.........................................................................................................................
A. Key Regulatory Requirements...............................................................................
B. Limitations Associated with Virus Removal .........................................................
C. 4-Log Removal of Viruses Usage..........................................................................
1. Challenge Testing ......................................................................................
2. Direct Integrity Testing..............................................................................
3. Indirect Integrity Testing ...........................................................................
VII. Ultraviolet .........................................................................................................................
A. Requirements .........................................................................................................
1. Validation Testing......................................................................................
2. Practical Limitations ..................................................................................
B. Unit Operation .......................................................................................................
DRAFT IX. Compliance Monitoring...................................................................................................
VIII. Ozone.................................................................................................................................
A. Unit Operation .......................................................................................................
B. 4-Log Inactivation of Viruses Usage .....................................................................
A. Chemical Disinfection ...........................................................................................
1. Serving More than 3,300 People................................................................
2. Serving Fewer than 3,300 People ..............................................................
B. Disinfectant Residuals ...........................................................................................
1. Community Systems ..................................................................................
2. Noncommunity Systems and BVRB Systems ...........................................
C. Alternative Treatment Technologies......................................................................
1. Membrane Filtration ..................................................................................
2. Ultraviolet ..................................................................................................
3. Ozone .........................................................................................................
Appendix A: CWS Demonstration of 4-Log Treatment of Viruses for Groundwater Systems..
Appendix B: NCWS 4-Log Treatment of Viruses for Groundwater Sources Permit .................
Appendix C: Public Water System Tracer Study Demonstration ...............................................
Appendix D: Chlorine Degradation Study ..................................................................................
Appendix E: Groundwater Rule 4-Log Treatment Demonstration.............................................
XXX-XXXX-XXX / Date / iii

DEP Regional Offices........................................................................................................
TABLES
Table 8.1 Flow Configuration................................................................................................
DRAFT
XXX-XXXX-XXX / Date / iv

I. General Information In 2009, Pennsylvania’s Chapter 109 Safe Drinking Water regulations were revised to incorporate the federal Groundwater Rule. A key component of these revisions requires that all community water systems (CWSs) maintain at least 4-log treatment of viruses for each entry point served by groundwater sources. CWSs are required to demonstrate and provide at least 4-log treatment of viruses according to the following schedule:
Population Served 4-Log Treatment Submission Deadline
Begin Approved 4-Log Treatment
>500 October 1, 2010 April 1, 2011 100-500 October 1, 2011 April 1, 2012
<100 October 1, 2012 April 1, 2013
DRAFT Noncommunity water systems (NCWSs) may respond to E. coli-positive source water samples by demonstrating and providing 4-log treatment of viruses as their required corrective action. A NCWS may also choose to avoid triggered monitoring requirements by demonstrating and providing 4-log treatment of viruses and beginning compliance monitoring. To demonstrate 4-log treatment of viruses, CWSs, NCWSs which hold a valid operation permit under § 109.504 or a bottled water and vended water systems, retail water facilities and bulk water hauling systems (BVRBs) which hold a valid permit under § 109.1005 should complete and submit the CWS Demonstration of 4-Log Treatment of Viruses for Groundwater Systems form found in Appendix A along with any other applicable documentation as described in that form. The 4-log demonstration in Appendix E Groundwater Rule 4-Log Treatment Demonstration or the online spreadsheet located at http://www.elibrary.dep.state.pa.us/dsweb/HomePage (3800-FM-WSFR0470d) shall be submitted with the CWS Demonstration of 4-Log Treatment of Viruses for Groundwater Systems or the NCWS 4-Log Treatment of Viruses for Groundwater Sources Permit for the Department to verify the 4-log treatment of viruses demonstration. Compliance monitoring must begin within 30 days of 4-log treatment of viruses verification. The demonstration process will require that the system have a documented and approved baffling factor for the disinfection system. Some systems may have an assigned and approved baffling factor documented in their permit. These systems may have their CWS Demonstration of 4-Log Treatment of Viruses for Groundwater Systems form completed by a certified operator skilled in disinfection practices and calculations, although it is preferable that the form be submitted by a licensed engineer. Systems that do not have an assigned and approved baffling factor documented in their permit should have their disinfection system evaluated by a licensed engineer, and should have their CWS Demonstration of 4-Log Treatment of Viruses for Groundwater Systems submitted by the engineer.
XXX-XXXX-XXX / Date / 1

There may be some systems that use a portion of their transmission line as a portion of their chlorine contact system, but that have no readily available means to measure the chlorine residual prior to the first customer. Systems that choose to use any length of pipe between the compliance monitoring point and the first customer will have to conduct a chlorine degradation study. Chlorine degradations studies must be performed and documented by a licensed engineer. Guidelines for a chlorine degradation study can be found in Appendix D Chlorine Degradation Study. NCWSs operating under § 109.505 should complete and submit the NCWS 4-Log Treatment of Viruses for Groundwater Sources Permit found in Appendix B along with any other applicable documentation as described in that permit application. This is a permit application, and will require the submission of plans and specifications, as well as a design engineer’s report. As such, this application must bear the signature and seal of a licensed professional engineer.
DRAFT
XXX-XXXX-XXX / Date / 2

XXX-XXXX-XXX / Date / 3
DRAFT
PWS Submits 4-Log Demonstration information
Sanitarian review: Is submission complete and
technically accurate?
Yes
No Submission returned/more info
requested
Engineering review: Is baffling
factor correctly assigned?
No
Yes
Engineer assigns new BF
Engineering review: Are 4-log
calculations accurate?
No
Yes
Engineer recalculates log-treatment
Is treatment
> 4-log
PADWIS- Sanitarian checks “4-Log treatment” for all GW sources feeding EP, sets min
Cl residual and CM begin-date
Yes
No
PWS Corrects deficiencies in submission and resubmits
Supervisor sends approval form letter to water system
Engineer amends permit if alternative Cl residual is needed
Is system adequate without requiring physical changes needing permit amendments?
Yes
No Permit applications go through existing permitting process
All permits approved?
Yes
No
Sanitarian forwards submission to engineering staff

II. Chlorine Disinfection Chlorine is the primary disinfectant used across the United States for surface water and groundwater systems. Aside from its strong oxidizing powers, chlorine has been found useful in taste and odor control, prevention of algal growths, maintenance of clear filter media, removal of iron and manganese, destruction of hydrogen sulfide, color removal, controlling biofilm, restoration and preservation of pipeline and well capacity, water main sterilization and maintaining distribution system residual. Chlorination is the addition of chlorine (Cl2) to water to form hypochlorous acid (HOCl). The chlorine reacts with organics, inorganics, and microorganisms to satisfy the chlorine demand. The chlorine remaining after the demand has been satisfied is the chlorine residual. The chlorine residual is the measurable quantity of chlorine available in the water that continues to disinfect. The contact time, chlorine residual, temperature, and pH of the water will determine how effectively the microorganisms are being inactivated. The chlorine compounds that can be added to form hypochlorous acid are chlorine gas (Cl2), sodium hypochlorite (NaOCl), or calcium hypochlorite (Ca(OCl)2).
DRAFT A. Chlorine Gas
When chlorine gas is added to water, it reacts to form a pH dependent equilibrium mixture of chlorine, hypochlorous acid and hydrochloric acid:
Cl2 + H2O → HOCl + HCl
The production of hydrogen ions reduces the pH of the water when chlorine is added. Depending on the pH, hypochlorous acid partly dissociates to hydrogen and hypochlorite ions:
HOCl H+ + OCl Both HOCl and OCl- are present when pH is between 6.5 and 8.5. When the pH is below 6.5 HOCl does not dissociate. A pH above 8.5 will completely dissociate OCl- ions. Because hypochlorous acid is 80-100% more effective at disinfection than the hypochlorite ion, chlorination is preferred at a lower pH where the more germicidal HOCl is present.
B. Sodium Hypochlorite
Sodium hypochlorite is an aqueous solution produced by dissolving chlorine gas in a sodium hydroxide solution. The sodium hypochlorite solution typically contains 12.5% available chlorine with one gallon being equivalent to one pound of chlorine. When sodium hypochlorite is added to water, hypochlorous acid is produced:
NaOCl + H2O → HOCl + Na+ + OH-
XXX-XXXX-XXX / Date / 4

This reaction is similar to the chlorine gas reaction except a hydroxl ion (OH-) is produced as well. The hydroxyl ion will increase the pH.
C. Calcium Hypochlorite
Calcium hypochlorite is a granular solid formed from the reactions of chlorine gas and a solution of calcium oxide and sodium hydroxide. Granular calcium hypochlorite contains 65% available chlorine making 1.5 pounds equivalent to one pound of chlorine. When calcium hypochlorite is added to water, hypochlorous acid is produced:
Ca(OCl)2 + 2H2O → 2HOCl + Ca2+ + 2OH-
Just like the sodium hypochlorite reaction, the hydroxyl ions produced will increase the pH of the water.
D. Application
DRAFT Chlorine has several possible application points. Application at the raw water intake is used to control biological growth, disinfect, oxidize iron, manganese, and hydrogen sulfide, and control taste and odor. When chlorine is applied before filters, its main purposes is to disinfect, control biological growth in the filter, provide taste and odor control, control algae, remove color, and oxidize iron and manganese. Chlorine is applied at the clearwell to provide disinfection and maintain a residual in the distribution system.
Ideal conditions for pathogen inactivation are high chlorine residual, long contact time, high water temperature, low pH, low turbidity, and an absence of interfering substances. It is also ideal that there is initially good mixing to disperse the chlorine rapidly within the treated water followed by a plug flow reactor, which minimizes mixing for the best contact time.
1. Dosage
The chlorine dosage will first satisfy the chlorine demand. The remaining chlorine after the demand is satisfied is the chlorine residual that is measured and used in calculations. Concentration-time (CT) calculations will determine the residual needed to achieve 4-log disinfection of viruses, or determine whether additional storage is needed when the residual required is undesirably high. Only chlorine analyzers using EPA approved methods are acceptable to the Department to measure chlorine residuals.
2. Contact Time The contact time is the amount of time the disinfectant is in contact with the water. The contact time is inversely related to the flow rate – the higher the flow rate for a given volume, the lower the contact time.
XXX-XXXX-XXX / Date / 5
The geometry of the contact basin dictates the baffling factor that is assigned to the disinfection segment. Agitated basins, or basins with low length to width ratios have low baffling factors, while plug flow reactors with length to width ratios greater than 40 have very high baffling factors. The baffling factor is used to calculate an effective contact time. Effective contact time should be used in calculations to determine the log removal of the disinfectant. The most accurate method of determining effective contact time is a tracer study. The design standard for chlorine disinfection calls for a minimum contact time of 20 minutes. The Groundwater Rule was designed with this in mind – a 20 minute contact time with a chlorine residual of 0.4 mg/L results in 4-log inactivation of viruses.
DRAFT However, some older, existing systems may not have 20 minutes of effective contact time. In order to allow for these situations, the regulation allows for higher chlorine residuals to be used. For example, an existing system with 14 minutes of effective contact time would be able to provide a 4-log inactivation of viruses with a chlorine residual of 0.6 mg/L. In order to use a residual other than 0.4 mg/L, the system must obtain an amended operating permit which specifies the required chlorine residual.
New systems and systems needing construction to comply with the regulation should comply with the design standard of 20 minutes of effective contact time.
3. pH
The pH of the water will determine how much HOCl and OCl- are present. The concentration of HOCl will be greater at lower pH, while the concentration of OCl- will be greater at higher pH. Since HOCl is a stronger disinfectant, a lower pH is preferred for greater inactivation of viruses.
Chlorine gas and hypochlorite will equally disinfect at the same pH. Using sodium hypochlorite or calcium hypochlorite as disinfectants will increase the pH of the water. Chlorine gas will decrease the pH of the water. Without pH adjustment the chlorine gas will disinfect more effectively. The highest pH of the water entering the public water system should be used in log inactivation calculations.
4. Temperature There is a direct correlation between temperature and virus inactivation. The virus inactivation increases as the temperature increases. When the temperature decreases the chlorine concentrations must be adjusted to maintain adequate
XXX-XXXX-XXX / Date / 6

disinfection. The lowest temperature the water system encounters should be used in 4-log calculations. The default temperature on the GWR 4-Log Treatment Demonstration spreadsheet is 5oC. To use an alternative temperature, the system should submit daily temperature readings from the three coldest months of the year to determine the lowest temperature the water encounters while leaving the storage tank.
E. Disinfection
DRAFT
Chlorine is one of the most effective methods used to achieve 4-log treatment of viruses. The effective contact time and the chlorine residual are used to determine CT in 4-log calculations. All community water systems and some non-community water systems will need to comply with 4-log treatment of viruses standards. These systems must submit schematics and Department-approved forms and spreadsheets to the Department. Community water systems (CWS) 4-log submittals should refer to Appendix A: CWS Demonstration of 4-Log Treatment of Viruses for Groundwater Sources. Non-community water systems (NCWS) 4-log submittals should refer to Appendix B: NCWS 4-Log Treatment of Viruses for Groundwater Sources Permit.
Both calcium hypochlorite and sodium hypochlorite solutions are fed by means of a diaphragm-type metered solution pump. The powder or the liquid is diluted with water in a solution to a predetermined strength.
Chlorine gas is fed through vacuum controlled chlorinators. This allows the gas to only be released when a vacuum is present, injecting the gas into a stream of water. The solution of chlorine and water is then conveyed to the point of application. A typical chlorinator has a pressure-reducing valve to lessen the pressure, a rate valve and rate meter to control the rate of flow, and a valve which shuts off the supply of chlorine gas when a vacuum is not present.
XXX-XXXX-XXX / Date / 7

III. Calculation of Volume
DRAFT
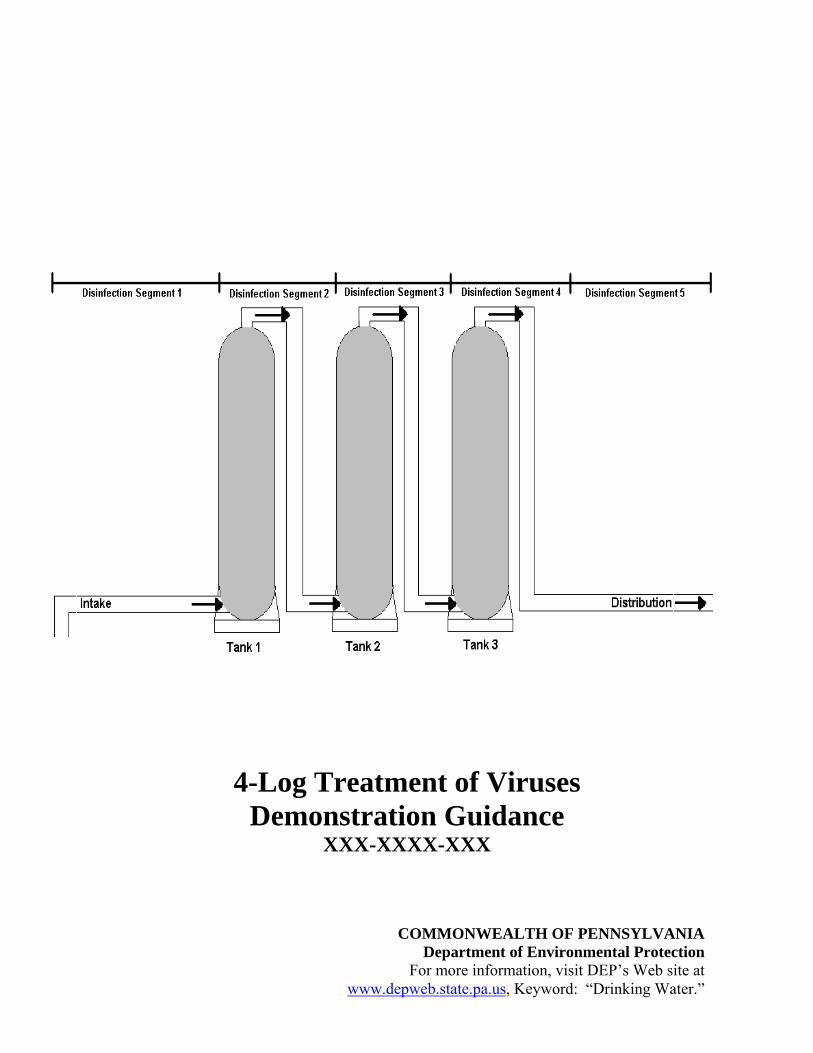
The volume of the disinfection segment is needed for CT calculations to determine contact time. A disinfection segment is a section of a treatment system beginning at one disinfectant injection or monitoring point and ending at the next disinfectant injection or monitoring point. The volume used should be the low water operating level in the tank. If the storage vessel is pressurized the volume does not change. Commonly used segment shapes are shown below:
A. Sphere
v = volume π = 3.14159 r = radius d = diameter
3
34 rv π= or
6
3dv π=
B. Box
l = length h = height w = width
hwlv ××= C. Cylinder
v = volume h = height π = 3.14159 r = radius d = diameter
XXX-XXXX-XXX / Date / 8

hrv 2π= or
4
2 hdv π=
D. Half-sphere
v = volume π = 3.14159 r = radius d = diameter
3
32 rv π= or
12
3dv π=
D AFTR E. Cone
v = volume h = height π = 3.14159 r = radius d = diameter
3
2 hrv π= or
12
2 hdv π=
F. Partially Filled Horizontal Cylinder
v = volume h = height π = 3.14159 r = radius l = length
( ) ⎥⎦
⎤⎢⎣
⎡−−−⎟
⎠⎞
⎜⎝⎛ −
= − 212 2cos hrhhrr
hrrlv
XXX-XXXX-XXX / Date / 9

IV. Selection of Baffling Factor
The assigned baffling factor (BF) is used to determine the effective contact time of the disinfection segment. The baffling factor will determine the actual residence time within the contact basin before passing through the segment. To calculate the effective contact time using a baffling factor, determine the segments characteristics most closely related to the diagram in Appendix E: Groundwater Rule 4-log Treatment Demonstration. The baffling conditions include: no contact time, unbaffled, poor, average, superior, near-plug flow, or plug flow. When attempting to decide between two baffling condition that could apply to a segment, the condition presenting the worst case baffling factor should be used. This conservative approach will ensure the effective contact time is not being overestimated. If the designer or operator wishes to obtain the most accurate determination of disinfectant contact time, a tracer study could be performed to eliminate any discrepancies. To conduct a tracer study refer to the information provided in Appendix C: Public Water System Tracer Study Demonstration. The tracer study method will be more costly and labor intensive than applying a baffling factor, but will give the most accurate result for effective contact time.
DRAFT The effective contact time is designated T
A. Determining Contact Time Using Baffling Factors
10 and is the time required for 10% of the water to pass through the unit. To determine the effective contact time, first find the volume of a unit (V) and divide the volume by the peak hourly flow rate (Q). Then multiply the result by the baffling factor (BF) that is taken from the baffling factor diagram that can be found in Appendix E: Groundwater Rule 4-log Treatment Demonstration. The effective contact time in the following equation is an estimate since the baffling factor is assigned based on physical characteristics of the vessel and not verified by a tracer study:
BFQVTimeContactEffectiveT ×==10
Increasing the baffling factor will reduce the residual needed to maintain 4-log inactivation of viruses at a given contact time. As previously stated, new systems and systems needing construction to comply with the regulation should comply with the design standard of 20 minutes of effective contact time. Only existing systems not needing construction should be allowed to use less than 20 minutes of effective contact time to provide disinfection using chlorine.
B. Prefabricated Tank Design with Baffling Factor Designation
Manufacturers wishing to have their tank design assigned a baffling factor by the Department may do so by submitting two tracer studies conducted by third parties. These tracer studies need to be completed by a licensed engineer and conform to the Department’s Public Water System Tracer Study Demonstration in Appendix C. The lowest value of the two studies shall be used for the baffling factor. The Department will maintain and make available to the public a list of approved tank designs with
XXX-XXXX-XXX / Date / 10

corresponding baffling factors. This list may be found at http://www.depweb.state.pa.us/ keyword Groundwater Rule. Submittals may be sent to: Bureau of Water Standards and Facility Regulations Division of Planning and Permits P.O. Box 8774 Harrisburg, PA 17105-8774
DRAFT
XXX-XXXX-XXX / Date / 11
V. Chemical Disinfectants Not Suitable for 4-log Inactivation of Viruses
Many chemicals are used as disinfectants. Some, including chloramines, chlorine dioxide, peroxone, and potassium permanganate, have limitations for 4-log inactivation of viruses. Most of them are used as secondary disinfectants and to reduce disinfection by-product precursors. Iodine should not be used as a disinfectant for any PWS.
D
Chloramines shoan exceptional arequired to achie(MRDL). For tammonia is typicrequirements are
Chlorine Dioxide
The use of chlorine dioxide as the sole disinfectant to achieve 4-log
Peroxone
Peroxone is one of the most powerful oxidants that can not be used to achieve 4-log virus inactivation credreactive they doand no equivalengiven.
D. Iodine
an not be used for 4-log treatment for multiple reasons. Firstly, EPA does not have standard CT tables for iodine. In addition, too much iodine uptake can cause vast health problems.
E. Potassium Perm
A. Chloramines
uld not be used for primary 4-log inactivation of viruses. They require mount of contact time to meet EPA CT requirements. Also, the residual ve 4-log inactivation is above the Maximum Residual Disinfectant Level hese reasons, chloramines are used only for secondary disinfection as ally added after chlorine has been introduced into the system and the CT fulfilled.
B.
RAFT inactivation of viruses is not recommended as it is volatile and high dosages above the MRDL may be needed to comply. Chlorine dioxide dosages above 0.4 mg/L tend to produce taste and odor problems. Water with a high oxidant demand will make it hard to achieve finished water below the MRDL of 0.8 mg/L. The EPA total concentration limit on chlorine dioxide, chlorite, and chlorate is 1.0 mg/L as Cl
2. Since chlorine dioxide is a gas and does not chlorinate the water, removal by the filters in the treatment process is a possibility. This will require reapplication or use of another disinfectant to carry a residual throughout the distribution system.
C.
it. The peroxonation process produces hydroxyl radicals that are so not leave a measurable residual. There is no method to measure them t CT table to determine their log inactivation, therefore no credit can be
Iodine c
anganate
XXX-XXXX-XXX / Date / 12

DRAFT
l not be a viable option for primary or secondary disinfection with the groundwater rule. Large doses and long contact times are required to inactivate viruses. High dconsistent CT tapotassium permahours, leaving th
Potassium permanganate wil
osages will leave an undesirable pink color to the water. There are no bles developed for potassium permanganate. The fast reaction rates of nganate would consume any residual in the distribution system within e system without a disinfectant residual.
XXX-XXXX-XXX / Date / 13

D
The regulatory bthe LT2 Rule, limitations assoc One significant requirement which must be satisfied for membrane processes is that the removal efficienproduct-specificproduct-specifictesting organizattesting and are vcredit that a meefficiency demobe verified by a The other major integrity testing. an ongoing basis n with system operation. Daily direct integrity testing is performed for th s purpose, with a pressure decay test being a commonly used method. Membrane systeintegrity testing. test methods whtesting being comtest. Marker-basmembrane integtesting. The Depmembranes ineff Indirect integritdirect integrity tthough it is a lesensitive direct Filtration Guida
B. Limitations Associated with Virus Removal
Membrane filtradisinfection optiprohibit their im With no non-de here is a limited set of methods available to verify membrane technology. The Department would
erification Testing completed:
RAFT m racks/trains must be taken off-line in order to perform this direct There are currently no non-destructive, pressure based direct integrity ich are able to detect a virus-sized breach. With successful challenge
pleted systems may chose to perform a marker-based direct integrity ed tests utilize either a spiked particulate or molecular marker to verify rity by directly assessing removal of the marker, similar to challenge artment will only accept particulate marker based tests due to the porous iciently removing molecular markers.
y monitoring, typically filtrate turbidity monitoring, complements the esting. The indirect integrity monitoring can be conducted continuously, ss sensitive way of detecting integrity breaches compared to the more integrity testing. Additional EPA guidance can be found in Membrane nce Manual (EPA 815-R-06-009).
VI. Membranes
A. Key Regulatory Requirements
asis applicable to membrane filtration processes actually is addressed in and not the Groundwater Rule. Some current membrane filtration iated with virus removal are described later in this section.
cy, or maximum log removal value, must have been determined through challenge testing. The challenge testing is intended to be a one-time, test, and must have been conducted by a DEP-approved third party ion. Removal credits are based on system performance during challenge erified on-site through direct integrity testing. The maximum removal mbrane process can receive is the lower value of either the removal
nstrated in challenge testing, or the maximum log removal value that can direct integrity test used on-site to gauge process performance.
requirement associated with these processes involves direct and indirect Log removal credits granted to a membrane process must be verified on in conjunctioi
tion is identified by EPA in the Groundwater Rule as an alternative on. However, there are some underlying limitations currently serving to plementation for purposes of virus removal.
structive continuous direct integrity tests available to date, t
like to see the following aspects of Membrane V
XXX-XXXX-XXX / Date / 14

D
• Membr• Cleanin• Finishe• Maxim• Membrane integrity testing • Data ha• QA/QC• Microb
The mem ll conclude all verification testing over a 30 day per . ting membrane products is the ETV Protocol for Equipment Verification Testing for Physical Removal of Microbiological and Particulate Con min Membrane Filtration Guidance Manual (EPA 815-R-06-009) provides an excellent source of information on challenge and integrity testing.
C. 4-L Re f Viruses Usage
With membrane filtration there is no set formula to achieve a given log removal of viruses. The chaof the membranewater quality dointegrity may hav
1. Challeng
The purpose of challenge testing is to determine the maximum log removal value
ed to an individual membrane. Once a LRV is established through challenge testing, additional challenge testing is not needed unless siseven asp • Ful
conconstruction of the proposed membrane modules to be used in the full-scale treatment facility.
• Appropriate challenge particle: The testing must be done with a challenge
ble of discretely quantifying the specific particulate.
ane flux and recovery g efficiency d water quality um pore size reporting
ndling protocol ial removal
brane verification process sha
iod An acceptable protocol for tes
ta ants (USEPA). The USEPA
RAFT llenge testing and direct integrity testing will determine the log removal . The indirect integrity monitoring is to ensure the membrane filtrate es not degrade below a set threshold signaling that the membrane e been compromised.
e Testing
og moval o
(LRV) that may be award
gnificant modifications are made to the membrane process. There are ects of the challenge testing.
l-scale vs. small-scale module testing: Challenge testing must be ducted on a full-scale membrane module identical in material and
particulate that is capable in being removed no more efficiently then a virus sized particle. Since the size of the adenovirus is between 0.06 and 0.09 microns, the Department suggests using a challenge particle of 0.08 microns. Samples of the feed and the filtrate must have their concentrations determined using a method capa
XXX-XXXX-XXX / Date / 15

D
llowing equation:
•
• alculation of removal efficiency: The removal efficiency is expressed as
• Challenge particulate concentrations: The maximum allowable feed water concentration used during a challenge test is based on the detection limit of the challenge particulate in the filtrate and must be determined according to the fo
Maximum Feed Concentration = (3.16 x 10⁶) * (Filtrate Detection Limit)
Test operating conditions: The testing must be conducted under representative hydraulic conditions at the maximum design flux and maximum design system recovery specified by the membrane module manufacturer. Cthe LRV according to the following equation:
( ) ( )pf CCLRV loglog −=
RAFT
where: LRV = log removal value established by challenge testing
C = filtrate concentration
removal efficiency is expressed as LRVC-Test.
must be applied to each mbrane module that did not undergo challenge testing in
cy. A quality control release value QCRV) must be established for the NDPT that is directly related to the
removal efficiency of the membrane filtrati ed testing. Membrane modules that do not meet the
established QCRV are not elig redit demonstrated during challenge testing.
•
would require additional challenge testing to both demonstrate the removal efficiency of
Modumodu
2. Direc
Cf = feed concentration p
Equivalent units must be used for both the feed and filtrate concentrations for the equation to be valid. A single LRV is calculated for each module and the overall
• Verifying characteristic removal efficiency for untested modules: A non-destructive performance test (NDPT) production meorder to verify virus removal efficien(
on process as demonstratduring challenge
ible for the removal c
Module modifications: Any significant modification to the membrane media, hydraulic configuration, or any other modification that could potentially affect removal efficiency or NDPT parameters
the modified module and define a new QCRV for the NDPT.
le selection for challenge testing should be done randomly of membrane les from several manufactured lots according to a statistical sample design.
t Integrity Testing
XXX-XXXX-XXX / Date / 16

DRAFT Sensitivity: The direct integrity test mu
Any criter ity, and frequency. There are currently no non-destructive, pressure based direct integrity test methods which are able to detect a v sto veto chsumm
• Resolution: The direct integrity test must be responsive to an integrity
For pressure-based direct integrity testing, the procedure in the Membrane
Manual (EPA 815-R-06-009) is applicable. The resolution should be recalculated if the system backpressure is adjusted
can be established through any accepted methodology such as size distribution analysis of particulate markers.
• st be able to verify a LRV equal to
or greater than the removal credit awarded to the membrane filtration
or pressure-based direct integrity testing, the procedure in the Membrane
direct integrity test for compliance must meet the specified performance ia for resolution, sensitiv
iru -sized breach. Therefore, marker-based direct integrity testing may be used rify membrane integrity by directly assessing removal of the marker, similar allenge testing. The performance criteria for direct integrity tests are arized as follows:
breach on the order of 0.08 um or less.
Filtration Guidance
during direct integrity testing. A marker based direct integrity test can use particulate surrogates, but the surrogate must meet the resolution criterion. The conservative guidelines for challenge testing surrogate selection apply here for the selection of an appropriate surrogate for a marker-based direct integrity test. The effective size of the marker
process. The maximum removal credit that a membrane can receive is the lowest of the LRV of the challenge test and the LRV of the direct integrity test.
FFiltration Guidance Manual (EPA 815-R-06-009) is applicable. The sensitivity for a marker-based direct integrity test is determined via a straightforward LRV calculation similar to that during challenge testing:
( ) ( )pfDIT CCLRV loglog −=
integrity test sensitiv
=
where: LRVDIT = direct ity in terms of LRV
Cf
fee
XXX-XXXX-XXX / Date / 17

DRAFT
con
ration
The day-to-day LRV is likely to vary during system operation due to the variability in dosing the marker. A sufficient conservative feed concentration must be utilized to demonstrate the required LRV forcompliance. An accurate analytical method with a wide dynamic range is
d
cent
Cp = filtrate concentration
XXX-XXXX-XXX / Date / 18

DRAF
desired to quantify the feed and filtrate concentrations since the feed and filtrate concentration differ by orders of magnitude.
• Frequency: A direct integrity test must be conducted on each membrane
unit at a frequency of no less than once each day that the unit is in operation.This testing should be conducted at the same time each day to maintain a consistent time interval between testing. The Department reserves the right to increase or decrease direct integrity testing frequency.
Control limits shall be established to identify any potential problems with the membrane’s integrity. If the upper control limit (UCL) is exceeded, the membrane must be taken offline for diagnostic testing and repair. Forpressure-based testing, the UCL is typically the maximum pressure drop at aminimum test starting pressure. For marker-based testing, the UCL is the LRV credit awarded by the state. Marker-based tests are advantageous in that they provide a direct assessment of the LRV achieved by the process. The challenge testing methodology is a good starting point to design a marker-basedinert and suitable for use in a water treatmenFDA and NSF.
3. Indirect Integrity Testing
Continuous filtrate turbidity monitoring must be cunit with a control limit specified by DEP. The memonitored independently for each membrane in monitoring consists of tests being performed at lReadings that exceed the control limit for greaterdirect integrity testing. All test results above triggering direct integrity testing must be reportmonthly basis.
The Department control limit. Tw iltrate turbidity readings above 0.05 NTU on any membrane
T test. Markers used must be t facility as approved by the
onducted on each membrane mbrane unit effluent must be operation. The continuous
east once every 15 minutes. than 15 minutes will trigger the established control limit ed to the Department on a
will accept 0.05 NTU as the o consecutive f
unit trigger immediate direct integrity testing on that unit. Ultra sensitive turbidity meters are available, such as laser turbidimeters, that have sensitivities accurate to +0.001 NTU. The measurement of turbidity must meet USEPA approved analytical methods. These are as
• •
follows:
Hach FilterTrak Method 10133 Great Lakes Instrument Method 2 (GLI2)
XXX-XXXX-XXX / Date / 19

DRA
• • tion of Turbidity by Nephelometry
The Dalternsensi0.06
Standard Method 2130B, Turbidity – Nephelometric Method USEPA Method 180.1, Determina
epartment will not accept particle counting and particle monitoring as an ative to turbidity monitoring. Particle counting testing equipment is only
tive to 2 microns, which is larger than typical adenovirus sizes ranging from – 0.09 microns.
FT
XXX-XXXX-XXX / Date / 20
DRAFT
VII. Ultravio
A. Requirements
1. Validation Testing
UV reactors must have undergone third party biodosimetry-based validation prior to being approved for use. The specific model proposed for installation must have been validated per an acceptable protocol and be accompanied by a validation report.
Reactor validation involves full-scale unit testing and demonstrated inactivation of an appropriate challenge microorganism. It is used to determine the range of operating conditions that a water system can monitor to insure that the UV dose required for a particular pathogen inactivation credit is being delivered.
The following are acceptable validation protocols:
• US EPA Ultraviolet Disinfection Guidance Manual (UVDGM)
(Publication EPA 815-R-06-007) • German Guideline DVGW W294 • Austrian Standard ONORM M 5873-1, M 5873-2
It must be noted that there are differences between these validation test procedures, and actual reactor dose monitoring strategy and operating limits will depend on protocol used to validate it. Additional details on design and reactor validation requirements are covered in EPA’s Ultraviolet Disinfection Guidance Manual (EPA 815-R-06-007). It should further be noted that the German and Austrian standards are designed to validate reactors at only one dose – 40 mJ/cm2.
2. Practical Limitations
The overriding issue currently serving to limit the use of UV disinfection as a four-log virus treatment option is associated with the required validation challenge organism. EPA has stipulated that adenovirus must be used as the virus challenge organism. The resulting dose needed to produce four-log adenovirus inactivation is 186 mJ/cm2, which is extremely high. The use of UV for virus inactivation with the groundwater rule only assigns a 0.5 log credit for reactors validated under the German or Austrian Standards. In order to achieve greater than 0.5 log virus inactivation, the reactor must have been validated for virus inactivation in accordance with the Ultraviolet Disinfection Guidance Manual (EPA 815-R-06-007).
let Light (UV)
XXX-XXXX-XXX / Date / 21

DRAFT
According to the preamble to the Groundwater Rule (71 FR 65604), UV reactors
ed in series, or in combination with other inactivation or removal technologies to provide a total 4-log treatment of viruses. According to the
ion Guidance Manual (EPA 815-R-06-007), if reactors are installed in series, the piping between the reactors should conform to the
used in series must necessarily be limited by the validation. Units not validated to 4-log inactivation of viruses, but validated to the German or Austrian
B. Unit Operation
An inst reactor must operate within appropriate validated ranges in order to produce treated wat c o different UV dose moni actors and maintain the required dose at or near a specified value via dose delivery monitoring. These are the intensity setpoint method and e ing method selection depends on factors such as the rotocol used to validate the reactor and the size of the planned installation. There e several factors that must be monitored on a daily basis, regardless of the monitotransmiother inumberinforma the system for three years, and should be made available to the Department upon request. Monthl requirements which must be met in order for the system to receive pathogen inactivation credits, in this case virus credits
ent demonstration in conjunction with the GWR. The Department has monitoring forms for this information. Forms should be sent to the appro Requ
• •
• ary of key operating parameters
may be install
Ultraviolet Disinfect
specifications provided by the UV reactor manufacturer. The piping should be inspected to ensure compliance with the manufacturer’s specifications.
UV units
Standard of 40 mJ/cm2 would need 5 units in series to achieve a 4-log inactivation. Units not validated to 4-log inactivation of viruses, but validated to 100 mJ/cm2 would need 2 units in series to achieve a 4-log inactivation.
alleder lassified as being within specification. There are currently tw
toring methods used to control re
th calculated dose method. Monitorp
arring method. These are the flow rate, lamp status, UV intensity, and UV ttance of the water. Systems using the calculated dose method must also record nformation essential to calculating the dose, including lamp power level and of banks in operation. The Department has monitoring forms for this tion. Forms should be kept by
y operational monitoring and reporting are other
applicable for four-log treatm
priate district office.
ired monthly reporting information will include the following:
Calculated percentage of off-specification water produced
Results from UV intensity sensor / UVT analyzer calibration checks (depending on the applicable dose monitoring method)
Summ
XXX-XXXX-XXX / Date / 22

DRAFT e. The biodegradability of non-organic matter increases as the large organic molecules verted into smaller molecules that are readily biodegradable. The further downstream the is fed; the less ozone demand and byproduct formation there will be. This will allow for anics that are partially oxidized to be further reduced with biological filtration.
ion will impact other water treatment processes. The ozone increases biodegradab
VIII. Ozone
Ozone is abldisinfectantseffectivenessno residual disinfectant i Utilizing ozone for primary disinfection will reduce precursors allowing for reduced DBP formation wwhen oxidizmanganese rdestroying ta
atter, pH, and alkalinity will determine ozone’s effectiveness. Ozone is most the plant or after sedimentation. Ozone placement upstream of
crease microbiological activity and dissolved oxygen concentration levels increasare conozone the org Ozonat le organic matter (BOM), reacts with chlorine, chlorine dioxide, and chloramines, reduces DBP precurs With adetermozone value. of brom
A.
a large input of energy. The most common method of generating ozone is corona discharge. It can also be generated
taining gas and UV, and electrolytic reactions.
Four basic components are needed for ozone treatment at a water plant.
1. Gas feed
A gas feed system
e to achieve disinfection with less contact time and lower concentration than weaker such as chlorine, chlorine dioxide, and chloramines. With ozone’s high germicidal it can be used as a primary disinfectant but not a secondary disinfectant as it carries in the distribution system due to rapid decomposition. The use of a secondary s required ensure a complete disinfection system.
ith secondary disinfection. Iron and manganese will precipitate out as hydroxides ed. Over dosing the ozone will have no effect on the iron but will re-solubilize equiring it to be reduced to manganese dioxide. Another good use for ozone is ste and odor compounds since they are resistant to most oxidation methods.
The organic mefficiently fed at the head offiltration will in
ors and lowers chlorine, chlorine dioxide, or chloramine demand in finished water.
n ozone system, the liquid and gas phases of the operation need to be analyzed to ine the applied ozone dosage, ozone transfer efficiency, and the residual ozone level. The residual is measured in the water while it exits the ozone contactor to determine the CT The DBPR requires systems using ozone to monitor for bromate resulting from oxidation ide.
Unit Operation
Due to its rapid decomposition, ozone needs to be generated at the point of application. The generation of ozone is an endothermic reaction requiring
electrolysis of sulfuric acid, irradiation with O2 con
is used to provide a clean, dry source of oxygen to the ozone
XXX-XXXX-XXX / Date / 23

DRAFT
generator through o . 2. Ozone generator
The ozone contactor provides contact time, with the ozone rich gas, for
tem is used, since ozone gas is fatal at the levels present in the contactor. The gas is
zone as the only disinfectant. Ozone treatment is commonly used for bottled water and vended
o be submitted:
Log inactivation calculation using 4-log inactivation of virus tables published by EPA
d/or data to support the minimum water temperature used. • Justification and/or data to support the peak water flow. • Justificat
contact ti• Equipme• Descript
.1
Turbine Co-Current Flow Flow Flow
an xygen feed system or an air feed system
The ozone generator creates O3 for use in the ozone contactor.
3. Ozone contactor
disinfection by the use of bubble diffuser contactors, injectors, and turbine mixers. 4. Off-gas
An off-gas destruction system is required, unless an off-gas recycling sys
converted into oxygen before being released into the atmosphere. B. 4-Log Inactivation of Viruses Usage
A PWS can achieve 4-log inactivation of viruses using ozone. but a secondary disinfectant will be required as there will be no residual in the distribution system. The ozone decays very quickly and does not carry a residual long enough to utilize o
water systems, retail water facilities and bulk water hauling systems (BVRB). To demonstrate 4-log inactivation with ozone the following information needs t
• System schematic which identifies the point of ozone application, the contact time
vessel, and the entry point (or the point(s) where compliance monitoring will be conducted to verify the ozone residual).
•
• Justification an
ion and/or data and/or a contact vessel schematic to support the effective me used in the CT calculation. nt specifications used to monitor ozone residual. ion of how flow configuration was considered when calculating CT
TABLE 8Flow Configuration
Counter-Current Reactive
First Chamber C Partial Credit Partial Credit Not Applicable
XXX-XXXX-XXX / Date / 24

D
All Other Chambers C = (Cout + Cin) / 2
C = CoutC = Cout
C = Coutor C = Cout / 2
RAFT
XXX-XXXX-XXX / Date / 25

DRAFT
IX. onitori
Co onitoring is done to ensure a GWS is consistently and effectively providing at lea tmen es when requ to under the G ule. A ill be provide 4-log trea onduct compliance monitoring. NCWSs may choose to provide 4-log treatment of viruses, thus being required to provide compliance monitoring as well. Compliance monitoring is necessary if 4-log treatment of virus is required as a corrective action. Community groundwater systems providing 4-log treatment of viruses begin compliance monitoring according to their population served. Systems serving more than 500 people must begin no later than April 1, 2011. Systems serving 100-500 people must begin no later than April 1, 2012. Systems serving less than 100 people must begin no later than April 1, 2013. New groundwater sources must provide and begin compliance monitoring within 30 days of these dates. Once a GWS notifies the Department in writing 4-log treatment of viruses is provided before or at the first customer, the system must begin compliance monitoring at the Department approved location no later then 30 days after notification. While conducting compliance monitoring the GWS will not have to conduct triggered source water monitoring. The written notification to the Department must include all information requested by the Department bearing the proper signatures or seals (i.e. system schematic, appropriate CWS or NCWS form, 4-log spreadsheet or 4-log worksheet or tracer study).
A. Chemical Disinfection
When chemical disinfection is being monitored the results shall be expressed as free chlorine. The state default free chlorine residual is 0.40 mg/L unless the GWS receives an approved alternative residual by the Department.
1. Serving More than 3,300 People
Systems serving more than 3,300 people must conduct compliance monitoring by continuous disinfectant residual monitoring methods that are approved by the EPA. The lowest residual for the day is recorded and submitted to the Department. If the continuous monitoring equipment fails, grab samples must be conducted at least every 4 hours until the continuous monitoring equipment is returned to service. The equipment must resume continuous monitoring within 14 days.
2. Serving 3,300 or Fewer People
Systems serving 3,300 people or less must conduct compliance monitoring with daily grab samples during the hour of peak flow. The lowest daily residual is recorded and submitted to the Department. If the residual falls below the Department minimum residual follow-up samples must be taken at least every 4 hours until the residual meets
Compliance M ng
mpliance mst 4-log trea required to
t of virus ired roundwater R ll CWSs wtment of virus and c
XXX-XXXX-XXX / Date / 26

DRare not required to maintain a disinfectant residual if there is no underground plumbing following treatment. Systems may remove the disinfectant residual from the water prior to serving. Even if a chemical disinfectant was used and the residual is removed, a noncommunity system or a BVRB system must still test the finished water for TTHM and HAA5. AFT
or exceeds the specified m ay use continuous monitoring and is held to the same requirements as systems serving more than 3,300 people.
y systems must maintain a residual of 0.4 mg/L as chlorine, or equivalent. Community systems may demonstrate that they are capable of 4-log
Noncommunity water systems and BVRB systems that demonstrate 4-log treatment
that systems must be able to show that the system is maintaining
the required treatment. This implies that a clearly identified monitoring point is required prmay be usemedium foused to rem nt residual, a method of disinfection with low or no residual should be used, such as UV or ozone.
3. Analytical Methods
ems conducting disinfectant residual monitoring for the Groundwater Rule should adhere to Method 334.0.
This method can be found at:
inimum residual. The system m
B. Disinfectant Residuals
1. Community Systems Communit
treatment of viruses at a different chlorine residual. In this case, the system must amend their operating permit to allow the use of a chlorine residual other than 0.4 mg/L, and the systems must maintain the residual specified in their permit.
2. Noncommunity Systems and BVRB Systems
It should be noted,
ior to the removal of the disinfectant residual. Granular activated carbon d to remove the disinfectant residual, but, since carbon is a growth r bacteria, post-carbon disinfection should be used. Since the carbon is ove the disinfecta
Section 304(a) of Pennsylvania’s Chapter 109 Safe Drinking Water regulations requires that sampling and analysis be performed in accordance with analytical techniques adopted by the EPA. On November 10, 2009, EPA published Method 334.0, “Determination of Residual Chlorine in Drinking Water Using an On-Line Chlorine Analyzer”. To ensure compliance, syst
http://epa.gov/safewater/methods/pdfs/methods/met334_0.pdf
XXX-XXXX-XXX / Date / 27

DR
C.
treatment technologies alone or in combination with other
technologies to reliably achieve 4-log treatment of viruses if they are approved by the s ecified compliance monitoring requirements.
1. Membrane Filtration
Systems choosing to use m nother technology in addition to m y direct integrity testing (with at membranes are capable of g ent will not award 4-log virus ther membrane filtration information can be found in EPA guidance: Membrane Filtration Guidance Manual, EPA 815-R-06-009.
2. Ultraviolet
Systems choosing to use UV of the reactor. The UV dose mu od or the calculated dose method. Wit assigned with the use of l . Medium-pressure UV syste lidated for virus inactivation in accordance with the EPA protocol in order to be awarded UV inactivation credits. Further UV information can infection Guidance Manual, EPA 815-R
3. Ozone
Bottled water and vended w hauling systems (BVRB) usdaily samples during the ho recorded and submitted to th the Department minimum ozone st every 4 hours until the residu
Alternative Treatment Technologies
Systems may use alternative
Department and follow state p
AFT disinfection will need to undergo validation testing st be monitored by the intensity setpoint methh the groundwater rule, only a 0.5 log credit may beow-pressure UV systems validated at 40 mJ/cm
embrane filtration typically need to use aembrane filtration. Until challenge testing and dail a resolution of 0.08 μm or less) both show th
reater than 4-log removal of viruses, the Departmremoval credit for membrane technologies. Fur
2
ms must be va
be found in EPA guidance: Ultraviolet Dis-06-007.
ater systems, retail water facilities and bulk watering ozone must conduct compliance monitoring with ur of peak flow. The lowest daily ozone residual ise Department. If the ozone residual falls below residual, follow-up samples must be taken at leaal meets or exceeds the specified minimum residual.
XXX-XXXX-XXX / Date / 28

XXX-XXXX-XXX / Date / 1
CW Attached is the CW (3800-FM-WSFR0470). The instructions should be fo and return this form to comply with 4-log
ent. The document is divided into 3 se Section 1 – General Information
Section 3 – Com
ppen A SFR0470a - d
Appendix A
S Demonstration of 4-Log Treatment of Viruses for Groundwater Systems
S 4-log demonstration formllowed by all CWSs to complete
treatm ctions beginning with a set of instructions:
Section 2 – Checklist of Enclosures
pliance Monitoring of Entry Point Free Chlorine Residual
A dix consists of documents 3800-FM-W

XXX-XXXX-XXX / Date / 2
Appendix B
NCWS 4-Log Treatment of Viruses for Groundwater Sources Permit Attached is the NCWS 4-log permit (3800-FM-WSFR0149). The instructions should be followed by all NCWSs to complete and return this form to comply with 4-log treatment. The document is divided into 5 sections beginning with a set of instructions: Section 1 – General Information Section 2 – Checklist of Enclosures Section 3 – Disinfection Section 4 – Storage Section 5 – Compliance Monitoring of Entry Point Free Chlorine Residual Appendix B consists of documents 3800-FM-WSFR0149a & b

XXX-XXXX-XXX / Date / 3
64). n.
ents
Appendix C consists of documents 3800-FM-WSFR0464a & b
Appendix C
Public Water System Tracer Study Demonstration Attached is the Public Water System Tracer Study Demonstration form (3800-FM-WSFR04Follow the form to submit a tracer study to the Department for 4-log treatment of virusescompliance. Follow the instructions for the 6 sections to complete the form for submissio Section 1 – General Information Section 2 – Certification and Signatures Section 3 – Tracer Chemical Section 4 – Disinfection Segm Section 5 – Tracer Study Methodology Section 6 – Calculations

XXX-XXXX-XXX / Date / 4
Chlorine De em’s Entry Point and First Customer
s ent of viruses
ompliance. The document is divided into 6 sections for submission.
ection 1 – General Information
ection 2 – Determination of Sampling Parameters and Data Collection Procedure
ection 3 – Flow Meter with Totalizer Method
ection 4 – Calculated Downstream Sample Time Method
ection 5 – Chlorine Degradation Study Data Sheet and Analysis of Results
ection 6 – Certification and Signatures
Appendix D consists of documents 3800-FM-WSFR0139a & b
Appendix D
gradation Study – Quantifying Chlorine Residual Loss Between a Syst
Attached is the Chlorine Degradation Study form (3800-FM-WSFR0139). Follow the guidelineto submit a chlorine degradation study to the Department for 4-log treatmc S S S S S S

3800-FM-WSFRXXXX XX/2009
XXX-XXXX-XXX / Date / 5
hed. ,
rm 3800-FM-WSFR0470d, can be found at s/dsweb/View/Collection-10671
Appendix E
Groundwater Rule 4-log Treatment Demonstration Attached is the 4-log treatment demonstration worksheet. The form is used for 4-log submissions to the Department. The temperature chart with the required CT value is attacThe baffling diagram is used to determine the systems baffling factor. The 4-log spreadsheetfohttp://www.elibrary.dep.state.pa.u .
ent 3800-FM-WSFR0470c
Appendix E consists of docum