Embed Size (px)
Citation preview
Techniques to consider in the determination of BAT Chapter 4
Mineral Oil and Gas Refineries 159
4 TECHNIQUES TO CONSIDER IN THE DETERMINATION OFBAT
This chapter describes in detail the techniques that are considered to be most relevant fordetermining BAT. This chapter should be seen as the main background information for thedetermination of best available techniques in the refinery sector (Chapter 5). Techniques that aregenerally seen as obsolescent are not included. Moreover, it does not include all the techniquesapplied in the refinery sector and described in Chapter 2. Only techniques with goodenvironmental performance are included here.
Production, prevention, control, minimisation and re-cycling procedures/techniques areconsidered in this chapter. This can be done in many ways, such as using production techniquesthat pollute less than others, changing the operating conditions, reducing material inputs, re-engineering processes to re-use by-products, improving management practices or employingsubstitution of toxic chemicals. This chapter provides information on some both general andspecific pollution prevention and control advances that have been implemented within industryin general and in the refinery industry in particular.
As in previous Chapters 2 and 3, each section of this chapter deals with a refinery process oractivity and contains the process and abatement techniques worth considered in thedetermination of BAT. If different techniques may be applicable for one process/activity, theyare discussed there. Sections from 4.2 to 4.22 in this chapter have been structured internally inthe same way. Each of those sections contain first the pollution prevention techniquesapplicable in the process/activity section referred to and secondly the end-of-pipe techniquesthat may be applicable to reduce the emissions coming from the process/activity. Those end-of-pipe techniques are grouped in media/pollutant bases to clarify the sequence of techniquesapplicable as, in some cases, the number of EOP techniques that may be use is quite extensive.
At the end of this chapter, three sections appear containing the end-of-pipe (EOP) techniquesapplied to waste gas, waste water and waste management. Those sections contain thedescriptions of the EOP techniques that may be applicable to more than a refineryprocess/activity as well as some other EOP processes. Consequently, the descriptions of thoseEOP techniques that may appear in this chapter are included in Sections 4.23, 4.24 and 4.25 andnot in the activities/process sections.
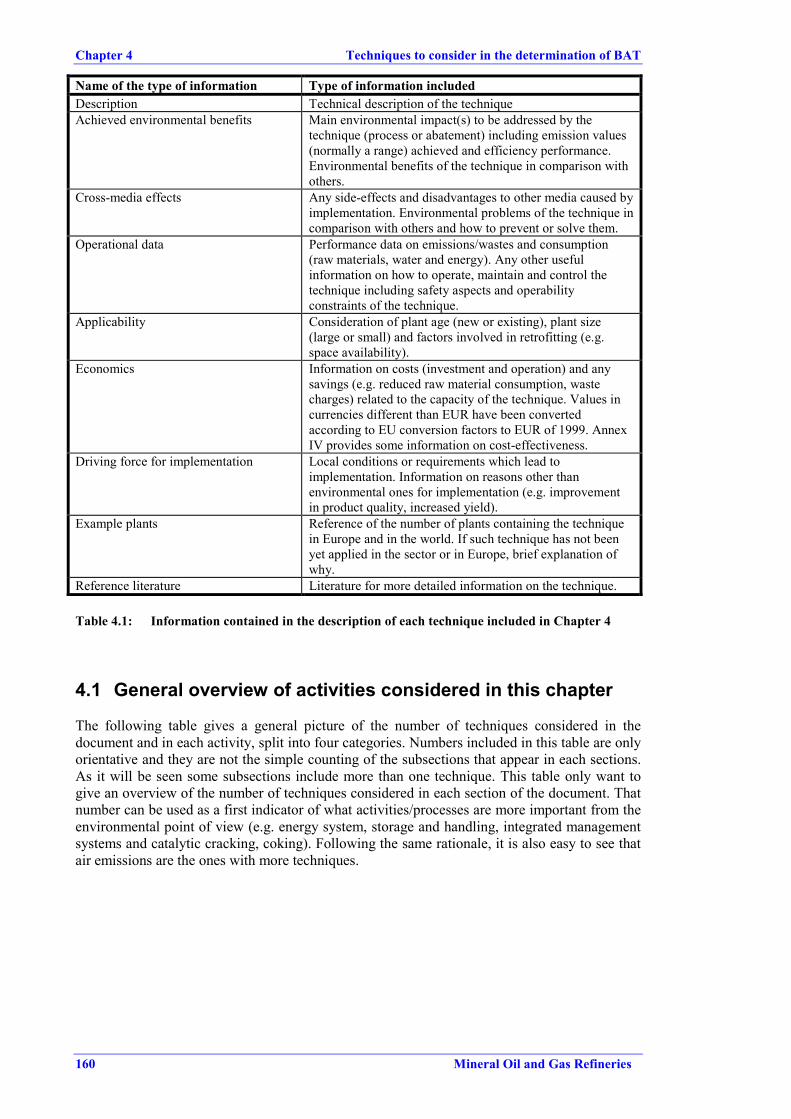
Each technique (both preventive (including process techniques) and control) is well documentedand includes information on consumption and emission levels considered achievable by usingthe technique, some idea of the costs and the cross-media issues associated with the techniqueand the extent to which the technique is applicable to the range of installations requiring IPPCpermits, for example new, existing, large or small installations. Each technique in this chapter isanalysed in the same way in order to give a good background for the determination of BAT forthe refinery sector. That determination is done in the next chapter. Table 4.1 shows the structureof the information for each technique included in this chapter.
When possible, this chapter provides information from real activities that can be, or are being,implemented by this sector, including associated costs. When possible, information providedgives the context in which the technique can be used effectively.
Chapter 4 Techniques to consider in the determination of BAT
160 Mineral Oil and Gas Refineries
Name of the type of information Type of information includedDescription Technical description of the techniqueAchieved environmental benefits Main environmental impact(s) to be addressed by the
technique (process or abatement) including emission values(normally a range) achieved and efficiency performance.Environmental benefits of the technique in comparison withothers.
Cross-media effects Any side-effects and disadvantages to other media caused byimplementation. Environmental problems of the technique incomparison with others and how to prevent or solve them.
Operational data Performance data on emissions/wastes and consumption(raw materials, water and energy). Any other usefulinformation on how to operate, maintain and control thetechnique including safety aspects and operabilityconstraints of the technique.
Applicability Consideration of plant age (new or existing), plant size(large or small) and factors involved in retrofitting (e.g.space availability).
Economics Information on costs (investment and operation) and anysavings (e.g. reduced raw material consumption, wastecharges) related to the capacity of the technique. Values incurrencies different than EUR have been convertedaccording to EU conversion factors to EUR of 1999. AnnexIV provides some information on cost-effectiveness.
Driving force for implementation Local conditions or requirements which lead toimplementation. Information on reasons other thanenvironmental ones for implementation (e.g. improvementin product quality, increased yield).
Example plants Reference of the number of plants containing the techniquein Europe and in the world. If such technique has not beenyet applied in the sector or in Europe, brief explanation ofwhy.
Reference literature Literature for more detailed information on the technique.
Table 4.1: Information contained in the description of each technique included in Chapter 4
4.1 General overview of activities considered in this chapter
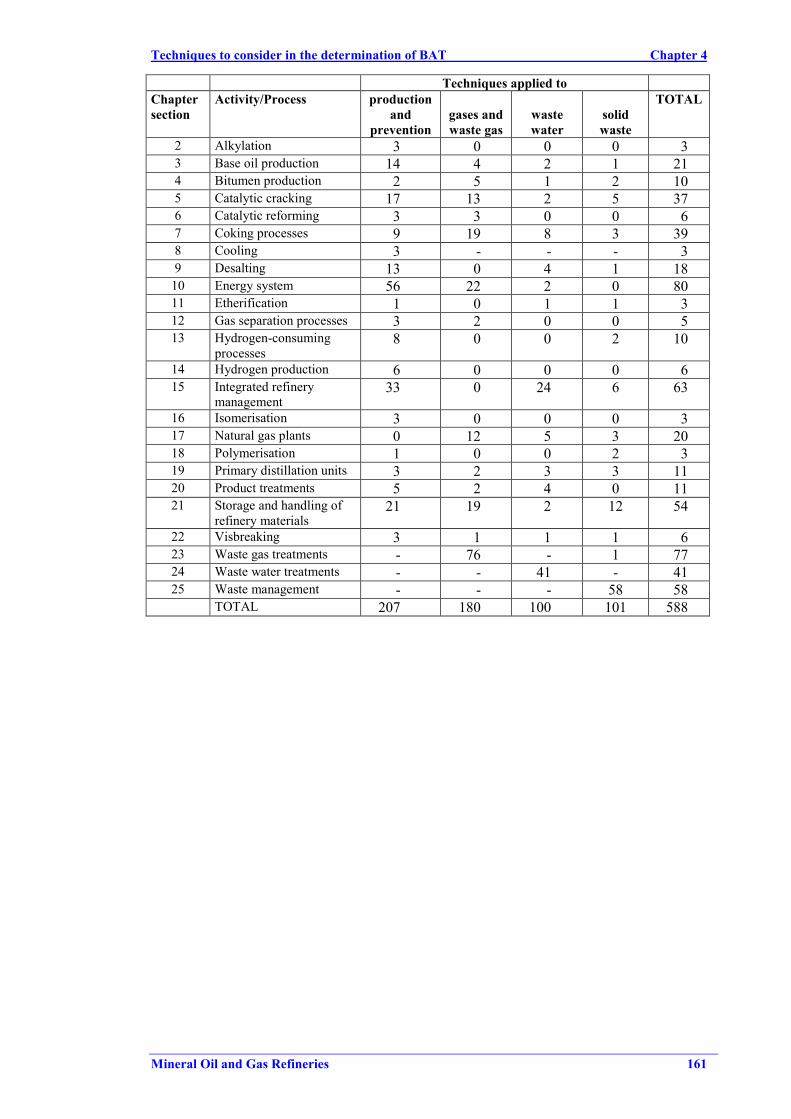
The following table gives a general picture of the number of techniques considered in thedocument and in each activity, split into four categories. Numbers included in this table are onlyorientative and they are not the simple counting of the subsections that appear in each sections.As it will be seen some subsections include more than one technique. This table only want togive an overview of the number of techniques considered in each section of the document. Thatnumber can be used as a first indicator of what activities/processes are more important from theenvironmental point of view (e.g. energy system, storage and handling, integrated managementsystems and catalytic cracking, coking). Following the same rationale, it is also easy to see thatair emissions are the ones with more techniques.
Techniques to consider in the determination of BAT Chapter 4
Mineral Oil and Gas Refineries 161
Techniques applied toChaptersection
Activity/Process productionand
preventiongases andwaste gas
wastewater
solidwaste
TOTAL
2 Alkylation 3 0 0 0 33 Base oil production 14 4 2 1 214 Bitumen production 2 5 1 2 105 Catalytic cracking 17 13 2 5 376 Catalytic reforming 3 3 0 0 67 Coking processes 9 19 8 3 398 Cooling 3 - - - 39 Desalting 13 0 4 1 18
10 Energy system 56 22 2 0 8011 Etherification 1 0 1 1 312 Gas separation processes 3 2 0 0 513 Hydrogen-consuming
processes8 0 0 2 10
14 Hydrogen production 6 0 0 0 615 Integrated refinery
management33 0 24 6 63
16 Isomerisation 3 0 0 0 317 Natural gas plants 0 12 5 3 2018 Polymerisation 1 0 0 2 319 Primary distillation units 3 2 3 3 1120 Product treatments 5 2 4 0 1121 Storage and handling of
refinery materials21 19 2 12 54
22 Visbreaking 3 1 1 1 623 Waste gas treatments - 76 - 1 7724 Waste water treatments - - 41 - 4125 Waste management - - - 58 58
TOTAL 207 180 100 101 588
Chapter 4 Techniques to consider in the determination of BAT
162 Mineral Oil and Gas Refineries
4.2 Alkylation
The techniques considered in the determination of BAT for the alkylation process are thefollowing:
4.2.1 Hydrofluoric acid alkylation process
DescriptionA brief description of the process can be found in Section 2.2.
Achieved environmental benefitsThe main advantages of the HF-alkylation process in comparison with the sulphuric acidprocess are the regeneration of HF, which minimises waste formation and disposal, and thelower acid-catalyst consumption as well as the minor consumption of energy and cooling.
Cross-media effectsEffluent gases: Scrubber using alkaline solution (NaOH or KOH) is necessary to remove HFfrom the incondensable gas stream. The acid relief neutraliser is operated so as to minimise thehydrogen fluoride content of the incondensable gas stream. Emissions levels of <1mg HF/Nm3
can be achieved. The vent gas should pass to flare not to the refinery fuel gas system; adedicated flare/stack is normally retained for this. Fugitive emissions are also generated by thisprocess.
HF is a very dangerous compound because of its severe corrosive nature and burning effects ofboth liquid and fumes to skin, eyes and mucous membranes. Consequently, storage andhandling it should comply with all safety rules.
KF (or NaF) is formed during the neutralisation process. The spent solution is stored and thenrequires regeneration with lime (or alumina). The regenerated KOH (or NaOH) is recycled.CaF2 is regularly cleaned out and disposed of, usually to a landfill. If alumina is used instead oflime as the neutralising agent, then, recovery of the aluminium is possible by the aluminiumindustry. Fumes can originate in the unit’s neutralising basin. To prevent the discharge of theseodorous gases to the surroundings, the neutralising basins are tightly covered and equipped witha gas scrubber to remove any offensive agent.
Water: HF alkylation effluents are a potential cause of acid excursions in refinery effluents anda high standard of control should be exercised on the neutralisation treatment system, e.g. on-line pH monitoring. The effluent containing HF acid can be treated with lime (CaO-Ca(OH)2),AlCl3 or CaCl2 or it can be neutralised indirectly in a KOH system to produce the desired CaF2or AlF3 (insolubles) which is separated in a settlement basin. The supernatant liquor flows to thewater treatment process. KOH may be regenerated for re-use. After this treatment, thesupernadant contains still 10 – 40 ppm F and some hydrocarbons and is directed to the WWTP.KOH may be regenerated from the aqueous solution for re-use.
Wastes: The HF process also yields tars (polymeric material) but these are essentially free fromHF. HF-containing tars are neutralised (with lime or alumina) and disposed of by incineration orblended as a fuel-oil component in small amounts because its pronounced odours. However,technology and special operating techniques such as internal acid regeneration have virtuallyeliminated this liquid-waste stream.
Bad operation of the system (excessively cold acid, improper acid settler level, low reactorpressure, excessive acid recycle rate, low i-butane or acid concentration, high reactortemperature and improper mixing) increases the amount of waste generated.
Techniques to consider in the determination of BAT Chapter 4
Mineral Oil and Gas Refineries 163
Operational dataThe potentially corrosive and toxic properties of HF require special engineering design andspecial construction materials, advanced process controls and stringent safety, personalprotection and maintenance requirements. These precautions include:a) special seals on acid-containing equipment such as pumps and valve stemsb) special safety clothing which must be worn by personnel entering an acid areac) extensive operator trainingd) special facilities (e.g. sprinkler systems, acid-inventory reduction, HF-detection systems,
isolation valves, rapid acid transfer systems) should be included in the design of this kind ofsystem to mitigate the effects of an accidental emission of HF vapour clouds. For leakdetection, HF sensitive colours on pipes and flanges are suitable as alternative to continuousair analysers and video control. The potential reduction of airborne HF acid has also beendemonstrated by the addition of additives. Special care should be taken during maintenanceand cleaning of the plant, e.g. for major shut-downs not to release odours from the drainagesystem and/or ponds.
Same developments (such as additives) have been already tested in order to lower the vapourpressure and to minimise the amount of HF released to the atmosphere in case of accident. Onthe downside of this is that handling and recyling the additive add to the complexity of theprocess.
ApplicabilityFully applicable.
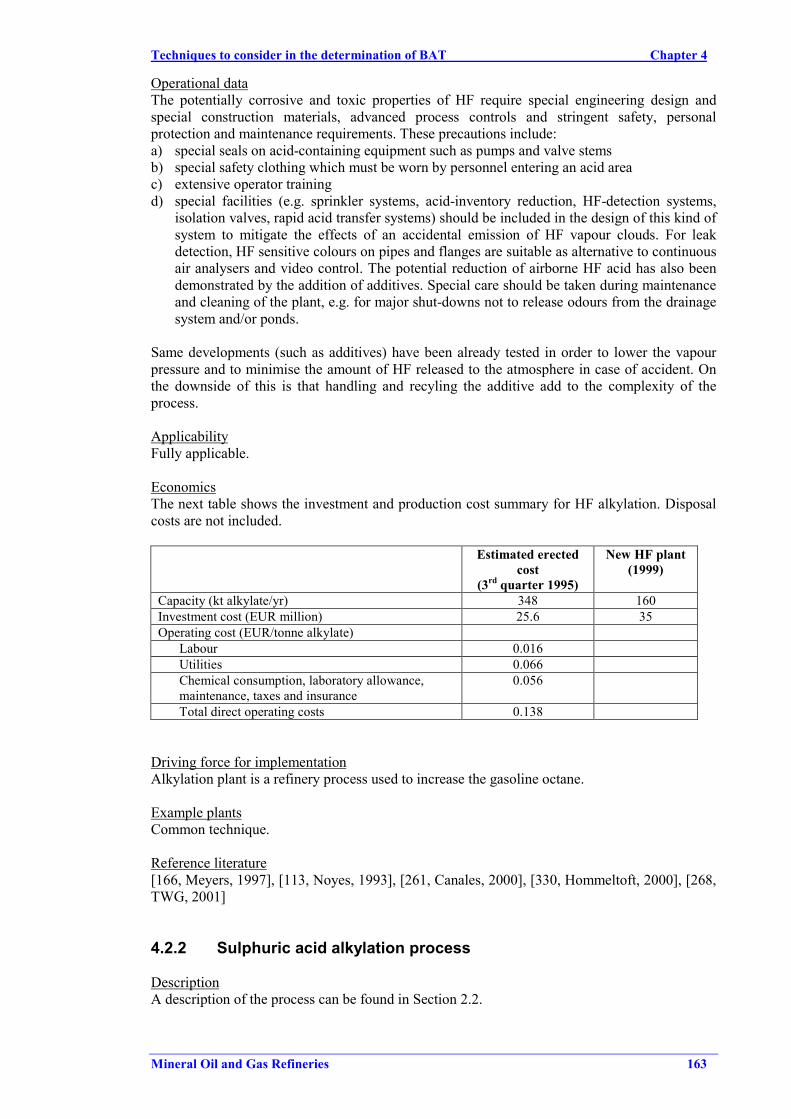
EconomicsThe next table shows the investment and production cost summary for HF alkylation. Disposalcosts are not included.
Estimated erectedcost
(3rd quarter 1995)
New HF plant(1999)
Capacity (kt alkylate/yr) 348 160Investment cost (EUR million) 25.6 35Operating cost (EUR/tonne alkylate)
Labour 0.016Utilities 0.066Chemical consumption, laboratory allowance,maintenance, taxes and insurance
0.056
Total direct operating costs 0.138
Driving force for implementationAlkylation plant is a refinery process used to increase the gasoline octane.
Example plantsCommon technique.
Reference literature[166, Meyers, 1997], [113, Noyes, 1993], [261, Canales, 2000], [330, Hommeltoft, 2000], [268,TWG, 2001]
4.2.2 Sulphuric acid alkylation process
DescriptionA description of the process can be found in Section 2.2.
Chapter 4 Techniques to consider in the determination of BAT
164 Mineral Oil and Gas Refineries
Achieved environmental benefitsA sulphuric acid plant is an alternative process for alkylation, but has the drawback of morespent acid to be disposed of or recycled outside. Efficiency of the process is lower than the HFalkylation and more cooling is needed in this process.
Cross-media effectsTechnologies using suphuric acid as catalyst produce very large quantities of spent acid(sulphuric and sulphonic acids) that has to be regenerated. The transport of spent and fresh acidto and from the sulphuric acid regeneration has give rise to some concern and increased thepressure on refiners to establish sulphuric acid regeneration plants near the alkylation unit. Insome cases this transport to/from the regeneration facility is by pipeline. However, no majornew improvements have been introduced in sulphuric acid alylation technology dealing with thespent acid issue. Fugitive emissions from this process is similar to the HF alkylation.
Acid-soluble oil should be recycled to process. Tars from the H2SO4 process contain sulphuricand miscellaneous sulphonic acids, which may cause disposal problems. This process generateswaste water that should be neutralised before be routed to WWTP, gum, spent acid, causticsolutions from regeneration and fugitive emissions.
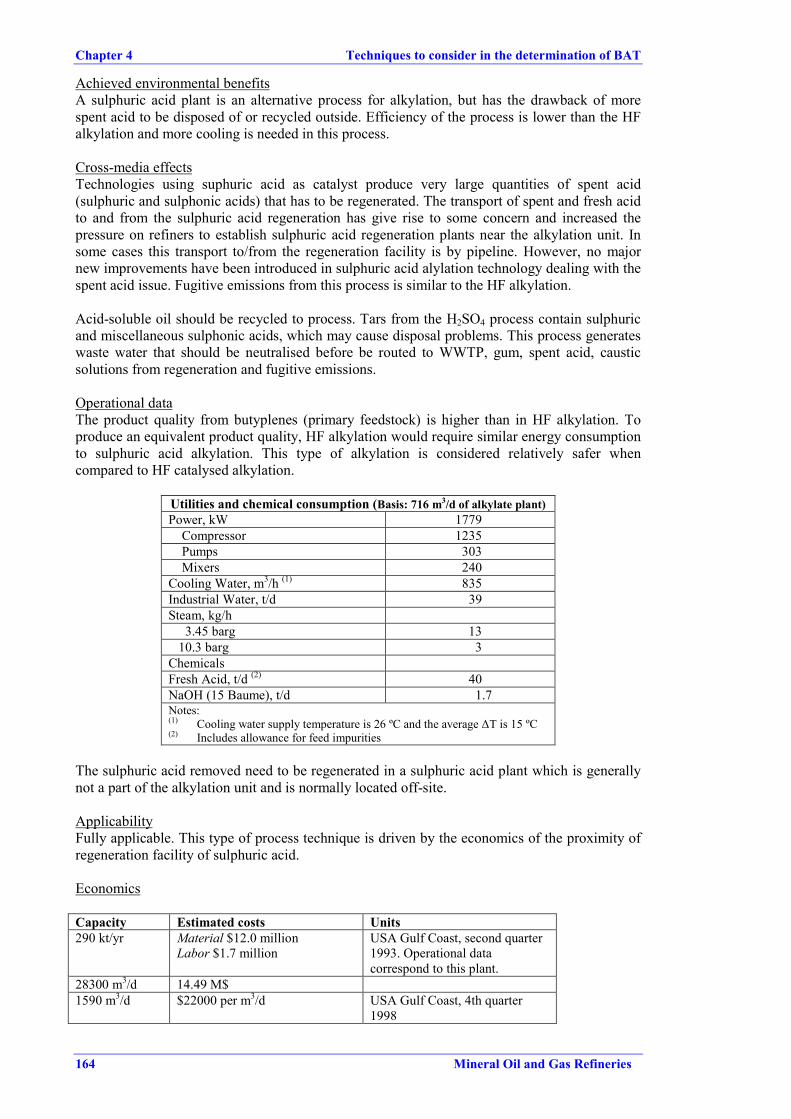
Operational dataThe product quality from butyplenes (primary feedstock) is higher than in HF alkylation. Toproduce an equivalent product quality, HF alkylation would require similar energy consumptionto sulphuric acid alkylation. This type of alkylation is considered relatively safer whencompared to HF catalysed alkylation.
Utilities and chemical consumption (Basis: 716 m3/d of alkylate plant)Power, kW 1779 Compressor 1235 Pumps 303 Mixers 240Cooling Water, m3/h (1) 835Industrial Water, t/d 39Steam, kg/h 3.45 barg 13 10.3 barg 3ChemicalsFresh Acid, t/d (2) 40NaOH (15 Baume), t/d 1.7Notes:(1) Cooling water supply temperature is 26 ºC and the average ∆T is 15 ºC(2) Includes allowance for feed impurities
The sulphuric acid removed need to be regenerated in a sulphuric acid plant which is generallynot a part of the alkylation unit and is normally located off-site.
ApplicabilityFully applicable. This type of process technique is driven by the economics of the proximity ofregeneration facility of sulphuric acid.
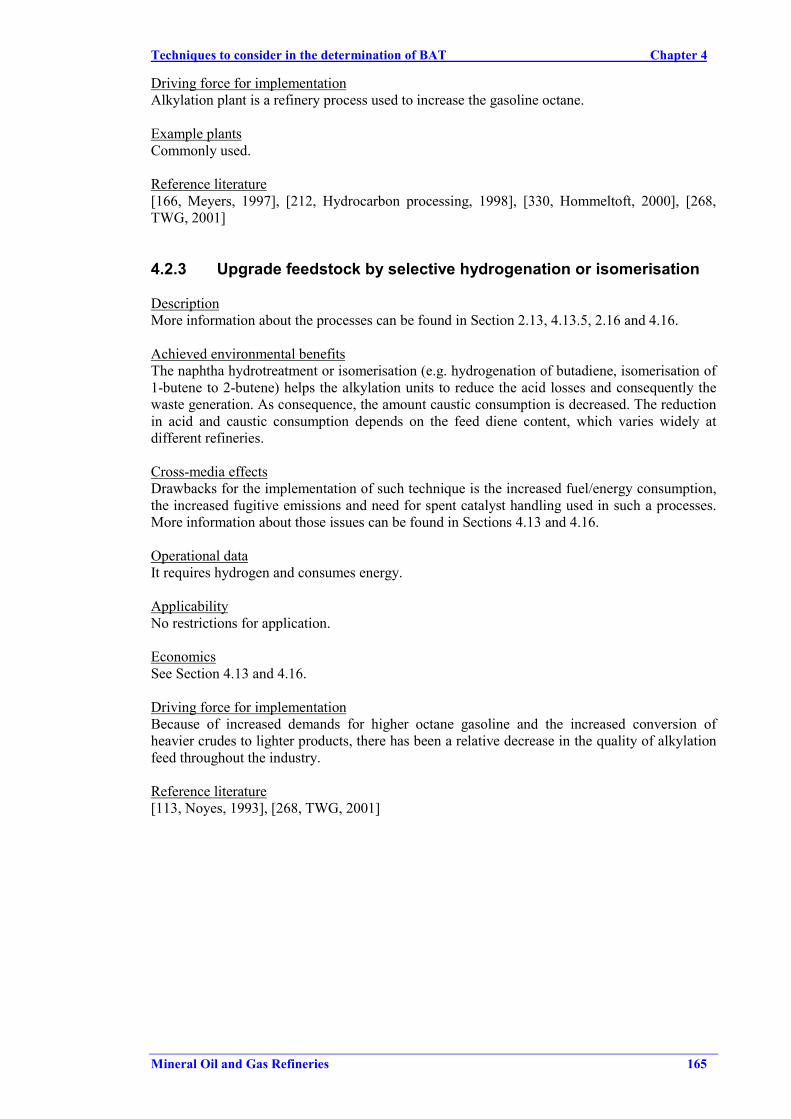
Economics
Capacity Estimated costs Units290 kt/yr Material $12.0 million
Labor $1.7 millionUSA Gulf Coast, second quarter1993. Operational datacorrespond to this plant.
28300 m3/d 14.49 M$1590 m3/d $22000 per m3/d USA Gulf Coast, 4th quarter
1998
Techniques to consider in the determination of BAT Chapter 4
Mineral Oil and Gas Refineries 165
Driving force for implementationAlkylation plant is a refinery process used to increase the gasoline octane.
Example plantsCommonly used.
Reference literature[166, Meyers, 1997], [212, Hydrocarbon processing, 1998], [330, Hommeltoft, 2000], [268,TWG, 2001]
4.2.3 Upgrade feedstock by selective hydrogenation or isomerisation
DescriptionMore information about the processes can be found in Section 2.13, 4.13.5, 2.16 and 4.16.
Achieved environmental benefitsThe naphtha hydrotreatment or isomerisation (e.g. hydrogenation of butadiene, isomerisation of1-butene to 2-butene) helps the alkylation units to reduce the acid losses and consequently thewaste generation. As consequence, the amount caustic consumption is decreased. The reductionin acid and caustic consumption depends on the feed diene content, which varies widely atdifferent refineries.
Cross-media effectsDrawbacks for the implementation of such technique is the increased fuel/energy consumption,the increased fugitive emissions and need for spent catalyst handling used in such a processes.More information about those issues can be found in Sections 4.13 and 4.16.
Operational dataIt requires hydrogen and consumes energy.
ApplicabilityNo restrictions for application.
EconomicsSee Section 4.13 and 4.16.
Driving force for implementationBecause of increased demands for higher octane gasoline and the increased conversion ofheavier crudes to lighter products, there has been a relative decrease in the quality of alkylationfeed throughout the industry.
Reference literature[113, Noyes, 1993], [268, TWG, 2001]
Chapter 4 Techniques to consider in the determination of BAT
166 Mineral Oil and Gas Refineries
4.3 Base oil production
As described in Section 2.3, several types of processes can be found in the base oil production.It includes the desaphalting unit, aromatic extraction, high pressure hydrogenation unit,dewaxing, hydrofinishing and wax processing. All these process are covered here and goodtechniques from the environmental point of view are discussed in this section. Techniquesapplicable for the storage of the solvents used in base oil production (e.g. furfural, NMP, MEK,MIBK) are also included here. Storage of products and intermediates appearing in base oilproduction is included here as well.
4.3.1 Multiple-effect extraction process
DescriptionSolvent based processes used in the manufacture of base oils are energy intensive because largevolumes of solvent must be recovered by flash distillation for recycle in the process. Number ofstages used for evaporation of the solvents has a significant effect on the energy cost for theseprocesses and as many as five evaporation stages were used in some early liquid SO2 extractionunits in Europe.
Achieved environmental benefitsHeat efficiency can be improved (less water and steam usage) by applying so-called double andtriple effect configurations, especially in the deasphalting and aromatic extraction units. Energysaving of a triple-effect evaporation is 30-33 % compared with double-effect evaporation.
Operational dataUtilities needed in the process are listed in the economic section. The energy saving of the tripleeffect systems is on the low level heat side only (in most cases LP-steam) where refineries oftenalready have a surplus. This means that the actual saving depends on the local circumstancesand a retrofit/change should be evaluated for each individual location.
ApplicabilityMultiple effect evaporation requires both a pressure and a temperature driving force. In someinstances, the increase in pressure and temperature required to go from double to triple effect isnot feasible and could result in higher emissions and energy consumption because of largerresidual amounts of solvent left in the oil leaving the evaporation section and entering thestripping section.
Triple effect systems are typically used for non-fouling feedstocks only (e.g. wax) as they areknown to be more vulnerable in this respect, so their application is restricted.
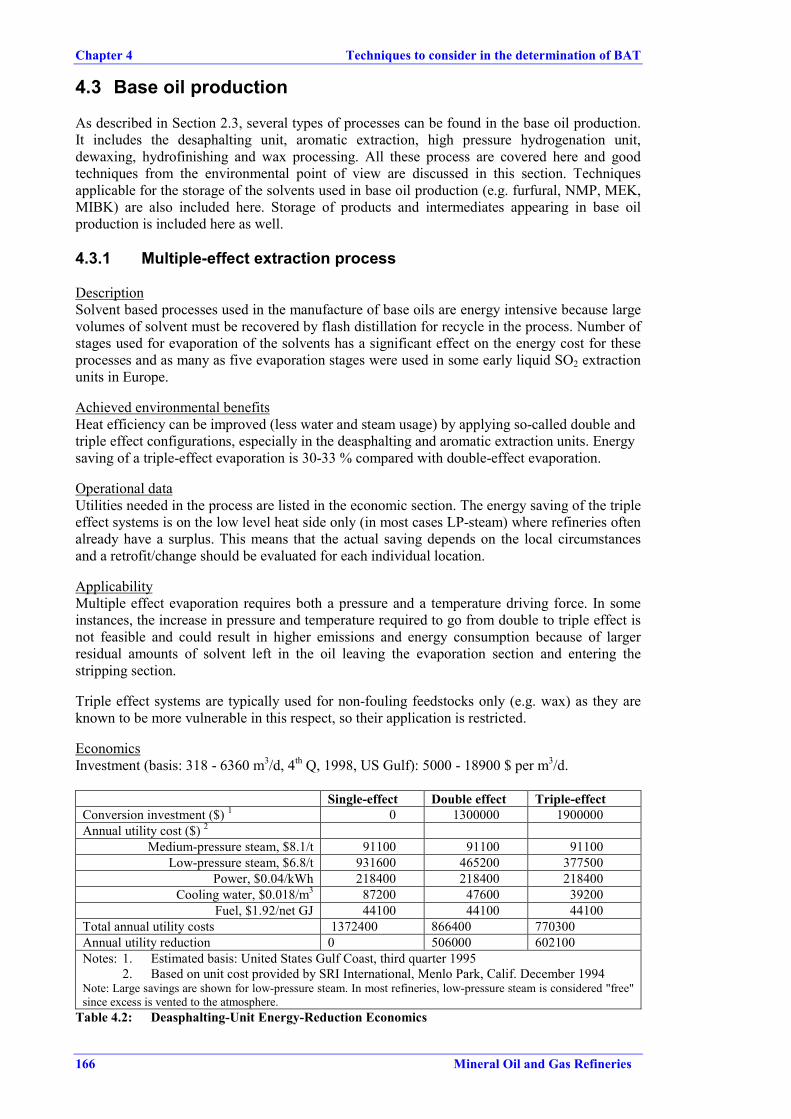
EconomicsInvestment (basis: 318 - 6360 m3/d, 4th Q, 1998, US Gulf): 5000 - 18900 $ per m3/d.
Single-effect Double effect Triple-effectConversion investment ($) 1 0 1300000 1900000Annual utility cost ($) 2
Medium-pressure steam, $8.1/t 91100 91100 91100Low-pressure steam, $6.8/t 931600 465200 377500
Power, $0.04/kWh 218400 218400 218400Cooling water, $0.018/m3 87200 47600 39200
Fuel, $1.92/net GJ 44100 44100 44100Total annual utility costs 1372400 866400 770300Annual utility reduction 0 506000 602100Notes: 1. Estimated basis: United States Gulf Coast, third quarter 1995
2. Based on unit cost provided by SRI International, Menlo Park, Calif. December 1994Note: Large savings are shown for low-pressure steam. In most refineries, low-pressure steam is considered "free"since excess is vented to the atmosphere.
Table 4.2: Deasphalting-Unit Energy-Reduction Economics
Techniques to consider in the determination of BAT Chapter 4
Mineral Oil and Gas Refineries 167
Driving force for implementationThe conversion to multiple-effect unit reduces the utility cost.
Example plantsCommon technology used in refineries having lubricant oil production. Double effect units arethe most predominant type of extraction processes. Units built in 1950-1975 used double effectand a few used single. Because the cost of energy increased rapidly during the 1970, most newunits built since about 1980 have been designed (and older units converted to) triple effectevaporation to reduce the cost of energy consumed.
Reference literature[166, Meyers, 1997], [212, Hydrocarbon processing, 1998], [319, Sequeira, 1998]
4.3.2 Types of solvent used in the aromatic extraction unit
DescriptionThe selection of the type of solvent used in the aromatic extraction has an impact on the energyconsumption of the system and the use of a less toxic solvent (furfural and n-methyl pyrrolidone(NMP) can be used in preference to the more toxic selective solvent as phenol and sulphurdioxide).
Achieved environmental benefitsThe use of a less polluting solvent (e.g.NMP or furfural) is preferred. As consequence thereduction of emissions of phenols and sulphur dioxide in the refinery effluents is achieved.
The advantage of NMP versus furfural is a higher selectivity leading to a higher raffinate yieldand a lower solvent ratio which both result in a lower energy consumption of some 30 - 40 %.
Cross-media effectsCare should be taken to avoid solvent contamination of aqueous effluents by applying efficientsolvent recovery techniques. Some contamination of aqueous effluents occurs, so care should betaken not to upset the activated sludge treatment unit of the waste water treatment. NMP iseasier to be degraded in the WWTP than furfural however is more corrosive than clean furfural.
Operational dataThe performance of NMP and furfural techniques are similar. Well maintained and operatedfurfural extraction units perform just as well as NMP plants. Similar quantities of furfural,compared to NMP, are required when the plants are run in the correct manner.
ApplicabilitySome technical dificulties for applicability or change of solvent are the following:• phenol is easier to recover than furfural. Furfural forms a different ratio azeotrope with
water, so a straight switch of solvent of a phenol unit may not possible, much largerquantities of furfural are used per unit throughput
• NMP switching of phenol is also difficult. NMP has a higher boiling point (by 22 ºC), alower melting point (by 64 ºC) and no azeotrope. Because those reasons, furfural istypically used when producing lower boiling point base oils (e.g. transformer oil distillates)
Major modifications would be required for existing units to change from furfural to NMP as theprocess conditions are different (change from hot oil heat exchangers to a fired furnace toachieve the required temperatures in the solvent recovery section).
Chapter 4 Techniques to consider in the determination of BAT
168 Mineral Oil and Gas Refineries
EconomicsThe change of solvent used does not entail significant extra costs in some cases. In other cases,for instance, the change from a SO2 aromatic extraction to another solvent needs a completelynew unit. Cost comparison of major base oil refining processes is given below
Furfural NMP PhenolSolvent, relative 1.0 2.3 0.60Investment medium low highMaintenance medium low highEnergy high low medium
The switch from furfural to NMP process need economical calculations because majormodification may be required. As consequence, the energy saving against the cost of the revamphas to be carried out individually. Changing from furfural to NMP requires significantinvestment, including, but not limited to the extraction tower, furnaces, metallurgy etc. Cost forconversion of a phenol unit (277 m3 per operating day) to a NMP unit (563 m3 per operatingday) is estimated in EUR 0.9 million (cost including solp and solvent tankage). Other estimatessays that the investment cost of a switch of a phenol units to NMP unit is around 70 % of acompletely new unit.
Driving force for implementationReduction of energy consumption and the emissions of phenols and SO2 in the refinery.
Example plantsCommon technologies.
Reference literature[110, HMIP UK, 1993], [319, Sequeira, 1998], [268, TWG, 2001]
4.3.3 Solvent recovery from dewaxing units
DescriptionInformation about the process can be found in Section 2.3. Different prevention techniques maybe applied to the solvent dewaxing process:
• vapours from the wax filters are contained in the inert gas system. In this process the inertgas is circulating and solvent vapours are recovered by refrigeration as part of the process.Solvent incineration in furnaces should be minimised. Alternative to refrigeration ispressure absorption of solvents in oil (e.g. fresh feed or finished)
• solvents used for the process include propane and mixtures of methyl ethyl ketone (MEK)with methyl isobutyl ketone (MIBK). Toluene or chlorinated hydrocarbons should beavoided
• the solvent recovery stage results in solvent-contaminated water, which should be sent tothe waste water treatment plant
• use of inert gas in place of steam for stripping the last traces of solvent from the dewaxedoil and waxes. When chlorinated solvents are used this procedure is typically applied.
Achieved environmental benefitsMaximise the recovery of the solvents used in the solvent dewaxing processes and reduce thecontamination of waste water by toluene or chlorinated hydrocarbons Benefits of inert gasstripping in solvent dewaxing are the reduction of energy requirements in solvent refining units,the increse of dewaxed oil yields, reduction of the dilution ratios, reduction of solvent losses,decrease of dewaxing differential, and maintenance cost reduced.
Techniques to consider in the determination of BAT Chapter 4
Mineral Oil and Gas Refineries 169
Cross-media effectsLarge refrigeration systems are used and refrigerant losses from these should be minimised.Energy consumption for refrigeration / pressure and heat. Care should be taken to avoid solventcontamination of aqueous effluents because most of the solvent used in solvent dewaxing areproblematic for water micro-organisms and waste water plants. VOC fugitive emissions may begenerated during the processes.
Operational data
Utilities, typical per m3 feed UnitsFuel 1856 MJElectricity 290 kWSteam 171 kgCooling water (∆T = 25 ºC) 36 m3
Solvent make-up 1.7 kg
ApplicabilityFully applicable.
EconomicsA new solvent recovery unit cost 66000 US$ per m3/day (basis 44000 m3/day feed rate capacity,1998 US Gulf Coast). Data on implementation of inert gas stripping in refineries shownpaybacks of 9-14 months.
Driving force for implementationThose techniques can be used in refineries having solvent dewaxing units in their lubricant oilproduction to promote reduction of solvent losses.
Example plantsMany refineries having lubricant production contain this type of processes.
Reference literature[212, Hydrocarbon processing, 1998], [19, Irish EPA, 1993], [319, Sequeira, 1998], [268, TWG,2001]
4.3.4 Wax reprocessing unit
DescriptionHydrofinishing or clay treating can be used in the wax processing.
Achieved environmental benefitsWax hydrofinishing offers several advantages over clay treating which include lower operatingcosts and reduction of waste generation.
Cross-media effectsWhen hydroprocessing is used, hydrogen is necessary. Hydrotreatments consume energy,hydrogen and the nickel, tungsten or even platinum catalyst needed for this process. Spent clayresults in a disposal problem.
Operational dataHydrogen finishing yields approach 100 % whereas the clay treating product yield ranges from75 to 90 % for the microcrystalline waxes and as high as 97 % for light parafin waxes.Hydrogen consumption is around 15 Nm3 per m3 of wax produced. Clay consumption runs from2 to 45 kg/t of product.
Chapter 4 Techniques to consider in the determination of BAT
170 Mineral Oil and Gas Refineries
ApplicabilityHydrofinishing is fully applicable especially when hydrogen is available. However, in somecases, hydrofinishing processes cannot reach certain very special product quality specifications.
EconomicsInvestment cost for a wax hidrofinishing process is EUR 1 million for a feed capacity of 20000t/yr.
Driving force for implementationHydrotreating offers a lower operating cost.
Example plantsMany examples exists.
Reference literature[319, Sequeira, 1998], [268, TWG, 2001]
4.3.5 Lube oil clean-up
DescriptionA short description of the process can be found in Section 2.3. The use of hydrotreating orsulphuric acid and clay treatments are treatments used in the lube oil clean-up.
Achieved environmental benefitsThe use of hydrotreatment intead of the other cleaning techniques reduces waste generation.
Cross-media effectsHydrotreatments consume energy, hydrogen and the nickel, tungsten or even platinum catalystneeded for this process.
Operational dataIn stand-alone luboil refineries, the small amounts of H2S generated due to hydrotreatment arenormally incinerated because the erection of a Claus unit is not justified economically.
ApplicabilityFully applicable. However, in some cases, hydrofinishing processes cannot reach certain veryspecial product quality specifications.
Driving force for implementationTechnology that may be used in refineries having lubricant oil production for the production ofcleaner lubricants.
Example plantsSulphuric acid and clay treatments are typically used in old plants.
Reference literature[19, Irish EPA, 1993], [268, TWG, 2001]
4.3.6 Storage of base oil intermediates and products
DescriptionStorage of intermediates and products from base oil production is typically found in base oilproduction units.
Techniques to consider in the determination of BAT Chapter 4
Mineral Oil and Gas Refineries 171
Achieved environmental benefitsReduce risk of leaking and VOC emissions
4.3.7 Storage and benchmarking of solvents
DescriptionSolvent used in the solvent extraction of aromatics should be stored in blanketed tanks tominimise fugitive emissions of furfural, NMP and MEK/toluene. The practice of internal and/orexternal benchmarking may reduce the solvent consumption.
Achieved environmental benefitsReduce VOC emissions, leakage prevention and reduction of solvent consumption. Preventionof leakage of solvents soluble in water reduce the contamination of soil and groundwater.
ApplicabilityThose tehniques can be seen as part of the VOC abatement programme (4.23.6) or soilcontamination prevention programme (4.25.1).
Driving force for implementationToluene and MEK should be routinely nitrogen blanketed, mainly to reduce fire hazard ratherthan to prevent VOC emissions; higher boiling range solvents, such as furfural and NMP areless prone to VOC releases and may be blanketed mainly to prevent oxidative degradation(furfural) or to reduce nuisance odorous.
Example plantsBenchmarking of solvents and leakage prevention is widely applied in refineries.
Reference literature[297, Italy, 2000], [268, TWG, 2001]
4.3.8 Sulphur treatment from hydrogenation units
DescriptionHydrogenation processes generate H2S. As consequence off-gases containing H2S are recoveredin a sulphur recovery plant (See Section 4.23.5) or incinerated.
Achieved environmental benefitsReduction of sulphur and H2S emissions.
Cross-media effectsAmine recovery of H2S consumes energy and chemicals. Sulphur recovery units consumesenergy (see Section 4.23.5). Incineration requires fuel.
Operational dataSee Section 4.23.5
ApplicabilityIn stand-alone luboil refineries, the small amounts of H2S generated in this process are typicallyincinerated. Sulphur recovery is less commonly applied in those specialised refineries.
EconomicsSee Section 4.23.5. Data from EU refineries have found that the implementation SRU in stand-alone lubricant refineries producing more than 2 tonnes of sulphur per day is cost-effective.
Chapter 4 Techniques to consider in the determination of BAT
172 Mineral Oil and Gas Refineries
Driving force for implementationReduction of sulphur oxide and H2S emissions.
Example plantsAt least one specialised European refinery has a SRU which recover 99.1 % of the sulphur inthe acid gas.
Reference literature[147, HMIP UK, 1995], [268, TWG, 2001]
4.3.9 Stripping of waste water from aromatic extraction
DescriptionStripping of waste water from aromatic extraction prior to sending to waste water treatmentplant. Other technique to consider is dehydration/settling.
Achieved environmental benefitsReduce the content of organic and sulphur compounds of waste water produced in the aromaticextraction. Other benefits are energy requirements reduced, dewaxed oil yield increased,dewaxing differential decreased, dilution ratios reduced, solvent losses reduced andmaintenance costs reduced.
Cross-media effectsStripping consumes energy.
Operational dataStripping consumes energy.
ApplicabilityFully applicable
Driving force for implementationEnergy consumption reduction and reduction of solvent losses.
Example plantsApplied in some refineries.
Reference literature[147, HMIP UK, 1995], [319, Sequeira, 1998], [268, TWG, 2001]
4.3.10 Hot oil system
DescriptionWhen the base oil production units have a single energy system, the introduction of clean-upfacilities in the flue gases is more cost-effective.
Achieved environmental benefitsReduction of SOx, NOx, particulates emissions from the energy system.
Cross-media effectsSee different cross-media for the abatement of SOx, NOx and particulates in Section 4.23
Operational dataSee Section 4.23
Techniques to consider in the determination of BAT Chapter 4
Mineral Oil and Gas Refineries 173
ApplicabilityThis technique may be very difficult to be applied to existing refineries.
EconomicsSee Section 4.23
Driving force for implementationReduction of SOx, NOx, particulates emissions from the energy system.
Example plantsSome stand-alone lubricant refineries have already applied this concept to reduce emissionscoming from the burning of liquid fuels.
Reference literature[268, TWG, 2001]
Chapter 4 Techniques to consider in the determination of BAT
174 Mineral Oil and Gas Refineries
4.4 Bitumen production
4.4.1 Storage of bitumen products
DescriptionBitumen should be stored in proper storage tanks normally under heating conditions andinsulated. Bitumen is not handled as a solid because is too difficult and is very intensive in manpower. Loading and unloading of the tank is typically done as follow. When the tank is filled,nitrogen does not flow to the tank, and the pressure is lowered by letting part of the gas go to theatmosphere. When the tank is unloaded on a low speed, a little bit nitrogen is led to the tank.However when the speed of unload is higher, higher amounts of nitrogen must be used. If thetank would be equipped with some cleaning system, it must be mechanically very simple andeasy to clean.
Achieved environmental benefitsFor safety reasons, bitumen tanks are equipped with nitrogen blanketing and pressure/vacuumsafety valve. Those valves need maintenance due to the slime.
Cross-media effectsHydrocarbons and sulphur compounds may emanate from leakages (particularly in overheadsystems) and pressure relief valves and in the form of aerosol-containing liquid droplets fromthe venting of tanker top-loading operations.
Operational dataElectricity hot oil and low pressure steam can be used for heating. The heat exchanger can beinside the tank or outside the tank in which case bitumen is circulated through it. Difference intemperature should not be too high due to the surface temperature and coking.
ApplicabilityStorage of bitumen products is done in refineries that have bitumen production. Preventiontechniques as mentioned are typically applied.
Driving force for implementationFor safety reasons, bitumen tanks are equipped with nitrogen blanketing and pressure/vacuumsafety valve.
Example plantsSome refineries in Europe use those techniques mentioned here.
Reference literature[268, TWG, 2001]
4.4.2 Techniques to control emissions to the air
4.4.2.1 Treatment of the gaseous overheads
DescriptionOxidiser overhead can be routed to a scrubber rather than direct water quenching forcontaminant removal prior to incineration.
Achieved environmental benefitsReduction of H2S, SO2, SO3, CO, VOC, particulates, smoke and odour emissions.
Techniques to consider in the determination of BAT Chapter 4
Mineral Oil and Gas Refineries 175
Cross-media effectsAdditional contaminated water. Scrubber water is dirty and requires oil and solids separationprior to re-use as desalter wash water and/or biotreatment. The sour water from the scrubber isrouted to and stripped in a sour water stripper prior to re-use and/or purification.
ApplicabilityTypically applied to overheads from the bitumen blowing systems
Reference literature[147, HMIP UK, 1995]
4.4.2.2 Use the heat from incondensable products and condensates
Description• Both incondensable products and condensates from the separator, hydrocarbon and aqueous,
can be burnt in a purpose-designed incinerator, using support fuel as necessary or in processheaters.
• Oxidiser overhead slop oil can also be treated in the sludge processing or recycled in therefinery slop oil system.
Achieved environmental benefitsReduction of emulsion of light oil, water and particulates. Another environmental benefit is theremoval of foul smelling odorous incondensables difficult to treat elsewhere.
Cross-media effectsOn scrubbing, aerosols can give rise to plugging. Additional contaminated water streams. In awell operated unit, SO2 or odour from incineration of bitumen blowing incondensables do notpose any problem.
Operational dataThe incinerator should operate at a temperature of at least 800 ºC and the combustion chambersshould have a residence time of at least 0.5 second. The oxygen concentration at the combustionchamber outlet should be greater than 3 % v/v. Low-NOx burners can be fitted in thoseincinerators.
ApplicabilityWidely used to get rid of bitumen fumes. Incondensable and/or condensates can be burnt inprocess heaters. However they should be treated or scrubbed to remove compounds of sulphuror combustion products that may cause odours or other environmental problems.
Driving force for implementationReduction of odours, sludge and oily waste.
Example plantsMany bitumen oxidisers have associated facilities to handle gas and liquid wastes.
Reference literature[147, HMIP UK, 1995]
Chapter 4 Techniques to consider in the determination of BAT
176 Mineral Oil and Gas Refineries
4.4.2.3 Treatment of vents from storage and handling bitumen materials
DescriptionTechniques that may be applied to prevent VOC emissions and odours are:• odorous gases vented during the storage of bitumens and the tank blending/filling operation
can be vented to an incinerator• the use of compact wet-type electrostatic precipitators has been proven capable of
successfully removing the liquid element of the aerosol generated during the top-loading oftankers.
Achieved environmental benefitsReduction of emissions of sulphur compounds, VOC, particulates, smoke and odour emissions.
Cross-media effectsEnergy consumption and in case of wet ESP waste generation.
Operational dataIn the waste gas of a cleaning unit, a mass concentration of VOC of a total of 150 mg/Nm³ canbe complied with. In the waste gas of a incineration plant, a mass concentration of VOC, givenas total C, of a total of 20 mg/Nm³ can be complied with (Half-hourly mean values attainable incontinuos operation).
ApplicabilityFully applicable.
Driving force for implementationReduction of emissions and nuissance.
Reference literature[147, HMIP UK, 1995], [117, VDI, 2000]
4.4.2.4 Sulphur dioxide abatement and sulphur recovery units
DescriptionSOx abatement techniques and SRU are techniques to reduce sulphur emissions. Those areextensivelly documented in Section 4.23.5.
Achieved environmental benefitsReduction of sulphur emission
Cross-media effectsSee Section 4.23.5 for the different techniques applicable.
Operational dataSee Section 4.23.5 for the different techniques applicable.
ApplicabilityThe implementation of those techniques are extremely linked to the rest of the refinery. Instand-alone bitumen refineries its application is more restricted.
EconomicsSee Section 4.23.5 for the different techniques applicable.
Driving force for implementationReduction of sulphur emissions
Techniques to consider in the determination of BAT Chapter 4
Mineral Oil and Gas Refineries 177
Example plantsThose techniques are applied in many refineries. However less applications are found in stand-alone bitumen production refineries.
Reference literature[268, TWG, 2001]
4.4.3 Techniques to control emissions to the waste water
DescriptionOxidiser overhead waste water accumulated in the overhead condensate collection drum can besent to a sour water stripper prior to sending it to the effluent water treatment facilities.
Achieved environmental benefitsThe stripping reduces the H2S, oil, aromatics, volatile PAHs, sulphuric acid and odorousoxidation products (ketones, aldehydes, fatty acids) in the sour waste water reducing the chargeto the central waste water system of the refinery.
Cross-media effectsIncrease of oil and particulates load to sour water stripper.
ApplicabilityTypically applied to waste water from bitumen blowing.
Driving force for implementationReduction of the pollutant charge to the refinery waste water treatment.
Reference literature[147, HMIP UK, 1995], [268, TWG, 2001]
4.4.4 Techniques for prevention of generation of waste
DescriptionIn the bitumen production facilities, including storage, leakages can be produced. Thoseleakages typically generate waste when mixed with other components as sand.
Achieved environmental benefitsReduction of waste production
Operational dataThis can be seen as a part of a waste management programme described in Section 4.25.1.
ApplicabilityFully applicable
Driving force for implementationReduction of waste and cleaning
Example plantsMany refineries apply those type of systems.
Reference literature[268, TWG, 2001]
Chapter 4 Techniques to consider in the determination of BAT
178 Mineral Oil and Gas Refineries
4.4.5 Hot oil system
DescriptionWhen the bitumen production units have a single energy system, the introduction of clean-upfacilities in the flue gases is more cost-effective.
Achieved environmental benefitsReduction of SOx, NOx, particulates emissions from the energy system.
Cross-media effectsSee different cross-media for the abatement of SOx, NOx and particulates in Section 4.23
Operational dataSee Section 4.23
ApplicabilityThis technique may be very difficult to be applied to existing refineries.
EconomicsSee Section 4.23
Driving force for implementationReduction of SOx, NOx, particulates emissions from the energy system.
Example plantsSome stand-alone bitumen refineries have already applied this concept to reduce emissionscoming from the burning of liquid fuels.
Reference literature[268, TWG, 2001]
Techniques to consider in the determination of BAT Chapter 4
Mineral Oil and Gas Refineries 179
4.5 Catalytic cracking
Several types of techniques are considered in this section. The first group of techniques(Sections 4.5.1 to 4.5.3) corresponds to the types of catalytic cracking processes. Those sectionsgive the emission values that can be achieved without use of abatement techniques (where datais available). The remaining sections correspond to end-of pipe techniques applicable tocatcrackers.
4.5.1 Full combustion mode in regenerator
DescriptionThis section gives emission information from the FCC when it is run under favourableconditions and the regenerator in total combustion mode. Operational techniques that affect theemissions from the FCC are also discussed. A description of the process can be found in Section2.5.
Achieved environmental benefitsSome operating modes that can reduce the emission of pollutants from the FCC are thefollowing:• when operating a FCC in full combustion mode, and with an excess of oxygen greater than
2 %, the amount of CO produced can range from 35 to 250 mg/Nm3 (Value attainable incontinuous operation. Emissions values as half-hourly mean values)
• in full combustion mode, a CO oxidation promoter can be added to the regenerator tocatalyse the oxidation of CO. However, this promoter also catalyses the oxidation of thefuel nitrogen in the coke, increasing the NOx levels (especially NO). Platinum catalyst maypromote the generation of N2O. Consequently, the amount of CO promoter varies therelationship between the NOx emissions and CO emissions. However; values of 300 - 700mg/Nm3 of NOx (3 % O2) can be achieved
• minimisation of the use of aeration and purge steam can decrease particulate emissionssignificantly. Aeration/steam rates are based on achieving a stable catalyst circulation in thecatalyst lines between reactor and regenerator
• proper loading and pre-sulphiding procedures, good reactor temperature control and goodflow distribution can reduce catalyst losses
• stripping of catalyst before reaction or before regeneration helps to reduce the cokeformation
• temperature adjustment in the riser by injection of a recycle stream above the zone of thefresh feed injection.
• modification of the design and operation of regenerator especially to avoid high temperaturespots that tend to increase the NOx formation.
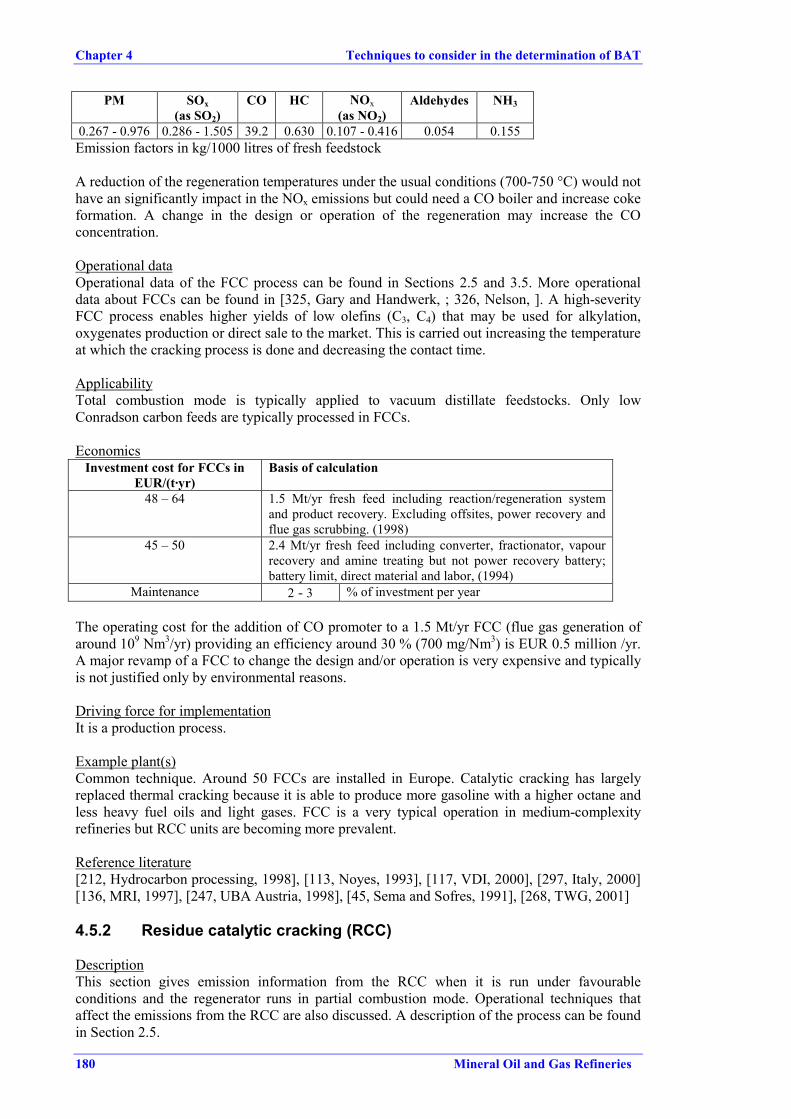
Cross-media effectsThe catcracker is the source of SO2 and NOx, CO2, CO, dust (particulates), N2O, SO3, metals,hydrocarbons (ex. aldehydes), ammonia emissions, as discussed in Section 3.5. For example,the basic design of a FCC includes two-stage cyclones in the regenerator vessel, which preventthe bulk of the fine catalyst used from escaping from the system. However, smaller catalystparticles, some of which are introduced with fresh catalyst and some created by attrition in thecirculating system, are not easily retained by the two-stage cyclone system. Consequently, inmany cases, other abatement techniques can be included to complement the process abatementtechniques discussed here. Next table gives a summary of the lowest emissions of pollutants tothe atmosphere due to an uncontrolled catcracker (No end-of-pipe technology is used to abateair emissions).
Chapter 4 Techniques to consider in the determination of BAT
180 Mineral Oil and Gas Refineries
PM SOx(as SO2)
CO HC NOx(as NO2)
Aldehydes NH3
0.267 - 0.976 0.286 - 1.505 39.2 0.630 0.107 - 0.416 0.054 0.155Emission factors in kg/1000 litres of fresh feedstock
A reduction of the regeneration temperatures under the usual conditions (700-750 °C) would nothave an significantly impact in the NOx emissions but could need a CO boiler and increase cokeformation. A change in the design or operation of the regeneration may increase the COconcentration.
Operational dataOperational data of the FCC process can be found in Sections 2.5 and 3.5. More operationaldata about FCCs can be found in [325, Gary and Handwerk, ; 326, Nelson, ]. A high-severityFCC process enables higher yields of low olefins (C3, C4) that may be used for alkylation,oxygenates production or direct sale to the market. This is carried out increasing the temperatureat which the cracking process is done and decreasing the contact time.
ApplicabilityTotal combustion mode is typically applied to vacuum distillate feedstocks. Only lowConradson carbon feeds are typically processed in FCCs.
EconomicsInvestment cost for FCCs in
EUR/(t·yr)Basis of calculation
48 – 64 1.5 Mt/yr fresh feed including reaction/regeneration systemand product recovery. Excluding offsites, power recovery andflue gas scrubbing. (1998)
45 – 50 2.4 Mt/yr fresh feed including converter, fractionator, vapourrecovery and amine treating but not power recovery battery;battery limit, direct material and labor, (1994)
Maintenance 2 - 3 % of investment per year
The operating cost for the addition of CO promoter to a 1.5 Mt/yr FCC (flue gas generation ofaround 109 Nm3/yr) providing an efficiency around 30 % (700 mg/Nm3) is EUR 0.5 million /yr.A major revamp of a FCC to change the design and/or operation is very expensive and typicallyis not justified only by environmental reasons.
Driving force for implementationIt is a production process.
Example plant(s)Common technique. Around 50 FCCs are installed in Europe. Catalytic cracking has largelyreplaced thermal cracking because it is able to produce more gasoline with a higher octane andless heavy fuel oils and light gases. FCC is a very typical operation in medium-complexityrefineries but RCC units are becoming more prevalent.
Reference literature[212, Hydrocarbon processing, 1998], [113, Noyes, 1993], [117, VDI, 2000], [297, Italy, 2000][136, MRI, 1997], [247, UBA Austria, 1998], [45, Sema and Sofres, 1991], [268, TWG, 2001]
4.5.2 Residue catalytic cracking (RCC)
DescriptionThis section gives emission information from the RCC when it is run under favourableconditions and the regenerator runs in partial combustion mode. Operational techniques thataffect the emissions from the RCC are also discussed. A description of the process can be foundin Section 2.5.
Techniques to consider in the determination of BAT Chapter 4
Mineral Oil and Gas Refineries 181
Achieved environmental benefitsPossibility to upgrade heavier residues than with the FCC (e.g. vacuum residue or low addedvalue residues). As consequence, the RCC can provide positive environmental benefit to reducethe generation of residue in the refinery that otherwise may go to bunker and other heavy fuels.Those fuels may finally be used in combustion processes generating SO2, NOx and metals.Other operational benefits of the RCC over the FCC with environmental consequences are:• use of two-stage catalyst regeneration as alternative to a catalyst cooler so as to control the
heat release due to coke combustion and can process feeds up to 10 % w/w Conradsoncarbon
• stripping of catalyst before reaction or before regeneration helps to reduce the cokeformation
• temperature adjustment in the rise by injection of a recycle stream above the zone of thefresh feed injection
• CO boiler and expander benefits used in RCC are analysed in Section 4.5.5.
Cross-media effectsSome feedstocks may need hydrotreatment.
ApplicabilityFully applicable. FCC can be retrofitted to RCC. Medium Conradson carbon feeds would need aCO boiler and higher ones a catalyst cooler. Metal content (Ni, V) should be limited; residuedemetallisation/hydrotreating may extend the range of residual feedstocks. It can run withcarbon Conradson index lower than 6 - 8 % and the total metal content less than 20 ppm.Example plantsSeveral examples in Europe.
Reference literature[212, Hydrocarbon processing, 1998]
4.5.3 Partial combustion mode in the regenerator
DescriptionFCC regenerators are operated either in a complete (considered in this document as the basisoperational mode) or partial combustion mode. In the partial combustion mode considerable COis present in the flue gas and it is consumed downstream of the regenerator in a CO boiler, bothto recover the energy produced in a CO boiler and to meet environmental requirements. Thissystem can be seen as two stage regeneration in comparison with the total combustion mode,where a single regeneration step is present. Another technique to consider is the modification ofthe design and operation of regenerator especially to avoid high temperature spots that tend toincrease the NOx formation.
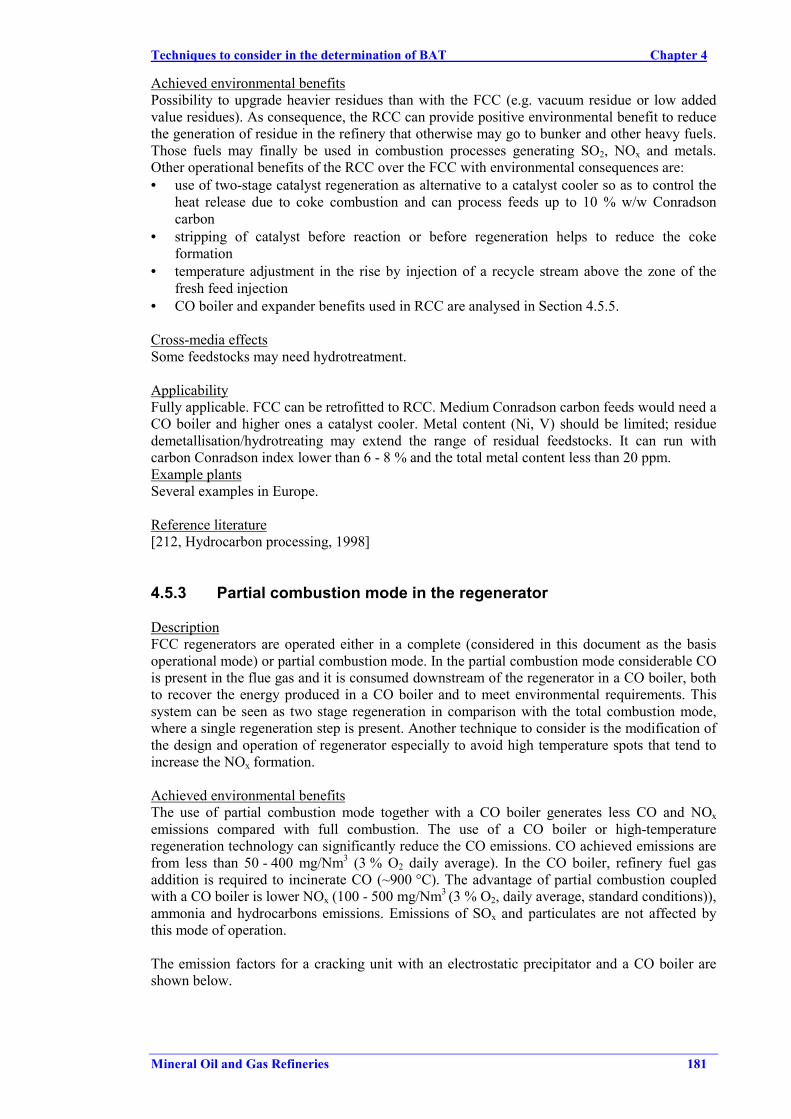
Achieved environmental benefitsThe use of partial combustion mode together with a CO boiler generates less CO and NOxemissions compared with full combustion. The use of a CO boiler or high-temperatureregeneration technology can significantly reduce the CO emissions. CO achieved emissions arefrom less than 50 - 400 mg/Nm3 (3 % O2 daily average). In the CO boiler, refinery fuel gasaddition is required to incinerate CO (~900 °C). The advantage of partial combustion coupledwith a CO boiler is lower NOx (100 - 500 mg/Nm3 (3 % O2, daily average, standard conditions)),ammonia and hydrocarbons emissions. Emissions of SOx and particulates are not affected bythis mode of operation.
The emission factors for a cracking unit with an electrostatic precipitator and a CO boiler areshown below.
Chapter 4 Techniques to consider in the determination of BAT
182 Mineral Oil and Gas Refineries
Process PM SOx(as SO2)
CO HC NOx(as NO2)
Aldehydes NH3
FCC with ESP andCO boiler
0.020 - 0.428 0.286 - 1.505 Neg Neg 0.107 - 0.416 Neg Neg
Neg: Negligible
Table 4.3: Emission factors for cracking (units in kg/1000 litres of fresh feed)
Cross-media effectsFuel gas is needed for the incineration of CO. If fuel contains sulphur, emissions of SO2 mayoccur. Other benefits are greater throughputs and heat/power recovery.
Operational dataWhere a CO boiler is installed it should be carefully designed and operated to minimise CO andNOx releases.
ApplicabilityThis mode of combustion is fully applicable. In general it can be said that feed having aConradson carbon figure up to 2 - 3 % can be processed in a ‘standard’ FCC without CO boileras well as partial-burn FCC. A Conradson figure from 2 - 5 % would require a CO boiler andfrom 5 - 10 % a cat cooler would be needed. It should be noted that the above figures are onlyindicative and depend also on the severity of cracking.
EconomicsInvestment cost necessary to convert a FCC from total to partial combustion mode is aroundEUR 2.5 - 4 million. A major revamp of a FCC to change the design and/or operation is veryexpensive and typically is not justified only by environmental reasons.
Driving force for implementationProduction process.
Example plantsCarbon monoxide boiler is normally a standard practice in fluidised catalytic cracking units inthe USA. Many examples also in Europe and the rest of the world.
Reference literature[297, Italy, 2000], [316, TWG, 2000], [268, TWG, 2001]
4.5.4 Hydrotreatment of feed to the catcraker
DescriptionHydrotreatment of feed to the catcracker operates at similar conditions to those used for gasoiland atmospheric residue hydrotreatment (see Sections 2.13 and 4.13).
Achieved environmental benefitsFCC feed hydrotreatment can reduce the sulphur content to <0.1 – 0.5 % w/w (depending on thefeedstock). As a consequence of the hydrotreatment, emissions of SO2 from the regenerator canbe reduced by up to 90 % (flue gas concentration 200 - 600 mg/Nm3 (3 % O2) depending on thefeedstock) and nitrogen compounds can be reduced by up to 75 – 85 % (smaller percentage forthe partial combustion mode). Be aware that a percentage on reduction of nitrogen compoundsdoes not lead to equivalent NOx reduction. This process also reduces the metal emissions (e.g.Ni, V) to the air and prolongs the life of the catcracker catalyst. Other benefit of this techniqueis that hydrotreated mercaptane oxidation is not necessary. This reduces amount of used causticand emissions into water.
Techniques to consider in the determination of BAT Chapter 4
Mineral Oil and Gas Refineries 183
Cross-media effectsCross-media effects are the increase of energy consumption and the consequent increase in CO2emissions, due mainly to the hydrogen, as discussed in Section 3.14. As discussed in Section4.13, hydrotreatment processes generate catalyst for disposal and increase the H2S productionwith direct consequences for the sour water stripper and sulphur recovery units (which mayneed to be enlarged or replaced).
Operational dataInstallation of catcracker feed hydrotreatment (or a feed hydrocracker) will reduce the sulphurcontent in catcracker products and improve their quality, so that they require less finalprocessing. Hydrogen and energy are required for this process. The water used for the differentcatalytic sections yields 20 - 40 m3/h of sour water. The sulphur removal efficiency achieved byhydrotreatment depends on the boiling range of the catcracker feed. The heavier the feed, themore energy is required for the same sulphur removal efficiency.
ApplicabilityFully applicable. This process is more cost-effective when hydrogen, SWS and SRU capacitiesare available in the refinery.
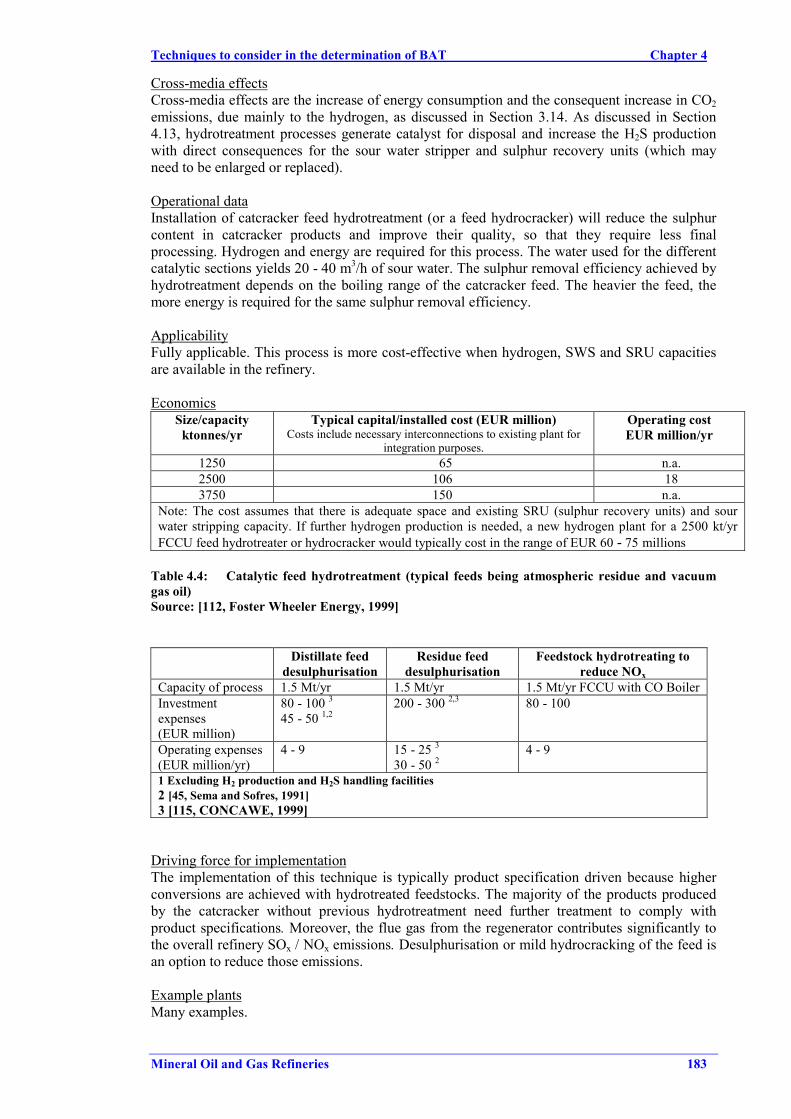
EconomicsSize/capacity
ktonnes/yrTypical capital/installed cost (EUR million)
Costs include necessary interconnections to existing plant forintegration purposes.
Operating costEUR million/yr
1250 65 n.a.2500 106 183750 150 n.a.
Note: The cost assumes that there is adequate space and existing SRU (sulphur recovery units) and sourwater stripping capacity. If further hydrogen production is needed, a new hydrogen plant for a 2500 kt/yrFCCU feed hydrotreater or hydrocracker would typically cost in the range of EUR 60 - 75 millions
Table 4.4: Catalytic feed hydrotreatment (typical feeds being atmospheric residue and vacuumgas oil)Source: [112, Foster Wheeler Energy, 1999]
Distillate feeddesulphurisation
Residue feeddesulphurisation
Feedstock hydrotreating toreduce NOx
Capacity of process 1.5 Mt/yr 1.5 Mt/yr 1.5 Mt/yr FCCU with CO BoilerInvestmentexpenses(EUR million)
80 - 100 345 - 50 1,2
200 - 300 2,3 80 - 100
Operating expenses(EUR million/yr)
4 - 9 15 - 25 330 - 50 2
4 - 9
1 Excluding H2 production and H2S handling facilities2 [45, Sema and Sofres, 1991]3 [115, CONCAWE, 1999]
Driving force for implementationThe implementation of this technique is typically product specification driven because higherconversions are achieved with hydrotreated feedstocks. The majority of the products producedby the catcracker without previous hydrotreatment need further treatment to comply withproduct specifications. Moreover, the flue gas from the regenerator contributes significantly tothe overall refinery SOx / NOx emissions. Desulphurisation or mild hydrocracking of the feed isan option to reduce those emissions.
Example plantsMany examples.
Chapter 4 Techniques to consider in the determination of BAT
184 Mineral Oil and Gas Refineries
Reference literature[296, IFP, 2000], [115, CONCAWE, 1999], [112, Foster Wheeler Energy, 1999], [45, Sema andSofres, 1991], [247, UBA Austria, 1998], [297, Italy, 2000], [268, TWG, 2001]
4.5.5 Waste heat boiler and expander applied to flue gas from the FCCregenerator
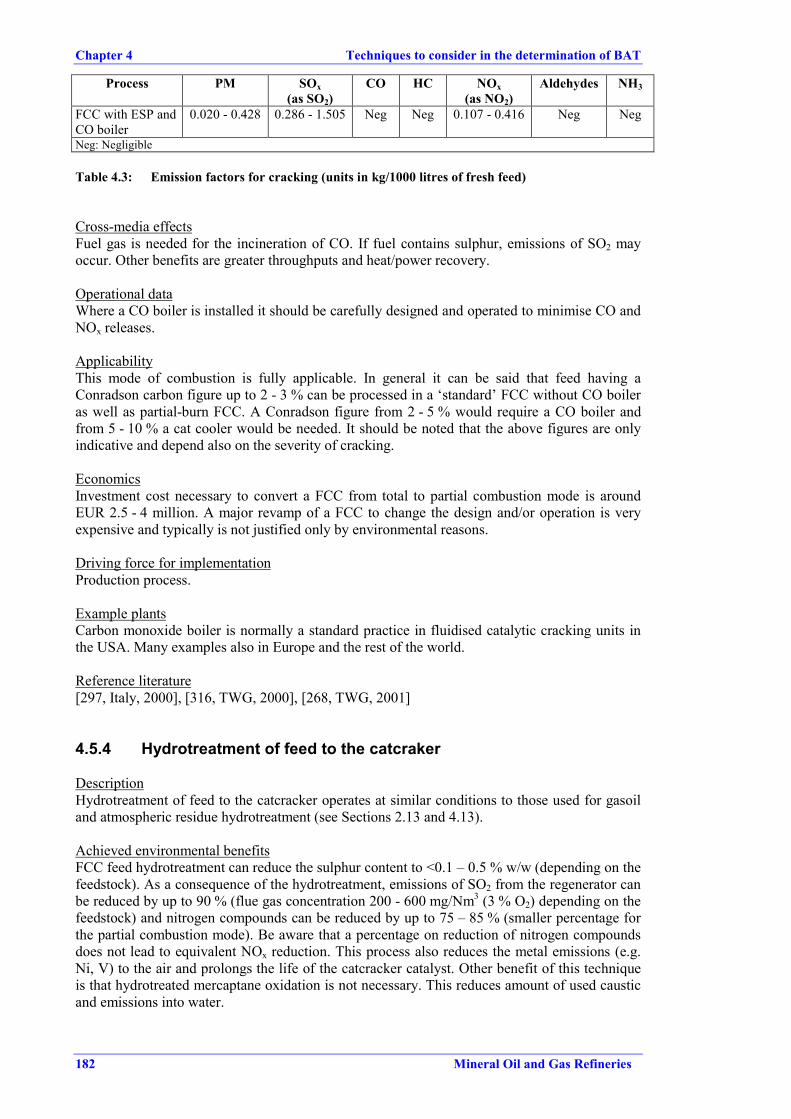
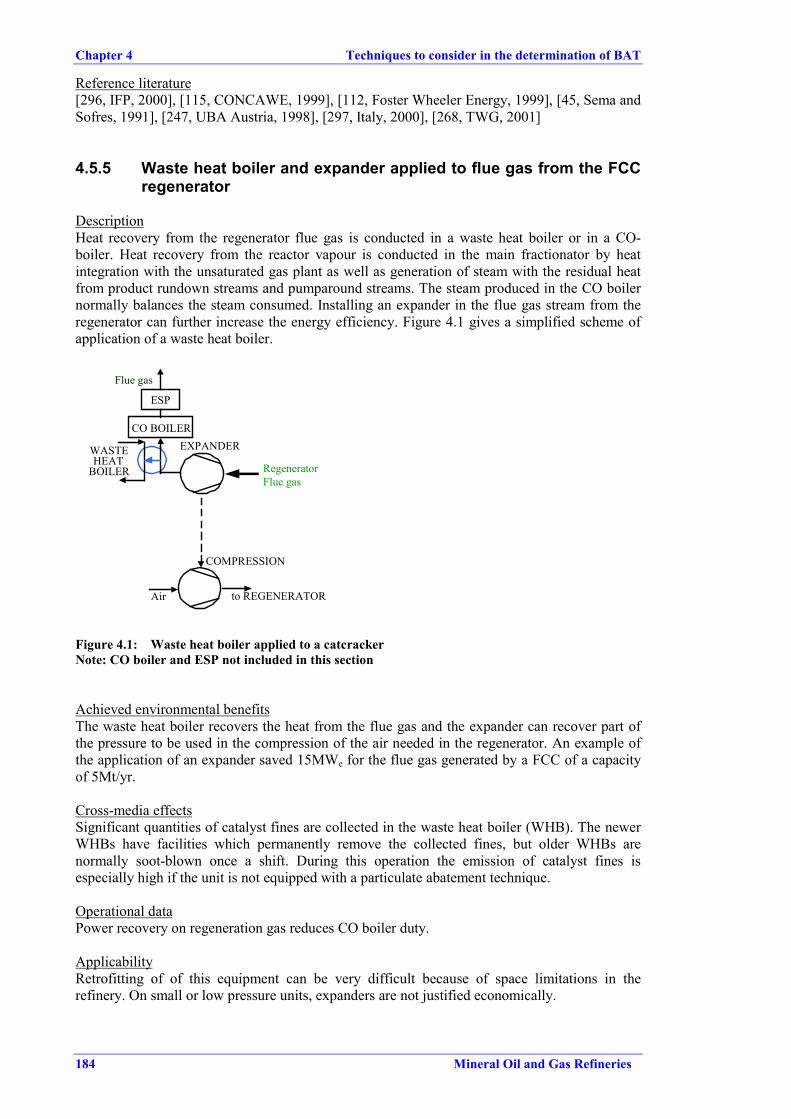
DescriptionHeat recovery from the regenerator flue gas is conducted in a waste heat boiler or in a CO-boiler. Heat recovery from the reactor vapour is conducted in the main fractionator by heatintegration with the unsaturated gas plant as well as generation of steam with the residual heatfrom product rundown streams and pumparound streams. The steam produced in the CO boilernormally balances the steam consumed. Installing an expander in the flue gas stream from theregenerator can further increase the energy efficiency. Figure 4.1 gives a simplified scheme ofapplication of a waste heat boiler.
EXPANDERWASTEHEAT
BOILER
CO BOILER
Flue gas
RegeneratorFlue gas
Air
COMPRESSION
to REGENERATOR
ESP
Figure 4.1: Waste heat boiler applied to a catcrackerNote: CO boiler and ESP not included in this section
Achieved environmental benefitsThe waste heat boiler recovers the heat from the flue gas and the expander can recover part ofthe pressure to be used in the compression of the air needed in the regenerator. An example ofthe application of an expander saved 15MWe for the flue gas generated by a FCC of a capacityof 5Mt/yr.
Cross-media effectsSignificant quantities of catalyst fines are collected in the waste heat boiler (WHB). The newerWHBs have facilities which permanently remove the collected fines, but older WHBs arenormally soot-blown once a shift. During this operation the emission of catalyst fines isespecially high if the unit is not equipped with a particulate abatement technique.
Operational dataPower recovery on regeneration gas reduces CO boiler duty.
ApplicabilityRetrofitting of of this equipment can be very difficult because of space limitations in therefinery. On small or low pressure units, expanders are not justified economically.
Techniques to consider in the determination of BAT Chapter 4
Mineral Oil and Gas Refineries 185
EconomicsApplying expander on the regenerator gas could be costly because the additional particulatesystems under high temperature that they need. Turbo expanders are big cost items, and so arewaste heat recovery units.
Driving force for implementationRecovery of energy
Example plant(s)Energy recovery by utilising an expander in the regenerator flue gas is only applied in thelarger, more recently built units.
Reference literature[136, MRI, 1997], [268, TWG, 2001]
4.5.6 Catalyst selection
DescriptionTechniques to consider are:a) Use a higher quality FCC catalyst, process efficiencies can be increased while catalyst wastecan be reduced and rate of replacement reduced.b) Use of an attrition resistant catalyst to reduce the frequency of replacing catalyst and reduceemission of particulates from the regenerator.
Achieved environmental benefitsA good selection of the catalyst used in the FCC process can:• increase the FCC efficiency by up to 20 %, coke production can be decreased and catalyst
waste can be reduced• increase the recyclability of the catalyst• reduce the particulate content of flue gas before treatment to 300 mg/Nm3.
ApplicabilityA change in the catalyst may have an adversely effect to the performance of the FCC.
EconomicsInvestment expenses: none.Operating expenses: Negligible.
Driving force for implementationProcess requirements.
Reference literature[80, March Consulting Group, 1991], [115, CONCAWE, 1999]
4.5.7 Waste water management within FCCU
DescriptionSome techniques to consider are:a) Some catcracker designs contain a cascading overhead washing section designed to minimisewater usage.b) re-use waste water generated in FCCU within the refinery (e.g. desalters) or ultimately routeto WWTP.
Achieved environmental benefitsReduction of water usage and re-use of water within the refinery.
Chapter 4 Techniques to consider in the determination of BAT
186 Mineral Oil and Gas Refineries
ApplicabilityBoth techniques are fully applicable to catcrackers
Driving force for implementationReduction of water usage.
Example plantsUsed in some catcrackers
Reference literature[80, March Consulting Group, 1991]
4.5.8 Nitrogen oxides abatement techniques
This section includes NOx abatement techniques that may be applied to FCCs.
4.5.8.1 Selective catalytic reduction (SCR)
DescriptionSee Section 4.23.3.
Achieved environmental benefitsInlet NOx concentration to the SCR may vary from 200 - 2000 mg/Nm3@ 3 % O2. Inlet NOxconcentrations to the SCR vary with the type of FCC used (total or partial combustion incombination with a CO boiler) and the type of feed used (heavier feed tends to produce higherNOx emissions). Reduction by 85 - 90 % of NOx emissions with the outlet concentration of NOxreduced to 30 - 250 mg/Nm3@ 3 % O2, depending on the inlet concentration. Those reductionefficiencies provide a reduction of 300 tonnes of NOx per year from catcrackers of capacity of1.65 Mt/yr. Other advantage is that some CO oxidation also occurs in the SCR process (aprox.40%).
Cross-media effectsUse of NH3 (storage/handling), risk of NH3 emissions when operating outside stoichiometricproportion and depending on the age of the catalyst (<2 - 10 mg/Nm3) and SCR catalystregeneration and disposal. Ammonia needed for this technique may be supplied by two-stagesour water strippers (see Section 4.24.2). Another disadvantage of SCR is that a few percent ofSO2 is oxidised to SO3 over the deNOx cat and as consequence it can potentially create plumeopacity problems.
Operational dataCatalyst performance is expected to deteriorate with time, due mainly to the dust and SOx.However, current examples have shown lifetimes well over the expected ones (6 years).Information from operators claim that not all SCR applied to FCC have operated to design loadsleading that fact to increase catalyst lifetimes. Some other concerns from operators is that SCRcatalyst could potentially be fouled by the particulates in the flue gas stream. More generaloperational data for SCRs can be found in Section 4.23.3.
ApplicabilityBecause the temperature window is wide (300 - 400 ºC), it is very flexible for retrofitapplications. However, considerable space is needed for installation. SCR applications oftenrequires a new waste heat boiler (full burn) or CO-boiler (partial burn) if they are not present.Preferably the deNOx unit is integrated with the waste heat boiler. Because SCR operates atoxidizing conditions it cannot be installed upstream of a CO boiler (partial burn).
Techniques to consider in the determination of BAT Chapter 4
Mineral Oil and Gas Refineries 187
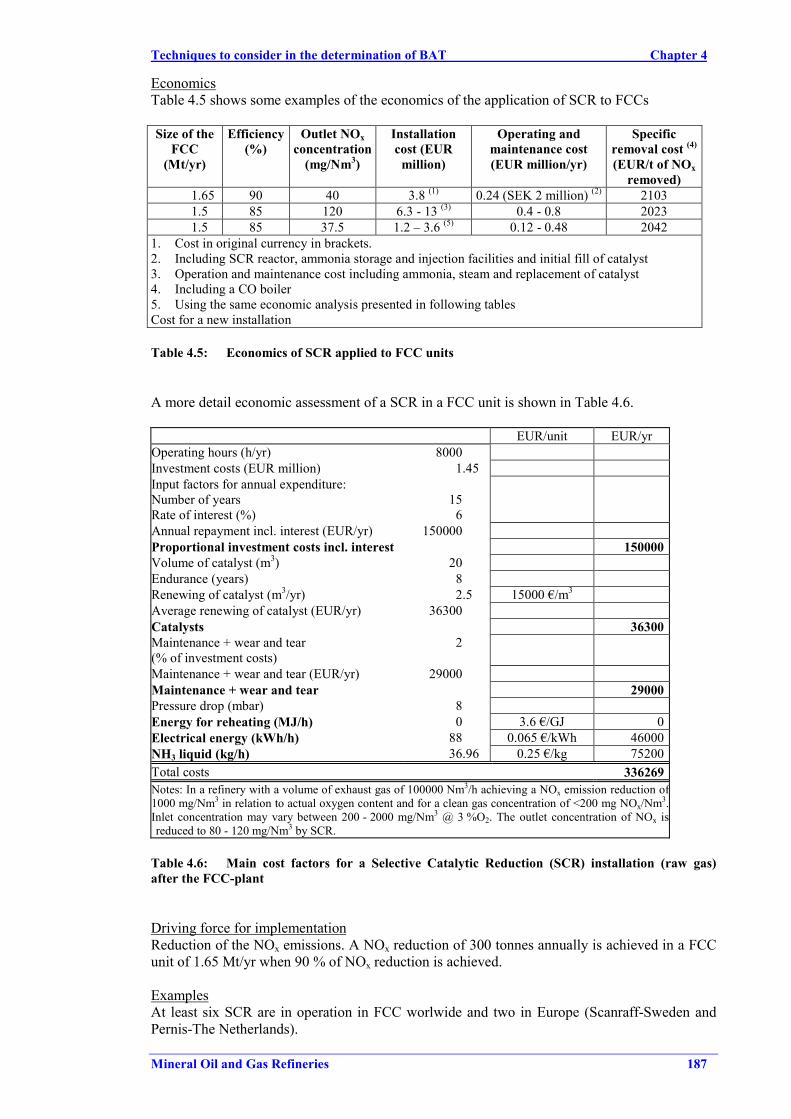
EconomicsTable 4.5 shows some examples of the economics of the application of SCR to FCCs
Size of theFCC
(Mt/yr)
Efficiency(%)
Outlet NOxconcentration
(mg/Nm3)
Installationcost (EUR
million)
Operating andmaintenance cost(EUR million/yr)
Specificremoval cost (4)
(EUR/t of NOxremoved)
1.65 90 40 3.8 (1) 0.24 (SEK 2 million) (2) 21031.5 85 120 6.3 - 13 (3) 0.4 - 0.8 20231.5 85 37.5 1.2 – 3.6 (5) 0.12 - 0.48 2042
1. Cost in original currency in brackets.2. Including SCR reactor, ammonia storage and injection facilities and initial fill of catalyst3. Operation and maintenance cost including ammonia, steam and replacement of catalyst4. Including a CO boiler5. Using the same economic analysis presented in following tablesCost for a new installation
Table 4.5: Economics of SCR applied to FCC units
A more detail economic assessment of a SCR in a FCC unit is shown in Table 4.6.
EUR/unit EUR/yrOperating hours (h/yr) 8000Investment costs (EUR million) 1.45Input factors for annual expenditure:Number of yearsRate of interest (%)
156
Annual repayment incl. interest (EUR/yr) 150000Proportional investment costs incl. interest 150000Volume of catalyst (m3) 20Endurance (years) 8Renewing of catalyst (m3/yr) 2.5 15000 €/m3
Average renewing of catalyst (EUR/yr) 36300Catalysts 36300Maintenance + wear and tear(% of investment costs)
2
Maintenance + wear and tear (EUR/yr) 29000Maintenance + wear and tear 29000Pressure drop (mbar) 8Energy for reheating (MJ/h) 0 3.6 €/GJ 0Electrical energy (kWh/h) 88 0.065 €/kWh 46000NH3 liquid (kg/h) 36.96 0.25 €/kg 75200Total costs 336269Notes: In a refinery with a volume of exhaust gas of 100000 Nm3/h achieving a NOx emission reduction of1000 mg/Nm3 in relation to actual oxygen content and for a clean gas concentration of <200 mg NOx/Nm3.Inlet concentration may vary between 200 - 2000 mg/Nm3 @ 3 %O2. The outlet concentration of NOx isreduced to 80 - 120 mg/Nm3 by SCR.
Table 4.6: Main cost factors for a Selective Catalytic Reduction (SCR) installation (raw gas)after the FCC-plant
Driving force for implementationReduction of the NOx emissions. A NOx reduction of 300 tonnes annually is achieved in a FCCunit of 1.65 Mt/yr when 90 % of NOx reduction is achieved.
ExamplesAt least six SCR are in operation in FCC worlwide and two in Europe (Scanraff-Sweden andPernis-The Netherlands).
Chapter 4 Techniques to consider in the determination of BAT
188 Mineral Oil and Gas Refineries
Reference literature[107, Janson, 1999], [45, Sema and Sofres, 1991], [254, UKPIA, 2000] [247, UBA Austria,1998], [115, CONCAWE, 1999], [316, TWG, 2000], [136, MRI, 1997], [348, AshworthLeininger Group, 2001]
4.5.8.2 Selective non-catalytic reduction (SNCR)
DescriptionSee Section 4.23.3.
Achieved environmental benefitsThese systems reduce the NOx emissions by 40 - 80 %. The outlet concentrations can be downto <200 - 400 mg/Nm3@ 3 % O2 depending on the nitrogen content of the feedstock. Instead ofammonia, urea can be also used. The use of urea has the advantage to be more soluble in waterand consequently reduce the risk of handling/storage of NH3.
Cross-media effectsUse of NH3 (storage/handling), risk of NH3 emissions when operating outside stoichiometricproportion. Ammonia needed for this technique may be supplied by two-stage sour waterstrippers (see Section 4.24.2). The use of urea generates more ammonia (from urea) slip andsome N2O formation.
Operational dataHigh temperatures (800 - 900 ºC) of the flue gases are needed.
ApplicabilityIt is applicable in partial combustion FCCs with CO boiler; retrofitting in existing CO boilers isrelatively simple. It is also applicable to full combustion units. Space requirements are mainlyrelated to NH3 storage.
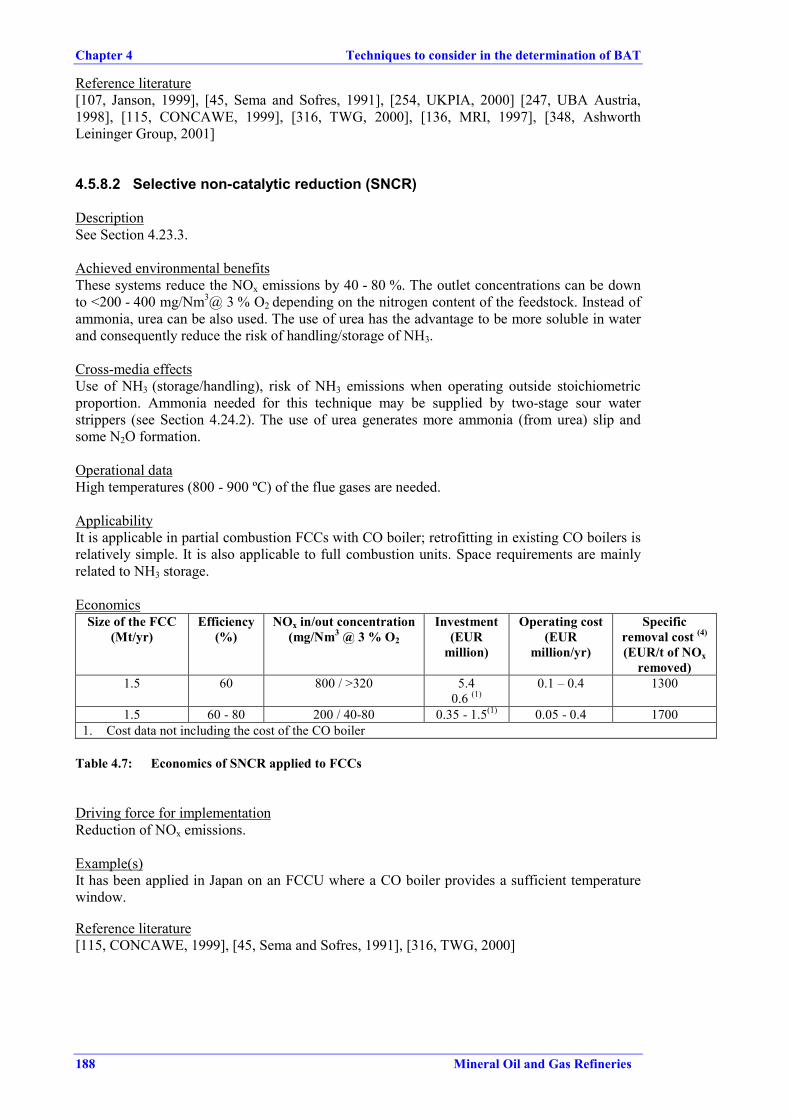
EconomicsSize of the FCC
(Mt/yr)Efficiency
(%)NOx in/out concentration
(mg/Nm3 @ 3 % O2
Investment(EUR
million)
Operating cost(EUR
million/yr)
Specificremoval cost (4)
(EUR/t of NOxremoved)
1.5 60 800 / >320 5.40.6 (1)
0.1 – 0.4 1300
1.5 60 - 80 200 / 40-80 0.35 - 1.5(1) 0.05 - 0.4 17001. Cost data not including the cost of the CO boiler
Table 4.7: Economics of SNCR applied to FCCs
Driving force for implementationReduction of NOx emissions.
Example(s)It has been applied in Japan on an FCCU where a CO boiler provides a sufficient temperaturewindow.
Reference literature[115, CONCAWE, 1999], [45, Sema and Sofres, 1991], [316, TWG, 2000]
Techniques to consider in the determination of BAT Chapter 4
Mineral Oil and Gas Refineries 189
4.5.9 Particulate abatement techniques
The selection of the catalyst can be seen as a particulate abatement technique. That techniquehas been included in Section 4.5.6 together with other possible effects of catalyst replacement.
4.5.9.1 Additional cyclones
DescriptionHighly specialised cyclones are used (third-stage and multicyclones), which are designed to suitthe arrangement, dimensions, contours, velocities, pressures and densities of the particles to beremoved. This is the natural first choice of clean-up device for particulates: these areconventional cyclones, fitted externally to the regenerator but operating on the same principle asthe internal first and second cyclones. They are high-velocity devices and recovered catalyst isreturned to a dust hopper.
Achieved environmental benefitsBy reducing the particulate content in the air, the metal emissions are reduced. Depending onthe above factors, cyclones are generally efficient at removing particles in the range of 10 to 40microns and above. Efficiencies can range from 30 to 90 %. An average performance figure forcyclone separation alone is in the region of 100 - 400 mg/Nm3. (Inlet concentration from 400 - 1000 mg/Nm3). Lower concentrations are not achievable because inlet velocities to thecyclones are in the region that causes additional attrition, which produces additional fines thatpass the cyclone. The fine catalyst disposal is 300 - 400 tonnes/yr per unit. Cyclones are moreeffective for coarser particles and they have been designed essentially to prevent any particlesgreater than 10 microns from entering downstream facilities.
Cross-media effectsCatalyst fines recovered are considered as waste (300 - 400 tonnes/yr per unit). Consequentlypollution is transferred from air to the soil.
Operational dataIt generates a pressure drop in the flue gas. Good performance and reliability in many FCCs.
ApplicabilityApplicable to any FCC.
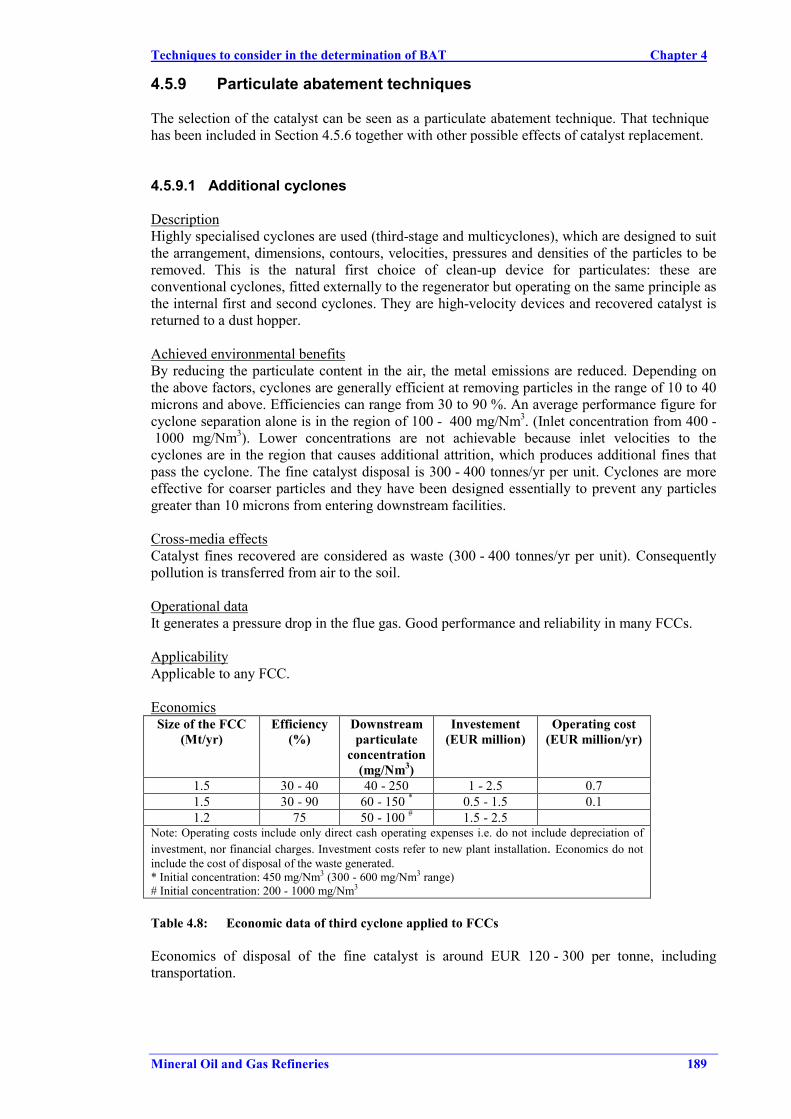
EconomicsSize of the FCC
(Mt/yr)Efficiency
(%)Downstreamparticulate
concentration(mg/Nm3)
Investement(EUR million)
Operating cost(EUR million/yr)
1.5 30 - 40 40 - 250 1 - 2.5 0.71.5 30 - 90 60 - 150 * 0.5 - 1.5 0.11.2 75 50 - 100 # 1.5 - 2.5
Note: Operating costs include only direct cash operating expenses i.e. do not include depreciation ofinvestment, nor financial charges. Investment costs refer to new plant installation. Economics do notinclude the cost of disposal of the waste generated.* Initial concentration: 450 mg/Nm3 (300 - 600 mg/Nm3 range)# Initial concentration: 200 - 1000 mg/Nm3
Table 4.8: Economic data of third cyclone applied to FCCs
Economics of disposal of the fine catalyst is around EUR 120 - 300 per tonne, includingtransportation.
Chapter 4 Techniques to consider in the determination of BAT
190 Mineral Oil and Gas Refineries
Driving force for implementationTo improve control of emission of particulates. Tertiary cyclones can be also used to protectdownstream equipment such as heat or power recovery units (e.g. expander blades).
Example plantsMany FFC units are operating with these systems.
Reference literature[45, Sema and Sofres, 1991], [80, March Consulting Group, 1991], [297, Italy, 2000], [115,CONCAWE, 1999]
4.5.9.2 Electrostatic precipitators
DescriptionA short description of an electrostatic precipitator can be found in Section 4.23.4.
Achieved environmental benefitsTypical particulate emission levels achieved with electrostatic precipitators range from10 - <50 mg/Nm3 of particulate matter in the flue gas of the FCC regenerator. This level isbased on averaged continuous monitoring, excluding soot blowing. The range depends on thetype of catalysts, the mode of FCC operation and whether other pretreatment techniques areimplemented before the ESP. Particulate abatement measures in FCC with electrostaticprecipitators with efficiency greater than 99.8 %. Efficiency is not dependent on particulate sizeor on flue gas velocity and the pressure drop is very marginal. As a consequence of theparticulate reduction, the metals (Ni, Sb, V and their components) can be reduced to less than 1mg/Nm3 (given as Ni, Sb and V total) and, within that, Ni and its components can be reduced toless than 0.3 mg/Nm3 (given as Ni). (Half-hourly mean values attainable in continuousoperation and with soot blowing in the CO boiler). Particulate emissions from the FCC can thusbe reduced to 1.1 - 2.3 kg/h.
Cross-media effectsBecause these systems recover the fine particulates (mainly catalyst) coming from the FCC, therefinery may need extra facilities to manage the fine particulates recovered. ESPs also consumeelectricity.
Operational dataElectrostatic precipitators cause a very slight pressure drop. The extra energy consumption isrelatively low, but they consume electricity. They also require high maintenance to keep thecapture efficiency high. Continuous monitoring of particulates is not amongst the most reliablecontinuous monitoring systems. Information from a EU+ refinery shows that the use of deep-desulphurisation of the feedstock have a great impact of the electrostatic properties of theparticulates (because content of sulphur and metals are smaller) reducing the availability of theESP to catch those particulates. In those cases, they have reported that the best valuesachievable are 30 – 35 mg/Nm3.
ApplicabilityBecause the FCC outflows to be treated are large (1.5Mt/yr FCC generates 2.8 million Nm3/day)and the flow gas speeds should be low to increase the capture of particulates, these systemsrequire a lot of space. ESP may be difficult to apply if high electrical resistivity particulates areto be captured.
Techniques to consider in the determination of BAT Chapter 4
Mineral Oil and Gas Refineries 191
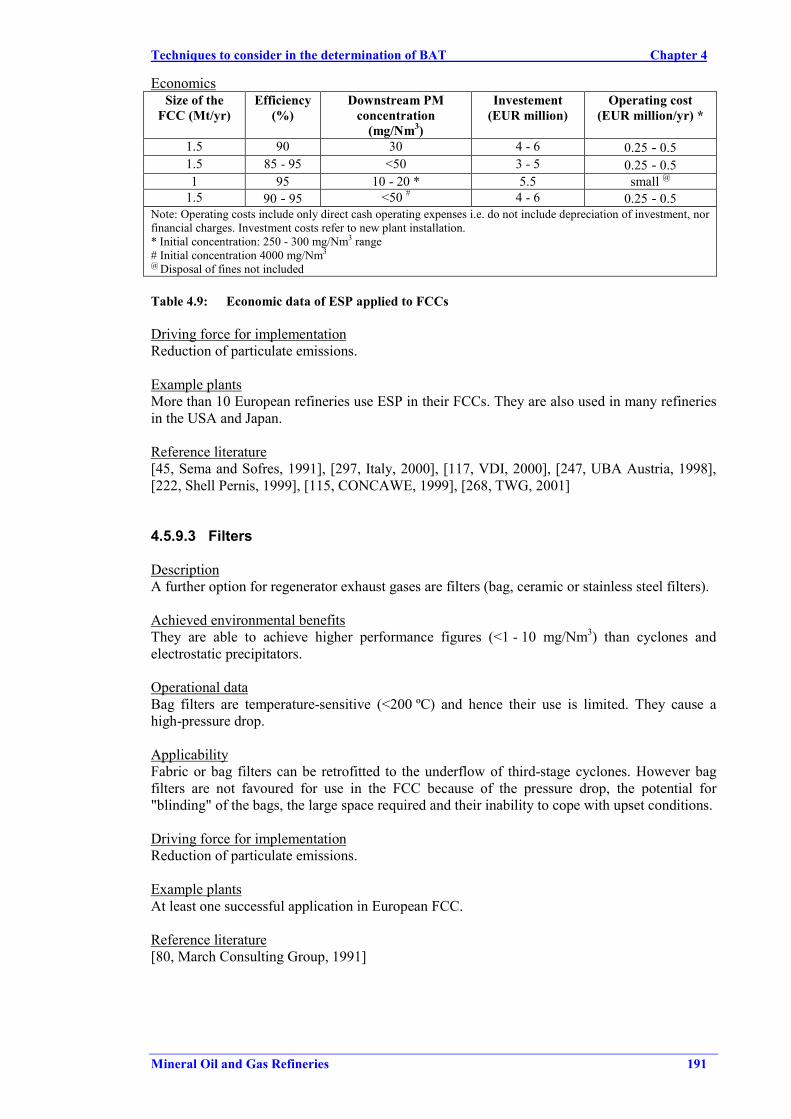
EconomicsSize of the
FCC (Mt/yr)Efficiency
(%)Downstream PM
concentration(mg/Nm3)
Investement(EUR million)
Operating cost(EUR million/yr) *
1.5 90 30 4 - 6 0.25 - 0.51.5 85 - 95 <50 3 - 5 0.25 - 0.51 95 10 - 20 * 5.5 small @
1.5 90 - 95 <50 # 4 - 6 0.25 - 0.5Note: Operating costs include only direct cash operating expenses i.e. do not include depreciation of investment, norfinancial charges. Investment costs refer to new plant installation.* Initial concentration: 250 - 300 mg/Nm3 range# Initial concentration 4000 mg/Nm3
@ Disposal of fines not included
Table 4.9: Economic data of ESP applied to FCCs
Driving force for implementationReduction of particulate emissions.
Example plantsMore than 10 European refineries use ESP in their FCCs. They are also used in many refineriesin the USA and Japan.
Reference literature[45, Sema and Sofres, 1991], [297, Italy, 2000], [117, VDI, 2000], [247, UBA Austria, 1998],[222, Shell Pernis, 1999], [115, CONCAWE, 1999], [268, TWG, 2001]
4.5.9.3 Filters
DescriptionA further option for regenerator exhaust gases are filters (bag, ceramic or stainless steel filters).
Achieved environmental benefitsThey are able to achieve higher performance figures (<1 - 10 mg/Nm3) than cyclones andelectrostatic precipitators.
Operational dataBag filters are temperature-sensitive (<200 ºC) and hence their use is limited. They cause ahigh-pressure drop.
ApplicabilityFabric or bag filters can be retrofitted to the underflow of third-stage cyclones. However bagfilters are not favoured for use in the FCC because of the pressure drop, the potential for"blinding" of the bags, the large space required and their inability to cope with upset conditions.
Driving force for implementationReduction of particulate emissions.
Example plantsAt least one successful application in European FCC.
Reference literature[80, March Consulting Group, 1991]
Chapter 4 Techniques to consider in the determination of BAT
192 Mineral Oil and Gas Refineries
4.5.9.4 Control and re-use of the catalyst fines
DescriptionSignificant quantities of catalyst fines are often present around the FCCU catalyst hoppers,reactor and regeneration vessels as well as those collected by the abatement techniquesmentioned above. The fines can be collected and recycled before being washed to the sewers ormigrating off-site via the wind. Those techniques may be considered as a housekeepingmeasures, included in Section 4.15. Some techniques to consider are:� dry sweeping the catalyst fines and sending the solids to be recycled or disposed of as non-
hazardous waste.� use of vacuum ducts in dusty areas (and vacuum hoses for manual collection) which run to a
small baghouse for collection.� recycling opportunities for the fines (cement production).
Achieved environmental benefitsReduce the emission of particulates.
ApplicabilityFully applicable especially during catalyst loading/unloading processes.
Driving force for implementationReduction of soil contamination by particulates.
Example plantsTechniques already in use in USA refineries.
Reference literature[80, March Consulting Group, 1991]
4.5.9.5 Removal of catalyst from slurry decant oil
DescriptionTwo types of techniques have been applied to improve separation of catalyst from slurry decantoil from the slurry settler used in catcracker: a) One system incorporates high voltage electricfields to polarize and capture catalyst particles from decant oil. b) The amount of catalyst finesreaching the decant oil can be also be minimized by installing high-efficiency cyclones in thereactor to shift catalyst fines losses of the decant oil to the regenerator, where they can becollected by any particulate abatement technique.
Achieved environmental benefitsDecant oil sludge from the FCC can contain significant concentrations of catalyst fines. Thesefines often prevent the use of decant oil as a feedstock and require treatment which generates anoily catalyst sludge. Catalysts in the decant oil can be minimized by using a decant oil catalystremoval system.
Operational dataCatalyst fines suspended in the separator underflow are recycled back to the reactor.
ApplicabilityHydrocyclones are applied in many FCC units.
Driving force for implementationReduction of consumption of catalyst and reduction of the decant oil sludge.
Example plantsHydrocyclones, for removal of catalyst fines, are successfully applied in many FCCs.
Techniques to consider in the determination of BAT Chapter 4
Mineral Oil and Gas Refineries 193
Reference literature[316, TWG, 2000]
4.5.10 Sulphur oxides abatement techniques
This section contains sulphur oxides abatement techniques that may be applicable to FCCs.
4.5.10.1 DeSOx catalyst additive
DescriptionSulphur dioxide in the regenerator off-gas of an FCC unit can be reduced by using a catalyst(metal (e.g. Al/Mg, Ce) oxide) which transfers a significant portion of the sulphur associatedwith the coke on the catalyst to the reactor, where it is liberated as hydrogen sulphide. Thisleaves the reactor with the cracked vapour product for capture in the refinery’s amine scrubbingsystem and hence conversion of sulphur in the SRU. DeSOx is a 3-step process: a) oxidation ofSO2 to SO3 catalysed by cerium, b) adsorption of SO3 produced in the regenerator to give asulphate which, on return to the reactor, c) reverts to the oxide and releases hydrogen sulphideinto the product gas stream for recovery.
Achieved environmental benefitsThe amount of SOx removed is dependent on the amount of deSOx additive added to the unit,but removal efficiency is typically 20 - 60 % in full combustion mode. This technique canremove up to 30 % of SOx when used in the partial combustion mode. Typical downstreameffluent has a SO2 concentration of 1300 to 3000 mg/Nm3 @ 3 % O2 (initial concentration 4250mg/Nm3 @ 3 % O2, feedstock sulphur approximately 2.5 %).
Cross-media effectsDisadvantages of the process are:• deSOx additive is more efficient in full burn mode. However, full burn implies more SOx
and NOx formation than partial combustion mode• possible poorer yield of products from FCC unit• reduced FCC unit operating flexibility• other impacts are the increased energy consumption and the possibility of bottlenecks in the
H2S handling facilities.
ApplicabilityThis technique is sensitive to unit design, especially regenerator conditions. It operates mosteffectively under full oxidising conditions, when as much as 50 % of the sulphur in the fluegases can be removed. Unit performance may, however, be affected and transfer catalystreplacement rate may be significant.
EconomicsThere are no major investment costs required for this option, save for the dosing equipment forintroducing the additive to the catalyst system. Operating expenses are around 0.34 - 0.7 EUR/t(EUR 1 million/yr for a 1.5 Mt/yr FCC). Another reference gives a typical cost of EUR 3million/yr (1997) for the catalyst for a gas flow of 200000 Nm3/h (2.3 Mt/yr FCC). Cost ishighly dependent on the unit, the initial SO2 emissions and the SO2 target.
Driving force for implementationReduction of sulphur oxide emissions from the FCC.
Example plant(s)Many refineries have applied deSOx additives to the catalyst. The method is well establishedcommercially.
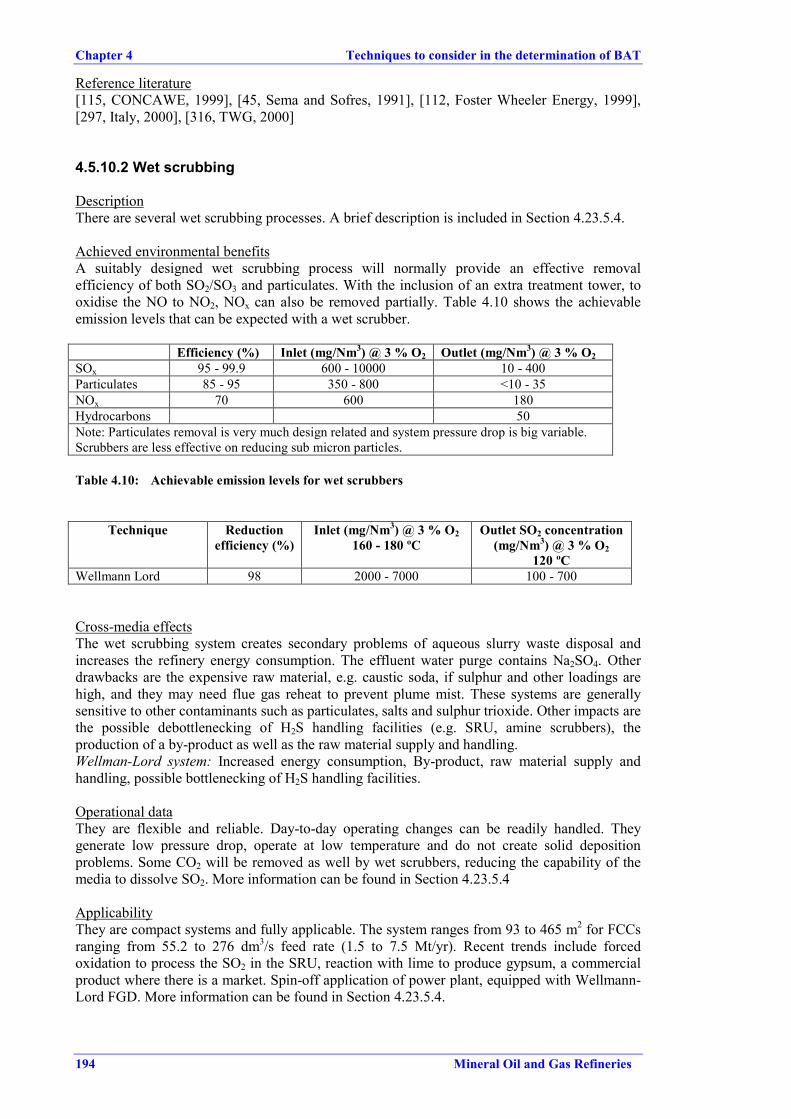
Chapter 4 Techniques to consider in the determination of BAT
194 Mineral Oil and Gas Refineries
Reference literature[115, CONCAWE, 1999], [45, Sema and Sofres, 1991], [112, Foster Wheeler Energy, 1999],[297, Italy, 2000], [316, TWG, 2000]
4.5.10.2 Wet scrubbing
DescriptionThere are several wet scrubbing processes. A brief description is included in Section 4.23.5.4.
Achieved environmental benefitsA suitably designed wet scrubbing process will normally provide an effective removalefficiency of both SO2/SO3 and particulates. With the inclusion of an extra treatment tower, tooxidise the NO to NO2, NOx can also be removed partially. Table 4.10 shows the achievableemission levels that can be expected with a wet scrubber.
Efficiency (%) Inlet (mg/Nm3) @ 3 % O2 Outlet (mg/Nm3) @ 3 % O2SOx 95 - 99.9 600 - 10000 10 - 400Particulates 85 - 95 350 - 800 <10 - 35NOx 70 600 180Hydrocarbons 50Note: Particulates removal is very much design related and system pressure drop is big variable.Scrubbers are less effective on reducing sub micron particles.
Table 4.10: Achievable emission levels for wet scrubbers
Technique Reductionefficiency (%)
Inlet (mg/Nm3) @ 3 % O2160 - 180 ºC
Outlet SO2 concentration(mg/Nm3) @ 3 % O2
120 ºCWellmann Lord 98 2000 - 7000 100 - 700
Cross-media effectsThe wet scrubbing system creates secondary problems of aqueous slurry waste disposal andincreases the refinery energy consumption. The effluent water purge contains Na2SO4. Otherdrawbacks are the expensive raw material, e.g. caustic soda, if sulphur and other loadings arehigh, and they may need flue gas reheat to prevent plume mist. These systems are generallysensitive to other contaminants such as particulates, salts and sulphur trioxide. Other impacts arethe possible debottlenecking of H2S handling facilities (e.g. SRU, amine scrubbers), theproduction of a by-product as well as the raw material supply and handling.Wellman-Lord system: Increased energy consumption, By-product, raw material supply andhandling, possible bottlenecking of H2S handling facilities.
Operational dataThey are flexible and reliable. Day-to-day operating changes can be readily handled. Theygenerate low pressure drop, operate at low temperature and do not create solid depositionproblems. Some CO2 will be removed as well by wet scrubbers, reducing the capability of themedia to dissolve SO2. More information can be found in Section 4.23.5.4
ApplicabilityThey are compact systems and fully applicable. The system ranges from 93 to 465 m2 for FCCsranging from 55.2 to 276 dm3/s feed rate (1.5 to 7.5 Mt/yr). Recent trends include forcedoxidation to process the SO2 in the SRU, reaction with lime to produce gypsum, a commercialproduct where there is a market. Spin-off application of power plant, equipped with Wellmann-Lord FGD. More information can be found in Section 4.23.5.4.
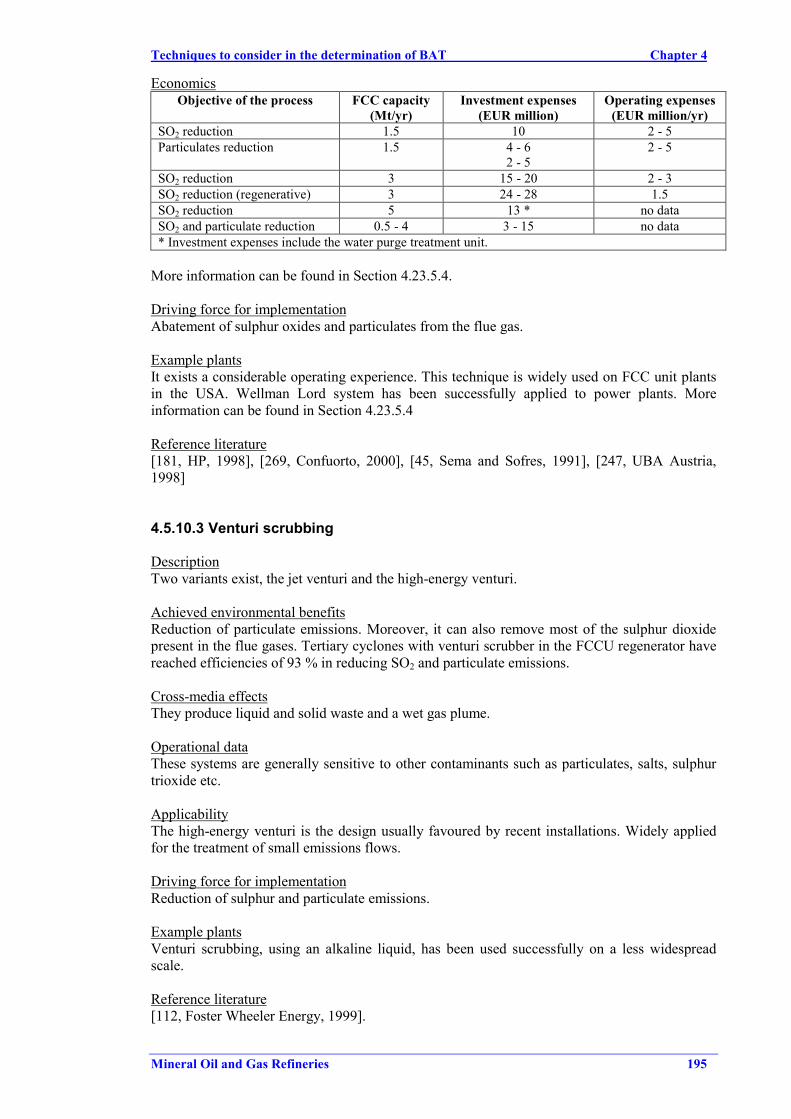
Techniques to consider in the determination of BAT Chapter 4
Mineral Oil and Gas Refineries 195
EconomicsObjective of the process FCC capacity
(Mt/yr)Investment expenses
(EUR million)Operating expenses
(EUR million/yr)SO2 reduction 1.5 10 2 - 5Particulates reduction 1.5 4 - 6
2 - 52 - 5
SO2 reduction 3 15 - 20 2 - 3SO2 reduction (regenerative) 3 24 - 28 1.5SO2 reduction 5 13 * no dataSO2 and particulate reduction 0.5 - 4 3 - 15 no data* Investment expenses include the water purge treatment unit.
More information can be found in Section 4.23.5.4.
Driving force for implementationAbatement of sulphur oxides and particulates from the flue gas.
Example plantsIt exists a considerable operating experience. This technique is widely used on FCC unit plantsin the USA. Wellman Lord system has been successfully applied to power plants. Moreinformation can be found in Section 4.23.5.4
Reference literature[181, HP, 1998], [269, Confuorto, 2000], [45, Sema and Sofres, 1991], [247, UBA Austria,1998]
4.5.10.3 Venturi scrubbing
DescriptionTwo variants exist, the jet venturi and the high-energy venturi.
Achieved environmental benefitsReduction of particulate emissions. Moreover, it can also remove most of the sulphur dioxidepresent in the flue gases. Tertiary cyclones with venturi scrubber in the FCCU regenerator havereached efficiencies of 93 % in reducing SO2 and particulate emissions.
Cross-media effectsThey produce liquid and solid waste and a wet gas plume.
Operational dataThese systems are generally sensitive to other contaminants such as particulates, salts, sulphurtrioxide etc.
ApplicabilityThe high-energy venturi is the design usually favoured by recent installations. Widely appliedfor the treatment of small emissions flows.
Driving force for implementationReduction of sulphur and particulate emissions.
Example plantsVenturi scrubbing, using an alkaline liquid, has been used successfully on a less widespreadscale.
Reference literature[112, Foster Wheeler Energy, 1999].
Chapter 4 Techniques to consider in the determination of BAT
196 Mineral Oil and Gas Refineries
4.5.10.4 Dry and semi-dry scrubbers
DescriptionTwo types of techniques exist: dry and semi-dry. The key component of the semi-dry process isa spray dryer in which the hot flue gas is contacted with a spray of fine droplets of lime slurry.The SO2 is absorbed into the droplets, forming reaction products which are dried to a finepowder by the hot flue gas. Both dry and semi-dry processes require downstream dustarrestment systems, such as an electrostatic precipitator or bag filtration. More information canbe found in Section 4.23.5.4.
Achieved environmental benefitsReduction of the SO2 in the flue gas. Efficiency of the processes: 90 % sulphur removal withsemi-dry process and about 50 % removal with dry process. Dry process efficiency of 50 % isobtained with lime at relatively high temperature (about 400 ºC) when Ca/S=1 or at130 - 140 ºC with Ca/S=2. The Ca/S ratio has a major influence. With reactant such asNaHCO3, the abatement rate would be much higher. With lime, it is also possible to have atreatement at 900 ºC in a reactor big enough to have a reasonable residence time. The abatementin this case is 80 % with CaS= 2.1 and 90 % with Ca/S=3.
Cross-media effectsDeposition of solid waste results in case that the reaction products cannot fullfill the qualityneeded by consumers. Other drawbacks are:• high pressure drops across the bag filters if are used• increased dust load in gas stream; need for dust capture• operational difficulties in water/heat balance (spray dryers only)• possibly significant pressure drop across bag filter dust arrestment plant, e.g. bag filters• generation of solid waste: 1 tonne of SO2 reduction entails about 2.5 tonnes of solid wastes
being generated• with the dry- and semidry scrubbers a mixture of CaSO3, CaSO4, fly-ash and lime is
produced.
Operational dataThese systems are generally sensitive to other contaminants such as particulates, salts, sulphurtrioxide etc.
ApplicabilityOperate at low-temperature end of system. Waste generated can be difficult to re-use (no marketfor gypsum), and difficult to landfill (landfill use to be severely restricted in near future).
EconomicsDry process is a relatively low cost solution. Raw materials for those processes are cheap.Capital cost and operating costs typically less than wet scrubbing. Investment cost around EUR15 - 20 million, and operating cost around EUR 2 - 3 million/yr (lime cost + landfill wastedisposal).
Reference literature[112, Foster Wheeler Energy, 1999], [257, Gilbert, 2000], [45, Sema and Sofres, 1991], [297,Italy, 2000]
4.5.10.5 Seawater scrubbing
DescriptionThis scrubbing uses the natural alkalinity of the seawater to remove SO2. More information canbe found in Section 4.23.5.4.
Techniques to consider in the determination of BAT Chapter 4
Mineral Oil and Gas Refineries 197
Achieved environmental benefitsSO2 recovery can be as high as 99 %. In order to reduce the particulate emissions to theseawater, a particulate abatement technique should be included before the flue gas is treated inthe seawater scrubber. In this way, seawater scrubbing can be seen as a transfer of the remainingpollution from air to seawater.
Cross-media effectsParticulates containing metals (e.g. V, Ni, Sb) and other pollutants from the flue gas aretransferred to the seawater. The sulphur content of the effluent seawater from the process itselfis increased by only approximately 3 %.
Operational dataThe system needs electrical power (seawater pumps, aeration fans and flue gas fan) andseawater. It is feasible to use spent cooling water, for example, when seawater is used as coolingwater. The need for seawater is roughly 15000 - 20000 m3/h per tonne of sulphur removed.Special attention should be paid to minimise corrosion and the maintenance derived from it.
ApplicabilityThe feasibility of applying seawater scrubbing is site-dependent. The process needs access toseawater in large amounts at a competitive cost. Fully applied for fuels up to 1.5 % of sulphur.This system normally is applied after a particulate abatement technique to avoid contaminationof sea environment by particulates (containing metals).
EconomicsSeawater scrubber annual costs depend on size and SOx in/out. The cost is comparable to wetscrubbers. Typical investement cost is in the order of EUR 60 /net kWe output of the powerplant. The main operating cost is the electrical power for operation of the technique.
Driving force for implementationReduction of SO2 emissions.
Example plantsSystem applied to some power plants aroung the world and one proven commercial applicationin FCC, Norway.
Reference literature[278, Alstom Power, 2000]
4.5.10.6 Wet gas sulphuric acid process (WSA)
DescriptionSee Section 4.23.5.4.
Achieved environmental benefits99 % reduction of SO2 and some reduction of NOx. In combination with a SCR, simultaneousreduction of NOx 95 %.
Reference literature[247, UBA Austria, 1998]
Chapter 4 Techniques to consider in the determination of BAT
198 Mineral Oil and Gas Refineries
4.5.11 Combined abatement techniques
DescriptionThere are processes on the market that include an ESP, a SCR for NOx, catalytic oxidation ofSO2 and production of sulphuric acid. More information about this technique can be found inSection 4.23.3.
Achieved environmental benefitsPollutant Efficiency of removal Concentration in the
outlet (mg/Nm3)SO2 >94 %NOx ≥90 %Particulates < 10
The integrated system produces also sulphuric acid of 95 % w/w.
Cross-media effectsSee each of the particular techniques included in this process.
Operational dataSee each of the particular techniques included in this process.
ApplicabilityProcess qualified for treating very high SO2 concentrations in the flue gas.
EconomicsDesign capacity 1000000 Nm3/hInvestment cost 100 EUR million
Driving force for implementationReduction of emissions of SO2, NOx and particulates.
Example plantsApplied to FCC and coking flue gas.
Reference literature[297, Italy, 2000]
4.5.12 Waste management techniques
DescriptionWaste is generated during the FCC processes. The selection of catalyst used in the FCC, controlof the emissions of particulates and the proper management of product and slurry tank bottomscan reduce the generation of waste. Also the implementation of benchmark performance on thewaste generation may be an incentive on how and how much the total amount of waste can bereduced.
Achieved environmental benefitsReduction of waste generation.
Operational dataThose techniques can be seen as part of the waste management programme of a refinery.
ApplicabilitySee Section 4.5.6 for applicability restriction of selection of catalyst.

Techniques to consider in the determination of BAT Chapter 4
Mineral Oil and Gas Refineries 199
Driving force for implementationReduction of waste management cost and losses of catalyst.
Example plantsApplied in many refineries.
Reference literature[268, TWG, 2001]
Chapter 4 Techniques to consider in the determination of BAT
200 Mineral Oil and Gas Refineries
4.6 Catalytic reforming
The first two techniques considered are process techniques and the rest are techniques for theprevention or control of emissions from the catalytic reforming processes.
4.6.1 Continuous catalytic reformer
DescriptionIn the continuous process, the catalyst is regenerated continuously and maintained at highactivity. Catalyst is regenerated in one external reactor. More information can be found inSection 3.6.
Achieved environmental benefitsThis process has a higher energy efficiency than semi-regenerative due to the heat recoveryfrom products, from pumparounds and due to integration with topping and vacuum.
Cross-media effectsIt generates more dioxins than semi-regenerative during the regeneration of the catalyst. Formore information, see Section 3.6.
Operational dataIt operates at lower pressures (6 - 14 bar) than and at the same temperature as semi-regenerativeprocesses. It uses bi-metallic catalysts (Pt-Re, Pt-Sn). Hydrogen is also produced in thoseprocesses. Continuous regeneration reformer produces around 350 Nm3 of hydrogen per tonneof feedstock. As increased coke laydown and thermodynamic equilibrium yields of reformateare both favoured by low-pressure operation, the ability to maintain high catalyst activities andselectivities by continuous catalyst regeneration is the major advantage of the continuous typeof unit.
ApplicabilityFully applicable.
EconomicsInvestment cost based in 3975 m3/d continuous octanizing unit, battery limits, erected cost, 1998Gulf Coast: 10000 USD per m3/d. The erected cost based in 3180 m3/d has been of USD 48.3million ($15200 per m3/d). In addition, catalyst costs add another USD 2.6 million. Costs are4Q95 US Gulf Coast.
Driving force for implementationProduction process. The biggest disadvantage for the future is the high content of aromatics(70 - 75 %) in CCR product. A lot of refineries will have great difficulty in reaching thegasoline specifications of 35 %v/v for aromatics as from 2005 onwards.
Example plant(s)Nowadays, only continuous catalytic reformer units are built.
Reference literature[212, Hydrocarbon processing, 1998], [166, Meyers, 1997], [268, TWG, 2001]
4.6.2 Semiregenerative reformer
DescriptionA brief description can be found in Section 2.6.
Techniques to consider in the determination of BAT Chapter 4
Mineral Oil and Gas Refineries 201
Achieved environmental benefitsHeat integration is lower than in the case of continuous reformers. However, manysemiregenerative units have applied better feed effluent exchange to minimise energyconsumption.
Cross-media effectsIn semi-regenerative reforming, the unit catalyst is regenerated at intervals of 3 to 24 months,depending upon the intensity of the process. The emission factor of dioxins per tonne offeedstock is much lower than in the case of continuous regeneration. For more information, seeSection 3.6.
Operational dataThe reactors operate at temperature in the range of 400 - 560º C and pressures in the range of20 - 50 bar. This type of process produces between 130 and 200 Nm3 of hydrogen per tonne offeedstock.
ApplicabilityFully applicable.
EconomicsThe erected cost of a semiregenerative unit of 3180 m3/d is 33 million USD (10400 $ per m3/d).In addition, catalyst costs add another 3.4 million USD. Costs are 4Q95 US Gulf Coast.
Driving force for implementationProduction process.
Example plantsMany applications exist in Europe as well as in the rest of the world.
Reference literature[261, Canales, 2000], [166, Meyers, 1997]
4.6.3 Type of catalyst promoter
DescriptionOzone depleting substances (e.g. carbon tetrachloride) are sometimes used during theregeneration of the catalyst of the reformer. Emissions of such substances should be avoided orat least minimized by using less harmful substitutes or by using them in confined compartments.
Achieved environmental benefitsOptimisation and reduction of use of catalyst promoters and ozone-depleting substances.
Cross-media effectsDue to the use of chlorinated compounds, the possibility of emissions of dioxins and furanesduring generation has been detected. Refer to Section 3.6.
Operational dataPromoters should be handled in enclosed systems.
Example plantsMost refiners have switched to lower ozone depleting substances such as perchloroethyleneduring the regeneration of the reforming catalyst.
Reference literature[80, March Consulting Group, 1991]
Chapter 4 Techniques to consider in the determination of BAT
202 Mineral Oil and Gas Refineries
4.6.4 Cleaning of the regeneration flue gas
DescriptionRegenerator flue gas containing HCl, H2S, small quantities of catalyst fines, traces of Cl2, SO2and dioxins can be sent to a scrubber prior to to release to atmosphere. The storage and handlingof organic chlorides used during the regeneration may also lead to releases. In some reformers afurther filter trap of Cl2 (ZnO/NaCO3 or NaOH over alumina) is installed.
Achieved environmental benefitsReduction of particulates and volatile acids (HCl, H2S). It has been reported that Cl2 filter alsotraps dioxins.
Cross-media effectsThe recirculated and bleed streams from the regeneration flue gas wash should be sent to thewaste water treatment plant. Due to low pH of this waste water stream, neutralisation prior tobiological treatment may be necessary. The use of scrubber can move some dioxins from the airto a water emission.
ApplicabilityFully applicable. Cl2 trap has been used in continuous reformers.
Driving force for implementationReduction of air pollutants
Reference literature[112, Foster Wheeler Energy, 1999], [268, TWG, 2001]
4.6.5 Electrostatic precipitator in the regeneration flue gas
DescriptionRegenerator flue gas containing HCl, H2S, small quantities of catalyst fines, traces of Cl2, SO2and dioxins can be sent to an electrostatic precipitator prior to release to atmosphere. Otheractivities as venting during catalyst regeneration or replacement and plant cleaning may be sentto the ESP.
Achieved environmental benefitsReduction of particulate content in the flue gas coming from the regenerator.
Cross-media effectsSee Section 4.23.4.2
ApplicabilityEmissions from continuous regeneration sections require particular attention. The use of thistype of systems in semiregenerative units is less extended because almost no exists mechanismfor the generation of catalyst fines.
Driving force for implementationReduction of particulate emissions during the catalyst regeneration.
Reference literature[112, Foster Wheeler Energy, 1999], [268, TWG, 2001]
Techniques to consider in the determination of BAT Chapter 4
Mineral Oil and Gas Refineries 203
4.6.6 Dioxins formation in catalytic reforming units
DescriptionReferring to Sections 3.6 and sections in 4.6 on catalytic reforming, dioxins are typically formedin the three types (continuous, cyclic and semiregenerative) of catalytic reforming during theregeneration of the catalyst.
If the regenerator flue gas is treated in a water scrubber (e.g. Section 4.6.4), the dioxins havebeen appeared detectable in waste water from the scrubber, but they have not been detected afterthe WWTP, possibly because dilution effects.
In some other cases, because the use of other techniques as fixed bed filters have result in acombine reduction of chlorine and dioxins. In some cases, activated carbon has been used toremove dioxins. Other techniques that have been used is the recirculation of regeneration ventgases. However this last one is not clear how it can reduce the emission of dioxins.
The study of dioxins emissions from reformers and how the regeneration conditions may affectthose emission can be a good technique to start to understand and solve the problem.
Achieved environmental benefitsKnowledge of the problem and control of the dioxin emissions.
Cross-media effectsSome dioxins from the regenerator gases may be transferred to water via scrubbing.
Driving force for implementationKnowledge of the formation of dioxins in regeneration of the catalyts.
Example plantsSome EU+ refineries have already applied and monitored dioxins emission from catalyticreformers. Techniques as chlorine trap and recirculation of vents have not been reported thathave been applied to semiregenerative reformers.
Reference literature[268, TWG, 2001]
Chapter 4 Techniques to consider in the determination of BAT
204 Mineral Oil and Gas Refineries
4.7 Coking processes
The first four techniques considered in this section are coking processes. The information givenis intended to help in assessing how well coking processes can perform from the environmentalpoint of view. The rest of the techniques are related to the cleaning of the coke gas, the use ofthe coking process to destroy solid residues/sludges and, finally, those techniques related withthe abatement of pollution generated by the coking processes.
4.7.1 Delayed coking
DescriptionA description of this process can be found in Section 2.7. The techniques that may be applied tothe delayed coker to prevent emissions are the following:1. uncondensable vapours generated in the coking processes should not pass to the flare
system2. pressure reliefs from the coke drums should pass to the quench tower3. techniques for coke drum quench tower arrestment train to include consideration of venting
the final emission to a flare header with the possible elimination of the second tower andblowdown pond
4. water use in the delayed coker is treated in Section 4.7.75. steam generated in this process can be used to heat up other refinery processes6. the delayed coking process itself has a low level of heat integration. The heat to maintain
the coke drums at coking temperature is supplied by heating the feed and the recycle streamin a furnace. However, the atmospheric residue and/or vacuum residue can be fed straightinto the delayed coking unit without intermediate cooling, which results in a high heat-integration level between the different units and saves a considerable amount of capital onheat exchangers
7. use of coking gas. The energy efficiency of the coker can be further increased if the cokegas is combusted in a gas turbine of a combined cycle unit. Extra information on theapplication of refinery fuel gas in combined cycle units appears in Section 4.10.
Achieved environmental benefitsReductions of VOC emissions, recovery of products and reduction of H2S emissions areachieved when applying some of the above-mentioned techniques. Water re-use is alsopromoted by the application of those techniques.
Operational dataSome operational data of delayed cokers can be found in Section 3.7.
ApplicabilityDelayed coking is fully applicable. It is normally applied when the production of petroleumcoke has a market or when high quality coke is required to produce anodes for the non-ferrousmetal industry.
EconomicsTypical investment of a full delayed coker (basis 1Mt/yr straight run vacuum residue feed, U.S.Gulf Coast 1998, fuel grade coke, includes vapour recovery): 136250 - 218000 USD per t/yr.
Driving force for implementationProduction process.
Example plantsMany delayed processes exist in Europe as well as in the rest of the world. Delayed coking isthe most commonly used technology in the refinery sector.
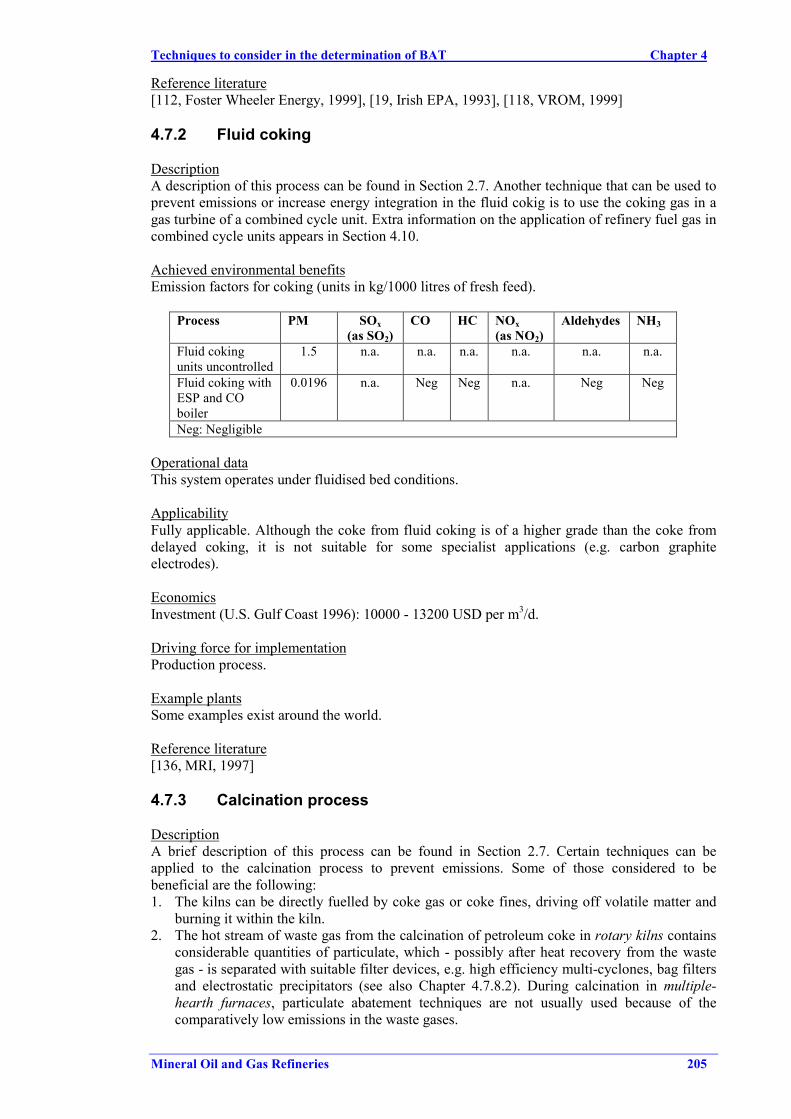
Techniques to consider in the determination of BAT Chapter 4
Mineral Oil and Gas Refineries 205
Reference literature[112, Foster Wheeler Energy, 1999], [19, Irish EPA, 1993], [118, VROM, 1999]
4.7.2 Fluid coking
DescriptionA description of this process can be found in Section 2.7. Another technique that can be used toprevent emissions or increase energy integration in the fluid cokig is to use the coking gas in agas turbine of a combined cycle unit. Extra information on the application of refinery fuel gas incombined cycle units appears in Section 4.10.
Achieved environmental benefitsEmission factors for coking (units in kg/1000 litres of fresh feed).
Process PM SOx(as SO2)
CO HC NOx(as NO2)
Aldehydes NH3
Fluid cokingunits uncontrolled
1.5 n.a. n.a. n.a. n.a. n.a. n.a.
Fluid coking withESP and COboiler
0.0196 n.a. Neg Neg n.a. Neg Neg
Neg: Negligible
Operational dataThis system operates under fluidised bed conditions.
ApplicabilityFully applicable. Although the coke from fluid coking is of a higher grade than the coke fromdelayed coking, it is not suitable for some specialist applications (e.g. carbon graphiteelectrodes).
EconomicsInvestment (U.S. Gulf Coast 1996): 10000 - 13200 USD per m3/d.
Driving force for implementationProduction process.
Example plantsSome examples exist around the world.
Reference literature[136, MRI, 1997]
4.7.3 Calcination process
DescriptionA brief description of this process can be found in Section 2.7. Certain techniques can beapplied to the calcination process to prevent emissions. Some of those considered to bebeneficial are the following:1. The kilns can be directly fuelled by coke gas or coke fines, driving off volatile matter and
burning it within the kiln.2. The hot stream of waste gas from the calcination of petroleum coke in rotary kilns contains
considerable quantities of particulate, which - possibly after heat recovery from the wastegas - is separated with suitable filter devices, e.g. high efficiency multi-cyclones, bag filtersand electrostatic precipitators (see also Chapter 4.7.8.2). During calcination in multiple-hearth furnaces, particulate abatement techniques are not usually used because of thecomparatively low emissions in the waste gases.
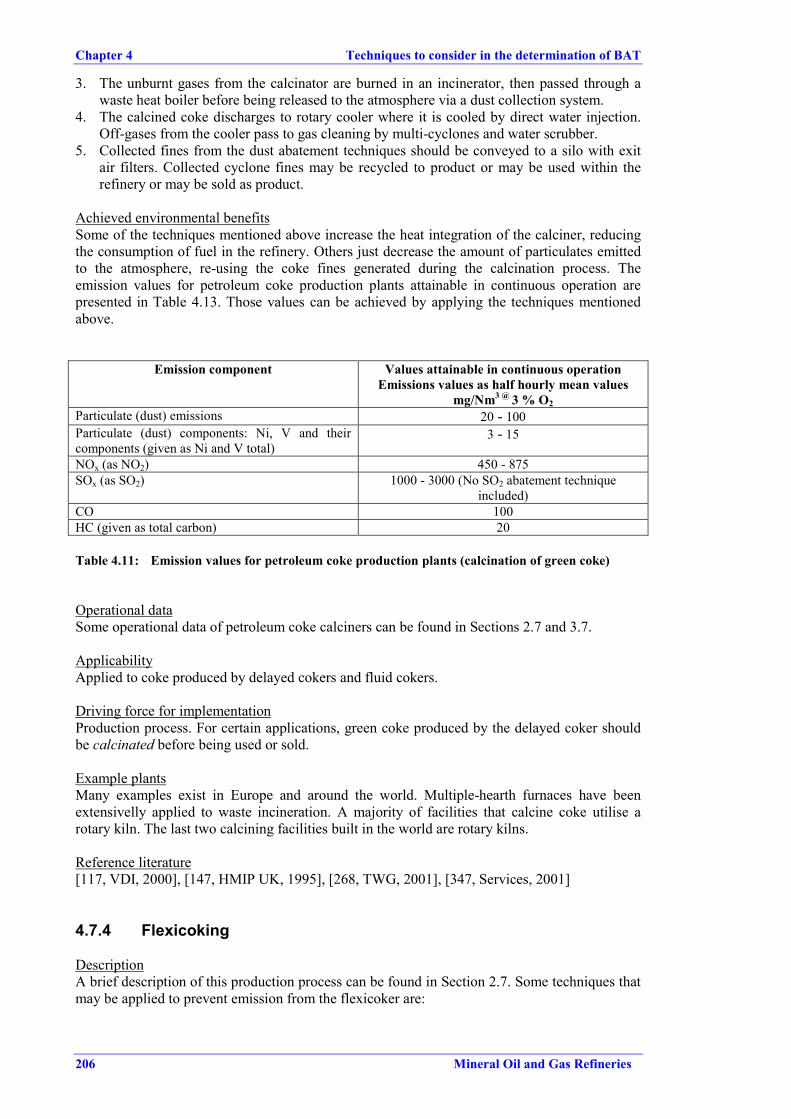
Chapter 4 Techniques to consider in the determination of BAT
206 Mineral Oil and Gas Refineries
3. The unburnt gases from the calcinator are burned in an incinerator, then passed through awaste heat boiler before being released to the atmosphere via a dust collection system.
4. The calcined coke discharges to rotary cooler where it is cooled by direct water injection.Off-gases from the cooler pass to gas cleaning by multi-cyclones and water scrubber.
5. Collected fines from the dust abatement techniques should be conveyed to a silo with exitair filters. Collected cyclone fines may be recycled to product or may be used within therefinery or may be sold as product.
Achieved environmental benefitsSome of the techniques mentioned above increase the heat integration of the calciner, reducingthe consumption of fuel in the refinery. Others just decrease the amount of particulates emittedto the atmosphere, re-using the coke fines generated during the calcination process. Theemission values for petroleum coke production plants attainable in continuous operation arepresented in Table 4.13. Those values can be achieved by applying the techniques mentionedabove.
Emission component Values attainable in continuous operationEmissions values as half hourly mean values
mg/Nm3 @ 3 % O2Particulate (dust) emissions 20 - 100Particulate (dust) components: Ni, V and theircomponents (given as Ni and V total)
3 - 15
NOx (as NO2) 450 - 875SOx (as SO2) 1000 - 3000 (No SO2 abatement technique
included)CO 100HC (given as total carbon) 20
Table 4.11: Emission values for petroleum coke production plants (calcination of green coke)
Operational dataSome operational data of petroleum coke calciners can be found in Sections 2.7 and 3.7.
ApplicabilityApplied to coke produced by delayed cokers and fluid cokers.
Driving force for implementationProduction process. For certain applications, green coke produced by the delayed coker shouldbe calcinated before being used or sold.
Example plantsMany examples exist in Europe and around the world. Multiple-hearth furnaces have beenextensivelly applied to waste incineration. A majority of facilities that calcine coke utilise arotary kiln. The last two calcining facilities built in the world are rotary kilns.
Reference literature[117, VDI, 2000], [147, HMIP UK, 1995], [268, TWG, 2001], [347, Services, 2001]
4.7.4 Flexicoking
DescriptionA brief description of this production process can be found in Section 2.7. Some techniques thatmay be applied to prevent emission from the flexicoker are:
Techniques to consider in the determination of BAT Chapter 4
Mineral Oil and Gas Refineries 207
1. The flexicoking process has a high level of heat integration. The only source of heat in theFlexicoker process is the gasifier, where the coke is partially oxidised. The remainder of theheat in the coker gas is recovered by generating steam. The energy efficiency can be furtherincreased if the coke gas is combusted in a gas turbine of a combined cycle unit. SeeSection 4.10.
2. As coke cutting from drums is not needed, emissions and dirty effluent generation areavoided compared to delayed coking. Moreover, the sulphur components from the coke gasare easy to eliminate. Some 84 - 88 % w/w of the hydrocarbon feed is recovered ashydrocarbon product, the remainder is converted into CO, CO2 and H2O.
3. The coke gas from the heater is passed through a cyclone set to remove the coarser cokeparticles and is subsequently cooled by generation of high-pressure steam and by preheatingboiler feed water. About 75 % of coke fines which pass through the two stages of heatercyclones are recovered in tertiary cyclones. Almost all the coke fines which escape thetertiary cyclones are scrubbed out in the venturi scrubber. The water slurry from the venturiscrubber is steam stripped to remove absorbed hydrogen sulphide and ammonia.
Achieved environmental benefits1. Increases the energy efficiency of the flexicoking process.2. Generates less waste than delayed coking.3. Prevents particulate, hydrogen sulphide and ammonia emissions.
Operational dataSome operational data for flexicokers can be found in Sections 2.7. and 3.7.
ApplicabilityFully applicable. However, because the products from flexicoking are different than othercoking processes (e.g no coke is produced) the implementation of this option typically shouldconsider the refinery product requirements.
EconomicsInvestment (basis U.S. Gulf Coast 1996): 15100 - 19500 US$ per m3/d (typical).
Driving force for implementationProduction process.
Example plantsMany examples exist in Europe, USA and the rest of the world.
Reference literature[212, Hydrocarbon processing, 1998], [271, Martinez del Pozo, 2000]
4.7.5 Use of oily sludges and/or waste as coker feedstock
DescriptionIn refineries with a coker, oily sludges, sludges from the waste water treatment and waste can bedestroyed in the coker (delayed, fluid or flexicoker). In the case that coke is produced, the cokequality produced should remains acceptable (acceptable with respect to further use as fuelwithin/outside refinery or as material for other purposes). Many oily sludges can be sent to acoking unit where they become part of the refinery products. In the case of delayed coker, thesludge can be injected into the coke drum with the quench water, or injected into the cokerblowdown contactor used in separating the quenching products.
Achieved environmental benefitsReduction of the amount of sludge and/or waste produced in the refinery. In principle anyrefinery with a coker is able to reduce its oily sludge production to ‘zero’ with the exceptionwhere high quality coke requirements that restrict its use.
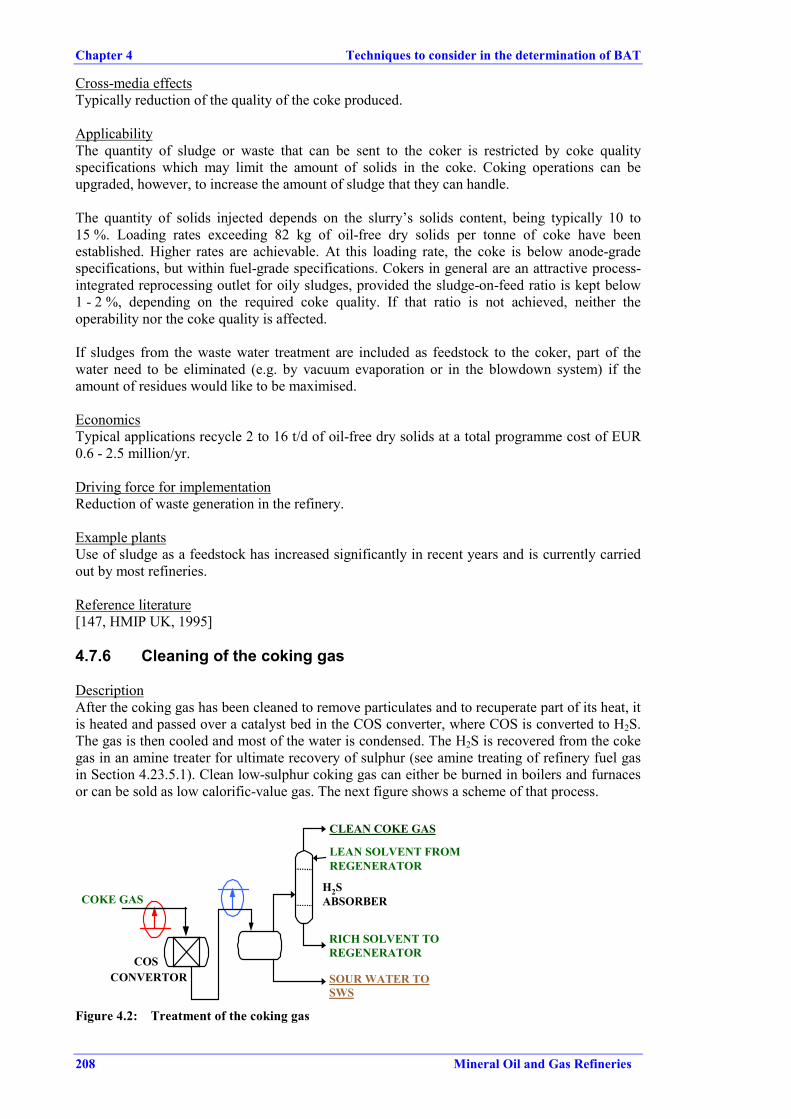
Chapter 4 Techniques to consider in the determination of BAT
208 Mineral Oil and Gas Refineries
Cross-media effectsTypically reduction of the quality of the coke produced.
ApplicabilityThe quantity of sludge or waste that can be sent to the coker is restricted by coke qualityspecifications which may limit the amount of solids in the coke. Coking operations can beupgraded, however, to increase the amount of sludge that they can handle.
The quantity of solids injected depends on the slurry’s solids content, being typically 10 to15 %. Loading rates exceeding 82 kg of oil-free dry solids per tonne of coke have beenestablished. Higher rates are achievable. At this loading rate, the coke is below anode-gradespecifications, but within fuel-grade specifications. Cokers in general are an attractive process-integrated reprocessing outlet for oily sludges, provided the sludge-on-feed ratio is kept below1 - 2 %, depending on the required coke quality. If that ratio is not achieved, neither theoperability nor the coke quality is affected.
If sludges from the waste water treatment are included as feedstock to the coker, part of thewater need to be eliminated (e.g. by vacuum evaporation or in the blowdown system) if theamount of residues would like to be maximised.
EconomicsTypical applications recycle 2 to 16 t/d of oil-free dry solids at a total programme cost of EUR0.6 - 2.5 million/yr.
Driving force for implementationReduction of waste generation in the refinery.
Example plantsUse of sludge as a feedstock has increased significantly in recent years and is currently carriedout by most refineries.
Reference literature[147, HMIP UK, 1995]
4.7.6 Cleaning of the coking gas
DescriptionAfter the coking gas has been cleaned to remove particulates and to recuperate part of its heat, itis heated and passed over a catalyst bed in the COS converter, where COS is converted to H2S.The gas is then cooled and most of the water is condensed. The H2S is recovered from the cokegas in an amine treater for ultimate recovery of sulphur (see amine treating of refinery fuel gasin Section 4.23.5.1). Clean low-sulphur coking gas can either be burned in boilers and furnacesor can be sold as low calorific-value gas. The next figure shows a scheme of that process.
LEAN SOLVENT FROMREGENERATOR
COSCONVERTOR
CLEAN COKE GAS
H2SABSORBER
SOUR WATER TOSWS
RICH SOLVENT TOREGENERATOR
COKE GAS
Figure 4.2: Treatment of the coking gas
Techniques to consider in the determination of BAT Chapter 4
Mineral Oil and Gas Refineries 209
Achieved environmental benefitsReduction of the emissions of H2S (less than 100 ppm v/v) and COS.
Cross-media effectsIncreased use of the amine scrubbing system and increased energy consumption of the COSconvertor.
Operational dataFor amine scrubbing see Section 4.23.5.1.
ApplicabilityAmine scrubbing is applied to all types of cokers and COS convertor to flexicokers.
EconomicsEconomics of the amine absorption of H2S can be found in Section 4.23.5.1
Driving force for implementationCleaning of the coke gas. Coke gas forms a main refinery gas source (after dust removal, COSconversion and amine treating for H2S removal).
Example plantsThese systems can be found in many cokers.
Reference literature[118, VROM, 1999]
4.7.7 Water use in the cooling/cutting process
DescriptionThe water used in the cutting/cooling operations is continuously recirculated with a bleed-off tothe refinery waste water treatment. Settling and filtering over a vacuum filter enables the re-useof this water, resulting in a 'closed water loop'. For water make-up to the quenching and cuttingwater loop, various effluent streams can be used. For this duty treated effluent could be used.Collected water from any condenser, and for draining of wet green coke, should be re-used forcoke drum quenching or drilling. This type of cooling is not used in any other process in therefinery because of environmental concern. More information about direct cooling (quenching)is found in Section 2.8.
Achieved environmental benefitsReduce consumption of water in the refinery.
Cross-media effectsCutting and cooling process result in vapour emissions (partially recycled in the mainfractionator), significant energy losses, large water use and severe water pollution. Bleeding ofcutting water to the desalter has the potential to add solids to the effluent, so it is best to keepcoker waters separate.
Operational dataThe amount of required make-up water depends on the evaporation losses and the bleed to otherprocesses or to the waste water treatment plant and amounts to about 10 - 20 m3/h for a 106 t/yrdelayed coker unit.
ApplicabilityApplicable when delayed coking is used. Re-use of water is subjected to restrictions of cokequality.
Chapter 4 Techniques to consider in the determination of BAT
210 Mineral Oil and Gas Refineries
Driving force for implementationTechnique typically used in the delayed coking process.
Example plantsMany examples of application exist in the world.
Reference literature[268, TWG, 2001]
4.7.8 Handling and storage of the coke
DescriptionSeveral techniques are suitable to reduce particulate emissions that may occur during thehandling of the coke (green and calcined):1. providing the green coke is kept wet, the handling between the discharge and the calciner
feed hopper is not problematic. There is the possibility of parts of the receiving pit dryingout although this is limited as the coke is very wet and is covered with residualhydrocarbons which tend to make it stick together. The construction of wind-breaks aroundthe pit might be considered. Careful design is essential, as bad design could make thesituation worse. Complete enclosure of the pit and associated handling facilities is anotherpossibility. The pits are very large and such an enclosure would be very expensive. Amonitoring programme should be carried out to evaluate if this option is in fact necessary ordesirable
2. cut the coke into a double-roll crusher, for example, and convey it to an intermediate storagesilo. The railway waggons are then loaded from the storage silo. This approach wouldcollect, filter, and dewater the coke prior to storage
3. spray the coke with a very fine layer of oil, which sticks the dust fines to the coke. The useof oil is limited by its acceptability in further processing. The oil option has the addedadvantage of reducing unloading problems
4. covered and de-pressurised conveyor belts5. aspiration systems to extract or collect dust6. use of an enclosed hot blowdown system7. loading areas could be enclosed and positive/negative pressures maintained, exhausting
through bag filters. As alternative dust extraction systems can be incorporated with loadingequipment.
8. collected fines from the cyclones are pneumatically conveyed to a silo with exit air filters.Dust collection systems are provided for handling, storage and loading, using bag filters.Collected fines are re-cycled to storage by enclosed means.
Achieved environmental benefitsEliminates releases to air of particulates (containing metals) from this part of the process duringroutine operation as well as from the storage of the coke. Achievable release level of particulatematter for solids handling is 25 mg/Nm3 (value based on averaged continuous monitoring).
Operational dataAdditionally, the storage silo provides a buffering capacity for process fluctuations and enablesa controlled loading of railway waggons.
Applicability3. Oling coke is sometimes practised in fluid and calcined coke, but is rarely applied withdelayed coke.8. That technique is mostly applicable to calciners, fluid cokers and flexicoking units.
EconomicsThe investment cost of about EUR 30 million for a typical coking unit with a capacity of 1.5Mt/yr may be expected for the storage system.
Techniques to consider in the determination of BAT Chapter 4
Mineral Oil and Gas Refineries 211
Driving force for implementationReduction of coke spillage. If the petroleum coke is cut directly from the coking units intorailway hopper waggons, it may cause overfilling of the waggons, degrading the quality of thespilled coke and increasing the amount of solids entering the waste water treatment system.Reduction of particulate emissions from the storage system of the coker.
Example plantsMany examples available in European refineries.
Reference literature[261, Canales, 2000], [80, March Consulting Group, 1991], [117, VDI, 2000], [268, TWG,2001]
4.7.9 Techniques to reduce air emissions
This chapter mentiones where the abatement techniques may be used and describes thetechniques used for abatement of air pollutants.
4.7.9.1 Particulate abatement in coking processes
DescriptionFlue gases and coke gas from coking processes normally contain coke particulates (includingmetals). Dust collection systems are then used in some parts of the coking processes.1. cleaning of coke gas2. cleaning of the gas produced during the coke cooling3. incinerated exhaust gases from the calcinator also produce coke fines. Hot flue gases pass
through a waste heat boiler and gas cleaning by a dust collection system.
In addition to the particulate abatement technique used in the FCC (Cyclones or ESP inSection 4.5.9) that may be also used here, bag filters can be used in this processes.
Achieved environmental benefitsAchievable release levels of particulate matter (values based on averaged continuousmonitoring) from calciners and coolers are 10 - 100 mg/Nm3.
Cross-media effectsSee Section 4.5.9.
Operational dataSee Section 4.5.9. The application of ESP for the control of particulate emission from petroleumcoke calciner have shown some difficulties to achieve the lower end of the range. The mainreason is that coke is a very good conductor of electricity and consequently its surface is verydifficult to be electrically charged and consequently difficult to be catch by the ESP.
ApplicabilitySee Section 4.5.9. The application of high efficiency cyclones are easier to be applied than ESP.
EconomicsBag filters can be used at a cost of about EUR 5 million EUR. Calciner boiler cyclones costEUR 225000 (1999). Economics for other type of systems are not available. An economic studydone in a EU+ refinery in 1992 shown that the cost for an ESP for a calciner was high.
Driving force for implementationReduce the particulate emissions from the calciner.
Chapter 4 Techniques to consider in the determination of BAT
212 Mineral Oil and Gas Refineries
Example plantsMany examples are available in European refineries that have coking processes.
Reference literature[147, HMIP UK, 1995] [60, Balik and Koraido, 1991], [297, Italy, 2000], [272, Shawcross,2000], [117, VDI, 2000], [268, TWG, 2001]
4.7.9.2 SO2 abatement techniques
DescriptionSulphur oxides are emitted during the coking processes, especially during the calcinationprocesses. The principal option to reduce sulphur dioxide releases from the process is the use ofthe lowest possible sulphur-content feedstocks. In practice, low-sulphur feeds are typically usedfor product quality reasons, since a substantial part of the sulphur remains fixed in the product.However, this option is not always possible and emissions of SO2 may be significant, especiallyduring the calcining process. To control those sulphur oxide emissions, the same abatementtechniques that may be used in the FCC may be also used in this process (Section 4.5.10 and4.23.5.4) with the exception of the DeSOx catalyst additive.
Achieved environmental benefitsSO2 concentration of 25 - 300 mg/Nm3 is achieved when the techniques mentioned in theSection 4.5.10 are used.
Cross-media effectsSection 4.5.10
Operational dataSection 4.5.10
ApplicabilityNormally applied to calciner flue gases.
EconomicsSection 4.5.10
Driving force for implementationReduction of SO2 emissions.
Example plantsSome examples of these techniques can be seen in some European and worldwide refineries.
Reference literature[297, Italy, 2000] and references in Section 4.5.10
4.7.9.3 Combined abatement techniques
The same types of techniques used in the FCC can be used in the coker. More information canbe found in Section 4.5.11.
4.7.10 Techniques to prevent emissions to water
This chapter analyses the ways to prevent emissions to effluents. Techniques used in the finalcleaning of the waters generated in the coking processes are in Section 4.24.
Techniques to consider in the determination of BAT Chapter 4
Mineral Oil and Gas Refineries 213
4.7.10.1 Treatment of the waste water
In the coking processes, sour water is generated (steam condensate). Consequently, all waterfrom the coking process is send to the sour water stripper (Section 4.24.2) before being sent tothe waste water treatment plant.
4.7.10.2 Separation of the oil/coke fines from the coke-cutting water
DescriptionThe proposed pollution prevention alternative was to retrofit the sump where the oil/coke finesare collected with an inclined plate separator to increase the separation efficiency.
Achieved environmental benefitsCoke fines and water generated from the coke-cutting operation enter an in-ground sump wherethe solids and water are separated by gravity. A refinery study indicated that over twenty-fivetonnes a year of coke fines entered the sewer system from that separator.
EconomicsThe annual cost saving associated with the increased recovery of product (coke) and thereduction in oil/water separation solids was approximately EUR 300000 (7.5 Mt/yr refinery).
Driving force for implementationReduce the coke fines entering in the sewer system.
Reference literature[60, Balik and Koraido, 1991]
4.7.11 Techniques to reduce soil contamination
4.7.11.1 Control and re-use of the coke fines
DescriptionCoke fines are often present around the coker unit and coke storage areas. The coke fines can becollected and recycled before being washed to the sewers or migrating off-site via the wind.Collection techniques include dry sweeping the coke fines and sending the solids to be recycledor disposed of as non-hazardous waste. Another collection technique involves the use ofvacuum ducts in dusty areas (and vacuum hoses for manual collection) which run to a smallbaghouse for collection.
Achieved environmental benefitsReduced soil contamination by coke particulates (including metals). Coke fines can be recycledfor fuel use or can be sold outside (e.g. cement production).
Cross-media effectsElectricity consumption by vacuum ducts/hoses.
ApplicabilityFully applicable.
Driving force for implementationReduction of soil contamination.
Example plant(s)Techniques already in use on USA refineries.
Reference literature[60, Balik and Koraido, 1991]
Chapter 4 Techniques to consider in the determination of BAT
214 Mineral Oil and Gas Refineries
4.8 Cooling systems
Under the IPPC process, a horizontal BREF on industrial cooling systems has been produced.The following topics of relevance to refineries are already described and analysed in that BREF:
1. Reduction of direct energy consumption2. Reduction of water requirements3. Reduction of entrainment4. Reduction of emissions to water5. Reduction of air emissions6. Reduction of noise emissions7. Reduction of risk of leakage8. Reduction of biological risk
The description and analysis includes an extensive discussion of environmental benefits ofsystems, cross-media effects, operational data, applicability and economics. To avoid repetition,therefore, this section on cooling addresses only topics not covered by that horizontal BREF.
4.8.1 Segregation of cooling and process waters
DescriptionBecause process waters are normally more contaminated than cooling waters, it is important tomaintain the segregation of the two. Only in cases where cooling waters need treatment(recirculation systems) should they be mixed, and then only at the right point (after the primarytreatment of the process waters).
Achieved environmental benefitsIt reduces the contamination of cooling water by oil coming from other waters. It increases therecovery of oil by the waste water plant.
Cross-media effectsNo cross-media effect has been found.
ApplicabilityWaste water treatment plant need to be sized to handle to the process water flow and the coolingwater flow. Segregation can be very costly in some parts of existing installations.
Driving force for implementationAvoid the contamination of cooling water by process waters, which are usually morecontaminated. Some of the topics dealing with pollution of water from cooling systems havealready been studied in the OSPAR and HELCOM processes (North sea and Baltic sea region).
Reference literature[107, Janson, 1999], OSPAR, HELCOM recommendations.
4.8.2 Air cooling
DescriptionSee Section 2.8 and BREF on cooling.
Achieved environmental benefitsThe major advantage of using air coolers is that no additional medium is required.
Techniques to consider in the determination of BAT Chapter 4
Mineral Oil and Gas Refineries 215
Cross-media effectsTend to produce more noise than water cooling. Noise production due to air cooler fan is97 - 105 dB(A) at source.
Operational dataA major disadvantage is, that normally a large plot is required when compared to water coolers(5 – 30 m2/MWth duty). It requires electricity but minimal maintenance cost
ApplicabilityAir cooling can be sufficient for the cooling needs in some parts of the refinery processes.Ambient conditions restrict the temperature levels that can be attained. Climatic conditions (hotclimates or temperatures below 0 ºC) typically restrict its use. However the plant location isindependent of water availability. They cannot be located near buildings because air short-circuiting may occur.
EconomicsAir coolers can be expensive. Minimal maintenance cost.
Example plantsMany examples exists in EU refineries.
Reference literature[316, TWG, 2000], [119, Bloemkolk and van der Schaaf, 1996]
4.8.3 Prevention of oil leakages into cooling water
DescriptionLooses of oil throught leaks can be minimised through continuous monitoring and a kind ofLeack Detection and Repare system (similar as that reference for VOC in Section 4.23.6.1). Atits simplest, this comprises monitoring of the cooling water separators for oil build-up. If this isobserved, then it will be necessary to trace back through the system to identify the source of theleak so that corrective action can be taken. Detailed system drawings are essential for thisactivity. Fingerprinting of the oil can also speed up identification of the leak. A furtherrefinement is to install oil in water monitors at various point in the cooling water sytem. Thisallows leaks to be detercted rapidly and corrective action taken. For this procedure to beeffective, sparing of critical heat exchangers will be required. More information in the coolingBREF.
Achieved environmental benefitsReduction of oil leakages into cooling water
Driving force for implementationDetect and correct oil leakages into cooling water.
Reference literature[316, TWG, 2000], [119, Bloemkolk and van der Schaaf, 1996]
Chapter 4 Techniques to consider in the determination of BAT
216 Mineral Oil and Gas Refineries
4.9 Desalting
4.9.1 Good desalting practices
DescriptionA short description of desalters can be found in Section 2.9. Several good desalting designshave been included in this section:1. multistage desalters and the combined use of AC and DC fields provide high desalting
efficiencies as well as energy savings2. recycling, in multistage desalters, part of the brine effluent water of second desalters to the
previous one minimises the wash water quantity3. use a low shear mixing device to mix desalter wash water and crude4. avoid turbulence in desalter vessels by using lower water pressure.
Achieved environmental benefitsIncreased efficiency of desalters may reduce wash water usage. Other environmental benefitswould be limited to energy savings, if any, related to a more efficient electric field.
Operational dataTwo-stage processes achieve 99 % or better efficiency (more than 99 % of the salts/solids areremoved from the crude oil). This high efficiency provides process benefits because it allowsless corrosion in the topping units.
ApplicabilityTwo-stage or even three-stage desalting is used either if the crude oil salt content is higher than0.02 %w/w, or if heavy residue is further catalytically processed.
Driving force for implementationIncrease the efficiency of the desalting process.
Reference literature[113, Noyes, 1993], [297, Italy, 2000], [268, TWG, 2001]
4.9.2 Enhance the oil/water separation before discharge to the wastewater treatment plant
DescriptionTechniques that may be applied are:1. transfer the water effluent from desalting units to a settling drum where a further separation
between oil and water can be achieved. The oil can be directly recovered in the slop system2. choice of optimum interface level controllers. As a function of specific gravity and range of
crudes processed, it is possible to consider the most accurate level sensors amongdisplacers, capacitance probes or radio wave detectors. The accuracy of interface levelcontrol is fundamental for the good operation of a desalter.
3. a good improvement in water-oil separation can be achieved using “wetting”agents, whoseaim is to de-oil the solid contaminants that are usually responsible for a significantentrainment of oil in the water
4. use of non-toxic, biodegradable, safe to use, non-flamable specific demulsifying chemicalsto promote coalescense of the water droplets.
Achieved environmental benefitsSystems described above enhance the oil/water separation, reducing the charge of oil to thewaste water treatment and recycling it to the process as well as reductions in the oily sludgegeneration (see Section 4.9.3). With the application of the first technique mentioned above some
Techniques to consider in the determination of BAT Chapter 4
Mineral Oil and Gas Refineries 217
10 - 20 % less oil is sent to the API separators. The second one can separate off some 5 - 10 %oil from the water phase.
Cross-media effectsSome of the techniques proposed need the application of chemicals.
ApplicabilityFully applicable.
Driving force for implementationEnhance the oil/water separation
Reference literature[297, Italy, 2000]
4.9.3 Enhance the solid/water-oil separation
DescriptionSolids entering the crude distillation unit are likely eventually to attract more oil and produceadditional emulsions and sludges. The amount of solids removed from the desalting unit should,therefore, be maximized. Then the objective is to minimize solids leaving the desalter with thecrude oil. A number of techniques can be used such as:1. use low-shear mixing devices to mix desalter wash water and crude oil2. use low-pressure water in the desalter to avoid turbulence3. replace the water jets with mud rakes. They cause less turbulence when removing settled
solids4. the water phase (suspension) can be separated in a pressurised plate separator. Alternatively
a combination of a hydrocyclone desalter and a hydrocyclone de-oiler can be used5. evaluate the effectiveness of a sludge wash system. The sludge washing is a batch operation
meant to stir the water phase in the desalter to suspend and remove the solids accumulatedon the vessel bottom. This cleaning operation increases the efficiency of desalters duringnormal run, particularly for long cycle runs.
Achieved environmental benefitsWith the application of the techniques mentioned above, the content of oil in the generatedsludges can be decreased and the separation of the sludges from the water phase can beenhanced.
Cross-media effectsThe application of these techniques increases the sludge generation within the refinery. At abottom sediment content of the crude of 0.015 % w/w, theoretically 1500 t/yr sludge can becollected in a 10 Mt/yr refinery.
ApplicabilityWhere bottoms, sediments and water are critical in downstream process units, desalters areequipped with a bottom flushing system to remove settled solids.
Driving force for implementationEnhance the separation of solids from the oil and water phase.
Example plant(s)Desalters with desludging facilities are scarce. Atmospheric residue desalters are also few, butthe number is increasing with the increasing complexity of refineries with respect to residueconversion. In a few refineries, desalters have been equipped with a bottom flushing system(See design in Figure 2.10).
Chapter 4 Techniques to consider in the determination of BAT
218 Mineral Oil and Gas Refineries
Reference literature[297, Italy, 2000]
4.9.4 Re-use of water for the desalter
DescriptionThe desalting process plays an important role in the waste water management in a refinery (seeSection 4.15.7). The water used in other processes can be re-used in the desalter. For instance, ifstripped sour water is used as desalter wash water, the ammonia, sulphides and phenols that itcontains can be reabsorbed by the crude to some extent.
The following process water streams can be suitable for use as desalter wash water:1. the accumulated water in the crude distillation unit overhead drum, usually 1 - 2 % w/w on
crude feed from steam injection2. the (unstripped) steam condensates from the light and heavy gasoil dryers and the vacuum
distiller overhead (about 3.5 % w/w on feed)3. stripped sour water and also other solid-free process water streams. Scrubber or quench
water is dirty and requires oil and solids separation prior to biotreatment and/or re-use asdesalter wash water. The sour water is routed to and stripped in a sour water stripper prior tore-use and/or final purification in effluent water treatment facilities
4. slowdowns from cooling water and boilers.
Achieved environmental benefitsBy using the water in this way, the refinery could reduce the hydraulic loading to the wastewater treatment units and reduce consumption of water.
Cross-media effectsRecycling of water streams that may form emulsions need to be avoided, because it results indeterioration of the oil/water phase separation in the desalter, which in turn leads to excessiveoil carry-over to water.
Operational dataThe scrubber water would be hard-piped to the desalter water storage tank without beingstripped first, in most cases.
ApplicabilityExamples of effluents that may form emulsions in the desalter are: bitumen blowing units,hydrocrackers, cokers (fines stabilise emulsions), other deep conversion facilities (insolublemetal sulphides that can stabilise emulsions) and HF-Alkylation units (corrosive fluoridedeposits). This option is fully applicable to new refineries and more difficult to apply in existingrefineries. This option is also limited in use when the salinity of the waste water may reachvalues that would negatively impinge on the Biox unit.
EconomicsThe costs of collecting, treating, pumping and piping these waters need to be considered.
Driving force for implementationThe refinery could reduce the hydraulic loading to the waste water treatment units and reduceconsumption of water.
Reference literature[79, API, 1993], [268, TWG, 2001]
Techniques to consider in the determination of BAT Chapter 4
Mineral Oil and Gas Refineries 219
4.9.5 Stripping of the desalter brine
DescriptionStrip desalter brine for hydrocarbons, sour components and ammonia removal before sendingbrine to waste water treatment. Recovered hydrocarbons can be blended with several refinerystreams. Acid injection can also be employed to enhance the stripping of oil from emulsions.
Achieved environmental benefitsReduction of the hydrocarbon, sulphur and ammonia content of the waste water generatedwithin the desalter. For example, phenol emissions can be reduced by 90 % and benzeneemissions by 95 %.
ApplicabilityPretreatment of desalter brine is normally applied when processing a very heavy crude. In onerefinery: 8.7 Mt/yr refinery produces a waste water flow in the crude unit of 1.3 m3 per minutecontaining 90 kg/day of phenols. The water discharge from the desalters contains a maximum of20 ppm benzene, and the quantity of desalter wash water is equivalent to 4 - 8 %v/v of the crudecharge. The discharge from the stripper bottoms, with benzene levels in the 20 ppb range, isthen routed to the waste water treatment system. A brine de-oling vessel is installed ahead of thestripping column to decant any free oil undercarry from the desalter. For the above-mentionedrefinery, with this system the phenols can be reduced to an annual emission of 3.29 kg/yr.
Reference literature[113, Noyes, 1993], [79, API, 1993]
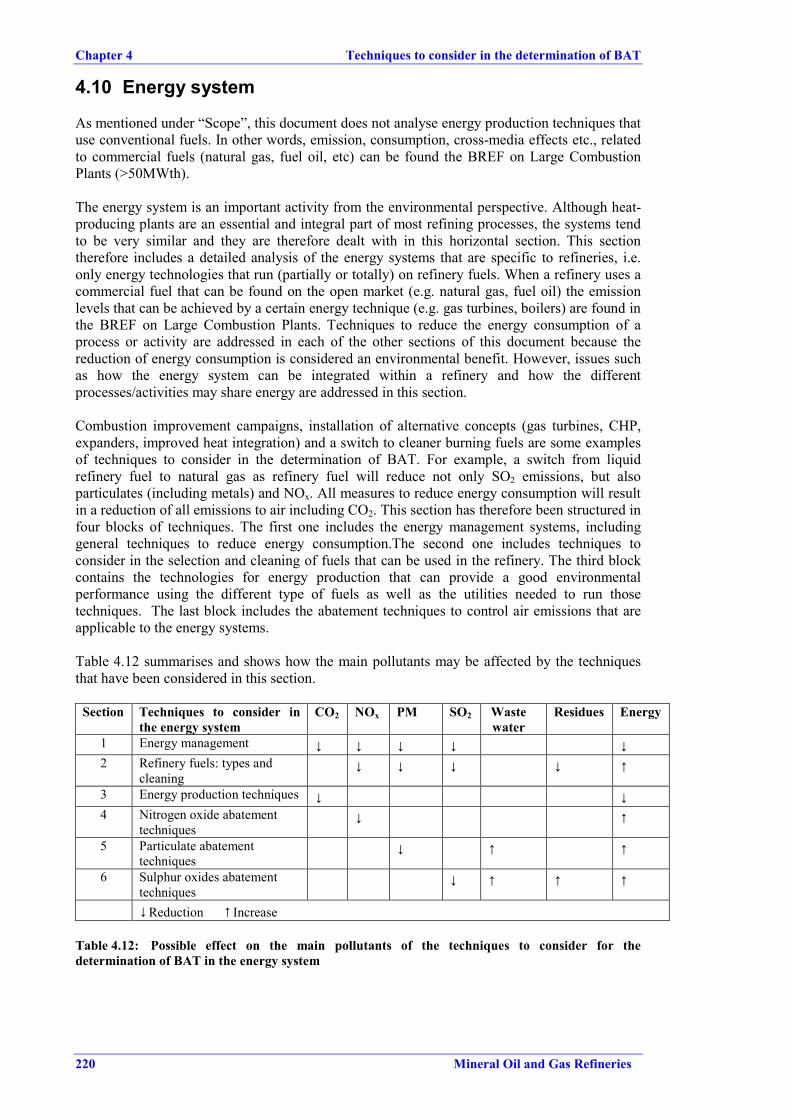
Chapter 4 Techniques to consider in the determination of BAT
220 Mineral Oil and Gas Refineries
4.10 Energy system
As mentioned under “Scope”, this document does not analyse energy production techniques thatuse conventional fuels. In other words, emission, consumption, cross-media effects etc., relatedto commercial fuels (natural gas, fuel oil, etc) can be found the BREF on Large CombustionPlants (>50MWth).
The energy system is an important activity from the environmental perspective. Although heat-producing plants are an essential and integral part of most refining processes, the systems tendto be very similar and they are therefore dealt with in this horizontal section. This sectiontherefore includes a detailed analysis of the energy systems that are specific to refineries, i.e.only energy technologies that run (partially or totally) on refinery fuels. When a refinery uses acommercial fuel that can be found on the open market (e.g. natural gas, fuel oil) the emissionlevels that can be achieved by a certain energy technique (e.g. gas turbines, boilers) are found inthe BREF on Large Combustion Plants. Techniques to reduce the energy consumption of aprocess or activity are addressed in each of the other sections of this document because thereduction of energy consumption is considered an environmental benefit. However, issues suchas how the energy system can be integrated within a refinery and how the differentprocesses/activities may share energy are addressed in this section.
Combustion improvement campaigns, installation of alternative concepts (gas turbines, CHP,expanders, improved heat integration) and a switch to cleaner burning fuels are some examplesof techniques to consider in the determination of BAT. For example, a switch from liquidrefinery fuel to natural gas as refinery fuel will reduce not only SO2 emissions, but alsoparticulates (including metals) and NOx. All measures to reduce energy consumption will resultin a reduction of all emissions to air including CO2. This section has therefore been structured infour blocks of techniques. The first one includes the energy management systems, includinggeneral techniques to reduce energy consumption.The second one includes techniques toconsider in the selection and cleaning of fuels that can be used in the refinery. The third blockcontains the technologies for energy production that can provide a good environmentalperformance using the different type of fuels as well as the utilities needed to run thosetechniques. The last block includes the abatement techniques to control air emissions that areapplicable to the energy systems.
Table 4.12 summarises and shows how the main pollutants may be affected by the techniquesthat have been considered in this section.
Section Techniques to consider inthe energy system
CO2 NOx PM SO2 Wastewater
Residues Energy
1 Energy management ↓ ↓ ↓ ↓ ↓2 Refinery fuels: types and
cleaning↓ ↓ ↓ ↓ ↑
3 Energy production techniques ↓ ↓4 Nitrogen oxide abatement
techniques↓ ↑
5 Particulate abatementtechniques
↓ ↑ ↑
6 Sulphur oxides abatementtechniques
↓ ↑ ↑ ↑
↓Reduction ↑ Increase
Table 4.12: Possible effect on the main pollutants of the techniques to consider for thedetermination of BAT in the energy system
Techniques to consider in the determination of BAT Chapter 4
Mineral Oil and Gas Refineries 221
4.10.1 Energy management
Good design and management of energy systems are important aspects of minimising theenvironmental impact of a refinery, bearing in mind the highly integrated and interdependentnature of most processes. The normal aim is to match continuously the variable production andconsumption of fuels in processes and utilities at the lowest economic and environmental cost.This section should be seen as an integration of all techniques proposed below, since an increasein the energy efficiency of a refinery can be achieved through energy conservation techniqueand heat integration/recovery techniques.
4.10.1.1 Increasing energy efficiency
DescriptionSome techniques to improve and calculate the energy efficiency within the refinery arementioned below.
a) The continuous matching of consumption at lowest cost is to be performed at allorganisational levels and to be assured at the highest management level. By the adoption of aproper management system, this can be done in a similar way to practise in a number of otherfields, notably in the field of safety. In principle the ISO 14000 system series or EMAS [285,Demuynck, 1999] provide an adequate framework to develop an adequate Energy ManagementSystem. In order to ensure continuous improvement, formal reporting of energy consumptiondata to the authorities can be instigated. Energy audits are part of such a system and it is furtherrecommended that, in the pursuit of continuous improvement, refineries learn from best practiceby participating in ranking/benchmarking activities. An annual investment plan on energyconsumption reduction is also to be included as a technique to consider in the determination ofBAT.
b) Another way to match production and consumption is to try to improve the energy efficiencywithin the refinery. More efficient refineries make better use of the energy produced within therefinery. To evaluate that, several methodologies exist, including the Solomon energy efficiencyindex (the most detailed one), specific energy consumption and (less accurate and more simple)the index relating the energy consumption to the amount of feedstock processed (Methodsdescribed briefly in Section 3.10.1). Solomon data is also available in that section. Solomondata are available in a form, that only makes sense in its context, and one needs to understandcertain underlaying (benchmarking) concepts that are proprietary to Solomon.
Techniques to increase the energy efficiency are available in next sections of this chapter.
Achieved environmental benefitsAn increase in the energy efficiency of a refinery has a direct impact reducing the air emissionsand indirectly the generation of waste water and waste. Less consumption of fuels or moreenergy conservation, increasing the likelyhood that the refinery gas supply will be sufficient forthe whole refinery.
Cross-media effectsSome difficulties have been identified in the collection of Solomon energy efficiency data fromrefineries. The main reason is that the figure is considered as confidential by both refineries andthe provider of the market study (Solomon Associates). Futhermore, Solomon Associates hasnot provided to the TWG data on the methodology used to calculate the figures. Moreover, itwas identified that not all refineries participate in this benchmarking exercise because differentreasons (e.g. cost, confidence in their figures was not high). Also not all refineries participateevery year.
Chapter 4 Techniques to consider in the determination of BAT
222 Mineral Oil and Gas Refineries
ApplicabilityFully applicable. The wide range of energy consumption in refineries means that in certainrefineries a considerable reduction in energy consumption can be realised. A concerted and wellmanaged effort based on an integrated approach in reducing energy use, improved operations,good housekeeping, adequate management and selective investment are good practices that areworth highlighting in this context.
EconomicsEnergy consumption may account for some 50 % of the total operating cost of refineries. Asconsequence a reduction in the energy consumption, or an increase in the refinery efficiency,reduce the total operating cost.
Driving force for implementationIncrease the energy performance of the refinery is typically done in refineries because reducetheir operating cost.
Example plantsMany refineries have installed an energy management system, they issue annual reports onenergy consumption performance and participate in benchmarking of energy consumption.Worldwide market studies of the wide variety of refineries (configurations/capacities) on thebasis of Equivalent Distillation Capacities has proved useful in helping refineries to comparetheir performance.
Reference literature[118, VROM, 1999], [316, TWG, 2000]
4.10.1.2 Energy conservation techniques
DescriptionA concerted and well managed effort based on an integrated approach to reduce energy use,improved operations, good housekeeping, good management and selective investments are thebest practices worth highlighting here. There follows a list of techniques that are considered forthe determination of BAT in the refinery sector. As can be seen, some of them are related toeach other in some way.
Description of the technique Performance and remarksTo have a management focus on energy To ensure decisions are made on a process-
integrated basisTo instigate an energy consumption reportingsystem
To measure progress and ensure targets are met
To instigate an incentive scheme for energysavings
To promote identification of improvement areas
To carry out energy audits on a regular basis To ensure activities are in conformance withinstructions
To have a formal energy consumption reductionplan
To set targets and strategy for improvements
To carry out combustion improvement campaigns To identify areas of improvement (e.g. air/fuelratio, stack temperature, burner configuration,furnace design)
To participate in ranking/benchmarking activitiesin energy consumption
Verification by an independent body
To review the integration between and within unitsand systems
Heat integration between units in the refinery canbe sub-optimal. “Pinch” studies
Techniques to consider in the determination of BAT Chapter 4
Mineral Oil and Gas Refineries 223
Achieved environmental benefitsAll measures to reduce energy consumption will result in a reduction of all emissions to airincluding CO2. Any energy conservation action has an impact on pollution due to the marginalfuel consumption.
ApplicabilityEspecially applicable to those refineries with very high specific energy consumption. The widerange of specific energy consumptions in refineries (by a factor of 4, see Section 3.10) meansthat in certain refineries a considerable reduction in energy consumption can be realised.
Reference literature[297, Italy, 2000], [118, VROM, 1999]
4.10.1.3 Heat integration/recovery
DescriptionActions that can be taken to improve integration and recovery of heat within a refinery toincrease efficiency can be (list do not try to be comprehensive):• general measures to reduce refinery CO2 emissions, such as optimised heat integration and
improved furnace efficiency combined with computer controlled combustion. This will leadto lower fuel consumption per tonne of crude processed
• installation of waste heat boiler in heaters• installation of expanders/power recovery• expanded heat exchanger areas in heat exchangers where cold streams are preheated by
warm product streams directly from processes• direct feed of “semiproducts” to processes without cooling and storage. It is always useful,
from an energy conservation point of view, to recover the waste heat of hot products of thecrude distillation unit, for instance, by later feeding them directly to the downstream units,rather than cooling them for storage and later feeding the downstream units from tankage
• balancing of vapour and refinery fuel gas systems• use of high-efficiency pumps and compressors• use of heat pumps• decreased film temperature and increased turbulence on heat transfer surfaces• waste heat delivery to adjacent buildings. The identification and use or opportunities for
synergy outside the refinery fence (e.g. district/industrial heating, power generation) mayreduce the cooling needs within the refinery and will reduce the consumption of fuelsomewhere else.
• application of advanced process control to optimise energy utilisation• insulation of buildings and process units (Minimisation of heat losses by thermal radiation)• optimisation of energy production (within 4.10.3).• optimise recycle gas rates, operating temperatures and pressures and steam pressure levels• minimising or even avoiding slops production and their necessary reprocessing• keeping heat exchanging surfaces clean or cleaning them regularly (good housekeeping)• repairing leaks and leaking steam traps• increase of heat exchanger surface areas of new sections of existing plants (so-called “add-
ons“). In the case more add-ons have been added to an existing plants: re-routing ofintermediate process streams and re-definition of the number of steam pressure levels andsteam duties
Achieved environmental benefitsHeat integration of process systems ensures that a substantial proportion of the heat required invarious processes is provided by exchanging heat between streams to be heated and streams tobe cooled. In a refinery, it is important to maximise heat integration in a plant to minimiseheating and cooling duty. This way, substantial amounts of products can be sold instead of
Chapter 4 Techniques to consider in the determination of BAT
224 Mineral Oil and Gas Refineries
being burnt. Heat integration/recovery techniques directly result on lower emissions of CO2,NOx, particulates and SO2 (see Section 3.10.3 for air emissions from energy system).
Cross-media effectsThe interchange of heat between processes implies the transference of disturbances from oneprocess to another. This can affect safety, so stability control systems may be required.
ApplicabilityWaste heat is abundant at refineries, and so is low/medium-pressure, low-temperature steam.Any effort to recover waste heat as low-pressure/low-temperature steam is pointless if there isno additional use for the extra steam produced. Options for using that heat need to be carefullyquantified and qualified. Heat exchangers require space. The identification and use oropportunities for synergy outside the refinery fence is some times difficult and need thecompromise not only by the refinery but also for the other part.
EconomicsIt makes economic sense to maximise heat integration in a plant, and as a result minimiseheating requirements and the cooling system burden. Heat integration/recovery offers anopportunity for energy cost savings (50 % of total operating cost of refineries), but the cost ofheat exchangers and piping need to be considered when heat integration is analysed.
Driving force for implementationEconomics because they reduce the fuel consumption.
Example plantsTechniques widely applied in refineries.
Reference literature[107, Janson, 1999], [118, VROM, 1999], [268, TWG, 2001]
4.10.1.4 Steam management
DescriptionSeveral techniques have been considered:• steam used for stripping, vacuum generation, atomisation and tracing is usually lost to waste
water and to the atmosphere. Steam used for mechanical and/or electrical energy generationand heating is usually recovered as condensate in the HP-, MP-, and LP-condensate systemsand collected in the condensate storage tank. Reducing the amount of steam stripping is anoption to reduce the generation of waste water. Stripping steam is normally used to meetflash point specification and to improve front end fractionation and yields distribution. Inorder to reduce the sour water loads to SWS strippers and reduce chemical treatments in theoverhead systems, an option would be to strip sidedraw products, particularly the lightercuts, using reboiled sidestrippers instead of steamed strippers. However, the majority ofsteam is used to strip the column bottom, which could not be reboiled by any other means,so the reduction of condensed steam would be limited anyway; besides, the stripping is farbetter under vapour stream than under reboiling conditions, because the more volatilefraction distillates off
• where inert gas as N2 is available at an economic price, it can be an alternative to steam forstripping operations, especially for the lighter ends
• optimising steam production by waste heat recovery in waste heat boilers (WHB or CHP)from hot flue gases (e.g. stacks) and hot product streams (related to the techniques shown inSection 4.10.1.3).
Achieved environmental benefitsReducing steam stripping reduces waste water generation. Reduction of energy use in steamproduction will lead to a reduced energy requirement and therefore to lower emissions to air.
Techniques to consider in the determination of BAT Chapter 4
Mineral Oil and Gas Refineries 225
Driving force for implementationEnvironmental driving force
Example plantsApplications are found in some refineries
Reference literature[297, Italy, 2000]
4.10.2 Refinery fuels: types and cleaning
As mentioned above, this document offers a detailed analysis only of refinery fuels produced inthe refinery. Whist the use of marketable fuels such as LPG, commercial fuel oil and gasoil inrefineries is a technique to consider that may be included in this chapter of the BREF, such useis extensively analysed in the LCP BREF [317, EIPPCB, 2002], which also gives achievableemissions levels using those fuels.
4.10.2.1 Increase the use of gas
DescriptionAn alternative to reduce SO2, NOx, CO2 and metals emissions from a refinery would be toreplace or to decrease the use of liquid refinery fuel with LPG – often produce on site -, refineryfuel gas (produced by some conversion techniques) or natural gas. This increase of the use ofgas is typically accompanied with a balance and control of the RFG system between suitablepressure limits to give the system flexibility, with make-up available from clean fuels such asLPG or imported gas. In those cases, an state-of-the-art controls to optimise the performance ofthe RFG is necessary.
Achieved environmental benefitsA full switch to a 100% gas-fired refinery would reduce SO2 emissions by up to 99 %, CO2 by30 - 38 % and NOx by 30 - >50 %. Releases of heavy metals would also be slashed.Furthermore, the use of gas generates very little dust and very low SO2 emissions, as therefinery gases are usually cleaned in amine scrubbers (see next section). Sulphur emissions aresignificantly lower when clean refinery fuel gas is used instead of a distillate such as automotivegasoil, i.e. 10 - 20 times better than low-sulphur (1 %) conventional fuel oil. Because of the lowSO2 concentrations in the flue gases of gas fired boilers, the emission temperatures at the stackcan be lowered to 150 °C (dew point corrosion is less of or no longer a constraint). The lowerflue gas temperature represents a difference in energy efficiency and inherent CO2 emissionreduction. Gaseous fuels typically release less NOx per unit of energy compared to liquid fuels,especially liquid refinery fuels. For gaseous fuels usually only thermal NOx is relevant. Oilburning normally leads to higher levels of NOx releases for several reasons, especially theproblem of fuel NOx arising from the nitrogen content, the need to balance NOx and particulatereleases and the frequent design requirement for firing in combination with gas. More detailedinformation for achievable emission values can be found in Table 4.15 to Table 4.21.
As a matter of summary the benefits for a switch to 100% gas-fired refinery are:� SO2 emissions will be reduced to nil for the single unit and for the refinery bubble will
be given by the emissions from other sources (very small from refinery gas, from theSRU, from the FCCU, the flare etc)
� particulate emissions including heavy metals will be reduced� NOx will be reduced to the levels typical for natural gas firing for energy production
techniques, and consequently other sources as catcrackers will become predominantemitters in the refinery
Chapter 4 Techniques to consider in the determination of BAT
226 Mineral Oil and Gas Refineries
� CO2 emission reduction is achieved mainly because of the lower carbon content of gas,its higher calorific value and in addition because of a higher attainable efficiency (Stackgases can be cooled further).
Cross-media effectsIt is acknowledged that the residual fuel replaced by gas results in a further surplus of residue,which has to be considered in any integrated solution for the fuel system of a refinery. It can bethe case that those residual fuels can be burned unproperly outside, so emissions produced bythat can be seen as an emission shift to outside the refinery. Furthermore, the conversion ofheavy fractions into light products and the targets for lower sulphur specifications of fuelsrequire considerable extra energy. This will lead to an inevitable increase in CO2 emissions. Asa first approximation, NOx emissions can be magnified by the use of hydrogen and residualfuels containing fuel bound nitrogen. High-hydrogen fuels result in higher flame temperatures,which typically lead to higher NOx levels. Although not all the fuel nitrogen ends up as NOxemissions, the fuel NOx contributions can range from non-existent, as in the case of natural gasfuelled equipment, to several times the thermal NOx contribution of the equipment for refineryfuels. Refinery fuel gas may contain amines (nitrogen compounds) and other compounds.Further information on conversion techniques of heavy fractions to refinery fuel gas can befound in Section 4.10.3.5, coking sections and hycroconversion processes.
Operational dataThe move from liquid to gas fuel would require process upgrades and gas grid connections.
ApplicabilitySome gases are used locally, i.e. in the process of origin or an adjacent process, but mostrefineries operate a common RFG main into which most RFG is fed and transferred to the gasusers. In a modern refinery the RFG main is carefully "balanced" with respect to supply anddemand; necessary flexibility is obtained by control of production (i.e. reformer throughput,LPG evaporation). The relationship to the refinery flare system is important and RFG willnormally include gas received from flare gas recovery. It may also release excess gas to flare ifthe upper limit pressure is exceeded. The application of energy conservation concepts (seeSection 4.10.1) can help refineries to meet all their needs with refinery gas produced in-house.
EconomicsThe cost of switching to gas can be up to EUR 30 million per year for a 10Mt/yr refinery.Use of LPG in lieu of fuel oil: Approximate capital cost is small (some reburnering) and theapproximate operating cost per year is 120EUR per tonne of fuel (cost differential between LPGand fuel oil). However, operating costs can vary significantly, depending on the season of theyear and on the price of LPG in the market.Use of natural gas in lieu of fuel oil: Approximate capital cost of installation is around GBP4 million. The approximate operating cost per year may vary from below 50 EUR per tonne toabove 100 EUR per tonne (cost differential between natural gas and fuel oil). Again, operatingcost can vary significantly, depending on the season of the year and on the market.
Driving force for implementationReduction of CO2, NOx, SO2 and particulate emissions (including metals)
Example plantsThe amount of refinery gas plus natural gas combusted by European refineries typically accountfrom 60 to 100 % (in terms of megawatts fired). However data from some single Europeanrefineries shows that the amount of heavy fuel oil fired can approach to 60 %.
Reference literature[118, VROM, 1999], [292, HMIP UK, 2000], [317, EIPPCB, 2002], [249, BMUJF, 1999], [268,TWG, 2001]
Techniques to consider in the determination of BAT Chapter 4
Mineral Oil and Gas Refineries 227
4.10.2.2 Cleaning of refinery fuel gas
DescriptionSome refinery fuel gases may be sulphur-free at source (i.e. from catalytic reforming andisomerisation processes) or sulphur-containing at source (most other processes, i.e. from crudedistillation, cracking and all hydrodesulphurising processes). In the latter case the gas streamsare normally treated by amine scrubbing to remove H2S before being released to the refineryfuel gas system. More information about amine scrubbers can be found in Section 4.23.5.1.
Achieved environmental benefitsAmine treated refinery fuel gases can be controlled to levels of 20 – 200 mg H2S/Nm3, whichwill achieve the release level of between 5 - 25 mg/Nm3 SO2 @ 3 % O2 in flue gases.
Cross-media effectsPossibility of bottlenecking the amine scrubbing system. More information in Section 4.23.5.1.
Operational dataSee Section 4.23.5.1.
ApplicabilityFully applicable.
EconomicsSee Section 4.23.5.1.
Driving force for implementationReduce the sulphur content of the refinery flue gas.
Example plantsThe treatment of refinery fuel gas in amine scrubbers are commonly used in all refineries.
Reference literature[297, Italy, 2000]
4.10.2.3 Hydrotreatment of liquid refinery fuels
DescriptionThe nitrogen, sulphur, particulates and metals content of the fuel used in refineries aredetermined by the crude that is used at the refinery and by the process units it has passedthrough. Liquid refinery fuel streams originate from various processes such as crude distillationunits, vacuum distillation, thermal cracking, catcracking and hydrocracking of residues. Exceptfor the latter one, the sulphur content of these residues can only be controlled by feedstockchoice. In general, the liquid refinery fuel may comprise one or more of the above-mentionedfractions and the sulphur content can vary greatly. Table 4.13 shows the sulphur content ofdifferent fractions suitable to be used as liquid refinery fuel.
Fraction suitable to beused as liquid refinery fuel
Crude oil origin S(%)
N(%)
Metal content(%)
Atmospheric residue North sea 0.6 - 1.1 0.03 - 0.32 0.03 - 0.06Atmospheric residue Middle East 2.3 - 4.4 0.04 - 0.06Vacuum residue North sea 1.1 - 1.8 0.18 - 0.58Vacuum residue Middle East 3.6 - 6.1 0.07 - 0.13Cracked residue Middle East 3.5 - 6.5
Table 4.13: Sulphur, nitrogen and metal content of fractions suitable to be used as liquid refineryfuels
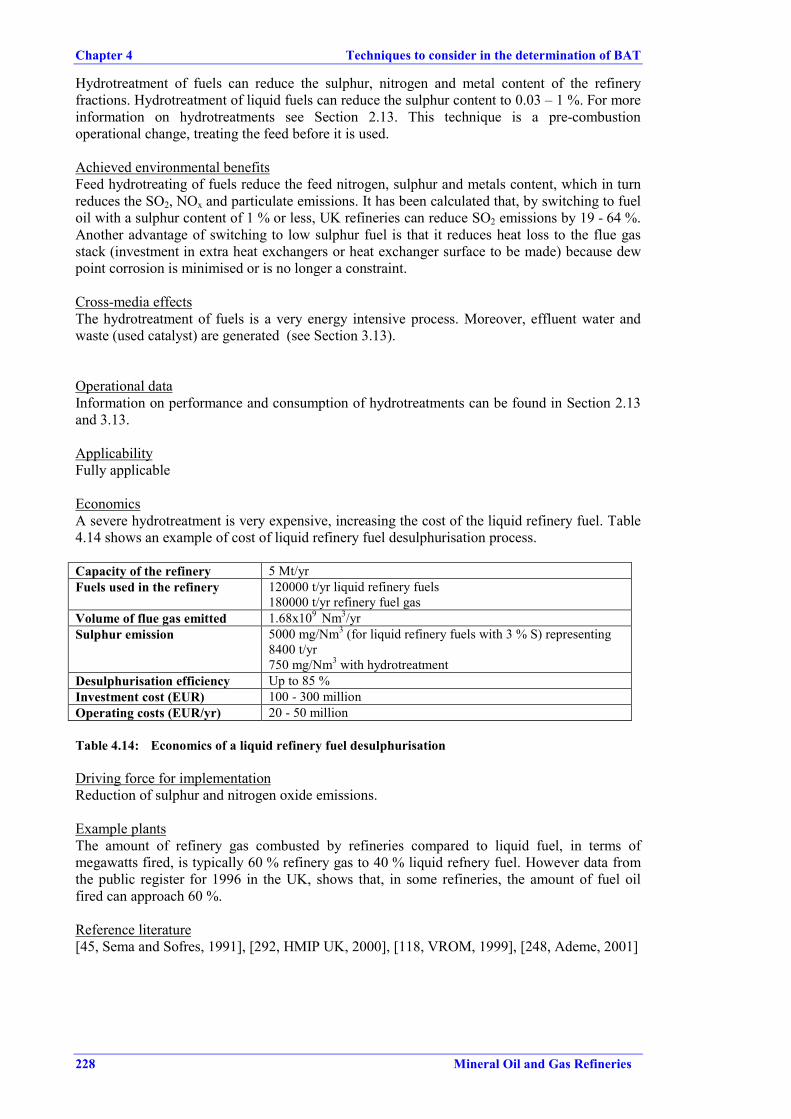
Chapter 4 Techniques to consider in the determination of BAT
228 Mineral Oil and Gas Refineries
Hydrotreatment of fuels can reduce the sulphur, nitrogen and metal content of the refineryfractions. Hydrotreatment of liquid fuels can reduce the sulphur content to 0.03 – 1 %. For moreinformation on hydrotreatments see Section 2.13. This technique is a pre-combustionoperational change, treating the feed before it is used.
Achieved environmental benefitsFeed hydrotreating of fuels reduce the feed nitrogen, sulphur and metals content, which in turnreduces the SO2, NOx and particulate emissions. It has been calculated that, by switching to fueloil with a sulphur content of 1 % or less, UK refineries can reduce SO2 emissions by 19 - 64 %.Another advantage of switching to low sulphur fuel is that it reduces heat loss to the flue gasstack (investment in extra heat exchangers or heat exchanger surface to be made) because dewpoint corrosion is minimised or is no longer a constraint.
Cross-media effectsThe hydrotreatment of fuels is a very energy intensive process. Moreover, effluent water andwaste (used catalyst) are generated (see Section 3.13).
Operational dataInformation on performance and consumption of hydrotreatments can be found in Section 2.13and 3.13.
ApplicabilityFully applicable
EconomicsA severe hydrotreatment is very expensive, increasing the cost of the liquid refinery fuel. Table4.14 shows an example of cost of liquid refinery fuel desulphurisation process.
Capacity of the refinery 5 Mt/yrFuels used in the refinery 120000 t/yr liquid refinery fuels
180000 t/yr refinery fuel gasVolume of flue gas emitted 1.68x10⁹ Nm3/yrSulphur emission 5000 mg/Nm3 (for liquid refinery fuels with 3 % S) representing
8400 t/yr750 mg/Nm3 with hydrotreatment
Desulphurisation efficiency Up to 85 %Investment cost (EUR) 100 - 300 millionOperating costs (EUR/yr) 20 - 50 million
Table 4.14: Economics of a liquid refinery fuel desulphurisation
Driving force for implementationReduction of sulphur and nitrogen oxide emissions.
Example plantsThe amount of refinery gas combusted by refineries compared to liquid fuel, in terms ofmegawatts fired, is typically 60 % refinery gas to 40 % liquid refnery fuel. However data fromthe public register for 1996 in the UK, shows that, in some refineries, the amount of fuel oilfired can approach 60 %.
Reference literature[45, Sema and Sofres, 1991], [292, HMIP UK, 2000], [118, VROM, 1999], [248, Ademe, 2001]
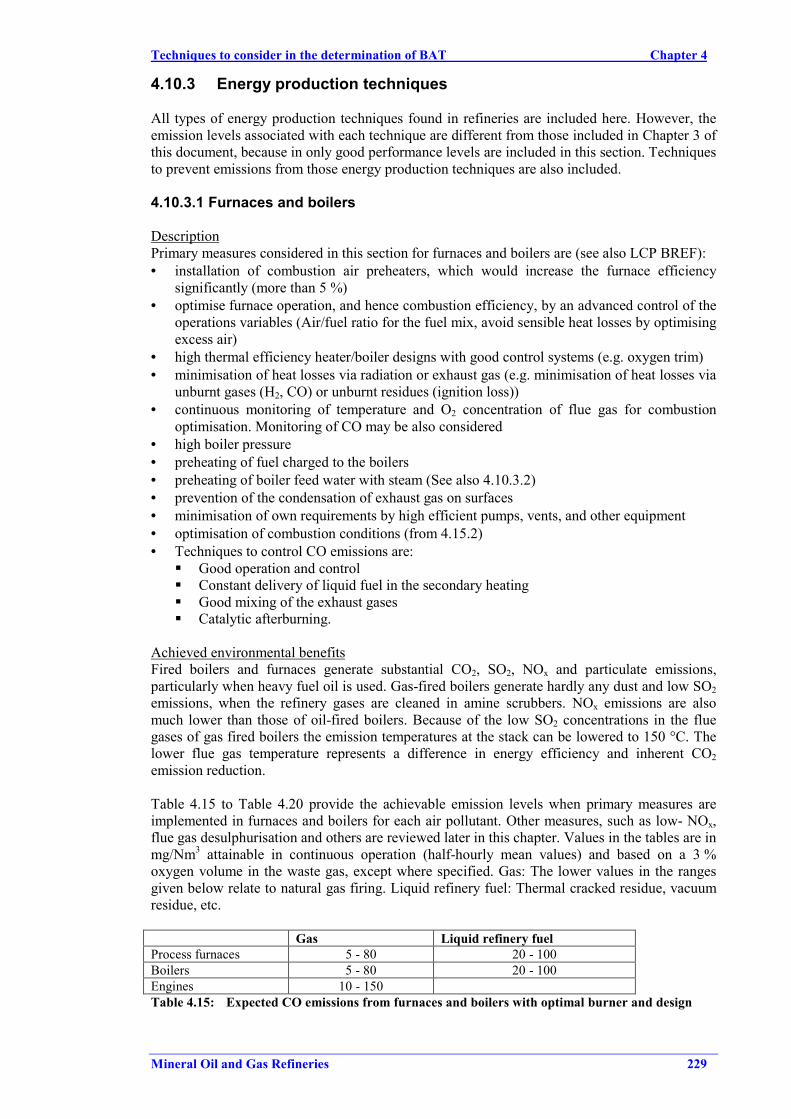
Techniques to consider in the determination of BAT Chapter 4
Mineral Oil and Gas Refineries 229
4.10.3 Energy production techniques
All types of energy production techniques found in refineries are included here. However, theemission levels associated with each technique are different from those included in Chapter 3 ofthis document, because in only good performance levels are included in this section. Techniquesto prevent emissions from those energy production techniques are also included.
4.10.3.1 Furnaces and boilers
DescriptionPrimary measures considered in this section for furnaces and boilers are (see also LCP BREF):• installation of combustion air preheaters, which would increase the furnace efficiency
significantly (more than 5 %)• optimise furnace operation, and hence combustion efficiency, by an advanced control of the
operations variables (Air/fuel ratio for the fuel mix, avoid sensible heat losses by optimisingexcess air)
• high thermal efficiency heater/boiler designs with good control systems (e.g. oxygen trim)• minimisation of heat losses via radiation or exhaust gas (e.g. minimisation of heat losses via
unburnt gases (H2, CO) or unburnt residues (ignition loss))• continuous monitoring of temperature and O2 concentration of flue gas for combustion
optimisation. Monitoring of CO may be also considered• high boiler pressure• preheating of fuel charged to the boilers• preheating of boiler feed water with steam (See also 4.10.3.2)• prevention of the condensation of exhaust gas on surfaces• minimisation of own requirements by high efficient pumps, vents, and other equipment• optimisation of combustion conditions (from 4.15.2)• Techniques to control CO emissions are:
� Good operation and control� Constant delivery of liquid fuel in the secondary heating� Good mixing of the exhaust gases� Catalytic afterburning.
Achieved environmental benefitsFired boilers and furnaces generate substantial CO2, SO2, NOx and particulate emissions,particularly when heavy fuel oil is used. Gas-fired boilers generate hardly any dust and low SO2emissions, when the refinery gases are cleaned in amine scrubbers. NOx emissions are alsomuch lower than those of oil-fired boilers. Because of the low SO2 concentrations in the fluegases of gas fired boilers the emission temperatures at the stack can be lowered to 150 °C. Thelower flue gas temperature represents a difference in energy efficiency and inherent CO2emission reduction.
Table 4.15 to Table 4.20 provide the achievable emission levels when primary measures areimplemented in furnaces and boilers for each air pollutant. Other measures, such as low- NOx,flue gas desulphurisation and others are reviewed later in this chapter. Values in the tables are inmg/Nm3 attainable in continuous operation (half-hourly mean values) and based on a 3 %oxygen volume in the waste gas, except where specified. Gas: The lower values in the rangesgiven below relate to natural gas firing. Liquid refinery fuel: Thermal cracked residue, vacuumresidue, etc.
Gas Liquid refinery fuelProcess furnaces 5 - 80 20 - 100Boilers 5 - 80 20 - 100Engines 10 - 150Table 4.15: Expected CO emissions from furnaces and boilers with optimal burner and design
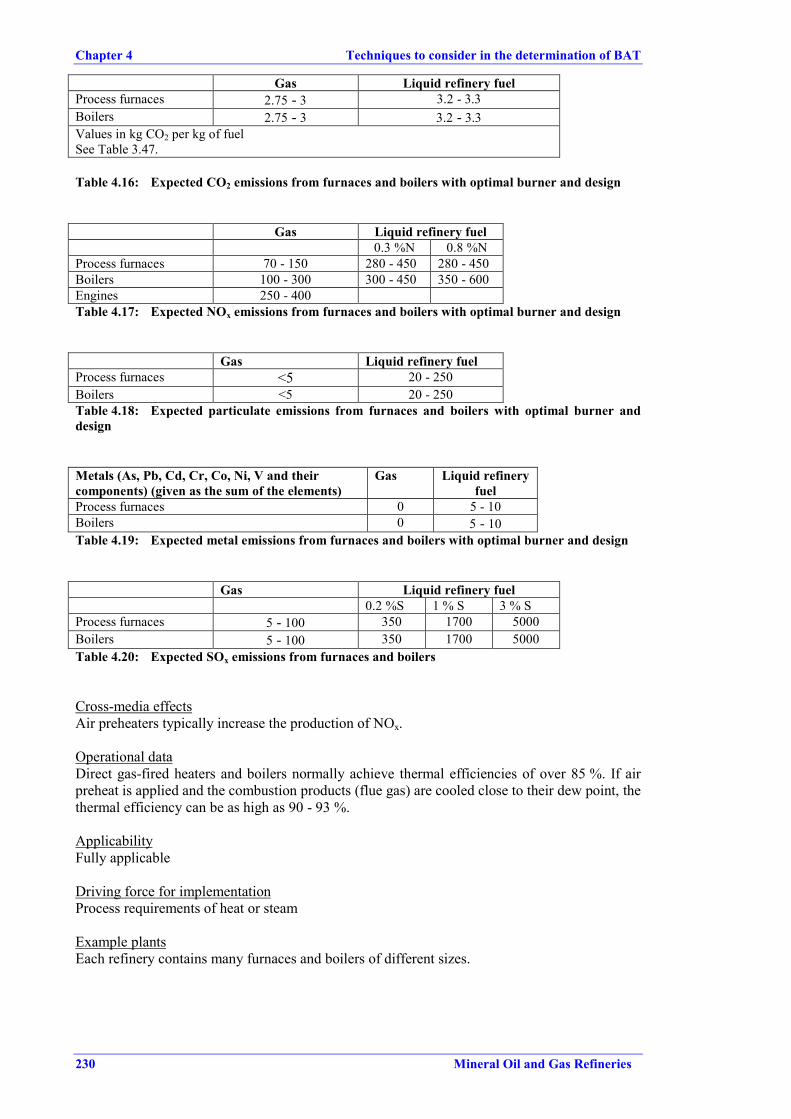
Chapter 4 Techniques to consider in the determination of BAT
230 Mineral Oil and Gas Refineries
Gas Liquid refinery fuelProcess furnaces 2.75 - 3 3.2 - 3.3Boilers 2.75 - 3 3.2 - 3.3Values in kg CO2 per kg of fuelSee Table 3.47.
Table 4.16: Expected CO2 emissions from furnaces and boilers with optimal burner and design
Gas Liquid refinery fuel0.3 %N 0.8 %N
Process furnaces 70 - 150 280 - 450 280 - 450Boilers 100 - 300 300 - 450 350 - 600Engines 250 - 400Table 4.17: Expected NOx emissions from furnaces and boilers with optimal burner and design
Gas Liquid refinery fuelProcess furnaces <5 20 - 250Boilers <5 20 - 250Table 4.18: Expected particulate emissions from furnaces and boilers with optimal burner anddesign
Metals (As, Pb, Cd, Cr, Co, Ni, V and theircomponents) (given as the sum of the elements)
Gas Liquid refineryfuel
Process furnaces 0 5 - 10Boilers 0 5 - 10Table 4.19: Expected metal emissions from furnaces and boilers with optimal burner and design
Gas Liquid refinery fuel0.2 %S 1 % S 3 % S
Process furnaces 5 - 100 350 1700 5000Boilers 5 - 100 350 1700 5000Table 4.20: Expected SOx emissions from furnaces and boilers
Cross-media effectsAir preheaters typically increase the production of NOx.
Operational dataDirect gas-fired heaters and boilers normally achieve thermal efficiencies of over 85 %. If airpreheat is applied and the combustion products (flue gas) are cooled close to their dew point, thethermal efficiency can be as high as 90 - 93 %.
ApplicabilityFully applicable
Driving force for implementationProcess requirements of heat or steam
Example plantsEach refinery contains many furnaces and boilers of different sizes.
Techniques to consider in the determination of BAT Chapter 4
Mineral Oil and Gas Refineries 231
Reference literature[117, VDI, 2000]], [195, The world refining association, 1999], [45, Sema and Sofres, 1991],[317, EIPPCB, 2002], [249, BMUJF, 1999], [297, Italy, 2000], [118, VROM, 1999], [268,TWG, 2001]
4.10.3.2 Boiler feed water (BFW) production and re-use
DescriptionTechniques to consider for the BFW production and re-use are:1) the condensate tank is generally equipped with an oil detection system and an oil skimming
device2) to avoid corrosion in the steam and condensate systems, oxygen and carbon dioxide are
removed in de-aerators, and oxygen scavengers and corrosion inhibitors are added. Forfurther conditioning of BFW, dispersing, alkaline and sometimes anti-foaming agents aredosed
3) minimisation of heat losses via flue gas (unburnt gases, such as H2, CO), via residues(ignition loss), via ashes and slags, via thermal radiation
4) preheating of boiler feed water (to de-areator) by waste heat5) reduction of own energy requirement in the BFW production6) production of boiler feed water: common techniques are ion-exchange, microfiltration and
reversed osmosis. Unlike ion-exchange techniques, membrane processes do not generatewaste water containing high loads of salts. Technologies should be preferred which generaterecyclable residues (e.g. iron-containing sludges). Preferred use of non-toxic chemicals forwater preparation, which are easily degraded by micro-organisms. Use of mineral oil-freeflocculation agents. Use of chemicals with no or only low content of chloroorganiccompounds. Rejection of the following compounds: EDTA (and homologous compounds)and its salts; aminopolycarbonic acids and their salts; metal-organic compounds; chromates,nitrites, organic polyeletrolytes with a monomer content >0.1 % w/w. Treatment of wastewater from boiler feed water preparation in a well designed WWTP, especially in case ofregenerates that contain high amounts of NH3 derived from condensate recovery applyingion exchange. [317, EIPPCB, 2002]
7) conditioning of boiler feed water: Good operation is the combined operation with oxygendosage: By addition of ammonia the pH is adjusted to an alkaline milieu and a small amountof oxygen is added. With this measure, addition of hydracine (which is consideredcancinogenic substance) can be avoided and the demand for ammonia is decreased.Furthermore a protective layer of magnetite and haematite is formed on the inner surface ofthe pipes, which is less rough thereby decreasing the pressure drop within the pipes anddecreasing the energy demand of the pumps. Waste water from water conditioning need tobe neutralised and treated in a well designed WWTP [317, EIPPCB, 2002].
8) repeated reheating of steam
Achieved environmental benefitsThe BFW condensate has a very low pollutant content. The reduction in water actual usebecause of re-use is the most significant environmental benefit.
Cross-media effectsBiotreatment may be required if anti-foaming inhibitors are used. Corrosion inhibitors are notbiodegradable in the waste water treatment plant.
Operational dataBFW should not be recycled or routed to the desalter.
ApplicabilityWhen the re-use of condensate water as deareator feed water or preheating the BFW is applied,in some instances, where the condensate and the deareator are located far apart, their integrationis not always possible because economical reasons.
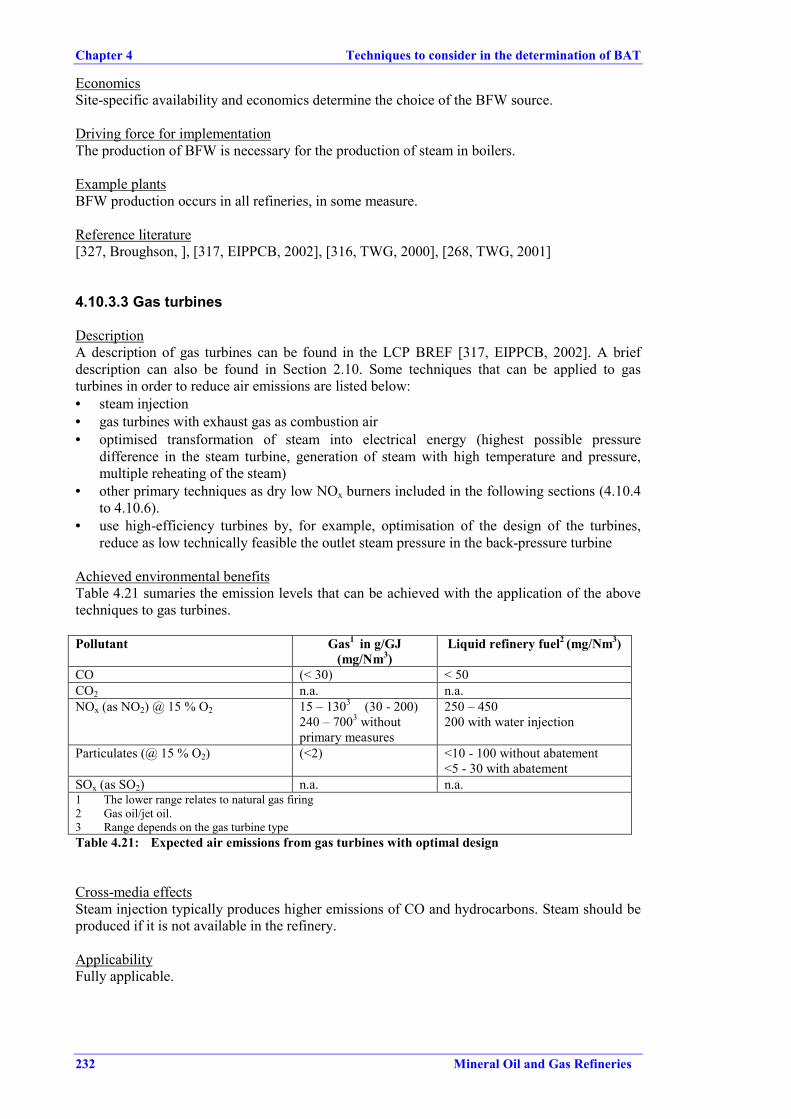
Chapter 4 Techniques to consider in the determination of BAT
232 Mineral Oil and Gas Refineries
EconomicsSite-specific availability and economics determine the choice of the BFW source.
Driving force for implementationThe production of BFW is necessary for the production of steam in boilers.
Example plantsBFW production occurs in all refineries, in some measure.
Reference literature[327, Broughson, ], [317, EIPPCB, 2002], [316, TWG, 2000], [268, TWG, 2001]
4.10.3.3 Gas turbines
DescriptionA description of gas turbines can be found in the LCP BREF [317, EIPPCB, 2002]. A briefdescription can also be found in Section 2.10. Some techniques that can be applied to gasturbines in order to reduce air emissions are listed below:• steam injection• gas turbines with exhaust gas as combustion air• optimised transformation of steam into electrical energy (highest possible pressure
difference in the steam turbine, generation of steam with high temperature and pressure,multiple reheating of the steam)
• other primary techniques as dry low NOx burners included in the following sections (4.10.4to 4.10.6).
• use high-efficiency turbines by, for example, optimisation of the design of the turbines,reduce as low technically feasible the outlet steam pressure in the back-pressure turbine
Achieved environmental benefitsTable 4.21 sumaries the emission levels that can be achieved with the application of the abovetechniques to gas turbines.
Pollutant Gas1 in g/GJ(mg/Nm3)
Liquid refinery fuel2 (mg/Nm3)
CO (< 30) < 50CO2 n.a. n.a.NOx (as NO2) @ 15 % O2 15 – 1303 (30 - 200)
240 – 7003 withoutprimary measures
250 – 450200 with water injection
Particulates (@ 15 % O2) (<2) <10 - 100 without abatement<5 - 30 with abatement
SOx (as SO2) n.a. n.a.1 The lower range relates to natural gas firing2 Gas oil/jet oil.3 Range depends on the gas turbine typeTable 4.21: Expected air emissions from gas turbines with optimal design
Cross-media effectsSteam injection typically produces higher emissions of CO and hydrocarbons. Steam should beproduced if it is not available in the refinery.
ApplicabilityFully applicable.
Techniques to consider in the determination of BAT Chapter 4
Mineral Oil and Gas Refineries 233
EconomicsSteam injection applied to a 85MWe output turbine. Uncontrolled NOx emissions of 500mg/Nm3 @ 15 % O2. Down to 50 - 80 mg/Nm3 @ 15 % O2. Investment cost (1998) EURmillion 3.4 (including cost of steam production) Operating Cost: 0.8 EUR million (excludescapital charge).
Driving force for implementationProcess technique used for the production of electricity.
Example plantsMany examples exist in refineries. A number of refineries have, or are currently installing,combined cycle gas turbine (CCGT), designed to produce steam and power for the refinery.This is usually done to replace in whole or part old oil-fired boiler plant, to reduce operatingcosts and to decrease reliance on other power generators.
Reference literature[45, Sema and Sofres, 1991], [118, VROM, 1999], [115, CONCAWE, 1999].
4.10.3.4 Cogeneration plants (CHP)
DescriptionA brief description can be found in Section 2.10.
Achieved environmental benefitsFor the combination Refinery/Other Power Generators (OPG), the energy consumption and CO2emissions will be reduced by the application of the CHP concept. At the OPG, fuel consumptionand all related emissions will be reduced but, at the refinery, fuel consumption and emissionsmay increase. A refinery that generates its own steam and electricity (no import from the OPG)can benefit from (enhanced) co-generation. In these cases the environmental effect in reducedfuel use and its related emissions accrue completely to the refinery.
Cross-media effectsNo cross-media effects have been detected.
Operational dataMost turbines require a particularly stable mix of fuel in order to be sure of flame stability andare basically designed to burn natural gas. Refinery fuel gas components can vary considerably,especially when surplus hydrogen is produced, such as when a hydrotreatment unit istemporarily shut down, resulting in excess hydrogen being sent to the fuel gas system. However,these problems can usually be overcome, up to a limit of about 70 % hydrogen in the fuel.
ApplicabilityGenerally applicable. The steam and power cogeneration concept can be also be applied toboilers firing, for instance, liquid refinery fuel. They can be designed to generate high-pressuresteam and to let the pressure down over an expander/turbo-generator. Economisers and theoptimisation of air-to-fuel control are also techniques applicable in cogeneration plants.
Driving force for implementationProduction of steam and power to be used within or outside the refinery.
Example plantsA number of refineries have, or are currently installing, combined cycle gas turbine (CCGT) orCombined Heat and Power (CHP) plant, designed to produce steam and power for the refinery.This is usually done to replace in whole or part old oil-fired boiler plant, to reduce operatingcosts and to decrease reliance on other power generators.
Chapter 4 Techniques to consider in the determination of BAT
234 Mineral Oil and Gas Refineries
Reference literature[118, VROM, 1999]
4.10.3.5 Gasification of heavy oils or coke (IGCC)
DescriptionIntegrated gasification combined cycle (IGCC) is another technique and its purpose is toproduce steam, hydrogen (optional) (see Section 2.14) and electric power from a variety of lowgrade fuel types with the highest conversion efficiency possible. More information can be foundin Section 2.10.
Achieved environmental benefitsSyngas produced in this process has a sulphur content of 0.01 - 0.05 % and could be used, asrefinery fuel gas for hydrogen, fuel or chemical production. Water containing the sootparticulates is filtered and the filter cake is subjected to a controlled burning process. Theprocess is in principle autothermic, the heat of combustion being sufficient to evaporate themoisture content of the filter cake.
The IGCC is a highly integrated and efficient process which can supply power, hydrogen andsteam. Furthermore, it offers in principle an acceptable outlet for heavy residues and feedstocksor even refinery sludges, provided the latter are less than 1 % of feed. Hot gas clean-up systemshave the potential to increase system efficiency and lower system costs. The achieved emissionsto the atmosphere from that system are: SO2 50 mg/Nm3, NOx 65 mg/Nm3 @ 3 % O2,particulate 5 mg/Nm3 and carbon monoxide 10 - 30 mg/Nm3.
The emissions from the IGCC show a significant decrease compared with conventionalpower/steam plants. The SO2 concentration in the refinery exhaust is reduced by 80 % but CO2emissions increase.
The use of by-product and residual streams to meet the fuel requirement of refineries cannotonly be cost-effective, but also is environmentally beneficial in that it makes use of what wouldotherwise be a waste refinery stream that would be flared without recovering the energy content.
Cross-media effectsIn some cases, some difficulties may occur in burning low calorific value gas produced. Watereffluent is normally sent to the existing waste water treatment plant of the refinery. It maycontain significant amounts of metals as V, Cr or Ni and PAHs.
Operational dataUtility requirements for the gasification processes are 1800 - 4900 kWh/t of power and 1140kg/t of steam consumption. The soot product is about 50 - 75 % w/w V2O5 residue, which canbe sold to metal reclaimers. The IGCC complex is also equipped with all the necessary auxiliarysystems, including cooling water (mixed system with an open seawater circuit for large usersand a closed clean water circuit for the other users), demi-water, air, nitrogen, water and fuel gasnetworks, fire fighting, flare, storage, electrical distribution, buildings, etc.
IGCC is a technology with high flexibility in start-up, shutdown and part-load operation,depending on the level of integration between the different sections. Typically, systems that useheat exchange equipment are more efficient than those using quench cooling; however, thecapital cost of the system with heat exchange is higher and there is a risk of fouling. Handling ofthe soot and filter cake should be done with care to avoid dust (even at 80 % moisture) due tothe toxic properties of the residue.
ApplicabilityThis technique can be seen as an alternative approach to removing sulphur using feedhydrotreatment (see Section 4.10.2.3). During normal refinery operation the gasifiers of the
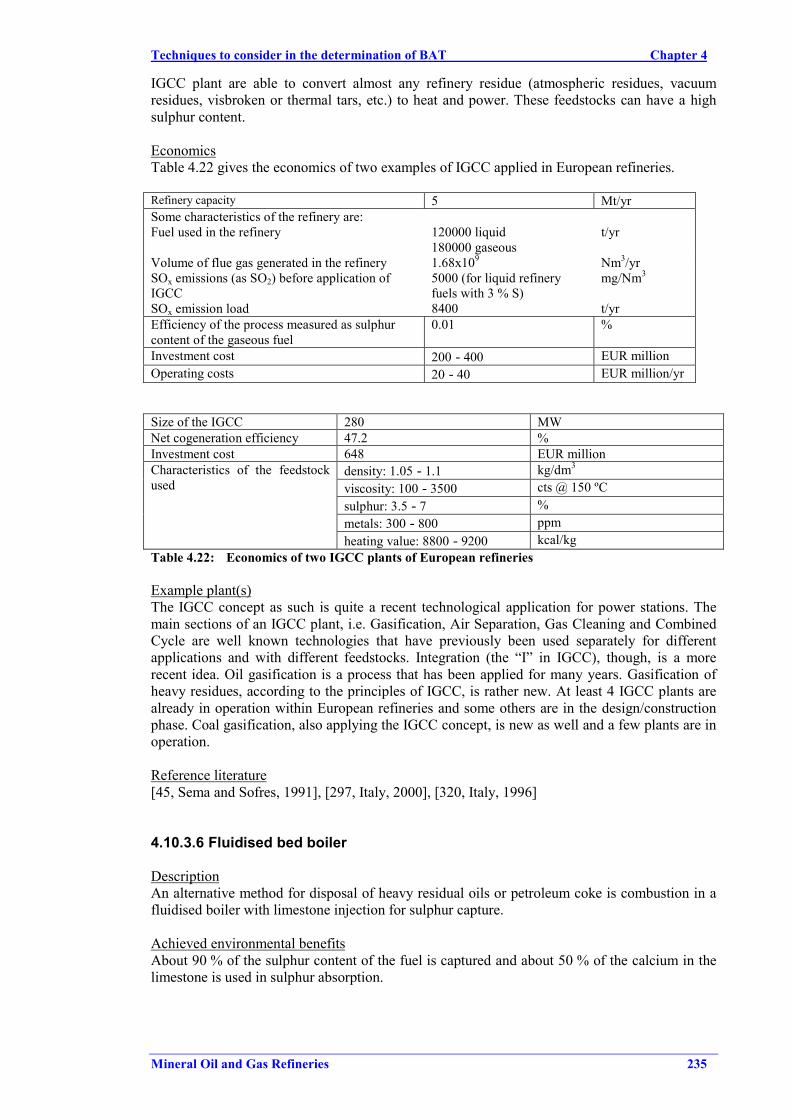
Techniques to consider in the determination of BAT Chapter 4
Mineral Oil and Gas Refineries 235
IGCC plant are able to convert almost any refinery residue (atmospheric residues, vacuumresidues, visbroken or thermal tars, etc.) to heat and power. These feedstocks can have a highsulphur content.
EconomicsTable 4.22 gives the economics of two examples of IGCC applied in European refineries.
Refinery capacity 5 Mt/yrSome characteristics of the refinery are:Fuel used in the refinery 120000 liquid
180000 gaseoust/yr
Volume of flue gas generated in the refinery 1.68x10⁹ Nm3/yrSOx emissions (as SO2) before application ofIGCC
5000 (for liquid refineryfuels with 3 % S)
mg/Nm3
SOx emission load 8400 t/yrEfficiency of the process measured as sulphurcontent of the gaseous fuel
0.01 %
Investment cost 200 - 400 EUR millionOperating costs 20 - 40 EUR million/yr
Size of the IGCC 280 MWNet cogeneration efficiency 47.2 %Investment cost 648 EUR million
density: 1.05 - 1.1 kg/dm3
viscosity: 100 - 3500 cts @ 150 ºCsulphur: 3.5 - 7 %metals: 300 - 800 ppm
Characteristics of the feedstockused
heating value: 8800 - 9200 kcal/kgTable 4.22: Economics of two IGCC plants of European refineries
Example plant(s)The IGCC concept as such is quite a recent technological application for power stations. Themain sections of an IGCC plant, i.e. Gasification, Air Separation, Gas Cleaning and CombinedCycle are well known technologies that have previously been used separately for differentapplications and with different feedstocks. Integration (the “I” in IGCC), though, is a morerecent idea. Oil gasification is a process that has been applied for many years. Gasification ofheavy residues, according to the principles of IGCC, is rather new. At least 4 IGCC plants arealready in operation within European refineries and some others are in the design/constructionphase. Coal gasification, also applying the IGCC concept, is new as well and a few plants are inoperation.
Reference literature[45, Sema and Sofres, 1991], [297, Italy, 2000], [320, Italy, 1996]
4.10.3.6 Fluidised bed boiler
DescriptionAn alternative method for disposal of heavy residual oils or petroleum coke is combustion in afluidised boiler with limestone injection for sulphur capture.
Achieved environmental benefitsAbout 90 % of the sulphur content of the fuel is captured and about 50 % of the calcium in thelimestone is used in sulphur absorption.
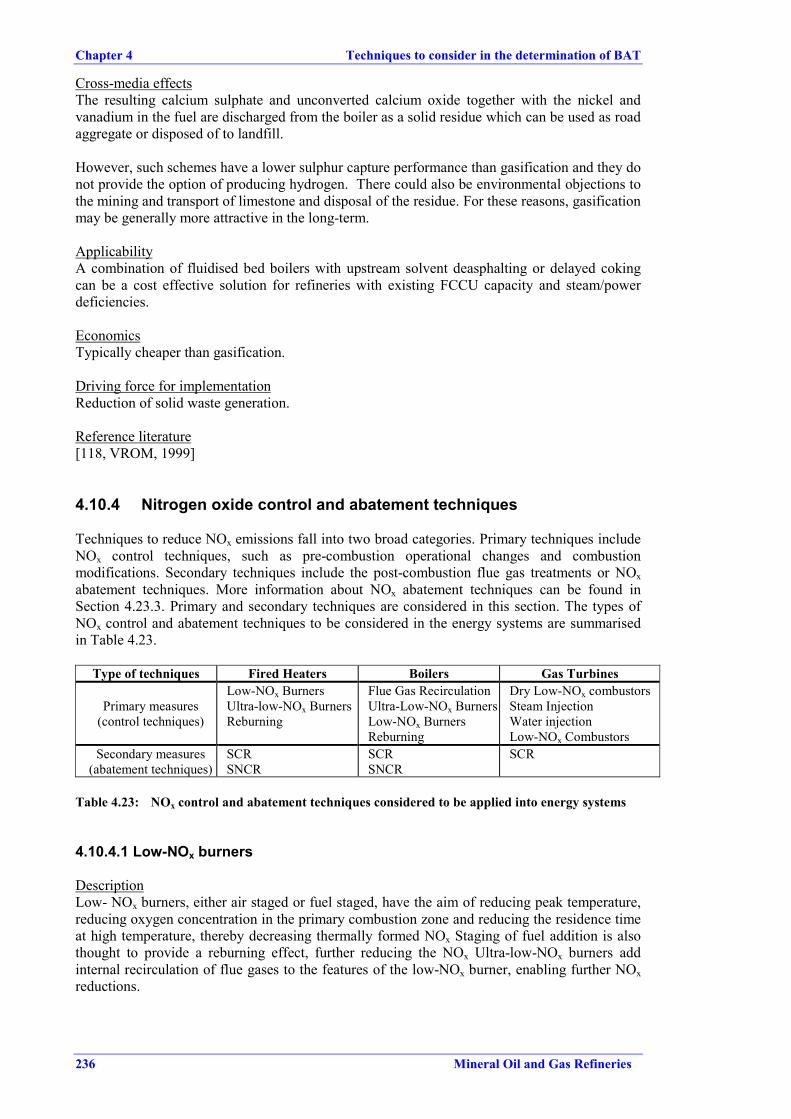
Chapter 4 Techniques to consider in the determination of BAT
236 Mineral Oil and Gas Refineries
Cross-media effectsThe resulting calcium sulphate and unconverted calcium oxide together with the nickel andvanadium in the fuel are discharged from the boiler as a solid residue which can be used as roadaggregate or disposed of to landfill.
However, such schemes have a lower sulphur capture performance than gasification and they donot provide the option of producing hydrogen. There could also be environmental objections tothe mining and transport of limestone and disposal of the residue. For these reasons, gasificationmay be generally more attractive in the long-term.
ApplicabilityA combination of fluidised bed boilers with upstream solvent deasphalting or delayed cokingcan be a cost effective solution for refineries with existing FCCU capacity and steam/powerdeficiencies.
EconomicsTypically cheaper than gasification.
Driving force for implementationReduction of solid waste generation.
Reference literature[118, VROM, 1999]
4.10.4 Nitrogen oxide control and abatement techniques
Techniques to reduce NOx emissions fall into two broad categories. Primary techniques includeNOx control techniques, such as pre-combustion operational changes and combustionmodifications. Secondary techniques include the post-combustion flue gas treatments or NOxabatement techniques. More information about NOx abatement techniques can be found inSection 4.23.3. Primary and secondary techniques are considered in this section. The types ofNOx control and abatement techniques to be considered in the energy systems are summarisedin Table 4.23.
Type of techniques Fired Heaters Boilers Gas Turbines
Primary measures(control techniques)
Low-NOx BurnersUltra-low-NOx BurnersReburning
Flue Gas RecirculationUltra-Low-NOx BurnersLow-NOx BurnersReburning
Dry Low-NOx combustorsSteam InjectionWater injectionLow-NOx Combustors
Secondary measures(abatement techniques)
SCRSNCR
SCRSNCR
SCR
Table 4.23: NOx control and abatement techniques considered to be applied into energy systems
4.10.4.1 Low-NOx burners
DescriptionLow- NOx burners, either air staged or fuel staged, have the aim of reducing peak temperature,reducing oxygen concentration in the primary combustion zone and reducing the residence timeat high temperature, thereby decreasing thermally formed NOx Staging of fuel addition is alsothought to provide a reburning effect, further reducing the NOx Ultra-low-NOx burners addinternal recirculation of flue gases to the features of the low-NOx burner, enabling further NOxreductions.
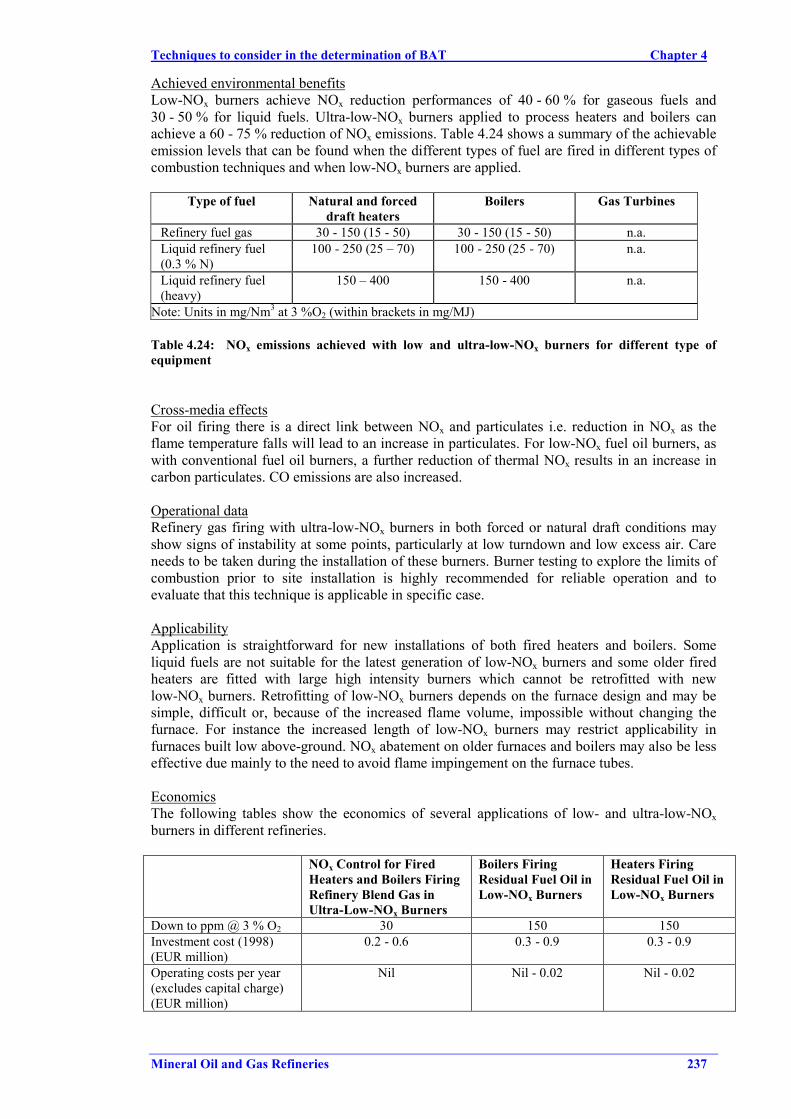
Techniques to consider in the determination of BAT Chapter 4
Mineral Oil and Gas Refineries 237
Achieved environmental benefitsLow-NOx burners achieve NOx reduction performances of 40 - 60 % for gaseous fuels and30 - 50 % for liquid fuels. Ultra-low-NOx burners applied to process heaters and boilers canachieve a 60 - 75 % reduction of NOx emissions. Table 4.24 shows a summary of the achievableemission levels that can be found when the different types of fuel are fired in different types ofcombustion techniques and when low-NOx burners are applied.
Type of fuel Natural and forceddraft heaters
Boilers Gas Turbines
Refinery fuel gas 30 - 150 (15 - 50) 30 - 150 (15 - 50) n.a.Liquid refinery fuel(0.3 % N)
100 - 250 (25 – 70) 100 - 250 (25 - 70) n.a.
Liquid refinery fuel(heavy)
150 – 400 150 - 400 n.a.
Note: Units in mg/Nm3 at 3 %O2 (within brackets in mg/MJ)
Table 4.24: NOx emissions achieved with low and ultra-low-NOx burners for different type ofequipment
Cross-media effectsFor oil firing there is a direct link between NOx and particulates i.e. reduction in NOx as theflame temperature falls will lead to an increase in particulates. For low-NOx fuel oil burners, aswith conventional fuel oil burners, a further reduction of thermal NOx results in an increase incarbon particulates. CO emissions are also increased.
Operational dataRefinery gas firing with ultra-low-NOx burners in both forced or natural draft conditions mayshow signs of instability at some points, particularly at low turndown and low excess air. Careneeds to be taken during the installation of these burners. Burner testing to explore the limits ofcombustion prior to site installation is highly recommended for reliable operation and toevaluate that this technique is applicable in specific case.
ApplicabilityApplication is straightforward for new installations of both fired heaters and boilers. Someliquid fuels are not suitable for the latest generation of low-NOx burners and some older firedheaters are fitted with large high intensity burners which cannot be retrofitted with newlow-NOx burners. Retrofitting of low-NOx burners depends on the furnace design and may besimple, difficult or, because of the increased flame volume, impossible without changing thefurnace. For instance the increased length of low-NOx burners may restrict applicability infurnaces built low above-ground. NOx abatement on older furnaces and boilers may also be lesseffective due mainly to the need to avoid flame impingement on the furnace tubes.
EconomicsThe following tables show the economics of several applications of low- and ultra-low-NOxburners in different refineries.
NOx Control for FiredHeaters and Boilers FiringRefinery Blend Gas inUltra-Low-NOx Burners
Boilers FiringResidual Fuel Oil inLow-NOx Burners
Heaters FiringResidual Fuel Oil inLow-NOx Burners
Down to ppm @ 3 % O2 30 150 150Investment cost (1998)(EUR million)
0.2 - 0.6 0.3 - 0.9 0.3 - 0.9
Operating costs per year(excludes capital charge)(EUR million)
Nil Nil - 0.02 Nil - 0.02
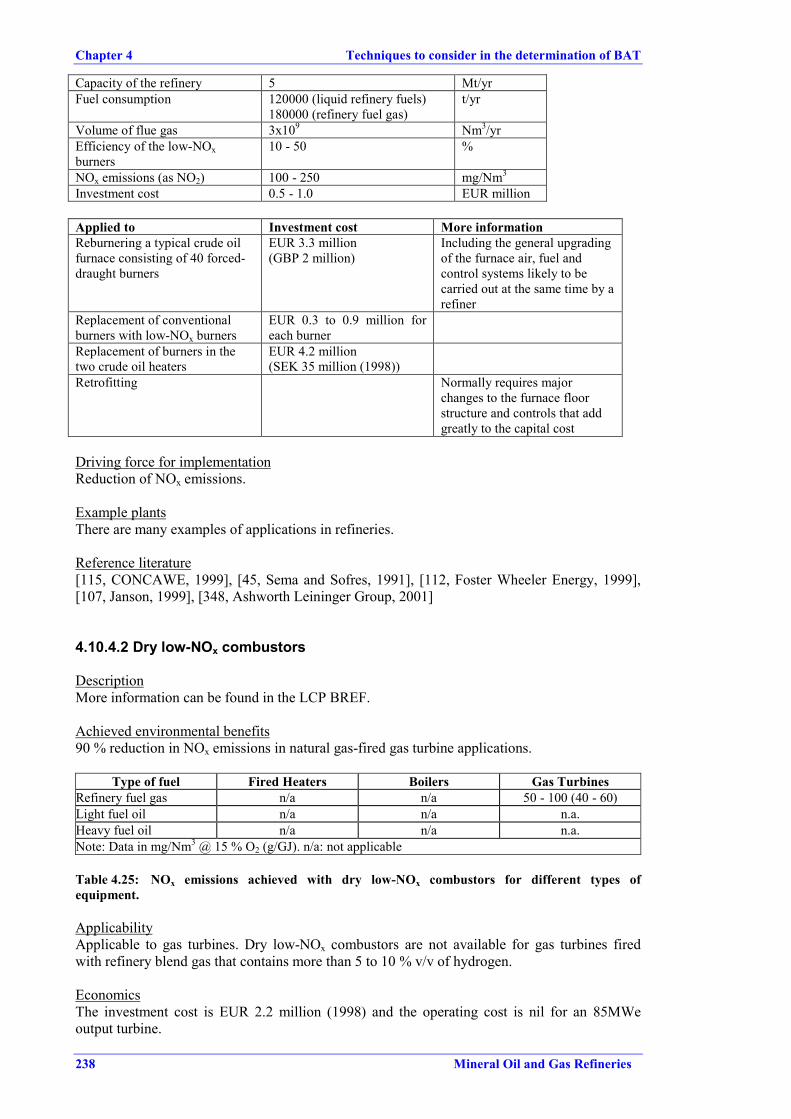
Chapter 4 Techniques to consider in the determination of BAT
238 Mineral Oil and Gas Refineries
Capacity of the refinery 5 Mt/yrFuel consumption 120000 (liquid refinery fuels)
180000 (refinery fuel gas)t/yr
Volume of flue gas 3x10⁹ Nm3/yrEfficiency of the low-NOxburners
10 - 50 %
NOx emissions (as NO2) 100 - 250 mg/Nm3
Investment cost 0.5 - 1.0 EUR million
Applied to Investment cost More informationReburnering a typical crude oilfurnace consisting of 40 forced-draught burners
EUR 3.3 million(GBP 2 million)
Including the general upgradingof the furnace air, fuel andcontrol systems likely to becarried out at the same time by arefiner
Replacement of conventionalburners with low-NOx burners
EUR 0.3 to 0.9 million foreach burner
Replacement of burners in thetwo crude oil heaters
EUR 4.2 million(SEK 35 million (1998))
Retrofitting Normally requires majorchanges to the furnace floorstructure and controls that addgreatly to the capital cost
Driving force for implementationReduction of NOx emissions.
Example plantsThere are many examples of applications in refineries.
Reference literature[115, CONCAWE, 1999], [45, Sema and Sofres, 1991], [112, Foster Wheeler Energy, 1999],[107, Janson, 1999], [348, Ashworth Leininger Group, 2001]
4.10.4.2 Dry low-NOx combustors
DescriptionMore information can be found in the LCP BREF.
Achieved environmental benefits90 % reduction in NOx emissions in natural gas-fired gas turbine applications.
Type of fuel Fired Heaters Boilers Gas TurbinesRefinery fuel gas n/a n/a 50 - 100 (40 - 60)Light fuel oil n/a n/a n.a.Heavy fuel oil n/a n/a n.a.Note: Data in mg/Nm3 @ 15 % O2 (g/GJ). n/a: not applicable
Table 4.25: NOx emissions achieved with dry low-NOx combustors for different types ofequipment.
ApplicabilityApplicable to gas turbines. Dry low-NOx combustors are not available for gas turbines firedwith refinery blend gas that contains more than 5 to 10 % v/v of hydrogen.
EconomicsThe investment cost is EUR 2.2 million (1998) and the operating cost is nil for an 85MWeoutput turbine.
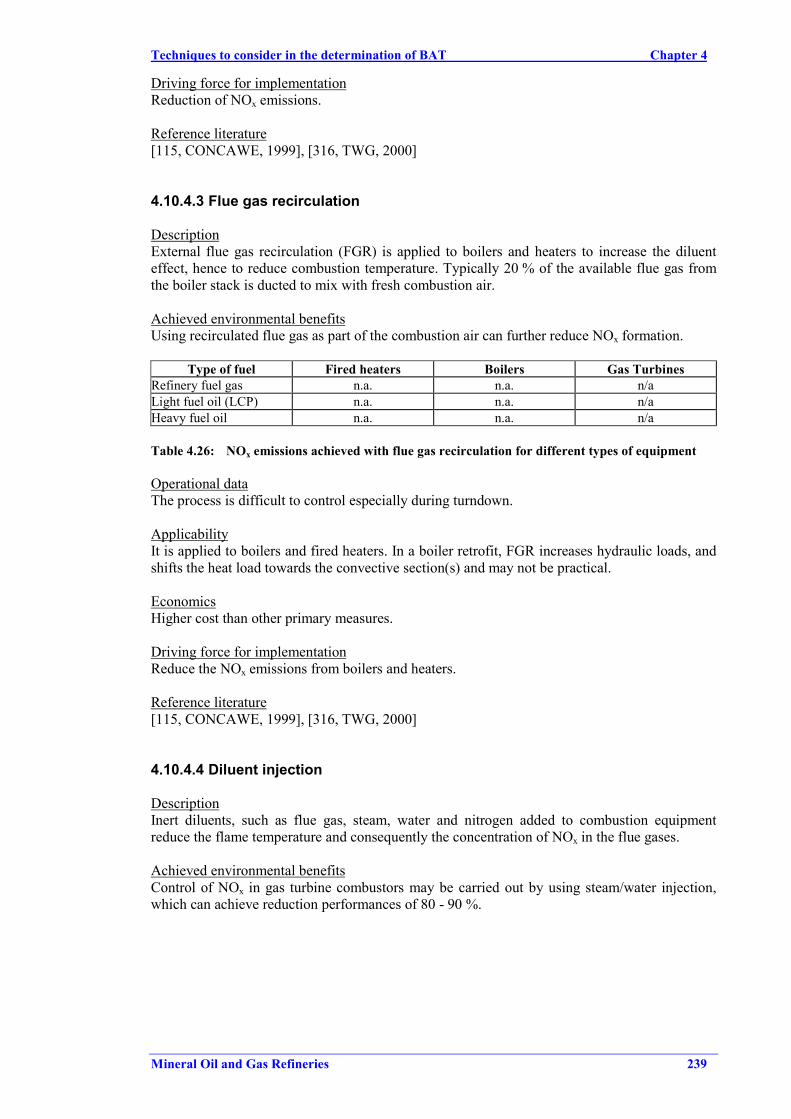
Techniques to consider in the determination of BAT Chapter 4
Mineral Oil and Gas Refineries 239
Driving force for implementationReduction of NOx emissions.
Reference literature[115, CONCAWE, 1999], [316, TWG, 2000]
4.10.4.3 Flue gas recirculation
DescriptionExternal flue gas recirculation (FGR) is applied to boilers and heaters to increase the diluenteffect, hence to reduce combustion temperature. Typically 20 % of the available flue gas fromthe boiler stack is ducted to mix with fresh combustion air.
Achieved environmental benefitsUsing recirculated flue gas as part of the combustion air can further reduce NOx formation.
Type of fuel Fired heaters Boilers Gas TurbinesRefinery fuel gas n.a. n.a. n/aLight fuel oil (LCP) n.a. n.a. n/aHeavy fuel oil n.a. n.a. n/a
Table 4.26: NOx emissions achieved with flue gas recirculation for different types of equipment
Operational dataThe process is difficult to control especially during turndown.
ApplicabilityIt is applied to boilers and fired heaters. In a boiler retrofit, FGR increases hydraulic loads, andshifts the heat load towards the convective section(s) and may not be practical.
EconomicsHigher cost than other primary measures.
Driving force for implementationReduce the NOx emissions from boilers and heaters.
Reference literature[115, CONCAWE, 1999], [316, TWG, 2000]
4.10.4.4 Diluent injection
DescriptionInert diluents, such as flue gas, steam, water and nitrogen added to combustion equipmentreduce the flame temperature and consequently the concentration of NOx in the flue gases.
Achieved environmental benefitsControl of NOx in gas turbine combustors may be carried out by using steam/water injection,which can achieve reduction performances of 80 - 90 %.
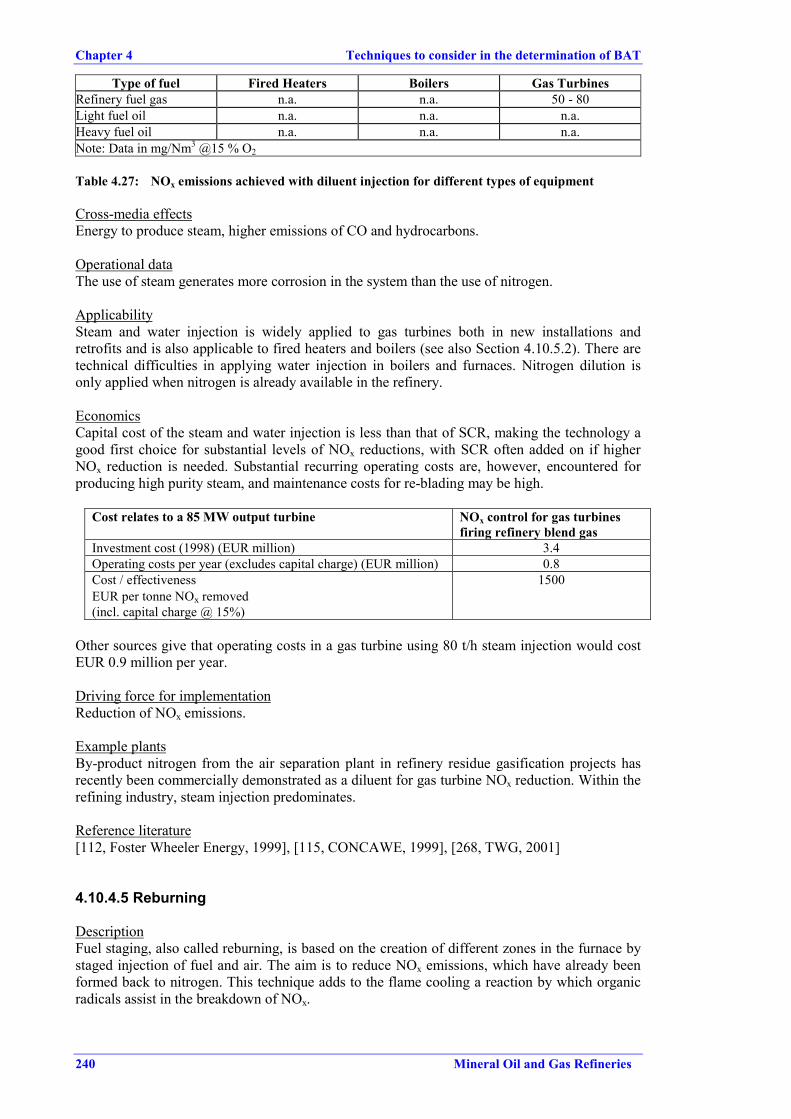
Chapter 4 Techniques to consider in the determination of BAT
240 Mineral Oil and Gas Refineries
Type of fuel Fired Heaters Boilers Gas TurbinesRefinery fuel gas n.a. n.a. 50 - 80Light fuel oil n.a. n.a. n.a.Heavy fuel oil n.a. n.a. n.a.Note: Data in mg/Nm3 @15 % O2
Table 4.27: NOx emissions achieved with diluent injection for different types of equipment
Cross-media effectsEnergy to produce steam, higher emissions of CO and hydrocarbons.
Operational dataThe use of steam generates more corrosion in the system than the use of nitrogen.
ApplicabilitySteam and water injection is widely applied to gas turbines both in new installations andretrofits and is also applicable to fired heaters and boilers (see also Section 4.10.5.2). There aretechnical difficulties in applying water injection in boilers and furnaces. Nitrogen dilution isonly applied when nitrogen is already available in the refinery.
EconomicsCapital cost of the steam and water injection is less than that of SCR, making the technology agood first choice for substantial levels of NOx reductions, with SCR often added on if higherNOx reduction is needed. Substantial recurring operating costs are, however, encountered forproducing high purity steam, and maintenance costs for re-blading may be high.
Cost relates to a 85 MW output turbine NOx control for gas turbinesfiring refinery blend gas
Investment cost (1998) (EUR million) 3.4Operating costs per year (excludes capital charge) (EUR million) 0.8Cost / effectivenessEUR per tonne NOx removed(incl. capital charge @ 15%)
1500
Other sources give that operating costs in a gas turbine using 80 t/h steam injection would costEUR 0.9 million per year.
Driving force for implementationReduction of NOx emissions.
Example plantsBy-product nitrogen from the air separation plant in refinery residue gasification projects hasrecently been commercially demonstrated as a diluent for gas turbine NOx reduction. Within therefining industry, steam injection predominates.
Reference literature[112, Foster Wheeler Energy, 1999], [115, CONCAWE, 1999], [268, TWG, 2001]
4.10.4.5 Reburning
DescriptionFuel staging, also called reburning, is based on the creation of different zones in the furnace bystaged injection of fuel and air. The aim is to reduce NOx emissions, which have already beenformed back to nitrogen. This technique adds to the flame cooling a reaction by which organicradicals assist in the breakdown of NOx.
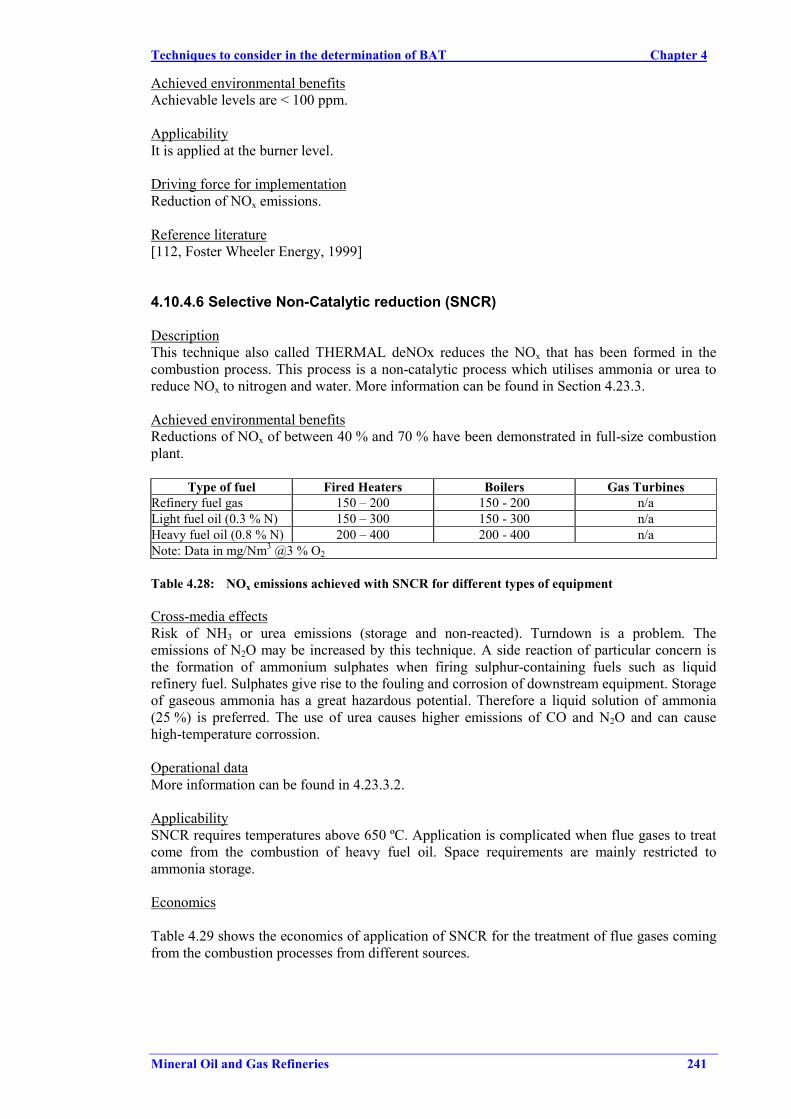
Techniques to consider in the determination of BAT Chapter 4
Mineral Oil and Gas Refineries 241
Achieved environmental benefitsAchievable levels are < 100 ppm.
ApplicabilityIt is applied at the burner level.
Driving force for implementationReduction of NOx emissions.
Reference literature[112, Foster Wheeler Energy, 1999]
4.10.4.6 Selective Non-Catalytic reduction (SNCR)
DescriptionThis technique also called THERMAL deNOx reduces the NOx that has been formed in thecombustion process. This process is a non-catalytic process which utilises ammonia or urea toreduce NOx to nitrogen and water. More information can be found in Section 4.23.3.
Achieved environmental benefitsReductions of NOx of between 40 % and 70 % have been demonstrated in full-size combustionplant.
Type of fuel Fired Heaters Boilers Gas TurbinesRefinery fuel gas 150 – 200 150 - 200 n/aLight fuel oil (0.3 % N) 150 – 300 150 - 300 n/aHeavy fuel oil (0.8 % N) 200 – 400 200 - 400 n/aNote: Data in mg/Nm3 @3 % O2
Table 4.28: NOx emissions achieved with SNCR for different types of equipment
Cross-media effectsRisk of NH3 or urea emissions (storage and non-reacted). Turndown is a problem. Theemissions of N2O may be increased by this technique. A side reaction of particular concern isthe formation of ammonium sulphates when firing sulphur-containing fuels such as liquidrefinery fuel. Sulphates give rise to the fouling and corrosion of downstream equipment. Storageof gaseous ammonia has a great hazardous potential. Therefore a liquid solution of ammonia(25 %) is preferred. The use of urea causes higher emissions of CO and N2O and can causehigh-temperature corrossion.
Operational dataMore information can be found in 4.23.3.2.
ApplicabilitySNCR requires temperatures above 650 ºC. Application is complicated when flue gases to treatcome from the combustion of heavy fuel oil. Space requirements are mainly restricted toammonia storage.
Economics
Table 4.29 shows the economics of application of SNCR for the treatment of flue gases comingfrom the combustion processes from different sources.
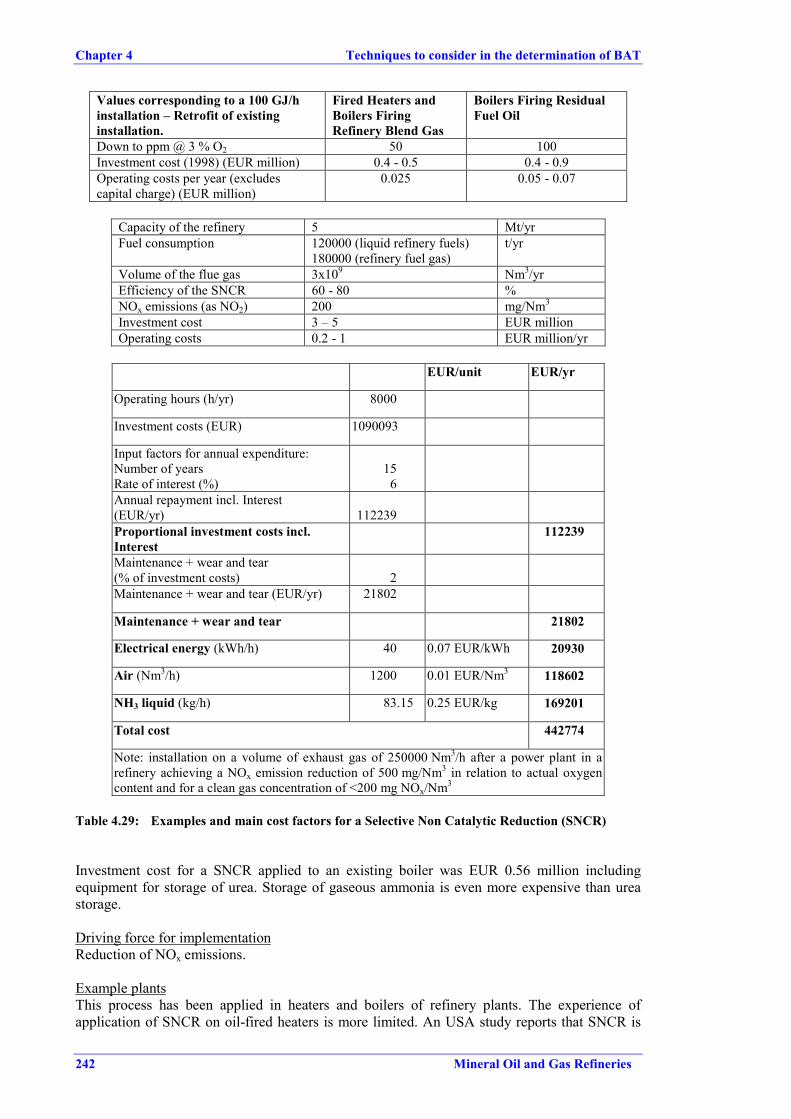
Chapter 4 Techniques to consider in the determination of BAT
242 Mineral Oil and Gas Refineries
Values corresponding to a 100 GJ/hinstallation – Retrofit of existinginstallation.
Fired Heaters andBoilers FiringRefinery Blend Gas
Boilers Firing ResidualFuel Oil
Down to ppm @ 3 % O2 50 100Investment cost (1998) (EUR million) 0.4 - 0.5 0.4 - 0.9Operating costs per year (excludescapital charge) (EUR million)
0.025 0.05 - 0.07
Capacity of the refinery 5 Mt/yrFuel consumption 120000 (liquid refinery fuels)
180000 (refinery fuel gas)t/yr
Volume of the flue gas 3x10⁹ Nm3/yrEfficiency of the SNCR 60 - 80 %NOx emissions (as NO2) 200 mg/Nm3
Investment cost 3 – 5 EUR millionOperating costs 0.2 - 1 EUR million/yr
EUR/unit EUR/yr
Operating hours (h/yr) 8000
Investment costs (EUR) 1090093
Input factors for annual expenditure:Number of yearsRate of interest (%)
156
Annual repayment incl. Interest(EUR/yr) 112239Proportional investment costs incl.Interest
112239
Maintenance + wear and tear(% of investment costs) 2Maintenance + wear and tear (EUR/yr) 21802
Maintenance + wear and tear 21802
Electrical energy (kWh/h) 40 0.07 EUR/kWh 20930
Air (Nm3/h) 1200 0.01 EUR/Nm3 118602
NH3 liquid (kg/h) 83.15 0.25 EUR/kg 169201
Total cost 442774
Note: installation on a volume of exhaust gas of 250000 Nm3/h after a power plant in arefinery achieving a NOx emission reduction of 500 mg/Nm3 in relation to actual oxygencontent and for a clean gas concentration of <200 mg NOx/Nm3
Table 4.29: Examples and main cost factors for a Selective Non Catalytic Reduction (SNCR)
Investment cost for a SNCR applied to an existing boiler was EUR 0.56 million includingequipment for storage of urea. Storage of gaseous ammonia is even more expensive than ureastorage.
Driving force for implementationReduction of NOx emissions.
Example plantsThis process has been applied in heaters and boilers of refinery plants. The experience ofapplication of SNCR on oil-fired heaters is more limited. An USA study reports that SNCR is
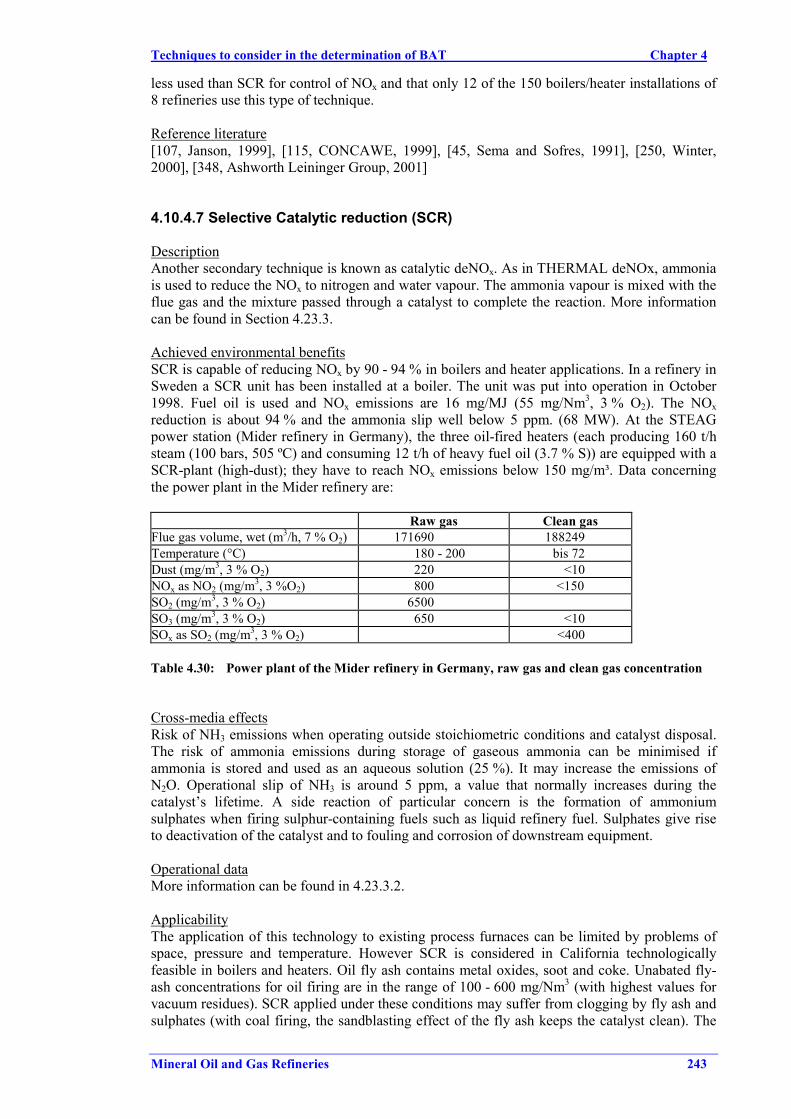
Techniques to consider in the determination of BAT Chapter 4
Mineral Oil and Gas Refineries 243
less used than SCR for control of NOx and that only 12 of the 150 boilers/heater installations of8 refineries use this type of technique.
Reference literature[107, Janson, 1999], [115, CONCAWE, 1999], [45, Sema and Sofres, 1991], [250, Winter,2000], [348, Ashworth Leininger Group, 2001]
4.10.4.7 Selective Catalytic reduction (SCR)
DescriptionAnother secondary technique is known as catalytic deNOx. As in THERMAL deNOx, ammoniais used to reduce the NOx to nitrogen and water vapour. The ammonia vapour is mixed with theflue gas and the mixture passed through a catalyst to complete the reaction. More informationcan be found in Section 4.23.3.
Achieved environmental benefitsSCR is capable of reducing NOx by 90 - 94 % in boilers and heater applications. In a refinery inSweden a SCR unit has been installed at a boiler. The unit was put into operation in October1998. Fuel oil is used and NOx emissions are 16 mg/MJ (55 mg/Nm3, 3 % O2). The NOxreduction is about 94 % and the ammonia slip well below 5 ppm. (68 MW). At the STEAGpower station (Mider refinery in Germany), the three oil-fired heaters (each producing 160 t/hsteam (100 bars, 505 ºC) and consuming 12 t/h of heavy fuel oil (3.7 % S)) are equipped with aSCR-plant (high-dust); they have to reach NOx emissions below 150 mg/m³. Data concerningthe power plant in the Mider refinery are:
Raw gas Clean gasFlue gas volume, wet (m3/h, 7 % O2) 171690 188249Temperature (°C) 180 - 200 bis 72Dust (mg/m3, 3 % O2) 220 <10NOx as NO2 (mg/m3, 3 %O2) 800 <150SO2 (mg/m3, 3 % O2) 6500SO3 (mg/m3, 3 % O2) 650 <10SOx as SO2 (mg/m3, 3 % O2) <400
Table 4.30: Power plant of the Mider refinery in Germany, raw gas and clean gas concentration
Cross-media effectsRisk of NH3 emissions when operating outside stoichiometric conditions and catalyst disposal.The risk of ammonia emissions during storage of gaseous ammonia can be minimised ifammonia is stored and used as an aqueous solution (25 %). It may increase the emissions ofN2O. Operational slip of NH3 is around 5 ppm, a value that normally increases during thecatalyst’s lifetime. A side reaction of particular concern is the formation of ammoniumsulphates when firing sulphur-containing fuels such as liquid refinery fuel. Sulphates give riseto deactivation of the catalyst and to fouling and corrosion of downstream equipment.
Operational dataMore information can be found in 4.23.3.2.
ApplicabilityThe application of this technology to existing process furnaces can be limited by problems ofspace, pressure and temperature. However SCR is considered in California technologicallyfeasible in boilers and heaters. Oil fly ash contains metal oxides, soot and coke. Unabated fly-ash concentrations for oil firing are in the range of 100 - 600 mg/Nm3 (with highest values forvacuum residues). SCR applied under these conditions may suffer from clogging by fly ash andsulphates (with coal firing, the sandblasting effect of the fly ash keeps the catalyst clean). The
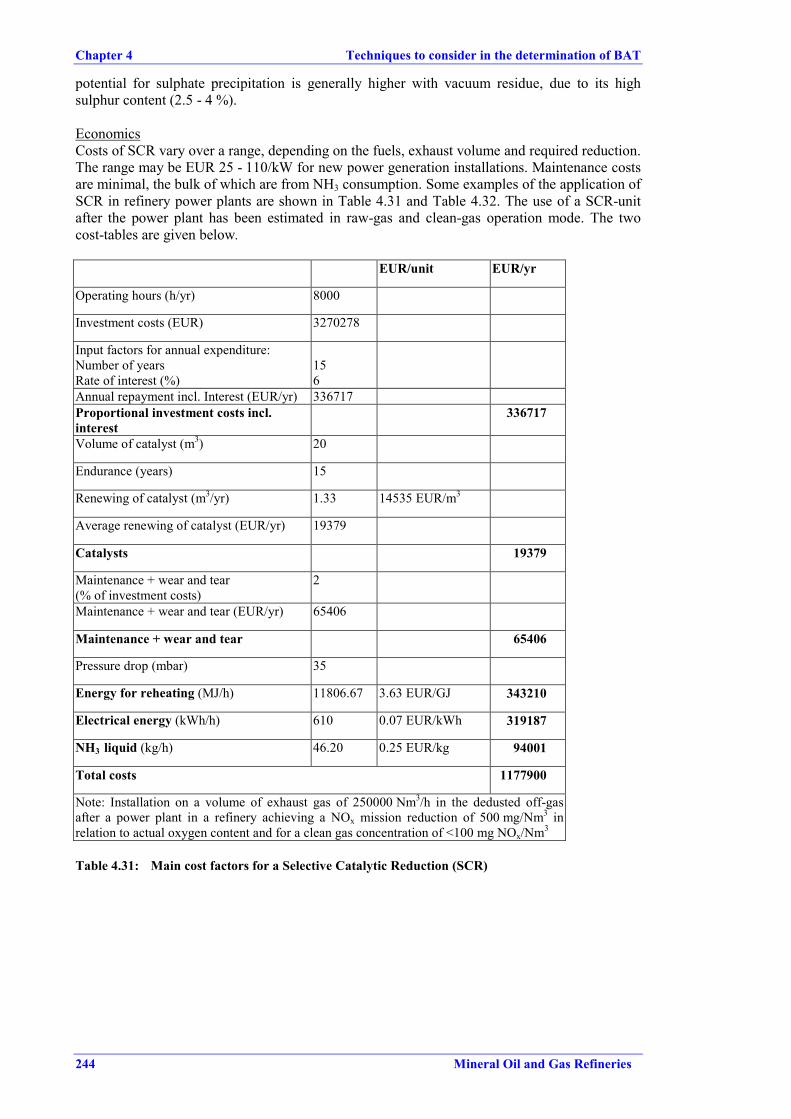
Chapter 4 Techniques to consider in the determination of BAT
244 Mineral Oil and Gas Refineries
potential for sulphate precipitation is generally higher with vacuum residue, due to its highsulphur content (2.5 - 4 %).
EconomicsCosts of SCR vary over a range, depending on the fuels, exhaust volume and required reduction.The range may be EUR 25 - 110/kW for new power generation installations. Maintenance costsare minimal, the bulk of which are from NH3 consumption. Some examples of the application ofSCR in refinery power plants are shown in Table 4.31 and Table 4.32. The use of a SCR-unitafter the power plant has been estimated in raw-gas and clean-gas operation mode. The twocost-tables are given below.
EUR/unit EUR/yr
Operating hours (h/yr) 8000
Investment costs (EUR) 3270278
Input factors for annual expenditure:Number of yearsRate of interest (%)
156
Annual repayment incl. Interest (EUR/yr) 336717Proportional investment costs incl.interest
336717
Volume of catalyst (m3) 20
Endurance (years) 15
Renewing of catalyst (m3/yr) 1.33 14535 EUR/m3
Average renewing of catalyst (EUR/yr) 19379
Catalysts 19379
Maintenance + wear and tear(% of investment costs)
2
Maintenance + wear and tear (EUR/yr) 65406
Maintenance + wear and tear 65406
Pressure drop (mbar) 35
Energy for reheating (MJ/h) 11806.67 3.63 EUR/GJ 343210
Electrical energy (kWh/h) 610 0.07 EUR/kWh 319187
NH3 liquid (kg/h) 46.20 0.25 EUR/kg 94001
Total costs 1177900
Note: Installation on a volume of exhaust gas of 250000 Nm3/h in the dedusted off-gasafter a power plant in a refinery achieving a NOx mission reduction of 500 mg/Nm3 inrelation to actual oxygen content and for a clean gas concentration of <100 mg NOx/Nm3
Table 4.31: Main cost factors for a Selective Catalytic Reduction (SCR)
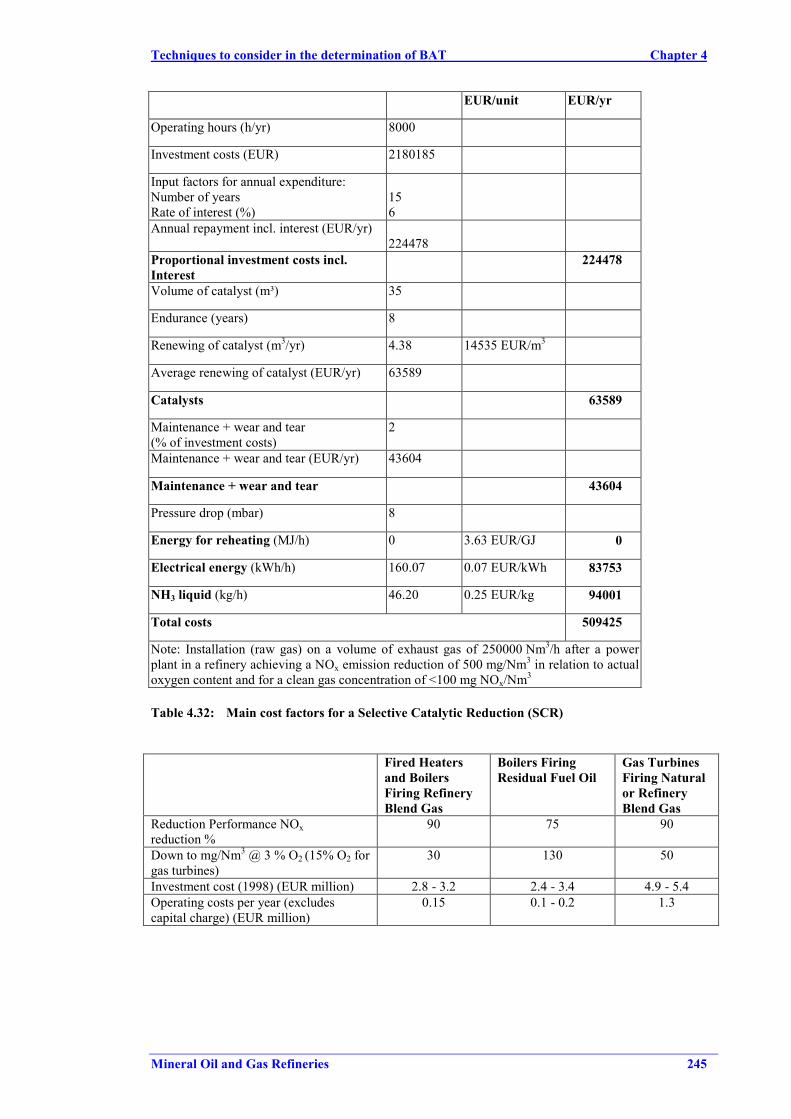
Techniques to consider in the determination of BAT Chapter 4
Mineral Oil and Gas Refineries 245
EUR/unit EUR/yr
Operating hours (h/yr) 8000
Investment costs (EUR) 2180185
Input factors for annual expenditure:Number of yearsRate of interest (%)
156
Annual repayment incl. interest (EUR/yr)224478
Proportional investment costs incl.Interest
224478
Volume of catalyst (m³) 35
Endurance (years) 8
Renewing of catalyst (m3/yr) 4.38 14535 EUR/m3
Average renewing of catalyst (EUR/yr) 63589
Catalysts 63589
Maintenance + wear and tear(% of investment costs)
2
Maintenance + wear and tear (EUR/yr) 43604
Maintenance + wear and tear 43604
Pressure drop (mbar) 8
Energy for reheating (MJ/h) 0 3.63 EUR/GJ 0
Electrical energy (kWh/h) 160.07 0.07 EUR/kWh 83753
NH3 liquid (kg/h) 46.20 0.25 EUR/kg 94001
Total costs 509425
Note: Installation (raw gas) on a volume of exhaust gas of 250000 Nm3/h after a powerplant in a refinery achieving a NOx emission reduction of 500 mg/Nm3 in relation to actualoxygen content and for a clean gas concentration of <100 mg NOx/Nm3
Table 4.32: Main cost factors for a Selective Catalytic Reduction (SCR)
Fired Heatersand BoilersFiring RefineryBlend Gas
Boilers FiringResidual Fuel Oil
Gas TurbinesFiring Naturalor RefineryBlend Gas
Reduction Performance NOxreduction %
90 75 90
Down to mg/Nm3 @ 3 % O2 (15% O2 forgas turbines)
30 130 50
Investment cost (1998) (EUR million) 2.8 - 3.2 2.4 - 3.4 4.9 - 5.4Operating costs per year (excludescapital charge) (EUR million)
0.15 0.1 - 0.2 1.3
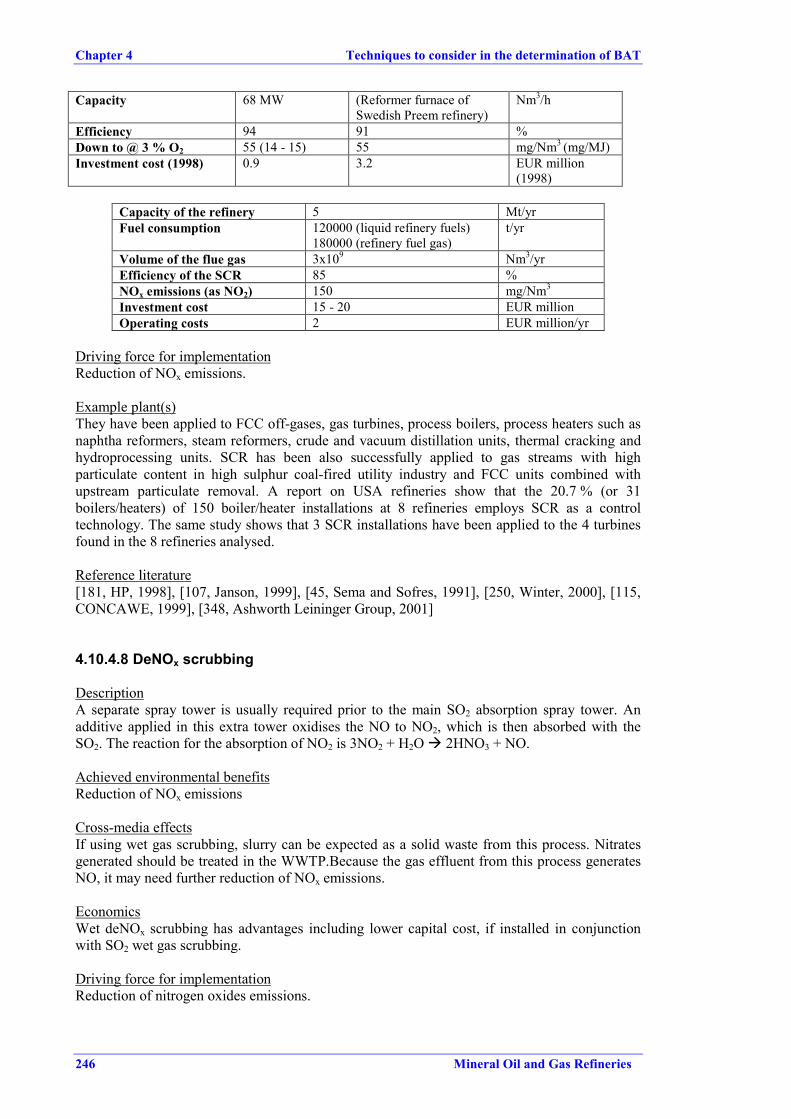
Chapter 4 Techniques to consider in the determination of BAT
246 Mineral Oil and Gas Refineries
Capacity 68 MW (Reformer furnace ofSwedish Preem refinery)
Nm3/h
Efficiency 94 91 %Down to @ 3 % O2 55 (14 - 15) 55 mg/Nm3 (mg/MJ)Investment cost (1998) 0.9 3.2 EUR million
(1998)
Capacity of the refinery 5 Mt/yrFuel consumption 120000 (liquid refinery fuels)
180000 (refinery fuel gas)t/yr
Volume of the flue gas 3x10⁹ Nm3/yrEfficiency of the SCR 85 %NOx emissions (as NO2) 150 mg/Nm3
Investment cost 15 - 20 EUR millionOperating costs 2 EUR million/yr
Driving force for implementationReduction of NOx emissions.
Example plant(s)They have been applied to FCC off-gases, gas turbines, process boilers, process heaters such asnaphtha reformers, steam reformers, crude and vacuum distillation units, thermal cracking andhydroprocessing units. SCR has been also successfully applied to gas streams with highparticulate content in high sulphur coal-fired utility industry and FCC units combined withupstream particulate removal. A report on USA refineries show that the 20.7 % (or 31boilers/heaters) of 150 boiler/heater installations at 8 refineries employs SCR as a controltechnology. The same study shows that 3 SCR installations have been applied to the 4 turbinesfound in the 8 refineries analysed.
Reference literature[181, HP, 1998], [107, Janson, 1999], [45, Sema and Sofres, 1991], [250, Winter, 2000], [115,CONCAWE, 1999], [348, Ashworth Leininger Group, 2001]
4.10.4.8 DeNOx scrubbing
DescriptionA separate spray tower is usually required prior to the main SO2 absorption spray tower. Anadditive applied in this extra tower oxidises the NO to NO2, which is then absorbed with theSO2. The reaction for the absorption of NO2 is 3NO2 + H2O � 2HNO3 + NO.
Achieved environmental benefitsReduction of NOx emissions
Cross-media effectsIf using wet gas scrubbing, slurry can be expected as a solid waste from this process. Nitratesgenerated should be treated in the WWTP.Because the gas effluent from this process generatesNO, it may need further reduction of NOx emissions.
EconomicsWet deNOx scrubbing has advantages including lower capital cost, if installed in conjunctionwith SO2 wet gas scrubbing.
Driving force for implementationReduction of nitrogen oxides emissions.
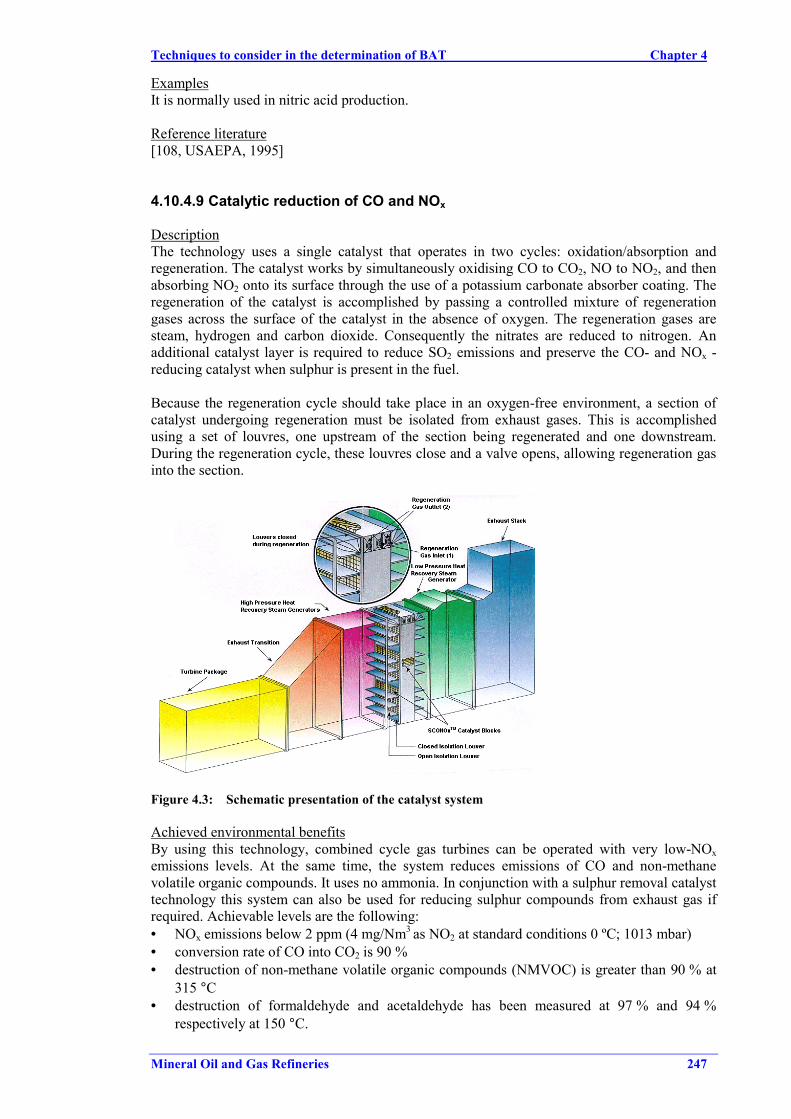
Techniques to consider in the determination of BAT Chapter 4
Mineral Oil and Gas Refineries 247
ExamplesIt is normally used in nitric acid production.
Reference literature[108, USAEPA, 1995]
4.10.4.9 Catalytic reduction of CO and NOx
DescriptionThe technology uses a single catalyst that operates in two cycles: oxidation/absorption andregeneration. The catalyst works by simultaneously oxidising CO to CO2, NO to NO2, and thenabsorbing NO2 onto its surface through the use of a potassium carbonate absorber coating. Theregeneration of the catalyst is accomplished by passing a controlled mixture of regenerationgases across the surface of the catalyst in the absence of oxygen. The regeneration gases aresteam, hydrogen and carbon dioxide. Consequently the nitrates are reduced to nitrogen. Anadditional catalyst layer is required to reduce SO2 emissions and preserve the CO- and NOx -reducing catalyst when sulphur is present in the fuel.
Because the regeneration cycle should take place in an oxygen-free environment, a section ofcatalyst undergoing regeneration must be isolated from exhaust gases. This is accomplishedusing a set of louvres, one upstream of the section being regenerated and one downstream.During the regeneration cycle, these louvres close and a valve opens, allowing regeneration gasinto the section.
Figure 4.3: Schematic presentation of the catalyst system
Achieved environmental benefitsBy using this technology, combined cycle gas turbines can be operated with very low-NOxemissions levels. At the same time, the system reduces emissions of CO and non-methanevolatile organic compounds. It uses no ammonia. In conjunction with a sulphur removal catalysttechnology this system can also be used for reducing sulphur compounds from exhaust gas ifrequired. Achievable levels are the following:• NOx emissions below 2 ppm (4 mg/Nm3 as NO2 at standard conditions 0 ºC; 1013 mbar)• conversion rate of CO into CO2 is 90 %• destruction of non-methane volatile organic compounds (NMVOC) is greater than 90 % at
315 °C• destruction of formaldehyde and acetaldehyde has been measured at 97 % and 94 %
respectively at 150 °C.
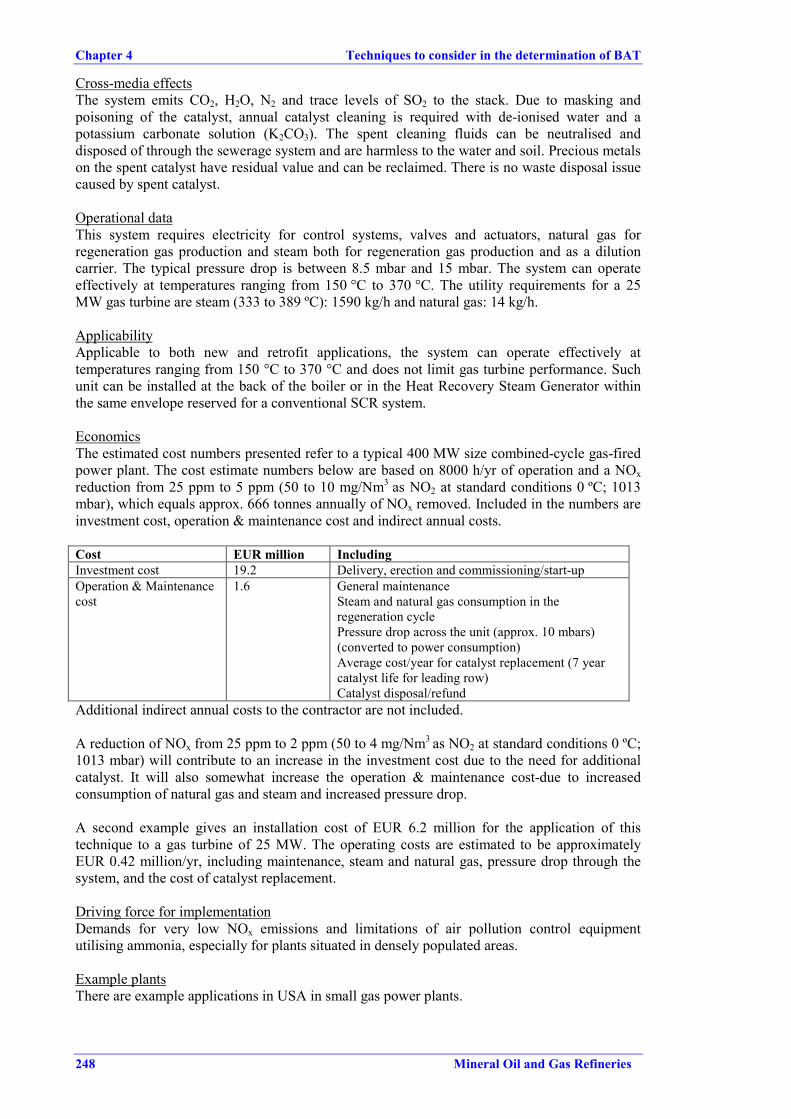
Chapter 4 Techniques to consider in the determination of BAT
248 Mineral Oil and Gas Refineries
Cross-media effectsThe system emits CO2, H2O, N2 and trace levels of SO2 to the stack. Due to masking andpoisoning of the catalyst, annual catalyst cleaning is required with de-ionised water and apotassium carbonate solution (K2CO3). The spent cleaning fluids can be neutralised anddisposed of through the sewerage system and are harmless to the water and soil. Precious metalson the spent catalyst have residual value and can be reclaimed. There is no waste disposal issuecaused by spent catalyst.
Operational dataThis system requires electricity for control systems, valves and actuators, natural gas forregeneration gas production and steam both for regeneration gas production and as a dilutioncarrier. The typical pressure drop is between 8.5 mbar and 15 mbar. The system can operateeffectively at temperatures ranging from 150 °C to 370 °C. The utility requirements for a 25MW gas turbine are steam (333 to 389 ºC): 1590 kg/h and natural gas: 14 kg/h.
ApplicabilityApplicable to both new and retrofit applications, the system can operate effectively attemperatures ranging from 150 °C to 370 °C and does not limit gas turbine performance. Suchunit can be installed at the back of the boiler or in the Heat Recovery Steam Generator withinthe same envelope reserved for a conventional SCR system.
EconomicsThe estimated cost numbers presented refer to a typical 400 MW size combined-cycle gas-firedpower plant. The cost estimate numbers below are based on 8000 h/yr of operation and a NOxreduction from 25 ppm to 5 ppm (50 to 10 mg/Nm3 as NO2 at standard conditions 0 ºC; 1013mbar), which equals approx. 666 tonnes annually of NOx removed. Included in the numbers areinvestment cost, operation & maintenance cost and indirect annual costs.
Cost EUR million IncludingInvestment cost 19.2 Delivery, erection and commissioning/start-upOperation & Maintenancecost
1.6 General maintenanceSteam and natural gas consumption in theregeneration cyclePressure drop across the unit (approx. 10 mbars)(converted to power consumption)Average cost/year for catalyst replacement (7 yearcatalyst life for leading row)Catalyst disposal/refund
Additional indirect annual costs to the contractor are not included.
A reduction of NOx from 25 ppm to 2 ppm (50 to 4 mg/Nm3 as NO2 at standard conditions 0 ºC;1013 mbar) will contribute to an increase in the investment cost due to the need for additionalcatalyst. It will also somewhat increase the operation & maintenance cost-due to increasedconsumption of natural gas and steam and increased pressure drop.
A second example gives an installation cost of EUR 6.2 million for the application of thistechnique to a gas turbine of 25 MW. The operating costs are estimated to be approximatelyEUR 0.42 million/yr, including maintenance, steam and natural gas, pressure drop through thesystem, and the cost of catalyst replacement.
Driving force for implementationDemands for very low NOx emissions and limitations of air pollution control equipmentutilising ammonia, especially for plants situated in densely populated areas.
Example plantsThere are example applications in USA in small gas power plants.
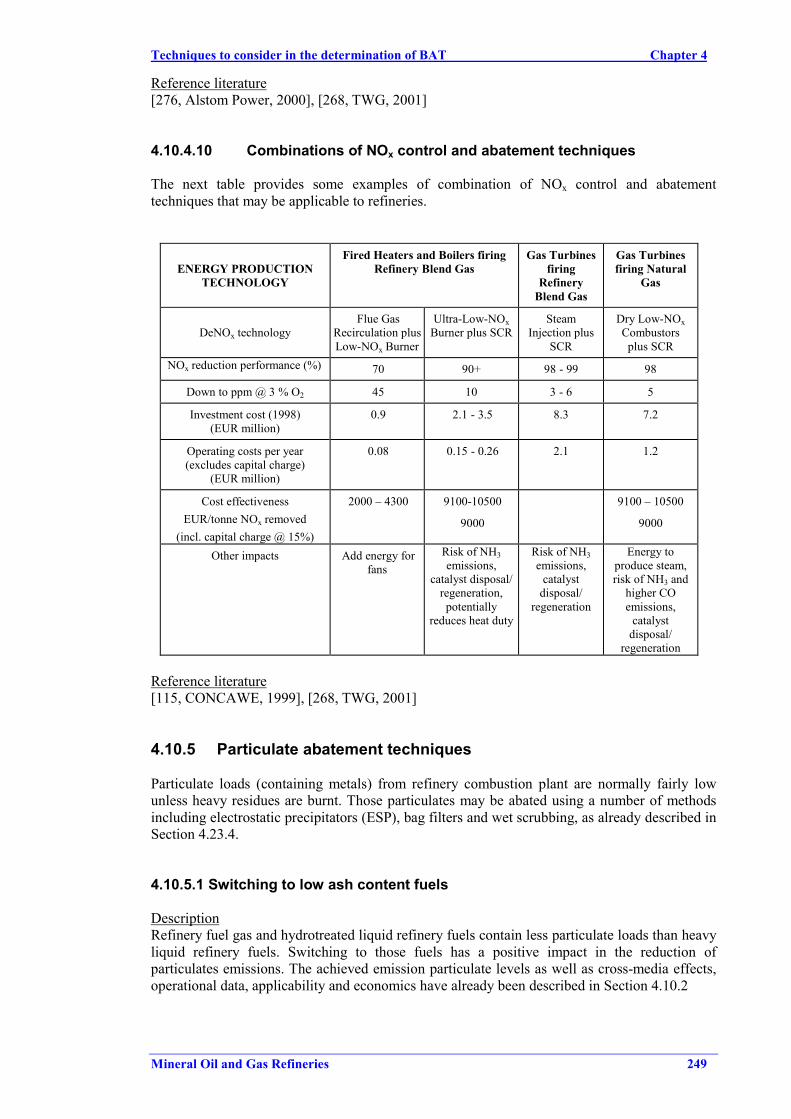
Techniques to consider in the determination of BAT Chapter 4
Mineral Oil and Gas Refineries 249
Reference literature[276, Alstom Power, 2000], [268, TWG, 2001]
4.10.4.10 Combinations of NOx control and abatement techniques
The next table provides some examples of combination of NOx control and abatementtechniques that may be applicable to refineries.
ENERGY PRODUCTIONTECHNOLOGY
Fired Heaters and Boilers firingRefinery Blend Gas
Gas Turbinesfiring
RefineryBlend Gas
Gas Turbinesfiring Natural
Gas
DeNOx technologyFlue Gas
Recirculation plusLow-NOx Burner
Ultra-Low-NOxBurner plus SCR
SteamInjection plus
SCR
Dry Low-NOxCombustors
plus SCRNOx reduction performance (%) 70 90+ 98 - 99 98
Down to ppm @ 3 % O2 45 10 3 - 6 5
Investment cost (1998)(EUR million)
0.9 2.1 - 3.5 8.3 7.2
Operating costs per year(excludes capital charge)
(EUR million)
0.08 0.15 - 0.26 2.1 1.2
Cost effectivenessEUR/tonne NOx removed
(incl. capital charge @ 15%)
2000 – 4300 9100-10500
9000
9100 – 10500
9000
Other impacts Add energy forfans
Risk of NH3emissions,
catalyst disposal/regeneration,potentially
reduces heat duty
Risk of NH3emissions,
catalystdisposal/
regeneration
Energy toproduce steam,risk of NH3 and
higher COemissions,
catalystdisposal/
regeneration
Reference literature[115, CONCAWE, 1999], [268, TWG, 2001]
4.10.5 Particulate abatement techniques
Particulate loads (containing metals) from refinery combustion plant are normally fairly lowunless heavy residues are burnt. Those particulates may be abated using a number of methodsincluding electrostatic precipitators (ESP), bag filters and wet scrubbing, as already described inSection 4.23.4.
4.10.5.1 Switching to low ash content fuels
DescriptionRefinery fuel gas and hydrotreated liquid refinery fuels contain less particulate loads than heavyliquid refinery fuels. Switching to those fuels has a positive impact in the reduction ofparticulates emissions. The achieved emission particulate levels as well as cross-media effects,operational data, applicability and economics have already been described in Section 4.10.2
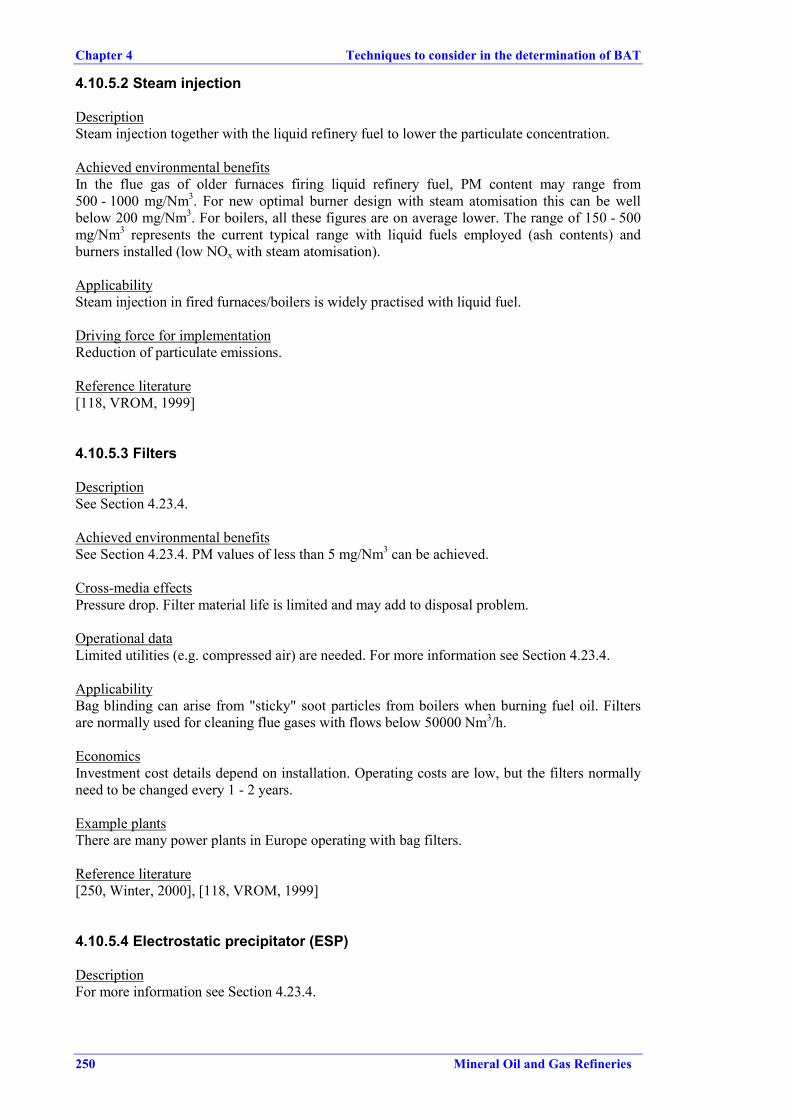
Chapter 4 Techniques to consider in the determination of BAT
250 Mineral Oil and Gas Refineries
4.10.5.2 Steam injection
DescriptionSteam injection together with the liquid refinery fuel to lower the particulate concentration.
Achieved environmental benefitsIn the flue gas of older furnaces firing liquid refinery fuel, PM content may range from500 - 1000 mg/Nm3. For new optimal burner design with steam atomisation this can be wellbelow 200 mg/Nm3. For boilers, all these figures are on average lower. The range of 150 - 500mg/Nm3 represents the current typical range with liquid fuels employed (ash contents) andburners installed (low NOx with steam atomisation).
ApplicabilitySteam injection in fired furnaces/boilers is widely practised with liquid fuel.
Driving force for implementationReduction of particulate emissions.
Reference literature[118, VROM, 1999]
4.10.5.3 Filters
DescriptionSee Section 4.23.4.
Achieved environmental benefitsSee Section 4.23.4. PM values of less than 5 mg/Nm3 can be achieved.
Cross-media effectsPressure drop. Filter material life is limited and may add to disposal problem.
Operational dataLimited utilities (e.g. compressed air) are needed. For more information see Section 4.23.4.
ApplicabilityBag blinding can arise from "sticky" soot particles from boilers when burning fuel oil. Filtersare normally used for cleaning flue gases with flows below 50000 Nm3/h.
EconomicsInvestment cost details depend on installation. Operating costs are low, but the filters normallyneed to be changed every 1 - 2 years.
Example plantsThere are many power plants in Europe operating with bag filters.
Reference literature[250, Winter, 2000], [118, VROM, 1999]
4.10.5.4 Electrostatic precipitator (ESP)
DescriptionFor more information see Section 4.23.4.
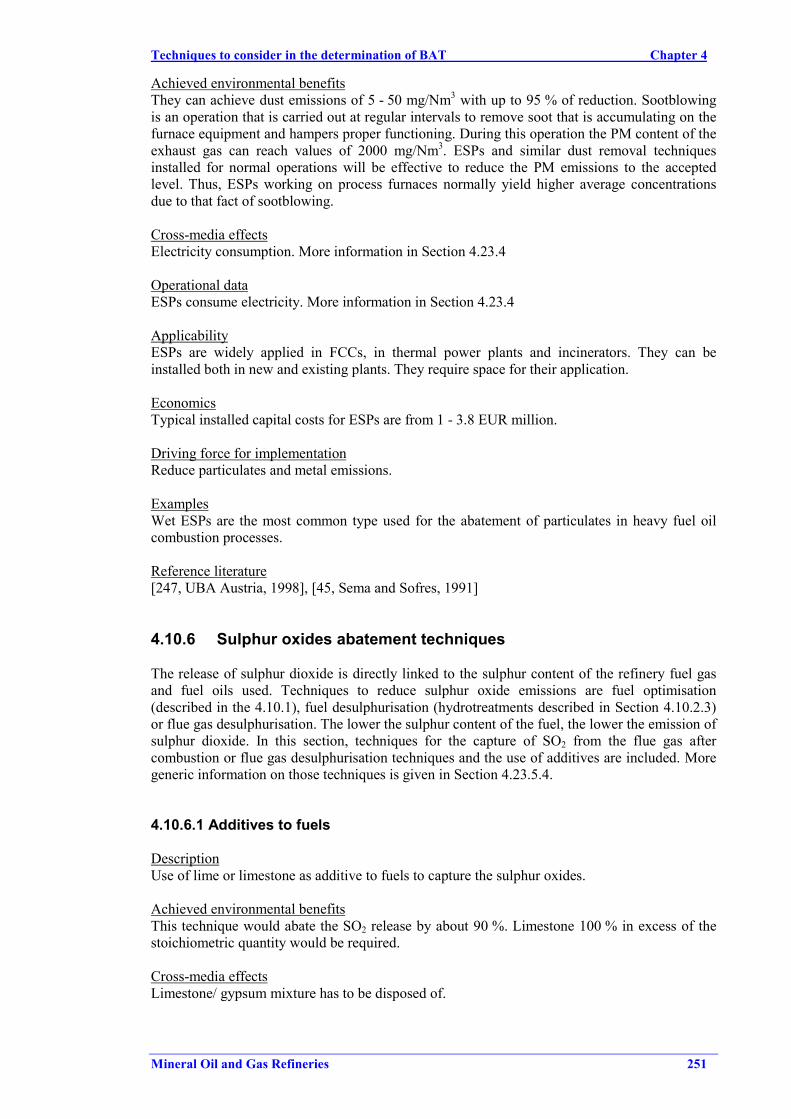
Techniques to consider in the determination of BAT Chapter 4
Mineral Oil and Gas Refineries 251
Achieved environmental benefitsThey can achieve dust emissions of 5 - 50 mg/Nm3 with up to 95 % of reduction. Sootblowingis an operation that is carried out at regular intervals to remove soot that is accumulating on thefurnace equipment and hampers proper functioning. During this operation the PM content of theexhaust gas can reach values of 2000 mg/Nm3. ESPs and similar dust removal techniquesinstalled for normal operations will be effective to reduce the PM emissions to the acceptedlevel. Thus, ESPs working on process furnaces normally yield higher average concentrationsdue to that fact of sootblowing.
Cross-media effectsElectricity consumption. More information in Section 4.23.4
Operational dataESPs consume electricity. More information in Section 4.23.4
ApplicabilityESPs are widely applied in FCCs, in thermal power plants and incinerators. They can beinstalled both in new and existing plants. They require space for their application.
EconomicsTypical installed capital costs for ESPs are from 1 - 3.8 EUR million.
Driving force for implementationReduce particulates and metal emissions.
ExamplesWet ESPs are the most common type used for the abatement of particulates in heavy fuel oilcombustion processes.
Reference literature[247, UBA Austria, 1998], [45, Sema and Sofres, 1991]
4.10.6 Sulphur oxides abatement techniques
The release of sulphur dioxide is directly linked to the sulphur content of the refinery fuel gasand fuel oils used. Techniques to reduce sulphur oxide emissions are fuel optimisation(described in the 4.10.1), fuel desulphurisation (hydrotreatments described in Section 4.10.2.3)or flue gas desulphurisation. The lower the sulphur content of the fuel, the lower the emission ofsulphur dioxide. In this section, techniques for the capture of SO2 from the flue gas aftercombustion or flue gas desulphurisation techniques and the use of additives are included. Moregeneric information on those techniques is given in Section 4.23.5.4.
4.10.6.1 Additives to fuels
DescriptionUse of lime or limestone as additive to fuels to capture the sulphur oxides.
Achieved environmental benefitsThis technique would abate the SO2 release by about 90 %. Limestone 100 % in excess of thestoichiometric quantity would be required.
Cross-media effectsLimestone/ gypsum mixture has to be disposed of.
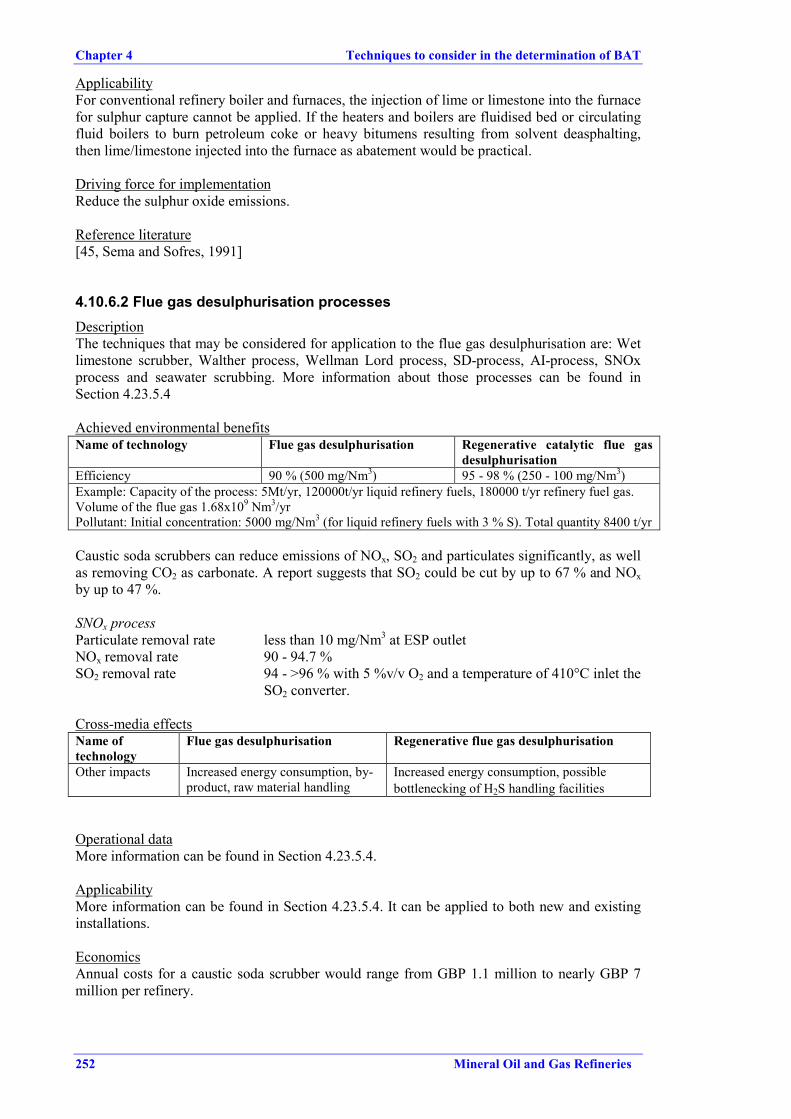
Chapter 4 Techniques to consider in the determination of BAT
252 Mineral Oil and Gas Refineries
ApplicabilityFor conventional refinery boiler and furnaces, the injection of lime or limestone into the furnacefor sulphur capture cannot be applied. If the heaters and boilers are fluidised bed or circulatingfluid boilers to burn petroleum coke or heavy bitumens resulting from solvent deasphalting,then lime/limestone injected into the furnace as abatement would be practical.
Driving force for implementationReduce the sulphur oxide emissions.
Reference literature[45, Sema and Sofres, 1991]
4.10.6.2 Flue gas desulphurisation processesDescriptionThe techniques that may be considered for application to the flue gas desulphurisation are: Wetlimestone scrubber, Walther process, Wellman Lord process, SD-process, AI-process, SNOxprocess and seawater scrubbing. More information about those processes can be found inSection 4.23.5.4
Achieved environmental benefitsName of technology Flue gas desulphurisation Regenerative catalytic flue gas
desulphurisationEfficiency 90 % (500 mg/Nm3) 95 - 98 % (250 - 100 mg/Nm3)Example: Capacity of the process: 5Mt/yr, 120000t/yr liquid refinery fuels, 180000 t/yr refinery fuel gas.Volume of the flue gas 1.68x10⁹ Nm3/yrPollutant: Initial concentration: 5000 mg/Nm3 (for liquid refinery fuels with 3 % S). Total quantity 8400 t/yr
Caustic soda scrubbers can reduce emissions of NOx, SO2 and particulates significantly, as wellas removing CO2 as carbonate. A report suggests that SO2 could be cut by up to 67 % and NOxby up to 47 %.
SNOx processParticulate removal rate less than 10 mg/Nm3 at ESP outletNOx removal rate 90 - 94.7 %SO2 removal rate 94 - >96 % with 5 %v/v O2 and a temperature of 410°C inlet the
SO2 converter.
Cross-media effectsName oftechnology
Flue gas desulphurisation Regenerative flue gas desulphurisation
Other impacts Increased energy consumption, by-product, raw material handling
Increased energy consumption, possiblebottlenecking of H2S handling facilities
Operational dataMore information can be found in Section 4.23.5.4.
ApplicabilityMore information can be found in Section 4.23.5.4. It can be applied to both new and existinginstallations.
EconomicsAnnual costs for a caustic soda scrubber would range from GBP 1.1 million to nearly GBP 7million per refinery.
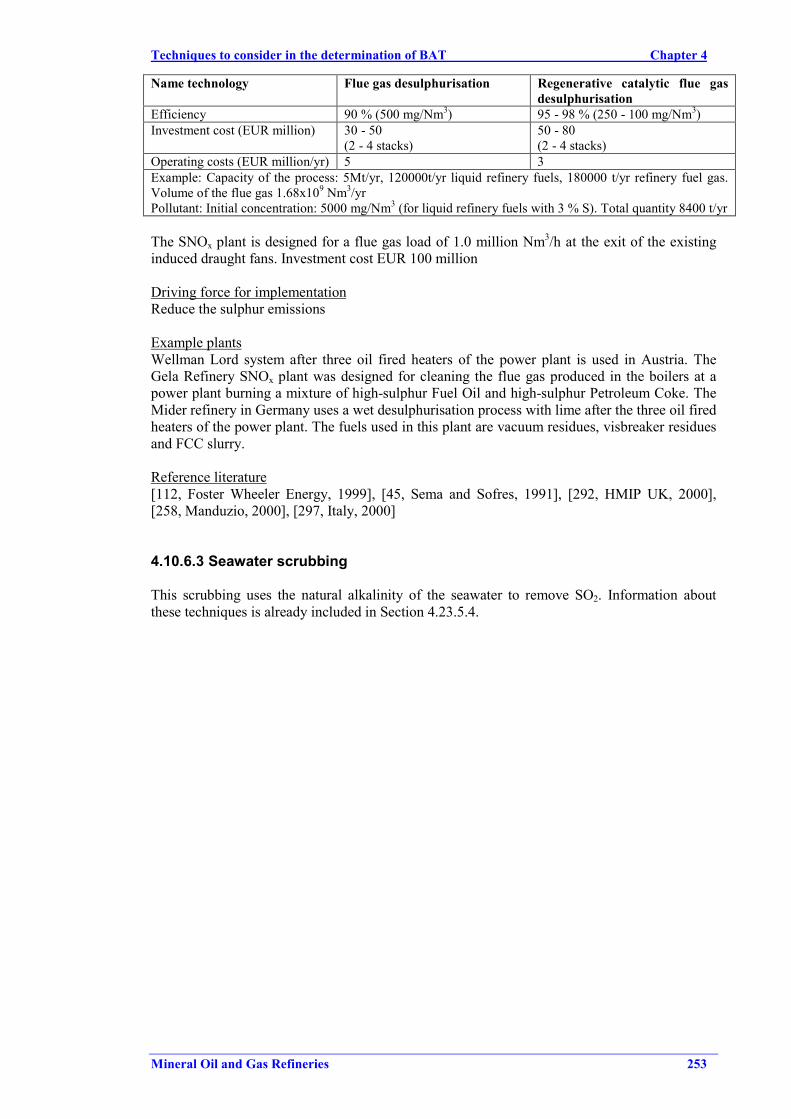
Techniques to consider in the determination of BAT Chapter 4
Mineral Oil and Gas Refineries 253
Name technology Flue gas desulphurisation Regenerative catalytic flue gasdesulphurisation
Efficiency 90 % (500 mg/Nm3) 95 - 98 % (250 - 100 mg/Nm3)Investment cost (EUR million) 30 - 50
(2 - 4 stacks)50 - 80(2 - 4 stacks)
Operating costs (EUR million/yr) 5 3Example: Capacity of the process: 5Mt/yr, 120000t/yr liquid refinery fuels, 180000 t/yr refinery fuel gas.Volume of the flue gas 1.68x10⁹ Nm3/yrPollutant: Initial concentration: 5000 mg/Nm3 (for liquid refinery fuels with 3 % S). Total quantity 8400 t/yr
The SNOx plant is designed for a flue gas load of 1.0 million Nm3/h at the exit of the existinginduced draught fans. Investment cost EUR 100 million
Driving force for implementationReduce the sulphur emissions
Example plantsWellman Lord system after three oil fired heaters of the power plant is used in Austria. TheGela Refinery SNOx plant was designed for cleaning the flue gas produced in the boilers at apower plant burning a mixture of high-sulphur Fuel Oil and high-sulphur Petroleum Coke. TheMider refinery in Germany uses a wet desulphurisation process with lime after the three oil firedheaters of the power plant. The fuels used in this plant are vacuum residues, visbreaker residuesand FCC slurry.
Reference literature[112, Foster Wheeler Energy, 1999], [45, Sema and Sofres, 1991], [292, HMIP UK, 2000],[258, Manduzio, 2000], [297, Italy, 2000]
4.10.6.3 Seawater scrubbing
This scrubbing uses the natural alkalinity of the seawater to remove SO2. Information aboutthese techniques is already included in Section 4.23.5.4.
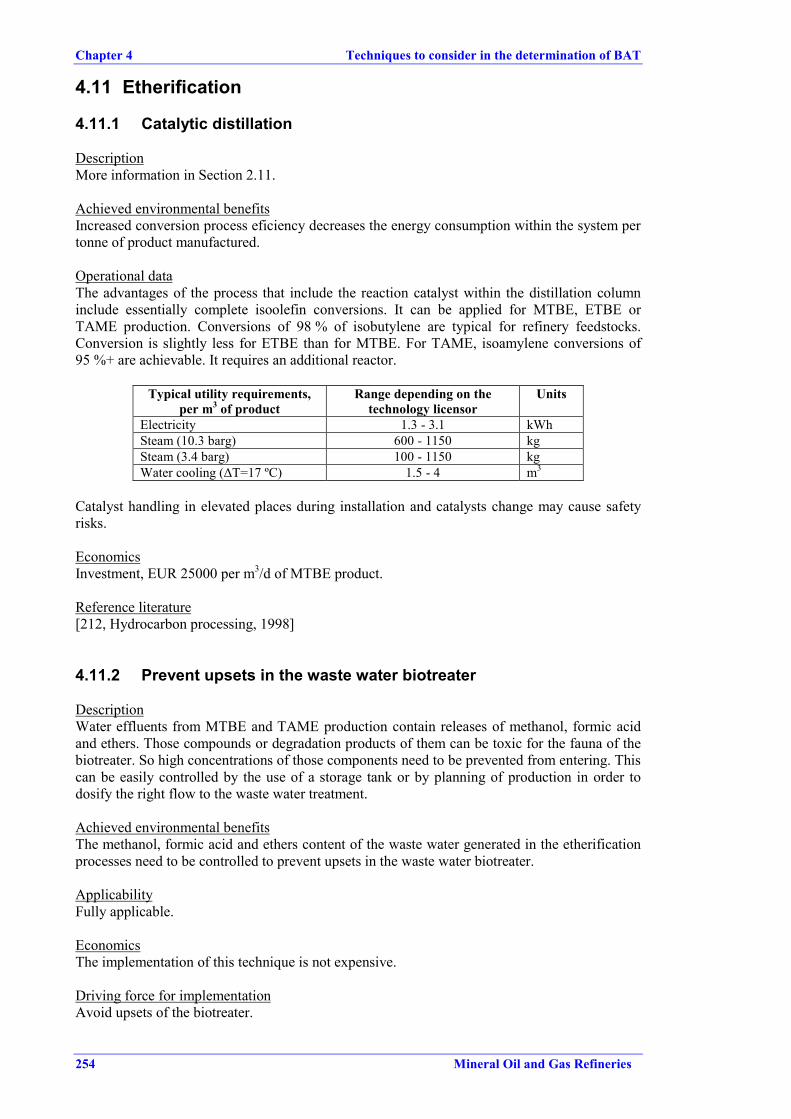
Chapter 4 Techniques to consider in the determination of BAT
254 Mineral Oil and Gas Refineries
4.11 Etherification
4.11.1 Catalytic distillation
DescriptionMore information in Section 2.11.
Achieved environmental benefitsIncreased conversion process eficiency decreases the energy consumption within the system pertonne of product manufactured.
Operational dataThe advantages of the process that include the reaction catalyst within the distillation columninclude essentially complete isoolefin conversions. It can be applied for MTBE, ETBE orTAME production. Conversions of 98 % of isobutylene are typical for refinery feedstocks.Conversion is slightly less for ETBE than for MTBE. For TAME, isoamylene conversions of95 %+ are achievable. It requires an additional reactor.
Typical utility requirements,per m3 of product
Range depending on thetechnology licensor
Units
Electricity 1.3 - 3.1 kWhSteam (10.3 barg) 600 - 1150 kgSteam (3.4 barg) 100 - 1150 kgWater cooling (∆T=17 ºC) 1.5 - 4 m3
Catalyst handling in elevated places during installation and catalysts change may cause safetyrisks.
EconomicsInvestment, EUR 25000 per m3/d of MTBE product.
Reference literature[212, Hydrocarbon processing, 1998]
4.11.2 Prevent upsets in the waste water biotreater
DescriptionWater effluents from MTBE and TAME production contain releases of methanol, formic acidand ethers. Those compounds or degradation products of them can be toxic for the fauna of thebiotreater. So high concentrations of those components need to be prevented from entering. Thiscan be easily controlled by the use of a storage tank or by planning of production in order todosify the right flow to the waste water treatment.
Achieved environmental benefitsThe methanol, formic acid and ethers content of the waste water generated in the etherificationprocesses need to be controlled to prevent upsets in the waste water biotreater.
ApplicabilityFully applicable.
EconomicsThe implementation of this technique is not expensive.
Driving force for implementationAvoid upsets of the biotreater.
Techniques to consider in the determination of BAT Chapter 4
Mineral Oil and Gas Refineries 255
Reference literature[272, Shawcross, 2000]
4.11.3 Prevent leaking of water soluble compounds
DescriptionEthers produced in the etherification processes are very soluble in water. If they leak maycontaminate the soil, raining water and ground water. It can be seen as a part of a programmefor prevention, detection and control of the soil and groundwater (See Section 4.25.1)
Achieved environmental benefitsReduce the risk of contamination of water by ethers and alcohols used in these processes.
Driving force for implementationAvoid contamination of ground water and surface water by ethers.
Reference literature[349, Finnish Environmental Institute, 2001]
Chapter 4 Techniques to consider in the determination of BAT
256 Mineral Oil and Gas Refineries
4.12 Gas separation processes
4.12.1 Increase the heat integration with upstream plants
DescriptionThe gas plant is a relatively simple process and the temperature levels are not high enough tocreate the opportunity for steam generation. No great efficiency improvements are to beexpected within a gas plant, but heat integration with upstream plants will normally make use ofe.g. reboiling heat available from upstream plant streams, saving direct heating capacity in thegas separation plant.
Achieved environmental benefitsReduced energy consumption in the gas plant and therefore in the refinery as a whole.
Cross-media effectsNo cross-media effects.
Driving force for implementationReduced energy consumption within the refinery.
Example plantsTechnique widely applied.
Reference literature[282, Conoco, 2000]
4.12.2 Improve the condensate knock-out system
DescriptionRe-sizing/improving condensate knock-out system on gas streams & on-site recycling.
Achieved environmental benefitsAppreciable waste minimisation.
ApplicabilityRelatively minor modifications.
Driving force for implementationReduction of waste generation.
Reference literature[115, CONCAWE, 1999]
4.12.3 Fugitive emissions minimisation
DescriptionGas plants process light compounds and are consequently more likely to produce fugitiveemissions. The use of double mechanical seals on pumps, compressors and agitators can reduceVOC emissions. Use of low-leaking valves also can contribute to reduce VOC emissions. Thistopic is described as an integrated measure within Section 4.23.6.1 because fugitives occur in allrefinery processes, but it is mentioned here explicitly because the light compounds used lead toa relatively high level of fugitive emissions.
Techniques to consider in the determination of BAT Chapter 4
Mineral Oil and Gas Refineries 257
Achieved environmental benefitsApplying those techniques, fugitive emissions such as VOC, H2S and other sulphur compoundscan be reduced considerably.
Cross-media effectsSection 4.23.6.1.
Operational dataSection 4.23.6.1.
ApplicabilitySection 4.23.6.1.
EconomicsSection 4.23.6.1.
Driving force for implementationReduction of product loss.
Example plantsProgrammes of minimisation of VOC emissions can be found in many European and non-European refineries.
Reference literatureSection 4.23.6.1.
4.12.4 Re-use of the fuel gas used in LPG production
DescriptionMolecular sieve dryers used in LPG production are regenerated using hot fuel gas.
Achieved environmental benefitsThe fuel gas can be vented to fuel gas drums to be re-used instead of being flared.
ApplicabilityEasily applicable.
Driving force for implementationReduced flaring.
Example plantsMany examples exist.
Reference literature[18, Irish EPA, 1992]
4.12.5 Prevention of emissions of LPG odorant
Storage and handling of odorants used in the LPG production is going to be covered in thehorizontal BREF on Storage. However the dosing of odorant to the LPG product need to behandled in a proper way to prevent emissions to the environment. This technique is included inthe Section 4.21.21.
Chapter 4 Techniques to consider in the determination of BAT
258 Mineral Oil and Gas Refineries
4.13 Hydrogen-consuming processes
4.13.1 Hydrotreating
DescriptionSee Section 2.13. Another technique that can be used is the use of heat recovery from high-temperature process streams in WHB and power recovery in the high-pressure units (lettingdown liquid) to increase the heat integration.
Achieved environmental benefitsReduction of sulphur, nitrogen, aromatics and particulate emissions. Hydrotreatment, inaddition to removing sulphur compounds, will remove nitrogen compounds by about 15 - 40 %(Very severe hydrotreating might achieve higher percentage removals).
Cross-media effectsSee next technique in this chapter.
Operational dataSee Section 2.13.
ApplicabilityFully applicable.
EconomicsThe investment associated with the installation of a hydrotreating unit depends on the feedcharacteristics and the product specifications. Generally speaking, as the feed gets heavier or theindividual product specifications are reduced, the processing requirements are increased. Thesemore severe processing conditions can result in more pieces of equipment, larger equipment,and higher operating pressure, all of which increase the cost of the unit. The required capitalinvestment for a hydrotreating unit can vary from EUR12 to EUR48 per tonne per year ofcapacity.
Type of hydrotreater Capacity(Mt/yr)
Typical capital/installed cost1997 million EUR
Typical operatingcost million EUR
per year1.3 501.7 58
Naphtha hydrotreatment
2.2 681.1 702.2 113 20
Catalytic feed hydrotreatment(typical feeds being atmosphericresidue and vacuum gas oil) 3.2 160
1.1 90 16Vacuum residue2.2 150
Driving force for implementationReduction of sulphur and aromatic content of the feedstock.
Example plantsMany examples exist in refineries.
Reference literature[166, Meyers, 1997], [112, Foster Wheeler Energy, 1999], [212, Hydrocarbon processing, 1998]
Techniques to consider in the determination of BAT Chapter 4
Mineral Oil and Gas Refineries 259
4.13.2 Hydrodesulphurisation processes
DescriptionSee Section 2.13. Another technique that can be used is the use of heat recovery from high-temperature process streams in WHB and power recovery in the high-pressure units (lettingdown liquid) to increase the heat integration.
Achieved environmental benefitsReduction of sulphur content of the different fractions. Modern techniques can reduce thesulphur content of distillates to less than 10 ppm. For example, the application of one-stephydration by means of a Co/Mo catalyst (30 - 40 bar) to middle distillates reduces the sulphurcontent by more than 90 % (down to some 100 ppm) depending on the product, the S-content ofthe feed and the reaction conditions. If demand for diesel fuel increases, additional compounds(e.g. LCO from the FCC) have to be used in its production. However these feedstocks contain avariety of aromatic compounds, which have to be hydrated under severe conditions (hightemperature, high pressure, highly active catalysts, two step processes).
New diesel specifications can be met in conventional single-stage hydrotreating units bylowering Liquid Hourly Space Velocity (LHSV) from 3.7 in conventional units to 0.8 - 1.1 byimplementing a reactor in series to the existing ones and applying the latest catalyst generationavailable for gasoil hydrotreating units. Processing Russian export blend with 1.3 % w/w S andan intermediate sulphur content ahead of the final desulphurisation unit of 0.12 % S, a finalsulphur content of 8 ppm S in the raffinate can be achieved during normal operation.
Cross-media effectsEnergy consumption, waste generation, effluent water and air emissions.
Operational dataGasoil hydrotreating units need the additional measure of a high-pressure amine washer in thehydrogen recycle stream to avoid recombination of H2S from the recycle hydrogen stream withhydrocarbons from fresh feed. The unit will operate at 45 bar, utilizing 40 Nm³ Hydrogen/t ofgasoil feed and anticipating a run length of 30 months.
ApplicabilityApplicable to distillates from naphtha to heavy residues.
EconomicsThe estimated erected cost for a reduced-crude desulphurisation process (basis 132 m3/h unit)unit is EUR 47 millions. Another estimated investment summary for residue desulphurisationsystem hydrotreater to prepare residue fluid catalytic cracking feed is shown below.
Feed Rate, Mt/yr 3.8Run length, days 335Operating factor 0.92On-plot investment, million EUR 272Total off-plot cost(30 % of on-plot), million EUR 82Catalyst cost per charge, million EUR 10Basis: second quarter 1995 US Gulf Coast
Driving force for implementationReduce sulphur content of the feedstock. Deep desulphurisation is an important techniqueapplied for compliance with Auto-Oil Programme II. Costly two-stage hydrotreating unitsapplying a noble metal catalyst in the second stage of hydrodesulphurisation are not needed tomeet Auto-Oil Programme II or German diesel specifications. But, depending on the finalspecification on cetane of diesel issued by the European parliament, two-stage units maybecome mandatory for refiners being short in cetane index in their diesel pool. Normally those
Chapter 4 Techniques to consider in the determination of BAT
260 Mineral Oil and Gas Refineries
refiners do not operate a hydrocracker unit. Two-stage units are also mandatory for refiners whoneed to lower the aromatics content and/or the CFPP in their gasoil pool.
Example plantsMany desulphurisation processes exist in refineries.
Reference literature[166, Meyers, 1997].
4.13.3 Catalytic distillation
DescriptionCatalytic distillation for desulphurisation of gasoline in a two stage process.
Achieved environmental benefitsReduction of 95 % of sulphur content in FCC-gasoline containing 1800 ppm of sulphur havebeen achieved. This type of technique consumes less energy than traditional desulphurisationprocesses.
Cross-media effectsEnergy consumption, waste generation, effluent water and air emissions.
ApplicabilityFully applicable. This technique may also be used for the reduction of benzene in the reformate.
EconomicsA two-stage process is designed to treat 7950 m3/d of FCC-gasoline containing 1800 ppm ofsulphur. Its efficiency has been of 95 % and its investment costs are approximately EUR 20millions.
Driving force for implementationSince the sulphur content of gasoline will be reduced to 50 ppm by law, techniques for thereduction of sulphur content will become more used.
Example plantsAt least one catalytic distillation plant for desulphurisation of 7950 m3/d of FCC-gasoline isavailable in Europe.
Reference literature[247, UBA Austria, 1998]
4.13.4 On-stream catalyst replacement technology for processing high-metal feeds
DescriptionWhile the main objective of this process is to extend catalyst life in a down-stream fixed-bedreactor by maintaining high hydrodemetallisation performance, the catalyst also achieves highhydrodesulphurisation/hydrodemetallisation and hydrodesulphurisation Conradson carbonremoval/hydrodemetallisation activity ratios.
Achieved environmental benefitsOn-stream catalyst replacement technology improves the residual desulphurisation in therefinery, thereby decreasing the waste generation.
Techniques to consider in the determination of BAT Chapter 4
Mineral Oil and Gas Refineries 261
Operational dataReactor typically operates at 390 ºC and 2000 psia.
ApplicabilityFully applicable.
Driving force for implementationExtend the catalyst life of the hydrotreatment processes.
Example plantsTill 1997, there were 15 on-stream worldwide.
Reference literature[166, Meyers, 1997]
4.13.5 Hydrogenation of light dienes
DescriptionThe hydrogenation of light dienes serves the purpose of producing a more stable refinery streamreducing upstream, gum formation. The process converts dienes to useful olefins. Moreinformation in Section 2.13.
Achieved environmental benefitsThe process helps reduce acid losses in downstream processes (e.g. alkylation). Typical productdiene levels from the selective hydrogenation process unit may range from 25 to 1 ppm.
Cross-media effectsLow energy consumption.
Operational dataLow temperature, liquid-phase operation means that no utilities are required in most cases if thefeed and hydrogen are both available at suitable conditions. Heating or cooling duties arelimited to cases with relatively high diene concentrations in the feed. Commercial operation fora period of more than two years without the need to regenerate or replace the catalyst is typical.
ApplicabilityThe design of the units is simple. Most of the units are designed for diene reduction to less than5 ppm in the product.
EconomicsThe design of the units is simple and requires low capital and nominal operating costs. The costof the catalyst is low compared with the installation cost. The capital investment, includingcatalyst, for the unit is small, usually within the range of EUR 0.6 - 1.2 million. The investmentbase on recent projects is of some EUR 3 millions for a plant of 100000 t/yr capacity.
Driving force for implementationReduce gum formation in downstream operations. The flexibility and minimal cost of thistechnology make the unit a valuable processing tool.
Reference literature[166, Meyers, 1997], [261, Canales, 2000]
Chapter 4 Techniques to consider in the determination of BAT
262 Mineral Oil and Gas Refineries
4.13.6 Hydrocracker
DescriptionHydrocracking is an exothermic process and heat integration techniques can be applied. Formore information on hydrocrackers see Section 2.13. Some techniques to consider are:a) The heat generated in the reactors can be partially recovered in a feed/product heat
exchanger. A furnace heats the feed to its required temperature. The reactor temperature iscontrolled via the injection of cold hydrogen between the catalyst beds.
b) A significant amount of heat is required in the fractionation section. Heat integration isapplied to minimise heat consumption.
c) The energy efficiency can further be increased by applying a four-stage separator system.The feed to the fractionation section is in that case rendered significantly hotter, andconsequently less heat is required in the fractionation section.
d) The use of heat recovery from high-temperature process streams in WHB and powerrecovery in the high-pressure units (letting down liquid)
Achieved environmental benefitsReduced hydrocracker energy consumption.
Cross-media effectsNo cross-media effects known.
Operational dataControl system need to be enhanced.
ApplicabilityIn some cases, the heat integration can be difficult to apply. Replacement of existinghydrocrackers by new and highly heat integrated hydrocrakers is in many cases not justifiedenvironmentally and economically.
EconomicsThe cost of a hydrocracker with heat integration varies from 36 - 84 EUR/(t/yr). Annualoperating cost varies between 0.6 and 1 % of the investment cost. In many cases the economicsof the process do not justify the replacement of an existing hydrocracker, because paybackperiod can be very long.
Driving force for implementationReduction of energy consumption.
Reference literature[166, Meyers, 1997], [212, Hydrocarbon processing, 1998], [112, Foster Wheeler Energy,1999], [268, TWG, 2001]
4.13.7 Residue hydroprocessing
DescriptionSee Section 2.13. Another technique that can be used is the use of heat recovery from high-temperature process streams in WHB and power recovery in the high-pressure units (lettingdown liquid) to increase the heat integration.
Achieved environmental benefitsUpgrading of fuel oil in lighter products, and reduction of sulphur, nitrogen and metal contentsin the fuel oil and other products.
Techniques to consider in the determination of BAT Chapter 4
Mineral Oil and Gas Refineries 263
Cross-media effectsCross-media effects are increased energy consumption and a consequent increase in CO2emissions, due mainly to the hydrogen. As discussed in Section 3.14, the production ofhydrogen is very energy-intensive, generating large quantities of CO2. As discussed in Section4.13, hydrotreatment processes generate catalyst for disposal and increase H2S production withdirect consequences (enlargement or new) for the sour water stripper and sulphur recovery units.Other cross-media effects are the increase of waste generation (catalysts) and effluent wastewater (containing H2S).
Operational dataHydroconversion is an exothermic reaction, the heat generated in the reactor system beingpartially recovered in the feed product exchanger. Normally a high level of heat integration andheat recovery is applied in the fractionation section. The amount of hydrogen required dependson feed (heavier feeds tend to increase hydrogen consumption) and process objectives (lowersulphur, nitrogen, aromatics content in the products, higher hydrogen consumption). In mostcases extra energy is required.
ApplicabilityCommercial experiences range from low-sulphur atmospheric residues to high-metal, high-sulphur vacuum residues with over 300 ppm metals.
EconomicsInvestment costs for the various options depend strongly on the feed properties and processobjectives of the residue hydroprocessing unit. Investment costs for a typical new single string5000 t/day unit will range from 200 - 300 million US$, the higher figure including an integratedhydrocracker.
Driving force for implementationResidue hydroprocessing is used for the upgrading of fuel oil into lighter products.
Example plant(s)Many different concepts of residue hydroconversion processes are licensed. The selection of thetype of process depends on feedstock quality (metal content and Concarbon number) and therequired conversion and product quality.
Reference literature[115, CONCAWE, 1999], [212, Hydrocarbon processing, 1998]
Chapter 4 Techniques to consider in the determination of BAT
264 Mineral Oil and Gas Refineries
4.14 Hydrogen production
As mentioned in Section 2.14, the production of hydrogen it is not exclusive to the refinerysector. Therefore this chapter should also be seen as applicable to other industrial sectors wherehydrogen production is necessary (e.g. ammonia production, chemical industry etc).
4.14.1 Gas Heated Steam Reformer Technology
Description• Gas Heated Steam reforming replaces the reformer furnace: the reforming heatload is
provided by cooling the exit gas from a secondary reformer which uses oxygen. The feedconsists of natural gas or light naphtha.
• The steam reformer has to supply a large amount of heat at high temperature for the steamreforming reaction by burning fuel, with the result that a large amount of heat is lost in theflue gas. In order to minimise the amount of heat lost in the stack, a large heat recoverysystem is used. A large proportion of the recovered heat is by raising and superheatingsteam. Some heat integration is possible around the solvent absorber and the methanator.
Achieved environmental benefits• Gas heated steam reforming reduces the energy consumption of the reforming process.• Recovery of heat from flue gas can be used elsewhere in the refinery, reducing consumption
elsewhere.
Cross-media effectsThe environmental regulations with the most impact on plant design are typically NOxlimitations. Other impacts, such as SOx or water emissions, are minimal, because low-sulphurfuel is typically used and there are few emissions other than flue gas. The choice of heatrecovery system can have a major effect on NOx production, since both the amount of fuel firedand the flame temperature will be affected. Preheating combustion air will reduce firing, butsince NOx formation is strongly influenced by flame temperature, there will be an overallincrease in NOx formation. Other methods of reducing firing, such as pre-reforming or heatexchange reforming, do not affect the flame temperature and will therefore reduce NOxproduction. The production of CO2 is also important. Each tonne of H2 produced also producesa minimum of 12 tonnes of CO2 (7.5 tonnes if related to the steam generation).
Operational dataThe combination of high temperature and pressure imposes severe demands on the steamreformer tubes, which must have thick walls to withstand the stresses and must be fabricatedfrom expensive alloys. The furnace box must be large to obtain the high rates of heat transferfrom the fluegas to the tubes. These combined factors make the steam reformer the largest andmost expensive single item of equipment in a hydrogen plant. The large size of the unit meansthat it takes a long time to heat up and cool down, and this makes it the most time-consumingpart of the start-up and shutdown procedure. The large thermal inertia makes it liable to damageduring plant upsets.
ApplicabilityFully applicable.
EconomicsRelative hydrogen production costs of the two processes are primarily a function of feedstockcost. A new hydrogen plant for a 7950 m3/day FCCU feed hydrotreater or hydrocraker wouldtypically cost in range of EUR 60 - 75 millions (1997).
Driving force for implementationProduction process. Hydrogen is needed for the hydrotreatments in the refinery.
Techniques to consider in the determination of BAT Chapter 4
Mineral Oil and Gas Refineries 265
Example plantsA new alternative, already proved commercially for ammonia and methanol production, is theGas Heated Steam Reformer Technology.
Reference literature[112, Foster Wheeler Energy, 1999]
4.14.2 Coke and heavy oils gasification
DescriptionThe IGCC plant can also function as a hydrogen supplier, in which case hydrogen is removedfrom the syngas (after the sulphur removal). For more information see Section 2.14, 2.10 and4.10.3.5.
Achieved environmental benefitsCoke gasificationA fixed-bed desulphurisation system using regenerable zinc ferrite as the sorbent has beentested as a continuation of the gasification exhaust gases treatment. Sulphur levels of 10 - 20ppm in the treated gas were achieved in this system. The product gas also contains traces ofammonia (less than 5 %) and hydrogen cyanide (HCN), derivatives of the nitrogen in the feed.Using limestone in the gasifier tends to reduce the level of these components. Ammonia is notremoved by zinc ferrite in the external desulphurisation process. If there is any alkali in the feed,some of it may vaporise in the gasifier and may have to be removed by an alkali sorbent or bycooling the gas going to the filter. The particulates in product gas are removed in the barrierfilter to a level of less than 5 ppm.Heavy oil gasificationAnother environmental benefit of gasification is that it reduces heavy oils that, used in anotherway may pollute the environment much more. See also 4.10.3.5.
Cross-media effectsPartial oxidation requires an oxygen plant (95 - 99 % purity), which increases costs.
Operational dataNormally, an IGCC plant includes a water purification section with the following units:• soot recovery either by washing with naphtha and recycle of naphtha/soot mixture to
gasification section and/or by filtration.• water pretreatment to remove solids (carbon, metals, salts) by filtration before final
treatment in biological plant (GTW)
The grey water treatment (GWT) is designed to treat water blowdown from a carbon extractionunit with syngas condensate and possibly the amine regeneration overhead system; water fromgrey water treatment is finally sent to biological treatment. The GWT may employ physical andchemical treatment for cyanides destruction and removal of heavy metals followed by a sourwater stripper, which removes sulphides, ammonia, and carbon dioxide from the water.
The gaseous streams are totally washed to remove any contaminant and the process normallyincludes the following ancillary units for gas purification:• washing with water and sometimes oil to remove soot and particulate• reactor for COS or cyanides by hydrolysis• sour gas absorbing with amine or equivalent system and production of elemental sulphur
from H2S in Claus unit.
ApplicabilityRelative hydrogen production costs are primarily a function of feedstock cost. The mainproblem with investment in gasification plant is its capital and operating cost. To be attractivecommercially it usually needs to be undertaken on a large scale. Typical requirement for
Chapter 4 Techniques to consider in the determination of BAT
266 Mineral Oil and Gas Refineries
chemicals production are the generation of more than 200 MWe of electrical power throughIGCC or the use of hydrogen, carbon monoxide and steam on a large scale.
EconomicsGenerally accepted investment costs for an oil gasification based combined cycle plant in the200+ MWe range are 1300 - 1700EUR per kW installed, with a thermal efficiency of around40 % and close to 99 % sulphur emission abatement. As average electrical demand in a refineryis usually less than 80 MWe, the investment in IGCC often depends on the opportunity to exportthe surplus of electrical power generated. However high pressure steam can also be a valuablegasification product and there are examples of much smaller gasification units that fit in wellwith a refinery.
Relative hydrogen production costs of the process are primarily a function of feedstock cost.Steam reforming of methane usually produces hydrogen at lower costs than partial oxidation offuel oil, if the cost of methane is less than about 65 % of fuel oil cost on an energy basis.
Driving force for implementationProduction of hydrogen, reduction of the production of heavy oils, power export and productionof synthesis gas as feed for petrochemistry.
Example plantsAt least five gasification processes are currently running in European refineries.
Reference literature[166, Meyers, 1997], [297, Italy, 2000]
4.14.3 Purification of hydrogen
DescriptionInformation about the processes can be found in Section 2.14. Some techniques that may beapplied to the hydrogen purification units to achieve better environmental performance are:• several adsorber beds are used, and the gas flow is periodically switched from one vessel to
another to allow regeneration of the adsorbent by pressure reduction and purging, thusreleasing the adsorbed components. The desorbed gas is normally accumulated in a vesseland used as fuel at a convenient location
• one technique to reduce air emissions is to use PSA systems only for purification ofhydrogen
• use the PSA purge gas as refinery fuel gas in the reforming furnace instead of higher C/Hratio fuels.
Achieved environmental benefitsRe-use of waste fuel gas as fuel within the process.
Cross-media effectsBecause of loss of hydrogen to the PSA tail gas, the reformer and front end of a PSA plant arelarger than in a wet scrubbing plant. However, a PSA plant uses less process steam and does notrequire heat for the reboiler. PSA is a high energy consumer due to the high vacuum/pressuresystems that it uses.
Operational dataThe PSA system is completely automatic and offers a higher purity product. The PSA unit issimpler to operate than a wet scrubbing system, since it has no rotating equipment or circulatingsolutions. The conventional process produces a hydrogen product of maximum 97 - 98 % v/vpurity, while the pressure swing adsorption process produces a very pure hydrogen productbetween 99.9 % v/v and 99.999 % v/v. The residual constituents of the product gas are mainlymethane and less than 10 ppm CO. Some data on the utility consumption of the PSA system are:
Techniques to consider in the determination of BAT Chapter 4
Mineral Oil and Gas Refineries 267
3700 Nm3/h with a H2 content of at least 85 % and a pressure between 37 and 47 bar. Product-stream: 2400 Nm3/h purified H2 with a concentration of at least 99.5 %, Temperature: 45°C,Pressure: 35 bar; waste gas: 1300 Nm3/h, P: 3 bar, T: 30°C, contains 60 % H2, 1.4 %H2S and40 % C1 - C6 compounds with higher boiling points.
Driving force for implementationProduction process to purify the hydrogen. The choice between the PSA system and thescrubbing system depends on product purity required, reliability and process economics. Theextra investment for the PSA system for large plant capacities can normally be offset by thelower operating cost. Also a PSA system will yield a higher H2 purity.
Example plantsMany examples exist.
Reference literature[166, Meyers, 1997], [297, Italy, 2000], [211, Ecker, 1999]
Chapter 4 Techniques to consider in the determination of BAT
268 Mineral Oil and Gas Refineries
4.15 Integrated refinery management
This section structured in the same way as Chapter 2 and 3, contains those integrated refinerymanagement activities that are not included in other sections. The first techniques to considerare environmental management activities and other utility management techniques.
4.15.1 Environmental management tools
DescriptionAn environmental management system (EMS) can contain the following elements:• the implementation and adherence to international accepted system such as those from the
ISO 14000 series or to EMAS. Those systems ensure the continuous improvements,complaints handling training, performance reporting, process control and improvementplanning etc.
• proof can be enhance by e.g. internal and/or external auditing, certification.• EMS does not stand in isolation from the other systems (safety, maintenance, finance etc.)
but is to be integrated with the other systems where relevant and beneficial. Morespecifically the management systems for Energy and Environment can be combined, whichis in line with the fact that a reduction in energy consumption goes hand in hand withimprovement of environmental performance.
• the preparation and publication of an annual environmental performance report, to beexternally verified. Such a report will also enable the dissemination of improvements toothers, and will be a vehicle for information exchange (to neighbouring environments, toauthorities etc).
• The delivery to stakeholders on an annual basis of an environmental performanceimprovement plan. Continuous improvement is assured by such a plan.
• It is common practice in the quest for continuous improvement to compare ownperformance with that of others in the field, and to identify the current “best practices”.Taking these “best practices” from others to heart and applying them will lead toenvironmental performance improvements. Systems are available for comparing ownperformance with others for energy, for efficiency, for maintenance, in which performancesof refineries with different capacities and complexity are normalized. (e.g quivalentDistilling Capacity). This technique of performance measurement, comparisons with othersand identification of “best practices” and the adoption in one’s own workplace is also called“benchmarking”. This technique has scope for application in a number of areas ofenvironmental performance improvements as well.
• practise of such benchmarking on a continuous basis, including energy efficiency andenergy conservation activities, emissions to air (SO2, NOx, VOC, and particulates),discharges to water and generation of waste. Benchmarking for energy efficiency typicallyinvolve an internal system of energy efficiency improvements, or intra- and inter-companyenergy efficiency benchmarking exercises, aiming for continuous improvements andlearning lessons.
• perform an Environmental Impact Assessment (EIA) for major new activities.� mass balance data on sulphur input and output via emissions and products (including low-
grade and off-spec products and further use and fate), to be reported on an annual basis.
Achieved environmental benefitsThose systems typically ensure the continuous improvements, complaints handling training,performance reporting, process control and improvement planning.
ApplicabilityThose techniques can be typically applied to all refineries
Example plantsMany of those techniques are applied in many refineries
Techniques to consider in the determination of BAT Chapter 4
Mineral Oil and Gas Refineries 269
Reference literature[118, VROM, 1999], [285, Demuynck, 1999]
4.15.2 The bubble concept
DescriptionThe bubble concept usually refers to air emissions of SO2, but can also be applied to NOx, dust,CO and metals (Ni, V). The bubble concept is a regulatory tool applied in several EU countries.As represented in the picture below, the bubble approach for emissions to air reflects a “virtualsingle stack” for the whole refinery. The treatment of process water in the refinery is typicallydone in a single waste water treatment plant (for technical and economical reasons) andconceptually can be regarded as a similar approach to the “bubble concept”4 for air.
Figure 4.4: The bubble concept
Why is it applied to refineries?The bubble concept is used for refineries because it is recognised that they meet some or all oftheir energy needs with a variety of gaseous and liquid fuels that are by-products of the variousprocesses. In this respect, refineries differ from other industries that generally buy all theirspecified fuels from outside.
The technical justification of the bubble concept in refineries is the complexity of theinstallation. Aspects of this complexity include the number of emission points and the technicaland economic interrelationships in a modern refinery between feedstock, types of processes andthe variations in different operating conditions in relation to product slate and product qualityrequirements.
The economic justification is that the refinery should be allowed to use, at different plants and atdifferent times, the various fuels it produces in-house. At the same time, it enables the operatorto:
4 The requirements on a refinery to reduce its discharges to water can be also conceived as a bubble approach.
Water from various process units is collected into one water treatment system. The load in g/tonne crude oilprocessed in the refinery can be defined in terms of a “bubble”, aimed at the minimisation of water consumption,re-use of water in different processes and BAT at the waste water treatment unit in an integrated way and for allprocesses together with the objective to reach as low a load as is technically and economically feasible for thewhole refinery.
Chapter 4 Techniques to consider in the determination of BAT
270 Mineral Oil and Gas Refineries
� choose the most cost-effective place to reduce emissions� respond to opportunities in the crude oil market and the supply & demand situation for oil
products� operate effectively in a competitive environment.
The environmental justification is that the authority should be allowed to define emissionconditions in line with its environmental targets while allowing the refinery operator flexibilityin the operation of its processing units and in the selection of the various technical andeconomic options to fulfil the energy requirements of the refinery in competitive marketconditions. Moreover, it allows easy comparison of the emission performance of a refinery andbetween refineries.
Definition and applicabilityFor the application of the bubble concept, the associated emission levels need to be given in atransparent way. This includes:1. the pollutants involved2. the approach used to define the bubble (concentration bubble and load bubble). (See below)3. a comprehensive list of installations included in the bubble concept (see below)4. the corresponding flue gas volumes and their measurement conditions (e.g. under standard
conditions, dry)5. reference data (oxygen content and averaging time (daily, monthly, yearly, 3-yearly)) (see
below)
Follows explanations of the above points:
1. Self-explanatory (See Description in this Section)
2. Different approaches (point 2 above) can be used to define the bubble, i.e:� in a concentration units of the flue gas emitted by the refinery, whereby the complexity
of the refinery is reflected in the energy consumption of the refinery, or� in a annual load per tonne of crude oil processed which can be combined with the
complexity factor (Nelson index) of the refinery
The load bubble includes energy efficiency of a refinery and the concentration approachdoes not. This is the major advantage of the load bubble. There are simplified factors (SeeTable 3.2) for switching between the two approaches. It should be notised that such a factorcalculated on an average European energy consumption value could, however, bemisleading because energy efficiencies in European refineries vary greatly (SeeSection 3.10.1). The conversion between the two approaches in each specific refinery ismore accurate.
Other methods may be used. It is more a question of convenience and custom than ofprinciple how and in which units of measurement the bubble is defined, as long as it is clearwhich approach is used, which methodology is used to define the unit of measurement andwhich units are included.
3. There are different interpretations in various countries of the units to be considered (e.g.combustion only, including or excluding FCC and/or SRU and/or flares). As an example, aMember State has reported that for an existing EU+ refinery the bubble concentrationincreases by 20% when flares are included in the bubble. Another example was given byConcawe were the calculated average of the SO2 fuel bubble was 1000 whereas the averagewas 1600 if all installations are included within the bubble.
4. Self-explanatory
5. When the short averaging time is defined (e.g. daily, monthly), additional flexibility foroutages, changes of feedstock and other technical problems may be granted by allowing the
Techniques to consider in the determination of BAT Chapter 4
Mineral Oil and Gas Refineries 271
high values in the current period to be corrected by lower values in the next period, whenthe technical problems have been sorted out. The mass bubble limit (g/tonne crude oilprocessed) is typically defined over a long period (e.g. one year). In one EU+ refinery, aperiod of three years is applied. Also, it has been recognised by the TWG that the averagingtime may depend on the pollutant. (e.g. environmental and health effects of NOx and SOxare different). The averaging period is also related to the stringency of the bubble emissionlevel (the more stringent the levels, the longer the averaging period, to allow flexibility).
The above paragraphs imply that a large amount of data is needed to continuously calculatethe bubble value. For example, for SO2:� RFG sulphur contents need to be continually measured (e.g. by mass spectrometer) and
hourly values produced; SO2 is then calculated by recording hourly fuel flows tofurnaces and boilers.
� Fuel oil S content is measured daily.� FCCU figures are estimated based on a percentage of the S feed to the unit (the daily
flow of feed to the unit; the S content is measured after any change of crude slate). Thisneeds months of data collection to establish a relationship.
� SRUs, calciners etc all have different algorithms to estimate releases continously basedon data collection.
� Data are also needed to continuously estimate moisture and O2 content in the flue gasesto correct to the reference conditions.
The last paragraph indicates the scope for considerable variability in the way refinerscalculate the bubble and thus in the accuracy and reliability of the data when comparingbubble values. However when a good sample schedule is establish together with anapproved calculation method, the follow up of the emissions become very easy.
Environmental concernsAs in some situations refineries are physically or logistically connected to a nearby chemicalplant, there may be a temptation to extend the bubble to the “non-refinery” processes which thenmay create misuse of the bubble concept because of dilution effects. These dilution effects canoccur due to the high volumes of flue gases generated by some non-refinery processes thattypically contain low levels of SO2 and NOx. An example of such dilution was submitted by aMember State where a refinery bubble profits from a large chemical plant and the bubbleconcentration is reduced by 50% (included in the LVOC BREF). Dilution effects do not affectthe load approach.
A second concern may be that the concentration bubble is defined as a relative standard, directlyrelated to the fuel use in the refinery, and therefore not enhancing efficient use of energy in therefinery. This can be addressed by defining the bubble according to a load per tonne of crude oilprocessed or by defining an absolute ceiling (in tonnes/year), in addition to emission values inmg/Nm3 flue gas in the bubble. However, there is a possible trade-off between the stringency ofthe environmental requirements and the need for flexibility in the operation of a refinery.Special care should be taken not to introduce additional complexity into the regulatory system,thereby losing part of the attractiveness of the bubble concept. For example, in a MS a 3-yearaverage is chosen for the SO2 bubble (load) for the refinery. In the case of NOx, however, thedifferences in long-term environmental and health effects of SO2 and NOx need to be borne inmind.
Another possible environmental concern with this concept, is the possibility of high emissionsat the lower stacks (e.g. SRU). This can easily be redressed by requiring that the flue gases ofthe cleaner fuels be discharged at the lower stacks and the high stacks are used to avoid highconcentrations of pollutants at ground level, affecting workers and the neighbourhood. Ofcourse, the regulator should be aware that traditional measures used to ensure that ground levelconcentrations of hazardous pollutants are within Air Quality Standards are still required whenusing the bubble concept. This comment can be extended to all legislation, because the use of
Chapter 4 Techniques to consider in the determination of BAT
272 Mineral Oil and Gas Refineries
the bubble concept as a regulatory tool does not prevent other existing/new limit values forspecific units/facilities within the refinery for being applied.
Establishing associated emission values in the bubble conceptIf the bubble concept is to be used as an instrument to enforce the application of BAT in therefinery, then the emission values defined in the refinery bubble should be such that they indeedreflect BAT performance for the refinery as a whole. The most important notion is then to:� identify the total fuel use of the refinery;� assess the contribution of each of the fuels to the total fuel consumption of the refinery;� quantify the emissions from process units implicated in such emissions (e.g. FCC, SRU);� review the applicability of BAT to each of these fuels and/or the process units� combine this information with the technical and economical constraints in using these
techniques.
This may imply different emission values associated with the use of BAT, depending on thetype of fuels used and their contribution to the total refinery fuel use, together with emissions ofprocess units such as the FCC and the SRU and their contribution to the total refinery emissions.
Associated emission values in the case of a gas-fired refinery will be inherently lower than theemissions in a situation where a major part of the fuel use of the refinery is provided by liquidfuels. In this latter case BAT may be defined by assessing the emissions associated with thegaseous fuels used in combination with the emissions associated with using liquid residual fuelsand flue gas treatment, or using clean liquid fuels, i.e. gas oil with limited S-content. If deemednecessary, these emission values for a bubble based on concentrations can easily be translatedinto a yearly or monthly load bubble, i.e. tonne of SO2 and/or NOx per million tonnes of crudeoil processed.
In Annex V, several examples show how, emission values for the bubble concept can be definedwhich reflect the SO2 and NOx performance that is technically feasible for the refinery as awhole. The assessment of BAT-associated emission values involves however also an economicand an environmental assessment of these values. The investment decision to convert anexisting refinery into a full conversion, gas-fired refinery involves much more technical,economic and environmental considerations than only the SO2 and NOx emissions from therefinery itself. Similarly, the decision to invest in flue gas desulphurisation and/or NOxabatement via SCR may also involve the concentration of liquid fuel firing of the refinery in oneor two larger combustion plants, which will have major implications on the way the refinerywill be able to respond to commercial pressures. The same holds true for the other technicaloptions that a refinery will be faced with. However, maximum flexibility will be high on theagenda in assessing the various technical considerations open to the refinery. By definingemission values in the bubble that respect this need for operational flexibility, the permittingauthority can support the proper environmental outcome of the investment decision process bythe refinery
The bubble concept is an environmental regulatory instrument that may be used to enforce theapplication of BAT in the refinery without becoming entangled in the complex technical-economic interrelationships in the refinery. As mentioned before, there is a link to the BATconcept provided that the bubble is set at a level that reflects BAT performance of the refineryas a whole.
ExamplesTWG has provided some reference numbers when bubble concept is applied to refineries. Datahas been divided in two groups. One group represents actual performance of refineries and thesecond one represents proposals provided by different TWG member(s).
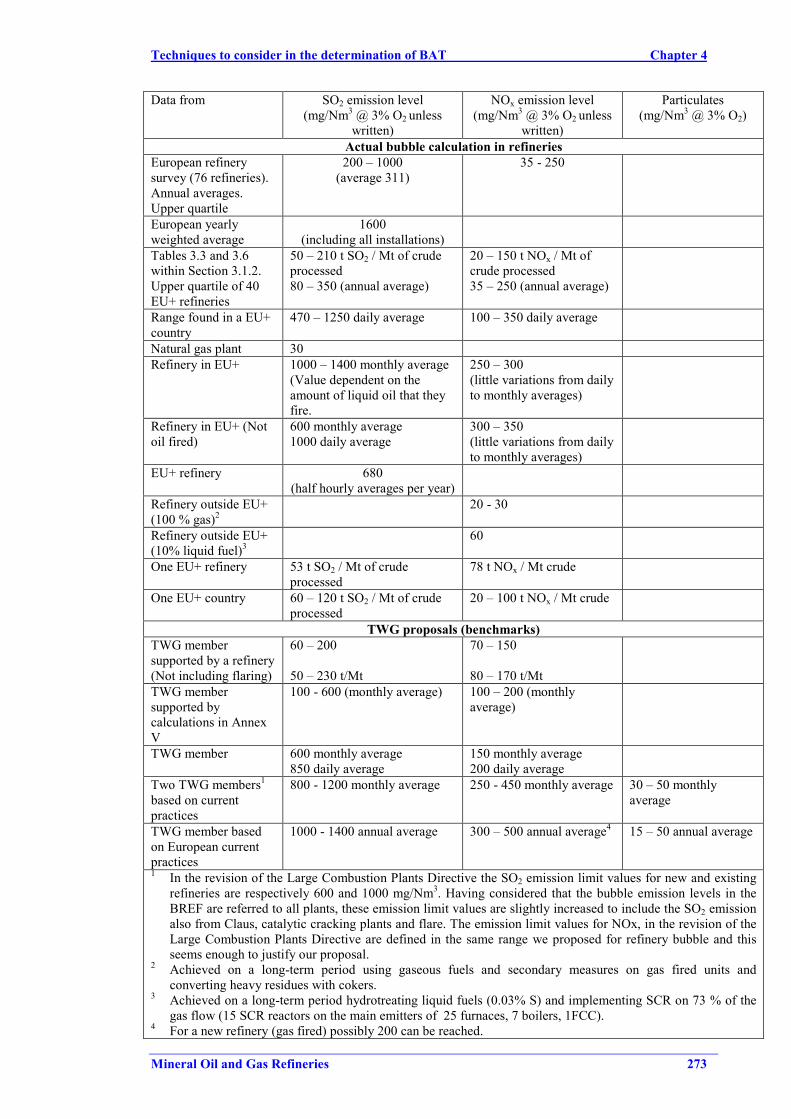
Techniques to consider in the determination of BAT Chapter 4
Mineral Oil and Gas Refineries 273
Data from SO2 emission level(mg/Nm3 @ 3% O2 unless
written)
NOx emission level(mg/Nm3 @ 3% O2 unless
written)
Particulates(mg/Nm3 @ 3% O2)
Actual bubble calculation in refineriesEuropean refinerysurvey (76 refineries).Annual averages.Upper quartile
200 – 1000(average 311)
35 - 250
European yearlyweighted average
1600(including all installations)
Tables 3.3 and 3.6within Section 3.1.2.Upper quartile of 40EU+ refineries
50 – 210 t SO2 / Mt of crudeprocessed80 – 350 (annual average)
20 – 150 t NOx / Mt ofcrude processed35 – 250 (annual average)
Range found in a EU+country
470 – 1250 daily average 100 – 350 daily average
Natural gas plant 30Refinery in EU+ 1000 – 1400 monthly average
(Value dependent on theamount of liquid oil that theyfire.
250 – 300(little variations from dailyto monthly averages)
Refinery in EU+ (Notoil fired)
600 monthly average1000 daily average
300 – 350(little variations from dailyto monthly averages)
EU+ refinery 680(half hourly averages per year)
Refinery outside EU+(100 % gas)2
20 - 30
Refinery outside EU+(10% liquid fuel)3
60
One EU+ refinery 53 t SO2 / Mt of crudeprocessed
78 t NOx / Mt crude
One EU+ country 60 – 120 t SO2 / Mt of crudeprocessed
20 – 100 t NOx / Mt crude
TWG proposals (benchmarks)TWG membersupported by a refinery(Not including flaring)
60 – 200
50 – 230 t/Mt
70 – 150
80 – 170 t/MtTWG membersupported bycalculations in AnnexV
100 - 600 (monthly average) 100 – 200 (monthlyaverage)
TWG member 600 monthly average850 daily average
150 monthly average200 daily average
Two TWG members1
based on currentpractices
800 - 1200 monthly average 250 - 450 monthly average 30 – 50 monthlyaverage
TWG member basedon European currentpractices
1000 - 1400 annual average 300 – 500 annual average4 15 – 50 annual average
1 In the revision of the Large Combustion Plants Directive the SO2 emission limit values for new and existingrefineries are respectively 600 and 1000 mg/Nm3. Having considered that the bubble emission levels in theBREF are referred to all plants, these emission limit values are slightly increased to include the SO2 emissionalso from Claus, catalytic cracking plants and flare. The emission limit values for NOx, in the revision of theLarge Combustion Plants Directive are defined in the same range we proposed for refinery bubble and thisseems enough to justify our proposal.
2 Achieved on a long-term period using gaseous fuels and secondary measures on gas fired units andconverting heavy residues with cokers.
3 Achieved on a long-term period hydrotreating liquid fuels (0.03% S) and implementing SCR on 73 % of thegas flow (15 SCR reactors on the main emitters of 25 furnaces, 7 boilers, 1FCC).
4 For a new refinery (gas fired) possibly 200 can be reached.
Chapter 4 Techniques to consider in the determination of BAT
274 Mineral Oil and Gas Refineries
Data on legislation applying bubble concept in some countries are provided in Annex I.
Reference literatureAustria, Belgium, Concawe, France, Greece, Italy, Netherlands, Norway, Spain, Sweden, UK,[248, Ademe, 2001]
4.15.3 Good housekeeping
DescriptionThis section includes good practices applied to maintenance, cleaning and other horizontalissues within refineries. What was considered “good housekeeping” in the past may nowadaysseem self-evident, as it is embedded in day-to-day refinery practice. New measures, based onexperience gained, are however included over time. “Good housekeeping” is often used in thebroader context of good management and conduct of the business. Quite a number of businessperformance parameters, such as safety, maintenance, efficiency (of energy and manpower),product quality, information, unit/equipment reliability, human resources and finance requireapproaches that start with a concept of “good housekeeping”. For refineries, safety providesnumerous examples of this approach, often grouped under the heading Safety Management.Similarly, Product Quality Management stands for a well-developed approach to assurecustomer satisfaction and Maintenance Management for improved unit reliability/on-streamtime and maintenance effectiveness. There are also systems for the other business parameters.All these systems are in place to assure that the correct practices are adopted, and that the“lessons learned” are reflected in these systems (e.g. ISO 9000 series).
The more traditional aspects of good housekeeping are included in this section. These systemscan also be regarded as the tools to ensure that the right procedures are adhered to in order tosafeguard the proper functioning of the refinery hardware. The following techniques areconsidered to be good environmental practices within the industrial sectors.
• Planning and carrying-out of maintenance by:� all plant and equipment should be subject to regular preventive maintenance
programmes, in line with operational requirements, to ensure continued optimumperformance.
� prompt clean-up of minor spillages with adsorbents.
• Regular cleaning of equipment and refinery premises. Cleaning, by its nature, generateswaste. By choosing the right procedure and technique this waste may be minimised or itsnature altered so as to make it more easily disposable:� drain equipment to the maximum� recycle "spent" rinse water� use high pressure water cleaning rather than detergents or chemicals� use on-site pretreatment whenever possible, e.g. wash/steam filter material (e.g. filter
clays) prior to dumping� minimise tank sludge prior to cleaning (solvent & mixers)� during cleaning, vents and vessel steaming to be directed to flare. This technique may
raise serious safety issues if oxygen is present. In addition when Hg is present –particularly when steaming overhead coolers- mercury emissions may occur.
� in many refineries, using high-pressure water to clean heat exchanger bundlesgenerates and releases water and entrained solids to the refinery waste water treatmentsystem. Exchanger solids may then attract oil as they move through the sewer systemand may produce finer solids and stabilized emulsions that are more difficult toremove. Solids can be removed at the heat exchanger cleaning pad by installingconcrete overflow weirs around the surface drains or by covering drains with a screen.Other ways to reduce solids generation are by using anti-foulants on the heatexchanger bundles to prevent scaling and by cleaning with reusable cleaningchemicals that also allow for the easy removal of oil
Techniques to consider in the determination of BAT Chapter 4
Mineral Oil and Gas Refineries 275
� cleaning at designated places in order to have control over run-off material andcontaminted water
� prompt clean-up of minor spillages with adsorbents.� install weirs at cleaning places, in order to hold back solids, which otherwise might
attract oil in CPI separators� minimise and re-use cleaning chemicals.
• Use techniques in common industrial equipment (pumps, compressors, etc.) that can reducethe environmental impact as for example:� implementation of operational improvements in new designs� equipment reliability improvement� use lubrication technique based on the lubrication by an oil mist. The technique
consists of a vortex generator, which generates, with the help of dry pressurised air, amixture of air and lubricant oil, This mixture is called oil mist, and lubricates thedynamic equipment. Once lubricated the air is recirculated to the vortex.
Some techniques that may be considered as good housekeeping techniques are already includedin other sections. Those include for example:• application of advanced process control (see Section 4.15.5) that can include the on-line
continuous (equipment and process) performance measurement, the measurement ofperformance and comparison with targets
• prevention of soil contamination (see Section 4.25.1)• leak detection and repair (LDAR) (see Section 4.23.6)• minimisation and prevention of spillage of hydrocarbons (see Section 4.23.6)• minimisation of waste generation (included in each of the process sections).
Achieved environmental benefitsThe lubricant technique can reduce the use and subsequent waste of lubricant oil up to 75% andreduce the electrical consumption within the electrical motors.
Operational dataThese systems are dynamic; they are kept alive by the incorporation of continuous improvementopportunities.
ApplicabilityThe lubricant technique can be applied to lubrication of dynamic equipment with lubricatedbearings, e.g. centrifuge pumps, electrical engines, gears assemblies, intermediate supports.
EconomicsLess than two years pay-off is claimed by the technology provider in the lubricant technique.
Example plantsThe lubricant technique has been already used by the main petrochemical companies
Reference literature[118, VROM, 1999], [285, Demuynck, 1999], [19, Irish EPA, 1993], [316, TWG, 2000], [324,Sicelub, 2001]
4.15.4 Training
Staff training plays an important role in the prevention of contamination within the refinery.Some important aspects are:
Chapter 4 Techniques to consider in the determination of BAT
276 Mineral Oil and Gas Refineries
• include environmental concern and environmental issues in the training of the refinery staff• train staff to reduce solids in sewers. A facility training programme which emphasizes the
importance of keeping solids out of the sewerage systems will help reduce that portion ofwaste water treatment plant sludge arising from the everyday activities of refinery staff
• train staff to prevent soil contamination. Contaminated soil can be reduced by educatingstaff on how to avoid leaks and spills.
Reference literature[118, VROM, 1999], [256, Lameranta, 2000]
4.15.5 Production planning and control
DescriptionSome techniques to consider in this respect are:• pollution control equipment should, in general, be kept running during start-up and
shutdown, for as long as is necessary to ensure compliance of authorisations, provided noother safety or operating considerations prevent it
• reduce the start-ups and shutdowns to a minimum. Proper production planning can reducethe frequency and duration of process shutdown
• implemention of advanced process control for the planning and control of production• advanced process control to optimise energy use within the refinery (related to 4.10.1.2).
Reference literature[118, VROM, 1999]
4.15.6 Safety management
Safety is an important cross effect of environmental measures. Any direct relation of influenceexists. Measures may affect safety in a:� positive way. Closed loop sampling minimizes accidental releases of material� no way. The process water recycle to desalters has no relevant impact on safety� negative way. Gas recovery systems often have to deal with explosive atmospheres, where
the untreated offgases are outside the explosibility limits. Negative impacts on plant safetycan reach such an extend, that the additional dangers exceed what a plant is willing tohandle. Even by others reasons promising techniques may lose applicability by that criterion– at least, until significant improvements of the safety properties of such techniques aredeveloped.
Some techniques to consider are the following:• prepare a safety report and practise risk management• use of results obtained from risk analyses
� identified risks are assessed with reference to the acceptance criteria for risk in theactivities in order to identify the dimension of accidental events
� dimensioning accidental events form the basis for a systematic selection of thetechnical, operational and/or organizational risk-reducing measures to be implemented.Risk-reducing measures consist of probability-reducing and consequence-reducingmeasures, including contingency measures
� the effect of the risk reducing measures to be implemented is documented, assessedboth individually and in a wider perspective
� implementation of the risk reducing measures and of the basic assumptions made in therisk analysis is systematically followed up in order to ensure that safety in the activitiesis maintained within the defined acceptance criteria for risk
� results from of risk analyses are communicated to the employees and shall be usedactively in preventive safety efforts.
Techniques to consider in the determination of BAT Chapter 4
Mineral Oil and Gas Refineries 277
Reference literature[118, VROM, 1999], [285, Demuynck, 1999], [302, UBA Germany, 2000], [260, Sandgrind,2000]
4.15.7 Water management
4.15.7.1 Water stream integration
Studies for the optimisation of water, effluent and drainage are often relevant. Similar to theidentification of energy saving opportunities, water pinch studies can be carried out to identifyprocess water integration options and water reduction and re-use opportunities. In mostrefineries some internal water streams are already used as desalter wash water, such ascondensate water and steam-stripped sour water. There is scope for increased water reductionand re-use in refineries, which will lead to reduced size and costs of both water make up andend-of-pipe treatment facilities.
Purpose and principleThe purpose of water stream integration (WSI) is the reduction of process water produced forfinal treatment prior to discharge in order to save operation costs. It saves high quality potableand demineralised water, which can be expensive at some locations; it reduces the size,investment costs and running costs of water supply and effluent treatment facilities. Moreover,it reduces the size and the environmental impact of effluent discharges.
The principle of WSI is maximising prevention, reduction, recycling and re-use of processwater, rainwater, cooling water and sometimes contaminated ground water with the aim ofminimising the amount of process water for end-of-pipe treatment. WSI need to be carried outas part of a Water Masterplan for the refinery. This plan aims at optimisation of the use and re-use of all water streams in the refinery. For greenfield refineries and in existing refineries, whennew treatment installations are installed, a win-win situation is created when the amount ofimported water, the size of effluent treatment facilities and the discharge are all minimised.Ideally it may become feasible to use treated effluent as a source for make-up of process water,cooling water and/or boiler feed water. Every refinery has its specific optimum WSI scheme.
Reduction of fresh water use is a goal for most refineries for two main reasons. Firstly, freshwater, particularly high quality water, is a valuable resource which in many parts of Europe isbecoming increasingly scarce. Where water of lower quality is used, treatment to acceptablestandards also requires the use of energy and chemicals. Secondly, water used has to bedischarged. Minimising the volume of water discharged reduces the size of effluent treatmentplant required, the amount of energy and chemicals used, and the quantity of pollutantsdischarged to the environment. Data on actual fresh water usage is included in Section 3.15. Asa general guide, approximately 0.1 - 5 m3 of waste water (process waste water, cooling waterand sanitary waste water) per tonne of crude is generated when cooling water is recycled. Theprocess water generated in a refinery is of the magnitude of 0.1 to 0.2 m3 per tonne of crude oilinput. Some techniques to consider for the minimisation of fresh water consumption, can be thefollowing:
• by substitution of wet cooling processes by dry processes• recirculation of cooling water• use of treated process water as cooling water• use of condensates as process water• use of rainwater as process water• other measures are: Use of production techniques which allow recovery and re-use of
rawmaterials, process- and product aids (e.g. use of regenerable extraction agents,desulphurisation by hydrotreatment). Use of process- and product aids with low hazardouspotential and substitution of hazardous chemicals by less hazardous ones.
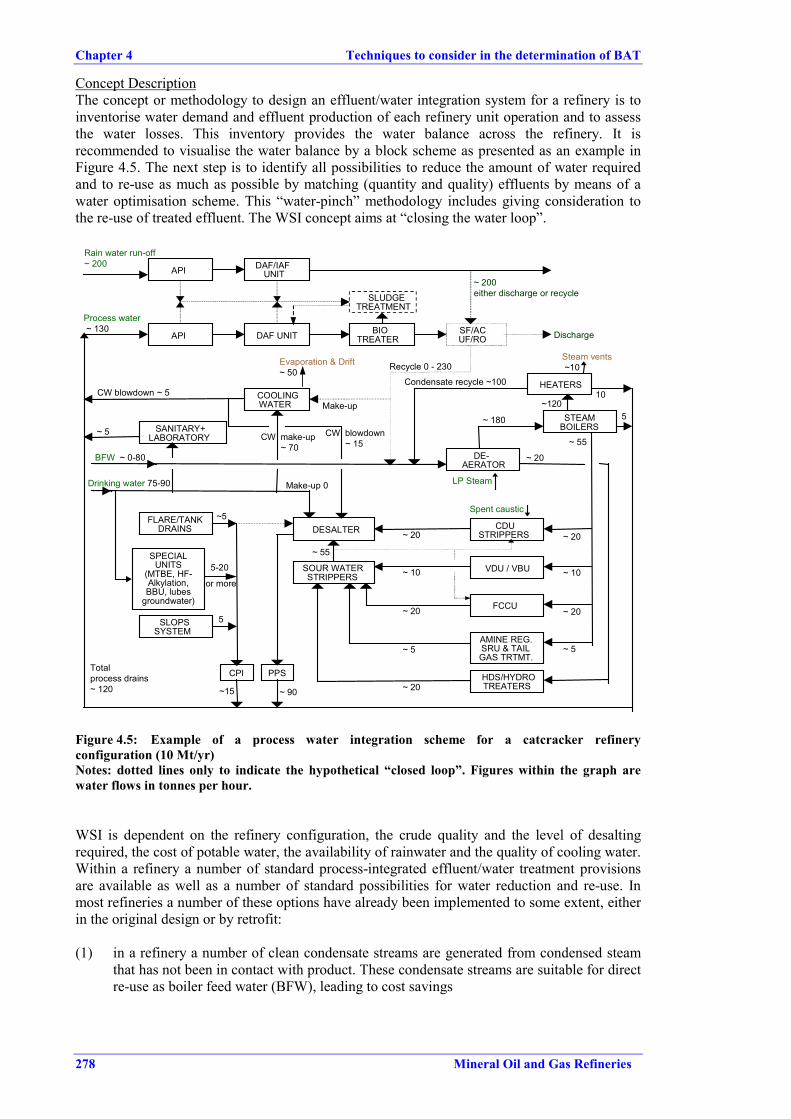
Chapter 4 Techniques to consider in the determination of BAT
278 Mineral Oil and Gas Refineries
Concept DescriptionThe concept or methodology to design an effluent/water integration system for a refinery is toinventorise water demand and effluent production of each refinery unit operation and to assessthe water losses. This inventory provides the water balance across the refinery. It isrecommended to visualise the water balance by a block scheme as presented as an example inFigure 4.5. The next step is to identify all possibilities to reduce the amount of water requiredand to re-use as much as possible by matching (quantity and quality) effluents by means of awater optimisation scheme. This “water-pinch” methodology includes giving consideration tothe re-use of treated effluent. The WSI concept aims at “closing the water loop”.
Rain water run-off~ 200
~ 200either discharge or recycle
Process water ~ 130
Discharge
Recycle 0 - 230 Steam vents ~10
Condensate recycle ~100 CW blowdown ~ 5 10
~120 5
~ 5 ~ 55
BFW ~ 0-80 ~ 20
CW make-up ~ 70
Drinking water 75-90
Spent caustic
~ 20
~ 55
~ 10
~ 20 5
~ 5
Totalprocess drains~ 120 ~15
DESALTER
SOUR WATERSTRIPPERS
CDUSTRIPPERS
VDU / VBU
FCCU
AMINE REG.SRU & TAILGAS TRTMT.
HDS/HYDROTREATERS
FLARE/TANKDRAINS
SPECIALUNITS
(MTBE, HF-Alkylation,BBU, lubes
groundwater)
DE-AERATOR
STEAMBOILERS
HEATERS
API DAF/IAFUNIT
BIOTREATER
SF/ACUF/ROAPI DAF UNIT
COOLINGWATER
SANITARY+LABORATORY
SLUDGETREATMENT
SLOPSSYSTEM
PPS CPI
CW blowdown ~ 15
Make-up
Evaporation & Drift~ 50
~ 180
LP Steam
~5
~ 20
5-20
or more~ 10
~ 20
~ 5
~ 20 ~ 90
Make-up 0
Figure 4.5: Example of a process water integration scheme for a catcracker refineryconfiguration (10 Mt/yr)Notes: dotted lines only to indicate the hypothetical “closed loop”. Figures within the graph arewater flows in tonnes per hour.
WSI is dependent on the refinery configuration, the crude quality and the level of desaltingrequired, the cost of potable water, the availability of rainwater and the quality of cooling water.Within a refinery a number of standard process-integrated effluent/water treatment provisionsare available as well as a number of standard possibilities for water reduction and re-use. Inmost refineries a number of these options have already been implemented to some extent, eitherin the original design or by retrofit:
(1) in a refinery a number of clean condensate streams are generated from condensed steamthat has not been in contact with product. These condensate streams are suitable for directre-use as boiler feed water (BFW), leading to cost savings
Techniques to consider in the determination of BAT Chapter 4
Mineral Oil and Gas Refineries 279
(2) the standard provisions for process water treatment are the sour water stripper (SWS, totreat the sour water produced in various process units) and the desalter, which is a majorwater consuming unit whereas the water quality requirement in the desalter does notconstrain the use of SWS effluents. Sour water is produced if wash water and/or steamcomes into contact with hydrocarbon products which contain H2S and NH3. In the SWSthe H2S and NH3 are largely eliminated. This renders a treated effluent into a suitablequality wash water for the desalter
(3) the re-use of stripped sour water as wash water for crude desalting is a first step in anyWSI. A crude desalter uses 5 - 10 % water on crude, dependent on the crude quality andthe level of desalting required
(4) process units that produce significant quantities of waste water are the Crude DistillationUnit (CDU) and the Fluid Catalytic Cracker (FCC). In the CDU overhead, 2 - 3 % wastewater on crude intake is produced as steam condensate. This water does not require SWStreatment but can be directly routed as wash water in the desalter. An FCC-unit, if presentin the refinery, also produces significant quantities of waste water in the range of 5 - 10 %on feed. This amount can be reduced to 2 - 4 % if cascading of wash water isaccomplished. Stripped sour water can in principle be used as wash water and, on theother hand, the FCC wash water can either be recycled to the SWS or used as desalterwash water. Depending on the quantities of effluent generated, optimisation of waterintegration is possible
(5) boiler blowdowns, cooling water blow downs and treated rainwater run-off are waterstreams that may be suitable for desalter wash water as well, dependent on the saltconcentration
(6) a site-specific Water Masterplan can be designed, applying the concept of WSI. It will bedependent on and will take account of the location and site-specific elements such asclimate/rainfall, river/sea, existing segregation, availability of two desalters/SWS,specific refinery units, fresh water costs, groundwater situation, etc
(7) use of phenolic spent caustic for stripped water neutralisation and subsequent desalterwash to allow phenols resorption into the crude
(8) if the stream generated in the boiler feed water production is not recycled to the desalter,biotreatment is required because of anti-foaming agents and corrosion inhibitors
(9) refinery waste water need to be properly segregated to ensure the most effective treatmentor re-use. A typical segregation scheme for a petroleum refinery would provide a “clean”water sewer, an oily water sewer, and a highly-contaminated water sewer
(10) water pinch or water optimisation studies(11) water coolers/condensors may be replaced by air coolers (closed cooling water systems)
(reference to cooling section)(12) air cooling, reduced cooling water blowdown, using hydrocracking and hydrotreating
processes that produce less waste water than older processes; and using improved drying,sweetening and finishing procedures to minimise the generation of spent caustics andacids, water washes and filter solids; recycling and re-using waste water elsewhere in therefinery
(13) treated waste water that can be re-used in make-up to process and pump cooling systems,washdown water and water from fire control systems
(14) use of vacuum liquid ring compression instead of steam ejectors to minimize waterconsumption; use waste water free vacuum technique (recirculation of water) if otherwiseharmful substances are transfered to the environment
Energy and process materials utilisationThe steam boilers and steam system require corrosion inhibitors and oxygen scavengers and thede-aerator uses LP steam. The DAF unit and the sludge work-up require poly-electrolytes. Thebiotreater requires nutrients (phosphor) if no sanitary waste water or cooling water blow down(which could contain phosphates as corrosion inhibitor) is co-treated. A comprehensive WSIwill result in minimisation of these expensive chemicals and in minimum pollution anddischarge levies.
Chapter 4 Techniques to consider in the determination of BAT
280 Mineral Oil and Gas Refineries
Environmental aspectsThe environmental implications of the conceptual approach of a process water integrationscheme are favourable. Enclosed systems and closed water loops limit the hydrocarbonemissions to air and discharges to surface water, and also lead to reduced generation of waste inthe form of sludges.
Quantification of the reductions of the water used (and products lost) vary from location tolocation but can be substantial (>50 %). A newly built refinery in Thailand generates only 40 t/hprocess water at a crude throughput of 8 Mt/yr due to such an approach. Values of 0.5 m3 pertonne of crude oil have been also achieved within Europe.
Reference literature[118, VROM, 1999], [113, Noyes, 1993], [268, TWG, 2001], [117, VDI, 2000]
4.15.7.2 Water and drainage system
Purpose and principleThe ideal for a water and drainage system is to create the flexibility to cope with changingcircumstances such as sudden rainfall, process upsets, process changes, additional plants,capacity extensions and new legislation. It would also provide a basis for integrated watermanagement, including spill prevention and potential re-use of water streams without or aftertreatment. The principle is based on a thorough qualitative and quantitative analysis of thevarious water and effluent streams, the assessment for re-use potential with maximum reliabilityand environmental protection. A flexible water and drainage design allows for water integrationand allows for short-term and long-term changes at optimised cost. Enclosed sewerage systemsfor transfer of contaminated water from tanks and processes to separation facilities is also atechnique to consider.
System descriptionA modern and optimised water and drainage system of an industrial site is a result of aconceptual design of many unit operations lined up in such a way that water management can beoptimised. The basis of the concept is segregation of the different water streams into oil-freewater streams, accidentally oil-contaminated (AOC) streams and continuously oil-contaminated(COC) streams. The latter need to be subdivided into low and high BOD streams with thepossibility for biotreatment, effluent polishing and re-use.
The application of a segregation concept takes a certain level of housekeeping and operationaldiscipline into account. The decision to choose a different route for a certain type of effluentwould be based on monitoring of water qualities, both internal streams and the collectivedischarge. The environmental performance and the effluent management of the refinery requiresa constant level of alertness and dedication, sufficient training and motivating instructions andan extensive monitoring (sampling and analysis) scheme. The first flush principle entails thecollection, separation and treatment of the first charge of rainwater from the potentiallycontaminated refinery surface. After the first flush the rest of the rainwater is collected, analysedand discharged without treatment, if acceptable.
Energy and process materials utilisationEnergy requirements are mainly for pumping the waste waters and are system and site-dependent.
ApplicationA number of elements of the current design philosophy for a new water and drainage system canbe considered for implementation in existing refineries, and more particularly in cases where theold effluent and drainage system has become obsolete.
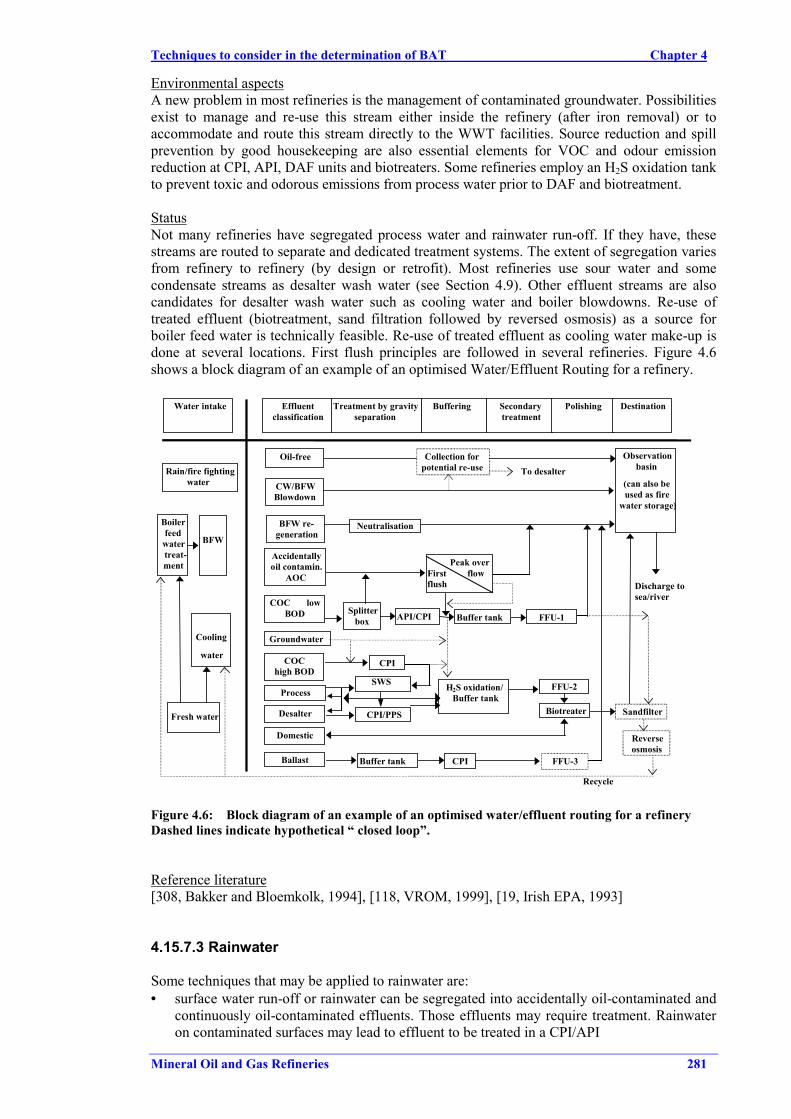
Techniques to consider in the determination of BAT Chapter 4
Mineral Oil and Gas Refineries 281
Environmental aspectsA new problem in most refineries is the management of contaminated groundwater. Possibilitiesexist to manage and re-use this stream either inside the refinery (after iron removal) or toaccommodate and route this stream directly to the WWT facilities. Source reduction and spillprevention by good housekeeping are also essential elements for VOC and odour emissionreduction at CPI, API, DAF units and biotreaters. Some refineries employ an H2S oxidation tankto prevent toxic and odorous emissions from process water prior to DAF and biotreatment.
StatusNot many refineries have segregated process water and rainwater run-off. If they have, thesestreams are routed to separate and dedicated treatment systems. The extent of segregation variesfrom refinery to refinery (by design or retrofit). Most refineries use sour water and somecondensate streams as desalter wash water (see Section 4.9). Other effluent streams are alsocandidates for desalter wash water such as cooling water and boiler blowdowns. Re-use oftreated effluent (biotreatment, sand filtration followed by reversed osmosis) as a source forboiler feed water is technically feasible. Re-use of treated effluent as cooling water make-up isdone at several locations. First flush principles are followed in several refineries. Figure 4.6shows a block diagram of an example of an optimised Water/Effluent Routing for a refinery.
Discharge tosea/river
Recycle
Boilerfeed
watertreat-ment
Water intake
Rain/fire fightingwater
Effluentclassification
Treatment by gravityseparation
Buffering Secondarytreatment
Polishing Destination
BFW
Cooling
water
Fresh water
Oil-free Observationbasin
(can also beused as fire
water storage)
CW/BFWBlowdown
BFW re-generation
Neutralisation
Accidentallyoil contamin.
AOC Peak over
First flowflush
COC lowBOD
COChigh BOD
Process
Desalter
Domestic
Ballast
Splitterbox API/CPI Buffer tank
CPI
SWS
CPI/PPS
H2S oxidation/Buffer tank
FFU-1
FFU-2
Biotreater
Buffer tank CPI FFU-3
Sandfilter
Groundwater
Reverseosmosis
Collection forpotential re-use To desalter
Figure 4.6: Block diagram of an example of an optimised water/effluent routing for a refineryDashed lines indicate hypothetical “ closed loop”.
Reference literature[308, Bakker and Bloemkolk, 1994], [118, VROM, 1999], [19, Irish EPA, 1993]
4.15.7.3 Rainwater
Some techniques that may be applied to rainwater are:• surface water run-off or rainwater can be segregated into accidentally oil-contaminated and
continuously oil-contaminated effluents. Those effluents may require treatment. Rainwateron contaminated surfaces may lead to effluent to be treated in a CPI/API
Chapter 4 Techniques to consider in the determination of BAT
282 Mineral Oil and Gas Refineries
• in specific situations rainwater may be a useful source of rawwater for the preparation ofprocess water make-up, boiler feed water and cooling water
• some refineries have segregated effluent and drainage systems. In modern refineries thewater and drainage system includes a segregation of process water, condensate blowdowns,rainwater and cooling water in order to minimise the environmental impact of effluentdischarges at minimum cost. Moreover, adequate process water integration and watermanagement measures will include a review of all options to recycle water streams with theaim of achieving a significant reduction of end-of-pipe treatment. Segregation of the processwater discharges, surface water run-off, cooling water and boiler feed water blowdowns andother effluents may be considered. Separation of storm water and other effluents of differentorigin in order to permit appropriate treatment options. In some cases, retroffiting cost canbe very high.
Reference literature[118, VROM, 1999], [113, Noyes, 1993]
4.15.7.4 Use of sanitary waste water
Sanitary waste water effluent is collected in a septic tank. As this stream is small compared tothe total waste water of a refinery, and contains sufficient nutrients (micronutrients andphosphorus) required for an industrial biotreater, this effluent can be usefully combined with theprocess water to a dissolved air flotation-unit preceding a biotreater.
4.15.7.5 Ballast water
Ballast water is typically discharged at a very high rate provoking generation of high volumewaste water peaks. That waste water contains high salt concentrations (seawater), and areheavily polluted with oil. It can easily lead to an upset of existing effluent treatment systems.Therefore the use of ballast water tanks is an important equalisation tool for feeding the water ina controlled way to either the process water system or the COC system, if the COD is lowerthan 100 ppm. Because of this, (and because jetties are often remote from the rest of therefinery) ballast water is often treated in a separate dedicated plant. As more and more crudetankers are equipped with double hulls, the ballast water problem is slowly phasing out.
4.15.7.6 Fire-fighting water
Some techniques to consider are:• The fire-fighting water system can sometimes be a water re-use sink within the refinery.• Provision should be made to collect fire fighting water in a lagoon. Serious pollution has
been caused by the release of firefighting water in an emergency. Design of ContainmentSystems for the Prevention of Water Pollution from Industrial Accidents can be found inConstruction Industry Research and Information Association Report 164 1996.
4.15.7.7 Blowdown systems
The blowdown liquid system is typically composed of mixtures of water and hydrocarbonscontaining sulphides, ammonia, and other contaminants, which are sent to the waste watertreatment plant.
Techniques to consider in the determination of BAT Chapter 4
Mineral Oil and Gas Refineries 283
4.15.8 Emissions integrated management
Some of the air emissions issues are by its nature refer to many processes or activities then theyshould be considered as a refinery as a whole issue. Under those issues, we can include sulphuremissions and VOC emissions. The application of a good environmental performance shouldtake the refinery as a whole as well as in the case of the sulphur the amount of sulphur containedin the products. A good environmental planning for reduction of those emissions shouldconsider those aspects. In order to clarify those aspects, the next table shows were in thisdocument, topics that may have integrated related issues are tackle.
Integrated environmental issue Section in Chapter 4 where it is analysedSulphur emissions from refineries 4.23.5VOC and fugitive emissions 4.23.6.1Protection of contamination of soil andgroundwater
4.25
Waste generation 4.25Energy 4.10Utilities related to energy (e.g. steam) 4.10Odour and noise 4.23.9 and 10
Reference literature[316, TWG, 2000]
Chapter 4 Techniques to consider in the determination of BAT
284 Mineral Oil and Gas Refineries
4.16 Isomerisation
4.16.1 Active chloride promoted catalyst isomerisation process
DescriptionMore information in Section 2.16.
Achieved environmental benefitsHigher process efficiencies compared with the zeolitic catalsyts and lower reaction temperatures(less energy consumed).
Cross-media effectsThe chloride promoted, chlorinated alumina catalyst (containing platinum) requires the additionof very small amounts of organic chlorides to maintain high catalyst activities. This is convertedto hydrogen chloride in the reactor. The chloride promoted catalyst cannot be regenerated.
Operational dataThe highly active chloride promoted catalyst, chlorinated alumina catalyst (containingplatinum), operates at a relatively low temperature (190 - 210 °C and 20 barg) and gives thehighest octane improvement. In such a reactor, the feed must be free of oxygen sources,including water to avoid deactivation and corrosion problems. The desorption process consumesutilities and energy.
ApplicabilityThis catalyst is very sensitive to sulphur, so deep desulphurisation of the feed to 0.5 ppm isrequired.
EconomicsInvestment estimated (basis ISBL, USA Gulf Coast 1998) 4150 - 10400 EUR per m3/d.Investment erected cost (basis: 2Q98 USA Gulf Coast) were evaluated for 1590 m3/d of freshfeed capacity EUR 8.8 millions (±50 %).
Driving force for implementationProduction process.
Reference literature[212, Hydrocarbon processing, 1998], [316, TWG, 2000]
4.16.2 Zeolitic isomerisation process
DescriptionMore information in Section 2.16. Some refiners need more octane from the light straight runnaphtha fraction than is possible from the O-T zeolitic isomerisation process. Adsorptiontechnology can then be used to remove the unconverted normal paraffins. The utilities needs forthat process are quite low.
Achieved environmental benefitsNo chloride compounds are used in this type of processes. The zeolite and sulphated zirconiacatalyst can be regenerated several times before sending the catalyst to a reclaimer to recoverthe platinum.
Cross-media effectsHigher temperature of the process, requiring more heating.
Techniques to consider in the determination of BAT Chapter 4
Mineral Oil and Gas Refineries 285
Operational dataThe zeolite catalyst operates at significantly higher temperatures (250 - 275°C and 28 barg) andis much more tolerant to contaminants, though the resulting octane improvement is lower.
ApplicabilityThe zeolite catalyst is mainly used for non hydrotreated feedstreams. Lower reactiontemperatures are preferred to higher temperatures because the equilibrium conversion to isomersis enhanced at the lower temperatures.
Refiners with idle hydroprocessing equipment, such as old catalytic reformers orhydrodesulphurisation units, can consider converting this equipment to the once-through zeoliticisomerisation process. With isomerisation, a 10 to 12 octane-number increase for the C5 - 71 ºClight naphtha can be achieved.
EconomicsEstimated cost of the reaction process is EUR 4654 per m3/d. For the absoprtion process, theinvestment is EUR 18900 - 25160 per m3/d. The catalyst and adsorbent cost is around EUR1700 per m3/d.
Driving force for implementationProduction process. Selection of a once-through or recycle scheme depends on factors such asquantity of light naphtha to be blended in the gasoline pool, the required octane number of thegasoline pool and the availability of other high octane gasoline blend components. If theisomerate product has an octane number exceeding 87, a recycle scheme is the only option.Selection of a fractionation-based scheme or an absorption based scheme is dependent on feedcomposition and to a certain extent on the product requirements. In general it can be said thatthe fractionation based scheme is lower in investment cost but significantly higher in operatingcost as a result of high energy requirements.
Reference literature[166, Meyers, 1997], [212, Hydrocarbon processing, 1998], [316, TWG, 2000]
4.16.3 Increase of the cyclic hexanes in the isomerisation feedstream
DescriptionAs the benzene content in the gasoline pool is being reduced by new specifications, the practicewill be to fully dehexanise the reformer feed, leaving in the cyclic hexanes to pass to theisomerisation unit (preventing their conversion to benzene in the reformer).
Achieved environmental benefitsReduced benzene content in the gasoline out of the reformer.
Reference literature[247, UBA Austria, 1998]
Chapter 4 Techniques to consider in the determination of BAT
286 Mineral Oil and Gas Refineries
4.17 Natural gas plants
As mentioned in the Scope section and in Section 2.17, the processes treated in this section arethose used in the refining of natural gas. As with mineral oil refineries, the processes used onproduction platforms are not included in this BREF.
4.17.1 Amine sweetening of natural gas
DescriptionThe reaction occouring in the process is given below and the process is illustrated in Figure 4.10of Section 4.23.5.1
2 R-NH2 +H2S -� (R-NH3)2S R = mono, di, or tri-ethanol
If the recovered H2S gas stream is not to be used as a feedstock for commercial applications, thegas is usually passed to a tail gas incinerator in which the H2S is oxidized to SO2 and is thenpassed to the atmosphere via a stack. More information can be found in Section 4.23.5.1.
Achieved environmental benefitsReduction of H2S concentration in natural gas.
Cross-media effectsSection 4.23.5.1.
Operational dataThe recovered hydrogen sulphide gas stream may be: (1) vented, (2) flared in waste gas flares ormodern smokeless flares, (3) incinerated, or (4) used for the production of elemental sulphur orsulphuric acid.
ApplicabilityFully applicable.
EconomicsSection 4.23.5.1.
Driving force for implementationComply with sulphur specifications of natural gas.
Example plantsAt present, the amine process (also known as the Girdler process) is the most widely usedmethod for H2S removal.
Reference literature[136, MRI, 1997], [144, HMIP UK, 1997]
4.17.2 Sulphur recovery unit
Extensive information can be found in Section 4.23.5.2.
Techniques to consider in the determination of BAT Chapter 4
Mineral Oil and Gas Refineries 287
4.17.3 Re-use of carbon dioxide
DescriptionAcid gas streams containing carbon dioxide free from sulphur and hydrocarbon compounds maybe vented directly to air, although this may require heating of the stream to air dispersion.However, carbon dioxide can be used for other purposes. If the CO2 stream has a significanthydrocarbon content, it can be used within combustion processes, e.g. mixed into site fuel gas orused in a utility designed to burn gas of low flame stability.
Reference literature[144, HMIP UK, 1997]
4.17.4 Techniques to reduce VOC emissions
During routine operation of natural gas terminals and other processes, the aim need to be toprevent releases to air of natural gas. Techniques to consider to reduce those emissions include:• minimise frequency of pig/sphere use by operating sea-lines at high velocity, ie use “mist
flow”conditions• minimise recovery of spheres by use of receivers holding several devices• vent receivers of high-pressure gas to a low-pressure part of the process for gas recovery by
recompression, before opening for access to pig/spheres• the occasional shutdown and venting of process plant is necessary, e.g. for maintenance,
upset and changeover purposes. This need to be minimised by appropriate plant selectionand design
• avoid the use of refrigerants for gas dew point control that are of significant environmentalconcern (CFCs)
• overheads and any gas vented from storage and glycol and methanol regeneration unitsshould be condensed and incinerated
• leak detection and repair programme. More information can be found in Section 4.23.6.1.• VOC emissions, including fugitives, can be maintained within a range of 200 to 250 kg/h
(300 - 350 kg/MNm3)
Reference literature[144, HMIP UK, 1997], [268, TWG, 2001]
4.17.5 Techniques to reduce NOx emissions
NOx emissions come from the combustion processes applied in the natural gas plant. Thetechniques that can be applied for control and abatement of NOx are the same as those applied torefinery fuel gas. See Section 4.10.4 and 4.23.3 for a detailed explanation.
4.17.6 Techniques to reduce water emissions
DescriptionPrevention techniques that may be applied to reduce the releases to water can be:• if possible, the quantity and contamination level of waste water to be treated on-shore need
to be minimised and controlled “at source”, i.e. wste water coming from off-shore activities• a three-phase separator can be used on the liquids from the slug cutcher to control and
minimise hydrocarbon content of the aqueous phase• sour water can be treated in a sour water stripper unit. See Section 4.24.2• process effluent from glycol or methanol regeneration plants and any other high BOD/COD
effluents should be kept separate from other streams, e.g. surface water, and treated beforedischarge to the site effluent system
• water management techniques. See Section 4.15.7.
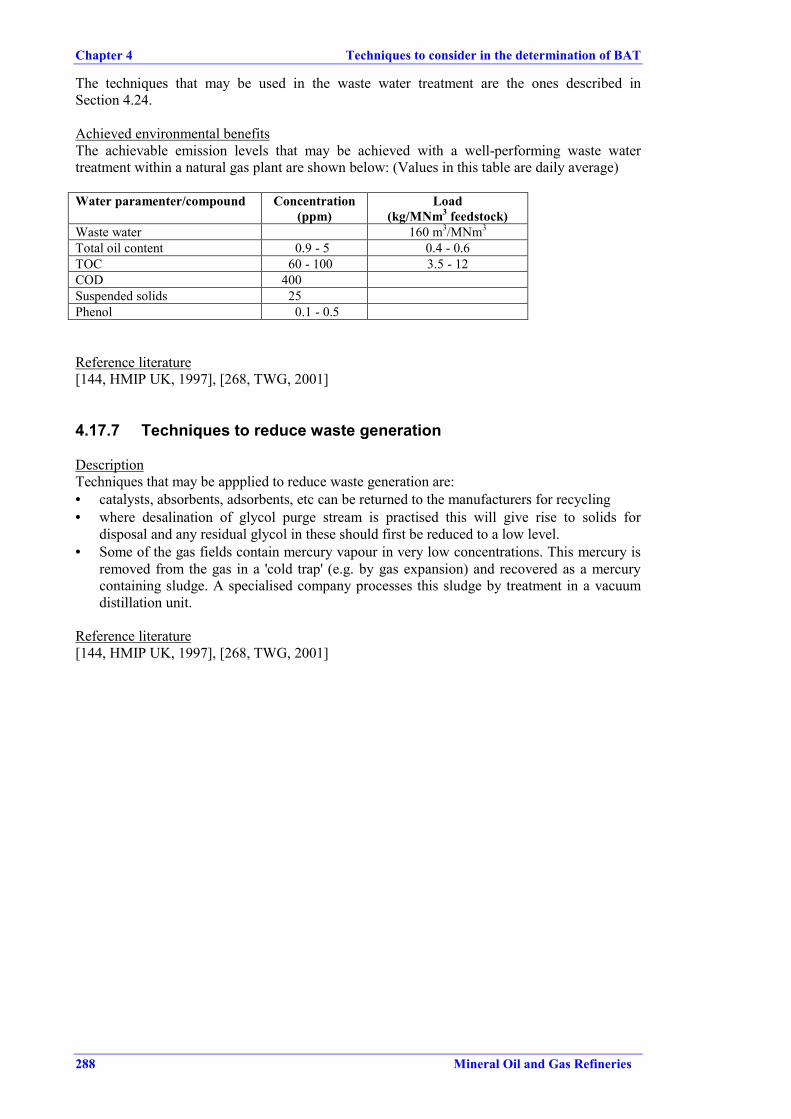
Chapter 4 Techniques to consider in the determination of BAT
288 Mineral Oil and Gas Refineries
The techniques that may be used in the waste water treatment are the ones described inSection 4.24.
Achieved environmental benefitsThe achievable emission levels that may be achieved with a well-performing waste watertreatment within a natural gas plant are shown below: (Values in this table are daily average)
Water paramenter/compound Concentration(ppm)
Load(kg/MNm3 feedstock)
Waste water 160 m3/MNm3
Total oil content 0.9 - 5 0.4 - 0.6TOC 60 - 100 3.5 - 12COD 400Suspended solids 25Phenol 0.1 - 0.5
Reference literature[144, HMIP UK, 1997], [268, TWG, 2001]
4.17.7 Techniques to reduce waste generation
DescriptionTechniques that may be appplied to reduce waste generation are:• catalysts, absorbents, adsorbents, etc can be returned to the manufacturers for recycling• where desalination of glycol purge stream is practised this will give rise to solids for
disposal and any residual glycol in these should first be reduced to a low level.• Some of the gas fields contain mercury vapour in very low concentrations. This mercury is
removed from the gas in a 'cold trap' (e.g. by gas expansion) and recovered as a mercurycontaining sludge. A specialised company processes this sludge by treatment in a vacuumdistillation unit.
Reference literature[144, HMIP UK, 1997], [268, TWG, 2001]
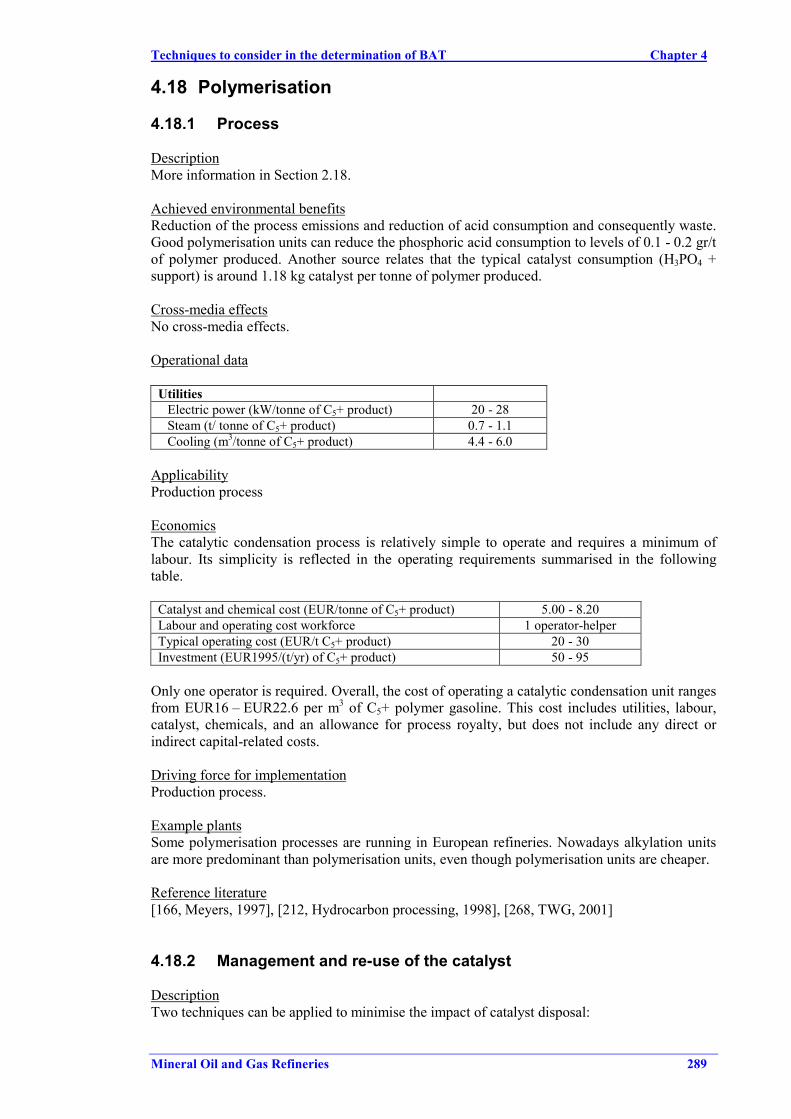
Techniques to consider in the determination of BAT Chapter 4
Mineral Oil and Gas Refineries 289
4.18 Polymerisation
4.18.1 Process
DescriptionMore information in Section 2.18.
Achieved environmental benefitsReduction of the process emissions and reduction of acid consumption and consequently waste.Good polymerisation units can reduce the phosphoric acid consumption to levels of 0.1 - 0.2 gr/tof polymer produced. Another source relates that the typical catalyst consumption (H3PO4 +support) is around 1.18 kg catalyst per tonne of polymer produced.
Cross-media effectsNo cross-media effects.
Operational data
UtilitiesElectric power (kW/tonne of C5+ product) 20 - 28Steam (t/ tonne of C5+ product) 0.7 - 1.1Cooling (m3/tonne of C5+ product) 4.4 - 6.0
ApplicabilityProduction process
EconomicsThe catalytic condensation process is relatively simple to operate and requires a minimum oflabour. Its simplicity is reflected in the operating requirements summarised in the followingtable.
Catalyst and chemical cost (EUR/tonne of C5+ product) 5.00 - 8.20Labour and operating cost workforce 1 operator-helperTypical operating cost (EUR/t C5+ product) 20 - 30Investment (EUR1995/(t/yr) of C5+ product) 50 - 95
Only one operator is required. Overall, the cost of operating a catalytic condensation unit rangesfrom EUR16 – EUR22.6 per m3 of C5+ polymer gasoline. This cost includes utilities, labour,catalyst, chemicals, and an allowance for process royalty, but does not include any direct orindirect capital-related costs.
Driving force for implementationProduction process.
Example plantsSome polymerisation processes are running in European refineries. Nowadays alkylation unitsare more predominant than polymerisation units, even though polymerisation units are cheaper.
Reference literature[166, Meyers, 1997], [212, Hydrocarbon processing, 1998], [268, TWG, 2001]
4.18.2 Management and re-use of the catalyst
DescriptionTwo techniques can be applied to minimise the impact of catalyst disposal:
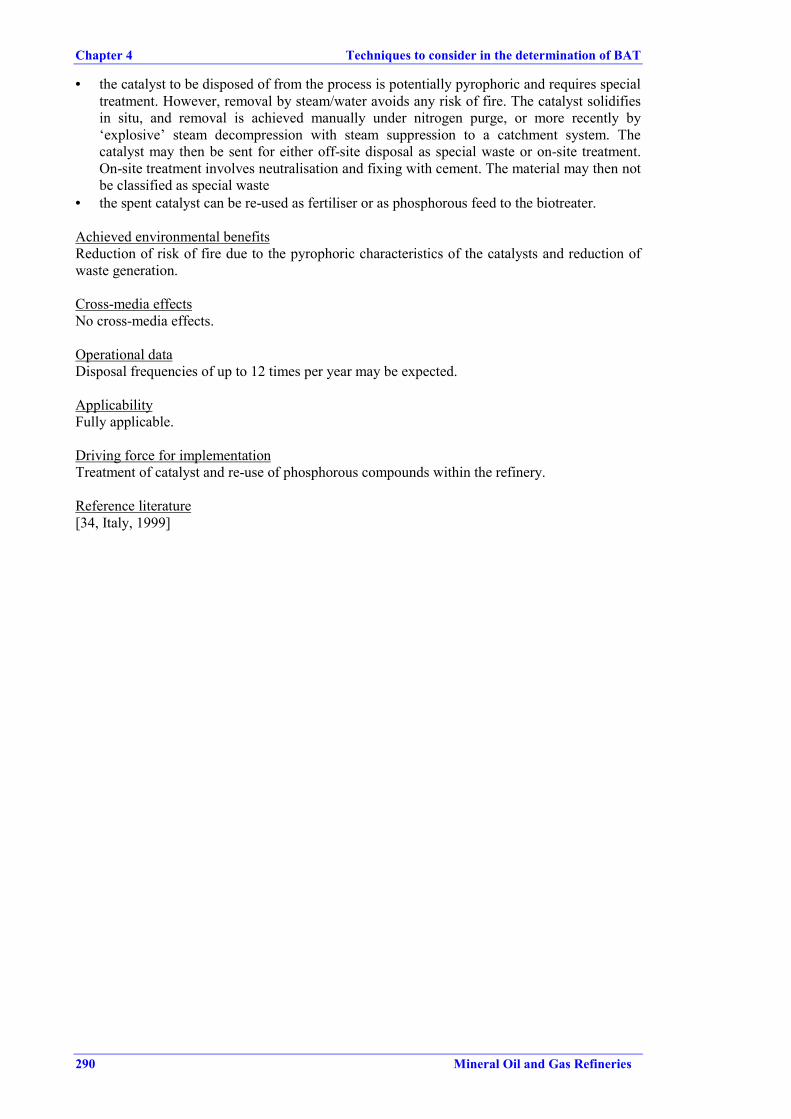
Chapter 4 Techniques to consider in the determination of BAT
290 Mineral Oil and Gas Refineries
• the catalyst to be disposed of from the process is potentially pyrophoric and requires specialtreatment. However, removal by steam/water avoids any risk of fire. The catalyst solidifiesin situ, and removal is achieved manually under nitrogen purge, or more recently by‘explosive’ steam decompression with steam suppression to a catchment system. Thecatalyst may then be sent for either off-site disposal as special waste or on-site treatment.On-site treatment involves neutralisation and fixing with cement. The material may then notbe classified as special waste
• the spent catalyst can be re-used as fertiliser or as phosphorous feed to the biotreater.
Achieved environmental benefitsReduction of risk of fire due to the pyrophoric characteristics of the catalysts and reduction ofwaste generation.
Cross-media effectsNo cross-media effects.
Operational dataDisposal frequencies of up to 12 times per year may be expected.
ApplicabilityFully applicable.
Driving force for implementationTreatment of catalyst and re-use of phosphorous compounds within the refinery.
Reference literature[34, Italy, 1999]
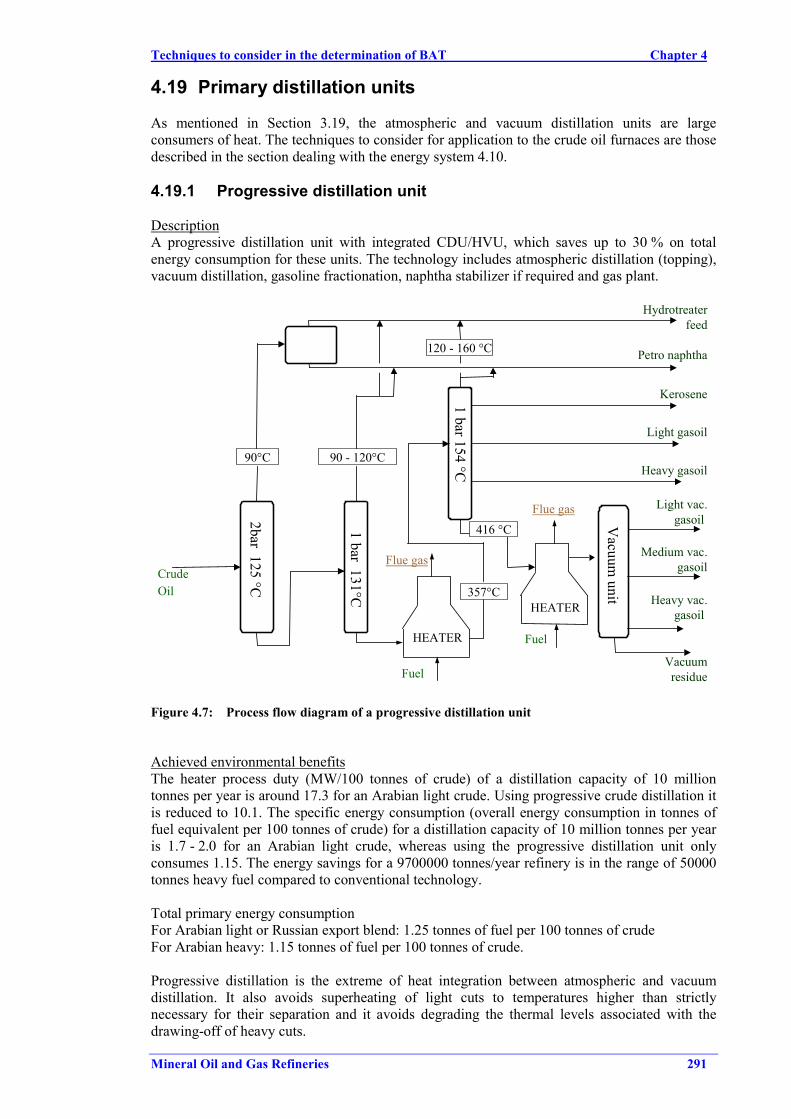
Techniques to consider in the determination of BAT Chapter 4
Mineral Oil and Gas Refineries 291
4.19 Primary distillation units
As mentioned in Section 3.19, the atmospheric and vacuum distillation units are largeconsumers of heat. The techniques to consider for application to the crude oil furnaces are thosedescribed in the section dealing with the energy system 4.10.
4.19.1 Progressive distillation unit
DescriptionA progressive distillation unit with integrated CDU/HVU, which saves up to 30 % on totalenergy consumption for these units. The technology includes atmospheric distillation (topping),vacuum distillation, gasoline fractionation, naphtha stabilizer if required and gas plant.
2bar 125 °C
1 bar 131°C
CrudeOil
HEATER
1 bar 154 °C
357°C
90°C 90 - 120°C
HEATER
416 °C Vacuum
unit
Hydrotreaterfeed
Petro naphtha
Kerosene
Light gasoil
Heavy gasoil
Light vac.gasoil
Medium vac.gasoil
Heavy vac.gasoil
VacuumresidueFuel
Fuel
Flue gas
Flue gas
120 - 160 °C
Figure 4.7: Process flow diagram of a progressive distillation unit
Achieved environmental benefitsThe heater process duty (MW/100 tonnes of crude) of a distillation capacity of 10 milliontonnes per year is around 17.3 for an Arabian light crude. Using progressive crude distillation itis reduced to 10.1. The specific energy consumption (overall energy consumption in tonnes offuel equivalent per 100 tonnes of crude) for a distillation capacity of 10 million tonnes per yearis 1.7 - 2.0 for an Arabian light crude, whereas using the progressive distillation unit onlyconsumes 1.15. The energy savings for a 9700000 tonnes/year refinery is in the range of 50000tonnes heavy fuel compared to conventional technology.
Total primary energy consumptionFor Arabian light or Russian export blend: 1.25 tonnes of fuel per 100 tonnes of crudeFor Arabian heavy: 1.15 tonnes of fuel per 100 tonnes of crude.
Progressive distillation is the extreme of heat integration between atmospheric and vacuumdistillation. It also avoids superheating of light cuts to temperatures higher than strictlynecessary for their separation and it avoids degrading the thermal levels associated with thedrawing-off of heavy cuts.
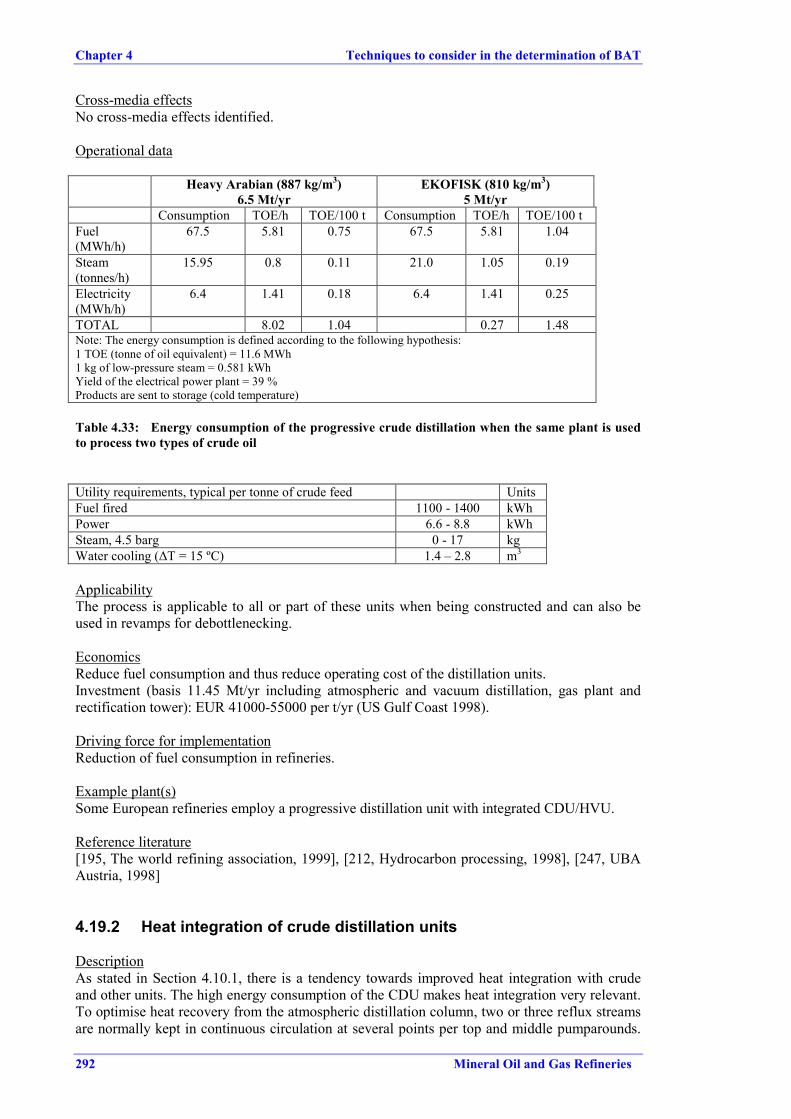
Chapter 4 Techniques to consider in the determination of BAT
292 Mineral Oil and Gas Refineries
Cross-media effectsNo cross-media effects identified.
Operational data
Heavy Arabian (887 kg/m3)6.5 Mt/yr
EKOFISK (810 kg/m3)5 Mt/yr
Consumption TOE/h TOE/100 t Consumption TOE/h TOE/100 tFuel(MWh/h)
67.5 5.81 0.75 67.5 5.81 1.04
Steam(tonnes/h)
15.95 0.8 0.11 21.0 1.05 0.19
Electricity(MWh/h)
6.4 1.41 0.18 6.4 1.41 0.25
TOTAL 8.02 1.04 0.27 1.48Note: The energy consumption is defined according to the following hypothesis:1 TOE (tonne of oil equivalent) = 11.6 MWh1 kg of low-pressure steam = 0.581 kWhYield of the electrical power plant = 39 %Products are sent to storage (cold temperature)
Table 4.33: Energy consumption of the progressive crude distillation when the same plant is usedto process two types of crude oil
Utility requirements, typical per tonne of crude feed UnitsFuel fired 1100 - 1400 kWhPower 6.6 - 8.8 kWhSteam, 4.5 barg 0 - 17 kgWater cooling (∆T = 15 ºC) 1.4 – 2.8 m3
ApplicabilityThe process is applicable to all or part of these units when being constructed and can also beused in revamps for debottlenecking.
EconomicsReduce fuel consumption and thus reduce operating cost of the distillation units.Investment (basis 11.45 Mt/yr including atmospheric and vacuum distillation, gas plant andrectification tower): EUR 41000-55000 per t/yr (US Gulf Coast 1998).
Driving force for implementationReduction of fuel consumption in refineries.
Example plant(s)Some European refineries employ a progressive distillation unit with integrated CDU/HVU.
Reference literature[195, The world refining association, 1999], [212, Hydrocarbon processing, 1998], [247, UBAAustria, 1998]
4.19.2 Heat integration of crude distillation units
DescriptionAs stated in Section 4.10.1, there is a tendency towards improved heat integration with crudeand other units. The high energy consumption of the CDU makes heat integration very relevant.To optimise heat recovery from the atmospheric distillation column, two or three reflux streamsare normally kept in continuous circulation at several points per top and middle pumparounds.
Techniques to consider in the determination of BAT Chapter 4
Mineral Oil and Gas Refineries 293
In modern designs, integration with the high vacuum unit and sometimes the thermal cracker isachieved. Some techniques applied are:• optimise the heat recovery, studying and implementing the optimal energy integration. In
this context, major progress has been made in recent years in understanding the design ofefficient heat recovery networks. "Pinch Analysis" has emerged as a tool for the evaluationof total systems designs, helping to balance investments against energy savings. See alsoSection 4.10.1
• apply pinch analysis to the crude preheat train heat integration. Increase crude preheattemperature and minimise heat losses to air and cooling water
• increase crude distillation column pumparounds from two to four. Reboil sidestrippers witha heat transfer oil rather than by steam stripping
• heat transfer in the crude preheating can be improved using specific antifoulant treatmentsin crude heat exchanger train. Antifoulants are available from many chemical companiesand, in many applications, are efficient in increasing the run cycle length of the exchangers ;antifoulant can help prevent plugging of tube exchangers, improving heat recovery andpreventing hydraulic losses, depending on the nature of fouling. Service factors of thevarious units/trains, as well as heat recovery (energy efficiency) increase at the same time.
• application of advanced process control to optimise the energy utilisation within the crudeunit.
Achieved environmental benefitsReduce the fuel consumption in distillation columns.
Cross-media effectsControl of plants is impaired because disturbances are transferred between them, influencingplant safety.
ApplicabilityIntegration in retrofitting application may will normally depend on plot space available. Exceptin a very few cases this technique is commonly applicable.
Driving force for implementationReduce energy consumption within the refinery.
Example plantsHeat integration procedures are extensively applied in crude units. Progressive distillation is thestream of heat integration between atmospheric and vacuum distillation.
Reference literature[147, HMIP UK, 1995], [79, API, 1993], [297, Italy, 2000]
4.19.3 Heat integration of the vacuum distillation units
DescriptionThe number of side-streams in a high vacuum unit is chosen to maximise heat integration ofproducing streams at different temperatures, rather than to match the number of productsrequired, with the exception of the luboil vacuum distillation units. Heat integration with thecrude units can be achieved. The atmospheric residue is then taken directly from the crudedistillation unit to the vacuum furnace, and the product streams and circulating refluxes of thehigh-vacuum unit are cooled against crude oil.
The main feed stream to the high-vacuum unit is the bottom stream of the crude oil distillationunit, referred to as atmospheric or long residue, which is either supplied directly hot or(relatively) cold from storage tanks. The latest option requires higher energy consumption.
Chapter 4 Techniques to consider in the determination of BAT
294 Mineral Oil and Gas Refineries
The application of advanced process control to optimise the energy utilisation within the crudeunit.
Achieved environmental benefitsReduce fuel consumption in the refinery.
Cross-media effectsControl of plants is impaired because disturbances are transferred between them, influencingplant safety.
ApplicabilityIntegration in retrofitting application may will normally depend on plot space available. Exceptin a very few cases this technique is commonly applicable.
Driving force for implementationReduce fuel consumption in the refinery.
Example plantsHeat integration procedures are extensively applied in vacuum units. Progressive distillation isthe stream of heat integration between atmospheric and vacuum distillation.
Reference literature[147, HMIP UK, 1995], [79, API, 1993], [297, Italy, 2000]
4.19.4 Use of vacuum pumps and surface condensers
DescriptionVacuum liquid ring compressors instead of steam ejectors.
Achieved environmental benefitsVacuum pumps and surface condensers have largely replaced barometric condensers in manyrefineries to eliminate this oily waste water stream. Replacing the steam ejectors by vacuumpumps will reduce the sour water flow from 10 to 2 m3/h. The vacuum may be generated by acombination of vacuum pumps and ejectors to optimise energy efficiency. Other benefits arecross linked with cross-media effects.
Cross-media effectsReplacement of the steam ejectors by vacuum pumps will increase the electricity consumptionfor vacuum generation, but will reduce the heat consumption, the cooling water consumption,the electricity consumed for cooling pumps and the consumption of agents used for conditioningof cooling water. Within the refinery there are many processes where surplus steam canrecovered and be used for the production of vacuum. However, an energy management analysiswill help to decide, whether use of surplus steam for steam ejection instead of applying vacuumpumps is more efficient than using surplus steam for other purposes.
Operational dataThe use of vacuum pumps consumes electricity.
ApplicabilityFully applicable.
Driving force for implementationReduction of production of waste water.
Example plantsAt present, vacuum pumps are used more often than ejector sets.
Techniques to consider in the determination of BAT Chapter 4
Mineral Oil and Gas Refineries 295
Reference literature[79, API, 1993], [268, TWG, 2001]
4.19.5 Reduction of the vacuum pressure in the vacuum distillation unit
DescriptionLowering the vacuum pressure, e.g. down to 20 - 25 mm Hg, will allow a reduction in thefurnace outlet temperature, while maintaining the same target cut point of the vacuum residue.
Achieved environmental benefitsThis technique would provide some benefits, both in terms of energy conservation and ofpollution. The environmental benefits are:• a lowered potential for cracking or coking at furnace tubes• a reduced cracking of feed to lighter products• a lowered furnace fired duty and hence lowered fuel consumption.
Cross-media effectsEnergy (electricity or steam) is necessary to generate the vacuum.
ApplicabilityIt is limited usually by tower capacity, condensing fluid temperature or material restrictions.
Driving force for implementationReduce the heat duty of the vacuum distillation process.
Reference literature[297, Italy, 2000], [79, API, 1993]
4.19.6 Treatment of non-condensables from vacuum ejector setcondensor
DescriptionTechniques for controlling releases from vacuum units include scrubbing, compression intorefinery fuel gas and burning in adjacent process furnaces, or combinations thereof. The gasesfrom some units may contain significant amounts of air and such gases are normally bestcombusted locally. Amine scrubbing techniques may need to be applied carefully ashydrocarbon contamination may cause foaming problems in amine regeneration units.
Incondensables from overhead condensers can be passed to light ends treatment or recoverysystems or refinery fuel gas systems; sour incondensable gases vented from sealed barometricpumps of vacuum distillation units should be extracted and dealt with in a manner appropriate tothe nature of the sour gas.
A control technique applicable to the non-condensable emissions vented from the vacuumejectors or pumps consisting of venting into blowdown systems or refinery fuel gas systems,and incineration in furnaces or waste heat boilers.
Achieved environmental benefitsVacuum distillation column condensers may emit 0.14 kg/m3 of vacuum feed and can bereduced to negligible levels if they are vented to heater or incinerator. Pollution reduction isachieved if vacuum gaseous streams (vent gas) are routed to an appropriate amine scrubbingunit instead of being directly burned in the process heater. Vacuum vent gas routing toscrubbing requires significant investment due to compressor costs.The efficiency of incineration control techniques is generally greater than 99 % as regardsNMVOC emissions.
Chapter 4 Techniques to consider in the determination of BAT
296 Mineral Oil and Gas Refineries
Cross-media effectsIn the incineration technique, the combustion products have to be accounted for.
ApplicabilityFully applicable.
Driving force for implementationReduce the emissions of pollutants.
Example plantsApplied in some European refineries.
Reference literature[136, MRI, 1997], [127, UN/ECE, 1998]
4.19.7 Waste water treatment and re-use
DescriptionThis topic is also treated in Section 4.15.7. Two techniques are considered in this section:• the overhead reflux drum generates some waste water. That water can be re-used as a
desalter wash water• sour water from atmospheric and vacuum unit condensates should pass to a sour water
stripper in enclosed systems• optimise water re-use by application of side-stream softening to blowdown streams.
Achieved environmental benefitsReduce water consumption and reabsorb pollutants.
ApplicabilityFully applicable.
Driving force for implementationReduce the water consumption.
Reference literature[79, API, 1993]
4.19.8 Other techniques to consider in the atmospheric units
DescriptionSome other techniques to consider are the following:(1) where applied, ammonia injection should be handled in enclosed systems. Alternative
neutralising techniques are available and can reduce the ammonia/ammonium load on sourwater and sulphur recovery systems
(2) de-coking vents need to be provided with suitable knock-out and dust suppressionfacilities;suitable methods of preventing emissions during clean-out procedures need to beused
(3) many oily sludges can be sent the crude distillation (or in alternative to the coking unit. See4.7.5) where they become part of the refinery products. This technique typically imply tosend the light slops to floating roof tanks (double sealed), and the heavy slops typically tofix roof tank. Typically the heavy slop after setting is blend with liquid fuel. The blendedlight slops after enough setting may be also blent to liquid fuel or sent to the crudedistillation at a mixing rate to avoid fouling.
(4) Pressure relief valves on column overheads; relief from overhead accumulator should bepiped to flare as well as the vent points.
(5) Use of spent caustic instead of fresh caustic for corrosion control on distillation unit. (Moreinformation in Section 4.20.2
Techniques to consider in the determination of BAT Chapter 4
Mineral Oil and Gas Refineries 297
Operational dataThe process of oily sludges in the crude distillation may generate problems in the desalter ormay foul up the heat exchangers of the distillation column.
Reference literature[79, API, 1993], [268, TWG, 2001]
Chapter 4 Techniques to consider in the determination of BAT
298 Mineral Oil and Gas Refineries
4.20 Product treatments
A brief explanation on which kind of processes are included within this section is given inSection 2.20 and within the Section on Scope.
4.20.1 Cascading of caustic solutions
DescriptionAn overall reduction in the caustic consumption of wet treating units can be obtained if semi-spent caustic from one treating unit can be re-used in another one. A typical example of thisprocedure is the use of the bleed of regenerated caustic (e.g. in mercaptan treaters for catcrackedgasoline or for removal of H2S or thiophenols) in a pre-wash step of the non-catalysedcatcracked gasoline sweetening processes. An example of a caustic integration scheme is givenin Figure 2.28.
Achieved environmental benefitsReduce the use of caustic solutions.
Operational dataSystems handling spent caustic require particular care regarding sulphur compounds.
Economics
Product Types of gasolinesweetening process
Estimate capital cost,million EUR
Est. operating cost,EUR/m3
LPG Extraction* 2.2 0.05Light naphtha Minalk 1.1 0.04
Caustic-free 1.1 0.15Heavy naphtha andkerosene
Conventional fixed-bed 2.6 0.18
Caustic free 2.6 0.40• * Include pretreating and post-treating facilities.• Sample economics of the MEROX process on the basis of 1590 m3 per stream day capacity for various
applications. The capital costs are for modular design, fabrication and erection of MEROX plants. The estimatedmodular cost is inside battery limits, U.S. Gulf coast, FOB point of manufacturer. The estimated operating costsinclude catalysts, chemicals, utilities and labor.
Sweetening treatment is much cheaper than hydrotreating, both in terms of capital investmentand in operation costs. The caustic is normally almost fully regenerated and only a small bleedresults.
Reference literature[115, CONCAWE, 1999], [166, Meyers, 1997], [83, CONCAWE, 1990]
4.20.2 Management of the spent caustic
DescriptionCaustics are used to absorb and remove hydrogen sulphide and phenol contaminants fromintermediate and final product streams can often be recycled. Spent caustic solutions from somesweetening units are odorous and need to be handled in enclosed systems and treated asnecessary before release at a controlled rate to the effluent system. Several techniques exist tomaximise the use of caustics within a refinery. They include recycling within the refinery oroutside the refinery or destruction within incinerators. Techniques considered are:• Treatment of caustic may include neutralisation and stripping• Because of the very high concentration of organic compounds in spent caustic solutions
(COD>>> 50 g/l), incineration can be an appropriate alternative to waste water treatment.
Techniques to consider in the determination of BAT Chapter 4
Mineral Oil and Gas Refineries 299
• Spent catalyst/caustic need to be handled and disposed of in a manner that avoids dustgeneration. They should not be disposed of to the land.
• Some techniques are available to re-use spent caustic within the refinery:(1) corrosion control on crude distillation units using spent caustic rather than fresh caustic.
Ustable chloridic (magnesium) salts that are not extracted from the crude oil in thedesalter will decompose upon heating to the crude distiller and cause chloridiccorrosion. To prevent corrosion of the exposed equipment, small quantities of caustic(sodium) are injected in the crude oil feed by which the chloridic components areneutralised due to the formation of stable sodium chloride. For this purpose ofneutralisation of chloridic decomposition products often spent caustic can be used,which is recommended as well to minimize waste generation.
(2) recycle to crude desalter or sour water strippers(3) addition to biotreaters for pH control.(4) Caustics containing phenols can also be recycled on-site by reducing the pH of the
caustic until the phenols become insoluble thereby allowing physical separation. Thecaustic can then be treated in the refinery waste water system.
• Re-use spent caustic outside refinery:(1) in paper mills (sulphidic caustic only)(2) as raw material for Na2SO3, cresylics and Na2CO3 (may require segregation of
sulphidic, cresylic and naphthenic caustics).(3) Spent caustics may be saleable to chemical recovery companies if concentrations of
phenol or hydrogen sulphide are high enough. Process changes in the refinery may beneeded to raise the concentration of phenols in the caustic to make recovery of thecontaminants economical.
• Measures to regenerate or oxidise spent caustic are:(1) Hydrogen peroxide(2) Fixed bed catalyst(3) Pressurised air: 120 - 320°C; 1.4 - 20.4 MPa(4) Biological system
Achieved environmental benefitsReduce odour emissions and caustic use.
Cross-media effectsThe cross-media effects found in the different techniques mentioned above are:(2) the addition of caustic within the desalter or within the crude unit may enhance the coke
formation within later units.(3) it adds phenols and BTX to waste water treatment. As a consequence, the degradation
efficiency of the biotreater can be adversely affected or the emissions from the waste watertreatment plant for these components can increase.
Operational dataSystems handling spent caustic require particular care regarding sulphur compounds.
Driving force for implementationReduce caustic use.
Example plantsMost refineries are able to regenerate their spent caustic, but sometimes they have to dispose ofsome excess quantities, mainly from caustic pre-wash activities. Usually these quantities aresmall and can be managed within their effluent treatment system or, if this is not the case, theyare disposed of via contractors for use as a bleaching agent in the paper and pulp industry. Somerefineries sell their concentrated phenolic caustic for the recovery of cresylic acids. Somerefineries work up the phenolic caustics themselves. From the extraction process the disulphiderecovered can be sold as product, or be recycles to a hydrometer or incinerator.
Chapter 4 Techniques to consider in the determination of BAT
300 Mineral Oil and Gas Refineries
Reference literature[115, CONCAWE, 1999], [259, Dekkers, 2000], [268, TWG, 2001]
4.20.3 Incineration of foul air vented from sweetening
DescriptionFour air vented from sweetening process contain sulphur compounds that typically have strongodour. The range of quantity of sulphur in the foul air vented from sweetening processes isaround 0.7 – 7 kg/day (disulphide concentration can be as high as 400 ppm) for a 10000 t/dcrude unit and the percentage contribution it makes to the stack gases where it is incinerated hasbeen estimated to 0.16 – 2.48 %. For this reason, the abatement previous an incineration is notjustified and the foul air vented from sweetening processes is incinerated in local furnaces.
Reference literature[268, TWG, 2001]
4.20.4 Replace clay filtration with hydrotreating
DescriptionWhere a need to remove colour bodies and olefins exists, hydrotreating is replacing clayfiltration as the method of choice. Hydrotreating does a better job of improving colour andincreasing stability against oxidation, and has no yield loss (the oil measured in the spent filterclay represents a loss of some of the most valuable products produced in a refinery). It alsoeliminates the problem of spent clay disposal.
Achieved environmental benefitsReduction of waste generation.
Cross-media effectsNeed for hydrogen and energy consumption. See Section 4.13.1.
Operational dataSee Section 4.13.1.
EconomicsSee Section 4.13.1.
Driving force for implementationProduct requirements.
Reference literature[113, Noyes, 1993]
4.20.5 Treating
DescriptionTreating gas, LPGs, butanes, gasolines, kerosenes and diesels with caustic, amines, water andacid to remove amines, caustic contaminants, H2S, COS and mercaptans. Dry adsorbents suchas molecular sieves, activated carbon, iron sponge and zinc oxide may also be used to reachspecification (LPG) and prevent odour problems. (See also.4.23.9)
Reference literature[212, Hydrocarbon processing, 1998]
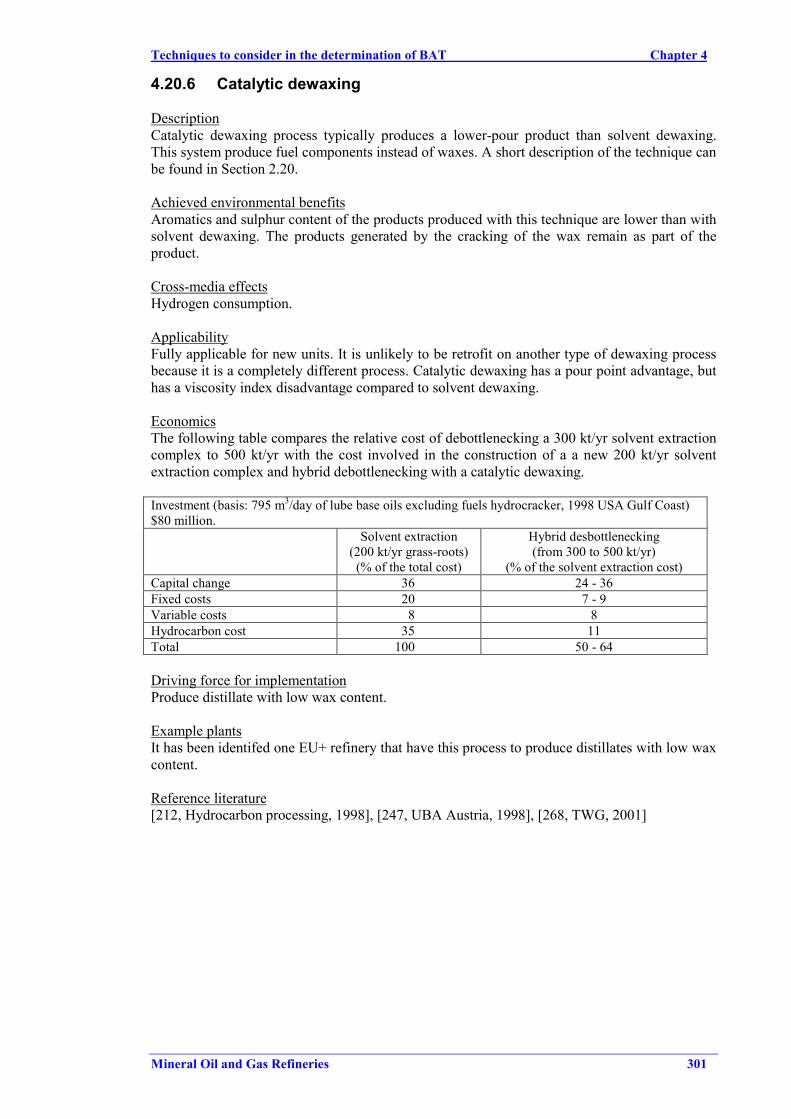
Techniques to consider in the determination of BAT Chapter 4
Mineral Oil and Gas Refineries 301
4.20.6 Catalytic dewaxing
DescriptionCatalytic dewaxing process typically produces a lower-pour product than solvent dewaxing.This system produce fuel components instead of waxes. A short description of the technique canbe found in Section 2.20.
Achieved environmental benefitsAromatics and sulphur content of the products produced with this technique are lower than withsolvent dewaxing. The products generated by the cracking of the wax remain as part of theproduct.
Cross-media effectsHydrogen consumption.
ApplicabilityFully applicable for new units. It is unlikely to be retrofit on another type of dewaxing processbecause it is a completely different process. Catalytic dewaxing has a pour point advantage, buthas a viscosity index disadvantage compared to solvent dewaxing.
EconomicsThe following table compares the relative cost of debottlenecking a 300 kt/yr solvent extractioncomplex to 500 kt/yr with the cost involved in the construction of a a new 200 kt/yr solventextraction complex and hybrid debottlenecking with a catalytic dewaxing.
Investment (basis: 795 m3/day of lube base oils excluding fuels hydrocracker, 1998 USA Gulf Coast)$80 million.
Solvent extraction(200 kt/yr grass-roots)
(% of the total cost)
Hybrid desbottlenecking(from 300 to 500 kt/yr)
(% of the solvent extraction cost)Capital change 36 24 - 36Fixed costs 20 7 - 9Variable costs 8 8Hydrocarbon cost 35 11Total 100 50 - 64
Driving force for implementationProduce distillate with low wax content.
Example plantsIt has been identifed one EU+ refinery that have this process to produce distillates with low waxcontent.
Reference literature[212, Hydrocarbon processing, 1998], [247, UBA Austria, 1998], [268, TWG, 2001]
Chapter 4 Techniques to consider in the determination of BAT
302 Mineral Oil and Gas Refineries
4.21 Storage and handling of materials
As has been mentioned more information can be found in the Horizontal BREF on Storage[264, EIPPCB, 2001].
4.21.1 Underground caverns
DescriptionMore information in Section 2.21.
Achieved environmental benefits• VOC emissions from underground storage caverns are very low or non-existent. The main
reasons are: the temperature of the cavern is low and stable, the product is under pressure,the breathing gases from the cavern are not led to atmosphere but to an other cavern
• the land above caverns is free for other purposes• improve safety.
Cross-media effectsGround water leaking into the cavern must be removed and treated with other oily waters.
ApplicabilityThe geology of the site should be adequate to install a cavern: non porous rock.
EconomicsThe construction costs of storage caverns are markedly smaller than for above-ground tankfarms. In Finland, profitability begins at 50000 m3 under favourable conditions (depends highlyon the rock type). Maintenance costs have been calculated to be one-sixth those of above-ground tanks.
Driving force for implementationAvoidance of visual intrusion, the reduction of energy consumption, saving of land surface andeconomic for large storage systems.
Example plantsUsed in some European countries.
Reference literature[256, Lameranta, 2000]
4.21.2 Internal floating roof tanks
DescriptionInternal floating roof tank (IFRT)s. Emissions primarily occur during standing storage, with anadditional contribution from withdrawal emissions. In addition to the rim seal area and rooffitting penetrations, sources of standing loss from internal floating roof tanks include boltedseams in the floating roof. More information in Section 2.21. Some techniques that might beapplied to IFRT are:• the replacement of primary/secondary seals with tighter seals, which can also reduce the
VOC emissions• drain design on floating roof tanks to avoid hydrocarbon contamination of rainwater.
Achieved environmental benefitsReduction of VOC emissions. Conversion of fixed roof tanks to internal floating roof and sealsto minimise evaporation of the product being stored. The control efficiency of this method
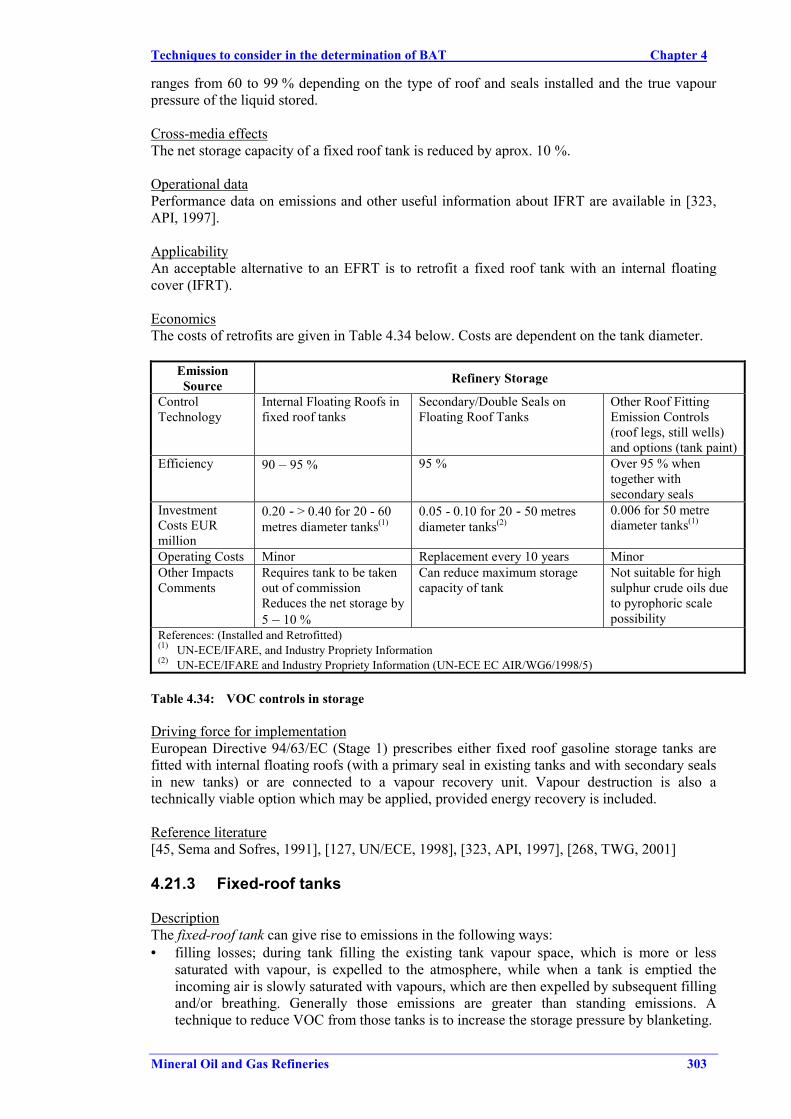
Techniques to consider in the determination of BAT Chapter 4
Mineral Oil and Gas Refineries 303
ranges from 60 to 99 % depending on the type of roof and seals installed and the true vapourpressure of the liquid stored.
Cross-media effectsThe net storage capacity of a fixed roof tank is reduced by aprox. 10 %.
Operational dataPerformance data on emissions and other useful information about IFRT are available in [323,API, 1997].
ApplicabilityAn acceptable alternative to an EFRT is to retrofit a fixed roof tank with an internal floatingcover (IFRT).
EconomicsThe costs of retrofits are given in Table 4.34 below. Costs are dependent on the tank diameter.
EmissionSource Refinery Storage
ControlTechnology
Internal Floating Roofs infixed roof tanks
Secondary/Double Seals onFloating Roof Tanks
Other Roof FittingEmission Controls(roof legs, still wells)and options (tank paint)
Efficiency 90 – 95 % 95 % Over 95 % whentogether withsecondary seals
InvestmentCosts EURmillion
0.20 - > 0.40 for 20 - 60metres diameter tanks(1)
0.05 - 0.10 for 20 - 50 metresdiameter tanks(2)
0.006 for 50 metrediameter tanks(1)
Operating Costs Minor Replacement every 10 years MinorOther ImpactsComments
Requires tank to be takenout of commissionReduces the net storage by5 – 10 %
Can reduce maximum storagecapacity of tank
Not suitable for highsulphur crude oils dueto pyrophoric scalepossibility
References: (Installed and Retrofitted)(1) UN-ECE/IFARE, and Industry Propriety Information(2) UN-ECE/IFARE and Industry Propriety Information (UN-ECE EC AIR/WG6/1998/5)
Table 4.34: VOC controls in storage
Driving force for implementationEuropean Directive 94/63/EC (Stage 1) prescribes either fixed roof gasoline storage tanks arefitted with internal floating roofs (with a primary seal in existing tanks and with secondary sealsin new tanks) or are connected to a vapour recovery unit. Vapour destruction is also atechnically viable option which may be applied, provided energy recovery is included.
Reference literature[45, Sema and Sofres, 1991], [127, UN/ECE, 1998], [323, API, 1997], [268, TWG, 2001]
4.21.3 Fixed-roof tanks
DescriptionThe fixed-roof tank can give rise to emissions in the following ways:• filling losses; during tank filling the existing tank vapour space, which is more or less
saturated with vapour, is expelled to the atmosphere, while when a tank is emptied theincoming air is slowly saturated with vapours, which are then expelled by subsequent fillingand/or breathing. Generally those emissions are greater than standing emissions. Atechnique to reduce VOC from those tanks is to increase the storage pressure by blanketing.
Chapter 4 Techniques to consider in the determination of BAT
304 Mineral Oil and Gas Refineries
• breathing losses; during storage of the liquid there will be vapour emissions from tankbreathing caused by the difference in night and day temperatures and by changes inatmospheric pressure. To a certain extent, pressure controllers and insulation can preventbreathing losses
• vapours released during water draining.
The techniques that are considered to reduce emissions from fixed roof tanks are:• a technique to reduce VOC from those tanks is to blanket them• installation of an internal floating roof.
Achieved environmental benefitsThe installation of an internal floating roof in fixed-roof tanks can reduce VOC emissions up to90 %.
Cross-media effectsThe installation of an internal floating roof in a fixed roof tank requires the tank to be taken outof commission and reduces the net storage by 5 - 10 %.
Operational dataPerformance data on emissions and other useful information about EFRT are available in [323,API, 1997]
ApplicabilityFixed roof tanks are typically used for low or non volatile products e.g. kerosene, heating oil,with TVP less than 14 kPa. These tanks can be retrofitted to internal floating roof tanks. But arenot suitable for all products, e.g. bitumen tank with an internal floating roof will not work due tobitumen solidifying in the flaw between wall and internal floating roof.
EconomicsThe investment cost of installing internal floating roofs in fixed roof tanks can be 0.2 - 0.4 EURmillion for tanks 20 - 60 meters in diameter.
Driving force for implementationReduction of VOC emissions.
Reference literature[107, Janson, 1999], [115, CONCAWE, 1999], [323, API, 1997], [268, TWG, 2001]
4.21.4 External floating roofs
DescriptionExternal Floating roof tanks (EFRT). Filling and breathing losses are greatly diminished incomparison with fixed roof tanks, but the following vapour losses are inherent to this type oftank:• standing storage emissions from floating roof tanks include rim seal and roof-fitting
emissions, which result from stock vapour pressure changes due to temperature, andpressure variations but more importantly wind effects as well as openings in the roof. Theinfluence of wind effects is not a factor on internal floating roof tanks. Standing emissionson external floating roof tanks are generally much more significant than withdrawalemissions
• wetting losses; by evaporation of liquid from the wet wall, when the level of the liquid islowered by discharge
• vapours released during water draining• in many cases, for an external floating roof tank, the emissions through fittings can exceed
the rim seal losses especially on tanks with secondary seals. In terms of fitting losses, themajor source is from the slotted stillwell (sample well or dipping well).
Techniques to consider in the determination of BAT Chapter 4
Mineral Oil and Gas Refineries 305
External floating roof tanks are used to store crudes, light products and intermediate stockshaving a vapour pressure of more than 14kPa but less than 86 kPa at normal storagetemperature. More information can be found in Section 2.21. Techniques to minimise emissionsthere include:• installing wipers at the floating deck• sleeves around the pipe, incorporating still well wipers• floats with wipers inside the slotted pipe• land as infrequently as possible the floating roof tanks to avoid unnecesary vapour releases.
Achieved environmental benefitsFor the same substance, e.g. gasoline, EFRTs have the advantage over fixed roof tanks ofsignificantly lower emissions to the atmosphere of VOCs. An EFRT can avoid 95 % of thelosses from a fixed roof. Product savings give operating benefits.
Cross-media effectsThey have potentially more emissions to water than fixed roof tanks, since it is possible forrainwater to enter the tank past the roof seal. Any such water needs to be drained beforedespatch of the product to a customer since the quality of the product can be seriouslyjeopardised.
Operational dataPerformance data on emissions and other useful information about EFRT are available in [323,API, 1997].
ApplicabilityIn retrofit situations where a change in the service of the tank is desired, an acceptablealternative to an EFRT is to retrofit a fixed roof tank with an internal floating cover.
EconomicsInvestment cost for the retrofitting of a fixed rood tank to a EFRT is EUR 0.26 million per tankdiameter 20 m. Operator is necessary for tank draining, giving rise to some operating cost.
Driving force for implementationThe Directive 94/63/EC (Annex 1) defines an appropriate floating roof tank as one having atleast a VOC release efficiency of 95 % as compared with a fixed roof one.
Reference literature[45, Sema and Sofres, 1991], [252, CONCAWE, 2000], [258, Manduzio, 2000], [323, API,1997], [268, TWG, 2001]
4.21.5 Pressurised vesselsPressurised vessels such as bullets and spheres are often fitted with pressure relief valves, whichvent to atmosphere or flare. VOC emissions can occur if these valves or by-pass block valveshave internal leaks.
4.21.6 Double and secondary seals
DescriptionTwo seals at the floating roof rim provide a double barrier to control VOC emissions fromstorage tanks. Fitting secondary roof rim seals is an accepted technology for emission reduction.Rim-mounted seals (as opposed to shoe-mounted seals) are favoured, since the former offeremission control if the primary seal fails.
Chapter 4 Techniques to consider in the determination of BAT
306 Mineral Oil and Gas Refineries
Achieved environmental benefitsVOC emissions can be significantly reduced by installing secondary seals on storage tanks. TheAmoco/USAEPA joint study estimated that VOC losses from storage tanks could be reduced by75 to 95 %. When they are applied in EFRT, secondary seals also reduce the likelihood ofrainwater ingress into the tank. Secondary seals for gasoline storage can reduce VOC emissionsby up to 95 %.
Cross-media effectsRetrofitting seals usually results a loss of operating capacity of about 5 %.
Operational dataPerformance data on emissions and other useful informations about rim seals are available in[323, API, 1997].
ApplicabilityThey can be readily installed in new units (named double seals) and generally retrofitted(secondary seals).
EconomicsEquipping an average tank with a secondary seal system was estimated to cost about $20000(1991). Investment costs: EUR 0.05 - 0.10 million for tanks 20 - 50 metre diameter.Operating costs: Replacement likely every 10 years.
Driving force for implementationEuropean Directive 94/63/EC (Stage 1) prescribes secondary seals for external floating rooftanks and for new internal floating roof tanks for gasoline storage in refineries and terminals.
Example plantsIn common use world-wide.
Reference literature[45, Sema and Sofres, 1991], [252, CONCAWE, 2000], [323, API, 1997], [268, TWG, 2001]
4.21.7 Storage strategy
DescriptionThe need for certain tanks can often be eliminated through improved production planning andmore continuous operations. This technique is closely related to Section 4.15.5. An example isthe implementation of an in-line blending system. See Section 4.21.14.
Achieved environmental benefitsSince storage tanks are one of the largest sources of VOC emissions, a reduction in their numbercontributes to a reduction of VOC emissions. By minimizing the number of storage tanks, tankbottom solids and decanted waste water may also be reduced.
ApplicabilityThe reduction of number of tanks typically requires a full change in the management of productand intermediates. As consequence this technique is easier to be applied to new units.
Driving force for implementationSpace usage can be improved by reducing the number of storage tanks in operation.
Reference literature[268, TWG, 2001]
Techniques to consider in the determination of BAT Chapter 4
Mineral Oil and Gas Refineries 307
4.21.8 Prevention of leakage through tank bottoms
It follows techniques to consider in the determination of BAT for prevention of leakage throughtank bottoms. This topic is well documented in EEMUA pub 183 "Guide for the Prevention ofBottom Leakage from Vertical, Cylindrical, Steel Storage Tanks”.
4.21.8.1 Double tank bottoms
DescriptionDouble bottoms can either be retrofitted in existing tanks or incorporated into the design of newtanks. If retrofitted, the existing tank bottom is normally used as the secondary flooring, andsand, gravel or concrete can be installed between the new primary and the secondary floors. Inthis case, it is general practice to keep the interstitial space to a minimum and therefore thesecondary bottom should slope the same way as the primary bottom. The slopes to the base oftanks can be either straight, cone-up (sloping from the centre down to the tank perimeter) orcone-down (sloping downward from the tank perimeter). Nearly all tank floors are made ofcarbon steel. If a double bottom is to be installed (either retrofit or new build), there are choicesin material selection for the new floor. A second carbon steel floor can be utilised or a morecorrosion-resistant stainless steel floor can be installed. A third choice is to use a glass fibre-reinforced epoxy coating over the steel.
The use of double bottom tanks allows a vacuum system to be installed, and in this case thespace between the lower and upper floor is not filled, but retained as an air space using steelspacers (which can typically be a steel reinforcement mesh). In this more recent system, thespace between the floors is kept under a vacuum that is continuously monitored. Any leak inthe primary or secondary floor will dissipate the vacuum and trigger an alarm. A further test ofthe extracted air will indicate an upper floor failure if product or vapours are present, or a lowerfloor failure if neither product nor vapour is present (subject to any previous underfloorcontamination).
Achieved environmental benefitsInstalling a second impervious bottom to a tank provides a measure of protection against non-catastrophic releases due to corrosion, faulty weld joints, or flaws in the bottom material or theconstruction details. In addition to containment, the secondary bottom provides a means ofallowing detection of a bottom leak which is not obviously visible to an operator, as a similarshell defect would be.
Cross-media effectsIn the case of retrofitting, the application of this technique may prolong the outage time of tanksduring installation of the double bottom. Its application can reduce the capacity of the tank.
Operational dataBy installing double bottoms, the time between inside inspections and the the number of theannual tank cleaning procedures are decreased.
ApplicabilityEither retrofit or new-build tanks.
EconomicsTypical retrofit costs for double bottoms, as quoted from German or Swiss suppliers, are asfollows and include provision of a vacuum leak detection system:• carbon steel: 110 EUR/m2
• stainless steel: 190 EUR/m2
• glass fibre-reinforced epoxy: 175 EUR/m2
An UK refinery reported that the actual cost of installing a double bottom on a 10340 m3 tankwas 600000 EUR.
Chapter 4 Techniques to consider in the determination of BAT
308 Mineral Oil and Gas Refineries
Driving force for implementationPrevention of leaks from storage tanks.
Reference literature[253, MWV, 2000], [112, Foster Wheeler Energy, 1999]
4.21.8.2 Impervious membrane liners
DescriptionThe impervious membrane liner is a continuous leak barrier under the entire bottom surface ofthe tanks. It can be an alternative to a double bottom or it can be added as an extra measure ofsafety below the double bottom. Like the double bottom, it is primarily intended to arrest thesmall but persistent leak rather than address a catastrophic failure of the entire tank. The key toan effective liner is that the seams need to be liquid-tight against either the steel shell of the tankor the concrete wall that supports and surrounds the tank. The minimum thickness of theflexible membrane is 1 mm, although 1.5 to 2 mm thick sheets are commonly used. Themembrane need to be chemically resistant to the product stored in the tank.
Achieved environmental benefitsPrevention of leak from storage tanks.
Cross-media effectsProlonged tank outage if liner has to be retrofitted to existing tank.
ApplicabilityThey can be installed either in a new-build design or as a retrofit and they generally include aleak detection system.
EconomicsThe cost of retrofitting a liner is slightly higher than installing a double bottom as it involvesjacking-up the existing tank to install the membrane and leak detection system. An indicativecost is of the order of 200 EUR/m2. As new-build construction, an impervious liner may becheaper than a double bottom, but it may have a higher life cycle cost. This is because anyfuture failures of the liner would require re-lifting the tank or reverting to a new double bottomsolution.
The following are costs per unit for placing the following materials on the ground:• concrete: 30 EUR/m2
• asphalt: 24 EUR/m2
• HD polyethylene: 23 EUR/m2
• bentonite: 18 EUR/m2
• clay: 11-17 EUR/m2
This costs exclude the cost of lifting the tank for installation. However, costs of placing suchmaterials in the floors of bunds would be of this order. An additional cost arises from movingany pipework in the bunds.
For comparison of the installed costs of such a liner, one refinery reported that since 1994, ithad installed a clay bottom liner under each lifted tank during maintenance. A leak detectionsystem was installed at the same time. The cost of this was about 20000 to 30000 EUR per tankwith the cost of the clay liner being 11 to 17 EUR/m2. The total cost for 14 tanks amounted to350000 EUR. A similar cost (35000 EUR) was quoted in another installation of an imperviousliner (plus leak detection) for a 12000 m3 concrete tank.
Driving force for implementationPreventing soil contamination.
Techniques to consider in the determination of BAT Chapter 4
Mineral Oil and Gas Refineries 309
Example plant(s)Impervious membrane liners are used in lieu of double bottoms in a number of non-Europeancountries.
Reference literature[45, Sema and Sofres, 1991], [268, TWG, 2001]
4.21.8.3 Leak detection
DescriptionAs with sewers, one way to protect against soil and groundwater contamination is by detectingleaks at an early stage. Leaks through a tank bottom can be detected by a leak detection system.Conventional systems include inspection ports, inventory control and inspection wells. Moreadvanced systems include electronic sensing probes or energy pulse cables whereby product thatcomes into contact with the probe or cable will alter its impedance and trip an alarm. Inaddition, it is common practice to use a variety of inspection procedures on tanks at intervals toprove their integrity. See also Section 4.23.6.1 LDAR programme. Some techniques to considerare:• Equipping storage tanks with overflow alarms and automatic pump shut-offs.• Installing double bottoms with integrated leak detection systems on tanks where practicable.
Relief valves on pressurised storage should undergo periodic checks for internal leaks. This canbe carried out using portable acoustic monitors or, if venting to atmosphere with an accessibleopen end, tested with a hydrocarbon analyser as part of an LDAR programme.
Achieved environmental benefitsAvoid soil and groundwater contamination.
ApplicabilityProbes and cables have to be packed pretty densely if the leak to be detected is small.Consequently, inspection, where possible, may in some cases be more reliable than probes.
EconomicsOne refinery reported that the installation of a leak detection system on a group of four 12 mdiameter tanks cost a total of 55000 EUR with an operating cost of 4000 EUR per year. Theroutine inspection of tanks at another refinery was quoted as 2000 EUR/tank/year.
Driving force for implementationAvoid soil and groundwater contamination.
Reference literature[253, MWV, 2000]
4.21.8.4 Cathodic protection
DescriptionTo avoid corrosion on the underside of the tank bottom, tanks can be equipped with cathodiccorrosion protection.
Achieved environmental benefitsAvoid soil and groundwater contamination and air emissions due to the prevention of corrosion.
Cross-media effectsElectricity is needed.
Chapter 4 Techniques to consider in the determination of BAT
310 Mineral Oil and Gas Refineries
Driving force for implementationAvoid corrosion of tanks and pipes, reducing the maintenance cost.
Reference literature[253, MWV, 2000]
4.21.9 Tank farm bund containment
DescriptionWhereas double bottoms or impervious liners protect against the small but incessant leak, animpermeable tank farm bund is designed to contain large spills (for safety as well asenvironmental reasons), such as caused by a shell rupture or a large spill from overfilling. Thebund consists of a wall or dike around the outside of the tank to contain all or part of the tankcontents in the event of a spill, and (in some cases) an impermeable ground barrier between thetank and the dike to prevent infiltration of the product into the ground. The dike is typicallyconstructed of well-compacted earth or reinforced concrete. The height is normally sized toaccommodate the maximum contents of the largest tank within the volume enclosed by the dike.However this philosophy of total capture is flawed if the ground between the tank and dike ispermeable. Oil can permeate downward and under the dike in these situations. Asphalt, concretesurface or high density polyethylene (HDPE) liner are some of the possibilities.
Achieved environmental benefitsContainment of large spills from liquid storage tanks.
Cross-media effectsThis technique might call for the soil to be compacted, which may be seen as negative impact. Astudy in the United States has concluded that the effectiveness of liners in protecting theenvironment is limited because of their unreliability and the difficulty in inspecting or testingtheir integrity. Also, there are few releases that would be contained by such liners, andmoreover, they are expensive to install. Because of this, it was concluded that otherpreventative measures are more effective in protecting the environment and are more cost-effective in the long run.
ApplicabilityIn some cases, retrofitting may not be possible.
EconomicsSome refineries have quoted the total cost for installing concrete paving under 6 big tanks atEUR 1.3 millions (0.22 per tank), the cost of sealing bund dike walls with asphalt (around 10tanks) at EUR 0.8 million, and the cost of concrete paving bunds at 70 - 140 EUR/m2. Onerefinery quoted the cost of installing 200m of impermeable HDPE barrier along the siteboundary at 150000 EUR (750 EUR/m).
Driving force for implementationContainment of large spills that may occur from liquid storage tanks is normally regulated bynational laws. In Italy, current legislation foresees for some liquids a volume of the bund lessthan 100 % of the tank volume.
Reference literature[147, HMIP UK, 1995]
Techniques to consider in the determination of BAT Chapter 4
Mineral Oil and Gas Refineries 311
4.21.10 Reduce the generation of tank bottoms
DescriptionMinimization of tank bottoms can be carried out through careful separation of the oil and waterremaining in the tank bottom. Filters and centrifuges can also be used to recover the oil forrecycling. Other techniques to consider are the installation of side entry or jet mixers on tanks orthe use of chemicals. This means that basic sediment and water is passed on to the receivingrefineries.
Achieved environmental benefitsTank bottoms from crude oil storage tanks constitute a large percentage of refinery solid wasteand pose a particularly difficult disposal problem due to the presence of heavy metals. Tankbottoms are comprised of heavy hydrocarbons, solids, water, rust and scale.
Cross-media effectsPassing the sediments and water from the crude oil tanks to the refinery means that they willmost probably show up in the desalter.
Reference literature[147, HMIP UK, 1995]
4.21.11 Tank cleaning procedures
DescriptionFor routine internal tank inspections and for the purpose of repair, crude oil and product tankshave to be emptied, cleaned and rendered gas-free. A technique to clean tank bottoms include todissolve the majority of the tank bottoms (>90%) with hot diesel fraction at temperatures ofaround 50 ºC where it disolve most of the tank bottoms and they can be blended after filtrationto the crude tanks.
Achieved environmental benefitsEmissions during the cleaning of tanks arise during natural or mechanical ventilation. A varietyof cleaning methods has been developed for the cleaning of crude oil tanks. Knowledge of thetechnology for cleaning crude oil tanks has improved, so that with primary measures emissionsof VOC less than 0.5 kg/m2 tank bottom area can be achieved. With secondary measures, e.g.installation of mobile flares, which are currently under development for cleaning crude oil andproduct tanks, further emission reductions of VOC of up to 90 % can be expected.
Cross-media effectsIf the refinery operates its own sludge incineration plant, cleaning residues can supplied to it.
Operational dataThe emission arising during the cleaning of crude oil tanks and the reduction of these emissionsare exhaustively described in [302, UBA Germany, 2000]. The use of hot diesel to clean up thetank bottoms require heating.
ApplicabilityFully applicable.
Driving force for implementationReduce VOC emissions and tank bottoms.
Example plantsExamples exist of applications in many EU+ refineries and tank farms.
Chapter 4 Techniques to consider in the determination of BAT
312 Mineral Oil and Gas Refineries
Reference literature[117, VDI, 2000], [316, TWG, 2000], [302, UBA Germany, 2000], [122, REPSOL, 2001]
4.21.12 Colour of tanks
DescriptionIt is preferable to paint tanks containing volatile materials in a light colour to prevent a)increasing the evaporation because of increased product temperature and b) increasing thebreathing rate of fixed roof tanks.
Achieved environmental benefitsReduction of VOC emissions.
Cross-media effectsPainting in light colours can result in tanks being more "visible" which can have negative visualeffect.
ApplicabilityPainting of the roof and the upper part of the shell of a tank in the middle of a tank farm can beas effective as painting the entire tank.
Driving force for implementationAlso a requirement of 94/63/EC for gasoline tanks, except there are derogations for visuallysensitive areas.
Reference literature[262, Jansson, 2000], [268, TWG, 2001], [302, UBA Germany, 2000]
4.21.13 Other good storage practices
DescriptionProper material handling and storage minimises the possibility of spills, leaks and other losseswhich result in waste, air emissions and emissions to water. Some good storage practices are:
• use larger containers instead of drums. Larger containers are reusable when equippedfor top and bottom discharge, whereas drums have to be recycled or disposed of aswaste. Bulk storage can minimize the chances of leaks and spills as compared to drums.Applicability: Safe disposal of un-refillable large containers can be a problem.
• reduce generation of empty oil drums. Bulk purchasing (via tank truck) of frequentlyused oils and filling tote bins as intermediate storage. Personnel could then transfer theoils from the tote bin to reusable drums, buckets, or other containers. This would reducethe generation of empty drums and their associated handling costs
• storage of drums off the floor to prevent corrosion through spills or concrete 'sweating'• keeping containers closed except when removing material• practise corrosion monitoring, prevention and control in underground piping and tank
bottoms (Related with 4.21.8 and 4.21.22)• tanks for storage of ballast water may cause large VOC emissions. They can be
therefore equipped with a floating roof. Those tanks are also relevant as equalizingtanks for the waste water treatment system
• vents from sulphur storage tanks to pass to sour gas or other arrestment systems• vent collection and ducting from tank farms to central abatement sytems.• install self-sealing hose connections or implement line draining procedures• install barriers and/or interlock systems to prevent damage to equipment from the
accidental movement or driving away of vehicles (road or rail tank cars) during loadingoperations
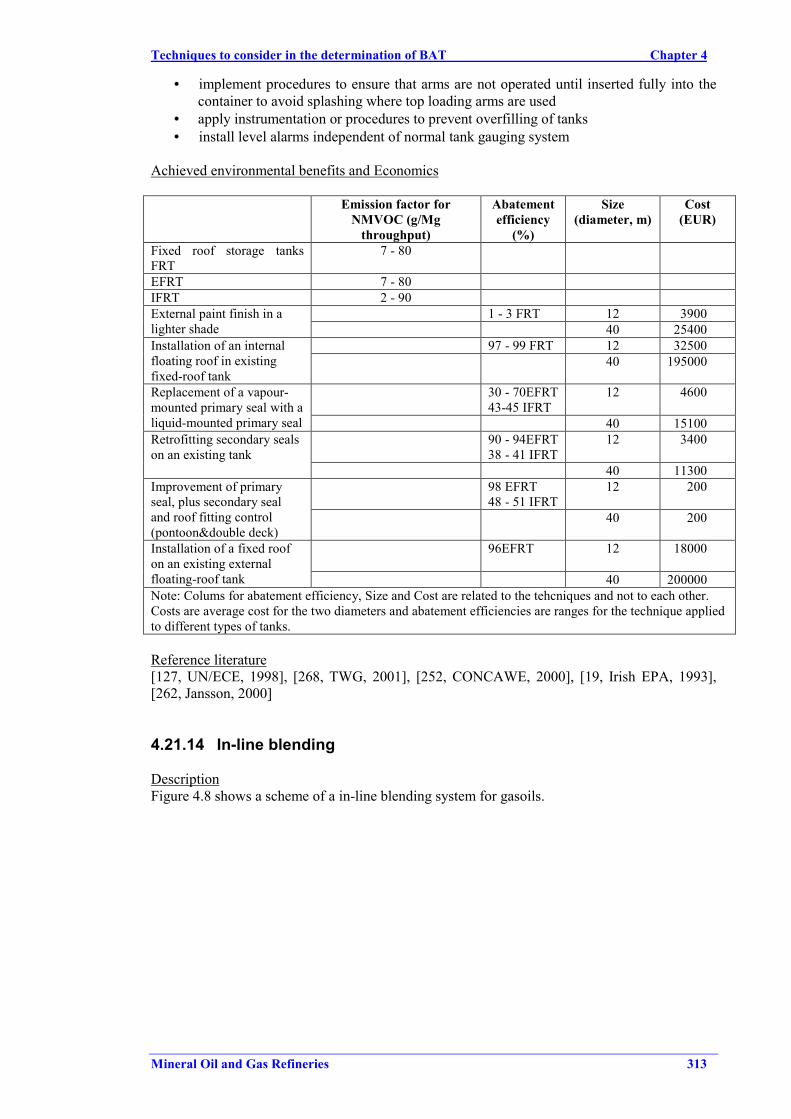
Techniques to consider in the determination of BAT Chapter 4
Mineral Oil and Gas Refineries 313
• implement procedures to ensure that arms are not operated until inserted fully into thecontainer to avoid splashing where top loading arms are used
• apply instrumentation or procedures to prevent overfilling of tanks• install level alarms independent of normal tank gauging system
Achieved environmental benefits and Economics
Emission factor forNMVOC (g/Mg
throughput)
Abatementefficiency
(%)
Size(diameter, m)
Cost(EUR)
Fixed roof storage tanksFRT
7 - 80
EFRT 7 - 80IFRT 2 - 90
1 - 3 FRT 12 3900External paint finish in alighter shade 40 25400
97 - 99 FRT 12 32500Installation of an internalfloating roof in existingfixed-roof tank
40 195000
30 - 70EFRT43-45 IFRT
12 4600Replacement of a vapour-mounted primary seal with aliquid-mounted primary seal 40 15100
90 - 94EFRT38 - 41 IFRT
12 3400Retrofitting secondary sealson an existing tank
40 1130098 EFRT48 - 51 IFRT
12 200Improvement of primaryseal, plus secondary sealand roof fitting control(pontoon&double deck)
40 200
96EFRT 12 18000Installation of a fixed roofon an existing externalfloating-roof tank 40 200000Note: Colums for abatement efficiency, Size and Cost are related to the tehcniques and not to each other.Costs are average cost for the two diameters and abatement efficiencies are ranges for the technique appliedto different types of tanks.
Reference literature[127, UN/ECE, 1998], [268, TWG, 2001], [252, CONCAWE, 2000], [19, Irish EPA, 1993],[262, Jansson, 2000]
4.21.14 In-line blending
DescriptionFigure 4.8 shows a scheme of a in-line blending system for gasoils.
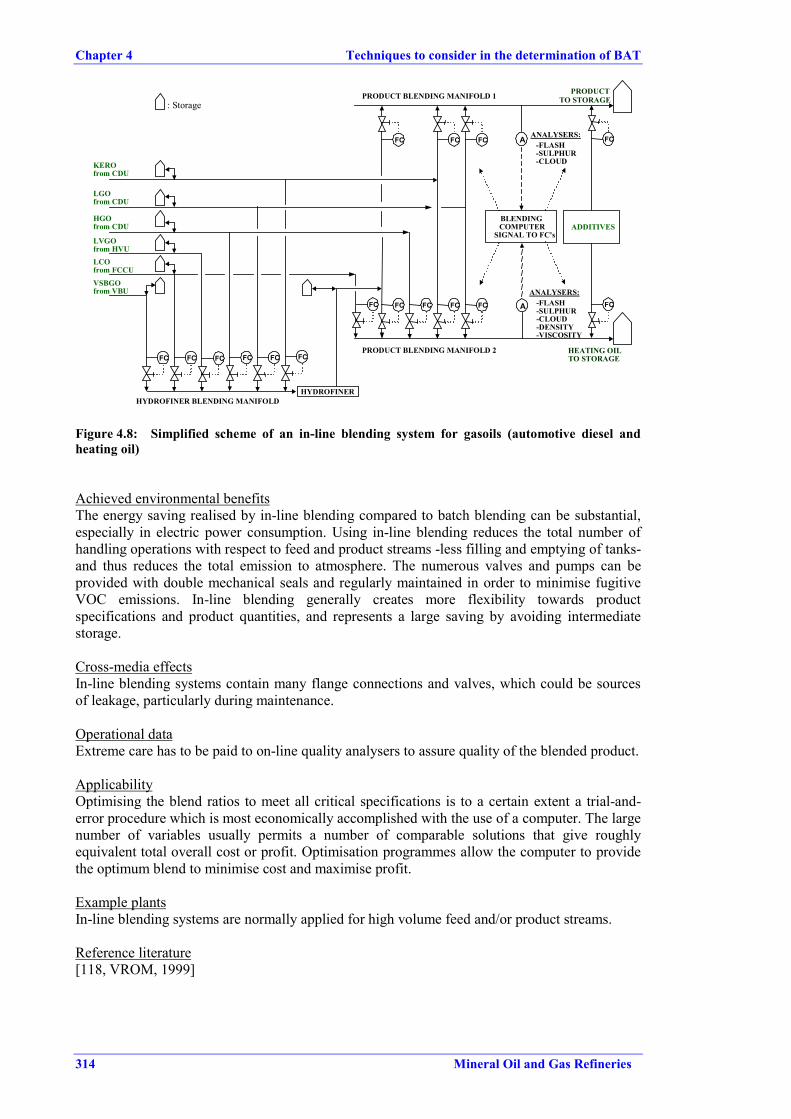
Chapter 4 Techniques to consider in the determination of BAT
314 Mineral Oil and Gas Refineries
KEROfrom CDU
LGOfrom CDU
HGOfrom CDU
PRODUCTTO STORAGE
HEATING OILTO STORAGE
PRODUCT BLENDING MANIFOLD 1
PRODUCT BLENDING MANIFOLD 2
FC FC FC
FC FC
LVGOfrom HVULCOfrom FCCU
VSBGOfrom VBU
ADDITIVES
FC
FC
BLENDINGCOMPUTER
SIGNAL TO FC's
FC
FC
FC
FC FC FC FC FC FC
HYDROFINER BLENDING MANIFOLDHYDROFINER
A
A ANALYSERS:-FLASH-SULPHUR-CLOUD
ANALYSERS:-FLASH-SULPHUR-CLOUD-DENSITY-VISCOSITY
: Storage
Figure 4.8: Simplified scheme of an in-line blending system for gasoils (automotive diesel andheating oil)
Achieved environmental benefitsThe energy saving realised by in-line blending compared to batch blending can be substantial,especially in electric power consumption. Using in-line blending reduces the total number ofhandling operations with respect to feed and product streams -less filling and emptying of tanks-and thus reduces the total emission to atmosphere. The numerous valves and pumps can beprovided with double mechanical seals and regularly maintained in order to minimise fugitiveVOC emissions. In-line blending generally creates more flexibility towards productspecifications and product quantities, and represents a large saving by avoiding intermediatestorage.
Cross-media effectsIn-line blending systems contain many flange connections and valves, which could be sourcesof leakage, particularly during maintenance.
Operational dataExtreme care has to be paid to on-line quality analysers to assure quality of the blended product.
ApplicabilityOptimising the blend ratios to meet all critical specifications is to a certain extent a trial-and-error procedure which is most economically accomplished with the use of a computer. The largenumber of variables usually permits a number of comparable solutions that give roughlyequivalent total overall cost or profit. Optimisation programmes allow the computer to providethe optimum blend to minimise cost and maximise profit.
Example plantsIn-line blending systems are normally applied for high volume feed and/or product streams.
Reference literature[118, VROM, 1999]
Techniques to consider in the determination of BAT Chapter 4
Mineral Oil and Gas Refineries 315
4.21.15 Batch blending
DescriptionSee Section 2.21
ApplicabilityThe reasons for batch blending are the minimum storage requirements for strategic reasons,fiscal and tax control, operating flexibility and tank dimensions.
Example plantsFor a variety of reasons given under applicability, batch blending of feed and product is stilldone to a certain extent.
4.21.16 Vapour recovery
Vapour recovery/destruction systems and vapour return during loading applied to storage areincluded in Section 4.23.6.2.
DescriptionVapour recovery systems, used for the reduction of hydrocarbon emissions from storage andloading facilities of gasoline and other highly volatile products. Displaced vapour containingair/gas from loading of volatile products (such as gasoline or products of similar vapourpressure) into vessels and barges should ideally be recycled or routed through a vapour recoveryunit. The pressure swing adsorption technique is one of a number of techniques to recoverchemical compounds from vapour streams. Examples of these vapour streams are process vents,refinery fuel gas, flare or incinerator feed streams. The units can recover organic compoundsfrom gaseous streams. More information in Section 4.23.6.
Achieved environmental benefitsIt has been estimated that VOC emissions from barge loading can be reduced by 98 % byinstalling a marine vapour loss control system. A vapour recovery unit used in fixed tanks canreduce VOC emissions by 93 - 99 % (down to 10 g/Nm3). Table 4.35 provides some data on theefficiency and environmental performance of vapour recovery units
VOC recovery technique Emission reduction (%) down to (g/Nm3)Single stage 93 - 99 10
Lean oil absorption 90 - 95Activated carbon as adsorbent 95 - 99
Condensation with liquid nitrogen 90Membrane 99
Double stage near 100 % 0.10 - 0.15
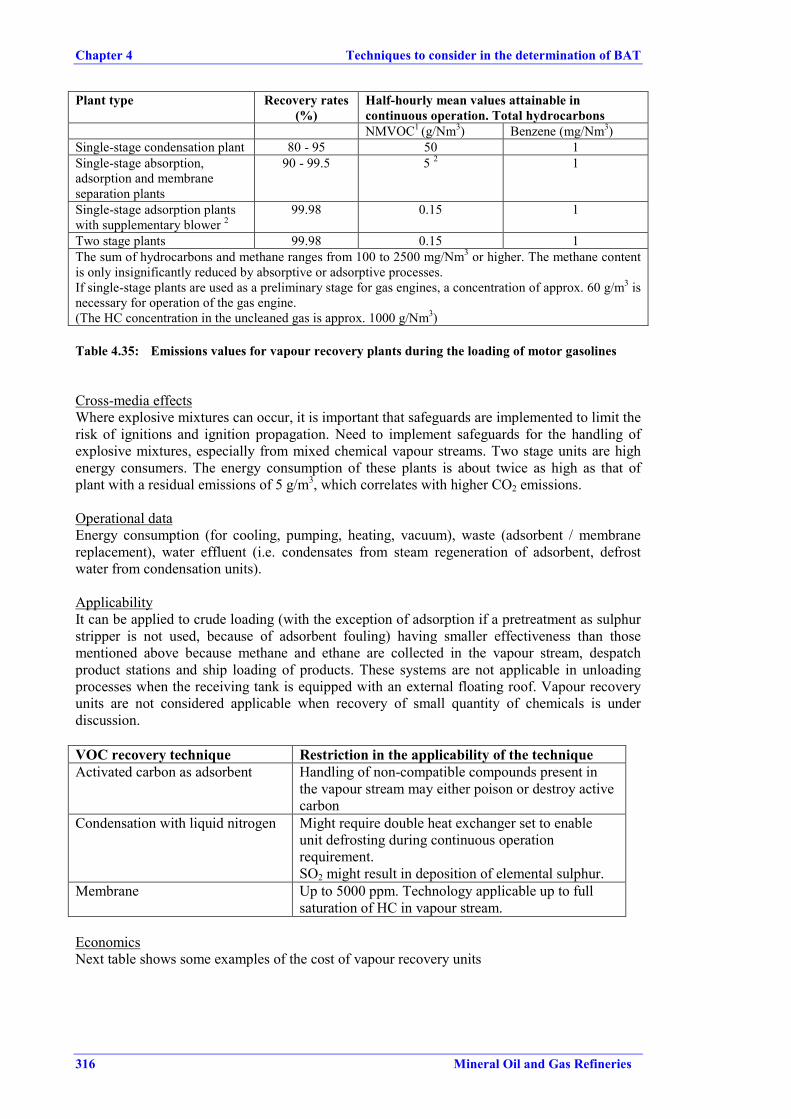
Chapter 4 Techniques to consider in the determination of BAT
316 Mineral Oil and Gas Refineries
Plant type Recovery rates(%)
Half-hourly mean values attainable incontinuous operation. Total hydrocarbonsNMVOC1 (g/Nm3) Benzene (mg/Nm3)
Single-stage condensation plant 80 - 95 50 1Single-stage absorption,adsorption and membraneseparation plants
90 - 99.5 5 2 1
Single-stage adsorption plantswith supplementary blower 2
99.98 0.15 1
Two stage plants 99.98 0.15 1The sum of hydrocarbons and methane ranges from 100 to 2500 mg/Nm3 or higher. The methane contentis only insignificantly reduced by absorptive or adsorptive processes.If single-stage plants are used as a preliminary stage for gas engines, a concentration of approx. 60 g/m3 isnecessary for operation of the gas engine.(The HC concentration in the uncleaned gas is approx. 1000 g/Nm3)
Table 4.35: Emissions values for vapour recovery plants during the loading of motor gasolines
Cross-media effectsWhere explosive mixtures can occur, it is important that safeguards are implemented to limit therisk of ignitions and ignition propagation. Need to implement safeguards for the handling ofexplosive mixtures, especially from mixed chemical vapour streams. Two stage units are highenergy consumers. The energy consumption of these plants is about twice as high as that ofplant with a residual emissions of 5 g/m3, which correlates with higher CO2 emissions.
Operational dataEnergy consumption (for cooling, pumping, heating, vacuum), waste (adsorbent / membranereplacement), water effluent (i.e. condensates from steam regeneration of adsorbent, defrostwater from condensation units).
ApplicabilityIt can be applied to crude loading (with the exception of adsorption if a pretreatment as sulphurstripper is not used, because of adsorbent fouling) having smaller effectiveness than thosementioned above because methane and ethane are collected in the vapour stream, despatchproduct stations and ship loading of products. These systems are not applicable in unloadingprocesses when the receiving tank is equipped with an external floating roof. Vapour recoveryunits are not considered applicable when recovery of small quantity of chemicals is underdiscussion.
VOC recovery technique Restriction in the applicability of the techniqueActivated carbon as adsorbent Handling of non-compatible compounds present in
the vapour stream may either poison or destroy activecarbon
Condensation with liquid nitrogen Might require double heat exchanger set to enableunit defrosting during continuous operationrequirement.SO2 might result in deposition of elemental sulphur.
Membrane Up to 5000 ppm. Technology applicable up to fullsaturation of HC in vapour stream.
EconomicsNext table shows some examples of the cost of vapour recovery units
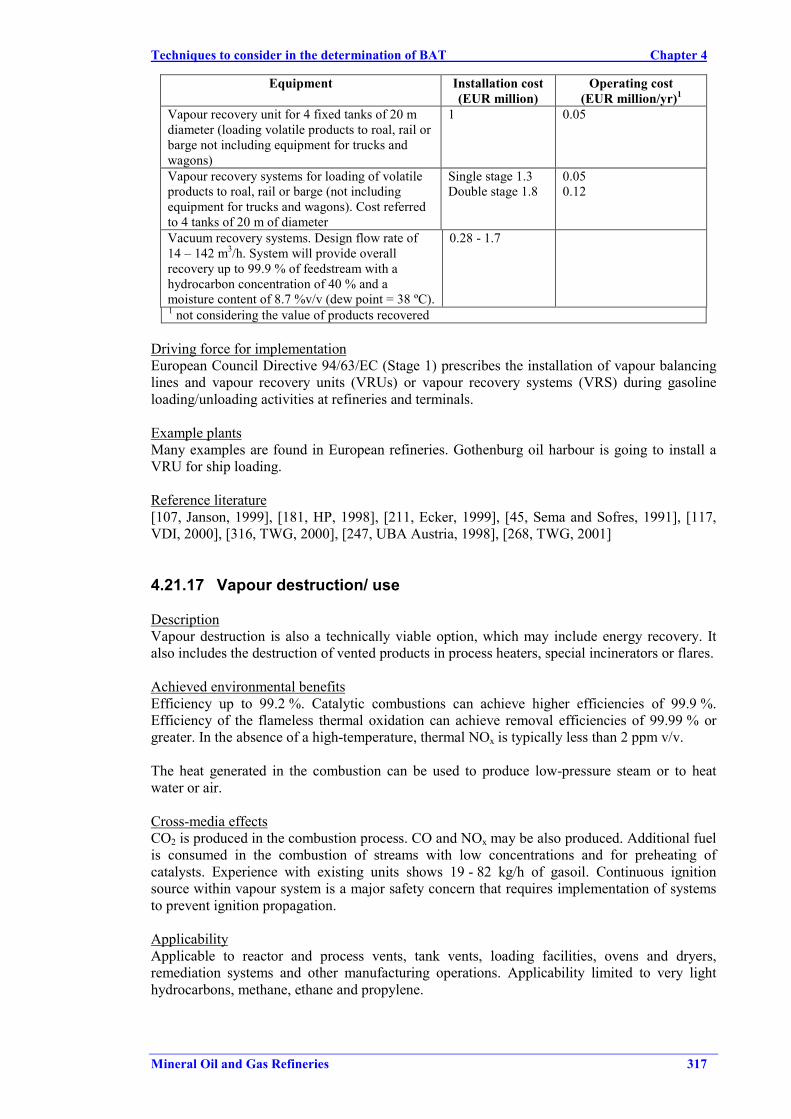
Techniques to consider in the determination of BAT Chapter 4
Mineral Oil and Gas Refineries 317
Equipment Installation cost(EUR million)
Operating cost(EUR million/yr)1
Vapour recovery unit for 4 fixed tanks of 20 mdiameter (loading volatile products to roal, rail orbarge not including equipment for trucks andwagons)
1 0.05
Vapour recovery systems for loading of volatileproducts to roal, rail or barge (not includingequipment for trucks and wagons). Cost referredto 4 tanks of 20 m of diameter
Single stage 1.3Double stage 1.8
0.050.12
Vacuum recovery systems. Design flow rate of14 – 142 m3/h. System will provide overallrecovery up to 99.9 % of feedstream with ahydrocarbon concentration of 40 % and amoisture content of 8.7 %v/v (dew point = 38 ºC).
0.28 - 1.7
1 not considering the value of products recovered
Driving force for implementationEuropean Council Directive 94/63/EC (Stage 1) prescribes the installation of vapour balancinglines and vapour recovery units (VRUs) or vapour recovery systems (VRS) during gasolineloading/unloading activities at refineries and terminals.
Example plantsMany examples are found in European refineries. Gothenburg oil harbour is going to install aVRU for ship loading.
Reference literature[107, Janson, 1999], [181, HP, 1998], [211, Ecker, 1999], [45, Sema and Sofres, 1991], [117,VDI, 2000], [316, TWG, 2000], [247, UBA Austria, 1998], [268, TWG, 2001]
4.21.17 Vapour destruction/ use
DescriptionVapour destruction is also a technically viable option, which may include energy recovery. Italso includes the destruction of vented products in process heaters, special incinerators or flares.
Achieved environmental benefitsEfficiency up to 99.2 %. Catalytic combustions can achieve higher efficiencies of 99.9 %.Efficiency of the flameless thermal oxidation can achieve removal efficiencies of 99.99 % orgreater. In the absence of a high-temperature, thermal NOx is typically less than 2 ppm v/v.
The heat generated in the combustion can be used to produce low-pressure steam or to heatwater or air.
Cross-media effectsCO2 is produced in the combustion process. CO and NOx may be also produced. Additional fuelis consumed in the combustion of streams with low concentrations and for preheating ofcatalysts. Experience with existing units shows 19 - 82 kg/h of gasoil. Continuous ignitionsource within vapour system is a major safety concern that requires implementation of systemsto prevent ignition propagation.
ApplicabilityApplicable to reactor and process vents, tank vents, loading facilities, ovens and dryers,remediation systems and other manufacturing operations. Applicability limited to very lighthydrocarbons, methane, ethane and propylene.
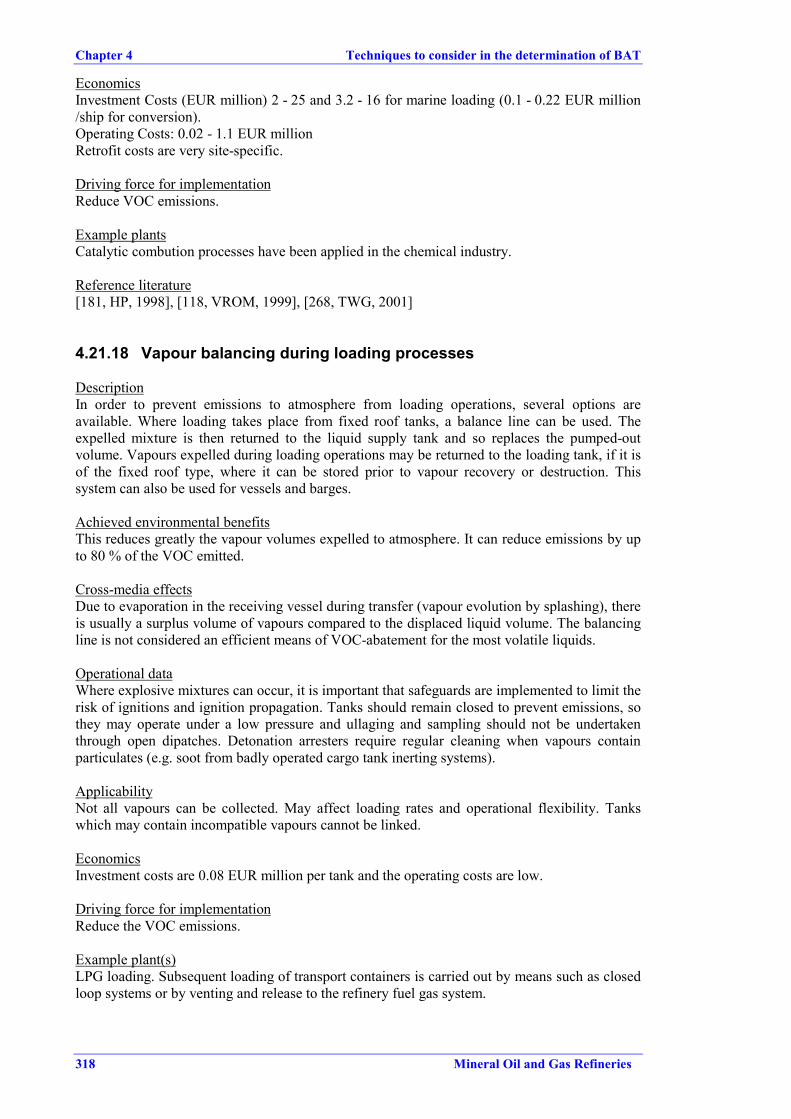
Chapter 4 Techniques to consider in the determination of BAT
318 Mineral Oil and Gas Refineries
EconomicsInvestment Costs (EUR million) 2 - 25 and 3.2 - 16 for marine loading (0.1 - 0.22 EUR million/ship for conversion).Operating Costs: 0.02 - 1.1 EUR millionRetrofit costs are very site-specific.
Driving force for implementationReduce VOC emissions.
Example plantsCatalytic combution processes have been applied in the chemical industry.
Reference literature[181, HP, 1998], [118, VROM, 1999], [268, TWG, 2001]
4.21.18 Vapour balancing during loading processes
DescriptionIn order to prevent emissions to atmosphere from loading operations, several options areavailable. Where loading takes place from fixed roof tanks, a balance line can be used. Theexpelled mixture is then returned to the liquid supply tank and so replaces the pumped-outvolume. Vapours expelled during loading operations may be returned to the loading tank, if it isof the fixed roof type, where it can be stored prior to vapour recovery or destruction. Thissystem can also be used for vessels and barges.
Achieved environmental benefitsThis reduces greatly the vapour volumes expelled to atmosphere. It can reduce emissions by upto 80 % of the VOC emitted.
Cross-media effectsDue to evaporation in the receiving vessel during transfer (vapour evolution by splashing), thereis usually a surplus volume of vapours compared to the displaced liquid volume. The balancingline is not considered an efficient means of VOC-abatement for the most volatile liquids.
Operational dataWhere explosive mixtures can occur, it is important that safeguards are implemented to limit therisk of ignitions and ignition propagation. Tanks should remain closed to prevent emissions, sothey may operate under a low pressure and ullaging and sampling should not be undertakenthrough open dipatches. Detonation arresters require regular cleaning when vapours containparticulates (e.g. soot from badly operated cargo tank inerting systems).
ApplicabilityNot all vapours can be collected. May affect loading rates and operational flexibility. Tankswhich may contain incompatible vapours cannot be linked.
EconomicsInvestment costs are 0.08 EUR million per tank and the operating costs are low.
Driving force for implementationReduce the VOC emissions.
Example plant(s)LPG loading. Subsequent loading of transport containers is carried out by means such as closedloop systems or by venting and release to the refinery fuel gas system.
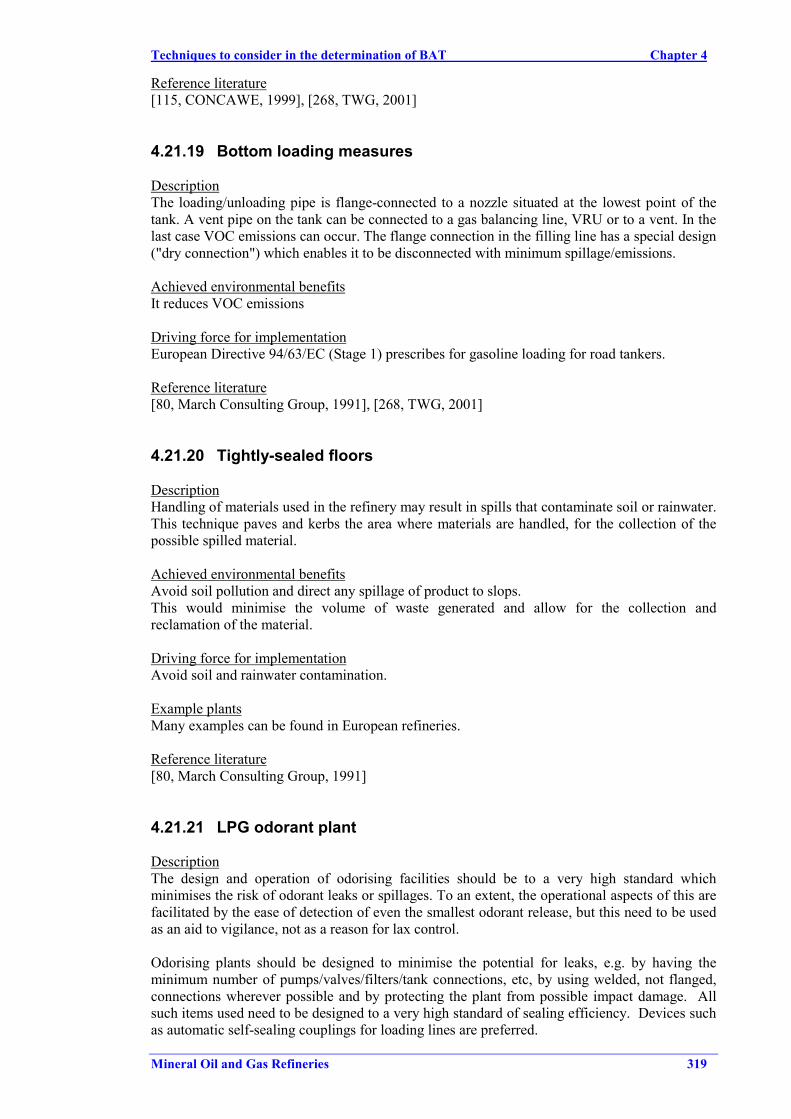
Techniques to consider in the determination of BAT Chapter 4
Mineral Oil and Gas Refineries 319
Reference literature[115, CONCAWE, 1999], [268, TWG, 2001]
4.21.19 Bottom loading measures
DescriptionThe loading/unloading pipe is flange-connected to a nozzle situated at the lowest point of thetank. A vent pipe on the tank can be connected to a gas balancing line, VRU or to a vent. In thelast case VOC emissions can occur. The flange connection in the filling line has a special design("dry connection") which enables it to be disconnected with minimum spillage/emissions.
Achieved environmental benefitsIt reduces VOC emissions
Driving force for implementationEuropean Directive 94/63/EC (Stage 1) prescribes for gasoline loading for road tankers.
Reference literature[80, March Consulting Group, 1991], [268, TWG, 2001]
4.21.20 Tightly-sealed floors
DescriptionHandling of materials used in the refinery may result in spills that contaminate soil or rainwater.This technique paves and kerbs the area where materials are handled, for the collection of thepossible spilled material.
Achieved environmental benefitsAvoid soil pollution and direct any spillage of product to slops.This would minimise the volume of waste generated and allow for the collection andreclamation of the material.
Driving force for implementationAvoid soil and rainwater contamination.
Example plantsMany examples can be found in European refineries.
Reference literature[80, March Consulting Group, 1991]
4.21.21 LPG odorant plant
DescriptionThe design and operation of odorising facilities should be to a very high standard whichminimises the risk of odorant leaks or spillages. To an extent, the operational aspects of this arefacilitated by the ease of detection of even the smallest odorant release, but this need to be usedas an aid to vigilance, not as a reason for lax control.
Odorising plants should be designed to minimise the potential for leaks, e.g. by having theminimum number of pumps/valves/filters/tank connections, etc, by using welded, not flanged,connections wherever possible and by protecting the plant from possible impact damage. Allsuch items used need to be designed to a very high standard of sealing efficiency. Devices suchas automatic self-sealing couplings for loading lines are preferred.
Chapter 4 Techniques to consider in the determination of BAT
320 Mineral Oil and Gas Refineries
Plants should be designed to deal with the high vapour pressure of odorants and should use inertor pressure controlled natural gas blanketing of the vapour spaces above stored odorant. Duringdeliveries into tanks any displaced vapour need to be returned to the delivery vehicle, adsorbedon activated carbon or incinerated. The use of demountable semi-bulk containers avoids thegeneration of displaced vapours and is preferred where appropriate.
Achieved environmental benefitsIn view of the nature and power of the odorants used there should be no normal release ofodorant to any environmental medium.
Reference literature[18, Irish EPA, 1992]
4.21.22 Overground pipelines and transfer lines
DescriptionIn overground pipelines is easier to detect leakings
Achieved environmental benefitsDecrease the soil contamination
ApplicabilityIts implementation is easier in new installations.
EconomicsThe replacement of existing underground pipelines is typically very expensive.
Reference literature[19, Irish EPA, 1993]
Techniques to consider in the determination of BAT Chapter 4
Mineral Oil and Gas Refineries 321
4.22 Visbreaking
4.22.1 Deep thermal conversion
DescriptionDeep thermal conversion bridges the gap between visbreaking and coking. It maximizes yieldsof stable distillates and produces a stable residue, called liquid coke.
Achieved environmental benefitsIncrease the performance of visbreaking.
Cross-media effectsIncreased energy consumption.
EconomicsThe investment amounts to 9120 to 11300 EUR/m3 installed, excluding treatment facilities anddepending on the capacity and configuration (basis: 1998)
Reference literature[212, Hydrocarbon processing, 1998], [316, TWG, 2000]
4.22.2 Hydrovisbreaking
Achieved environmental benefitsA modern technology, which increases the conversion rate of the feed by addition of H-donatorsand water without reducing the stability of the process.
EconomicsInvestment (basis: 750 kt/yr of topped heavy Canadian crude; battery limits including desalting,topping and engineering; 1994 USA$ Gulf Coast)
Process alternative Normal visbreaker Hydro visbreakerEUR per t/yr 85000 115000Utilities, typical per m3
Fuel oil fired (80 % effic.) kg 15.1 15.1Electricity, kWh 1.9 12.0Steam consumed (produced), kg (15.1) 30.2Water, process, m3 nil nilHydrogen consumption, Nm3 - 30.2
Example plantsThis technology was tested in a 2 Mt/yr visbreaker in a refinery in Curaçao.
Reference literature[212, Hydrocarbon processing, 1998], [250, Winter, 2000]
4.22.3 Soaker visbreakers
DescriptionIn this process, a soaker drum is added after the furnace. So the cracking takes place at lowerfurnace outlet temperatures, and longer residence time.
Achieved environmental benefitsThe product yields and properties are similar but the soaker operation with its lower furnaceoutlet temperatures has the advantages of lower energy consumption (30 – 35 %) and longer run
Chapter 4 Techniques to consider in the determination of BAT
322 Mineral Oil and Gas Refineries
times before shutting down to remove coke from the furnace tubes (run times of 6 - 18 monthsversus 3 - 6 months in coil cracking).
Cross-media effectsThe above apparent advantage to reduce the number of clean-ups for soaker visbreakers is atleast partially balanced by the greater difficulty in cleaning the soaking drum.
Operational dataRun times of 3 - 6 months are common for furnace visbreakers and 6 - 18 months for soakervisbreakers. Fuel consumption is around 11 kg FOE/t. Power and steam consumption is similarto the coil one. Operating temperature is 400 - 420 ºC.
Example plantsSome soaker visbreakers exists in European refineries.
Reference literature[297, Italy, 2000], [268, TWG, 2001]
4.22.4 Sour gas and waste water management
DescriptionThe gas generated in the visbreaking may be sour and contain sulphur compounds, in whichcase a gas sweetening operation, typically amine scrubbing, should be applied before the gas isrecovered into products or used as refinery fuel gas. Visbreaking gas, apart from being aminescrubbed to remove H2S, is further treated to remove approximately 400 to 600 mg/Nm3 ofmercaptan sulphur (depending on feed) in order to meet the refinery fuel gas sulphur-contentspecification.The aqueous condensate is usually sour, and should pass to the sour water stripper in anenclosed system.
Achieved environmental benefitsReduce sulphur content of products.
Cross-media effectsNeed for chemicals and utilities to run the processes.
Driving force for implementationSulphur specifications of the products.
Example plantsThose techniques are applied in many refineries.
Reference literature[316, TWG, 2000]
4.22.5 Reduction of coke formation in visbreakers
DescriptionDuring the thermal cracking some coke formation is produced and deposits in the furnace tubes.The coke should be cleaned when necessary. It exist in the market additives to control thesodium content within the feedstock. Also the control of the addition of caustics to the feedstockupstream can be also used.
Achieved environmental benefitsReduction of the coke formation and as consequence reduction of cleaning waste.

Techniques to consider in the determination of BAT Chapter 4
Mineral Oil and Gas Refineries 323
Driving force for implementationThis technique is typically applied to prevent cleaning.
Reference literature[268, TWG, 2001]
Chapter 4 Techniques to consider in the determination of BAT
324 Mineral Oil and Gas Refineries
4.23 Waste gas treatments
This section together with the following two sections (namely Sections 4.24 and 4.25) aredealing with the end-of-pipe processes that appear in a refinery. Deeper information about thetechniques included in this section and next one can be found in the Common waste water andwastegas treatments BREF. The reason why those techniques are appearing here is to give anoverall description of the techniques and to avoid repetition. Description of end-of-pipetechniques does not appear in the previous sections. In this Sections (23 and 24), generalinformation on environmental benefits, cross-media effects, operational data, applicability isdescribed here. However, the application of those techniques to a certain activity refinery mayvary its operational data, its cost, its performance etc. Consequently the data included in thesesections is broader and more general than the one appearing within the activities.Complementing those techniques that may appear within the production activities, this sectionand the next one also contains end-of-pipe processes applied and that are techniques to considerin the determination of BAT for refineries. Under this category folds the sulphur recovery units,flares, amine treatment or the waste water treatments. Those techniques are only discussed here.
4.23.1 CO abatement techniques
DescriptionCO boilers and catalyst reduction of CO (and NOx). Good primary measures for the COreduction are:• good operation control• constant delivery of liquid fuel in the secondary heating• good mixing of the exhaust gases• catalytic afterburning• catalysts with oxidation promoters.
Achieved environmental benefitsReduction of CO emissions. Emissions after the CO boiler: < 100 mg/Nm3. In the case ofconventional firings a CO concentration below 50 mg/Nm3 is achievable at temperatures above800 °C, at sufficient air delivery and sufficient retention time.
ApplicabilityFCC and in heavy residues fired. (Section 4.10.4.9 and 4.5.5)
Reference literature[316, TWG, 2000]
4.23.2 CO2 emission control options
DescriptionUnlike SO2, NOx or particulates treatment of flue gases, as a feasible abatement technology forCO2 is not available. CO2 separation techniques are available but the problem is the storage andthe recycling of the CO2. Options for the refiner to reduce CO2 emissions are:I. effective energy management (topic discussed in Section 4.10.1) including:
• improving heat exchange between refinery streams• integration of refinery processes to avoid intermediate cooling of components (e.g.
4.19.1 Progressive distillation unit)• recovery of waste gases and their use as fuels (e.g. flare gas recovery)• use of the heat content of flue gases.
II. use of fuels with high hydrogen contents (topic discussed in Section 4.10.2)III. effective energy production techniques (see Section 4.10.3). It means the highest
possible recovery of energy from fuel combustion.
Techniques to consider in the determination of BAT Chapter 4
Mineral Oil and Gas Refineries 325
Achieved environmental benefitsReduction of CO2 emissions
Cross-media effectsUse of fuels with high hydrogen contents reduce CO2 emissions from the refineries but overallwill not reduce CO2 as these fuels will not then be available for other uses.
Operational dataRational energy use needs good operation to maximise heat recovery and process control (e.g.:O2 excess, heat balances between reflux, product temperature to storage, equipment survey andcleaning). To get optimum results repeated operator training and clear instructions arenecessary.
Reference literature[252, CONCAWE, 2000], [268, TWG, 2001]
4.23.3 NOx abatement techniques
The NOx emission level of an oil refinery or a natural gas plant is influenced by the refiningscheme, the type of fuels used and the abatement techniques implemented. As the number ofemission sources and their contribution to the overall emission level may vary greatly, one ofthe first techniques to consider is the precise quantification and characterisation of the emissionsources in each specific case. For more information see Section 3.26.
4.23.3.1 Low-temperature NOx oxidation
DescriptionThe low-temperature oxidation process injects ozone into a flue gas stream at optimaltemperatures below 200 ºC, to oxidise insoluble NO and NO2 to highly soluble N2O5. The N2O5is removed in a wet scrubber by forming a dilute nitric acid waste water that can be used inplant processes or neutralised for release. General information about this technique can be foundin Waste water and wastegas BREF [312, EIPPCB, 2001]
Achieved environmental benefitsIt can achieve 90 - 95 % removal of NOx, with consistent NOx levels as low as 5 ppm.Additional benefits are the heat-recovery fuel savings. The entire process is controlled toproduce no secondary gaseous emissions. Because ozone is used as oxidant agent, emissions ofCO, VOC and ammonia are also reduced.
Cross-media effectsOzone should be produced on site, on demand, from stored O2. Risk of ozone slip. The systemcan increase nitrate concentration in the waste water.
Operational dataThe use of ozone and the low optimal temperatures of the process provide stable treatmentconditions. Energy consumption for the production of ozone range from 7 - 10 MJ/kg (2 – 2.8kWh/kg) of ozone produced with a concentration of 1-3 % w/w with dry oxygen feed.Temperature should be below 160 ºC to minimise ozone decomposition. Heavy particulateladen fuels may require additional equipment.
ApplicabilityIt can be used as a stand-alone treatment system or can follow other combustion modificationsand post-combustion treatment systems, such as low-NOx burners, SCR or SOx removal, as afinal polish step. The process can be used either as a “stand alone”treatment system or as a
Chapter 4 Techniques to consider in the determination of BAT
326 Mineral Oil and Gas Refineries
retrofit to existing plant. It can also be used as a polishing system to other NOx removaltechnologies and for the treatment of ammonia slips.
EconomicsIt requires low maintenance and low operator interface. The relative capital cost and operatingcosts given by technology providers claim that are equal to, or less than SCR-type systems.
Example plantsThe process is in use on USA commercial installation for sectors as acid pickling, steam boilersand coal fired boilers. A demonstration is currently planned on a refinery FCCU.
Driving force for implementationReduce the NOx emissions.
Reference literature[181, HP, 1998], [344, Crowther, 2001], [268, TWG, 2001]
4.23.3.2 Selective Non-Catalytic Reduction (SNCR)
DescriptionSNCR is a non-catalytic process for removing oxides of nitrogen from the flue gas by gas phasereaction of ammonia or urea at high temperature. General information about this technique canbe found in Waste water and wastegas BREF [312, EIPPCB, 2001]
Achieved environmental benefitsReductions of 40 - 70 % can be achieved giving values of less than 200 mg/Nm3 by the use ofthis technique. Higher reduction figures (up to 80 %) can only be achieved under optimalconditions.
Cross-media effectsAmmonia injection produces significantly less N2O and CO emissions than other reagents.When the temperature lower it is needed to reheat-up the flue gas with the consequent use ofenergy. The systems also need the equipment necessary for the storage of ammonia or urea.Disadvantages are also NH3 slip (5 - 40 mg/Nm3) and possible side reactions (N2O). The U.S.EPA identified ammonia as the single largest precursor of fine particulate (2.5 microns in sizeand smaller) air pollution in the country.
Operational dataSNCR process needs to achieve temperatures of 800 ºC to 1200 ºC for efficient conversion.With the injection of hydrogen along with the NH3 and carrier, optimum temperatures can beshifted to as low as 700 ºC. To achieve good mixing, the small amount of reactant is injectedalong with a carrier gas, usually air or steam. The ammonia produced in the sour water stripping(see Section 4.24.2) can be used as denox agent. The effectiveness of this process is verytemperature dependent.
ApplicabilityIt is typically applied to flue gases from heaters and boilers. No or very small spacerequirements. Space requirements are mainly restricted to NH3 storage.
EconomicsCost considerations include the initial capital costs for modifying the furnace or boiler, piping toinject the reactant, the reactant supply system and a recurring cost for ammonia or urea to reactwith the NOx. Cost estimates for the use of an SNCR after a power plant are reported in theSection 4.10.4.6. The following table gives cost effectiveness of the use of SNCR underdifferent conditions
Techniques to consider in the determination of BAT Chapter 4
Mineral Oil and Gas Refineries 327
SNCR on Cost effectiveness EUR/tonne NOxremoved (includes capital charge 15%)
Fired heaters and boilers firing refinery blend gas 2000-25001800-4300
Boilers firing Residual fuel oil 1500-28001500-4300
Fluid catalytic cracking units 1900Details on the conditions are given in Annex IV
Driving force for implementationReduction of nitrogen oxide emissions
Example plantsApplied to FCCs and boilers
Reference literature[211, Ecker, 1999], [302, UBA Germany, 2000], [115, CONCAWE, 1999], [181, HP, 1998],[247, UBA Austria, 1998], [268, TWG, 2001]
4.23.3.3 Selective catalytic reduction (SCR)
DescriptionA further deNOx technique is known as catalytic deNOx. The ammonia vapour is mixed with theflue gas through an injection grid before being passed through a catalyst to complete thereaction. Various catalyst formulations are available for different temperature ranges: zeolitesfor 300 - 500 °C, traditional base metals employed between 200 - 400 °C, for low temperatureapplications 150 - 300 °C metals and activated carbon are used. More information about thistechnique can be found in the Waste gas BREF [312, EIPPCB, 2001]
Achieved environmental benefitsIt is especially suitable for situations where emission standards are strict. With SCR removalefficiencies of 80 to 95 % can be obtained. Residual NOx stack levels of 10 - 20 mg/Nm3 can beobtained by application of SCR in gas fired boilers and furnaces. When firing heavy residuesemissions of < 100 mg/Nm3 (3% O2, half hourly mean value, efficiencies up to 90 %) can beachieved.
Cross-media effectsSCR has some cross-media effects as NH3 slip of less than <2 – 20 mg/Nm3 depending on theapplication and requirements or sulphate aerosols are controllable to very low levels. SCRoperation at the end of its catalyst life may also entail bigger slip of NH3. This means aconstraint in conversion efficiency. The U.S. EPA identified ammonia as the single largestprecursor of fine particulate (2.5 microns in size and smaller) air pollution in the country. N2Ogeneration can occur with some catalysts. At the end of its life, some components of the catalystcan be recycled and the other are dispose.
Operational dataThe ammonia produced in the sour water stripping (see Section 4.24.2) can be used as denoxagent. The catalytic deNOx, process operates at low temperatures (250 ºC to 450 ºC). Operatorand maintenance requirements are low for clean gas applications. More attention is required forapplications where fouling substances like SO3 and soot or dust are present in the off-gas. Thepresence of SO3 will lead to formation of ammonium sulphates, which have a detrimental effecton the activity of the catalyst and lead to fouling of downstream heat exchangers. Howeversulphate deactivation can be avoided with a relevant temperature control. Reactivation of thecatalyst can be executed by heating at 400°C, to counteract fouling a water washing step isgenerally applied. Soot has to be removed by blowing of the catalyst with steam or inert gas
Chapter 4 Techniques to consider in the determination of BAT
328 Mineral Oil and Gas Refineries
(e.g. nitrogen), while a ‘dummy’ layer can optionally be applied for extra protection of thecatalyst. If the flue gas contain particulates containing metals, metal deactivation may occur.The NH3 consumption is directly related to the NOx concentration in the flue gas and amounts toabout 0.4 tonne NH3 per tonne of NOx removed. The amount of ammonia is normally dosify ina 10 % more than the stoquiometric needs. The catalyst has a lifetime of 4 to 7 years for oilfiring, for gas firing 7 to 10 years. The pressure drop of the catalyst bed will lead to a minoramount of additional power consumption from fans in the system or loss of efficiency in case ofa gasturbine application (equivalent to 0.5 - 1 % of the heat-input). Additional fuel in the eventof reheating the flue gas is necessary, corresponding to a loss of energy efficiency of 1 - 2 %.Common safety precautions need to be taken when using pure NH3. To avoid elaborate safetymeasures (required for larger volumes of NH3) the trend is towards using aqueous NH3 or urea.The NH3 storage also varies in size allowing 1 - 3 week operational hold-up.
When a so-called tail-end configuration is preferred (e.g. where the SCR is projected behind awet scrubber, or at the end of a gasfired unit where the flue gas has reached a temperature ofless than 150°C), it may be necessary to reheat the flue gases to have an adequate temperaturefor the reduction reaction. For these applications in-line burners are required. If the requiredtemperature rise is larger than 70 - 100°C heat recuperation by means of a gas-to-gas heatexchanger could be cost-effective.
ApplicabilitySelective catalytic reduction (SCR) has been applied to combustion flue gases or process off-gases (e.g. FCC). The introduction of an SCR-system into an existing installation is a challengedue to space, pressure and temperature problems. Creative solutions can often be found toreduce the retrofit costs. Higher operating temperatures reduce the catalyst size and costs butintroduce retrofit complexity. Lower operating temperatures increase the required catalystvolume and costs but often allow a simple retrofit.
Sofar, predominantly operating temperatures between 200 and 450°C prevail. Thesetemperatures are normally available before the economiser section or the air preheater of aboiler. Gas fired refinery furnaces generally have a stack temperature of 150 - 300°C.Dependent on the flue gas sulphur content a medium (MT) or low temperature (LT) catalystscan be applied in tail-end configuration. Zeolite type catalysts have reached the market place. Inthe USA a number of gas turbines have been fitted with these catalysts, some other applicationsalso exist (the DESONOX process, a combined technique for SO2 and NOx removal, has suchcatalyst). As for oil firing, only MT catalysts can be applied, because of the presence of sulphurand particulates. MT catalysts have been widely applied in coal fired power plantspredominantly at conditions where the flue gas still contain all the fly-ash and SO2 from theboiler. Two other configurations are low dust / high SO2 level and low dust / low SO2 level (tail-end configuration). There is little experience with the use of SCR for units applying vacuumresidue as fuel. However, the power plant of the refinery Mider in Germany uses vacuumresidue, visbreaker residue and FCC-slurry as fuel in its three oil-fired heaters. A SCR-plant inhigh dust configuration is installed after the heaters, cleaning the gas of NOx to concentrationless than 150 mg/Nm3. The particular difference oil firing represent, lies in the nature of its flyash. In contrast to coal, the fly ash is extremely fine (> 90 % fall in the category of PM2.5),though the quantity is much less. The composition is also quite different. Coal fly ashpredominantly consists of silica compounds, with a minimum of unburnt HCs. Oil fly ashcontains metal oxides, soot and coke. Unabated fly-ash concentrations for oil firing are in therange of 100 - 600 mg/Nm3 (with highest values for vacuum residues). SCR applied under theseconditions may suffer from clogging by fly ash and sulphates (at coal firing the fly ash by itssandblasting effect keeps the catalyst clean). The potential for sulphate precipitation is generallyhigher with vacuum residue, due to its high sulphur content (2.5 - 4 %).
Pressure drop can be an important consideration as to whether SCR can be applied to a flue gassystem. For this reason natural draft furnaces could probably not be fitted with it.
See Section 4.23.8 for combined flue gas desulphurisation and deNOxing.
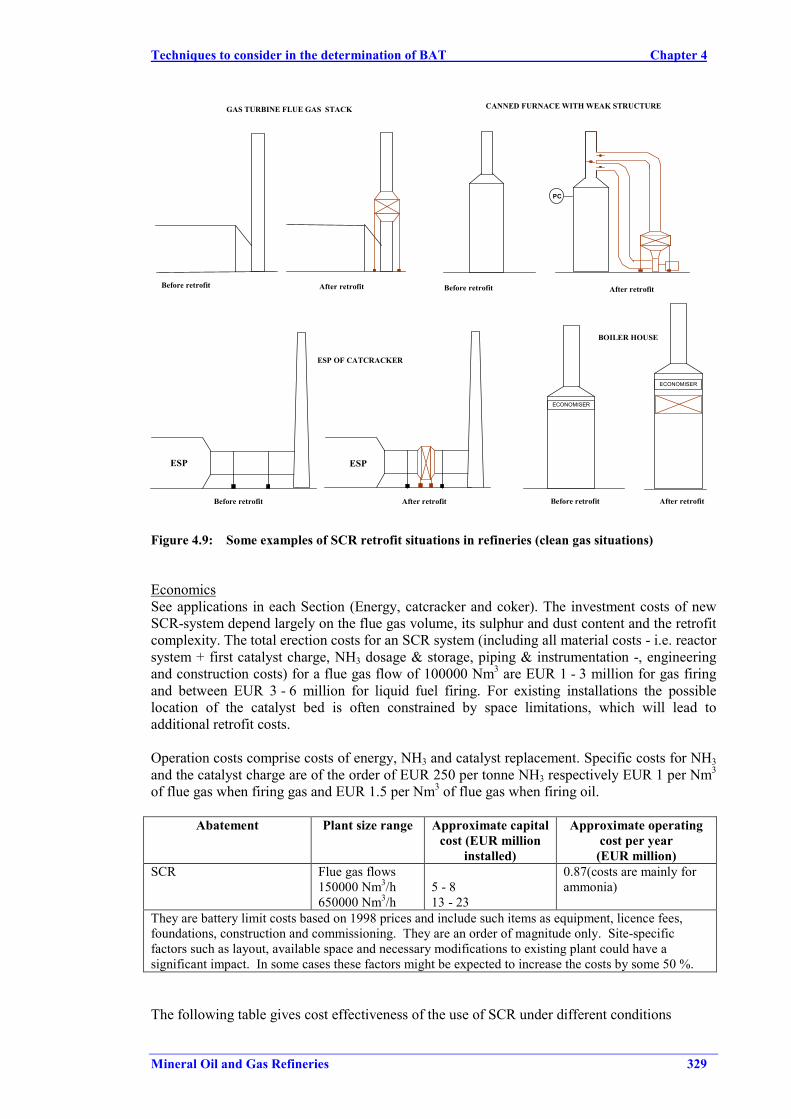
Techniques to consider in the determination of BAT Chapter 4
Mineral Oil and Gas Refineries 329
CANNED FURNACE WITH WEAK STRUCTUREGAS TURBINE FLUE GAS STACK
After retrofitBefore retrofit
PC
After retrofitBefore retrofit
ESP OF CATCRACKER
ESP
After retrofitBefore retrofit
ECONOMISER
ECONOMISER
BOILER HOUSE
After retrofitBefore retrofit
ESP
Figure 4.9: Some examples of SCR retrofit situations in refineries (clean gas situations)
EconomicsSee applications in each Section (Energy, catcracker and coker). The investment costs of newSCR-system depend largely on the flue gas volume, its sulphur and dust content and the retrofitcomplexity. The total erection costs for an SCR system (including all material costs - i.e. reactorsystem + first catalyst charge, NH3 dosage & storage, piping & instrumentation -, engineeringand construction costs) for a flue gas flow of 100000 Nm3 are EUR 1 - 3 million for gas firingand between EUR 3 - 6 million for liquid fuel firing. For existing installations the possiblelocation of the catalyst bed is often constrained by space limitations, which will lead toadditional retrofit costs.
Operation costs comprise costs of energy, NH3 and catalyst replacement. Specific costs for NH3and the catalyst charge are of the order of EUR 250 per tonne NH3 respectively EUR 1 per Nm3
of flue gas when firing gas and EUR 1.5 per Nm3 of flue gas when firing oil.
Abatement Plant size range Approximate capitalcost (EUR million
installed)
Approximate operatingcost per year
(EUR million)SCR Flue gas flows
150000 Nm3/h650000 Nm3/h
5 - 813 - 23
0.87(costs are mainly forammonia)
They are battery limit costs based on 1998 prices and include such items as equipment, licence fees,foundations, construction and commissioning. They are an order of magnitude only. Site-specificfactors such as layout, available space and necessary modifications to existing plant could have asignificant impact. In some cases these factors might be expected to increase the costs by some 50 %.
The following table gives cost effectiveness of the use of SCR under different conditions
Chapter 4 Techniques to consider in the determination of BAT
330 Mineral Oil and Gas Refineries
SCR Cost effectiveness EUR/tonne NOx removed(includes capital charge 15%)
Fired heaters and boilers firing refinery blend gas 8300-980012000
4200-9000Boilers firing Residual fuel oil 5000-8000
4500-10200Gas Turbines firing Natural or refinery blend gas 1700-8000
Fluid catalytic cracking units 2800-3300Details on the conditions are given in Annex IV
Driving force for implementationReduction of NOx emissions
Example plantsIt has been applied to FCC off-gases, gas turbines, process boilers, process heaters. SCR hasbeen applied successfully on a large variety of applications: coal and oil fired power plants,waste incineration plants, diesel and gas engines, gas turbine plants, steam boilers and refineryfurnaces (such us naphtha reformers, steam reformers, crude and vacuum distillations units,thermal cracking and hydroprocessing units) and FCC plants. Some examples are shown inFigure 4.9. Less experience is available with flue gas from firing high-sulphur residual oil.
SCR is used extensively on power plant in Japan, Germany, Austria and on gas turbine plant inNetherlands, California in the USA- SCR are also widely used in waste incineration plants. Todate, SCR has been sucessfully applied worldwide in refinery processes as power plants and theFCCs. For example, at refineries in Japan, SCR applications are common. In Europeanrefineries, more than 6 applications have been found (Austria, the Netherlands and Sweden).
Reference literature[302, UBA Germany, 2000], [211, Ecker, 1999], [118, VROM, 1999], [257, Gilbert, 2000],[175, Constructors, 1998], [181, HP, 1998], [115, CONCAWE, 1999], [268, TWG, 2001]
4.23.4 Particulates
PM emissions from refinery units entail particles present in the flue gas from furnaces,particularly soot, catalyst fines emitted from FCC regeneration units and other catalyst basedprocesses, the handling of coke and coke fines and ash generated during incineration of sludges.Particulates generated in the refinery contain metals. Then, a reduction in the particules contentreduces the metal emissions from the refinery. The particles may range in size from largemolecules, measuring a few tenths of a nanometer, to the coarse dusts arising from the attritionof catalyst. Distinction is usually made between aerosols, < 1 - 3 µm and larger dust particles.The avoidance of fine particulates < 10 µm (PM10) is particularly important for health reasons.
The available dust removal techniques can be subdivided into dry and wet techniques or acombination of the two. The usually at refineries applied techniques for dust emission reductionare briefly discussed below. Dry techniques are cyclones, electrofilters and filtration and wettechniques are wet scrubbers and washers. More information can be found in the waste gasBREF [312, EIPPCB, 2001].
Techniques to consider in the determination of BAT Chapter 4
Mineral Oil and Gas Refineries 331
4.23.4.1 Cyclones
DescriptionThe principle of cyclone separation is based on centrifugal force, whereby the particle isseparated from the carrier gas. More information can be found in the waste gas BREF [312,EIPPCB, 2001].
Achieved environmental benefitsCyclones are used to reduce dust concentrations to the 100 - 500 mg/Nm3 range. A novelcyclone design, called the rotating particulate separator (RPS), is able to effectively removeparticles > 1 µm, this design, however, has a limited capacity compared to the conventionalcyclone. Third cyclone achieve 90 % reduction of particulate emissions (100 - 400 mg/Nm3).Modern multicyclones used as third stage cyclones achieves 80 % reduction of particulateemissions to about 50 mg/m3. Particulate concentrations below 50 mg/Nm3 are only achievablein combination with specific catalysts.
Cross-media effectsA reduction of the environmental impact is best achieved if a useful outlet is found for thecollected solid dust material. Dust collection is essentially a shift of an air emission problem to awaste problem.
Operational dataCyclones can be designed for high temperature and pressure operation. Dust collectionequipment is normally simple to operate and fully automated. For the dry separation no utilitiesare needed. For dust removal normally no additives are used. Sometimes the collected dustneeds rewetting to avoid spreading of dust during handling.
ApplicabilityMulti-cyclones as employed in FCC-units, cokers are not able to remove fine particulate matter(PM10 = dust <10 µm) and therefore they are mainly used as pre-separation step.
Driving force for implementationProcess gas streams must often be cleaned up to prevent contamination of catalysts or products,and to avoid damage to equipment, such as compressors. Toxic and other hazardous substances(e.g. coke fines and heavy metal containing cat fines) have to be removed to comply with air-pollution regulations and for reasons of hygiene.
Example plantsIn refineries multi-cyclones and ESPs are employed in FCC-, heavy oil and residue crackerunits.
Reference literature[250, Winter, 2000], [118, VROM, 1999]
4.23.4.2 Electrofilters (ESP)
DescriptionThe basic principle of operation of electrofilters (Electro-Static Precipitator, ESP) is simple. Thegas is ionised in passing between a high-voltage electrode and an earthed (grounded) electrode;the dust particles become charged and are attracted to the earthed electrode. The precipitateddust is removed from the electrodes mechanically, usually by vibration, or by washing in socalled wet electrofilters.
Chapter 4 Techniques to consider in the determination of BAT
332 Mineral Oil and Gas Refineries
Achieved environmental benefitsESP are capable of collecting bulk quantities of dust including very fine particles, <2 µm, athigh efficiencies. ESP can achieve values of 5 - 50 mg/Nm3 (95 % reduction or higher withhigher inlet concentration only)
Cross-media effectsHigh voltage in an ESP introduces a new safety risk in refineries. A reduction of theenvironmental impact is best achieved if a useful outlet is found for the collected solid dustmaterial. Dust collection is essentially a shift of an air emission problem to a waste problem.
Operational dataAn ESP uses some electricity. For dust removal normally no additives are used. Sometimes thecollected dust needs rewetting to avoid spreading of dust during handling.
ApplicabilityApplication of ESPs can be found in FCC-units, FGD processes, power plants and incinerators.It may not be applicable for some particulates with high electric resistance. They typically canbe installed in new and existing plants.
EconomicsAbatement Plant size range Approximate capital
cost (EUR millioninstalled)
Approximate operatingcost per year
(EUR million)Electrostatic precipitator Flue gas flows
150000 Nm3/h650000 Nm3/h
1.94.4
0.16
They are battery limit costs based on 1998 prices and include such items as equipment, licence fees,foundations, contruction and commissioning. They are an order of magnitude only. Site-specific factorssuch as layout, available space and necessary modifications to existing plant could have a significantimpact. In some cases these factors might be expected to increase the costs by some 50 %.
Operating costs are in the order of EUR0.5 to 10 per 1000 Nm3 treated flue gas. Inclusion offines disposal costs gives figures 2.5 - 3 times higher than the ones specified in the above tableand 10 times higher the operating cost.
Driving force for implementationProcess gas streams must often be cleaned up to prevent contamination of catalysts or products,and to avoid damage to equipment, such as compressors. Toxic and other hazardous substances(e.g. coke fines and heavy metal containing cat fines) have to be removed to comply with air-pollution regulations and for reasons of hygiene.
Example plantsIn refineries multi-cyclones and ESPs are employed in FCC-, heavy oil and residue crackerunits.
Reference literature[250, Winter, 2000], [118, VROM, 1999]
4.23.4.3 Filtration
DescriptionFabric filters
Achieved environmental benefitsFabric filters can achieve values less than 5 mg/Nm3
Techniques to consider in the determination of BAT Chapter 4
Mineral Oil and Gas Refineries 333
Cross-media effectsA reduction of the environmental impact is best achieved if a useful outlet is found for thecollected solid dust material. Dust collection is essentially a shift of an air emission problem to awaste problem. Filter material life is limited (1 - 2 years) and may add a disposal problem.
Operational dataDust collection equipment is normally simple to operate and fully automated. For the dryseparation only limited utilities are needed.
ApplicabilityFabric filters are effective, except in applications with sticky dust or at of temperatures over240 ºC. Filters are typically used for cleaning of flue gases with a volume < 50000 Nm3/h.
Driving force for implementationProcess gas streams must often be cleaned up to prevent contamination of catalysts or products,and to avoid damage to equipment, such as compressors. Toxic and other hazardous substances(e.g. coke fines and heavy metal containing cat fines) have to be removed to comply with air-pollution regulations and for reasons of hygiene.
Reference literature[250, Winter, 2000], [118, VROM, 1999]
4.23.4.4 Wet Scrubbers
DescriptionIn wet scrubbing the dust is removed by counter-current washing with a liquid, usually water,and the solids are removed as slurry. Venturi and orifice scrubbers are simple forms of wetscrubbers. The Electro-dynamic venturi washer (EDV), is a recent development which reducesthe dust emission to 5 mg/Nm3. The technique combines venturi with electrostatic dustseparation. EDV is sometimes used in the flue gas treatment of combustion installations andincinerators.
Achieved environmental benefitsParticles sizes down to 0.5 µm can be removed in well designed scrubbers. Wet scrubbersreduce between 85 - 95 % of the particulates and can achieve values of particulate concentration< 30 - 50 mg/Nm3. In addition to solids removal, wet scrubbers can be used to simultaneouslycool the gas and neutralise any corrosive constituents. The collecting efficiency can beimproved by the use of plates or packings at the expense of a higher-pressure drop.
Cross-media effectsA reduction of the environmental impact is best achieved if a useful outlet is found for thecollected solid dust material. Dust collection is essentially a shift of an air emission problem to awaste problem. Scrubbers for dust removal, may also be effective for SO2 reduction.
Operational dataDust collection equipment is normally simple to operate and fully automated. Wet scrubbingrequires pumping energy as well as water and alkali.
ApplicabilitySpray towers have a low pressure drop but are not suitable for removing particles below 10 µm.Venturi and packed bed washers have been installed for sludge incinerators.
EconomicsOperating costs are in the order of EUR0.5 to 10 per 1000 Nm3 treated flue gas.
Chapter 4 Techniques to consider in the determination of BAT
334 Mineral Oil and Gas Refineries
Driving force for implementationProcess gas streams must often be cleaned up to prevent contamination of catalysts or products,and to avoid damage to equipment, such as compressors. Toxic and other hazardous substances(e.g. coke fines and heavy metal containing cat fines) have to be removed to comply with air-pollution regulations and for reasons of hygiene.
Example plantsSome FCC-units are equipped with scrubbers.
Reference literature[250, Winter, 2000], [118, VROM, 1999]
4.23.4.5 Washers
DescriptionVentury washers.Centrifugal washers combine the cyclone principle and an intensive contact with water, like theventuri washer.
Achieved environmental benefitsDust emissions can be reduced to 50 mg/Nm3 and below if very large quantities of water areused such as in an absorber used in a two stage scrubbing system.Dependent on the operating pressure and the construction, dust emissions can be reduced below10 mg/Nm3 with centrifugal washers or ventury washers.
Operational dataDust collection equipment is normally simple to operate and fully automated.Venturi washers, need to be operated at sufficient pressure and at full water saturation of the gasphase to reduce the dust emission.
ApplicabilityWash columns, or absorbers with packing are applied in various processes.
Driving force for implementationProcess gas streams must often be cleaned up to prevent contamination of catalysts or products,and to avoid damage to equipment, such as compressors. Toxic and other hazardous substances(e.g. coke fines and heavy metal containing cat fines) have to be removed to comply with air-pollution regulations and for reasons of hygiene.
Example plantsVentury washers: they are mostly applied for removal of a combination of dust, acidiccomponents (HCl and HF) at for example cokers and incinerators. For SO2 removal scrubbing atpH ± 6 with caustic or lime is necessary.
Reference literature[118, VROM, 1999]
4.23.4.6 Combination of particulate abatement techniques
Often a combination of techniques is applied, such as cyclone/ESP, ESP/venturi/wash columnor a cyclone/venturi/absorber leading to >99 % dust elimination.
Techniques to consider in the determination of BAT Chapter 4
Mineral Oil and Gas Refineries 335
4.23.5 Sulphur management system
Sulphur is an inherent component of crude oil. Part of this sulphur leaves the refinery in itsproducts, part of it is emitted to the atmosphere (already described in all the processes) and partof it is recovered by some processes located in the refinery for this purpose (more informationabout the sulphur split in a refinery in Section 1.4.1). Sulphur is an environmental issue thatcannot be addressed in an integrated manner if sulphur coming out with the products is notconsidered. In other words, decreasing emissions from a refinery may result in the production offuels (products) that may later be burned in a way that is not environmentally efficient, therebyjeopardising the environmental effort made in refineries.
Because it is such an integrated issue, proper sulphur management (See Annex VI) should alsoconsider other topics that are not within the objectives of this document. For example, a globalenvironmental impact assessment of sulphur dioxide emissions should contain:
1. Atmospheric emissions from processes generating SOx (furnaces, boilers, FCC, etc.). Thoseissues are in fact included in this document in each of the process sections.
2. Atmospheric emissions from sulphur recovery units or of gases containing sulphur in anH2S form before incineration. This category of sulphur is normally recovered, as shown inSection 4.23.5.2.
3. Atmospheric emissions generated by sulphur contained in products for which morestringent specifications already exist, such as gasolines, gasoils, etc. Those emissions cannotbe considered here because they do not fall within the scope of IPPC legislation, but theyshould be considered as part of an integrated approach.
4. Atmospheric emissions generated by products with less stringent specifications (bunkers,coke, heavy fuel oil). Typically, those products (heavy residues) contain high quantities ofsulphur. If they are not used in a proper way from the environmental point of view, theemissions can jeopardise the integrated approach to reducing sulphur emissions from therefinery sector. Another threat to this integrated approach is the exporting of those productsto countries with less environmental control.
5. Sulphur contained in non-fuel products such as bitumen or lubricants is typically notidentified as a problem.
In principle refiners have the following options and combinations thereof to reduce the SO2emissions of the refinery:• increase the use of non sulphur containing gas (LPG, natural gas, etc.) discussed in
Section 4.10 Energy system• to lower the sulphur content of the fuels used (reduce the H2S content in the refinery fuel
gas with amine treating Section 4.23.5.1, gasification of heavy fuels Section 4.10,hydrotreatment of fuels in Section 4.13.2 )
• to use low sulphur crudes discussed in Sections 4.10 Energy system• increase the efficiency of the SRU discussed in Section 4.23.5.2 Sulphur recovery units
(SRU)• to apply end-of-pipe techniques to capture the SO2 from the fumes (namely flue gas
desulphurisation(FGD)) (those techniques are the ones discussed in Section 4.23.5.4andhave been considered in Sections 4.5 Catalytic cracking and 4.10 Energy system).
• reduce SO2 emission from typically small contributors whey they become significantpart of the total emission. For example in the case of gas refineries, the overall picture ofthe sulphur emissions change because small contributors in liquid-fired refineriesbecome significant.
In this section, only those processes dealing with the recovery of sulphur is going to beconsidered. Between 17 to 53 % (average 36 %) of the sulphur is recovered in European
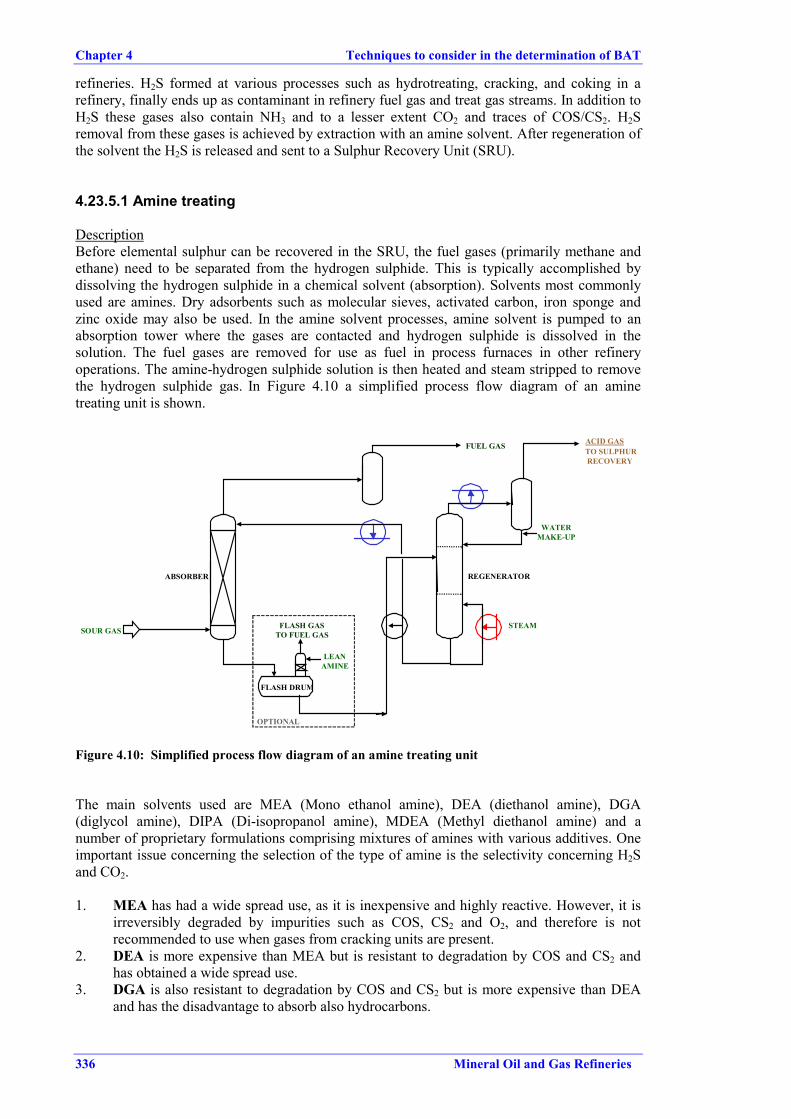
Chapter 4 Techniques to consider in the determination of BAT
336 Mineral Oil and Gas Refineries
refineries. H2S formed at various processes such as hydrotreating, cracking, and coking in arefinery, finally ends up as contaminant in refinery fuel gas and treat gas streams. In addition toH2S these gases also contain NH3 and to a lesser extent CO2 and traces of COS/CS2. H2Sremoval from these gases is achieved by extraction with an amine solvent. After regeneration ofthe solvent the H2S is released and sent to a Sulphur Recovery Unit (SRU).
4.23.5.1 Amine treating
DescriptionBefore elemental sulphur can be recovered in the SRU, the fuel gases (primarily methane andethane) need to be separated from the hydrogen sulphide. This is typically accomplished bydissolving the hydrogen sulphide in a chemical solvent (absorption). Solvents most commonlyused are amines. Dry adsorbents such as molecular sieves, activated carbon, iron sponge andzinc oxide may also be used. In the amine solvent processes, amine solvent is pumped to anabsorption tower where the gases are contacted and hydrogen sulphide is dissolved in thesolution. The fuel gases are removed for use as fuel in process furnaces in other refineryoperations. The amine-hydrogen sulphide solution is then heated and steam stripped to removethe hydrogen sulphide gas. In Figure 4.10 a simplified process flow diagram of an aminetreating unit is shown.
STEAM
REGENERATOR
WATERMAKE-UP
FUEL GAS ACID GASTO SULPHUR RECOVERY
FLASH DRUM
LEANAMINE
FLASH GASTO FUEL GASSOUR GAS
ABSORBER
OPTIONAL
Figure 4.10: Simplified process flow diagram of an amine treating unit
The main solvents used are MEA (Mono ethanol amine), DEA (diethanol amine), DGA(diglycol amine), DIPA (Di-isopropanol amine), MDEA (Methyl diethanol amine) and anumber of proprietary formulations comprising mixtures of amines with various additives. Oneimportant issue concerning the selection of the type of amine is the selectivity concerning H2Sand CO2.
1. MEA has had a wide spread use, as it is inexpensive and highly reactive. However, it isirreversibly degraded by impurities such as COS, CS2 and O2, and therefore is notrecommended to use when gases from cracking units are present.
2. DEA is more expensive than MEA but is resistant to degradation by COS and CS2 andhas obtained a wide spread use.
3. DGA is also resistant to degradation by COS and CS2 but is more expensive than DEAand has the disadvantage to absorb also hydrocarbons.
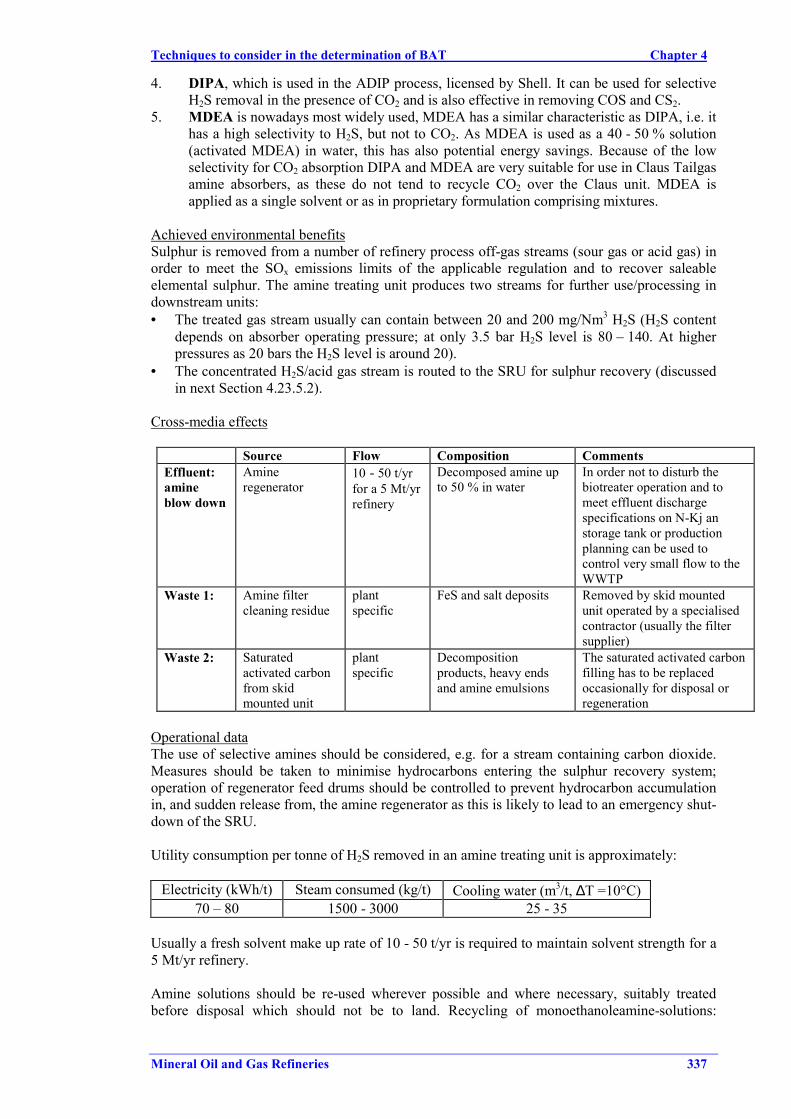
Techniques to consider in the determination of BAT Chapter 4
Mineral Oil and Gas Refineries 337
4. DIPA, which is used in the ADIP process, licensed by Shell. It can be used for selectiveH2S removal in the presence of CO2 and is also effective in removing COS and CS2.
5. MDEA is nowadays most widely used, MDEA has a similar characteristic as DIPA, i.e. ithas a high selectivity to H2S, but not to CO2. As MDEA is used as a 40 - 50 % solution(activated MDEA) in water, this has also potential energy savings. Because of the lowselectivity for CO2 absorption DIPA and MDEA are very suitable for use in Claus Tailgasamine absorbers, as these do not tend to recycle CO2 over the Claus unit. MDEA isapplied as a single solvent or as in proprietary formulation comprising mixtures.
Achieved environmental benefitsSulphur is removed from a number of refinery process off-gas streams (sour gas or acid gas) inorder to meet the SOx emissions limits of the applicable regulation and to recover saleableelemental sulphur. The amine treating unit produces two streams for further use/processing indownstream units:• The treated gas stream usually can contain between 20 and 200 mg/Nm3 H2S (H2S content
depends on absorber operating pressure; at only 3.5 bar H2S level is 80 – 140. At higherpressures as 20 bars the H2S level is around 20).
• The concentrated H2S/acid gas stream is routed to the SRU for sulphur recovery (discussedin next Section 4.23.5.2).
Cross-media effects
Source Flow Composition CommentsEffluent:amineblow down
Amineregenerator
10 - 50 t/yrfor a 5 Mt/yrrefinery
Decomposed amine upto 50 % in water
In order not to disturb thebiotreater operation and tomeet effluent dischargespecifications on N-Kj anstorage tank or productionplanning can be used tocontrol very small flow to theWWTP
Waste 1: Amine filtercleaning residue
plantspecific
FeS and salt deposits Removed by skid mountedunit operated by a specialisedcontractor (usually the filtersupplier)
Waste 2: Saturatedactivated carbonfrom skidmounted unit
plantspecific
Decompositionproducts, heavy endsand amine emulsions
The saturated activated carbonfilling has to be replacedoccasionally for disposal orregeneration
Operational dataThe use of selective amines should be considered, e.g. for a stream containing carbon dioxide.Measures should be taken to minimise hydrocarbons entering the sulphur recovery system;operation of regenerator feed drums should be controlled to prevent hydrocarbon accumulationin, and sudden release from, the amine regenerator as this is likely to lead to an emergency shut-down of the SRU.
Utility consumption per tonne of H2S removed in an amine treating unit is approximately:
Electricity (kWh/t) Steam consumed (kg/t) Cooling water (m3/t, ∆T =10°C)70 – 80 1500 - 3000 25 - 35
Usually a fresh solvent make up rate of 10 - 50 t/yr is required to maintain solvent strength for a5 Mt/yr refinery.
Amine solutions should be re-used wherever possible and where necessary, suitably treatedbefore disposal which should not be to land. Recycling of monoethanoleamine-solutions:
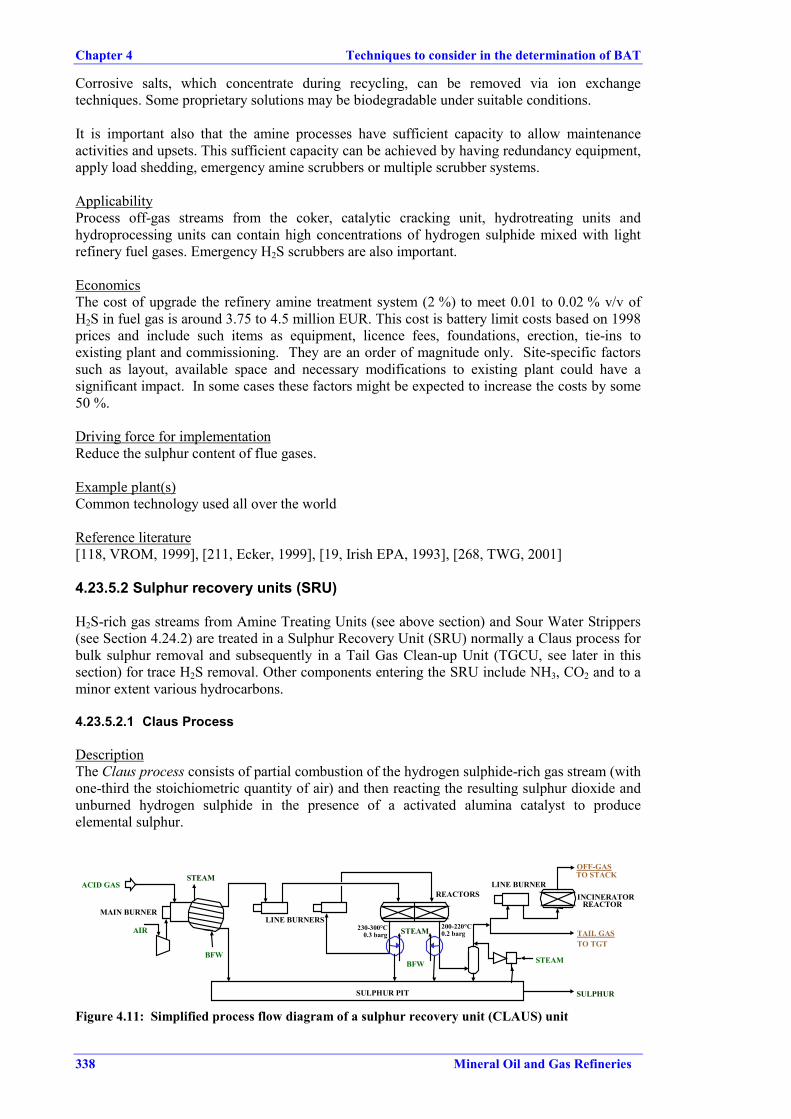
Chapter 4 Techniques to consider in the determination of BAT
338 Mineral Oil and Gas Refineries
Corrosive salts, which concentrate during recycling, can be removed via ion exchangetechniques. Some proprietary solutions may be biodegradable under suitable conditions.
It is important also that the amine processes have sufficient capacity to allow maintenanceactivities and upsets. This sufficient capacity can be achieved by having redundancy equipment,apply load shedding, emergency amine scrubbers or multiple scrubber systems.
ApplicabilityProcess off-gas streams from the coker, catalytic cracking unit, hydrotreating units andhydroprocessing units can contain high concentrations of hydrogen sulphide mixed with lightrefinery fuel gases. Emergency H2S scrubbers are also important.
EconomicsThe cost of upgrade the refinery amine treatment system (2 %) to meet 0.01 to 0.02 % v/v ofH2S in fuel gas is around 3.75 to 4.5 million EUR. This cost is battery limit costs based on 1998prices and include such items as equipment, licence fees, foundations, erection, tie-ins toexisting plant and commissioning. They are an order of magnitude only. Site-specific factorssuch as layout, available space and necessary modifications to existing plant could have asignificant impact. In some cases these factors might be expected to increase the costs by some50 %.
Driving force for implementationReduce the sulphur content of flue gases.
Example plant(s)Common technology used all over the world
Reference literature[118, VROM, 1999], [211, Ecker, 1999], [19, Irish EPA, 1993], [268, TWG, 2001]
4.23.5.2 Sulphur recovery units (SRU)
H2S-rich gas streams from Amine Treating Units (see above section) and Sour Water Strippers(see Section 4.24.2) are treated in a Sulphur Recovery Unit (SRU) normally a Claus process forbulk sulphur removal and subsequently in a Tail Gas Clean-up Unit (TGCU, see later in thissection) for trace H2S removal. Other components entering the SRU include NH3, CO2 and to aminor extent various hydrocarbons.
4.23.5.2.1 Claus Process
DescriptionThe Claus process consists of partial combustion of the hydrogen sulphide-rich gas stream (withone-third the stoichiometric quantity of air) and then reacting the resulting sulphur dioxide andunburned hydrogen sulphide in the presence of a activated alumina catalyst to produceelemental sulphur.
ACID GAS
AIR
MAIN BURNER
BFW
STEAM
LINE BURNERS
REACTORSLINE BURNER
TAIL GAS TO TGT
STEAM
SULPHURSULPHUR PIT
STEAM
BFW
230-300°C0.3 barg
200-220°C0.2 barg
INCINERATORREACTOR
OFF-GASTO STACK
Figure 4.11: Simplified process flow diagram of a sulphur recovery unit (CLAUS) unit
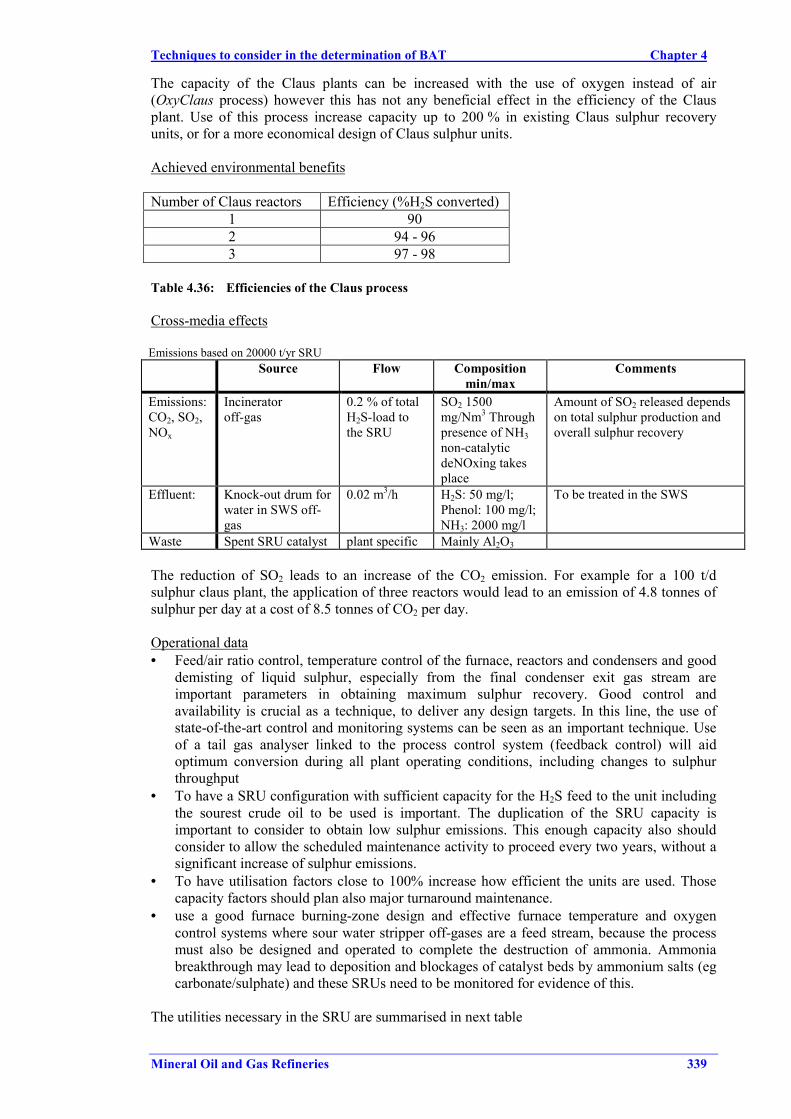
Techniques to consider in the determination of BAT Chapter 4
Mineral Oil and Gas Refineries 339
The capacity of the Claus plants can be increased with the use of oxygen instead of air(OxyClaus process) however this has not any beneficial effect in the efficiency of the Clausplant. Use of this process increase capacity up to 200 % in existing Claus sulphur recoveryunits, or for a more economical design of Claus sulphur units.
Achieved environmental benefits
Number of Claus reactors Efficiency (%H2S converted)1 902 94 - 963 97 - 98
Table 4.36: Efficiencies of the Claus process
Cross-media effects
Emissions based on 20000 t/yr SRUSource Flow Composition
min/maxComments
Emissions:CO2, SO2,NOx
Incineratoroff-gas
0.2 % of totalH2S-load tothe SRU
SO2 1500mg/Nm3 Throughpresence of NH3non-catalyticdeNOxing takesplace
Amount of SO2 released dependson total sulphur production andoverall sulphur recovery
Effluent: Knock-out drum forwater in SWS off-gas
0.02 m3/h H2S: 50 mg/l;Phenol: 100 mg/l;NH3: 2000 mg/l
To be treated in the SWS
Waste Spent SRU catalyst plant specific Mainly Al2O3
The reduction of SO2 leads to an increase of the CO2 emission. For example for a 100 t/dsulphur claus plant, the application of three reactors would lead to an emission of 4.8 tonnes ofsulphur per day at a cost of 8.5 tonnes of CO2 per day.
Operational data• Feed/air ratio control, temperature control of the furnace, reactors and condensers and good
demisting of liquid sulphur, especially from the final condenser exit gas stream areimportant parameters in obtaining maximum sulphur recovery. Good control andavailability is crucial as a technique, to deliver any design targets. In this line, the use ofstate-of-the-art control and monitoring systems can be seen as an important technique. Useof a tail gas analyser linked to the process control system (feedback control) will aidoptimum conversion during all plant operating conditions, including changes to sulphurthroughput
• To have a SRU configuration with sufficient capacity for the H2S feed to the unit includingthe sourest crude oil to be used is important. The duplication of the SRU capacity isimportant to consider to obtain low sulphur emissions. This enough capacity also shouldconsider to allow the scheduled maintenance activity to proceed every two years, without asignificant increase of sulphur emissions.
• To have utilisation factors close to 100% increase how efficient the units are used. Thosecapacity factors should plan also major turnaround maintenance.
• use a good furnace burning-zone design and effective furnace temperature and oxygencontrol systems where sour water stripper off-gases are a feed stream, because the processmust also be designed and operated to complete the destruction of ammonia. Ammoniabreakthrough may lead to deposition and blockages of catalyst beds by ammonium salts (egcarbonate/sulphate) and these SRUs need to be monitored for evidence of this.
The utilities necessary in the SRU are summarised in next table
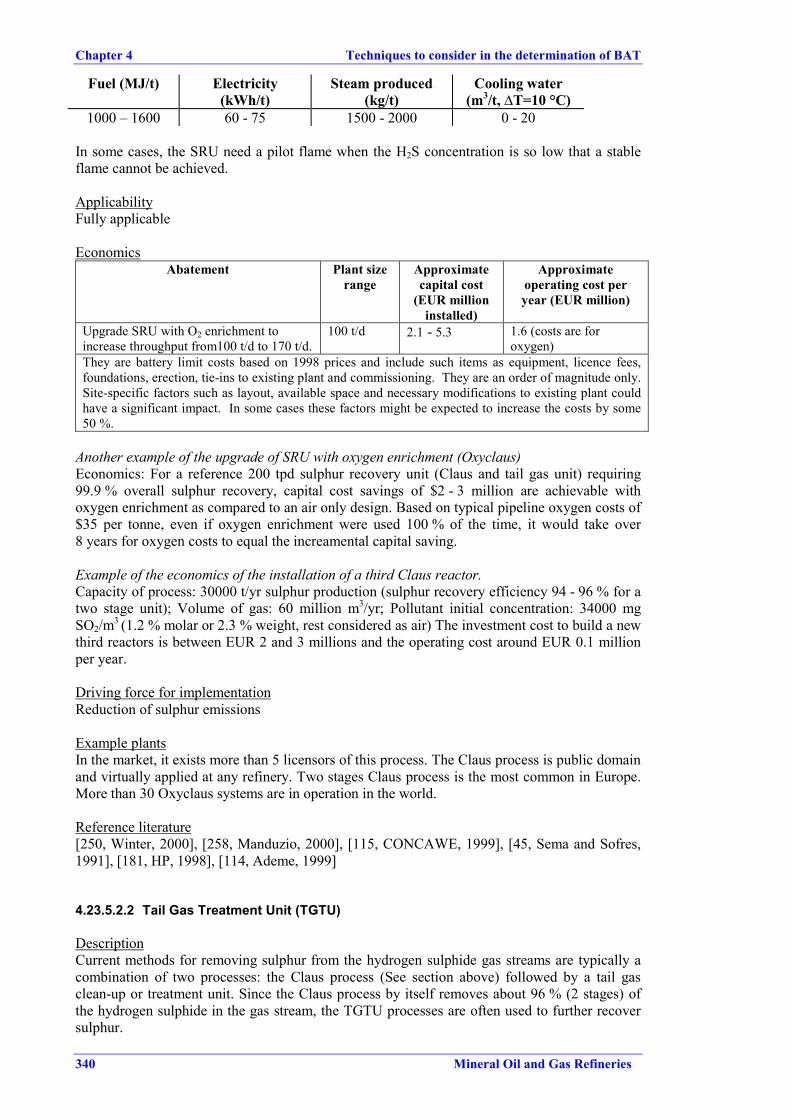
Chapter 4 Techniques to consider in the determination of BAT
340 Mineral Oil and Gas Refineries
Fuel (MJ/t) Electricity(kWh/t)
Steam produced(kg/t)
Cooling water(m3/t, ∆T=10 °C)
1000 – 1600 60 - 75 1500 - 2000 0 - 20
In some cases, the SRU need a pilot flame when the H2S concentration is so low that a stableflame cannot be achieved.
ApplicabilityFully applicable
EconomicsAbatement Plant size
rangeApproximatecapital cost
(EUR millioninstalled)
Approximateoperating cost peryear (EUR million)
Upgrade SRU with O2 enrichment toincrease throughput from100 t/d to 170 t/d.
100 t/d 2.1 - 5.3 1.6 (costs are foroxygen)
They are battery limit costs based on 1998 prices and include such items as equipment, licence fees,foundations, erection, tie-ins to existing plant and commissioning. They are an order of magnitude only.Site-specific factors such as layout, available space and necessary modifications to existing plant couldhave a significant impact. In some cases these factors might be expected to increase the costs by some50 %.
Another example of the upgrade of SRU with oxygen enrichment (Oxyclaus)Economics: For a reference 200 tpd sulphur recovery unit (Claus and tail gas unit) requiring99.9 % overall sulphur recovery, capital cost savings of $2 - 3 million are achievable withoxygen enrichment as compared to an air only design. Based on typical pipeline oxygen costs of$35 per tonne, even if oxygen enrichment were used 100 % of the time, it would take over8 years for oxygen costs to equal the increamental capital saving.
Example of the economics of the installation of a third Claus reactor.Capacity of process: 30000 t/yr sulphur production (sulphur recovery efficiency 94 - 96 % for atwo stage unit); Volume of gas: 60 million m3/yr; Pollutant initial concentration: 34000 mgSO2/m3 (1.2 % molar or 2.3 % weight, rest considered as air) The investment cost to build a newthird reactors is between EUR 2 and 3 millions and the operating cost around EUR 0.1 millionper year.
Driving force for implementationReduction of sulphur emissions
Example plantsIn the market, it exists more than 5 licensors of this process. The Claus process is public domainand virtually applied at any refinery. Two stages Claus process is the most common in Europe.More than 30 Oxyclaus systems are in operation in the world.
Reference literature[250, Winter, 2000], [258, Manduzio, 2000], [115, CONCAWE, 1999], [45, Sema and Sofres,1991], [181, HP, 1998], [114, Ademe, 1999]
4.23.5.2.2 Tail Gas Treatment Unit (TGTU)
DescriptionCurrent methods for removing sulphur from the hydrogen sulphide gas streams are typically acombination of two processes: the Claus process (See section above) followed by a tail gasclean-up or treatment unit. Since the Claus process by itself removes about 96 % (2 stages) ofthe hydrogen sulphide in the gas stream, the TGTU processes are often used to further recoversulphur.
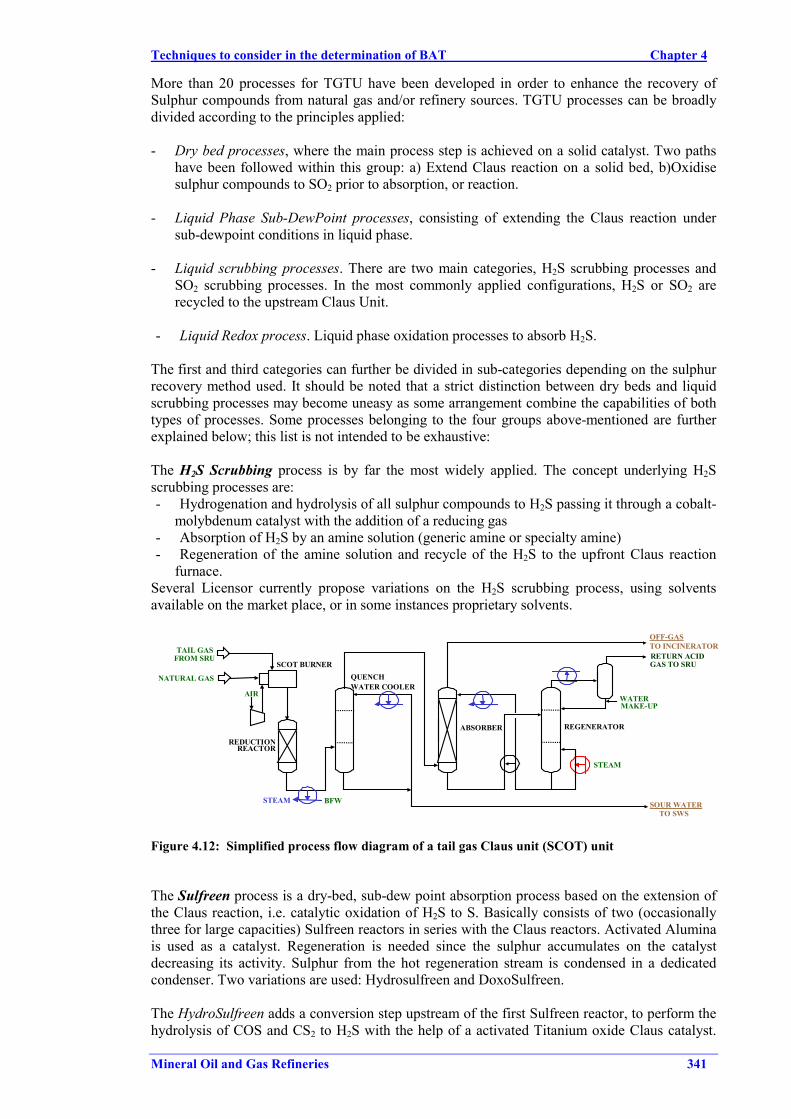
Techniques to consider in the determination of BAT Chapter 4
Mineral Oil and Gas Refineries 341
More than 20 processes for TGTU have been developed in order to enhance the recovery ofSulphur compounds from natural gas and/or refinery sources. TGTU processes can be broadlydivided according to the principles applied:
- Dry bed processes, where the main process step is achieved on a solid catalyst. Two pathshave been followed within this group: a) Extend Claus reaction on a solid bed, b)Oxidisesulphur compounds to SO2 prior to absorption, or reaction.
- Liquid Phase Sub-DewPoint processes, consisting of extending the Claus reaction undersub-dewpoint conditions in liquid phase.
- Liquid scrubbing processes. There are two main categories, H2S scrubbing processes andSO2 scrubbing processes. In the most commonly applied configurations, H2S or SO2 arerecycled to the upstream Claus Unit.
- Liquid Redox process. Liquid phase oxidation processes to absorb H2S.
The first and third categories can further be divided in sub-categories depending on the sulphurrecovery method used. It should be noted that a strict distinction between dry beds and liquidscrubbing processes may become uneasy as some arrangement combine the capabilities of bothtypes of processes. Some processes belonging to the four groups above-mentioned are furtherexplained below; this list is not intended to be exhaustive:
The H2S Scrubbing process is by far the most widely applied. The concept underlying H2Sscrubbing processes are:- Hydrogenation and hydrolysis of all sulphur compounds to H2S passing it through a cobalt-
molybdenum catalyst with the addition of a reducing gas- Absorption of H2S by an amine solution (generic amine or specialty amine)- Regeneration of the amine solution and recycle of the H2S to the upfront Claus reaction
furnace.Several Licensor currently propose variations on the H2S scrubbing process, using solventsavailable on the market place, or in some instances proprietary solvents.
STEAM
ABSORBER REGENERATOR
WATERMAKE-UP
RETURN ACIDGAS TO SRU
QUENCHWATER COOLER
REDUCTIONREACTOR
STEAM BFW
TAIL GASFROM SRU
SCOT BURNER
OFF-GASTO INCINERATOR
AIR
SOUR WATERTO SWS
NATURAL GAS
Figure 4.12: Simplified process flow diagram of a tail gas Claus unit (SCOT) unit
The Sulfreen process is a dry-bed, sub-dew point absorption process based on the extension ofthe Claus reaction, i.e. catalytic oxidation of H2S to S. Basically consists of two (occasionallythree for large capacities) Sulfreen reactors in series with the Claus reactors. Activated Aluminais used as a catalyst. Regeneration is needed since the sulphur accumulates on the catalystdecreasing its activity. Sulphur from the hot regeneration stream is condensed in a dedicatedcondenser. Two variations are used: Hydrosulfreen and DoxoSulfreen.
The HydroSulfreen adds a conversion step upstream of the first Sulfreen reactor, to perform thehydrolysis of COS and CS2 to H2S with the help of a activated Titanium oxide Claus catalyst.
Chapter 4 Techniques to consider in the determination of BAT
342 Mineral Oil and Gas Refineries
The Claus reaction takes place in the HydroSulfreen reactor and produced sulphur is condensedin a dedicated condenser
The DoxoSulfreen concept is based on two ideas: the upstream units are operated to get a slightexcess of H2S, compared to the quantity necessary to maintain the Claus ratio, therefore a nearlytotal SO2 conversion takes place on the conventional Sulfreen catalyst; then the remaining H2Sis directly oxidised to elemental Sulphur
In the Beaven process, the hydrogen sulphide in the relatively low concentration gas streamfrom the Claus process can be almost completely removed by absorption in a quinone solution.The dissolved hydrogen sulphide is oxidized to form a mixture of elemental sulphur and hydro-quinone. The solution is injected with air or oxygen to oxidize the hydro-quinone back toquinone. The solution is then filtered or centrifuged to remove the sulphur and the quinone isthen re-used. The Beaven process is also effective in removing small amounts of sulphurdioxide, carbonyl sulphide, and carbon disulphide that are not affected by the Claus process.These compounds are first converted to hydrogen sulphide at elevated temperatures in a cobaltmolybdate catalyst prior to being fed to the Beaven unit.
The CBA (cold bed absorption), process is very similar to the Sulfreen process except in thefact that the CBA process uses a hot process stream indigenous to the Claus process toaccomplish regeneration of the sulphur loaded catalyst bed. The hot process stream is part of theeffluent of the first Claus reactor. Several configurations are available depending on the numberof Claus converters.
The Clauspol is a process where the tail gas is put in contact with a solvent (polyethyleneglycol) and the reaction of H2S and SO2 is catalysed by a dissolved catalysts. (sodium salt of aninorganic acid) which is a solvent for H2S and SO2, but not for liquid sulphur.The Claus reactioncan therefore proceed at low temperature (120 °C) and is shifted further to the right as theproduced sulphur is removed from the reaction medium, as it is not soluble and separates.
The Superclaus process is based on two principles:- Operating the Claus plant with excess H2S to minimise the SO2 content in the Claus tail gas.
This feature simplifies and makes more flexible the air ratio control.- Selective oxidation of the remaining H2S in the Claus tail gas by means of specific catalyst
which efficiently convert the remaining H2S in the presence of water vapour and excessoxygen to elemental sulphur only.
This reaction takes place in a specific converter (oxidation reactor), downstream of a two orthree reactors traditional Claus unit. The catalyst used is an alumina based catalyst coated withiron oxide and chromium oxide layers.
The LO-CAT process. Absorption and regeneration are performed in a single vessel divided intwo sections: the centerwell and the outer space where aeration with air is performed. Thepurpose of the Centerwell is to separate the sulphite ions from air in order to minimize by-product formation (e.g. thiosulphate). The difference in aeration (and therefore of density)between the centerwell and the outer space give sufficient driving force for solution circulationbetween the absorption and the regeneration zones without the need of a specific pump. The lasttype of processing scheme is called the “aerobic unit” and is used to treat air contaminated withH2S. All reactions take place in the same vessel, at the expense of increased by-productformation, but with the advantage of a reduced capital cost.
The SO2 abatement from the Claus plant is a process that uses a physical scrubbing mechanismto remove SO2 from the incinerated tail gas of a Claus plant. The recovered SO2 is recycled tothe inlet of the Claus plant unit.
Achieved environmental benefitsTail gas treatment units increase the overall recovery of H2S decreasing the sulphur emissionsfrom the refinery. For example, if a refinery has a 100 t/d SRU, with a two stage Claus reactor
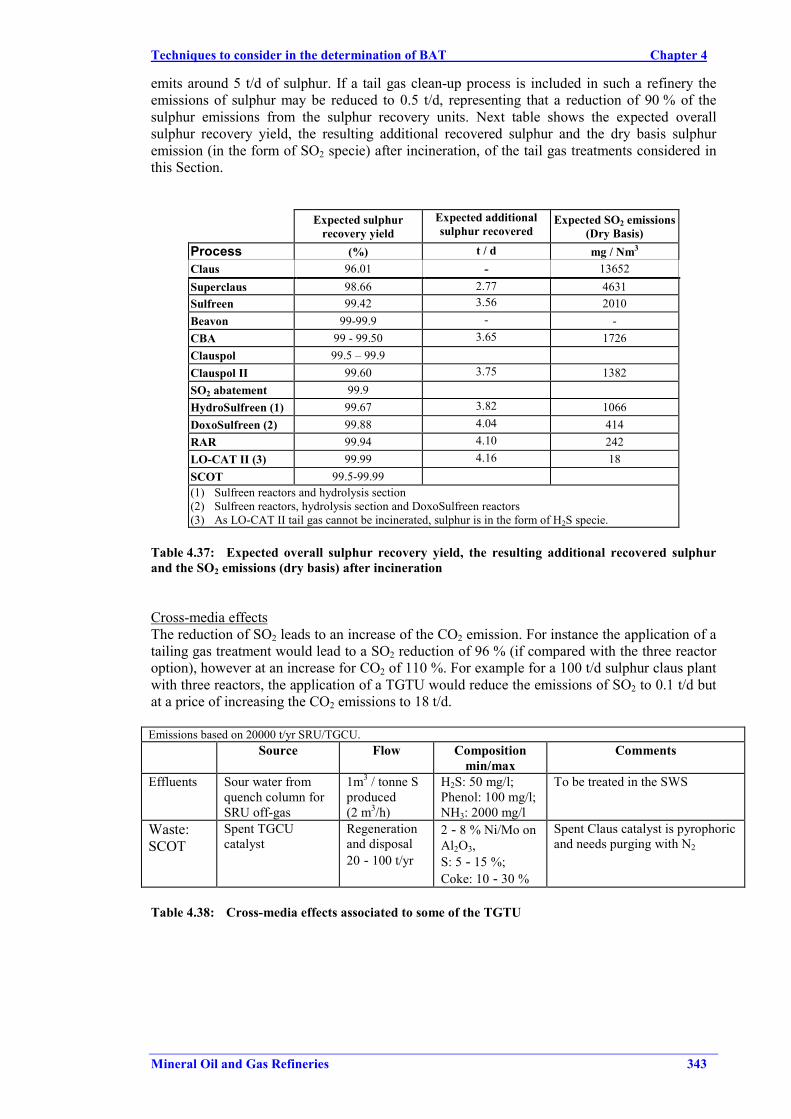
Techniques to consider in the determination of BAT Chapter 4
Mineral Oil and Gas Refineries 343
emits around 5 t/d of sulphur. If a tail gas clean-up process is included in such a refinery theemissions of sulphur may be reduced to 0.5 t/d, representing that a reduction of 90 % of thesulphur emissions from the sulphur recovery units. Next table shows the expected overallsulphur recovery yield, the resulting additional recovered sulphur and the dry basis sulphuremission (in the form of SO2 specie) after incineration, of the tail gas treatments considered inthis Section.
Expected sulphurrecovery yield
Expected additionalsulphur recovered
Expected SO2 emissions(Dry Basis)
Process (%) t / d mg / Nm3
Claus 96.01 - 13652Superclaus 98.66 2.77 4631Sulfreen 99.42 3.56 2010Beavon 99-99.9 - -CBA 99 - 99.50 3.65 1726Clauspol 99.5 – 99.9Clauspol II 99.60 3.75 1382SO2 abatement 99.9HydroSulfreen (1) 99.67 3.82 1066DoxoSulfreen (2) 99.88 4.04 414RAR 99.94 4.10 242LO-CAT II (3) 99.99 4.16 18SCOT 99.5-99.99(1) Sulfreen reactors and hydrolysis section(2) Sulfreen reactors, hydrolysis section and DoxoSulfreen reactors(3) As LO-CAT II tail gas cannot be incinerated, sulphur is in the form of H2S specie.
Table 4.37: Expected overall sulphur recovery yield, the resulting additional recovered sulphurand the SO2 emissions (dry basis) after incineration
Cross-media effectsThe reduction of SO2 leads to an increase of the CO2 emission. For instance the application of atailing gas treatment would lead to a SO2 reduction of 96 % (if compared with the three reactoroption), however at an increase for CO2 of 110 %. For example for a 100 t/d sulphur claus plantwith three reactors, the application of a TGTU would reduce the emissions of SO2 to 0.1 t/d butat a price of increasing the CO2 emissions to 18 t/d.
Emissions based on 20000 t/yr SRU/TGCU.Source Flow Composition
min/maxComments
Effluents Sour water fromquench column forSRU off-gas
1m3 / tonne Sproduced(2 m3/h)
H2S: 50 mg/l;Phenol: 100 mg/l;NH3: 2000 mg/l
To be treated in the SWS
Waste:SCOT
Spent TGCUcatalyst
Regenerationand disposal20 - 100 t/yr
2 - 8 % Ni/Mo onAl2O3,S: 5 - 15 %;Coke: 10 - 30 %
Spent Claus catalyst is pyrophoricand needs purging with N2
Table 4.38: Cross-media effects associated to some of the TGTU
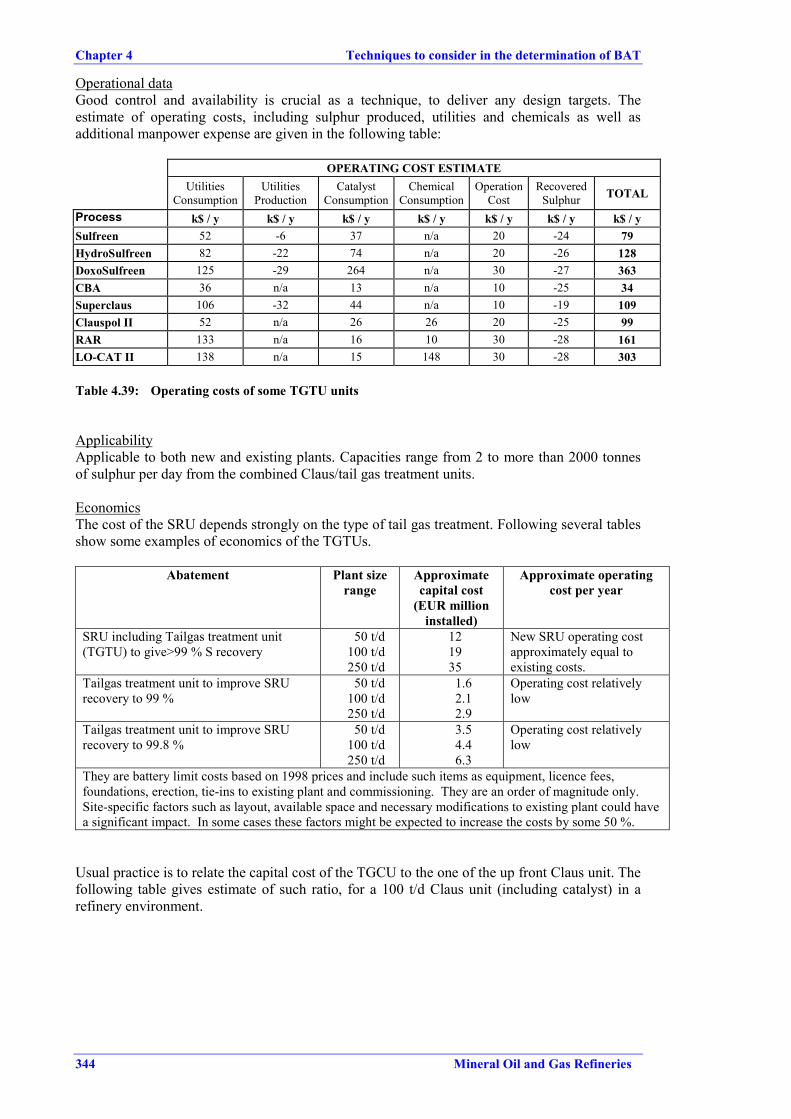
Chapter 4 Techniques to consider in the determination of BAT
344 Mineral Oil and Gas Refineries
Operational dataGood control and availability is crucial as a technique, to deliver any design targets. Theestimate of operating costs, including sulphur produced, utilities and chemicals as well asadditional manpower expense are given in the following table:
OPERATING COST ESTIMATEUtilities
ConsumptionUtilities
ProductionCatalyst
ConsumptionChemical
ConsumptionOperation
CostRecovered
Sulphur TOTAL
Process k$ / y k$ / y k$ / y k$ / y k$ / y k$ / y k$ / ySulfreen 52 -6 37 n/a 20 -24 79HydroSulfreen 82 -22 74 n/a 20 -26 128DoxoSulfreen 125 -29 264 n/a 30 -27 363CBA 36 n/a 13 n/a 10 -25 34Superclaus 106 -32 44 n/a 10 -19 109Clauspol II 52 n/a 26 26 20 -25 99RAR 133 n/a 16 10 30 -28 161LO-CAT II 138 n/a 15 148 30 -28 303
Table 4.39: Operating costs of some TGTU units
ApplicabilityApplicable to both new and existing plants. Capacities range from 2 to more than 2000 tonnesof sulphur per day from the combined Claus/tail gas treatment units.
EconomicsThe cost of the SRU depends strongly on the type of tail gas treatment. Following several tablesshow some examples of economics of the TGTUs.
Abatement Plant sizerange
Approximatecapital cost
(EUR millioninstalled)
Approximate operatingcost per year
SRU including Tailgas treatment unit(TGTU) to give>99 % S recovery
50 t/d100 t/d250 t/d
121935
New SRU operating costapproximately equal toexisting costs.
Tailgas treatment unit to improve SRUrecovery to 99 %
50 t/d100 t/d250 t/d
1.62.12.9
Operating cost relativelylow
Tailgas treatment unit to improve SRUrecovery to 99.8 %
50 t/d100 t/d250 t/d
3.54.46.3
Operating cost relativelylow
They are battery limit costs based on 1998 prices and include such items as equipment, licence fees,foundations, erection, tie-ins to existing plant and commissioning. They are an order of magnitude only.Site-specific factors such as layout, available space and necessary modifications to existing plant could havea significant impact. In some cases these factors might be expected to increase the costs by some 50 %.
Usual practice is to relate the capital cost of the TGCU to the one of the up front Claus unit. Thefollowing table gives estimate of such ratio, for a 100 t/d Claus unit (including catalyst) in arefinery environment.
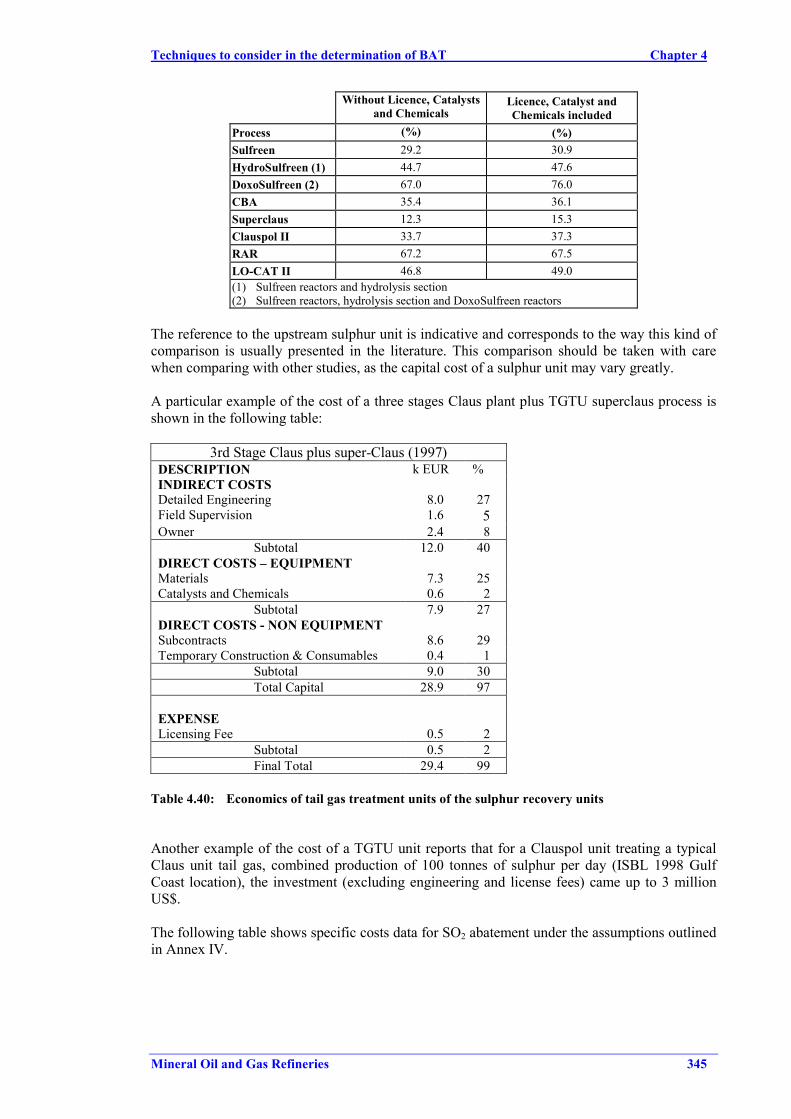
Techniques to consider in the determination of BAT Chapter 4
Mineral Oil and Gas Refineries 345
Without Licence, Catalystsand Chemicals
Licence, Catalyst andChemicals included
Process (%) (%)Sulfreen 29.2 30.9HydroSulfreen (1) 44.7 47.6DoxoSulfreen (2) 67.0 76.0CBA 35.4 36.1Superclaus 12.3 15.3Clauspol II 33.7 37.3RAR 67.2 67.5LO-CAT II 46.8 49.0(1) Sulfreen reactors and hydrolysis section(2) Sulfreen reactors, hydrolysis section and DoxoSulfreen reactors
The reference to the upstream sulphur unit is indicative and corresponds to the way this kind ofcomparison is usually presented in the literature. This comparison should be taken with carewhen comparing with other studies, as the capital cost of a sulphur unit may vary greatly.
A particular example of the cost of a three stages Claus plant plus TGTU superclaus process isshown in the following table:
3rd Stage Claus plus super-Claus (1997)DESCRIPTION k EUR %INDIRECT COSTSDetailed Engineering 8.0 27Field Supervision 1.6 5Owner 2.4 8
Subtotal 12.0 40DIRECT COSTS – EQUIPMENTMaterials 7.3 25Catalysts and Chemicals 0.6 2
Subtotal 7.9 27DIRECT COSTS - NON EQUIPMENTSubcontracts 8.6 29Temporary Construction & Consumables 0.4 1
Subtotal 9.0 30Total Capital 28.9 97
EXPENSELicensing Fee 0.5 2
Subtotal 0.5 2Final Total 29.4 99
Table 4.40: Economics of tail gas treatment units of the sulphur recovery units
Another example of the cost of a TGTU unit reports that for a Clauspol unit treating a typicalClaus unit tail gas, combined production of 100 tonnes of sulphur per day (ISBL 1998 GulfCoast location), the investment (excluding engineering and license fees) came up to 3 millionUS$.
The following table shows specific costs data for SO2 abatement under the assumptions outlinedin Annex IV.
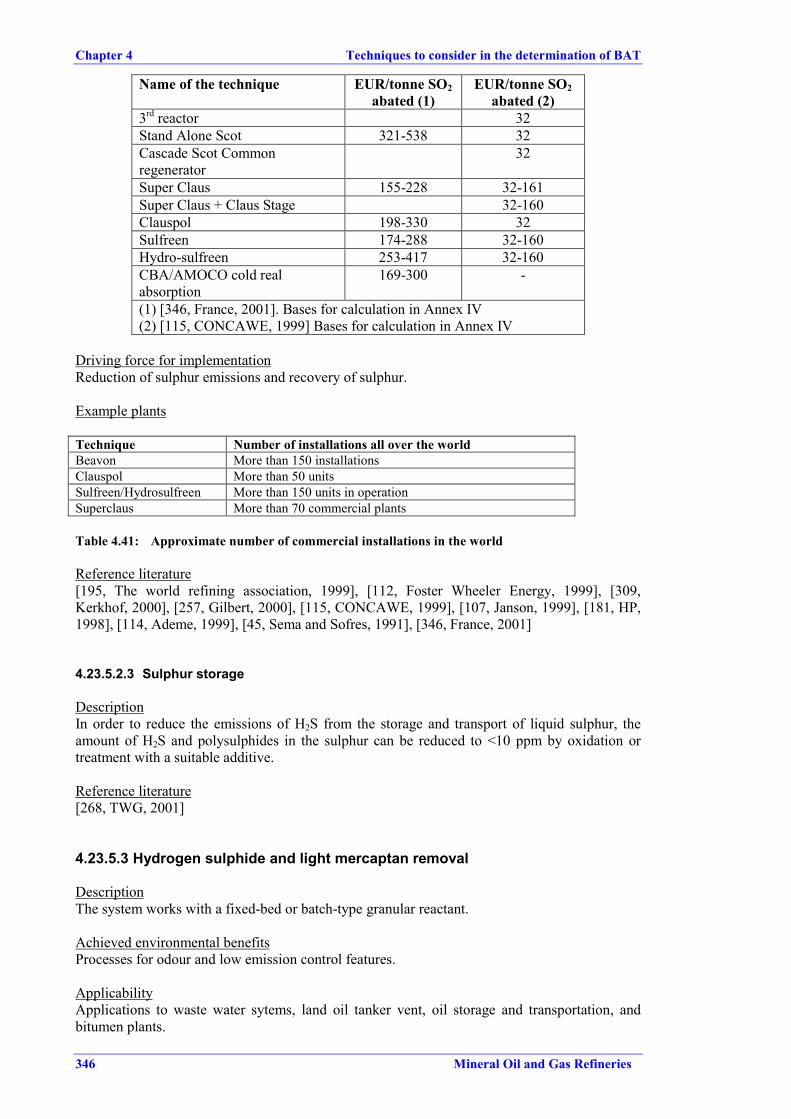
Chapter 4 Techniques to consider in the determination of BAT
346 Mineral Oil and Gas Refineries
Name of the technique EUR/tonne SO2abated (1)
EUR/tonne SO2abated (2)
3rd reactor 32Stand Alone Scot 321-538 32Cascade Scot Commonregenerator
32
Super Claus 155-228 32-161Super Claus + Claus Stage 32-160Clauspol 198-330 32Sulfreen 174-288 32-160Hydro-sulfreen 253-417 32-160CBA/AMOCO cold realabsorption
169-300 -
(1) [346, France, 2001]. Bases for calculation in Annex IV(2) [115, CONCAWE, 1999] Bases for calculation in Annex IV
Driving force for implementationReduction of sulphur emissions and recovery of sulphur.
Example plants
Technique Number of installations all over the worldBeavon More than 150 installationsClauspol More than 50 unitsSulfreen/Hydrosulfreen More than 150 units in operationSuperclaus More than 70 commercial plants
Table 4.41: Approximate number of commercial installations in the world
Reference literature[195, The world refining association, 1999], [112, Foster Wheeler Energy, 1999], [309,Kerkhof, 2000], [257, Gilbert, 2000], [115, CONCAWE, 1999], [107, Janson, 1999], [181, HP,1998], [114, Ademe, 1999], [45, Sema and Sofres, 1991], [346, France, 2001]
4.23.5.2.3 Sulphur storage
DescriptionIn order to reduce the emissions of H2S from the storage and transport of liquid sulphur, theamount of H2S and polysulphides in the sulphur can be reduced to <10 ppm by oxidation ortreatment with a suitable additive.
Reference literature[268, TWG, 2001]
4.23.5.3 Hydrogen sulphide and light mercaptan removal
DescriptionThe system works with a fixed-bed or batch-type granular reactant.
Achieved environmental benefitsProcesses for odour and low emission control features.
ApplicabilityApplications to waste water sytems, land oil tanker vent, oil storage and transportation, andbitumen plants.
Techniques to consider in the determination of BAT Chapter 4
Mineral Oil and Gas Refineries 347
Driving force for implementationProcesses for odour and emission control features.
Example plantsMore than 1000 applications worldwide.
Reference literature[181, HP, 1998]
4.23.5.4 Sulphur dioxide abatement techniques
Flue gas desulphurisation is a technique by which SO2 is removed from flue gases or otherwaste gases. The process often involves an alkaline sorbent which captures SO2 and transformsit to a solid product. SO2 in refinery waste gases may have unabated concentration levels of1500 - 7500 mg/m3. Various FGD methods exist with varying SO2 removal efficiencies. TheFGD market is dominated by the so-called wet lime/limestone process followed by spray dryscrubbers, and the application of sorbent injection and regenerable processes. More informationcan be found in the Waste gas waste water BREF [312, EIPPCB, 2001].
Systems either of the regenerable or the non-regenerable type, do exist for SOx removal only,but also for simultaneous removal of dust and NOx. Most of these combined processes are stillin the development phase, but some are commercially available already. They are or maybecome competitive with systems consisting of separate units for SO2 elimination (i.e. wetscrubbers) and NOx removal (i.e. SCR).
DescriptionAdditive injection (AI) and Spray Dry Absorber (SD) are scrubbing processes that remove SO2according to the same principle as WS (reacting with a Ca-based sorbent) however, without thecomplicating requirements for producing a high-grade gypsum by-product (i.e. prescrubbingand oxidising). The by-product is a mixture of sulphites, sulphates and fly-ash for which thereare few or no useful applications.
The AI-process provides moderate SO2 removal at relative low sulphur loads. A dry sorbent isinjected in the furnace. The sorbent used is limestone or hydrated lime (for small boilers, moreactive sodium bicarbonate (NaHCO3) is injected in the flue gas duct).
The SNOX process combines high removal of SO2, NOx and particulates. More information seeSection 4.23.8
The seawater scrubbing process uses the natural alkaline - bicarbonates - of seawater to removeSO2. This implies a potential for high removal efficiencies. The discharge will contain sulphateand chlorine ions - which are a natural constituent of seawater.
In the Walther (WA)-process, SO2 is absorbed by spray injection of aqueous ammonia, yieldingammonium sulphite. The sulphite is subsequently oxidised to sulphate. The ammonium saltsolution from the scrubbing section is concentrated in an evaporation unit and granulated. Theend-product is a marketable fertiliser.
The Wellman Lord (WL)-process is the most widely used regenerable process. The process isbased on sodium sulphite/bisulphite equilibrium.
Present-day Wet Limestone Scrubber (WS)-systems are very much improved and less complexthan the earlier systems. Generally a limestone/water slurry is used as the sorbent. Gypsum isproduced by oxidation (aeration) in the sump of the absorber.
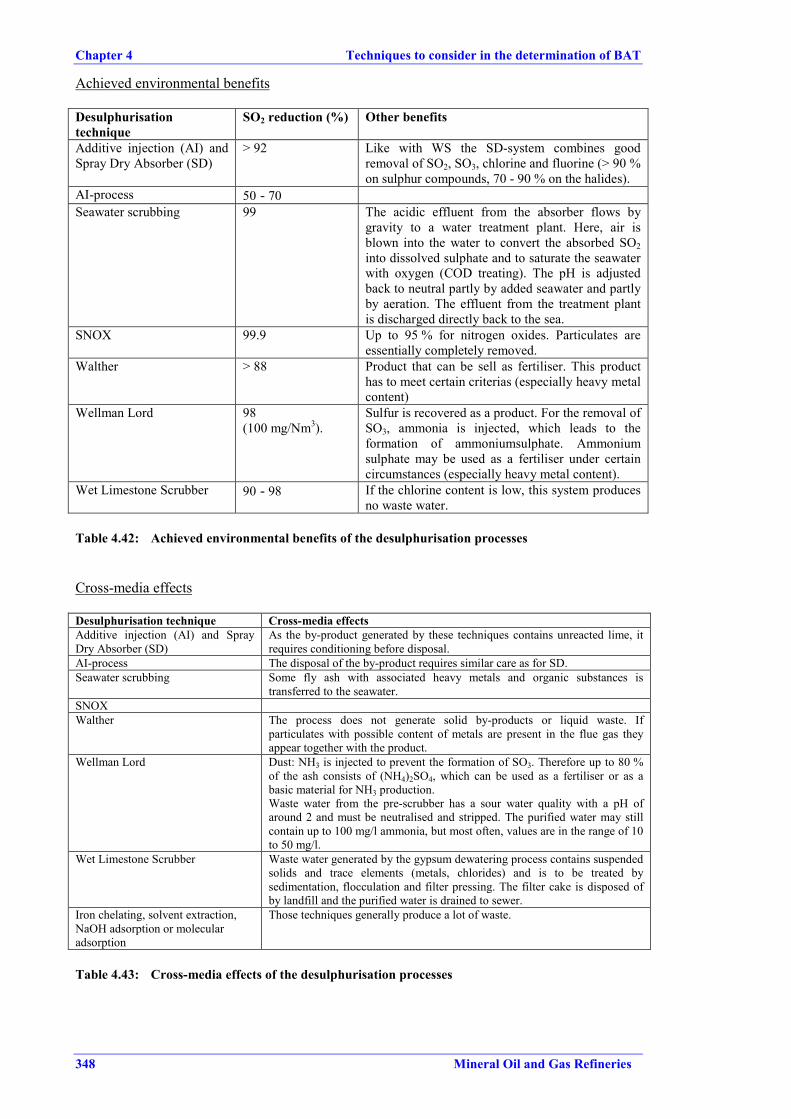
Chapter 4 Techniques to consider in the determination of BAT
348 Mineral Oil and Gas Refineries
Achieved environmental benefits
Desulphurisationtechnique
SO2 reduction (%) Other benefits
Additive injection (AI) andSpray Dry Absorber (SD)
> 92 Like with WS the SD-system combines goodremoval of SO2, SO3, chlorine and fluorine (> 90 %on sulphur compounds, 70 - 90 % on the halides).
AI-process 50 - 70Seawater scrubbing 99 The acidic effluent from the absorber flows by
gravity to a water treatment plant. Here, air isblown into the water to convert the absorbed SO2into dissolved sulphate and to saturate the seawaterwith oxygen (COD treating). The pH is adjustedback to neutral partly by added seawater and partlyby aeration. The effluent from the treatment plantis discharged directly back to the sea.
SNOX 99.9 Up to 95 % for nitrogen oxides. Particulates areessentially completely removed.
Walther > 88 Product that can be sell as fertiliser. This producthas to meet certain criterias (especially heavy metalcontent)
Wellman Lord 98(100 mg/Nm3).
Sulfur is recovered as a product. For the removal ofSO3, ammonia is injected, which leads to theformation of ammoniumsulphate. Ammoniumsulphate may be used as a fertiliser under certaincircumstances (especially heavy metal content).
Wet Limestone Scrubber 90 - 98 If the chlorine content is low, this system producesno waste water.
Table 4.42: Achieved environmental benefits of the desulphurisation processes
Cross-media effects
Desulphurisation technique Cross-media effectsAdditive injection (AI) and SprayDry Absorber (SD)
As the by-product generated by these techniques contains unreacted lime, itrequires conditioning before disposal.
AI-process The disposal of the by-product requires similar care as for SD.Seawater scrubbing Some fly ash with associated heavy metals and organic substances is
transferred to the seawater.SNOXWalther The process does not generate solid by-products or liquid waste. If
particulates with possible content of metals are present in the flue gas theyappear together with the product.
Wellman Lord Dust: NH3 is injected to prevent the formation of SO3. Therefore up to 80 %of the ash consists of (NH4)2SO4, which can be used as a fertiliser or as abasic material for NH3 production.Waste water from the pre-scrubber has a sour water quality with a pH ofaround 2 and must be neutralised and stripped. The purified water may stillcontain up to 100 mg/l ammonia, but most often, values are in the range of 10to 50 mg/l.
Wet Limestone Scrubber Waste water generated by the gypsum dewatering process contains suspendedsolids and trace elements (metals, chlorides) and is to be treated bysedimentation, flocculation and filter pressing. The filter cake is disposed ofby landfill and the purified water is drained to sewer.
Iron chelating, solvent extraction,NaOH adsorption or molecularadsorption
Those techniques generally produce a lot of waste.
Table 4.43: Cross-media effects of the desulphurisation processes
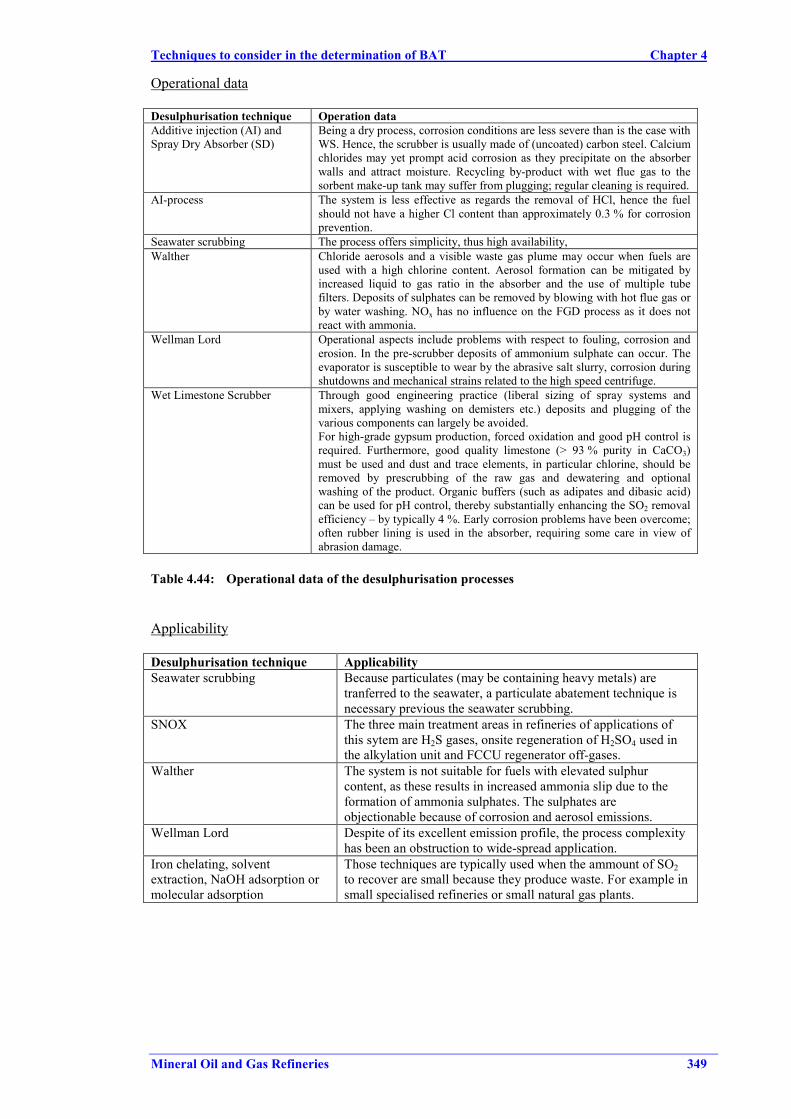
Techniques to consider in the determination of BAT Chapter 4
Mineral Oil and Gas Refineries 349
Operational data
Desulphurisation technique Operation dataAdditive injection (AI) andSpray Dry Absorber (SD)
Being a dry process, corrosion conditions are less severe than is the case withWS. Hence, the scrubber is usually made of (uncoated) carbon steel. Calciumchlorides may yet prompt acid corrosion as they precipitate on the absorberwalls and attract moisture. Recycling by-product with wet flue gas to thesorbent make-up tank may suffer from plugging; regular cleaning is required.
AI-process The system is less effective as regards the removal of HCl, hence the fuelshould not have a higher Cl content than approximately 0.3 % for corrosionprevention.
Seawater scrubbing The process offers simplicity, thus high availability,Walther Chloride aerosols and a visible waste gas plume may occur when fuels are
used with a high chlorine content. Aerosol formation can be mitigated byincreased liquid to gas ratio in the absorber and the use of multiple tubefilters. Deposits of sulphates can be removed by blowing with hot flue gas orby water washing. NOx has no influence on the FGD process as it does notreact with ammonia.
Wellman Lord Operational aspects include problems with respect to fouling, corrosion anderosion. In the pre-scrubber deposits of ammonium sulphate can occur. Theevaporator is susceptible to wear by the abrasive salt slurry, corrosion duringshutdowns and mechanical strains related to the high speed centrifuge.
Wet Limestone Scrubber Through good engineering practice (liberal sizing of spray systems andmixers, applying washing on demisters etc.) deposits and plugging of thevarious components can largely be avoided.For high-grade gypsum production, forced oxidation and good pH control isrequired. Furthermore, good quality limestone (> 93 % purity in CaCO3)must be used and dust and trace elements, in particular chlorine, should beremoved by prescrubbing of the raw gas and dewatering and optionalwashing of the product. Organic buffers (such as adipates and dibasic acid)can be used for pH control, thereby substantially enhancing the SO2 removalefficiency – by typically 4 %. Early corrosion problems have been overcome;often rubber lining is used in the absorber, requiring some care in view ofabrasion damage.
Table 4.44: Operational data of the desulphurisation processes
Applicability
Desulphurisation technique ApplicabilitySeawater scrubbing Because particulates (may be containing heavy metals) are
tranferred to the seawater, a particulate abatement technique isnecessary previous the seawater scrubbing.
SNOX The three main treatment areas in refineries of applications ofthis sytem are H2S gases, onsite regeneration of H2SO4 used inthe alkylation unit and FCCU regenerator off-gases.
Walther The system is not suitable for fuels with elevated sulphurcontent, as these results in increased ammonia slip due to theformation of ammonia sulphates. The sulphates areobjectionable because of corrosion and aerosol emissions.
Wellman Lord Despite of its excellent emission profile, the process complexityhas been an obstruction to wide-spread application.
Iron chelating, solventextraction, NaOH adsorption ormolecular adsorption
Those techniques are typically used when the ammount of SO2to recover are small because they produce waste. For example insmall specialised refineries or small natural gas plants.
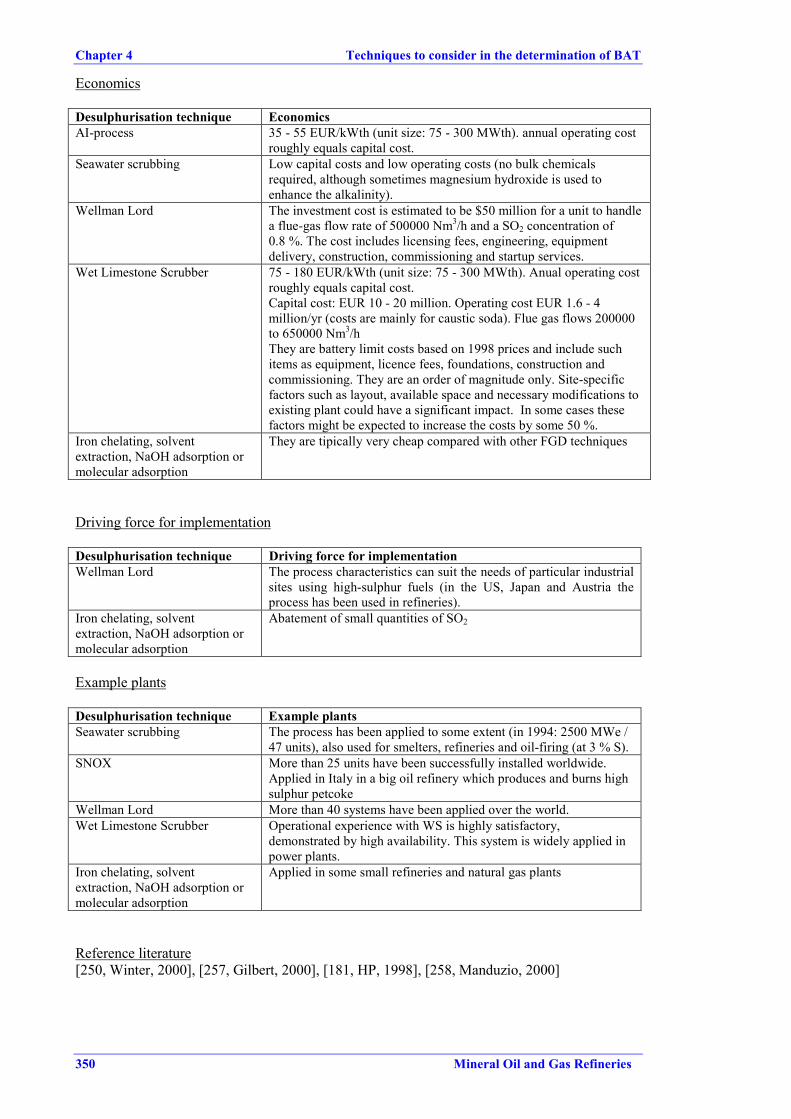
Chapter 4 Techniques to consider in the determination of BAT
350 Mineral Oil and Gas Refineries
Economics
Desulphurisation technique EconomicsAI-process 35 - 55 EUR/kWth (unit size: 75 - 300 MWth). annual operating cost
roughly equals capital cost.Seawater scrubbing Low capital costs and low operating costs (no bulk chemicals
required, although sometimes magnesium hydroxide is used toenhance the alkalinity).
Wellman Lord The investment cost is estimated to be $50 million for a unit to handlea flue-gas flow rate of 500000 Nm3/h and a SO2 concentration of0.8 %. The cost includes licensing fees, engineering, equipmentdelivery, construction, commissioning and startup services.
Wet Limestone Scrubber 75 - 180 EUR/kWth (unit size: 75 - 300 MWth). Anual operating costroughly equals capital cost.Capital cost: EUR 10 - 20 million. Operating cost EUR 1.6 - 4million/yr (costs are mainly for caustic soda). Flue gas flows 200000to 650000 Nm3/hThey are battery limit costs based on 1998 prices and include suchitems as equipment, licence fees, foundations, construction andcommissioning. They are an order of magnitude only. Site-specificfactors such as layout, available space and necessary modifications toexisting plant could have a significant impact. In some cases thesefactors might be expected to increase the costs by some 50 %.
Iron chelating, solventextraction, NaOH adsorption ormolecular adsorption
They are tipically very cheap compared with other FGD techniques
Driving force for implementation
Desulphurisation technique Driving force for implementationWellman Lord The process characteristics can suit the needs of particular industrial
sites using high-sulphur fuels (in the US, Japan and Austria theprocess has been used in refineries).
Iron chelating, solventextraction, NaOH adsorption ormolecular adsorption
Abatement of small quantities of SO2
Example plants
Desulphurisation technique Example plantsSeawater scrubbing The process has been applied to some extent (in 1994: 2500 MWe /
47 units), also used for smelters, refineries and oil-firing (at 3 % S).SNOX More than 25 units have been successfully installed worldwide.
Applied in Italy in a big oil refinery which produces and burns highsulphur petcoke
Wellman Lord More than 40 systems have been applied over the world.Wet Limestone Scrubber Operational experience with WS is highly satisfactory,
demonstrated by high availability. This system is widely applied inpower plants.
Iron chelating, solventextraction, NaOH adsorption ormolecular adsorption
Applied in some small refineries and natural gas plants
Reference literature[250, Winter, 2000], [257, Gilbert, 2000], [181, HP, 1998], [258, Manduzio, 2000]
Techniques to consider in the determination of BAT Chapter 4
Mineral Oil and Gas Refineries 351
4.23.6 VOC abatement techniques
When transferring liquids to vessels at atmospheric pressure, the existing mixture of vapour andgas (often air, but also inerts) in the receiving vessel is often emitted to atmosphere. Suchloading operation is recognised as having an impact on the environment due to the presence ofVOC, a precursor of ozone. EU Stage 1 Directive 94/63/EC requires that Member Statesprescribe the specific emission reduction measures is laid down in the annexes of the Directive.Also the application of VRUs to prevent escape of these vapours to the atmosphere is specifiedin the directive. VRUs aim for recovery of hydrocarbons for re-use. In some cases recovery isnot economic, and preference will be given to vapour destruction units (VDU). A more generalterm covering both options is Vapour Handling Systems (VHS).
4.23.6.1 Establishment of a programme for prevention, detection and control offugitive emissions
DescriptionControl of fugitive emissions involves minimising leaks and spills through equipment changes,procedure changes, and improved monitoring, good housekeeping and maintenance practices.The aim in all refinery processes should be to prevent or minimise the release of VOCS.Because of the size, scope and nature of hydrocarbon processing on refineries, this presents amajor challenge, which requires an overall strategy that also devolves down into individualaction at a process unit and plant item level. Most VOCs are released through fugitive lossesfrom sources including valves, flanges, pump seals and equipment vents. Even a small simplerefinery may have over 10000 potential sources and the problem is magnified proportionally onthe complete complex refineries.
In the case of process component fugitive releases the only real option, is the implementation ofa permanent on-going Leak Detection and Repair (LDAR) programme. This should bedeveloped and tailored to suit the situation concerned, using appropriate techniques, frequenciesand priorities. It should provide estimates of fugitive VOC releases for monitoring returns andenable action to be taken to minimise releases. A LDAR contains the following elements:� type of measurement (e.g. detection limit of 500 ppm for valves and flanges, against the
interface of the flange)� frequency (e.g. twice a year)� type of components to be checked (e.g. pumps, control valves, heat exchangers, connectors,
flanges)� type of compound lines (e.g. exclude lines that contain liquids with a vapour pressure above
13 kPa)� what leaks should be repaired and how fast the action should be taken
The principal areas of fugitive loss are well known and their minimising has been the subject ofmuch investigation and action on refineries world-wide, mainly led by operators subject toextremely tight regulation. Some techniques to consider can be:• an essential first step of any programme is to establish a fugitive release inventory for the
refinery. This normally involves a combination of sampling, measurements, environmentalmonitoring, dispersion modeling and estimates based on emission factors
• identify all potential sources of VOC releases, by establishing population counts ofequipment components in line with up-to-date P & I drawings for processes. This surveyshould cover gas, vapour and light liquid duties
• quantifying of the VOC releases, initially as "baseline" estimates, and subsequently to morerefined levels. Suitable protocols for this include the “1995 Protocol for Equipment leakEmission Estimates” (USAEPA-453/R-95-017) for process component losses and APImethods(9) for tankage losses. Some major companies have developed their own techniquesand protocols. USAEPA method defines an emission estimate of 10000 ppm and is morecorrect for a plant that until today, has not implemented LDAR programme. A recent reportshown that from 1000 valves analysed by type found that the average leakage measured on
Chapter 4 Techniques to consider in the determination of BAT
352 Mineral Oil and Gas Refineries
regulating control valves was over 70000 ppm. Some TWG members question that highemission leakage limit and propose to set the limit to 500 - 1000 ppm and specially withsmall chemicals are handled.
• using appropriate dispersion modeling techniques, predict atmospheric mass flux andconcentrations
• employing environmental monitoring techniques, compare the predicted situation with themeasured one
• identification of the processes that have higher fugitive releases• VOC releases need also to be minimised from refinery utility and ancillary systems and
during plant maintenance and cleaning operations. Hydrocarbons should be minimised incooling water and adequate separation facilities provided to deal with incidents ofcontamination. After depressurising off-line process vessels to RFG/flare, they neednormally to be steamed out to flare and residual liquids returned to oil slops plants, not runto drain before venting to air, when personnel entry is required
• vapour recovery/incineration/use• a strategy to reduce VOC emissions may include a complete inventory and quantification by
a DIAL LIDAR technique (differential absorption light detection and ranging) (seeSection 3.26 for more information).
• emissions that occur through relief valves are to be routed to flare or dedicated incinerationsystems, and in exceptional cases vented to a safe location
• fugitive VOC emissions (sometimes containing H2S) can be minimised through doublemechanical seals on pumps, compressors or agitators. For example dual pressurized sealingsystems on pumps virtually eliminate leakage of the process fluid into the environment andtypically have emissions approaching zero, usually described as ‘not measurable withexisting instrument technology’
• use of low emission valve stem packing (500 ppm) on critical valves, e.g. rising stem gatetype control valves in continuous operation, particularly on gas/light liquid highpressure/temperature duties. Valves is the type of equipment that causes most of the leaks(40 - 65 %) Valves with rising stems and in particular control valves are an importantsource of leaks and may account for as much as 64% of the leaking losses in a plant. It istherefore recommended that a high integrity low emission packing be installed on thesevalves that can provide emissions performance below 500 ppm and at the same time is firesafe. To ensure low term leakage performance valve live loading spring assemblies mountedon the gland bolts will ensure that the low emission packing is constantly loaded even as thematerial relaxes over time. Control Valve solutions with valve live loading exist asMaximum Achievable Control Technology (MACT) and emissions performance of 3-5years is achievable at below 500 ppm. Low emission packing should be specified, andshould be certified by an independent test by a reputable testing house. Packing also be firesafe. Rising Stem control valves even with low emission packings can leak excessively afterthe packing has relaxed in the stuffing box. Studies carried out by a French researchinstitute have shown average leakage concentrations on control valves to be as much as70000 ppm. (Power Point Slide Enclosed) In the chemical, petrochemical and refineryindustry the use of packed valves incorporating live loading spring assemblies mounted onthe gland bolts compensates for normal packing relaxation or the effects of thermal cyclingand vibration. Valve Live Loading systems offer considerable improvements in long-termsealability on rising stem gate valves, globe valves and regulating control valves. Onfrequently operated rising stem valves (most problematic) Live Loading offers aconsiderable improvement in long-term emissions performance (< 500 ppm for 3-5 years).Valves have been identified as the greatest source of fugitive emissions in refineries andrising stem valves particularly frequently operated valves represent the greatest sources offugitive emissions.
• use of alternative proven types of low-release valves where gate valves are not essential,e.g. quarter turn and sleeved plug valves, both of which have two independent seals
• use of balanced bellows type relief valves to minimise valve leakage outside the design liftrange and piping of reliefs to RFG or flare gas, normally via phase separation, withoutheader back pressure
Techniques to consider in the determination of BAT Chapter 4
Mineral Oil and Gas Refineries 353
• minimising the number of flanged connections on pipelines and the use of highspecification jointing materials. Flanges should be minimized and high integrity sealingmaterials should be used and should be fire safe materials. In some critical services,particularly where thermal cycling or possible vibration may exist, flange disc springs canbe mounted under the flange bolts to compensate for the effects of thermal cycling andgasket relaxation. Such solutions combined with high performance sealing materials canprovide emissions performance of <500 ppm for periods of 3-5 years. Often heatexchangers are not given a separate consideration in the discussion of fugitive emissions.On a typical refinery there can be several hundred heat exchangers. Due to the size of theseflanged connections, the large no. of bolts involved, the non uniform temperature on theflange and the thermal cycling conditions under which many operate, it is recommendedthat flange disc springs are fitted under the nuts of the bolts to maintain a constant glandload on the sealing material. Heat exchangers have a far greater tendency to leak thannormal pipe flanges due to their dimensions and particularly in thermal cycling conditions.High integrity sealing materials are recommended and not the standard typical metaljacketed gaskets as indicated in the design codes.
• use of canned pumps or double seals on conventional pumps. Study the use of non-leakingpumps as diaphragm pumps, bellow pumps, canned rotor pumps, or pumps with magneticclutches. Magnetic pumps cannot be used for clean liquids at low temperature. Emissionsfrom centrifugal pumps can be reduced to 33 % by replacing packed seals by mechanicalseals. Turbo-compressors can be sealed with labyrinth glands, with rotating rings or floatingrings in liquid seals. An escape of the transported medium through the seals should beprevented e.g. by inert gas or liquid sealing medium at elevated pressure. Furthermore,magnetic drive pumps and canned motor pumps have limited applicability and care must betaken when using such pumps in contaminated process streams, process streams containingparticulate and higher pressures. It should also be noted that magnetic pumps typically havelower efficiency compared to conventional pumps, drawing more power for the sameservice. In end effect this transfers emissions from the pump ( as VOC emissions) to thestack ( as CO2, SO2, NO2 emissions).
• piping of compressor seals, vent and purge lines to RFG or flare systems• use of end caps or plugs on open ended lines and closed loop flush on liquid sampling
points (no applicable with circulating fluid (pump discharge) or in tanks). Minimising thereleases to air from process hydrocarbon analysers, by optimising samplingvolume/frequency and venting to RFG or flare systems
• install a maintenance drain-out system to eliminate open discharges from drains• using totally closed-loop in all routine samplers. To follow product quality, inspection
requirements, environmental standards, etc. a sampling schedule is typically set up. Withroutine sampling is understood those that are frequently used or needed. For example, byroutine samplers is understood, the samplers of effluent water quality, daily samples ofprocessed crude fuel fired, fuel gas, certain feedstocks (i.e. FCCU), that are taken to analysethe sulphur concentration. and samplers from intermediates, final products, tanks, etc.
Achieved environmental benefitsFugitive emissions are one of the largest sources of refinery hydrocarbon emissions. A leakdetection and repair (LDAR) programme consists of using a portable VOC detecting instrumentto detect leaks during regularly scheduled inspections of valves, flanges, and pump seals. Leaksare then repaired immediately or are scheduled for repair as quickly as possible. A LDARprogramme could reduce fugitive emissions 40 to 64 percent, depending on the frequency ofinspections.
Techniques to reduce VOC emissions are: efficient seals and valves, good maintenanceprogrammes and monitoring of the emissions. Fugitive emissions can be reduced to 0.01 %weight when normal fugitive emissions has been calculated as 0.03 % weight on throughput.The investment cost for those techniques is negligeble and the operating cost is around EUR 0.1million per year (accounting for 190 EUR per tonne of VOC recovered).
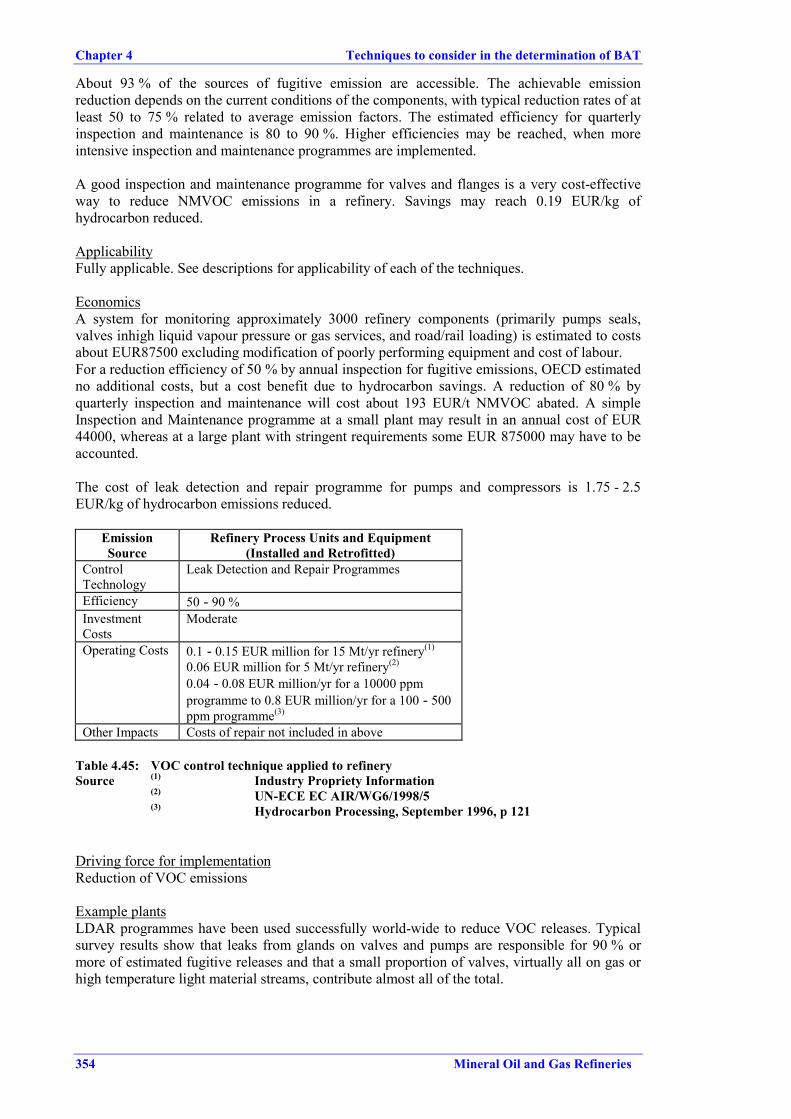
Chapter 4 Techniques to consider in the determination of BAT
354 Mineral Oil and Gas Refineries
About 93 % of the sources of fugitive emission are accessible. The achievable emissionreduction depends on the current conditions of the components, with typical reduction rates of atleast 50 to 75 % related to average emission factors. The estimated efficiency for quarterlyinspection and maintenance is 80 to 90 %. Higher efficiencies may be reached, when moreintensive inspection and maintenance programmes are implemented.
A good inspection and maintenance programme for valves and flanges is a very cost-effectiveway to reduce NMVOC emissions in a refinery. Savings may reach 0.19 EUR/kg ofhydrocarbon reduced.
ApplicabilityFully applicable. See descriptions for applicability of each of the techniques.
EconomicsA system for monitoring approximately 3000 refinery components (primarily pumps seals,valves inhigh liquid vapour pressure or gas services, and road/rail loading) is estimated to costsabout EUR87500 excluding modification of poorly performing equipment and cost of labour.For a reduction efficiency of 50 % by annual inspection for fugitive emissions, OECD estimatedno additional costs, but a cost benefit due to hydrocarbon savings. A reduction of 80 % byquarterly inspection and maintenance will cost about 193 EUR/t NMVOC abated. A simpleInspection and Maintenance programme at a small plant may result in an annual cost of EUR44000, whereas at a large plant with stringent requirements some EUR 875000 may have to beaccounted.
The cost of leak detection and repair programme for pumps and compressors is 1.75 - 2.5EUR/kg of hydrocarbon emissions reduced.
EmissionSource
Refinery Process Units and Equipment(Installed and Retrofitted)
ControlTechnology
Leak Detection and Repair Programmes
Efficiency 50 - 90 %InvestmentCosts
Moderate
Operating Costs 0.1 - 0.15 EUR million for 15 Mt/yr refinery(1)
0.06 EUR million for 5 Mt/yr refinery(2)
0.04 - 0.08 EUR million/yr for a 10000 ppmprogramme to 0.8 EUR million/yr for a 100 - 500ppm programme(3)
Other Impacts Costs of repair not included in above
Table 4.45: VOC control technique applied to refinerySource (1) Industry Propriety Information
(2) UN-ECE EC AIR/WG6/1998/5(3) Hydrocarbon Processing, September 1996, p 121
Driving force for implementationReduction of VOC emissions
Example plantsLDAR programmes have been used successfully world-wide to reduce VOC releases. Typicalsurvey results show that leaks from glands on valves and pumps are responsible for 90 % ormore of estimated fugitive releases and that a small proportion of valves, virtually all on gas orhigh temperature light material streams, contribute almost all of the total.
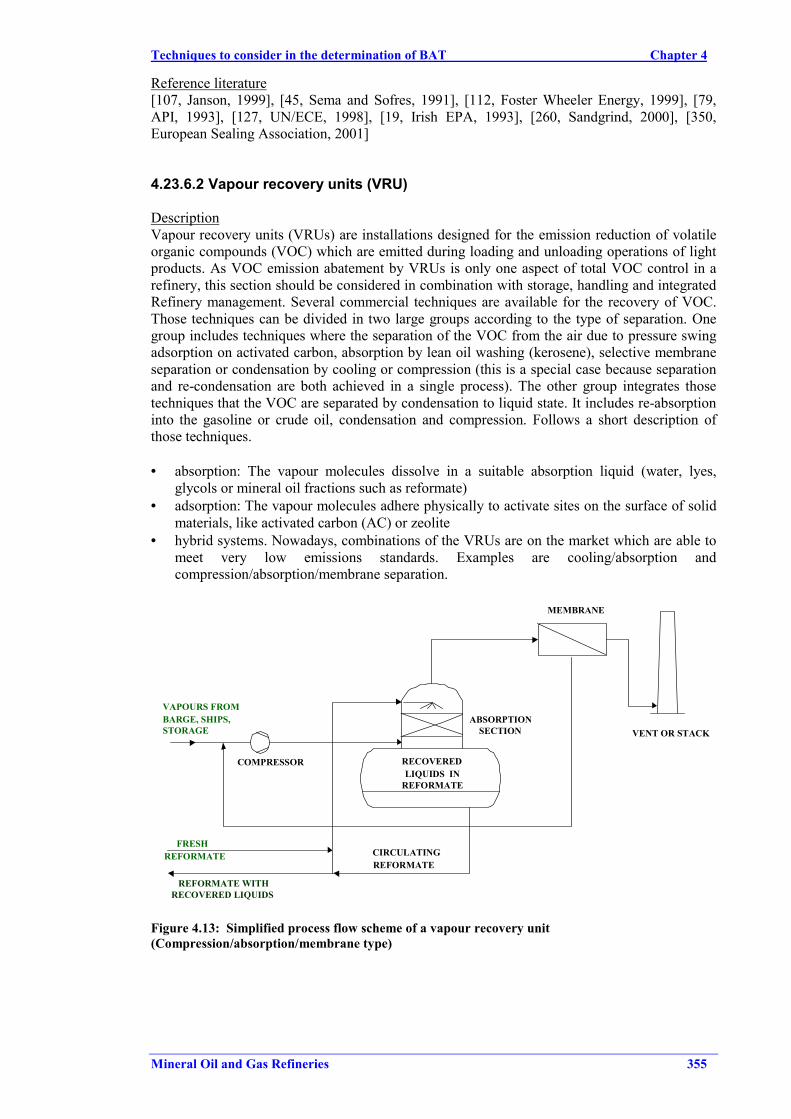
Techniques to consider in the determination of BAT Chapter 4
Mineral Oil and Gas Refineries 355
Reference literature[107, Janson, 1999], [45, Sema and Sofres, 1991], [112, Foster Wheeler Energy, 1999], [79,API, 1993], [127, UN/ECE, 1998], [19, Irish EPA, 1993], [260, Sandgrind, 2000], [350,European Sealing Association, 2001]
4.23.6.2 Vapour recovery units (VRU)
DescriptionVapour recovery units (VRUs) are installations designed for the emission reduction of volatileorganic compounds (VOC) which are emitted during loading and unloading operations of lightproducts. As VOC emission abatement by VRUs is only one aspect of total VOC control in arefinery, this section should be considered in combination with storage, handling and integratedRefinery management. Several commercial techniques are available for the recovery of VOC.Those techniques can be divided in two large groups according to the type of separation. Onegroup includes techniques where the separation of the VOC from the air due to pressure swingadsorption on activated carbon, absorption by lean oil washing (kerosene), selective membraneseparation or condensation by cooling or compression (this is a special case because separationand re-condensation are both achieved in a single process). The other group integrates thosetechniques that the VOC are separated by condensation to liquid state. It includes re-absorptioninto the gasoline or crude oil, condensation and compression. Follows a short description ofthose techniques.
• absorption: The vapour molecules dissolve in a suitable absorption liquid (water, lyes,glycols or mineral oil fractions such as reformate)
• adsorption: The vapour molecules adhere physically to activate sites on the surface of solidmaterials, like activated carbon (AC) or zeolite
• hybrid systems. Nowadays, combinations of the VRUs are on the market which are able tomeet very low emissions standards. Examples are cooling/absorption andcompression/absorption/membrane separation.
FRESHREFORMATE
REFORMATE WITHRECOVERED LIQUIDS
VENT OR STACK
VAPOURS FROMBARGE, SHIPS,STORAGE
MEMBRANE
RECOVEREDLIQUIDS IN
REFORMATE
ABSORPTIONSECTION
COMPRESSOR
CIRCULATINGREFORMATE
Figure 4.13: Simplified process flow scheme of a vapour recovery unit(Compression/absorption/membrane type)
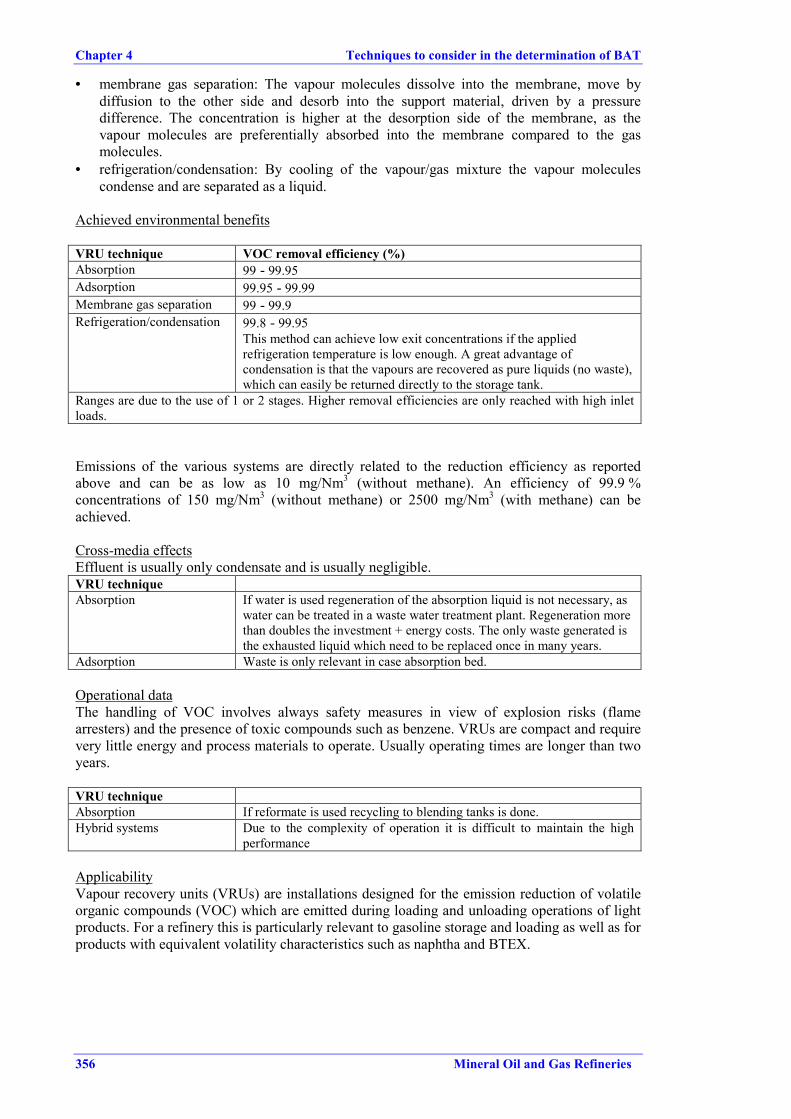
Chapter 4 Techniques to consider in the determination of BAT
356 Mineral Oil and Gas Refineries
• membrane gas separation: The vapour molecules dissolve into the membrane, move bydiffusion to the other side and desorb into the support material, driven by a pressuredifference. The concentration is higher at the desorption side of the membrane, as thevapour molecules are preferentially absorbed into the membrane compared to the gasmolecules.
• refrigeration/condensation: By cooling of the vapour/gas mixture the vapour moleculescondense and are separated as a liquid.
Achieved environmental benefits
VRU technique VOC removal efficiency (%)Absorption 99 - 99.95Adsorption 99.95 - 99.99Membrane gas separation 99 - 99.9Refrigeration/condensation 99.8 - 99.95
This method can achieve low exit concentrations if the appliedrefrigeration temperature is low enough. A great advantage ofcondensation is that the vapours are recovered as pure liquids (no waste),which can easily be returned directly to the storage tank.
Ranges are due to the use of 1 or 2 stages. Higher removal efficiencies are only reached with high inletloads.
Emissions of the various systems are directly related to the reduction efficiency as reportedabove and can be as low as 10 mg/Nm3 (without methane). An efficiency of 99.9 %concentrations of 150 mg/Nm3 (without methane) or 2500 mg/Nm3 (with methane) can beachieved.
Cross-media effectsEffluent is usually only condensate and is usually negligible.VRU techniqueAbsorption If water is used regeneration of the absorption liquid is not necessary, as
water can be treated in a waste water treatment plant. Regeneration morethan doubles the investment + energy costs. The only waste generated isthe exhausted liquid which need to be replaced once in many years.
Adsorption Waste is only relevant in case absorption bed.
Operational dataThe handling of VOC involves always safety measures in view of explosion risks (flamearresters) and the presence of toxic compounds such as benzene. VRUs are compact and requirevery little energy and process materials to operate. Usually operating times are longer than twoyears.
VRU techniqueAbsorption If reformate is used recycling to blending tanks is done.Hybrid systems Due to the complexity of operation it is difficult to maintain the high
performance
ApplicabilityVapour recovery units (VRUs) are installations designed for the emission reduction of volatileorganic compounds (VOC) which are emitted during loading and unloading operations of lightproducts. For a refinery this is particularly relevant to gasoline storage and loading as well as forproducts with equivalent volatility characteristics such as naphtha and BTEX.
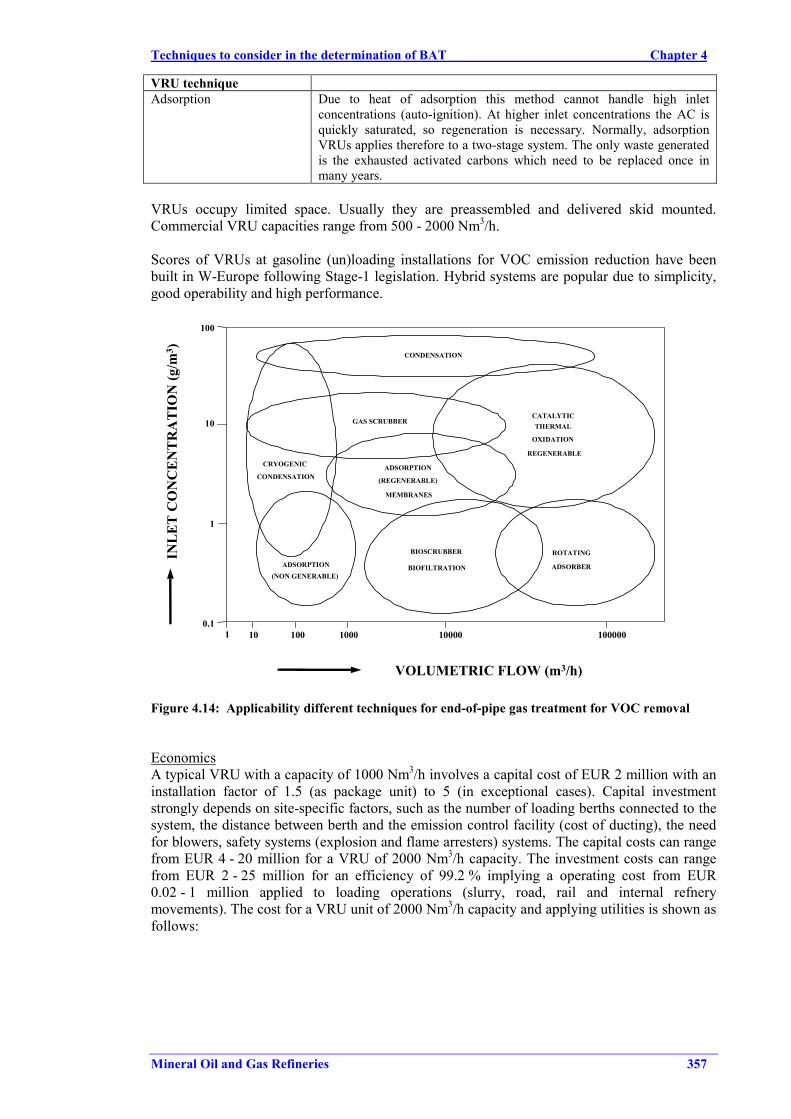
Techniques to consider in the determination of BAT Chapter 4
Mineral Oil and Gas Refineries 357
VRU techniqueAdsorption Due to heat of adsorption this method cannot handle high inlet
concentrations (auto-ignition). At higher inlet concentrations the AC isquickly saturated, so regeneration is necessary. Normally, adsorptionVRUs applies therefore to a two-stage system. The only waste generatedis the exhausted activated carbons which need to be replaced once inmany years.
VRUs occupy limited space. Usually they are preassembled and delivered skid mounted.Commercial VRU capacities range from 500 - 2000 Nm3/h.
Scores of VRUs at gasoline (un)loading installations for VOC emission reduction have beenbuilt in W-Europe following Stage-1 legislation. Hybrid systems are popular due to simplicity,good operability and high performance.
INLE
T C
ON
CEN
TRA
TIO
N (g
/m3 ) CONDENSATION
GAS SCRUBBER
ADSORPTION
(REGENERABLE)
MEMBRANES
CRYOGENIC
CONDENSATION
ADSORPTION(NON GENERABLE)
BIOSCRUBBER
BIOFILTRATION
ROTATING
ADSORBER
OXIDATION
THERMALCATALYTIC
REGENERABLE
0.110 100 1000 10000 100000
1
10
100
VOLUMETRIC FLOW (m3/h)
1
Figure 4.14: Applicability different techniques for end-of-pipe gas treatment for VOC removal
EconomicsA typical VRU with a capacity of 1000 Nm3/h involves a capital cost of EUR 2 million with aninstallation factor of 1.5 (as package unit) to 5 (in exceptional cases). Capital investmentstrongly depends on site-specific factors, such as the number of loading berths connected to thesystem, the distance between berth and the emission control facility (cost of ducting), the needfor blowers, safety systems (explosion and flame arresters) systems. The capital costs can rangefrom EUR 4 - 20 million for a VRU of 2000 Nm3/h capacity. The investment costs can rangefrom EUR 2 - 25 million for an efficiency of 99.2 % implying a operating cost from EUR0.02 - 1 million applied to loading operations (slurry, road, rail and internal refnerymovements). The cost for a VRU unit of 2000 Nm3/h capacity and applying utilities is shown asfollows:
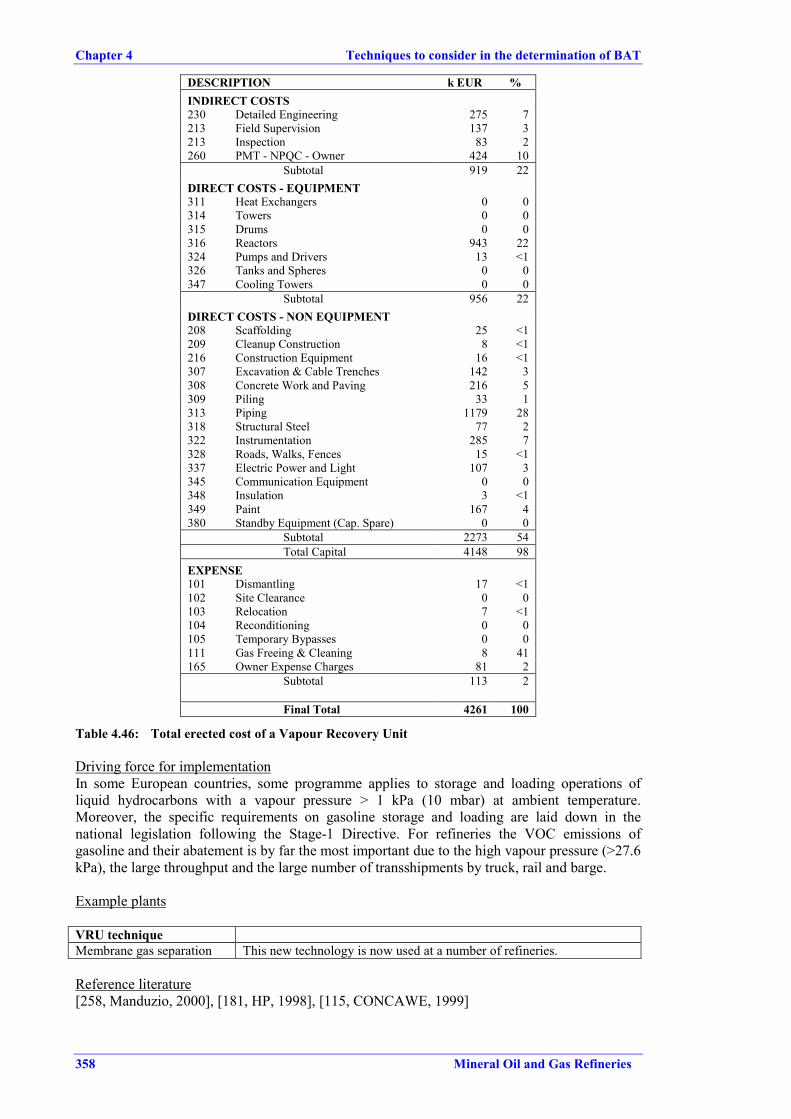
Chapter 4 Techniques to consider in the determination of BAT
358 Mineral Oil and Gas Refineries
DESCRIPTION k EUR %INDIRECT COSTS230 Detailed Engineering 275 7213 Field Supervision 137 3213 Inspection 83 2260 PMT - NPQC - Owner 424 10
Subtotal 919 22DIRECT COSTS - EQUIPMENT311 Heat Exchangers 0 0314 Towers 0 0315 Drums 0 0316 Reactors 943 22324 Pumps and Drivers 13 <1326 Tanks and Spheres 0 0347 Cooling Towers 0 0
Subtotal 956 22DIRECT COSTS - NON EQUIPMENT208 Scaffolding 25 <1209 Cleanup Construction 8 <1216 Construction Equipment 16 <1307 Excavation & Cable Trenches 142 3308 Concrete Work and Paving 216 5309 Piling 33 1313 Piping 1179 28318 Structural Steel 77 2322 Instrumentation 285 7328 Roads, Walks, Fences 15 <1337 Electric Power and Light 107 3345 Communication Equipment 0 0348 Insulation 3 <1349 Paint 167 4380 Standby Equipment (Cap. Spare) 0 0
Subtotal 2273 54Total Capital 4148 98
EXPENSE101 Dismantling 17 <1102 Site Clearance 0 0103 Relocation 7 <1104 Reconditioning 0 0105 Temporary Bypasses 0 0111 Gas Freeing & Cleaning 8 41165 Owner Expense Charges 81 2
Subtotal 113 2
Final Total 4261 100
Table 4.46: Total erected cost of a Vapour Recovery Unit
Driving force for implementationIn some European countries, some programme applies to storage and loading operations ofliquid hydrocarbons with a vapour pressure > 1 kPa (10 mbar) at ambient temperature.Moreover, the specific requirements on gasoline storage and loading are laid down in thenational legislation following the Stage-1 Directive. For refineries the VOC emissions ofgasoline and their abatement is by far the most important due to the high vapour pressure (>27.6kPa), the large throughput and the large number of transshipments by truck, rail and barge.
Example plants
VRU techniqueMembrane gas separation This new technology is now used at a number of refineries.
Reference literature[258, Manduzio, 2000], [181, HP, 1998], [115, CONCAWE, 1999]
Techniques to consider in the determination of BAT Chapter 4
Mineral Oil and Gas Refineries 359
4.23.6.3 Vapour Destruction (VD)In addition to vapour recovery also vapour destruction can be applied.
DescriptionTwo systems are relevant in this respect:• oxidation: The vapour molecules are converted to CO2 and H2O either by thermal oxidation
at high temperatures or by catalytic oxidation at lower temperatures. The stage 1 directiveonly allows oxidation in special situations, e.g. when energy is recovered by a gas motor
• biofiltration: Decomposition to CO2 and H2O is achieved at temperatures slightly aboveambient by micro-organisms located in a solid humidified mass.
VOC collection and destructionAnother control technique is to collect VOCs from vents, pumps and compressors and to routethem to a flare system.
Achieved environmental benefitsThermal oxidation: 99 - 99.9 %, Catalytic oxidation 95 - 99 %, Biofilters 95 - 99 %. Theefficiency of the biofilters is normally a controversy. Since high removal efficiencies are onlyreaqched with high inlet loads, emission concentrations well below 50 mg/Nm3 NMVOC arerarely achieved.Biotreatment: The units are rugged, silent, need minimal maintenance and no inputs. No fuel orchemicals are required. Biofilters remove and destroy aliphatic and aromatic hydrocarbons,other VOC, H2S and odors in off-gases from process streams, tank vents, relief valves, soilvapour extracion, waste water treatments, etc.
Cross-media effectsThermal oxidation can give unwanted combustion products such as NOx, requiring extratreatment. Catalytic oxidation requires less energy to arrive at combustion temperatures, and canbe competitive with thermal oxidation at low inlet concentrations. Thermal oxidation requiresgood primary and/or secondary safety measures to prevent explosions, while the efficiency ofcatalytic oxidation may be reduced by catalyst poisoning and ageing. Incineration of VOC alsogenerates CO2. Combustion of streams with low concentrations and for preheating of catalystsadditional fuel is consumed.
Waste is only relevant in case biofilters are exhausted. No secondary pollutants or wastes arecreated.
Operational dataUsually operating times are longer than two years. Biofilters: Input air should be 5 - 55 ºC andmoist.
ApplicabilityBiofilters: Any gas that can burn in air will oxidise in biofilters. Installation for the treatment offlows of 17 m3/h up to 135000 m3/h are found in the literature.Bioxidation: The method is highly suited for treatment of continuous constant-composition airstreams with low concentrations of organic pollutants. The method is not suitable for the directtreatment of the vapour/air mixtures often encountered in transshipments, because suchmixtures have mostly higher vapour concentrations (>1 % v/v) and appear as sudden peak flowsduring the rather infrequent unloading operations. Biotreatment facilities are certainly sensitiveto poisoning by presence of unexpected compounds in the incoming vapour stream.Consequently most of those systems needs continuous monitoring to prevent the entrance ofundesired compounds.
EconomicsThermal oxidation of VOCs. The economics of a thermal oxidation system with heat recoverywill depend on many factors, including the calorific value of the waste stream. If a thermaloxidiser is furnished with a gas-to-gas heat exchanger that has an efficiency of 60 % and a gas
Chapter 4 Techniques to consider in the determination of BAT
360 Mineral Oil and Gas Refineries
flow of 4720 l/s, the payback for heat recovery will be impressive. Assume natural gas, used assupplementary fuel, costs $20/ million of kcal and electric power cost $0.08/kWh. If a systemruns 24 h/day, 350 d/yr, the payback for the 200000$ additional capital investment for a plant-type heat exchanger would be less than five months.
Biofilters: Biofiltration costs significantly cost less than the other air pollution controltechniques. Capital costs vary with flowrate and the destruction/removal efficiency. Capitalcosts start at about $15/m3/h. Operation and maintenance costs are extremely low because nofuel or chemicals are required.
EmissionSource
Refinery Process Units and Equipment (Installed andRetrofitted)
ControlTechnology
Collection of atmospheric VOCs and relief valves toflare/incineration system
Efficiency up to 99.5 % destruction efficiency in incinerationInvestmentCosts
1.3 EUR million for5 Mt/yr refinery
Operating Costs 3.0 EUR millionOther Impacts Increase in CO2 emissions due to combustion
Table 4.47: VOC control technique applied to refinerySource: UN-ECE EC AIR/WG6/1998/5
Driving force for implementationReduction of VOCs
Example plantsThermal incineration: More than 107 units operaring in the world and over 76 portables.
Reference literature[118, VROM, 1999], [181, HP, 1998]
4.23.7 Flares
DescriptionFlares are used for safety and environmental control of discharges of undesired or excesscombustibles and for surges of gases in emergency situation or upsets. The flare is usuallyrequired to be smokeless for the gas flows that are expected to occur from normal day-to-dayoperation. This gas flow is usually designed at 15 to 20 percent of the maximum design flow.Flares may become an important SO2 emitter when clean fuels are used within the refinery.
Flare systems normally can be divided into two main sections, i.e. the flare collection systemwith a flare knock out drum and the flare stack itself. When dealing with large refinerycomplexes separate knock-out drums may be installed in different process areas with ‘blocking-in’ facilities to allow maintenance during shut downs of these areas.
In Figure 4.15 a simplified process flow diagram of a flare system is shown.
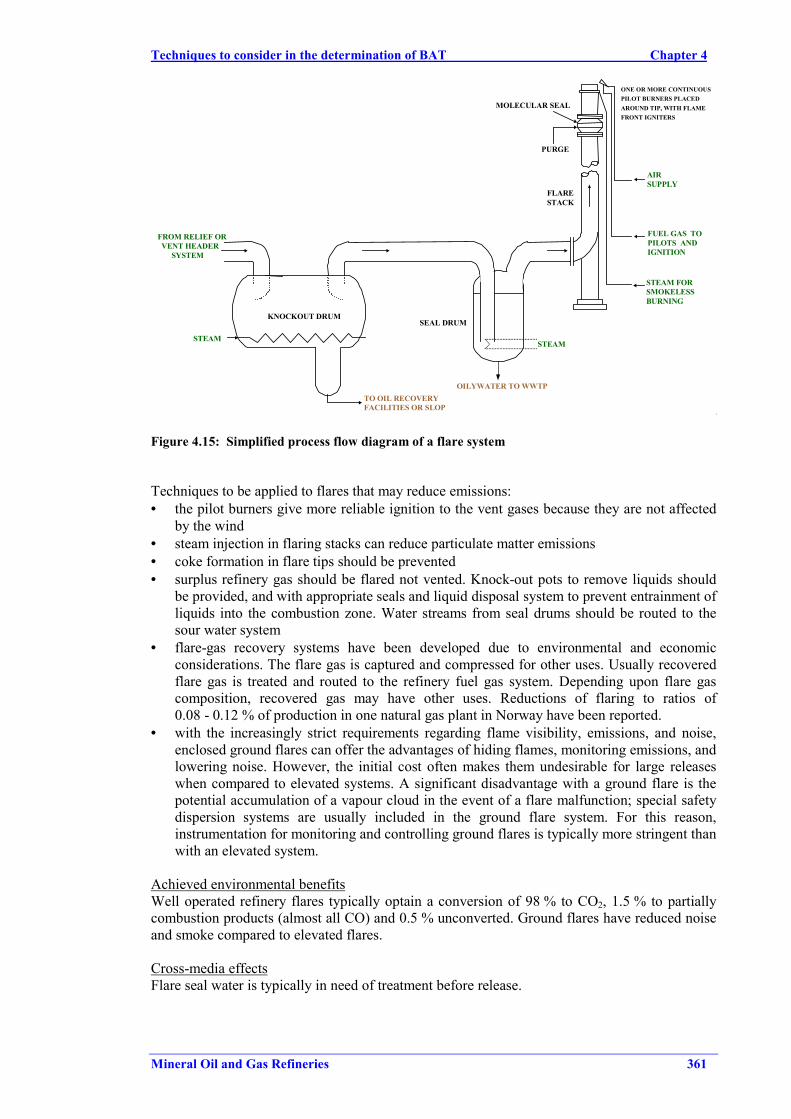
Techniques to consider in the determination of BAT Chapter 4
Mineral Oil and Gas Refineries 361
ONE OR MORE CONTINUOUSPILOT BURNERS PLACEDAROUND TIP, WITH FLAMEFRONT IGNITERS
AIRSUPPLY
FUEL GAS TOPILOTS ANDIGNITION
STEAM FORSMOKELESSBURNING
STEAMSTEAM
FROM RELIEF ORVENT HEADER
SYSTEM
PURGE
MOLECULAR SEAL
TO OIL RECOVERYFACILITIES OR SLOP
KNOCKOUT DRUM
OILYWATER TO WWTP
FLARESTACK
SEAL DRUM
Figure 4.15: Simplified process flow diagram of a flare system
Techniques to be applied to flares that may reduce emissions:• the pilot burners give more reliable ignition to the vent gases because they are not affected
by the wind• steam injection in flaring stacks can reduce particulate matter emissions• coke formation in flare tips should be prevented• surplus refinery gas should be flared not vented. Knock-out pots to remove liquids should
be provided, and with appropriate seals and liquid disposal system to prevent entrainment ofliquids into the combustion zone. Water streams from seal drums should be routed to thesour water system
• flare-gas recovery systems have been developed due to environmental and economicconsiderations. The flare gas is captured and compressed for other uses. Usually recoveredflare gas is treated and routed to the refinery fuel gas system. Depending upon flare gascomposition, recovered gas may have other uses. Reductions of flaring to ratios of0.08 - 0.12 % of production in one natural gas plant in Norway have been reported.
• with the increasingly strict requirements regarding flame visibility, emissions, and noise,enclosed ground flares can offer the advantages of hiding flames, monitoring emissions, andlowering noise. However, the initial cost often makes them undesirable for large releaseswhen compared to elevated systems. A significant disadvantage with a ground flare is thepotential accumulation of a vapour cloud in the event of a flare malfunction; special safetydispersion systems are usually included in the ground flare system. For this reason,instrumentation for monitoring and controlling ground flares is typically more stringent thanwith an elevated system.
Achieved environmental benefitsWell operated refinery flares typically optain a conversion of 98 % to CO2, 1.5 % to partiallycombustion products (almost all CO) and 0.5 % unconverted. Ground flares have reduced noiseand smoke compared to elevated flares.
Cross-media effectsFlare seal water is typically in need of treatment before release.
Chapter 4 Techniques to consider in the determination of BAT
362 Mineral Oil and Gas Refineries
Operational dataSince air present in the stack can create a potentially explosive mixture with incoming flare gasduring low-flare gas loads, a continuous stream of purge gas is required. Also in a lot of cases amolecular water seal is employed which allows using a smaller purging rate.
ApplicabilityFlaring of toxic gases (never via a ground flare) requires special considerations. To ensure safeoperation during periods when the flare may not have a flame present, ground levelconcentration calculations for hazardous components should be performed assuming the flare asa vent only. Other safeguards may be necessary to mitigate groundlevel exposure hazards.Reliable continuous pilot monitoring is considered critical when flaring toxic gases.
There are basically two types of flares, an elevated flare and a ground flare. Ground flares areused when it is necessary to conceal the flare (for various reasons), otherwise the elevated flareis commonly chosen, because it can handle larger flow releases more economically. Sometimesa refinery has both a ground flare and an elevated flare. In that case the ground flare is used tocombust small amounts of continuous vents and small relief loads.
The elevated flare is always a vital part of the refinery complex, its primary purpose beingsafety. This flare system is designed to conduct easily ignitable and toxic vapours from theprocess area to a remote elevated location. The elevated flare system includes a seal drum toprevent the flame from flashing back into the process units, and an elevated stack with pilot-ignition and steam nozzles at the tip. Due to different burning characteristics of the gases, aseparate sour gas flare is usually provided; this flare could be equipped with different burnersthan the hydrocarbon flare to allow more efficient combustion of sour gases (H2S).
Driving force for implementationThe purpose of the flare system is to collect and process vent gases (e. g. pressure relief fromthe fractionator should pass to flare) and (large) quantities of fluids during emergency situationsor upsets: when safety relief valves are open, during depressurisation operations and purging ofprocess units in case of an emergency situation, during start-up of certain process units or priorto a scheduled shut down. Provisions are available to separate the liquids from the gases and toincinerate relieved vapours. The liquids are usually returned to the process units or tanks. Pilotburners are normally installed to take care of constant ignition of released vapours. Moreover,well controlled steam injection systems have been applied to achieve smokeless burning.
Flare-gas recovery systems often are installed to comply with local regulatory limits on flareoperation and, therefore must be sized to conform to any such limits.
Example plantsFlares are common in refineries
Reference literature[101, World Bank, 1998], [19, Irish EPA, 1993], [117, VDI, 2000], [118, VROM, 1999]
4.23.8 Combined techniques to abate air pollutants
DescriptionThe SNOX plant removes SO2, NOx and particulate from the flue gas produced by the coal-firedboilers at the Gela refinery power plant.
The SNOX plant is based on catalytic processes where the only additional material necessary isthe ammonia used for the NOx removal. Furthermore, natural gas and water are needed, besidessmall quantities of silicone oil for the acid mist control unit.
Techniques to consider in the determination of BAT Chapter 4
Mineral Oil and Gas Refineries 363
The process produces 94 - 95 % pure sulphuric acid (H2SO4) for sale. The system employs acatalytic converter to oxidise SO2 to SO3 at a temperature of 400 - 420 °C. This temperaturelevel allows a deNOx, operating at 380 °C, to be well fitted in the process. High NOx removal athigh NH3 slip is possible with no risk of precipitation of ammonium sulphates, as the reactortemperatures are above the decomposition temperature (350 °C) and any NH3 slip is destroyedin the SO2 / SO3 oxidiser. The process produces no waste water or waste products, nor does itconsume any chemical apart from ammonia for NOx control. The high removal of dust isdemanded by the H2SO4 production step. Dedusting with an efficiency consistently at 99.9 % isrequired as to avoid frequent clean-up of the SO2 / SO3 converter and to maintain good productquality. The flue gas train subsequently comprises an air preheater, a high-temperature ESP, thecold side of the regenerative heat exchanger, the deNOx reactor, a heat supply, the SO2/ SO3converter, hot-side regeneration heat-exchanger, the acid condenser (operating between240 - 100 °C, hydrating SO3 and condensing the resulting acid product) which heat is used asthe first step in preheating combustion air. The recovered heat, produced by the conversionprocess, is substantial and make up for the power demand when the sulphur content in the fuel(oil or coal) is 2 - 3 %. Areas relating to dust that require attention in operation are the HTEP,the SO2 / SO3 converter and the acid falling-film condenser (made of borosilicate glass tubes).
The SNOX process is divided into four main steps:• dust removal (ESP). More information in 4.23.4• selective Catalytic Reduction (SCR) of NOx. More information in 4.23.3.3• catalytic oxidation of SO2
• condensation of H2SO4
Dust removal (ESP)An extensive dust removal from the flue gas is necessary to obtain:• a long life of the deNOx catalyst• a long running time between screening of the SO2 oxidation catalyst• a high purity of the produced sulphuric acid.
Catalytic Oxidation of SO2From the SCR reactor the flue gas is distributed uniformly over the sulphuric acid catalyst in theSO2 converter. Here the SO2 initially present in the flue gas is oxidized into SO3 according tothe following reaction scheme:1) 2 SO2 + O2 ----> 2 SO3 + 23.6 kcal/gmol SO2
Condensation of H2SO4The SO3 rich flue gas from the SO2 converter is cooled from approximately 422°C down to260°C in the gas/gas exchanger, by heat exchange with the cold unconverted flue gas.Then the SO3 gas is condensed in the WSA heat exchanger.When the SO3 rich gas is cooled, the SO3 is hydrated to vapours sulphuric acid according to thefollowing reaction scheme:1) SO3 + H2O ----> H2SO4 + 24.1 kcal/gmol SO3The cleaned gas is discharged into the atmosphere through the stack at 106°C.
Achieved environmental benefits• process qualified for treating high SO2 concentration flue gas (as in Gela refinery)• high removal of SO2, together with NOx and particulate removal• low environmental impacts: no raw material required (only ammonia consumption for NOx
control), no waste water or waste production• no cooling water consumption• production, as by-product of the process, of H2SO4 commercial grade for sale• high heat recovery.
Chapter 4 Techniques to consider in the determination of BAT
364 Mineral Oil and Gas Refineries
Particulate removal rate less than 10 mg/Nm3 at ESP outletNOx removal rate 90 - 94.7 %SO2 removal rate 94 - >96 % with 5 % v/v O2 and a temperature of 410°C inlet
the SO2 converter.
Cross-media effectsH2SO4 production (95 % w/w H2SO4 concentration) 13 tonne/h with a 5.5 % w/w sulphurpet-coke
ApplicabilityThe Gela Refinery SNOX plant was designed for cleaning the flue gas produced in the boilers atpower plant burning a mixture of high sulphur Fuel Oil and high sulphur Petroleum Coke.
EconomicsA SNOX plant designed for a flue gas load of 1.0 million Nm3/h at the exit of the existinginduced draught fans had a cost of EUR 100 million.
Driving force for implementationEnvironmental Italian regulations (D.P.R. 203/88) imposed very severe limit on emissions(particulary on SO2), so AgipPetroli had to search a way to be able to continue to burn highsulphur pet-coke in its power plants in Gela refinery.
Example plantsGELA AgipPetroli Refinery Start up September 1999
Reference literature[297, Italy, 2000]
4.23.9 Odour preventing and control techniques
DescriptionScrubber with hypochlorite ion is used for odour/low-level VOC abatement.
4.23.10 Noise prevention and control techniques
DescriptionFlares, compressors, pumps, turbines and air coolers require particular attention as regardssources of noise. Abatement measures in refineries usually focus on these types of equipment.
Techniques to consider in the determination of BAT Chapter 4
Mineral Oil and Gas Refineries 365
4.24 Waste water treatments
This section together with the previous one and the next section are dealing with the end-of-pipeprocesses that appear in a refinery. Deeper information about the techniques included in thissection can be found in the Common waste water and wastegas treatments BREF. The reasonwhy those techniques are appearing here is to give an overall description of the techniques andto avoid repetition. Description of end-of-pipe techniques does not appear in the previoussections. In this Section, general information on environmental benefits, cross-media effects,operational data, applicability is described here. Prevention or minimisation techniques appliedto different process activities are found in each of the sections dealing with those productionprocesses. Complementing water management systems that may be found along the document,this section contains the waste water treatments. Those techniques are only discussed in thissection within this document.
Refinery waste water streams that require purification prior to discharge comprises mainly twostreams. The first effluent is process water generated in various refinery units as a consequenceof steam injection and/or washing hydrocarbon fractions with water. The direct contact withhydrocarbon fractions usually results in a high concentration of dissolved organics. Processwater is treated in a sour water stripper (SWS) when it contains hydrogen sulphide andammonia and is subsequently re-used as wash water for the desalter. The resulting effluent ishigh in oil and solids, has a high chemical oxygen demand (COD 300 - >600 mg/l) and mightcontain also specific contaminants for which legal limits apply. The second significant effluentstream that requires treatment is contaminated rainwater, referred to as surface water run-off,which usually requires only removal of free oil and solids as COD is usually below 100 mg/l.Prior to effluent treatment proper segregation and process water integration should beconsidered. Other waste water streams that appear in a refinery are the cooling water blowdown,tank water bottoms and ballast water. This section only includes the end-of-pipe processes thatappear in treatment of waste water in refinery. Deeper information about the techniquesincluded in chapter can be found in the Common waste water and wastegas treatments BREF.
Waste water treatment plants are advanced environmental protection systems for the control ofsurface water pollution. The purpose of waste water treatment is to remove floating anddispersed oil, suspended solids, dissolved oil, notably BTEX and phenol and other specificcompounds such as sulphides, cyanides, heavy metals, phosphate (when polymerisation ispresent) and nitrogen compounds and other COD. Additionally, the treated effluent can berendered suitable for re-use in the refinery process. The principle of waste water purification isbased on (1) dedicated separation techniques for the dispersed and floating oil and suspendedsolids from the waste water and (2) removal of dissolved compounds by biological treatment orfurther treatments.
4.24.1 Management of waste water within a refinery
This section try to give some indication on what can be done in a refinery with the managementof the waste water. In other words, it is better to combine waste waters from different processesor is better to process them independtly in some independent waste water plant. Topics relatedwith the storage of waste water is also included here. This section deals with process wastewater, cooling water and sanitary waste water, ballast water, cleaning water, accidentally oilcontaminated water, continuous oil contaminated water, etc.
Process water integration can be applied at any industrial site, be it a refinery or a combinedrefinery and petrochemical complex. In this document the concept and practical tools forpreparing a process water integration scheme for a refinery is presented in Section 4.15.7.1.Reference is made to a EU BREF document on waste water treatment.
DescriptionSome techniques to consider in that respect are:
Chapter 4 Techniques to consider in the determination of BAT
366 Mineral Oil and Gas Refineries
1. use of sour water can be used to the maximum extend possible as desalter wash water or aswash water in overhead FCC main column
2. process water from the dimerisation process should be treated properly because the highcontent on phosphate that waste water from this process typically have
3. use of equalising tanks for the storage of waste water4. tanks for storage of ballast water may cause large VOC emissions. A way to prevent those
emissions is to cover the equalising tanks of the waste water treatment systems with floatingroofs. Technique to consider also included in the Section 4.21.13
5. the temperature of the waste water is controlled in order to reduce volatilisation and tosecure the performance of the biological treatment
6. rainwater from polluted plant areas (storm water) should be collected and routed to atreatment plant. For collection a “first flush” scheme may be used. Depending on the initialdegree of pollution (mainly oil), the contaminated water should be treated in oil/water/solidsseparation systems (API, flotation units, sandfilters) and/or biotreatment units. Non-contaminated water may be discharged directly or re-used in order to save costs. It isnecessary that the WWTP is able to handle high quantities of rainwater. For this purposesufficient buffer capacity need to be installed (storm water tank). In locations with lowrainfall segregation of streams is less relevant
7. control of surfactants in waste water - Surfactants entering the refinery waste water streamswill increase the amount of emulsions and sludges generated. Surfactants can enter thesystem from a number of sources including: washing unit pads with detergents; treatinggasolines with an end point over 400 degrees (F) thereby producing spent caustics; cleaningtank truck tank interiors; and using soaps and cleaners for miscellaneous tasks. In addition,the overuse and mixing of the organic polymers used to separate oil, water and solids in thewaste water treatment plant can actually stabilise emulsions. The use of surfactants need tobe minimised by educating operators, routing surfactant sources to a point downstream ofthe DAF unit and by using dry cleaning, high pressure water or steam to clean oil surfacesof oil and dirt
8. install high pressure power washer - Chlorinated solvent vapour degreasers can be replacedwith high pressure power washers which do not generate spent solvent hazardous wastes
9. use non-hazardous degreasers - Spent conventional degreaser solvents can be reduced oreliminated through substitution with less toxic and/or biodegradable products.
Achieved environmental benefits1. re-use of water within the refinery
Process effluent volume can be compared to the volumes of process effluent discharged(excluding once through cooling water). Although related, the values are not identical giventhat there are other sources of water to the effluent system including rainwater on plantsurfaces, water separaged from crude, ballast water, etc. On the other hand, some water willevaporate, be used in chemical reactions, etc. The correponding figures for effluents for 63European refineries are (all annual averages):
Annual average effluent volume 3.6 million m3/ yearRange 0.07 – 21 million m3/yearAverage effluent per tonne throughput 0.53 m3/ tonne throughputRange 0.09 to 1.6 m3/ tonne throughput
Other data from an EU+ country with many refineries gives the following ranges dependingon the type of refinery:
0.1 – 0.3 m3/ tonne throughput for pure refineries0.3 – 0.5 m3/ tonne throughput for lubricant refineries0.5 – 0.8 m3/ tonne throughput for bitumen refinery
Other data from another EU+ country gave a range from 0.18 – 0.21 m3/ tonne throughputfor three refineries in his country.
Techniques to consider in the determination of BAT Chapter 4
Mineral Oil and Gas Refineries 367
2. proper treatment of phosphates3. action has been taken in order to reduce the amount of oil to reach the API separators4. reduce the VOC emissions from waste waters5. reduce the VOC emissions and secure the performance of the biological treatment.
Driving force for implementationRe-use water, reduce the hydrocarbon charge to the waste water treatment and reduce VOCemissions.
Reference literature[118, VROM, 1999], [197, Hellenic Petroleum, 1999], [107, Janson, 1999], [262, Jansson,2000], [268, TWG, 2001]
4.24.2 Sour water stripping (SWS)
Sour water from the various refinery units is for the main part stripped in a SWS and cannormally be re-used together with crude distillation unit overhead wash water as desalter washwater. This is the main process water source in refineries.
DescriptionMost sour water strippers are single stage, requiring one stripping column. Figure 4.16 shows atypical single stage sour water stripper. The sour water streams from the process units arecollected in a sour water collection vessel. This provides both hold-up for feed and acts as asettler, where oil separation takes place. From this vessel sour water is pumped via afeed/effluent exchanger, to the top of the stripper column. The sour water is counter-currentlystripped in the column by steam, either injected live or generated in a reboiler. This column isusually refluxed to reduce the water content in the sour gas. Operating pressure in the columnvaries from 0.5 to 1.2 barg depending on the destination of the off-gas. Often pH control isapplied to maximise either H2S or NH3 removal.
Sour off-gases from a stripper unit can be routed either to a sulphur recovery unit (SRU), to anincinerator, or to the sour flare. Since off-gases routed to an incinerator or a flare contribute tothe release of SO2 and NOx, routing to a SRU unit is preferred and now commonly practised.Normally the off-gas from the sour water stripper, leaving the reflux drum containsapproximately 30 mol% water.
Two stage stripping:. The two-stage sour water stripper differs from the single stage stripper byoperating the first column at a lower pH (6), removing H2S over the top and NH3/water via thebottom, and the second stage at a higher pH (10), removing the NH3 over the top and a strippedwater stream over the bottom. These results in much lower H2S and NH3 concentration in thestripped water to be discharged to the effluent treatment plant.
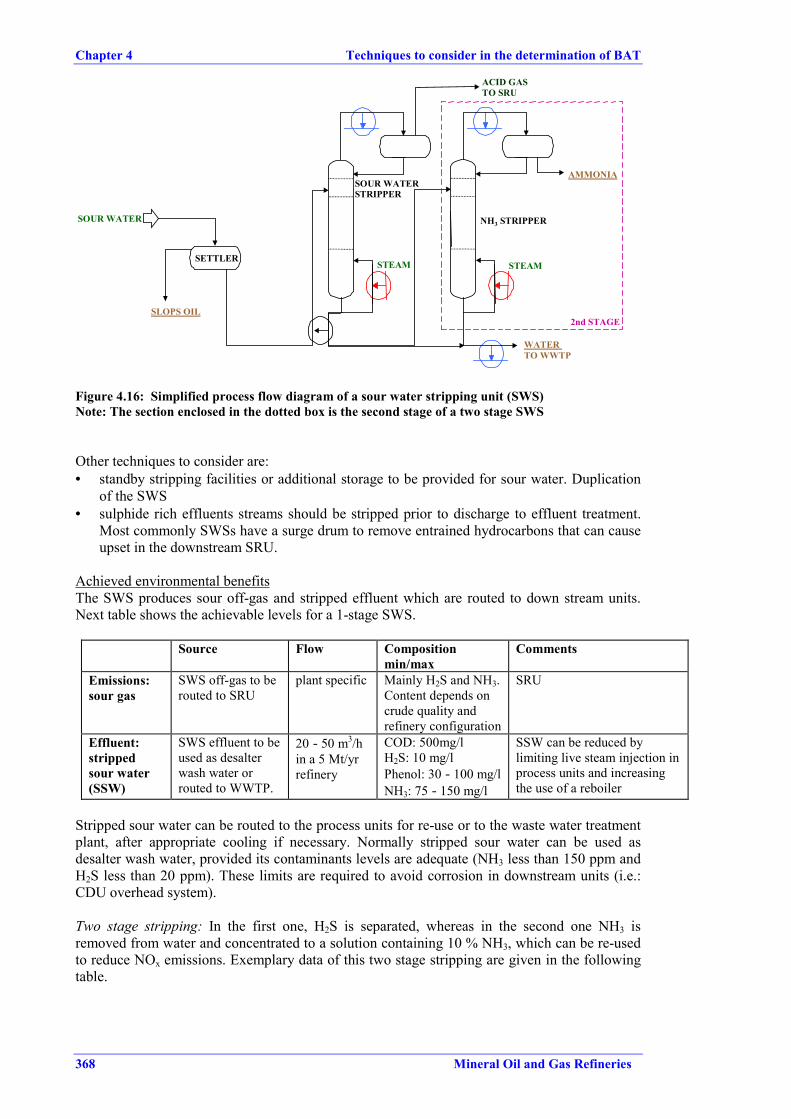
Chapter 4 Techniques to consider in the determination of BAT
368 Mineral Oil and Gas Refineries
SLOPS OIL
SETTLER
SOUR WATER
WATER TO WWTP
ACID GASTO SRU
SOUR WATERSTRIPPER
STEAM
NH3 STRIPPER
STEAM
AMMONIA
2nd STAGE
Figure 4.16: Simplified process flow diagram of a sour water stripping unit (SWS)Note: The section enclosed in the dotted box is the second stage of a two stage SWS
Other techniques to consider are:• standby stripping facilities or additional storage to be provided for sour water. Duplication
of the SWS• sulphide rich effluents streams should be stripped prior to discharge to effluent treatment.
Most commonly SWSs have a surge drum to remove entrained hydrocarbons that can causeupset in the downstream SRU.
Achieved environmental benefitsThe SWS produces sour off-gas and stripped effluent which are routed to down stream units.Next table shows the achievable levels for a 1-stage SWS.
Source Flow Compositionmin/max
Comments
Emissions:sour gas
SWS off-gas to berouted to SRU
plant specific Mainly H2S and NH3.Content depends oncrude quality andrefinery configuration
SRU
Effluent:strippedsour water(SSW)
SWS effluent to beused as desalterwash water orrouted to WWTP.
20 - 50 m3/hin a 5 Mt/yrrefinery
COD: 500mg/lH2S: 10 mg/lPhenol: 30 - 100 mg/lNH3: 75 - 150 mg/l
SSW can be reduced bylimiting live steam injection inprocess units and increasingthe use of a reboiler
Stripped sour water can be routed to the process units for re-use or to the waste water treatmentplant, after appropriate cooling if necessary. Normally stripped sour water can be used asdesalter wash water, provided its contaminants levels are adequate (NH3 less than 150 ppm andH2S less than 20 ppm). These limits are required to avoid corrosion in downstream units (i.e.:CDU overhead system).
Two stage stripping: In the first one, H2S is separated, whereas in the second one NH3 isremoved from water and concentrated to a solution containing 10 % NH3, which can be re-usedto reduce NOx emissions. Exemplary data of this two stage stripping are given in the followingtable.
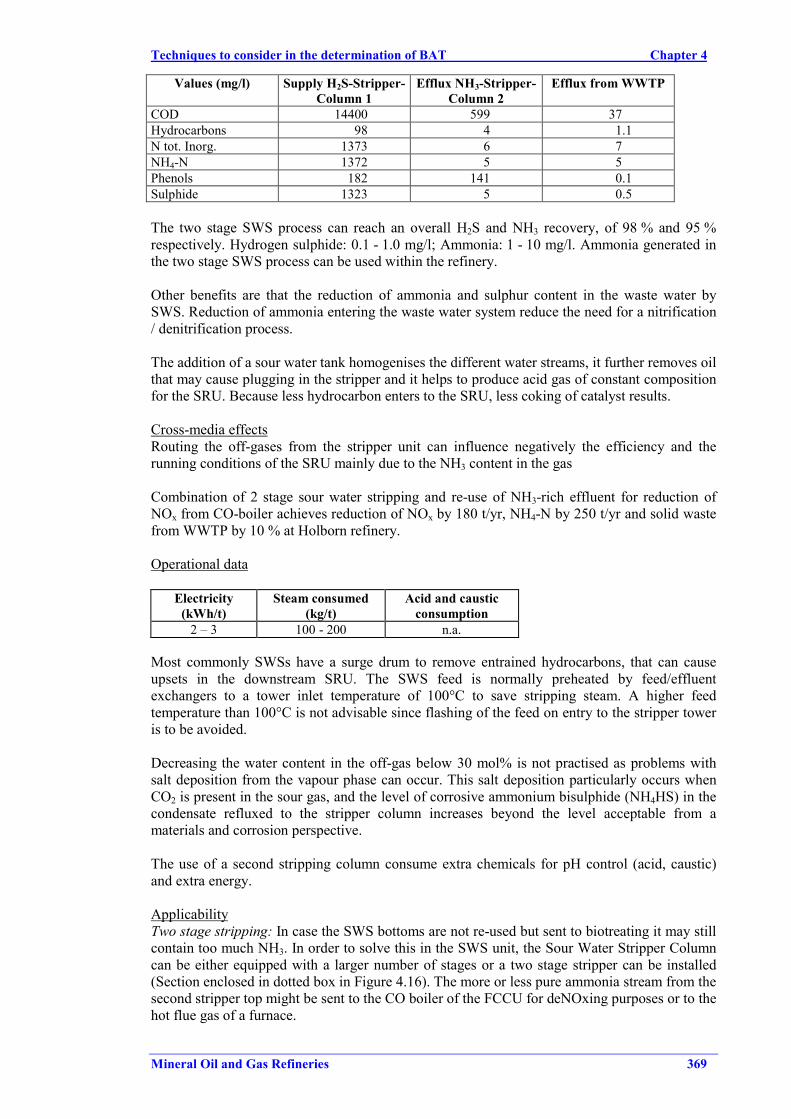
Techniques to consider in the determination of BAT Chapter 4
Mineral Oil and Gas Refineries 369
Values (mg/l) Supply H2S-Stripper-Column 1
Efflux NH3-Stripper-Column 2
Efflux from WWTP
COD 14400 599 37Hydrocarbons 98 4 1.1N tot. Inorg. 1373 6 7NH4-N 1372 5 5Phenols 182 141 0.1Sulphide 1323 5 0.5
The two stage SWS process can reach an overall H2S and NH3 recovery, of 98 % and 95 %respectively. Hydrogen sulphide: 0.1 - 1.0 mg/l; Ammonia: 1 - 10 mg/l. Ammonia generated inthe two stage SWS process can be used within the refinery.
Other benefits are that the reduction of ammonia and sulphur content in the waste water bySWS. Reduction of ammonia entering the waste water system reduce the need for a nitrification/ denitrification process.
The addition of a sour water tank homogenises the different water streams, it further removes oilthat may cause plugging in the stripper and it helps to produce acid gas of constant compositionfor the SRU. Because less hydrocarbon enters to the SRU, less coking of catalyst results.
Cross-media effectsRouting the off-gases from the stripper unit can influence negatively the efficiency and therunning conditions of the SRU mainly due to the NH3 content in the gas
Combination of 2 stage sour water stripping and re-use of NH3-rich effluent for reduction ofNOx from CO-boiler achieves reduction of NOx by 180 t/yr, NH4-N by 250 t/yr and solid wastefrom WWTP by 10 % at Holborn refinery.
Operational data
Electricity(kWh/t)
Steam consumed(kg/t)
Acid and causticconsumption
2 – 3 100 - 200 n.a.
Most commonly SWSs have a surge drum to remove entrained hydrocarbons, that can causeupsets in the downstream SRU. The SWS feed is normally preheated by feed/effluentexchangers to a tower inlet temperature of 100°C to save stripping steam. A higher feedtemperature than 100°C is not advisable since flashing of the feed on entry to the stripper toweris to be avoided.
Decreasing the water content in the off-gas below 30 mol% is not practised as problems withsalt deposition from the vapour phase can occur. This salt deposition particularly occurs whenCO2 is present in the sour gas, and the level of corrosive ammonium bisulphide (NH4HS) in thecondensate refluxed to the stripper column increases beyond the level acceptable from amaterials and corrosion perspective.
The use of a second stripping column consume extra chemicals for pH control (acid, caustic)and extra energy.
ApplicabilityTwo stage stripping: In case the SWS bottoms are not re-used but sent to biotreating it may stillcontain too much NH3. In order to solve this in the SWS unit, the Sour Water Stripper Columncan be either equipped with a larger number of stages or a two stage stripper can be installed(Section enclosed in dotted box in Figure 4.16). The more or less pure ammonia stream from thesecond stripper top might be sent to the CO boiler of the FCCU for deNOxing purposes or to thehot flue gas of a furnace.
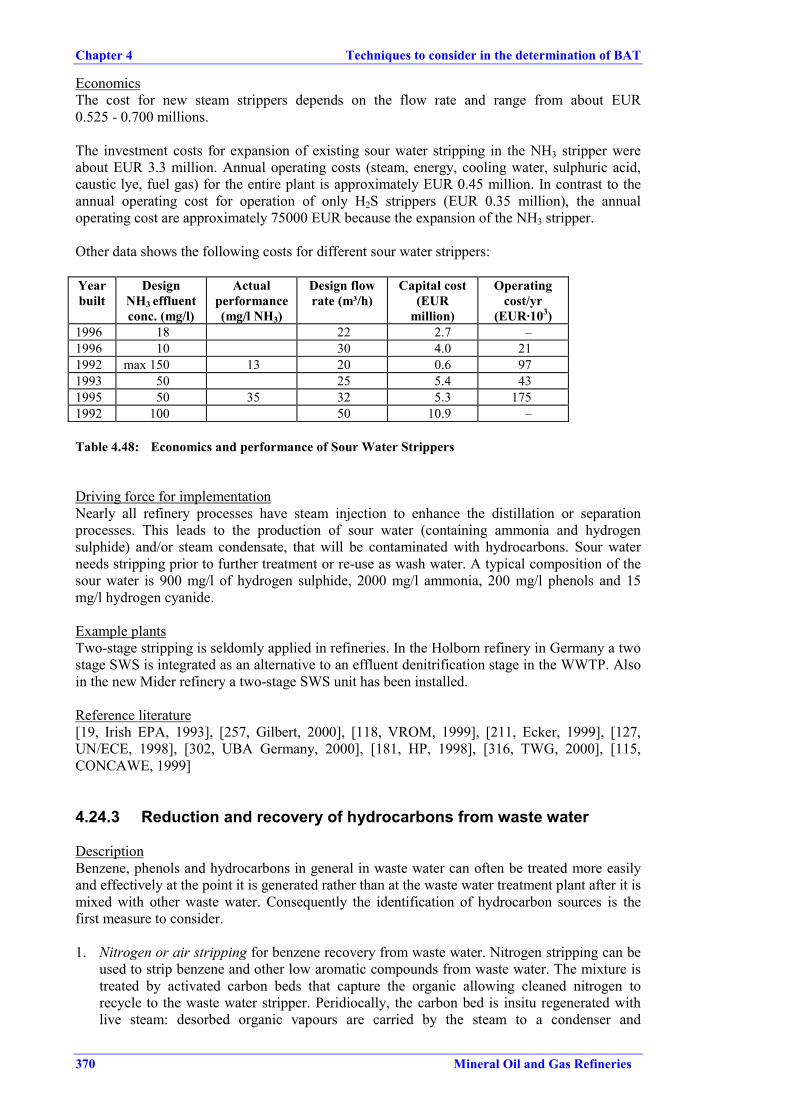
Chapter 4 Techniques to consider in the determination of BAT
370 Mineral Oil and Gas Refineries
EconomicsThe cost for new steam strippers depends on the flow rate and range from about EUR0.525 - 0.700 millions.
The investment costs for expansion of existing sour water stripping in the NH3 stripper wereabout EUR 3.3 million. Annual operating costs (steam, energy, cooling water, sulphuric acid,caustic lye, fuel gas) for the entire plant is approximately EUR 0.45 million. In contrast to theannual operating cost for operation of only H2S strippers (EUR 0.35 million), the annualoperating cost are approximately 75000 EUR because the expansion of the NH3 stripper.
Other data shows the following costs for different sour water strippers:
Yearbuilt
DesignNH3 effluentconc. (mg/l)
Actualperformance(mg/l NH3)
Design flowrate (m³/h)
Capital cost(EUR
million)
Operatingcost/yr
(EUR·103)1996 18 22 2.7 –1996 10 30 4.0 211992 max 150 13 20 0.6 971993 50 25 5.4 431995 50 35 32 5.3 1751992 100 50 10.9 –
Table 4.48: Economics and performance of Sour Water Strippers
Driving force for implementationNearly all refinery processes have steam injection to enhance the distillation or separationprocesses. This leads to the production of sour water (containing ammonia and hydrogensulphide) and/or steam condensate, that will be contaminated with hydrocarbons. Sour waterneeds stripping prior to further treatment or re-use as wash water. A typical composition of thesour water is 900 mg/l of hydrogen sulphide, 2000 mg/l ammonia, 200 mg/l phenols and 15mg/l hydrogen cyanide.
Example plantsTwo-stage stripping is seldomly applied in refineries. In the Holborn refinery in Germany a twostage SWS is integrated as an alternative to an effluent denitrification stage in the WWTP. Alsoin the new Mider refinery a two-stage SWS unit has been installed.
Reference literature[19, Irish EPA, 1993], [257, Gilbert, 2000], [118, VROM, 1999], [211, Ecker, 1999], [127,UN/ECE, 1998], [302, UBA Germany, 2000], [181, HP, 1998], [316, TWG, 2000], [115,CONCAWE, 1999]
4.24.3 Reduction and recovery of hydrocarbons from waste water
DescriptionBenzene, phenols and hydrocarbons in general in waste water can often be treated more easilyand effectively at the point it is generated rather than at the waste water treatment plant after it ismixed with other waste water. Consequently the identification of hydrocarbon sources is thefirst measure to consider.
1. Nitrogen or air stripping for benzene recovery from waste water. Nitrogen stripping can beused to strip benzene and other low aromatic compounds from waste water. The mixture istreated by activated carbon beds that capture the organic allowing cleaned nitrogen torecycle to the waste water stripper. Peridiocally, the carbon bed is insitu regenerated withlive steam: desorbed organic vapours are carried by the steam to a condenser and
Techniques to consider in the determination of BAT Chapter 4
Mineral Oil and Gas Refineries 371
subsequently decanted into organic and water layers. Organics are returned to refinery asvaluable feed
2. Liquid-Liquid extraction from waste waters for phenol extraction from waste water3. Reduction of hydrocarbons and aromatic compounds4. High-pressure wet air oxidation. Water is intensively mixed with air and organic
compounds are oxidised in the presence of a catalyst at high temperature and high pressure(250 ºC, 7 MPa). Sulphur containing substances are oxidised to sulphates; amines andnitriles are converted to molecular nitrogen
5. Low pressure oxidation. Persistent organic compounds are treated with oxygen and aremineralised in a biological treatment plant. (BOC Gases)
6. Supercritical water oxidation process. Supercritical water (373 ºC, 221 bar) is used todissolve organic compounds, which are oxidised in a reactor by injection of oxygen
7. Energy absorption technology. Sources of contamination with hydrocarbons are desalters(40 %), storage tanks (20 %), slop-systems (15 %) and other processes (25 %). It is possibleto recognise type and extent of water contamination directly at the source by use ofelectromagnetically high frequencies (EA – Energy Absorption Technology).
Achieved environmental benefits1. A refinery has used that system to reduce 1895 l/d of waste water containing benzene 50
ppm, 100 ppm toluene/xylenes and 100 ppm of other hydrocarbons liquids. The recoveryunit consistently reduced benzene to below 500 ppb. About 35000 kg of hydrocarbon liquidare returned to the refinery feedstock annually. This technique can be also applied toremove MTBE
2. Recoveries greater than 99 % or raffinate concentrations well below 1ppm can be achieved.With this technique waste water containing > 1 % phenols was treated to get purified waterwith a phenol content lower than 1 ppm (Efficiencies: higher than 99 %; Koch ProcessTechnology, Inc.). Phenol containing waste water may also be treated microbiologically
3. The efficiency of this process is stated to be 99 % for a COD of 30000 mg/l. Sodiumsulphide of spent caustic can be reduced from 3 % to <1 mg/l (160°C; 0.9 MPa)
4. 5. Efficiency is higher than 99.9 %6. With this system emissions of hydrocarbons to water could be reduced (e.g. benzene
contamination: minus 80 %).
Operational data1. Nitrogen stripping has several advantages over air. No oxygen reduces biological fouling ofthe stripper and reduces the risk of refinery upsets creating explosive mixtures in the recoveryunit.2. Utilities: typical per m3 water feedElectricity 159 kWhSteam, 20.7 barg, 15.6 kgSteam, 2.07 barg, 103 kgWater tempered at 45 ºC, (∆T = 19 ºC) 5.6 m3
cooling at 29 ºC, (∆T = 11 ºC) 2.5 m3
Applicability1. This technology is used for the treatment of desalting water and waste water from BTEX-plants (Texaco Development Co; AMCEC, Inc.).2. They can be designed to handle waste water streams with phenol levels from several hundredppm to saturation (approx. 7 %) and above.3. This method is not applied for high flows.
Economics1. Economics: The design and equipment supply cost of about $1250000. Annual utility costsare around $85000.
Chapter 4 Techniques to consider in the determination of BAT
372 Mineral Oil and Gas Refineries
2. Economics: Cost effective for levels of phenols higher than 1 %. A base case example for awaste water stream of 27.2 m3/h containing 6 % phenol was treated with 4.3 m3/h solvent in afour-column system. The overall phenol recovery was 99.3 %.Investment, extractor only, $1.32/m3
complete system, $3.43/m3
Recovered value $3.96/m3
3. Method very expensive
Driving force for implementationReduction and recovery of hydrocarbons
Example plants1. More than 15 systems ranging from 800 to 12000 l/min are now operating in various USA
refineries. Air stripping for the removal of MTBE has been used succesfully at least in oneEuropean refinery.
2. This system is typically applied when phenol concentrations are high.
Reference literature[181, HP, 1998], [211, Ecker, 1999], [316, TWG, 2000], [321, Helm, Spencer et al., 1998]
4.24.4 Primary treatments
Process water coming from the SWS is the main process water source in refineries. Moreover,some incompatible process effluents and drains from off-sites (flares and tanks) add to the totalflow of process water. This effluent has to pass first an oil/water separator (CPI, PPI or API) forfree oil and solids removal and an equalisation tank where sometimes further oil skimming canbe accomplished.
DescriptionEmissions to air of VOC (including benzene) and odorous components (hydrogen sulphides andmercaptans), however, are not uncommon and cannot always be controlled fully by up-streammeasures. Therefore APIs, CPIs can be provided with covers as an emission reduction measure,sometimes with off-gas treatment (biofilter or re-injected into the aeration basin). Safety aspects(explosiveness of VOC-air mixtures) are to be attended.
The next level of control is to install water seals (traps) on sewers and drains and gas tightcovers on junction boxes in the system. The use of covers on oil/water separators with good oilremoval facilities will prevent or reduce evaporation of liquid hydrocarbons from exposedsurfaces. Alternatively, incineration of the vapours coming from the API could be achievedfrom a covered API separator.
Achieved environmental benefitsPerformance of CPIs and APIs as regards oil removal suggests 50 - 100 ppm oil in the outlet.NMVOC emissions from oil separators can be reduced to 3 g/m3 by cover the CPI and API.
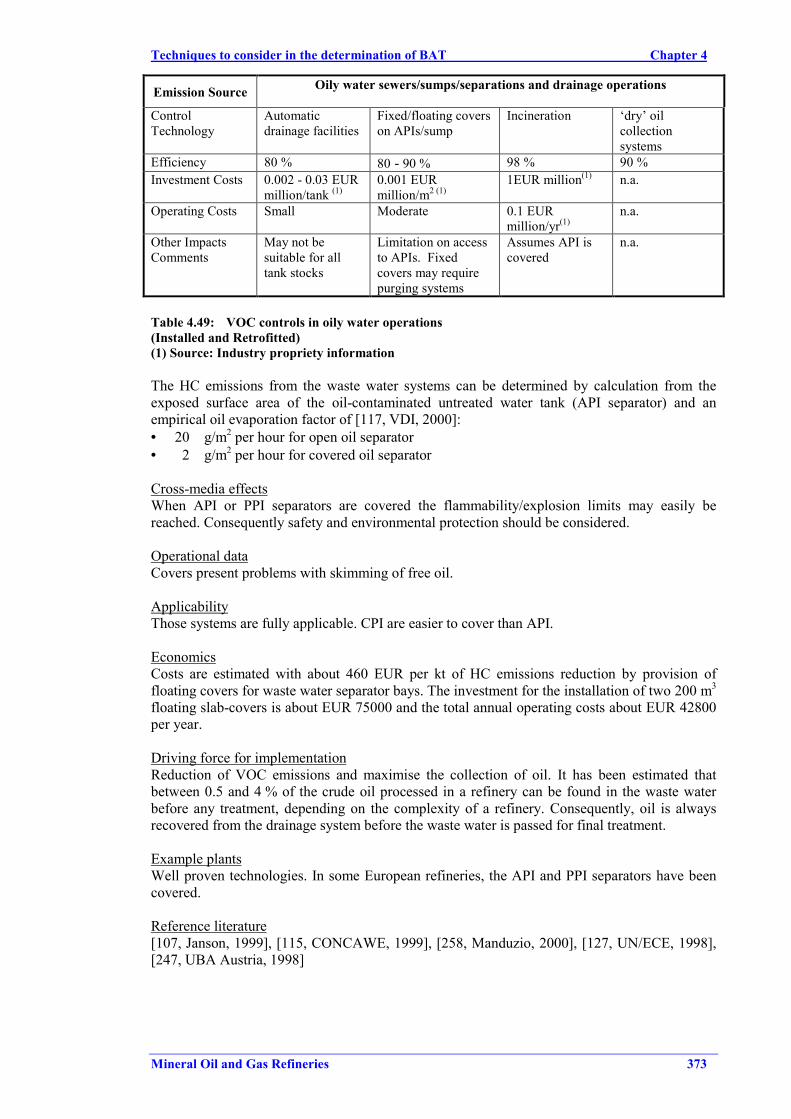
Techniques to consider in the determination of BAT Chapter 4
Mineral Oil and Gas Refineries 373
Emission Source Oily water sewers/sumps/separations and drainage operations
ControlTechnology
Automaticdrainage facilities
Fixed/floating coverson APIs/sump
Incineration ‘dry’ oilcollectionsystems
Efficiency 80 % 80 - 90 % 98 % 90 %Investment Costs 0.002 - 0.03 EUR
million/tank (1)0.001 EURmillion/m2 (1)
1EUR million(1) n.a.
Operating Costs Small Moderate 0.1 EURmillion/yr(1)
n.a.
Other ImpactsComments
May not besuitable for alltank stocks
Limitation on accessto APIs. Fixedcovers may requirepurging systems
Assumes API iscovered
n.a.
Table 4.49: VOC controls in oily water operations(Installed and Retrofitted)(1) Source: Industry propriety information
The HC emissions from the waste water systems can be determined by calculation from theexposed surface area of the oil-contaminated untreated water tank (API separator) and anempirical oil evaporation factor of [117, VDI, 2000]:• 20 g/m2 per hour for open oil separator• 2 g/m2 per hour for covered oil separator
Cross-media effectsWhen API or PPI separators are covered the flammability/explosion limits may easily bereached. Consequently safety and environmental protection should be considered.
Operational dataCovers present problems with skimming of free oil.
ApplicabilityThose systems are fully applicable. CPI are easier to cover than API.
EconomicsCosts are estimated with about 460 EUR per kt of HC emissions reduction by provision offloating covers for waste water separator bays. The investment for the installation of two 200 m3
floating slab-covers is about EUR 75000 and the total annual operating costs about EUR 42800per year.
Driving force for implementationReduction of VOC emissions and maximise the collection of oil. It has been estimated thatbetween 0.5 and 4 % of the crude oil processed in a refinery can be found in the waste waterbefore any treatment, depending on the complexity of a refinery. Consequently, oil is alwaysrecovered from the drainage system before the waste water is passed for final treatment.
Example plantsWell proven technologies. In some European refineries, the API and PPI separators have beencovered.
Reference literature[107, Janson, 1999], [115, CONCAWE, 1999], [258, Manduzio, 2000], [127, UN/ECE, 1998],[247, UBA Austria, 1998]
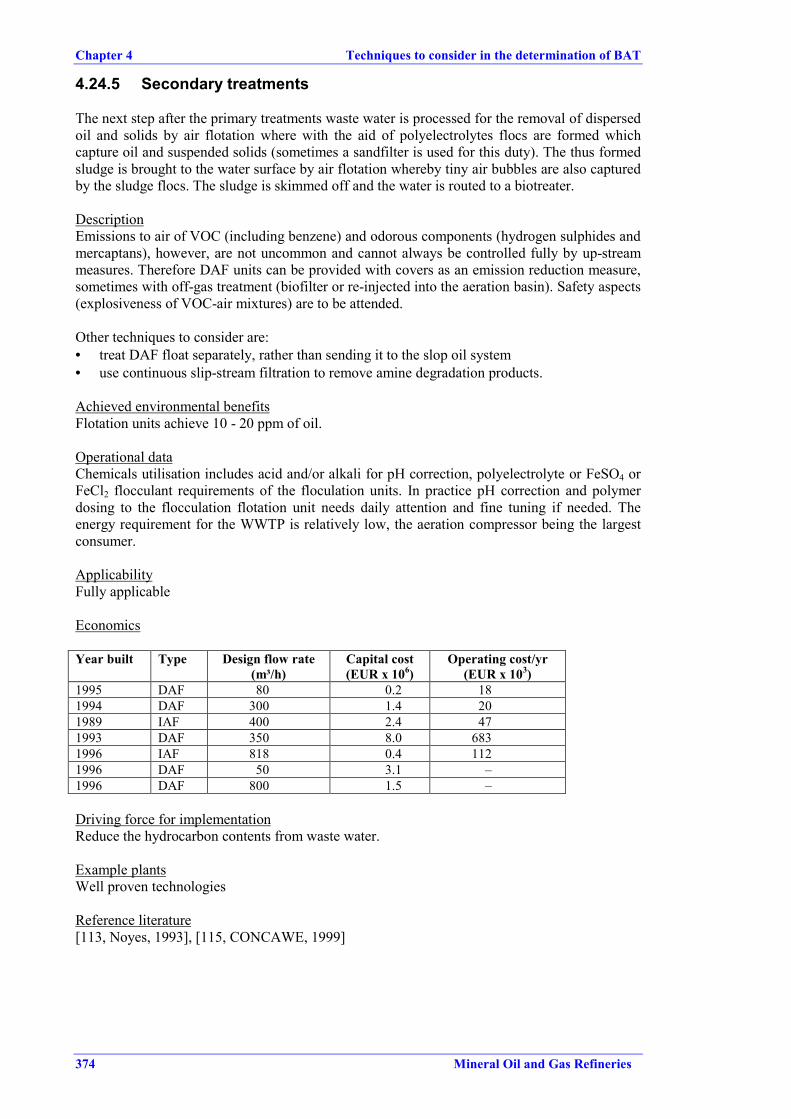
Chapter 4 Techniques to consider in the determination of BAT
374 Mineral Oil and Gas Refineries
4.24.5 Secondary treatments
The next step after the primary treatments waste water is processed for the removal of dispersedoil and solids by air flotation where with the aid of polyelectrolytes flocs are formed whichcapture oil and suspended solids (sometimes a sandfilter is used for this duty). The thus formedsludge is brought to the water surface by air flotation whereby tiny air bubbles are also capturedby the sludge flocs. The sludge is skimmed off and the water is routed to a biotreater.
DescriptionEmissions to air of VOC (including benzene) and odorous components (hydrogen sulphides andmercaptans), however, are not uncommon and cannot always be controlled fully by up-streammeasures. Therefore DAF units can be provided with covers as an emission reduction measure,sometimes with off-gas treatment (biofilter or re-injected into the aeration basin). Safety aspects(explosiveness of VOC-air mixtures) are to be attended.
Other techniques to consider are:• treat DAF float separately, rather than sending it to the slop oil system• use continuous slip-stream filtration to remove amine degradation products.
Achieved environmental benefitsFlotation units achieve 10 - 20 ppm of oil.
Operational dataChemicals utilisation includes acid and/or alkali for pH correction, polyelectrolyte or FeSO4 orFeCl2 flocculant requirements of the floculation units. In practice pH correction and polymerdosing to the flocculation flotation unit needs daily attention and fine tuning if needed. Theenergy requirement for the WWTP is relatively low, the aeration compressor being the largestconsumer.
ApplicabilityFully applicable
Economics
Year built Type Design flow rate(m³/h)
Capital cost(EUR x 106)
Operating cost/yr(EUR x 103)
1995 DAF 80 0.2 181994 DAF 300 1.4 201989 IAF 400 2.4 471993 DAF 350 8.0 6831996 IAF 818 0.4 1121996 DAF 50 3.1 –1996 DAF 800 1.5 –
Driving force for implementationReduce the hydrocarbon contents from waste water.
Example plantsWell proven technologies
Reference literature[113, Noyes, 1993], [115, CONCAWE, 1999]
Techniques to consider in the determination of BAT Chapter 4
Mineral Oil and Gas Refineries 375
4.24.6 Tertiary treatments
DescriptionAfter the sludge is skimmed off in the flotation process, the water is routed to a biotreater,usually an activated sludge unit or to a trickling filter. By means of bacteria nearly all dissolvedhydrocarbons and other organics are removed. In case deep nitrogen removal is required,denitrification in a biotreater is an option. Oxygen using (aerobic) bacteria is able to convertammonia into nitrate and in a so-called anoxic stage (without aeration) in the biotreater otherbacteria are able to convert nitrate into atmospheric nitrogen, which escape as bubbles. Thegenerated biomass or biosludge is allowed to settle in a clarifier and for the main part recycledto the biotreater. Primary sludge from the flocculation-unit and excess biosludge are usuallysent to a thickener prior to dewatering and disposal (Figure 4.17). Air Flocculation Flotationprocesses can be operated with Dissolved or Induced Air (DAF or IAF resp.).
Other techniques to consider are:• heterotroph denitrification combined with autotrophic sulphide oxidation (the reductive
potential of sulphide is used to eliminate nitrogen via denitrifiction, simultaneously sulphideoxidised, so that sulphide precipitation in subsequent biological treatment unit isunnecesary)
• granular activated carbon (GAC). Pollutants are adsorbed and biologically treated in anoxygen rich atmosphere. (attainable COD: <100 mg/l)
• powdered activated carbon (PAC). Similar to GAC• cover of the waste water treatment plant. Fixed covers are to be avoided for loss prevention
purposes (building up of explosive vapours)• emissions to air of VOC (including benzene) and odorous components (hydrogen sulphides
and mercaptans), are not uncommon and cannot always be controlled fully by up-streammeasures. Therefore sometimes the aeration basins of biotreaters can be provided withcovers as an emission reduction measure, sometimes with off-gas treatment (biofilter or re-injected into the aeration basin). Safety aspects (explosiveness of VOC-air mixtures) are tobe attended, however they are less dangerous than in up-stream units.
Achieved environmental benefitsA biotreater can remove 80 - 90 % of dissolved oil and COD as well as 90 - 98 % BOD undernormal operating conditions. Natural nitrogen removal is normally about 10 % in an activatedsludge unit (ASU), 70 - 80 % in a nitrification/denitrification biotreater (DNB) and up to 90 %in a tertiary (add-on) denitrification unit. For MAH/phenol >95 % removal can be achievedbased on a well-adapted biological system. Oxygen aireation in activated sludge plants can beup to 50 % more efficient than air aeration techniques.
Cross-media effectsEnergy consumption, activated carbon wastes when GAC or PAC are appplied and methanolconsumption when denitrification is applied. Waste water treatment generate sludge. If wastewater treatment is not properly operated the amount of sludge can be increased.
Operational dataIf a denitrification biotreater is applied pumping energy is relatively high. If a tertiary treatmentunit is used for ammonia removal by biological nitrification, methanol can be used as in asubsequent denitrification stage as an oxygen receptor for denitrifiying bacteria. In somerefinery biotreaters powdered activated carbon is dosed for meeting discharge specs. Thesensitivity of a biotreater against shock loads (peak discharges) of toxic compounds (e.g.sulfolane, MTBE, phenol, cyanide, sulphide) is relatively large and should be avoided by spillprevention measures, good housekeeping and equalisation in a buffer tank.
ApplicabilityFully applicable. Toxic streams should not enter a biotreater.
Chapter 4 Techniques to consider in the determination of BAT
376 Mineral Oil and Gas Refineries
EconomicsA complete API, equalisation tank, DAF, DNB biotreater, clarifier train for 125 m3/h requiresan investment cost of about EUR 15 million provided the up-stream drainage infrastructure isavailable. Operating costs are in the order of EUR 1.5/m3.
Floating cover: Capacity of the process 800 m3/h of oily water may emit up to 1000 t/yrEfficiency: 90 % of recovery of the VOCInvestment cost EUR 0.6 millionOperating cost: EUR 0.03 million per year
Driving force for implementationDenitrification biotreaters are usually applied in environments sensitive to nitrates.
Example plantsWell proven technologies. Nitrification/denitrification biotreater installations are operational atHarburg, Godorf and Gothenburg refineries.
Reference literature[181, HP, 1998], [45, Sema and Sofres, 1991]
4.24.7 Final treatments
In countries where water is a scarce resource it is sometimes economically attractive to furtherimprove the quality of the effluent in order to re-use the water as wash water or even as a sourcefor the preparation of boiler feed water (BFW). In that case sand filtration (SF), followed by acombination of ultrafiltration (UF) or activated carbon filtration (AC) and reverse osmosis (RO)for salt removal generates sufficiently pure water for entering the demineralisation unit of theBFW preparation unit. Other techniques are ozonation/oxidation, ion exchange and incineration.
DescriptionTechniques for the reduction of salt contents of the waste water: Ion exchange, Membraneprocesses or Osmosis.Metals may be separated by Precipitation, Flotation, Extraction, Ion exchange or Vacuumdistillation.
Achieved environmental benefitsSee Section 4.24.8
Cross-media effectsEnergy consumption, wastes from exhausted activated carbon, membranes and metal sludges.
Operational dataActivated carbon is needed if AC filtration appears in the system.
EconomicsWhen the WWTP is extended with SF and AC, the operating costs of the resulting WWTP isdoubled in reference with a WWTP without those systems (base case). With UF and RO boththe investment costs and the operating costs will approximately triple the base case.
Driving force for implementationThese systems have been installed at some locations only in BFW preparation. Applied inrefineries where shortages of water supply may occur.
Example plantsSandfilters, ultrafiltration, activated carbon and reverse osmosis are proven technologies.
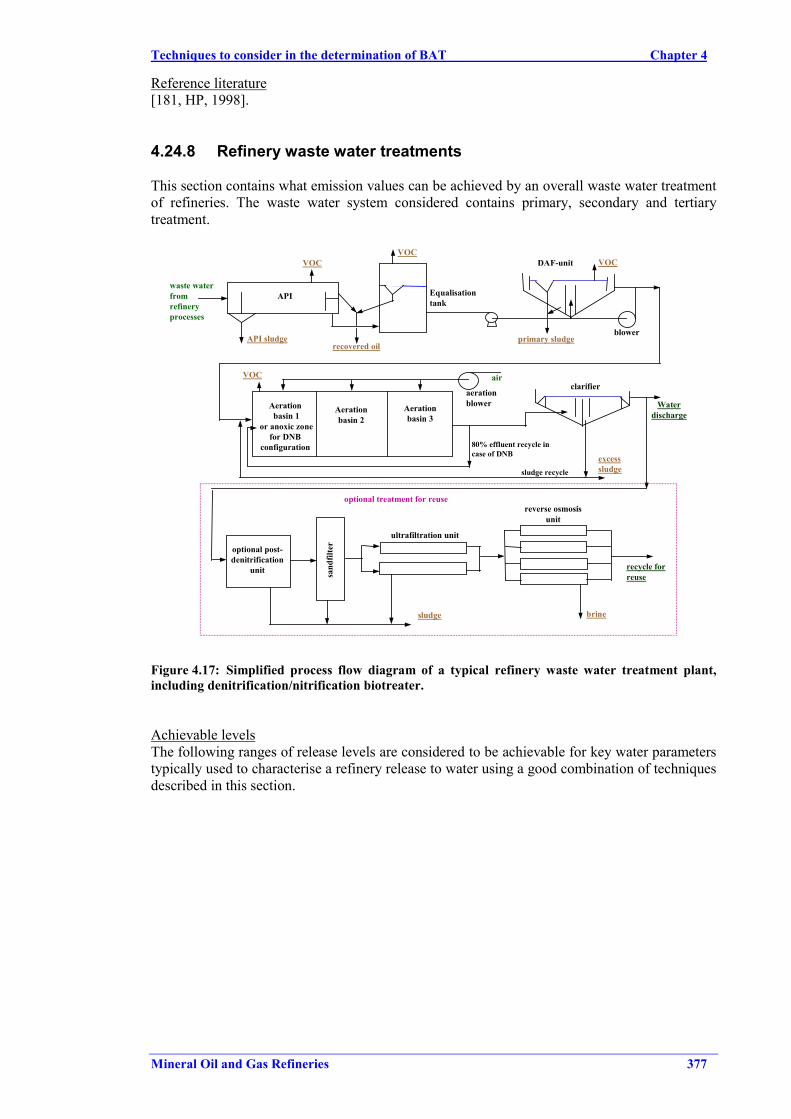
Techniques to consider in the determination of BAT Chapter 4
Mineral Oil and Gas Refineries 377
Reference literature[181, HP, 1998].
4.24.8 Refinery waste water treatments
This section contains what emission values can be achieved by an overall waste water treatmentof refineries. The waste water system considered contains primary, secondary and tertiarytreatment.
brinesludge
recycle forreuse
optional treatment for reuse
sludge recycle
optional post-denitrification
unit sand
filte
r
ultrafiltration unit
reverse osmosisunit
excesssludge
Aerationbasin 2
API Equalisationtank
DAF-unit
recovered oilprimary sludgeAPI sludge
Waterdischarge
clarifier
waste waterfromrefineryprocesses
Aeration basin 1
or anoxic zonefor DNB
configuration
Aerationbasin 3
blower
aerationblower
air
VOCVOC
VOC
VOC
80% effluent recycle incase of DNB
Figure 4.17: Simplified process flow diagram of a typical refinery waste water treatment plant,including denitrification/nitrification biotreater.
Achievable levelsThe following ranges of release levels are considered to be achievable for key water parameterstypically used to characterise a refinery release to water using a good combination of techniquesdescribed in this section.
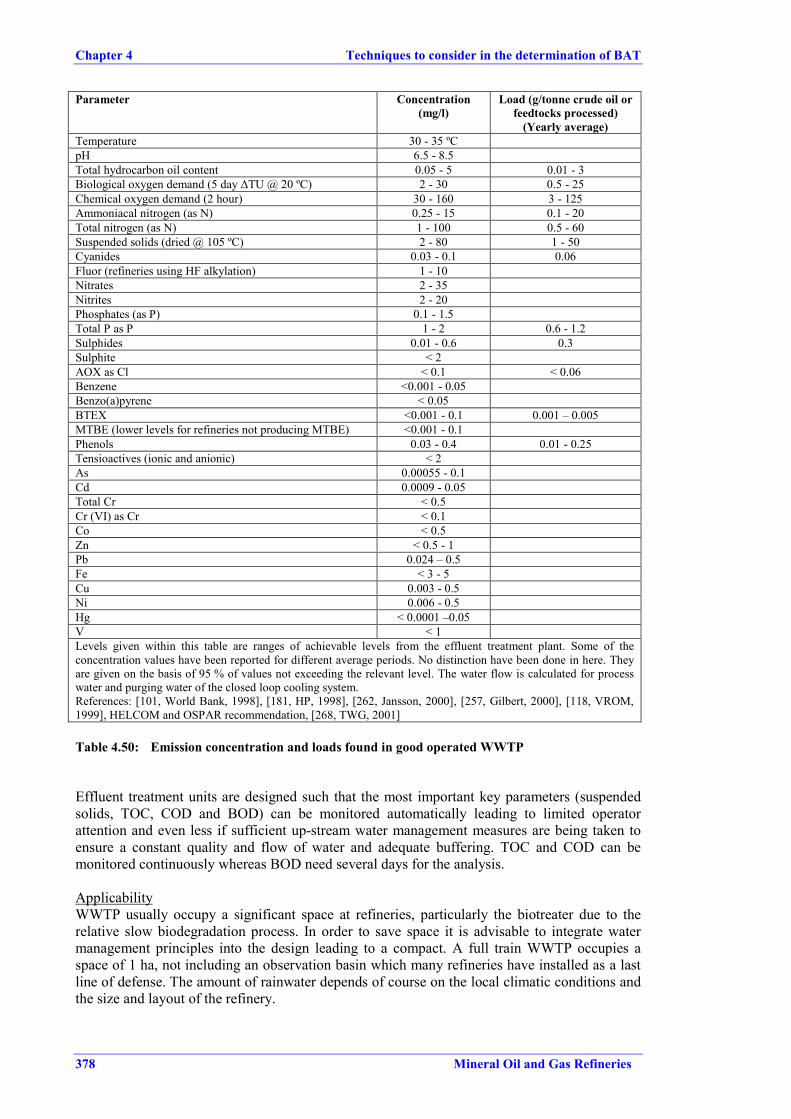
Chapter 4 Techniques to consider in the determination of BAT
378 Mineral Oil and Gas Refineries
Parameter Concentration(mg/l)
Load (g/tonne crude oil orfeedtocks processed)
(Yearly average)Temperature 30 - 35 ºCpH 6.5 - 8.5Total hydrocarbon oil content 0.05 - 5 0.01 - 3Biological oxygen demand (5 day ∆TU @ 20 ºC) 2 - 30 0.5 - 25Chemical oxygen demand (2 hour) 30 - 160 3 - 125Ammoniacal nitrogen (as N) 0.25 - 15 0.1 - 20Total nitrogen (as N) 1 - 100 0.5 - 60Suspended solids (dried @ 105 ºC) 2 - 80 1 - 50Cyanides 0.03 - 0.1 0.06Fluor (refineries using HF alkylation) 1 - 10Nitrates 2 - 35Nitrites 2 - 20Phosphates (as P) 0.1 - 1.5Total P as P 1 - 2 0.6 - 1.2Sulphides 0.01 - 0.6 0.3Sulphite < 2AOX as Cl < 0.1 < 0.06Benzene <0.001 - 0.05Benzo(a)pyrene < 0.05BTEX <0.001 - 0.1 0.001 – 0.005MTBE (lower levels for refineries not producing MTBE) <0.001 - 0.1Phenols 0.03 - 0.4 0.01 - 0.25Tensioactives (ionic and anionic) < 2As 0.00055 - 0.1Cd 0.0009 - 0.05Total Cr < 0.5Cr (VI) as Cr < 0.1Co < 0.5Zn < 0.5 - 1Pb 0.024 – 0.5Fe < 3 - 5Cu 0.003 - 0.5Ni 0.006 - 0.5Hg < 0.0001 –0.05V < 1Levels given within this table are ranges of achievable levels from the effluent treatment plant. Some of theconcentration values have been reported for different average periods. No distinction have been done in here. Theyare given on the basis of 95 % of values not exceeding the relevant level. The water flow is calculated for processwater and purging water of the closed loop cooling system.References: [101, World Bank, 1998], [181, HP, 1998], [262, Jansson, 2000], [257, Gilbert, 2000], [118, VROM,1999], HELCOM and OSPAR recommendation, [268, TWG, 2001]
Table 4.50: Emission concentration and loads found in good operated WWTP
Effluent treatment units are designed such that the most important key parameters (suspendedsolids, TOC, COD and BOD) can be monitored automatically leading to limited operatorattention and even less if sufficient up-stream water management measures are being taken toensure a constant quality and flow of water and adequate buffering. TOC and COD can bemonitored continuously whereas BOD need several days for the analysis.
ApplicabilityWWTP usually occupy a significant space at refineries, particularly the biotreater due to therelative slow biodegradation process. In order to save space it is advisable to integrate watermanagement principles into the design leading to a compact. A full train WWTP occupies aspace of 1 ha, not including an observation basin which many refineries have installed as a lastline of defense. The amount of rainwater depends of course on the local climatic conditions andthe size and layout of the refinery.
Techniques to consider in the determination of BAT Chapter 4
Mineral Oil and Gas Refineries 379
4.25 Waste management
This section together with the two previous ones are dealing with the end-of-pipe processes thatappear in a refinery. The reason why those techniques are appearing here is to give an overalldescription of the techniques and to avoid repetition. Description of end-of-pipe techniques doesnot appear in the previous sections. In this Section, general information on environmentalbenefits, cross-media effects, operational data, applicability is described here. Prevention orminimisation techniques applied to different process activities are found in each of the sectionsdealing with those production processes. Complementing waste minimisation and prevention ofgeneration of waste that may be found along this chapter, this section contains the wastemanagement systems that may be found within refineries. Those techniques are only discussedin this section within this document.
Residual refinery wastes are typically in the form of sludges, spent process catalysts, filter clay,and incinerator ash. Other waste fractions are waste from flue gas desulphurisation, fly ash,bottom ash, spent activated carbon, filter dust, inorganic salts as ammonium sulphate and limefrom water pretreatment, oil-contaminated soil, bitumen, sweepings, spent acid and causticsolutions, chemicals, among others. Treatment of these wastes includes incineration, landtreating off-site, land filling onsite, land filling off-site, chemical fixation, neutralization, andother treatment methods.
4.25.1 Establishment of a waste management programme
DescriptionThe establishment of an Environmental Management System (Section 4.15.1) should containelements to prevent waste generation and some pollution prevention techniques that help toprevent pollution of soil and groundwater. Some techniques that may be included are:• implementation of a sludge master plan with the aim to reduce the sludge generated.• provide enclosed sampling loops• clean and assembly only in especially constructed and dedicated areas• provide dedicated drainage systems• physical barriers such as clay walls or plastic membranes can be installed around the site
boundary. To be effective at containing oil pollution, these have to extend below the watertable. Monitoring wells will also be required to ensure that if oil does build up behind thebarrier, it can be removed before it has a chance to escape under the barrier. A second formof barrier is a ditch also extending to below the groundwater table. Any oil leaving the sitecan be observed floating on the water in the ditch and recovered. The outer face of the ditchcan be sealed with an impervious layer such as concrete, plastic, clay, steel piling etc
• groundwater, like surface water basically flows downhill. Therefore, groundwater can beprevented from leaving a site by lowering the level inside the site by pumping so that it islower than the level outside. Water will then flow into the site rather than outwards. Thepumped water has obviously to be disposed of. It may be possible to use this water forsupply purposes on site. If it is to be discharged, then monitoring will be required to ensurethat it is not contaminated. If it is, then it will have to be treated in which case, this methodwill be limited by the capacity of the effluent treatment system
• minimisation of underground piping. Underground piping can be a source of undetectedreleases to the soil and groundwater. Inspecting, repairing or replacing underground pipingwith surface piping can reduce or eliminate these potential sources. Retrofitting can be veryexpensive
• perform a risk analysis to rank in order of significance cases where accidental leak mayoccur (elements to consider are the product in the tanks/pipes, the age of the equipment, thenature of the soil and groundwater that would be affected). Prioritise areas whereimpermeable floors are needed most. Produce a multiyear master plan to program necessarysteps
• periodically screening of leaks in sewers and pipes.• correct conditioning of a catalyst during a run extends catalytic life
Chapter 4 Techniques to consider in the determination of BAT
380 Mineral Oil and Gas Refineries
• control of sodium content in visbreaker feedstock reduces coke formation• process optimisation leads to less off-specification product and hence less recycle• recycling caustic sufficiently can ensure it is completely spent• Sorting waste mixes e.g. concrete and scrap metal. could be cost-attractive (cheaper disposal
routes for some components) and eliminates risk of unwanted components• asbestos lagging: special equipment for compaction & packing• TEL/TML scale & sludge: permanganate treatment eliminates TEL/TML traces• oiled solids (soil): de-oiling in an oil extractor.• neutralisation: mixing polymerisation catalyst (H3PO4) with lime• Process treatment by steaming, flushing or regeneration prior to disposal: clay and sand
filters; catalysts• Solids released to the waste water sewer system can account for a large portion of a
refinery's oily sludges. Solids entering the sewer system (primarily soil particles) becomecoated with oil and are deposited as oily sludges in the API oil/water separator. Because atypical sludge has a solids content of 5 to 30 percent by weight, preventing one kg of solidsfrom entering the sewer system can eliminate 3 to 20 kg of oily sludge. TheAmoco/USAEPA study estimated that at the Yorktown facility 1000 tonnes of solids peryear enter the refinery sewer system. Methods used to control solids include: using a streetsweeper on paved areas, paving unpaved areas, planting ground cover on unpaved areas, re-lining sewers, cleaning solids from ditches and catch basins, and reducing heat exchangerbundle cleaning solids by using antifoulants in cooling water.
• A significant portion of refinery waste arises from oily sludges found in combinedprocess/storm sewers. Segregation of the relatively clean rainwater runoff from the processstreams can reduce the quantity of oily sludges generated. Furthermore, there is a muchhigher potential for recovery of oil from smaller, more concentrated process streams.
Achieved environmental benefitsThe aim of such a programme is to prevent contamination of the soil and the groundwater aswell as reduce the amount of waste generated.
Reference literature[195, The world refining association, 1999], [316, TWG, 2000], [115, CONCAWE, 1999]
4.25.2 Sludge management and treatment
DescriptionSludges are defined as emulsions of oil in water, stabilised by the presence of solids. Inrefineries a number of different types of sludges are generated at the following sources: crudeand product tanks (bottoms), API separation units, flocculation and flotation units, DAF,contaminated soil. Biological sludges represent an important different category of sludges interms of oil content and dewaterability. According to CONCAWE, in 1993, 44 % of theEuropean refinery sludges were incinerated, 9 % was land farmed and 30 % land filled. It isforeseen that land filling and land farming of sludges will be increasingly prohibited byforthcoming EU legislation, which means that the scope for sludge prevention reduction butalso for incineration at third parties will increase in the future.
The purpose of sludge treatment by dewatering, drying and/or incineration is to reduce thevolume and the residual hydrocarbon content in order to save costs in subsequent processing ordisposal. The principle of mechanical dewatering by decanters is based on centrifugal forces andon the density difference between water, oil and solids. The principle of the thermal treatmentsteps is based on a combination of evaporation by indirect heating and/or destruction of theorganic constituents by thermal oxidation (incineration).
Decanter centrifuges are the most widely used for dewatering both oily and for biosludges.Steam dryers are almost exclusively applied for biosludge and function often as a pretreatment
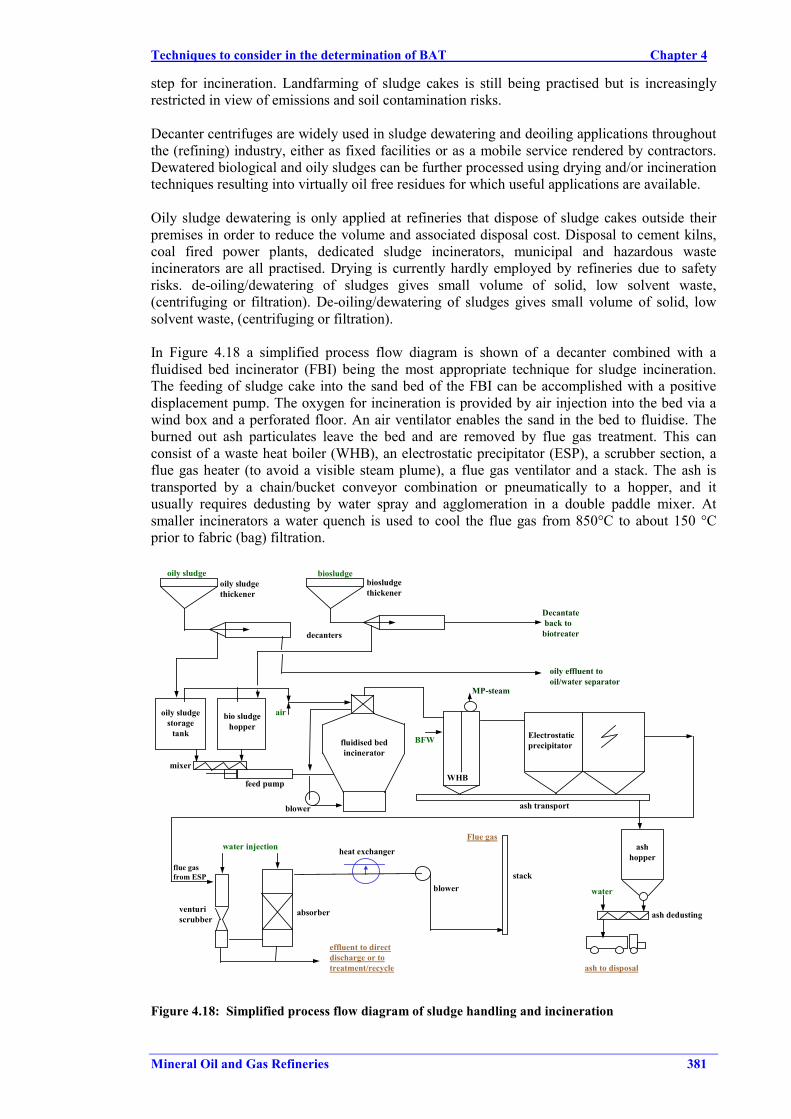
Techniques to consider in the determination of BAT Chapter 4
Mineral Oil and Gas Refineries 381
step for incineration. Landfarming of sludge cakes is still being practised but is increasinglyrestricted in view of emissions and soil contamination risks.
Decanter centrifuges are widely used in sludge dewatering and deoiling applications throughoutthe (refining) industry, either as fixed facilities or as a mobile service rendered by contractors.Dewatered biological and oily sludges can be further processed using drying and/or incinerationtechniques resulting into virtually oil free residues for which useful applications are available.
Oily sludge dewatering is only applied at refineries that dispose of sludge cakes outside theirpremises in order to reduce the volume and associated disposal cost. Disposal to cement kilns,coal fired power plants, dedicated sludge incinerators, municipal and hazardous wasteincinerators are all practised. Drying is currently hardly employed by refineries due to safetyrisks. de-oiling/dewatering of sludges gives small volume of solid, low solvent waste,(centrifuging or filtration). De-oiling/dewatering of sludges gives small volume of solid, lowsolvent waste, (centrifuging or filtration).
In Figure 4.18 a simplified process flow diagram is shown of a decanter combined with afluidised bed incinerator (FBI) being the most appropriate technique for sludge incineration.The feeding of sludge cake into the sand bed of the FBI can be accomplished with a positivedisplacement pump. The oxygen for incineration is provided by air injection into the bed via awind box and a perforated floor. An air ventilator enables the sand in the bed to fluidise. Theburned out ash particulates leave the bed and are removed by flue gas treatment. This canconsist of a waste heat boiler (WHB), an electrostatic precipitator (ESP), a scrubber section, aflue gas heater (to avoid a visible steam plume), a flue gas ventilator and a stack. The ash istransported by a chain/bucket conveyor combination or pneumatically to a hopper, and itusually requires dedusting by water spray and agglomeration in a double paddle mixer. Atsmaller incinerators a water quench is used to cool the flue gas from 850°C to about 150 °Cprior to fabric (bag) filtration.
bio sludgehopper
mixer
feed pump
fluidised bedincinerator
blower
BFW
air
MP-steam
Electrostaticprecipitator
ash transport
ashhopper
WHB
flue gasfrom ESP
blowerstack
heat exchanger
absorberventuriscrubber
water injection
effluent to directdischarge or totreatment/recycle
ash dedusting
ash to disposal
water
Flue gas
oily sludgestorage
tank
oily sludgethickener
biosludgethickener
decanters
oily effluent tooil/water separator
Decantate back tobiotreater
oily sludge biosludge
Figure 4.18: Simplified process flow diagram of sludge handling and incineration
Chapter 4 Techniques to consider in the determination of BAT
382 Mineral Oil and Gas Refineries
Operating temperatures of the bed can be controlled at respectively 800 – 850 °C and 850 – 950 °C. The WHB operates between 250 and 450 °C, the ESP at 220 °C and the scrubberbetween 200 and 50 °C. In a FBI all ash is carried over the top with the flue gas, which providesa large dust loading (typically 50000 mg/Nm3) to the WHB and ESP. Some 50 % of the dust iscollected in the WHB, which can be regarded as a settling chamber. The catchment efficiency ofan ESP is typically 99 %, leaving the (venturi) scrubber system to eliminate ± 500 mg/Nm3 tothe stringent CEC limit of 5 mg/Nm3. The ash might find a useful outlet in concrete or asphaltdependent on the quality.
It should be mentioned that the emissions of SO2, NOx, CO, organic compound, PAH, heavymetals generated by those systems should be properly controlled by suitable abatementtechniques.
Achieved environmental benefitsGeneration of sludges can be minimised and can be maintained to values between 0.1 to 0.5 kgper tonne of feedstock processed within the refinery.
Cross-media effectsScrubbing might require caustic if acidic (SO2 and NOx) components are present in the flue gasin concentrations which need to be removed to legal limits. The FBI with flue gas treatment andash handling is a closed system, with fully automated control. The system is kept under slightnegative pressure. The described system is regarded state-of-the-art for sludge incineration andis able to fulfil all legal stack emission requirements. Dioxins (PCDD/F) could be an issue athigh chlorine loading combined with sub-optimum operation conditions. In flue gas treatmentsystems of domestic sludge incinerators impregnated activated carbon filters (ACF) or zeolitesare installed for mercury/dioxin control. Effluent from the scrubber system can be substantial.Recirculation of scrubber water is only a cost effective proposition if treatment is required priorto discharge.
Operational dataSafety issues are associated with start-up and (planned or emergency) shut-down, for which aflame control interlock and a nitrogen purging system is required. Anaerobic and pyrophoricsludges (tank bottoms) can cause safety problems during storage and drying. The energyrequirements of sludge drying and incineration depend strongly on the sludge cakecharacteristics (water and residual oil contents). Energy integration with FBI is two fold: airpreheating of the primary fluidisation air is standard, and steam generation can be economicallyaccomplished with systems able to generate >8 tonnes of MP steam/hour. An intrinsicdisadvantage of FBI is the relatively large excess of air utilised in order to keep the bedfluidised.
ApplicabilityBecause its high cost, options as reduction/recycling of waste are more typical wasteminimisation options to be applied before waste incineration. Fluidised bed incinerators may bean option for third-party waste industry receiving waste streams.
EconomicsFor a FBI with a capacity of 4 t/h sludge cake (20 % dry solids) a footprint of about 50x100 m isrequired including tankage and complete flue gas and ash handling. The installation is normally12 - 15 m high (tanks, incinerator, WHB, ESP, ash hopper) and the stack height is usually atleast 40 m, dependent on ancillary installations. The above-described system would be suitablefor a large 20 Mt/yr refinery and requires a capital investment of about EUR 37.5 million(including installation). The operational costs could amount to EUR 500 - 700/tonne dry solids.If large scale domestic sludge incinerators are available, which are entitled to take industrialsludges, the installation of a dedicated sludge incineration system is not economicallyjustifiable. This certainly would be the case for smaller refineries, indicating that contractdewatering, drying and incineration are competitive to own processing.


![Sulphuric Acid Data[1]](https://img.pdfslide.net/doc/110x75/577d23741a28ab4e1e99d41e/sulphuric-acid-data1.jpg)