Embed Size (px)
Citation preview
Chapter 40
DATA MINING FOR IMBALANCED DATASETS: AN OVERVIEW
Nitesh V. Chawla Department of Computer Science and Engineering University of Notre Dame IN 46530, USA
Abstract A dataset is imbalanced if the classification categories are not approximately equally represented. Recent years brought increased interest in applying ma- chine learning techniques to difficult "real-world" problems, many of which are characterized by imbalanced data. Additionally the distribution of the testing data may differ from that of the training data, and the true misclassification costs may be unknown at learning time. Predictive accuracy, a popular choice for evaluating performance of a classifier, might not be appropriate when the data is imbalanced andlor the costs of different errors vary markedly. In this Chapter, we discuss some of the sampling techniques used for balancing the datasets, and the performance measures more appropriate for mining imbalanced datasets.
Keywords: imbalanced datasets, classification, sampling, ROC, cost-sensitive measures, precision and recall
1 Introduction The issue with imbalance in the class distribution became more pronounced
with the applications of the machine learning algorithms to the real world. These applications range from telecommunications management (Ezawa et al., 1996), bioinformatics (Radivojac et al., 2004), text classification (Lewis and Catlett, 1994; Dumais et al., 1998; Mladeni6 and Grobelnik, 1999; Cohen, 1995b), speech recognition (Liu et al., 2004), to detection of oil spills in satel- lite images (Kubat et al., 1998). The imbalance can be an artifact of class distribution and/or different costs of errors or examples. It has received atten- tion from machine learning and Data Mining community in form of Workshops (Japkowicz, 2000b; Chawla et al., 2003a; Dietterich et al., 2003; Fem et al.,
854 DATA MINING AND KNOWLEDGE DISCOVERY HANDBOOK
2004) and Special Issues (Chawla et al., 2004a). The range of papers in these venues exhibited the pervasive and ubiquitous nature of the class imbalance is- sues faced by the Data Mining community. Sampling methodologies continue to be popular in the research work. However, the research continues to evolve with different applications, as each application provides a compelling problem. One focus of the initial workshops was primarily the performance evaluation criteria for mining imbalanced datasets. The limitation of the accuracy as the performance measure was quickly established. ROC curves soon emerged as a popular choice (Fem et al., 2004).
The compelling question, given the different ciass distributions is: What is the correct distribution for a learning algorithm? Weiss and Provost pre- sented a detailed analysis on the effect of class distribution on classifier learn- ing (Weiss and Provost, 2003). Our observations agree with their work that the natural distribution is often not the best distribution for learning a classifier (Chawla, 2003). Also, the imbalance in the data can be more characteristic of "sparseness" in feature space than the class imbalance. Various re-sampling strategies have been used such as random oversampling with replacement, ran- dom undersampling, focused oversampling, focused undersampling, oversam- pling with synthetic generation of new samples based on the known informa- tion, and combinations of the above techniques (Chawla et al., 2004b).
In addition to the issue of inter-class distribution, another important probem arising due to the sparsity in data is the distribution of data within each class (Japkowicz, 2001a). This problem was also linked to the issue of small disjuncts in the decision tree learning. Yet another, school of thought is a recognition based approach in the form of a one-class learner. The one-class learners provide an interesting alternative to the traditional discriminative ap- proach, where in the classifier is learned on the target class alone (Japkowicz, 2001b; Juszczak and Duin, 2003; Raskutti and Kowalczyk, 2004; Tax, 2001).
In this chapter1, we present a liberal overview of the problem of mining im- balanced datasets with particular focus on performance measures and sampling methodologies. We will present our novel oversampling technique, SMOTE, and its extension in the boosting procedure - SMOTEBoost.
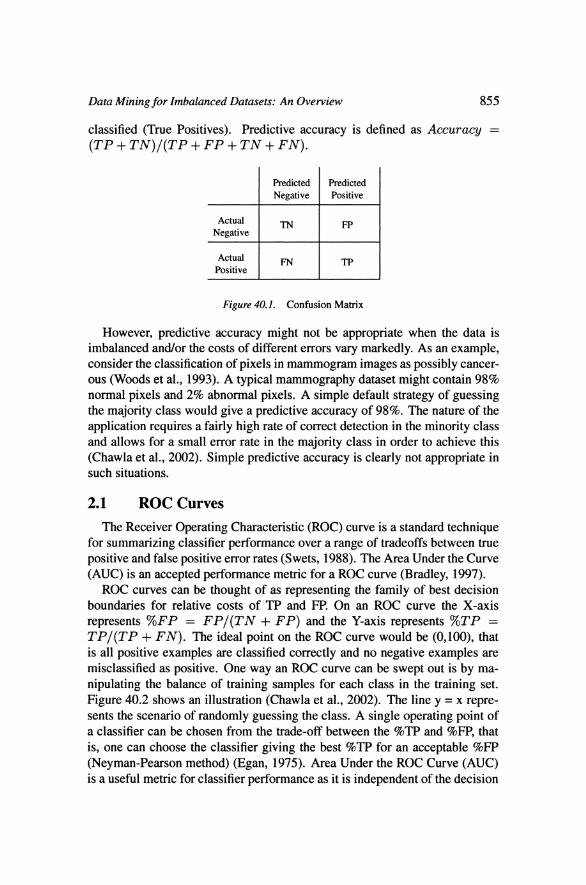
2. Performance Measure A classifier is, typically, evaluated by a confusion matrix as illustrated in
Figure 40.1 (Chawla et al., 2002). The columns are the Predicted class and the rows are the Actual class. In the confusion matrix, T N is the num- ber of negative examples correctly classified (True Negatives), F P is the number of negative examples incorrectly classified as positive (False Posi- tives), F N is the number of positive examples incorrectly classified as neg- ative (False Negatives) and TP is the number of positive examples correctly
Data Mining for Imbalanced Datasets: An Overview 855
classified ( T N ~ Positives). Predictive accuracy is defined as Accuracy = ( T P + T N ) / ( T P + F P + T N + F N ) .
Predicted Predicted I Negative I Positive I Actual
Negative
Actual Positive
Figure 40.1. Confusion Matrix
However, predictive accuracy might not be appropriate when the data is imbalanced and/or the costs of different errors vary markedly. As an example, consider the classification of pixels in mammogram images as possibly cancer- ous (Woods et al., 1993). A typical mammography dataset might contain 98% normal pixels and 2% abnormal pixels. A simple default strategy of guessing the majority class would give a predictive accuracy of 98%. The nature of the application requires a fairly high rate of correct detection in the minority class and allows for a small error rate in the majority class in order to achieve this (Chawla et al., 2002). Simple predictive accuracy is clearly not appropriate in such situations.
2.1 ROC Curves The Receiver Operating Characteristic (ROC) curve is a standard technique
for summarizing classifier performance over a range of tradeoffs between true positive and false positive error rates (Swets, 1988). The Area Under the Curve (AUC) is an accepted performance metric for a ROC curve (Bradley, 1997).
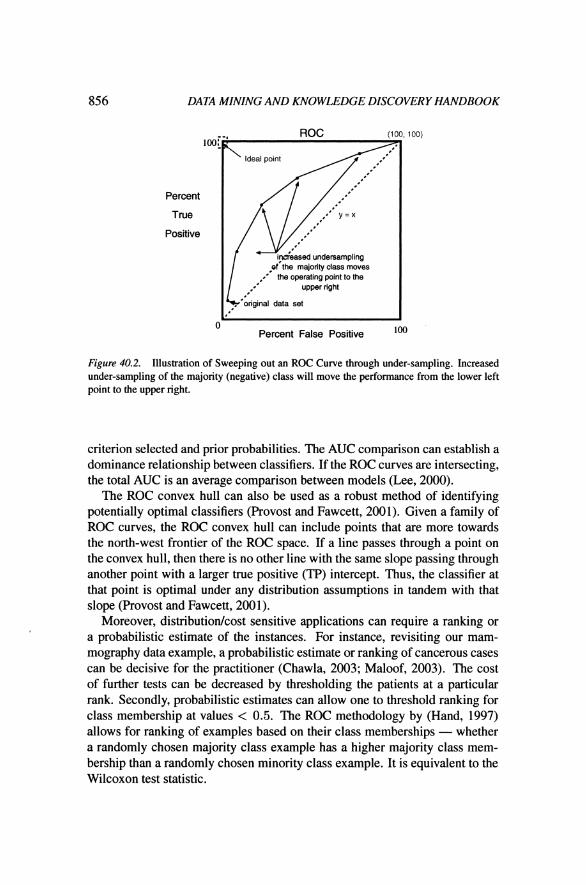
ROC curves can be thought of as representing the family of best decision boundaries for relative costs of TP and FP. On an ROC curve the X-axis represents %FP = F P / ( T N + F P ) and the Y-axis represents %TP = T P / ( T P + F N ) . The ideal point on the ROC curve would be (0,100), that is all positive examples are classified correctly and no negative examples are misclassified as positive. One way an ROC curve can be swept out is by ma- nipulating the balance of training samples for each class in the training set. Figure 40.2 shows an illustration (Chawla et al., 2002). The line y = x repre- sents the scenario of randomly guessing the class. A single operating point of a classifier can be chosen from the trade-off between the %TP and %FP, that is, one can choose the classifier giving the best %TP for an acceptable %FP (Neyman-Pearson method) (Egan, 1975). Area Under the ROC Curve (AUC) is a useful metric for classifier performance as it is independent of the decision
DATA MINING AND KNOWLEDGE DISCOVERY HANDBOOK
Percent
True
Positive
,.' the operating point to the
0 Percent False Positive loo
Figure 40.2. Illustration of Sweeping out an ROC Curve through under-sampling. Increased under-sampling of the majority (negative) class will move the performance from the lower left point to the upper right.
criterion selected and prior probabilities. The AUC comparison can establish a dominance relationship between classifiers. If the ROC curves are intersecting, the total AUC is an average comparison between models (Lee, 2000).
The ROC convex hull can also be used as a robust method of identifying potentially optimal classifiers (Provost and Fawcett, 2001). Given a family of ROC curves, the ROC convex hull can include points that are more towards the north-west frontier of the ROC space. If a line passes through a point on the convex hull, then there is no other line with the same slope passing through another point with a larger true positive (TP) intercept. Thus, the classifier at that point is optimal under any distribution assumptions in tandem with that slope (Provost and Fawcett, 2001).
Moreover, distribution/cost sensitive applications can require a ranking or a probabilistic estimate of the instances. For instance, revisiting our mam- mography data example, a probabilistic estimate or ranking of cancerous cases can be decisive for the practitioner (Chawla, 2003; Maloof, 2003). The cost of further tests can be decreased by thresholding the patients at a particular rank. Secondly, probabilistic estimates can allow one to threshold ranking for class membership at values < 0.5. The ROC methodology by (Hand, 1997) allows for ranking of examples based on their class memberships - whether a randomly chosen majority class example has a higher majority class mem- bership than a randomly chosen minority class example. It is equivalent to the Wilcoxon test statistic.
Data Mining for Imbalanced Datasets: An Overview 857
2.2 Precision and Recall From the confusion matrix in Figure 40.1, we can derive the expression for
precision and recall (Buckland and Gey, 1994).
precision = T P
T P + FP
recall = T P
T P + FN The main goal for learning from imbalanced datasets is to improve the recall
without hurting the precision. However, recall and precision goals can be often conflicting, since when increasing the true positive for the minority class, the number of false positives can also be increased; this will reduce the precision. The F-value metric is one measure that combines the trade-offs of precision and recall, and outputs a single number reflecting the "goodness" of a classi- fier in the presence of rare classes. While ROC curves represent the trade-off between values of TP and FP, the F-value represents the trade-off among dif- ferent values of TP, FP, and FN (Buckland and Gey, 1994). The expression for the F-value is as follows:
(1 + P2) * recall *precision F - value =
0 2 * recall +precision
where /3 corresponds to the relative importance of precision vs recall. It is usually set to 1.
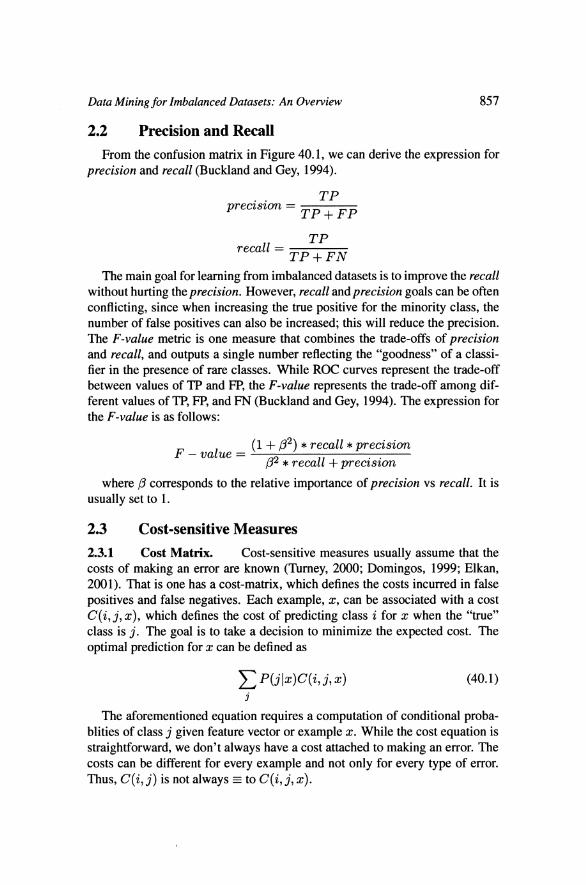
2.3 Cost-sensitive Measures 2.3.1 Cost Matrix. Cost-sensitive measures usually assume that the costs of making an error are known (Turney, 2000; Domingos, 1999; Elkan, 2001). That is one has a cost-matrix, which defines the costs incurred in false positives and false negatives. Each example, x, can be associated with a cost C(i, j, x), which defines the cost of predicting class i for x when the "true" class is j. The goal is to take a decision to minimize the expected cost. The optimal prediction for x can be defined as
The aforementioned equation requires a computation of conditional proba- blities of class j given feature vector or example x. While the cost equation is straightforward, we don't always have a cost attached to making an error. The costs can be different for every example and not only for every type of error. Thus, C(i, j) is not always = to C(i, j, x).
858 DATA MINING AND KNOWLEDGE DISCOVERY HANDBOOK
2.3.2 Cost Curves. (Drummond and Holte, 2000) propose cost-curves, where the x-axis represents of the fraction of the positive class in the training set, and the y-axis represents the expected error rate grown on each of the training sets. The training sets for a data set is generated by under (or over) sampling. The error rates for class distributions not represented are construed by interpolation. They define two cost-sensitive components for a machine learning algorithm: 1) producing a variety of classifiers applicable for different distributions and 2) selecting the appropriate classifier for the right distribution. However, when the misclassification costs are known, the x-axis can represent the "probability cost function", which is the normalized product of C(- I +) * P(+); the y-axis represents the expected cost.
3. Sampling Strategies Over and under-sampling methodologies have received significant attention
to counter the effect of imbalanced data sets (Solberg and Solberg, 1996; Jap- kowicz, 2000a; Chawla et al., 2002; Weiss and Provost, 2003; Kubat and Matwin, 1997; Jo and Japkowicz, 2004; Batista et al., 2004; Phua and Ala- hakoon, 2004; Laurikkala, 2001; Ling and Li, 1998). Various studies in im- balanced datasets have used different variants of over and under sampling, and have presented (sometimes conflicting) viewpoints on usefulness of oversam- pling versus undersampling (Chawla, 2003; Maloof, 2003; Drurnmond and Holte, 2003; Batista et al., 2004).
The random under and over sampling methods have their various short-comings. The random undersampling method can potentially remove certain important examples, and random oversampling can lead to overfitting. However, there has been progression in both the under and over sampling methods. (Kubat and Matwin, 1997) used one-sided selection to selectively undersample the original population. They used Tomek Links (Tomek, 1976) to identify the noisy and borderline examples. They also used the Condensed Nearest Neighbor (CNN) rule (Hart, 1968) to remove examples from the ma- jority class that are far away from the decision border. (Laurikkala, 2001) proposed Neighborhood Cleaning Rule (NCL) to remove the majority class examples. The author computes three nearest neighbors for each of the (Ei) examples in the training set. If Ei belongs to the majority class, and it is mis- classified by its three nearest neighbors, then Ei is removed. If Ei belongs to the minority class, and it is misclassified by its three nearest neighbors then the majority class examples among the three nearest neighbors are removed. This approach can reach a computational bottleneck for very large datasets, with a large majority class.
(Japkowicz, 2000a) discussed the effect of imbalance in a dataset. She eval- uated three strategies: under-sampling, resampling and a recognition-based
Data Mining for Imbalanced Datasets: An Overview 859
induction scheme. She considered two sampling methods for both over and undersampling. Random resampling consisted of oversampling the smaller class at random until it consisted of as many samples as the majority class and "focused resampling" consisted of oversampling only those minority exam- ples that occurred on the boundary between the minority and majority classes. Random under-sampling involved under-sampling the majority class samples at random until their numbers matched the number of minority class samples; focused under-sampling involved under-sampling the majority class samples lying further away. She noted that both the sampling approaches were effec- tive, and she also observed that using the sophisticated sampling techniques did not give any clear advantage in the domain considered. However, her over- sampling methodologies did not construct any new examples.
(Ling and Li, 1998) also combined over-sampling of the minority class with under-sampling of the majority class. They used lift analysis instead of accu- racy to measure a classifier's performance. They proposed that the test exam- ples be ranked by a confidence measure and then lift be used as the evaluation criteria. In one experiment, they under-sampled the majority class and noted that the best lift index is obtained when the classes are equally represented. In another experiment, they over-sampled the positive (minority) examples with replacement to match the number of negative (majority) examples to the num- ber of positive examples. The over-sampling and under-sampling combination did not provide significant improvement in the lift index.
We developed a novel oversampling technique called SMOTE (Synthetic Minority Oversampling TEchnique). It can be essential to provide new related information on the positive class to the learning algorithm, in addition to un- dersampling the majority class. This was the first attempt to introduce new examples in the training data to enrich the data space and counter the sparsity in the distribution. We will discuss SMOTE in more detail in the subsequent section. We combined SMOTE with undersampling. We used ROC analyses to present the results of our findings.
Batista et al. (Batista et al., 2004) evaluated various sampling methodolo- gies on a variety of datasets with different class distributions. They included various methods in both oversampling and undersampling. They conclude that SMOTE+Tomek and SMOTE+ENN are more applicable and give very good results for datasets with a small number of positive class examples. They also noted that the decision trees constructed from the oversampled datasets are usually very large and complex. This is similar to the observation by (Chawla et al., 2002).
860 DATA MINING AND KNOWLEDGE DISCOVERY HANDBOOK
3.1 Synthetic Minority Oversampling TEchnique: SMOTE
Over-sampling by replication can lead to similar but more specific regions in the feature space as the decision region for the minority class. This can po- tentially lead to overfitting on the multiple copies of minority class examples. To overcome the overfitting and broaden the decision region of minority class examples, we introduced a novel technique to generate synthetic examples by operating in "feature space" rather than "data space" (Chawla et al., 2002). The minority class is over-sampled by taking each minority class sample and intro- ducing synthetic examples along the line segments joining anylall of the k mi- nority class nearest neighbors. Depending upon the amount of over-sampling required, neighbors from the k nearest neighbors are randomly chosen. Syn- thetic samples are generated in the following way: Take the difference between the feature vector (sample) under consideration and its nearest neighbor. Mul- tiply this difference by a random number between 0 and l, and add it to the feature vector under consideration. This causes the selection of a random point along the line segment between two specific features. This approach effectively forces the decision region of the minority class to become more general. For the nominal cases, we take the majority vote for the nominal value amongst the nearest neighbors. We use the modification of Value Distance Metric (VDM) (Cost and Salzberg, 1993) to compute the nearest neighbors for the nominal valued features.
The synthetic examples cause the classifier to create larger and less spe- cific decision regions, rather than smaller and more specific regions, as typi- cally caused by over-sampling with replication. More general regions are now learned for the minority class rather than being subsumed by the majority class samples around them. The effect is that decision trees generalize better.
SMOTE was tested on a variety of datasets, with varying degrees of imbal- ance and varying amounts of data in the training set, thus providing a diverse testbed. SMOTE forces focused learning and introduces a bias towards the mi- nority class. On most of the experiments, SMOTE using C4.5 (Quinlan, 1992) and Ripper (Cohen, 1995a) as underlying classifiers outperformed other meth- ods including sampling strategies, Ripper's Loss Ratio, and even Naive Bayes by varying the class priors.
4. Ensemble-based Methods Combination of classifiers can be an effective technique for improving pre-
diction accuracy. As one of the most popular combining techniques, boosting (Freund and Schapire, 1996), uses adaptive sampling of instances to generate a highly accurate ensemble of classifiers whose individual global accuracy is only moderate. In boosting, the classifiers in the ensemble are trained serially,
Data Mining for Imbalanced Datasets: An Overview 86 1
with the weights on the training instances adjusted adaptively according to the performance of the previous classifiers. The main idea is that the classifica- tion algorithm should concentrate on the instances that are difficult to learn. Boosting has received extensive empirical study (Dietterich, 2000; Bauer and Kohavi, 1999), but most of the published work focuses on improving the ac- curacy of a weak classifier on datasets with well-balanced class distributions. There has been significant interest in the recent literature for embedding cost- sensitivities in the boosting algorithm. We proposed SMOTEBoost that em- beds the SMOTE procedure during boosting iterations. CSB fling, 2000) and AdaCost boosting algorithms (Fan et al., 1999) update the weights of examples according to the misclassification costs. On the other side, Rare-Boost (Joshi et al., 2001) updates the weights of the examples differently for all four entries shown in Figure 40.1. Guo and Viktor (Guo and Viktor, 2004) propose another technique that modifies the boosting procedure - DataBoost. As compared to SMOTEBoost, which only focuses on the hard minority class cases, this technique employs a synthetic data generation process for both minority and majority class cases.
In addition to boosting, popular sampling techniques have also been de- ployed to construct ensembles. Radivojac et al. (Radivojac et al., 2004) com- bined bagging with oversampling methodlogies for the bioinformatics domain. Liu et al. (Liu et al., 2004) also applied a variant of bagging by bootstrapping at equal proportions from both the minority and majority classes. They ap- plied this technique to the problem of sentence boundary detection. Phua et. a1 (Phua and Alahakoon, 2004) combine bagging and stacking to identify the best mix of classifiers. In their insurance fraud detection domain, they note that stacking-bagging achieves the best cost-savings
4.1 SMOTEBoost SMOTEBoost algorithm combines SMOTE and the standard boosting pro-
cedure (Chawla et al., 2003b). We want to utilize SMOTE for improving the accuracy over the minority classes, and we want to utilize boosting to maintain accuracy over the entire data set. The major goal is to better model the mi- nority class in the data set, by providing the learner not only with the minority class instances that were rnisclassified in previous boosting iterations, but also with a broader representation of those instances.
The standard boosting procedure gives equal weights to all misclassified examples. Since boosting samples from a pool of data that predominantly con- sists of the majority class, subsequent samplings of the training set may still be skewed towards the majority class. Although boosting reduces the vari- ance and the bias in the final ensemble (Freund and Schapire, 1996), it might not hold for datasets with skewed class distributions. There is a very strong
862 DATA MINING AND KNOWLEDGE DISCOVERY HANDBOOK
learning bias towards the majority class cases in a skewed data set, and subse- quent iterations of boosting can lead to a broader sampling from the majority class. Boosting (Adaboost) treats both kinds of errors (FP and FN) in a sim- ilar fashion. Our goal is to reduce the bias inherent in the learning procedure due to the class imbalance, and increase the sampling weights for the minority class. Introducing SMOTE in each round of boosting will enable each learner to be able to sample more of the minority class cases, and also learn better and broader decision regions for the minority class. SMOTEBoost approach outperformed boosting, Ripper (Cohen, 1995a), and AdaCost on a variety of datasets (Chawla et al., 2003b).
5. Discussion Mining from imbalanced datasets is indeed a very important problem from
both the algorithmic and performance perspective. Not choosing the right dis- tribution or the objective function while developing a classification model can introduce bias towards majority (potentially uninteresting) class. Furthermore, predictive accuracy is not a useful measure when evaluating classifiers learned on imbalance data sets. Some of the measures discussed in Section 2 can be more appropriate.
Sampling methods are very popular in balancing the class distribution be- fore learning a classifier, which uses an error based objective function to search the hypothesis space. We focused on SMOTE in the chapter. Consider the ef- fect on the decision regions in feature space when minority over-sampling is done by replication (sampling with replacement) versus the introduction of synthetic examples. With replication, the decision region that results in a clas- sification decision for the minority class can actually become smaller and more specific as the minority samples in the region are replicated. This is the op- posite of the desired effect. Our method of synthetic over-sampling works to cause the classifier to build larger decision regions that contain nearby minority class points. The same reasons may be applicable to why SMOTE performs better than Ripper's loss ratio and Naive Bayes; these methods, nonetheless, are still learning from the information provided in the dataset, albeit with dif- ferent cost information. SMOTE provides more related minority class samples to learn from, thus allowing a learner to carve broader decision regions, lead- ing to more coverage of the minority class. The SMOTEBoost methodology that embeds SMOTE within the Adaboost procedure provided further improve- ments to the minority class prediction.
One compelling problem arising from sampling methodologies is: Can we identify the right distribution? Is balanced the best distribution? It is not straightforward. This is very domain and classifier dependent, and is usually driven by empirical observations. (Weiss and Provost, 2003) present a bud-
Data Mining for Imbalanced Datasets: An Overview 863
geted sampling approach, which represents a heuristic for searching for the right distribution. Another compelling issue is :What ifthe test distribuion re- markably difers from the training distribution? If we train a classifier on a distribution tuned on the discovered distribution, will it generalize enough on the testing set. In such cases, one can assume that the natural distribution holds, and apply a form of cost-sensitive learning. If a cost-matrix is known and is static across the training and testing sets, learn from the original or natural dis- tribution, and then apply the cost-matrix at the time of classification. It can also be the case that the majority class is of an equal interest as the minority class - the imbalance here is a mere artifiact of class distribution and not of different types of errors (Liu et al., 2004). In such a scenario, it is important to model both the majority and minority classes without a particular bias towards any one class.
We believe mining imbalanced datasets opens a front of interesting prob- lems and research directions. Given that Data Mining is becoming pervasive and ubiquitous in various applications, it is important to investigate along the lines of imbalance both in class distribution and costs.
Acknowledgements I would like to thank Larry Hall, Kevin Bowyer and Philip Kegelmeyer for
their valuable input during my Ph.D. research in this field. I am also extremely grateful to all my collaborators and co-authors in the area of learning from imbalanced datasets. I have enjoyed working with them and contributing to this field.
Notes 1. The chapter will utilize excerpts from our published work in various Journals and Conferences.
Please see the references for the original publications.
References Batista, G. E. A. P. A., Prati, R. C., and Monard, M. C. (2004). A study of the
behavior of several methods for balancing machine learning training data. SIGKDD Explorations, 6(1).
Bauer, E. and Kohavi, R. (1999). An empirical comparison of voting classifica- tion algorithms: Bagging, boosting and variants. Machine Learning, 36(1,2).
Bradley, A. P. (1997). The Use of the Area Under the ROC Curve in the Eval- uation of Machine Learning Algorithms. Pattern Recognition, 30(6): 1145- 11%.
Buckland, M. and Gey, F. (1994). The Relationship Between Recall and Preci- sion. Journal of the American Society for Information Science, 45(1): 12-19.
864 DATA MINING AND KNOWLEDGE DISCOVERY HANDBOOK
Chawla, N. V. (2003). C4.5 and Imbalanced Data sets: Investigating the Effect of Sampling Method, Probabilistic Estimate, and Decision Tree Structure. In ICML Workshop on Learning from Imbalanced Data sets, Washington, DC.
Chawla, N. V., Bowyer, K. W., Hall, L. O., and Kegelmeyer, W. P. (2002). SMOTE: Synthetic Minority Oversampling TEchnique. Journal of Artijcial Intelligence Research, 16:321-357.
Chawla, N. V., Japkowicz, N., and Kolcz, A., editors (2003a). Proceedings of the ICML'2003 Workshop on Learningfrom Imbalanced Data Sets 11.
Chawla, N. V., Japkowicz, N., and Kokz, A., editors (2004a). SIGKDD Special Issue on Learning from Imbalanced Datasets.
Chawla, N. V., Japkowicz, N., Kolcz, A. (2004b), Editorial: Learning form Imbalanced Datasets, SIGKDD Explorations, 6(1).
Chawla, N. V., Lazarevic, A., Hall, L. O., and Bowyer, K. W. (2003b). Smote- boost: Improving Prediction of the Minority Class in Boosting. In Seventh European Conference on Principles and Practice of Knowledge Discovery in Databases, pages 107-1 19, Dubrovnik, Croatia.
Cohen, W. (1995a). Fast Effective Rule Induction. In Proceedings of the Twelfth International Conference on Machine Learning, pages 115-123. Department of Computer Science, Katholieke Universiteit Leuven.
Cohen, W. (1995b). Learning to Classify English Text with ILP Methods. In Proceedings of the 5th International Workshop on Inductive Logic Program- ming, pages 3-24. Department of Computer Science, Katholieke Univer- siteit Leuven.
Cost, S. and Salzberg, S. (1993). A Weighted Nearest Neighbor Algorithm for Learning with Symbolic Features. Machine Learning, 10(1):57-78.
Dietterich, T. (2000). An Empirical Comparison of Three Methods for Con- structing Ensembles of Decision Trees: Bagging, Boosting and Randomiza- tion. Machine Learning, 40(2): 139 - 157.
Dietterich, T., Margineantu, D., Provost, F., and Turney, P., editors (2003). Pro- ceedings of the ICML'2000 Workshop on COST-SENSITIVE LEARNING.
Domingos, P. (1999). Metacost: A General Method for Making Classifiers Cost-sensitive. In Proceedings of the Fifrh ACM SIGKDD International Conference on Knowledge Discovery and Data Mining, pages 155-164, San Diego, CA. ACM Press.
Drummond, C. and Holte, R. (2003). C4.5, class imbalance, and cost sen- sitivity: Why under-sampling beats over-sampling. In Proceedings of the ICML'03 Workshop on Learning from Imbalanced Data Sets.
Drummond, C. and Holte, R. C. (2000). Explicitly Representing Expected Cost: An Alternative to ROC Representation. In Proceedings of the Sixth ACM SIGKDD International Conference on Knowledge Discovery and Data Mining, pages 198-207, Boston. ACM.
Data Mining for Imbalanced Datasets: An Overview 865
Dumais, S., Platt, J., Heckerman, D., and Sahami, M. (1998). Inductive Learn- ing Algorithms and Representations for Text Categorization. In Proceed- ings of the Seventh International Conference on Information and Knowledge Management., pages 148-155.
Egan, J. P. (1975). Signal Detection Theory and ROC Analysis. In Series in Cognition and Perception. Academic Press, New York.
Elkan, C. (2001). The Foundations of Cost-sensitive Learning. In Proceedings of the Seventeenth International Joint Conference on Artificial Intelligence, pages 973-978, Seattle, WA.
Ezawa, K., J., Singh, M., and Norton, S., W. (1996). Learning Goal Oriented Bayesian Networks for Telecommunications Risk Management. In Proceed- ings of the International Conference on Machine Learning, ICML-96, pages 139-147, Bari, Italy. Morgan Kauffman.
Fan, W., Stolfo, S., Zhang, J., and Chan, P. (1999). Adacost: Misclassification Cost-sensitive Boosting. In Proceedings of Sixteenth International Confer- ence on Machine Learning, pages 983-990, Slovenia.
Fem, C., Flach, P., Orallo, J., and Lachice, N., editors (2004). ECAI' 2004 First Workshop on ROC Analysis in AI. ECAI.
Freund, Y. and Schapire, R. (1996). Experiments with a New Boosting Algo- rithm. In Thirteenth International Conference on Machine Learning, Bari, Italy.
Guo, H. and Viktor, H. L. (2004). Learning from imbalanced data sets with boosting and data generation: The DataBoost-IM approach. SIGKDD Ex- plorations, 6(1).
Hand, D. J. (1997). Construction and Assessment of Classification Rules. John Wiley and Sons.
Hart, P. E. (1968). The Condensed Nearest Neighbor Rule. IEEE Transactions on Information Theory, 14:5 15-5 16.
Japkowicz, N. (2000a). The Class Imbalance Problem: Significance and Strate- gies. In Proceedings of the 2000 International Conference on Artificial In- telligence (IC-A1'2000): Special Track on Inductive Learning, Las Vegas, Nevada.
Japkowicz, N. (2000b). Learning from Imbalanced Data sets: A Comparison of Various Strategies. In Proceedings of the AAA1'2000 Workshop on Learning from Imbalanced Data Sets, Austin, TX.
Japkowicz, N. (2001a). Concept-learning in the presence of between-class and within-class imbalances. In Proceedings of the Fourteenth Conference of the Canadian Sociefy for Computational Studies of Intelligence, pages 67-77.
Japkowicz, N. (2001b). Supervised versus ~ n s u p e ~ i s e d binary-learning by feedforward neural networks. Machine Learning, 42(1/2):97-122.
Jo, T. and Japkowicz, N. (2004). Class imbalances versus small disjuncts. SIGKDD Explorations, 6(1).
866 DATA MINING AND KNOWLEDGE DISCOVERY HANDBOOK
Joshi, M., Kumar, V., and Agarwal, R. (2001). Evaluating Boosting Algorithms to Classify Rare Classes: Comparison and Improvements. In Proceedings of the First IEEE International Conference on Data Mining, pages 257-264, San Jose, CA.
Juszczak, P. and Duin, R. P. W, (2003). Uncertainty sampling methods for one- class classifiers. In Proceedings of the ICML'03 Workshop on Learningfrom Imbalanced Data Sets.
Kubat, M., Holte, R., and Matwin, S. (1998). Machine Learning for the Detec- tion of Oil Spills in Satellite Radar Images. Machine Learning, 30:195-215.
Kubat, M. and Matwin, S. (1997). Addressing the Curse of Imbalanced Train- ing Sets: One Sided Selection. In Proceedings of the Fourteenth Intema- tional Conference on Machine Learning, pages 179-186, Nashville, Ten- nesse. Morgan Kaufmann.
Laurikkala, J. (2001). Improving Identification of Difficult Small Classes by Balancing Class Distribution. Technical Report A-2001-2, University of Tampere.
Lee, S. S. (2000). Noisy Replication in Skewed Binary Classification. Compu- tational Statistics and Data Analysis, 34.
Lewis, D. and Catlett, J. (1994). Heterogeneous Uncertainity Sampling for Su- pervised Learning. In Proceedings of the Eleventh International Conference of Machine Learning, pages 148-156, San Francisco, CA. Morgan Kauf- mann.
Ling, C. and Li, C. (1998). Data Mining for Direct Marketing Problems and Solutions. In Proceedings of the Fourth International Conference on Knowl- edge Discovery and Data Mining (KDD-98), New York, NY. AAAI Press.
Liu, Y., Chawla, N. V., Shriberg, E., Stolcke, A., and Harper, M. (2004). Re- sampling Techniques for Sentence Boundary Detection: A Case Study in Machine Learning from Imbalanced Data for Spoken Language Processing. Under Review.
Maloof, M. (2003). Learning when data sets are imbalanced and when costs are unequal and unknown. In Proceedings of the ICML'03 Workshop on Learning from Imbalanced Data Sets.
Mladenii, D. and Grobelnik, M. (1999). Feature Selection for Unbalanced Class Distribution and Naive Bayes. In Proceedings of the 16th Interna- tional Conference on Machine Learning., pages 258-267. Morgan Kauf- mann.
Phua, C. and Alahakoon, D. (2004). Minority report in fraud detection: Clas- sification of skewed data. SIGKDD Explorations, 6(1).
Provost, F. and Fawcett, T. (2001). Robust Classification for Imprecise Envi- ronments. Machine Learning, 42/3:203-23 1.
Quinlan, J. R. (1992). C4. 5: Programs for Machine Learning. Morgan Kauf- mann, San Mateo, CA.
Data Mining for Imbalanced Datasets: An Overview 867
Radivojac, P., Chawla, N. V., Dunker, K., and Obradovic, Z. (2004). Classifica- tion and Knowledge Discovery in Protein Databases. Journal of Biomedical Informatics, 37(4):224-239.
Raskutti, B. and Kowalczyk, A. (2004). Extreme rebalancing for svms: a case study. SIGKDD Explorations, 6(1).
Solberg, A. H. and Solberg, R. (1996). A Large-Scale Evaluation of Features for Automatic Detection of Oil Spills in ERS SAR Images. In International Geoscience and Remote Sensing Symposium, pages 1484-1486, Lincoln, NE.
Swets, J. (1988). Measuring the Accuracy of Diagnostic Systems. Science, 240: 1285-1293.
Tax, D. (2001). One-class classiJication. PhD thesis, Delft University of Tech- nology.
Ting, K. (2000). A comparative study of cost-sensitive boosting algorithms. In Proceedings of Seventeenth International Conference on Machine Learning, pages 983-990, Stanford, CA.
Tomek, I. (1976). Two Modifications of CNN. IEEE Transactions on Systems, Man and Cybernetics, 6:769-772.
Turney, P. (2000). Types of Cost in Inductive Concept Learning. In Workshop on Cost-Sensitive Learning at the Seventeenth International Conference on Machine Learning, pages 15-2 1, Stanford, CA.
Weiss, G. and Provost, F. (2003). Learning when Training Data are Costly: The Effect of Class Distribution on Tree Induction. Journal of ArtiJicial Intelli- gence Research, 19:3 15-354.
Woods, K., Doss, C., Bowyer, K., Solka, J., Priebe, C., and Kegelmeyer, P. (1993). Comparative Evaluation of Pattern Recognition Techniques for De- tection of Microcalcifications in Mammography. International Journal of Pattern Recognition and ArtiJicial Intelligence, 7(6): 14 17-1436.


![META METRIC LEARNING FOR HIGHLY IMBALANCED AERIAL …epubs.surrey.ac.uk/853803/1/GuanLSFSW_ICASSP_2020.pdf · 2020. 2. 20. · promising performance [2, 3]. The training datasets](https://img.pdfslide.net/doc/110x75/5fdfe99211902627c34ff88b/meta-metric-learning-for-highly-imbalanced-aerial-epubs-2020-2-20-promising.jpg)