Embed Size (px)
Citation preview

7/15/2013
1
Budgeting and Forecasting to Meet Your Budgeting and Forecasting to Meet Your Strategic Planning Needs in Home HealthStrategic Planning Needs in Home Health
Christopher AttayaChief Financial OfficerVisiting Nurse Association of Boston
500 Rutherford Avenue, Suite 101Charlestown, MA 02129
[email protected]‐886‐6882 (o)
• Provide essential tools for long term budgeting in home health services
ObjectivesObjectives
• Identify the factors relevant to long term budgeting and the range of variation in those factors
• Explain the budgeted safeguards and contingencies necessary in a Medicare home health program budget and forecast
7/15/2013
2
CLINICAL CENTERS OF EXCELLENCECLINICAL CENTERS OF EXCELLENCECardio Pulmonary RehabDiabetes Management
Key Statistics
• Provided nearly 180,000 visits to 12 000 patients in 2012
VNA of Boston & AffiliatesVNA of Boston & Affiliates
Diabetes ManagementMaternal Child HealthWound Care
PROGRAMSPROGRAMS•Care Calls ‐ Check in calls to patients after discharge•Community Blood Pressure Clinics
12,000 patients in 2012• Payer mix: Medicare 50%,
Medicaid 10%, Commercial 40%• $44 million operating budget • VNA Hospice Care provides end of
life/palliative care, average daily census is 169
• VNA Private Care provides private and Community Resource Specialists•HomeSafe – Reducing re‐hospitalizations•Telehealth Home Monitoring
duty and companion services, average 78,000 hours annually
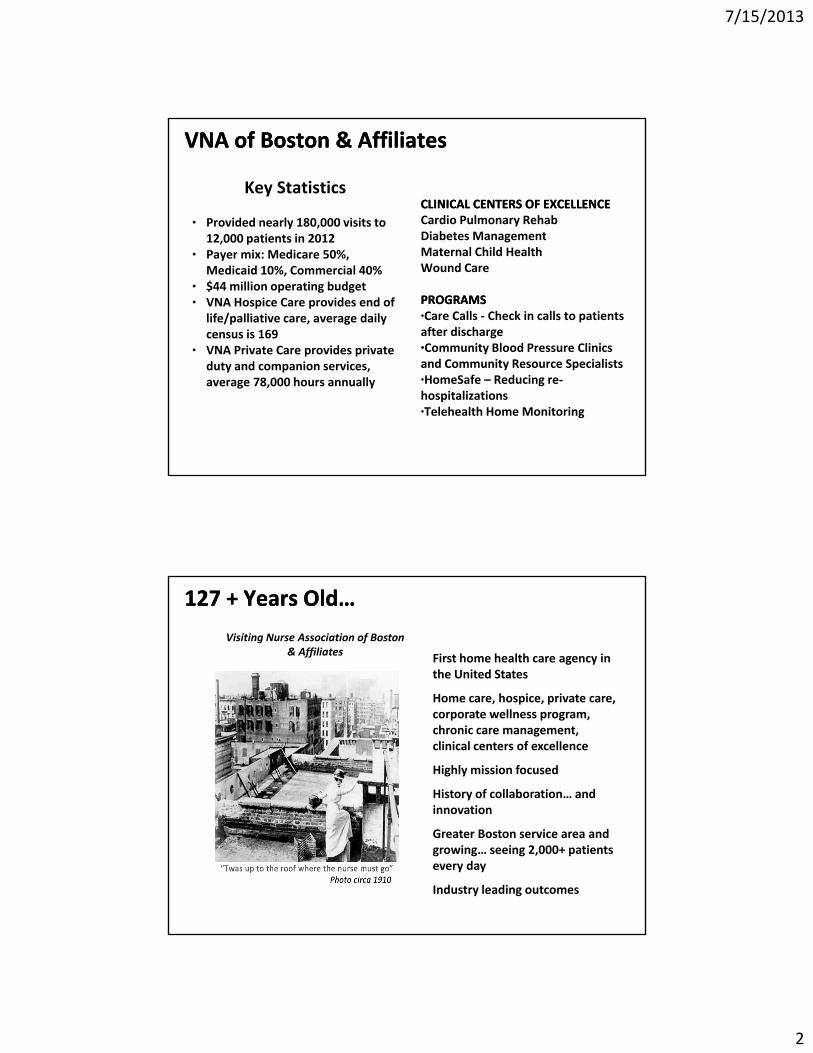
127 + Years Old…127 + Years Old…
First home health care agency in the United States
H h i i t
Visiting Nurse Association of Boston& Affiliates
Home care, hospice, private care, corporate wellness program, chronic care management, clinical centers of excellence
Highly mission focused
History of collaboration… and innovation
Greater Boston service area and growing… seeing 2,000+ patients every day
Industry leading outcomes

7/15/2013
3
• Strategic Planning> Market and Industry outlook (SWOT, Data marts, interviews health care marketplace)
Steps and Process in BudgetingSteps and Process in Budgeting
interviews, health care marketplace)> Development of Strategic Goals and Objectives
• Forecasting> Long term – Multi‐year projections (3, 5?)> Short term – Current year
• BudgetingBudgeting> Operating budget – Annual plan> Capital Budget – Major Purchases with return > 1 year > Cash Flow Budget– Impact of projections on cash
• Setting Strategic Direction> Standing committee of the Board> Best if supported by outside consultant
VNA of Boston Strategic PlanningVNA of Boston Strategic Planning
> Best if supported by outside consultant> Experts used to educate the Board> Mission, Vision and Values are reviewed> Looks at external environments and trends> Creates plan typically across three years> Management provides data and context for internal environments
> In some cases Board provides oversight on process but management prepares plan

7/15/2013
4
• Creates output and recommendation to the full BoardIdentifies the Strengths Weaknesses Opportunities
VNA of Boston Strategic Planning VNA of Boston Strategic Planning (cont.)(cont.)
> Identifies the Strengths, Weaknesses, Opportunities and Threats (SWOT)
> Reports on the Key Strategic GoalsOrganized to be SMART (Specific, Measurable, Achievable, Realistic, Timely) E – Extend capabilities and R ‐ Reward
> Management prepares Strategic Objectives and Initiatives (tactics) to accomplish goalsInitiatives should be laid out by identifying R‐Responsibilities, A – Accountabilities, C – Consults by key managers and I – Informed members of the team (RACI)
• Identify Key Assumptions for the multiyear ForecastsCreate model to help relate single and multi
VNA of Boston ForecastingVNA of Boston Forecasting
• Create model to help relate single and multi‐variable changes
• Global Model was designed for three year view and to update annual forecasts to begin the annual budget planning cycle
• Model is high level ‐ but uses key variables or “drivers” to address key changes in revenues and expenses
• Use High, Medium, Low for risk and likelihood
7/15/2013
5
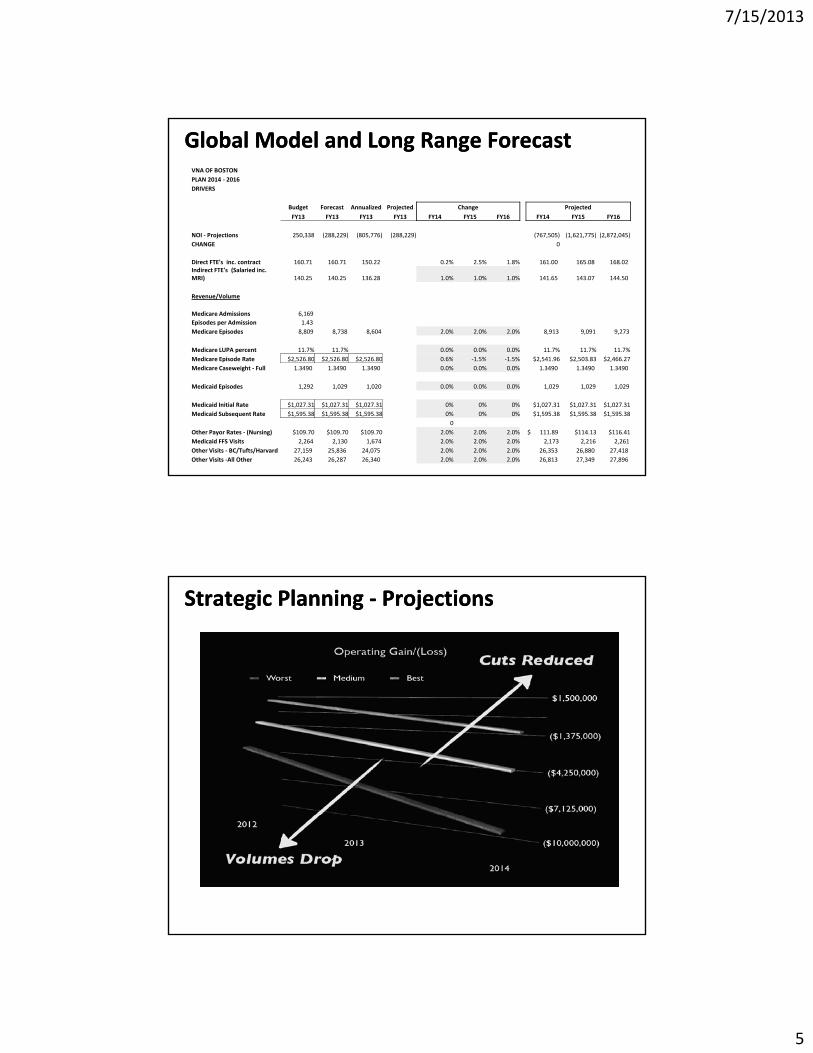
Global Model and Long Range ForecastGlobal Model and Long Range ForecastVNA OF BOSTONPLAN 2014 ‐ 2016DRIVERS
Budget Forecast Annualized Projected Change Projected
FY13 FY13 FY13 FY13 FY14 FY15 FY16 FY14 FY15 FY16
NOI ‐ Projections 250,338 (288,229) (805,776) (288,229) (767,505) (1,621,775) (2,872,045)NOI Projections 250,338 (288,229) (805,776) (288,229) (767,505) (1,621,775) (2,872,045)CHANGE 0
Direct FTE's inc. contract 160.71 160.71 150.22 0.2% 2.5% 1.8% 161.00 165.08 168.02 Indirect FTE's (Salaried inc. MRI) 140.25 140.25 136.28 1.0% 1.0% 1.0% 141.65 143.07 144.50
Revenue/Volume
Medicare Admissions 6,169 Episodes per Admission 1.43 Medicare Episodes 8,809 8,738 8,604 2.0% 2.0% 2.0% 8,913 9,091 9,273
Medicare LUPA percent 11.7% 11.7% 0.0% 0.0% 0.0% 11.7% 11.7% 11.7%di i d $2 26 80 $2 26 80 $2 26 80 0 6% % % $2 96 $2 03 83 $2 66 2Medicare Episode Rate $2,526.80 $2,526.80 $2,526.80 0.6% ‐1.5% ‐1.5% $2,541.96 $2,503.83 $2,466.27
Medicare Caseweight ‐ Full 1.3490 1.3490 1.3490 0.0% 0.0% 0.0% 1.3490 1.3490 1.3490
Medicaid Episodes 1,292 1,029 1,020 0.0% 0.0% 0.0% 1,029 1,029 1,029
Medicaid Initial Rate $1,027.31 $1,027.31 $1,027.31 0% 0% 0% $1,027.31 $1,027.31 $1,027.31 Medicaid Subsequent Rate $1,595.38 $1,595.38 $1,595.38 0% 0% 0% $1,595.38 $1,595.38 $1,595.38
0Other Payor Rates ‐ (Nursing) $109.70 $109.70 $109.70 2.0% 2.0% 2.0% $ 111.89 $114.13 $116.41 Medicaid FFS Visits 2,264 2,130 1,674 2.0% 2.0% 2.0% 2,173 2,216 2,261 Other Visits ‐ BC/Tufts/Harvard 27,159 25,836 24,075 2.0% 2.0% 2.0% 26,353 26,880 27,418 Other Visits ‐All Other 26,243 26,287 26,340 2.0% 2.0% 2.0% 26,813 27,349 27,896
Strategic Planning Strategic Planning ‐‐ ProjectionsProjections

7/15/2013
6
• Management translates into Annual Operating PlansVolume and Revenue Projections
Annual Operating PlanAnnual Operating Plan
> Volume and Revenue ProjectionsMedicare Episodes, Medicaid, Commercial FFS, Capitation, Risk ContractsReferral targets projections
> Expense ProjectionsSalary and BenefitsC t tContractsMedical SuppliesOccupancy costsBad Debt, Interest and Depreciation
• Based on historic trends> Cost versus Benefit of zero based budgeting
• Includes strategic goals and objectives
Annual Operating Plan Annual Operating Plan (cont.)(cont.)
• Includes strategic goals and objectives> New programs; Key investments
• Begin with fact – build in strong annual forecast> The better the forecast, the better the budget
• Create model to make changes to assumptions or key variables from Forecastor key variables from Forecast> Build model so “material” revenues and expenses can be modeled

7/15/2013
7
Financial Management Conference & ExpositionWashington, DC
Budgeting and Forecasting to g g gMeet Your Strategic Planning Needs in Home Health
Paul GilesDirector of Home Health Finance Dignity Health
July 30 2013July 30, 2013
• Not For Profit Health Care system
• Mission:
Dignity Health Home Health Agencies
– Delivering compassionate, high‐quality, affordable health services;
– Serving and advocating for our sisters and brothers who are poor and disenfranchised; and
– Partnering with others in the community to improve the quality of life
• 40 hospitals, 32 foundations, 150 urgent care /ambulatory/etc.
14
• 17 Home Health; 7 Hospices, 1 facility w/for‐profit JV
• 5th largest hospital provider in nation
• $1.3B in charity & unsponsored care last year

7/15/2013
8
• Different reimbursement models– Fees for direct services
Projecting Revenue for Budgeting
– Episodic– Cap lives – “insurance premiums”
• Suggested approach–Use standardized charges associated with the services you provide for Gross Revenue
15
–Net Revenue to be the expected amount you will receive in cash–Difference between these will be “Revenue or Contractual Allowances”
• For fee for service, use visits, supplies and net rates by discipline by payor grouping to determine net
Projecting Revenue for Budgeting
revenue
• Determine all services where you would have a unique rate of charge or reimbursement
• Recommend setting charges at or above 10% of the fully allocated budgeted cost of the service
16
y g
• Different accounting treatments for bad debts, typically an expense, need to consider

7/15/2013
9
• Traditional Medicare– Paid by 60‐day episodes
Projecting Revenue for Budgeting
– Complex
–Multiple types of adjustments
– Annually updated by CMS
– Changes often unpredictable
17
– Difficult to understand affects of variables
– Recommend use of revenue template for predicting Medicare revenue
• Can be simple or complex depending upon level of accuracy desired
Medicare Revenue Template
• Provides ability for “what if” scenarios
• Excellent for making management decisions for improvements, KPIs, Key Performance Indicators
• What would you need to beginA hi t i l d t
18
– Agency historical data: use averages
– Start with current Medicare variables
– Adjust with your estimated changes
7/15/2013
10
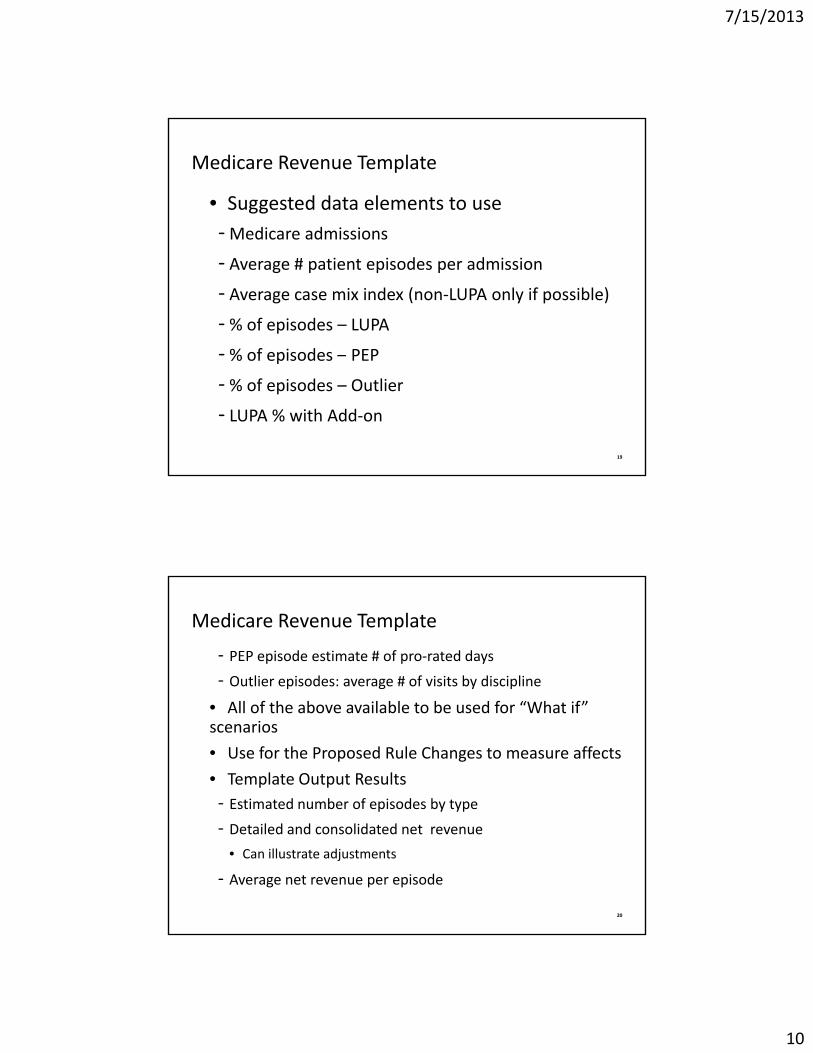
• Suggested data elements to use–Medicare admissions
Medicare Revenue Template
Medicare admissions
–Average # patient episodes per admission
–Average case mix index (non‐LUPA only if possible)
–% of episodes – LUPA
–% of episodes – PEP
19
% of episodes PEP
–% of episodes – Outlier
–LUPA % with Add‐on
– PEP episode estimate # of pro‐rated days
– Outlier episodes: average # of visits by discipline
Medicare Revenue Template
• All of the above available to be used for “What if” scenarios
• Use for the Proposed Rule Changes to measure affects
• Template Output Results– Estimated number of episodes by type
20
– Detailed and consolidated net revenue
• Can illustrate adjustments
– Average net revenue per episode

7/15/2013
11
• Inputs
• Results
Demo of Medicare Net Revenue Budget Tool
21
• Simple template for computing field staff labor cost with productivity and rate variables
Field Staff Labor Template Budgeting Tool
• Needs for entering
– Hourly rates, use overall averages for each category
– Productivity factors for visit types
– Average number of visits per 8‐hour working day
– Define visit types
22
– Productive hours not part of visit production
– Optionally add benefit cost percentage
• Output results: average labor cost per visit by visit type
7/15/2013
12
• Input
• Results
Demo of Field Staff Labor Template
23
• Recommended for management decision making
Budget Margin Analysis by Major Payor Group
decision making
• Analysis provides high level review of projected margins by major payor groups
• “What If” scenarios provides the i di t bilit t b ff t f
24
immediate ability to observe affects of changes

7/15/2013
13
• Elements to detail
• Admissions
Budget Margin Analysis Tool
• Visits
• Gross Revenue, Allowances and Net Revenue
• Direct Expenses or Expenses allocated by service line
• Salaries, Benefits, Contract labor, Other Direct
25
• Indirect Expenses
• Margin
Medicare FFS
Medicare Managed
Care Episodic
Medicare Managed Care (non
Cap)Medicaid
FFS
Medicaid Managed Care (non
Cap)Admissions: 2,004 359 12 1,446 981Visits 34,389 5,337 176 1,689 4,256
Sample Budget Margin Analysis Tool
Gross Revenue $10,867,158 $1,667,510 $57,196 $613,037 $1,472,796
Allow & Adjmts 2,720,898 523,205 24,955 452,834 1,094,323Net Revenue $8,146,260 $1,144,305 $32,241 $160,203 $378,473
Cost of Services
RN $4,416,573 $665,108 $27,455 $405,644 $824,397
PT 1,750,650 246,626 5,735 3,971 97,062
ST 73,846 8,593 1,133 1,889 6,233
OT 351,407 53,132 2,462 23,386
MSW 116,284 18,175 337 9,592
26
HHA 130,583 46,423 181 2,353
Nutr
Other
Total $6,839,343 $1,038,057 $37,122 $411,685 $963,023
131,403 26,655 520 9,265
TOTAL EXP $6,970,746 $1,064,712 $37,122 $412,205 $972,288
MARGIN $1,175,514 $79,593 ($4,881) ($252,002) ($593,815)Margin % 14.43% 6.96% (15.14)% (157.30)% (156.90)%
Medical Supplies
7/15/2013
14
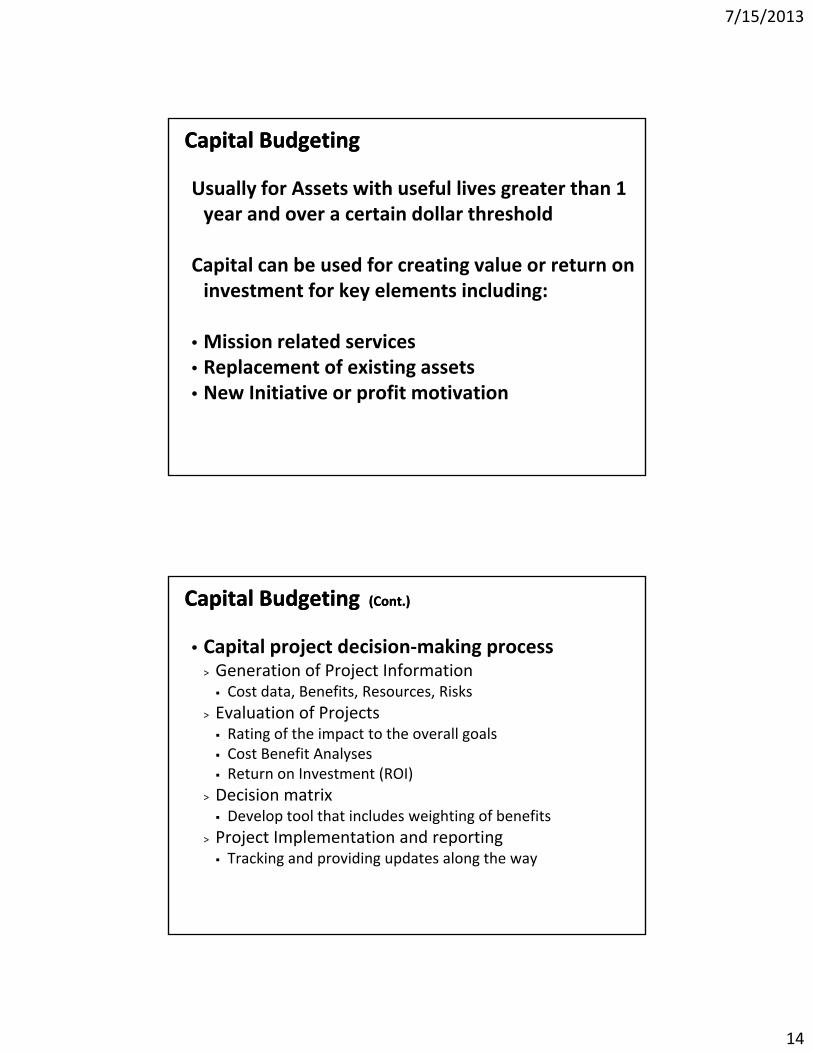
Usually for Assets with useful lives greater than 1 year and over a certain dollar threshold
Capital BudgetingCapital Budgeting
Capital can be used for creating value or return on investment for key elements including:
• Mission related services• Replacement of existing assets• New Initiative or profit motivation
• Capital project decision‐making process> Generation of Project Information
Cost data, Benefits, Resources, Risks
Capital Budgeting Capital Budgeting (Cont.)(Cont.)
Cost data, Benefits, Resources, Risks> Evaluation of Projects
Rating of the impact to the overall goalsCost Benefit AnalysesReturn on Investment (ROI)
> Decision matrixDevelop tool that includes weighting of benefitsDevelop tool that includes weighting of benefits
> Project Implementation and reportingTracking and providing updates along the way

7/15/2013
15
• Operating and Capital Budgets – Completed but need to determine the impacts on CashCash is generated from sources
Cash Flow Cash Flow ‐‐ BudgetingBudgeting
• Cash is generated from sources> Operations> Fundraising> Debt> Cash/Investments
• Usually look at Operating Budget and add back• Usually look at Operating Budget and add back non‐cash items (depreciation)
• Changes in Current assets and liabilities should be included
• Need to look at revenue and expense streams when starting a new program – impacts cash during growth mode
Cash Flow Cash Flow ‐‐ Budgeting Budgeting (cont.)(cont.)
during growth mode• Revenues – Look at payment histories • Expenses – Payroll weekly/bi‐weekly and other expenses based on commitments and A/P runs
• Based on Uses – Determine the level of Sources for Funding Operations and Capital
• Lines of Credit can cover gaps and contingencies• Regular monitoring of Cash is important
7/15/2013
16
• Provided structure for current and long term budgeting in home health services
Wrap Wrap ‐‐ UpUp
• Identified tools and the key variables including Medicare revenue and salary expenses in preparing forecasts and annual budgets
• Identified margin analysis and capital budget analysis
• QUESTIONS?