Embed Size (px)
Citation preview
1
1
Lecture 13, 07 Oct. 2008Small Population Probs
Conservation BiologyECOL 406R/506R
University of ArizonaFall 2008
Bonine & Epps
Lab Friday-Sunday 17-19 October (leave 1230 Friday [west side BSE], return 1830h on Sunday)Hat, water bottle, food [plate, cup, utensils?], snacks, $?, sunscreen, close-toed shoes, layers, pants, binos, (cooler?, jug), ID/VISA- Readings on Course Website
506 meet at 1505h today
Upcoming ReadingsThurs 09 October (Con Gen): Edwards et al. 2004; HOGL, Conservation Projects website; read for big picture: DeSalle & Amato 2004Tues 14 October (~PVA): Primack CH6; Marmontel et al. 1997; optional: Gilpin 1996
-506 Thurs
Primack Ch5&6, Panther PVA (skim)
NO LAB 31 OCTOBER
THANK YOUs
2
406/506 Exam 1 fall2008mean = 74.9%max = 98.7%min = 42.7%
00.5
11.5
22.5
33.5
30 36 42 48 54 60 66 72 78 84 90 96More
N = 30
2
3
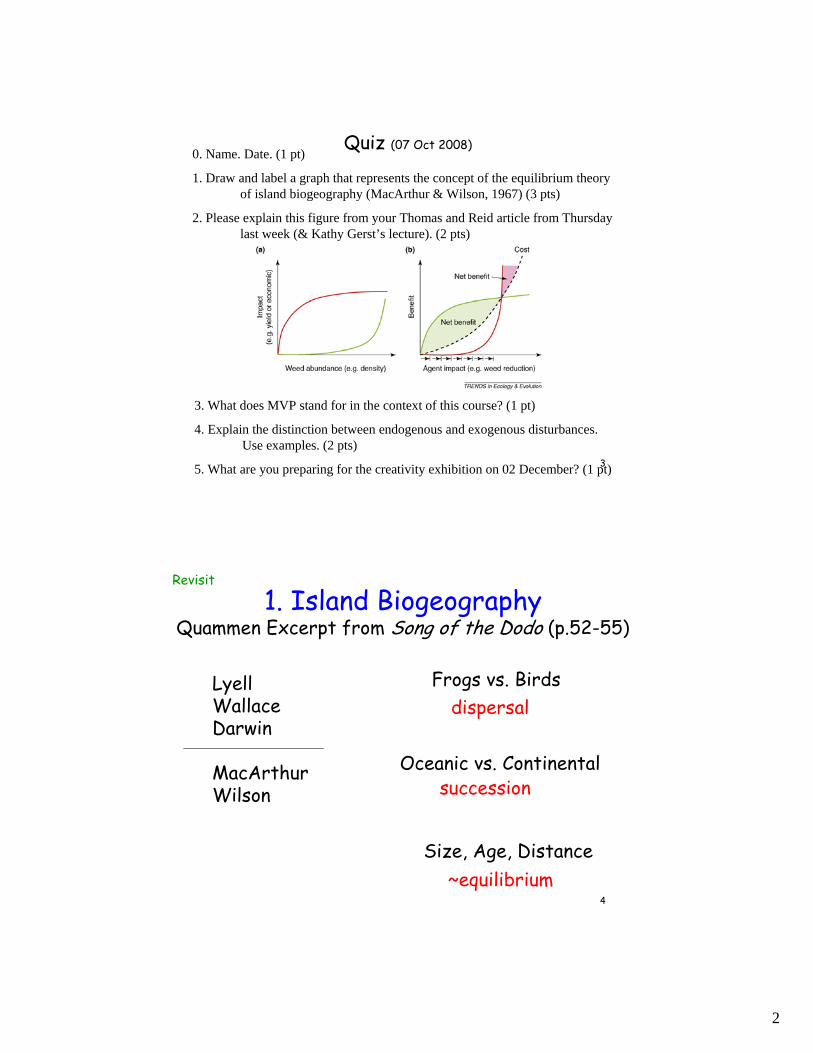
Quiz (07 Oct 2008)
1. Draw and label a graph that represents the concept of the equilibrium theory of island biogeography (MacArthur & Wilson, 1967) (3 pts)
2. Please explain this figure from your Thomas and Reid article from Thursday last week (& Kathy Gerst’s lecture). (2 pts)
3. What does MVP stand for in the context of this course? (1 pt)
5. What are you preparing for the creativity exhibition on 02 December? (1 pt)
4. Explain the distinction between endogenous and exogenous disturbances. Use examples. (2 pts)
0. Name. Date. (1 pt)
4
1. Island BiogeographyQuammen Excerpt from Song of the Dodo (p.52-55)
LyellWallaceDarwin
MacArthurWilson
Frogs vs. Birds
Oceanic vs. Continental
Size, Age, Distance
dispersal
succession
~equilibrium
Revisit
3
5
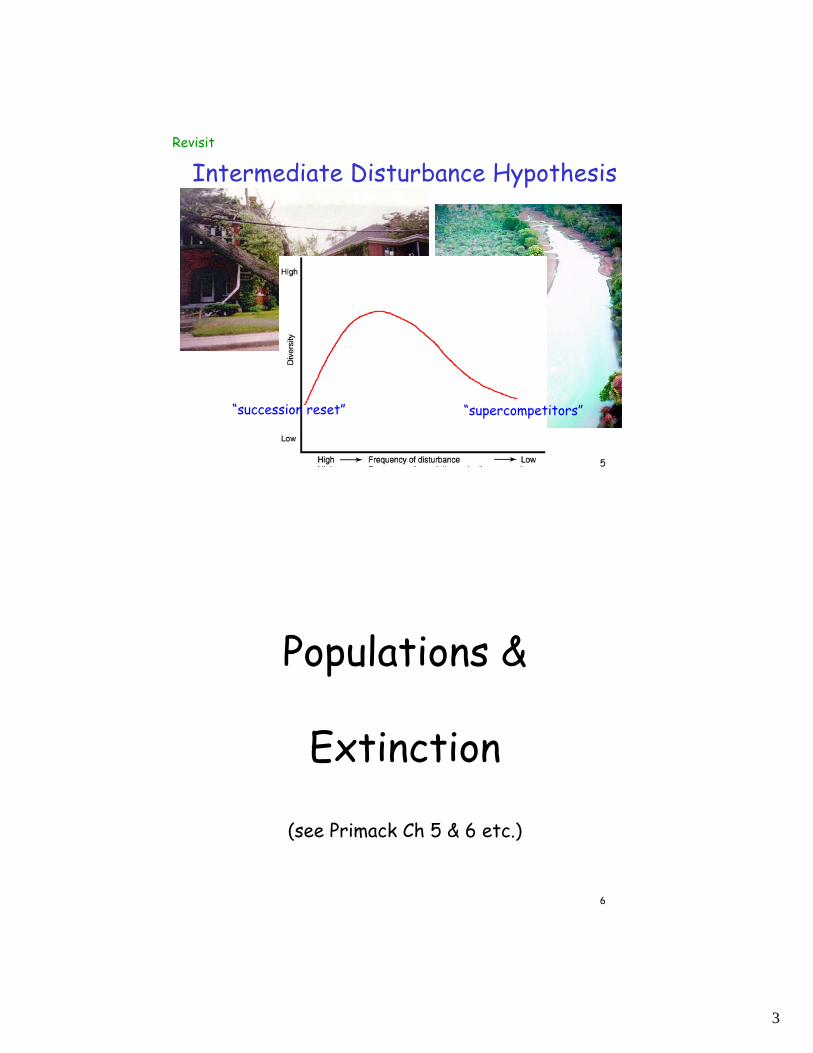
Intermediate Disturbance Hypothesis
“supercompetitors”“succession reset”
Revisit
6
Populations &
Extinction
(see Primack Ch 5 & 6 etc.)
4
7
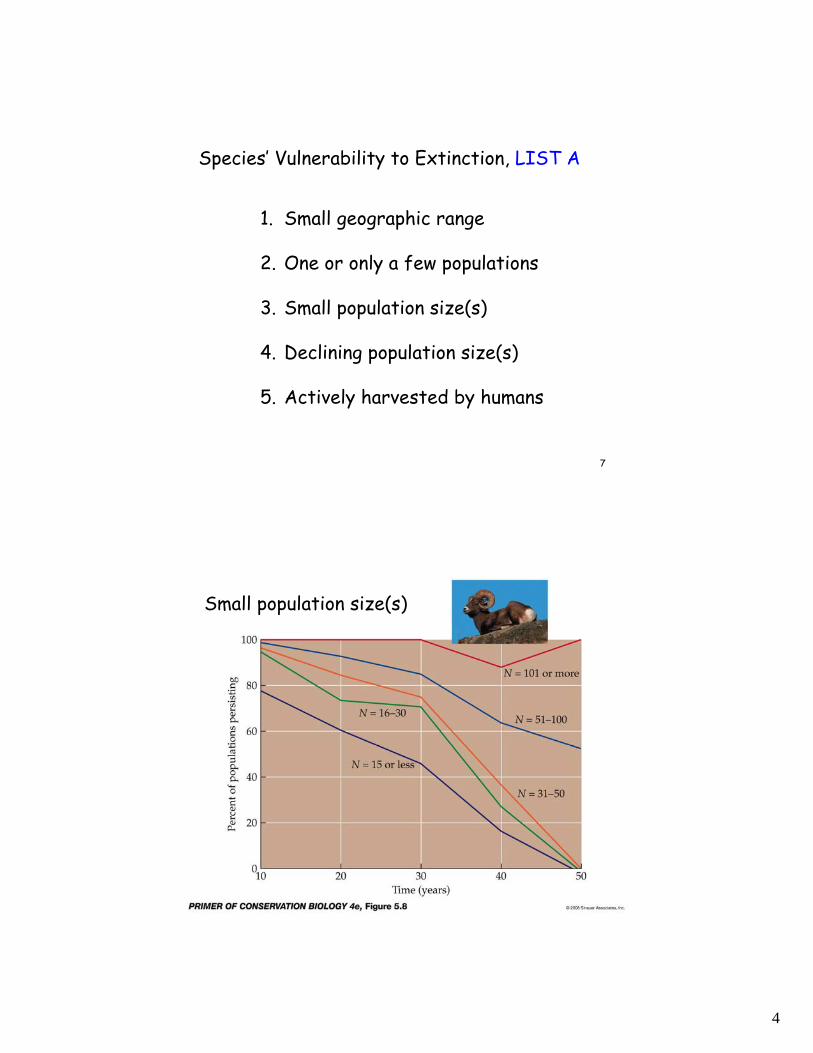
Species’ Vulnerability to Extinction, LIST A
1. Small geographic range
2. One or only a few populations
3. Small population size(s)
4. Declining population size(s)
5. Actively harvested by humans
8
Small population size(s)
5
9
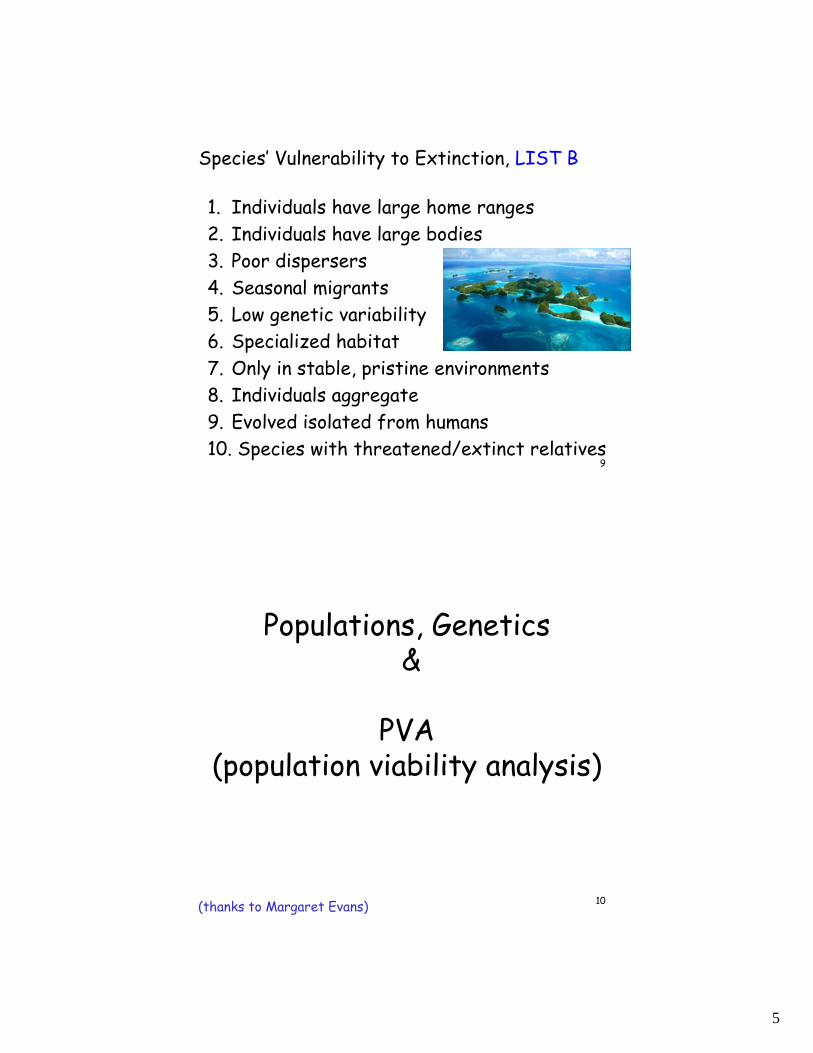
Species’ Vulnerability to Extinction, LIST B
1. Individuals have large home ranges2. Individuals have large bodies3. Poor dispersers4. Seasonal migrants5. Low genetic variability6. Specialized habitat7. Only in stable, pristine environments8. Individuals aggregate9. Evolved isolated from humans10. Species with threatened/extinct relatives
10
Populations, Genetics&
PVA (population viability analysis)
(thanks to Margaret Evans)
6
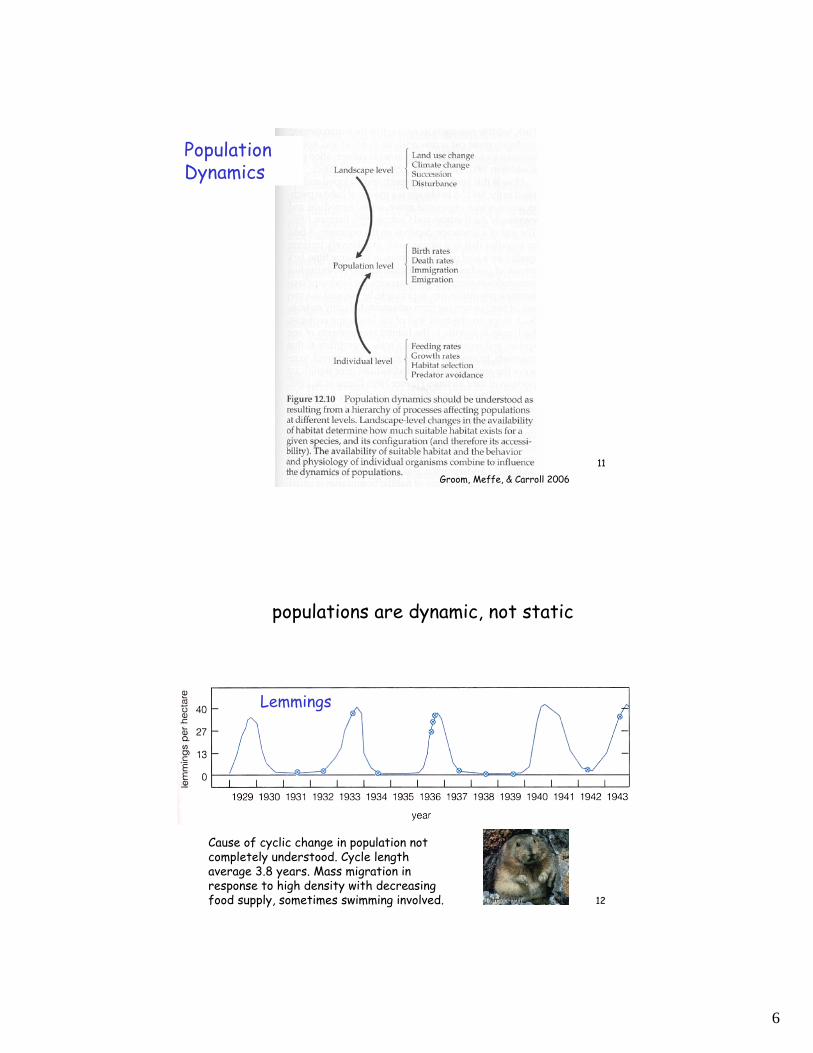
11Groom, Meffe, & Carroll 2006
Population Dynamics
12
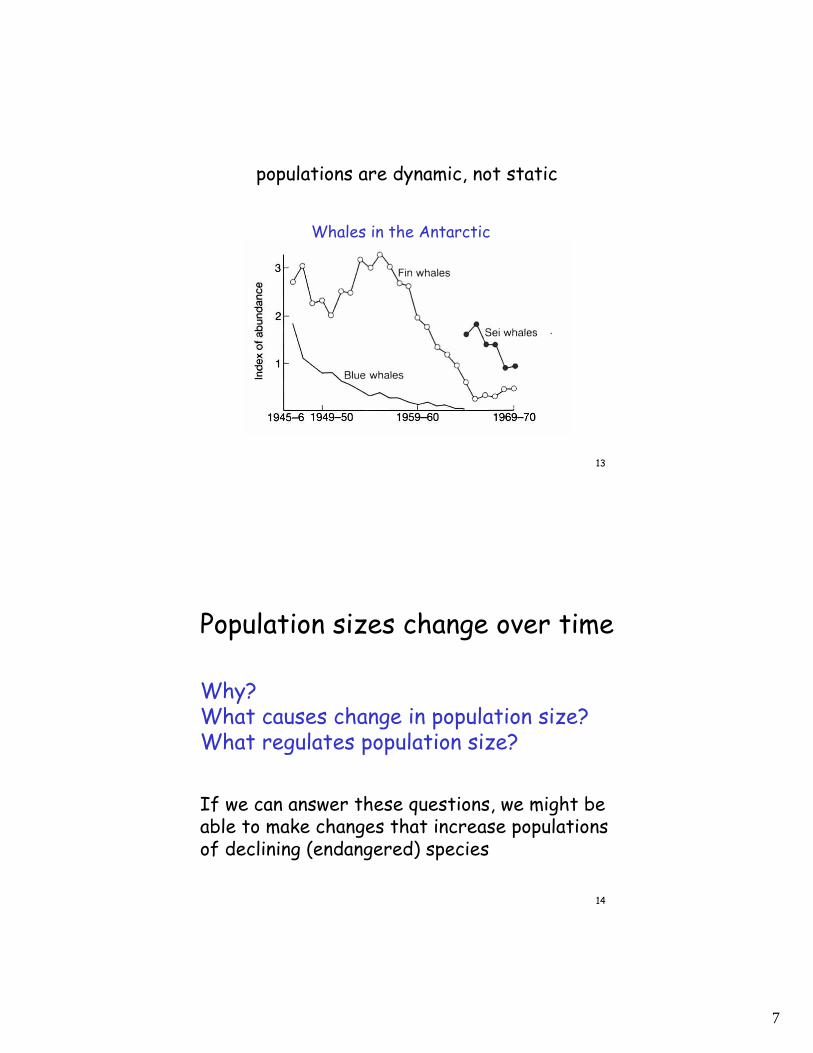
populations are dynamic, not static
Lemmings
Cause of cyclic change in population not completely understood. Cycle length average 3.8 years. Mass migration in response to high density with decreasing food supply, sometimes swimming involved.
7
13
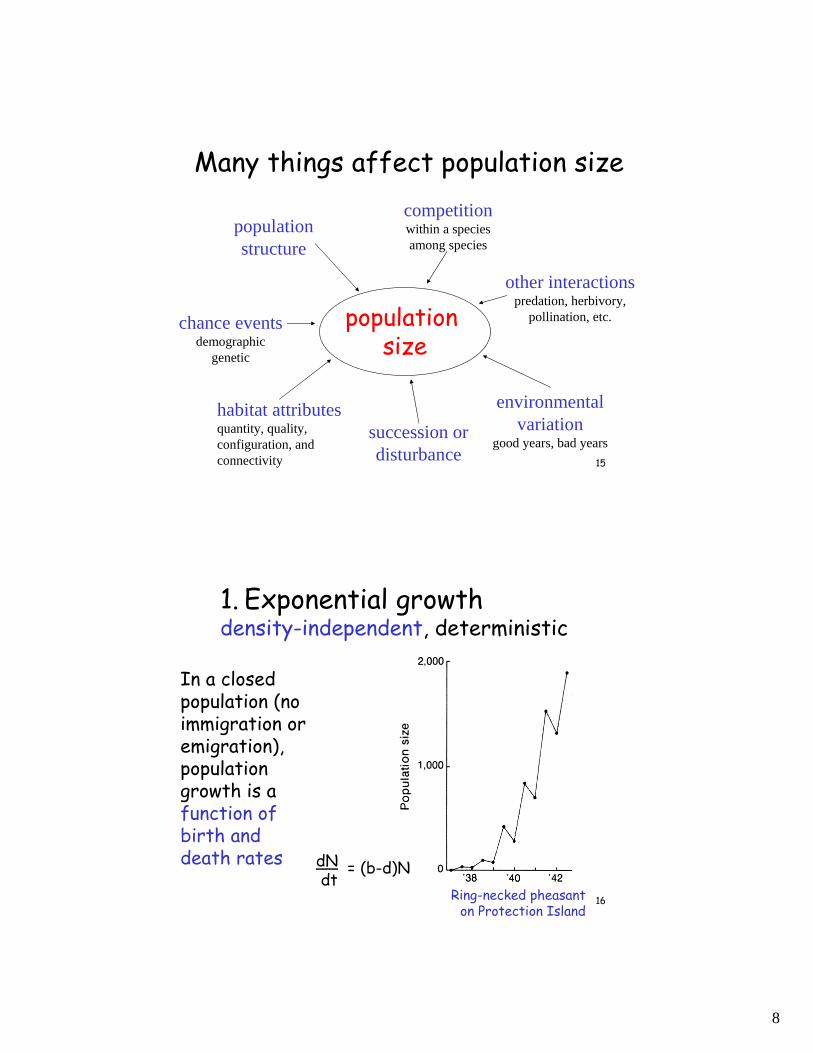
populations are dynamic, not static
Whales in the Antarctic
14
Population sizes change over time
Why?What causes change in population size?What regulates population size?
If we can answer these questions, we might be able to make changes that increase populationsof declining (endangered) species
8
15
Many things affect population size
population size
competitionwithin a speciesamong species
other interactionspredation, herbivory,
pollination, etc.
population structure
environmental variation
good years, bad yearssuccession or disturbance
habitat attributesquantity, quality, configuration, and connectivity
chance eventsdemographic
genetic
16
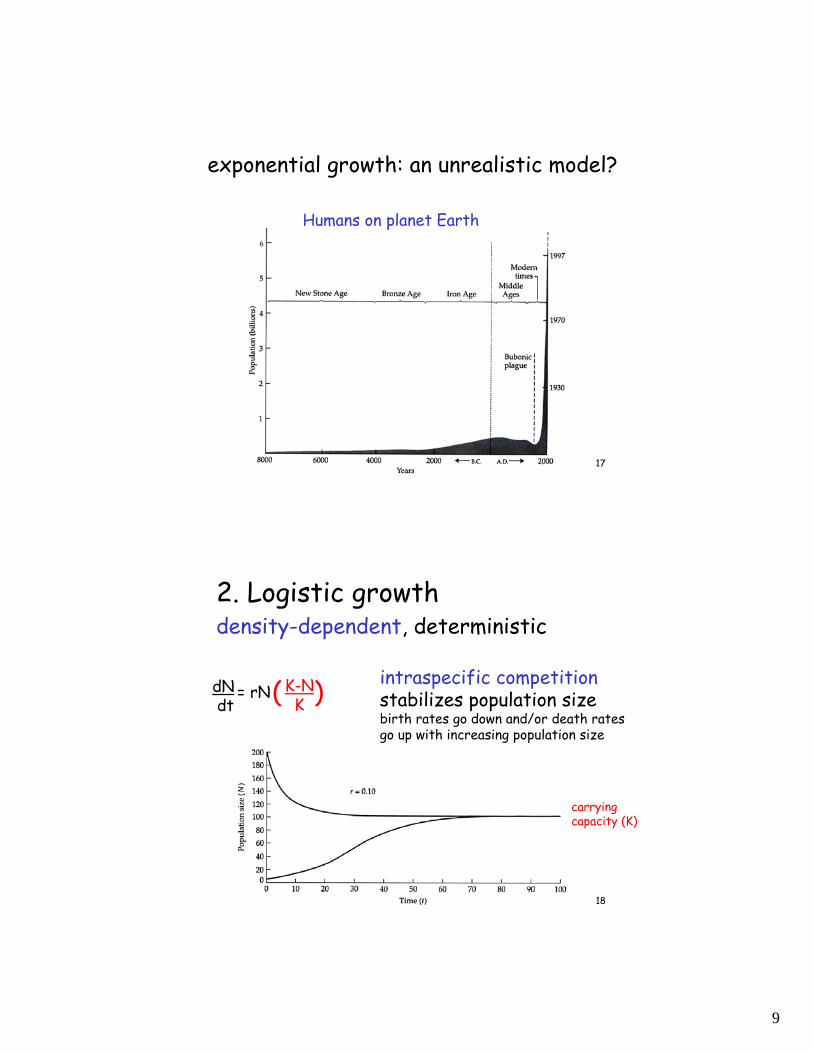
1. Exponential growthdensity-independent, deterministic
In a closed population (no immigration or emigration),population growth is a function of birth and death rates dN
dtRing-necked pheasant
on Protection Island
= (b-d)N
9
17
exponential growth: an unrealistic model?
Humans on planet Earth
18
dNdt
= rN K-NK( ) intraspecific competition
stabilizes population sizebirth rates go down and/or death rates go up with increasing population size
2. Logistic growth density-dependent, deterministic
carryingcapacity (K)
10
19
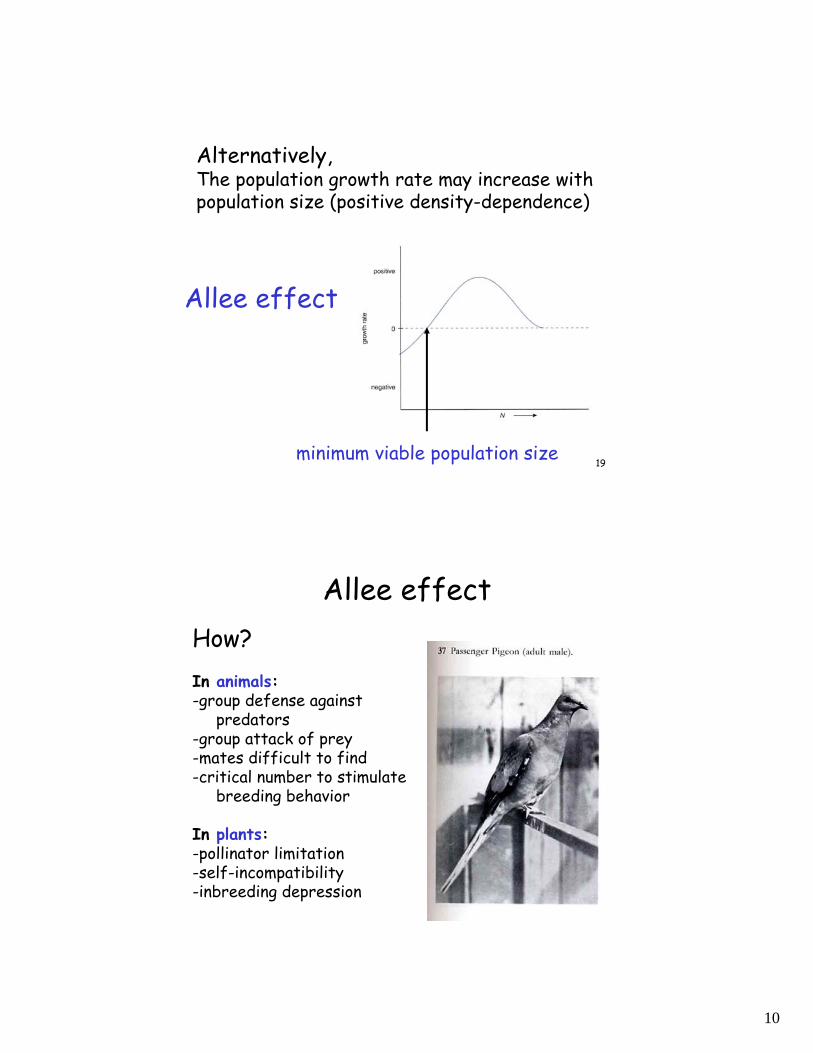
Allee effect
Alternatively,The population growth rate may increase with population size (positive density-dependence)
minimum viable population size
20
Allee effectHow?In animals:-group defense against
predators-group attack of prey-mates difficult to find-critical number to stimulate
breeding behavior
In plants:-pollinator limitation-self-incompatibility-inbreeding depression
11
21
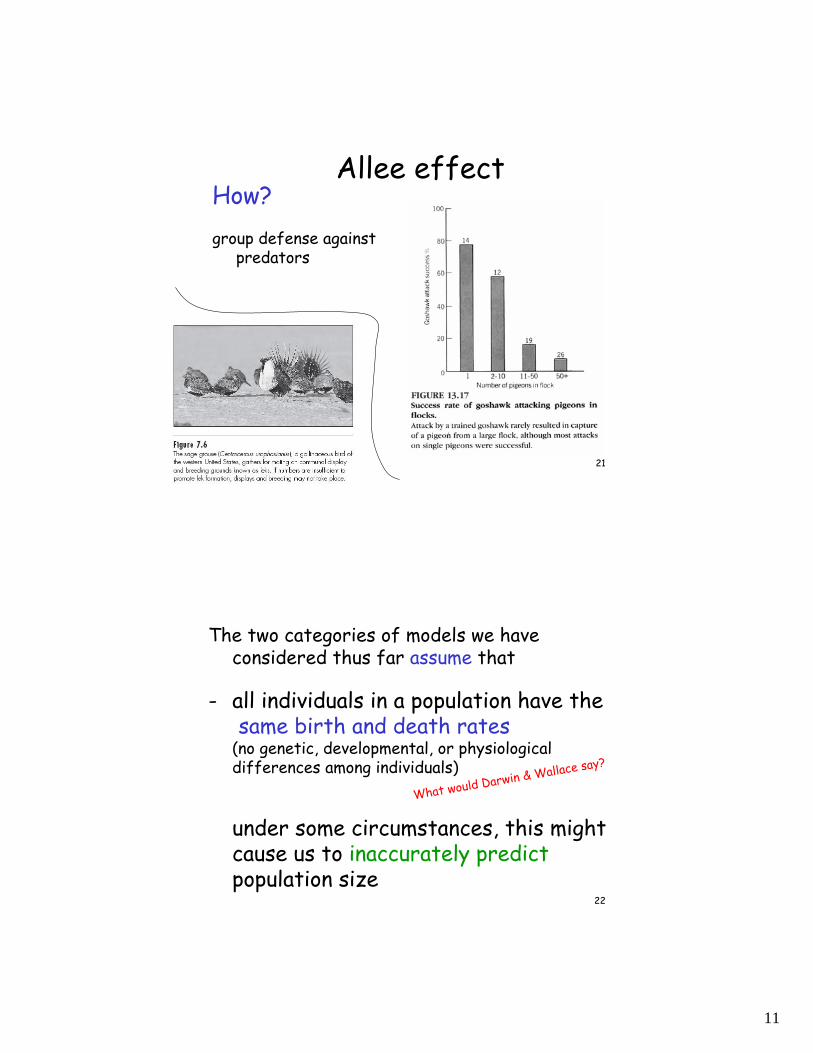
Allee effectHow?group defense against
predators
22
The two categories of models we have considered thus far assume that
- all individuals in a population have thesame birth and death rates
(no genetic, developmental, or physiological differences among individuals)
under some circumstances, this might cause us to inaccurately predictpopulation size
What would Darwin & Wallace say?
12
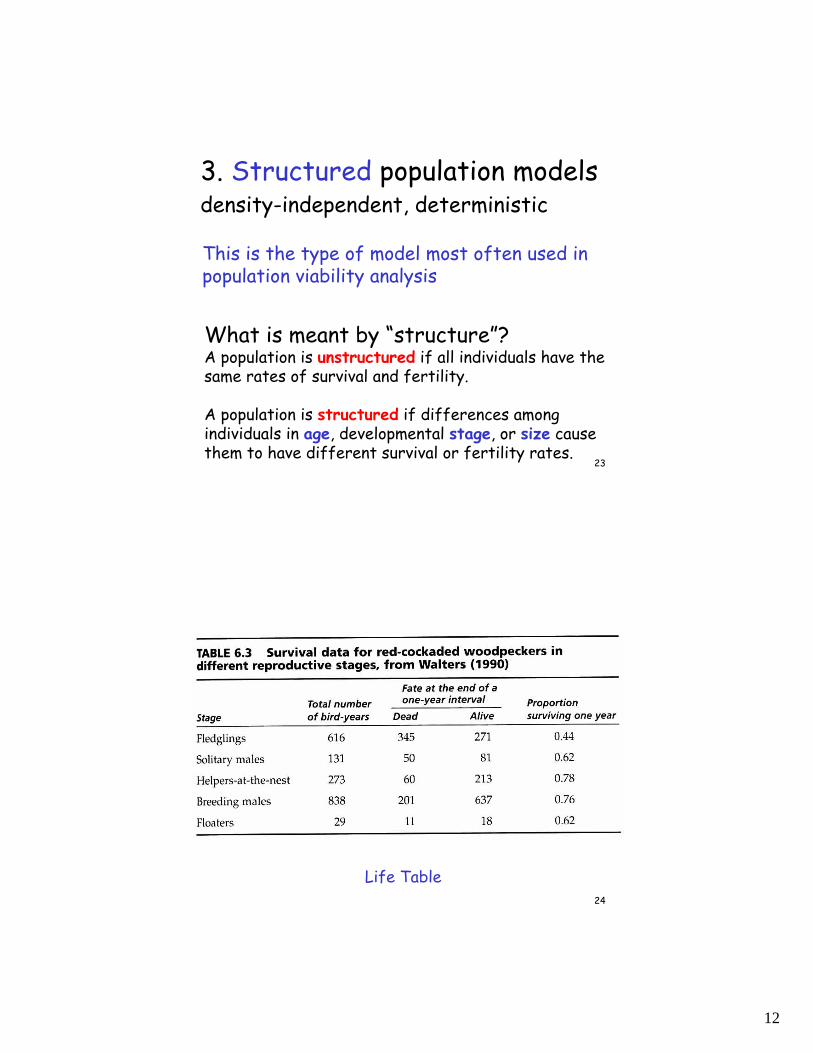
23
This is the type of model most often used in population viability analysis
What is meant by “structure”?A population is unstructured if all individuals have the same rates of survival and fertility.
A population is structured if differences among individuals in age, developmental stage, or size cause them to have different survival or fertility rates.
3. Structured population modelsdensity-independent, deterministic
24
Life Table
13
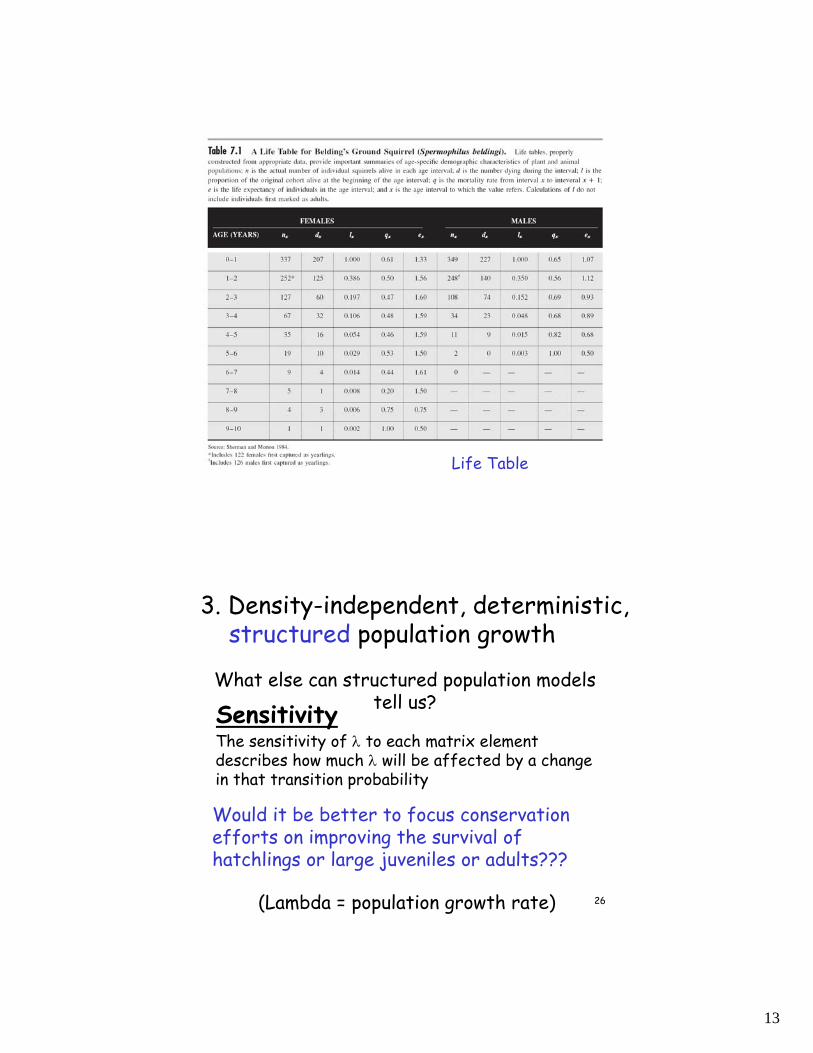
25Life Table
26
3. Density-independent, deterministic, structured population growth
What else can structured population models tell us?Sensitivity
The sensitivity of λ to each matrix element describes how much λ will be affected by a change in that transition probability
Would it be better to focus conservation efforts on improving the survival of hatchlings or large juveniles or adults???
(Lambda = population growth rate)
14
27
When lambda is greater than 1 the population increases in size
When lambda is less than 1 the population decreases in size
28
Van Dyke p. 178
“Four Horsemen of the Extinction Apocalypse:”
1. Genetic Stochasticity
2. Environmental Stochasticity
3. Demographic Stochasticity
4. Natural Catastrophes
15
29
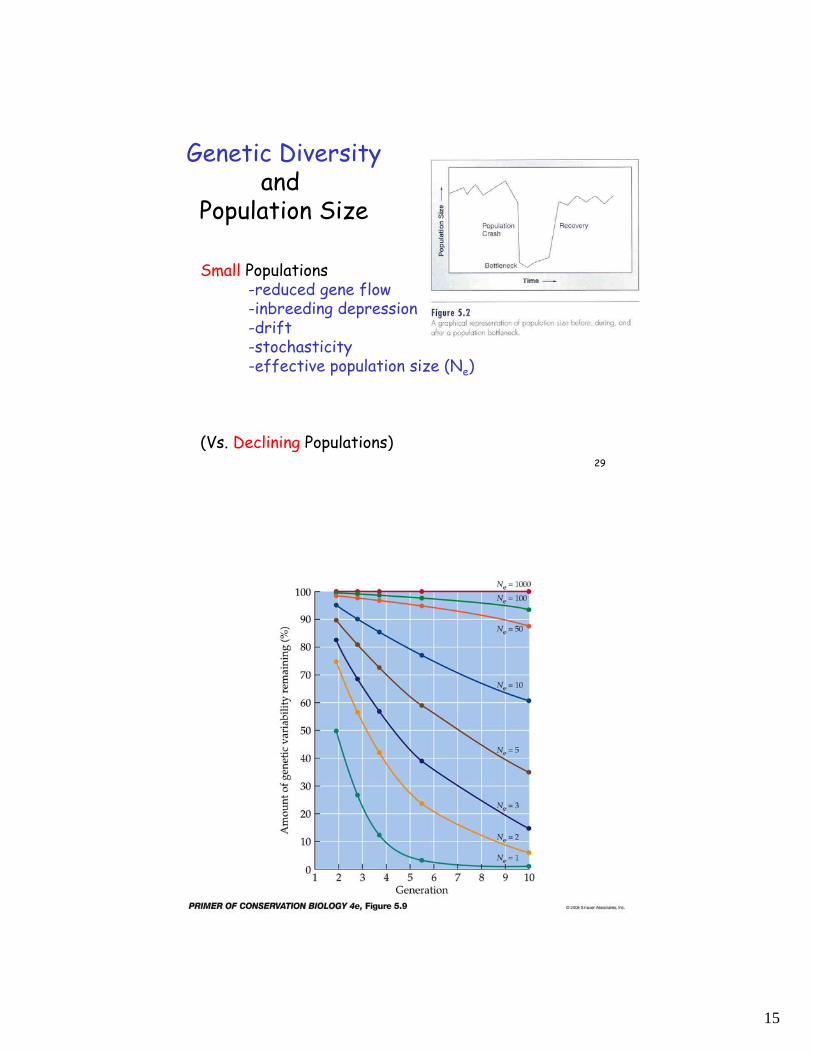
Small Populations-reduced gene flow-inbreeding depression-drift-stochasticity-effective population size (Ne)
(Vs. Declining Populations)
Genetic Diversityand
Population Size
30
16
31
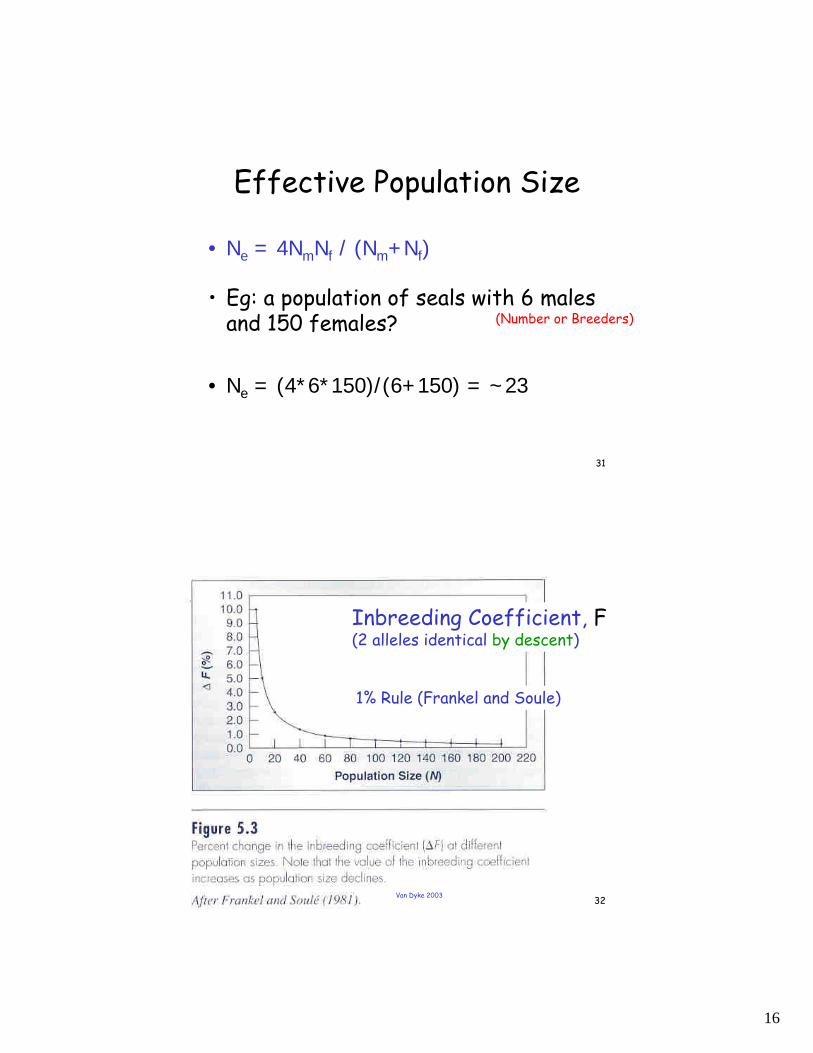
Effective Population Size
• Ne = 4NmNf / (Nm+Nf)
• Eg: a population of seals with 6 males and 150 females?
• Ne = (4*6*150)/(6+150) = ~23
(Number or Breeders)
32
xx
Van Dyke 2003
Inbreeding Coefficient, F(2 alleles identical by descent)
1% Rule (Frankel and Soule)
17
33
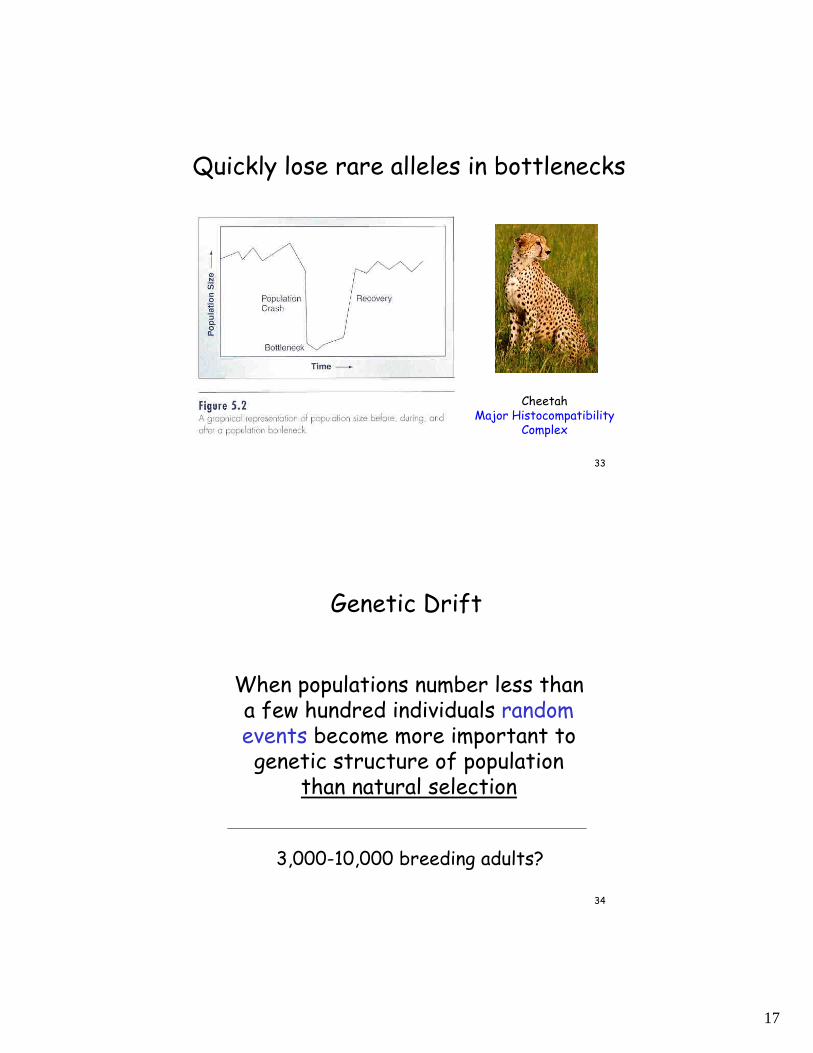
Quickly lose rare alleles in bottlenecks
Cheetah Major Histocompatibility
Complex
34
Genetic Drift
When populations number less than a few hundred individuals random events become more important to genetic structure of population
than natural selection
3,000-10,000 breeding adults?
18
35
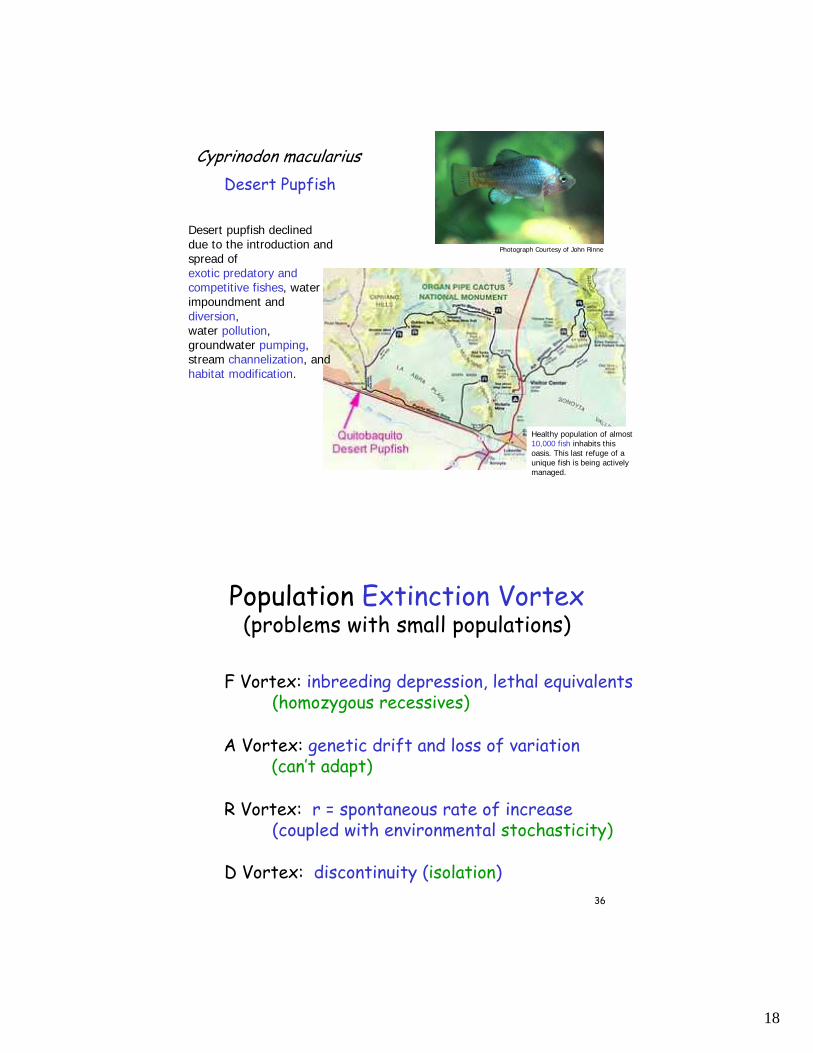
Cyprinodon maculariusDesert Pupfish
Photograph Courtesy of John Rinne
Desert pupfish declined due to the introduction and spread of exotic predatory and competitive fishes, water impoundment and diversion, water pollution, groundwater pumping, stream channelization, and habitat modification.
Healthy population of almost 10,000 fish inhabits this oasis. This last refuge of a unique fish is being actively managed.
36
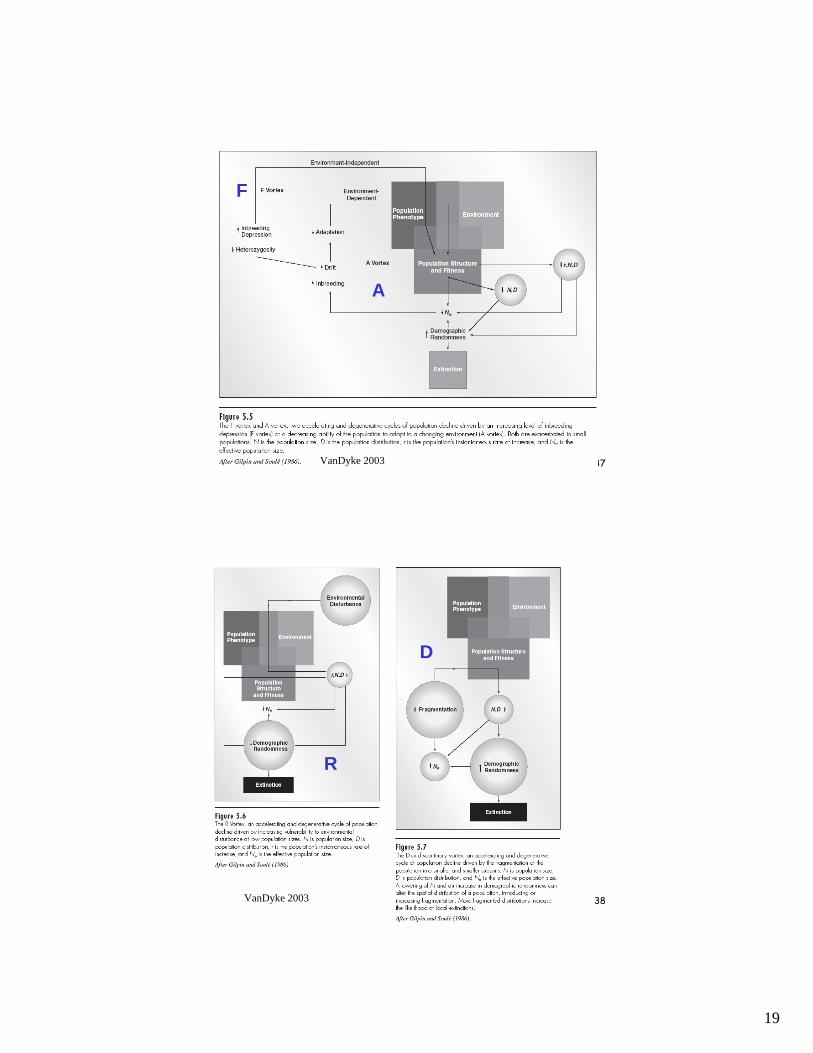
Population Extinction Vortex(problems with small populations)
F Vortex: inbreeding depression, lethal equivalents(homozygous recessives)
A Vortex: genetic drift and loss of variation(can’t adapt)
R Vortex: r = spontaneous rate of increase(coupled with environmental stochasticity)
D Vortex: discontinuity (isolation)
19
37VanDyke 2003
F
A
38VanDyke 2003
R
D
20
39
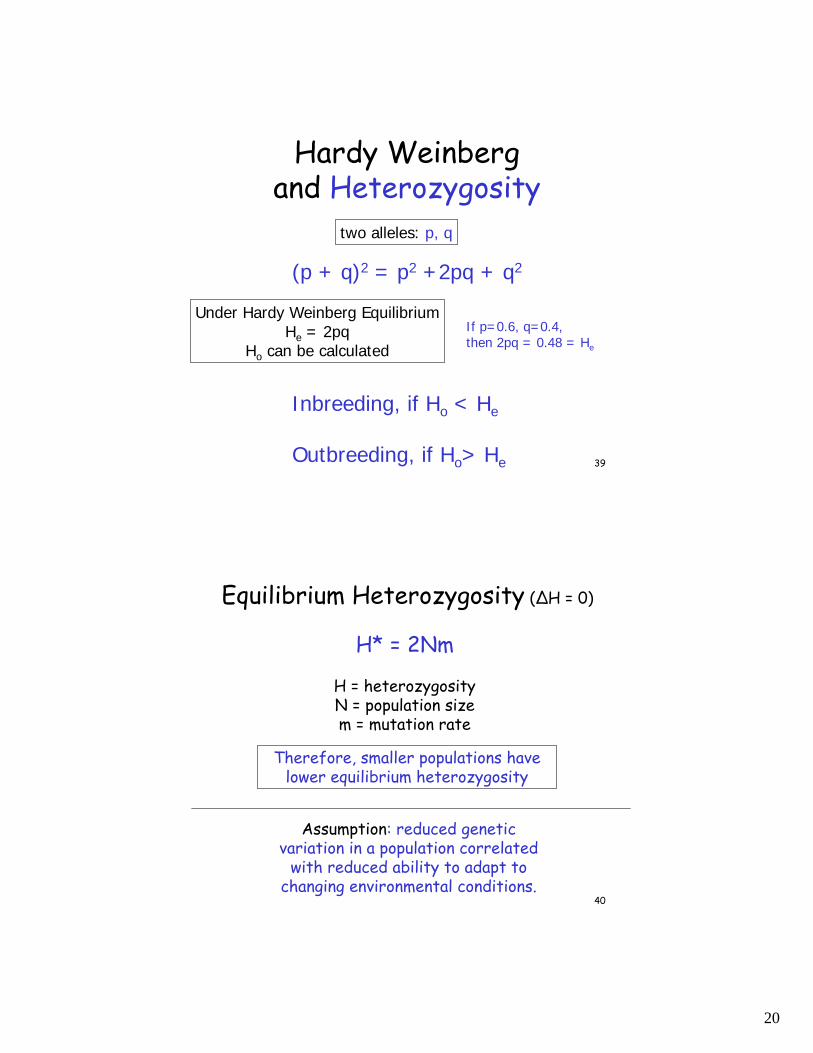
Hardy Weinbergand Heterozygosity
two alleles: p, q
(p + q)2 = p2 +2pq + q2
Under Hardy Weinberg EquilibriumHe = 2pq
Ho can be calculated
If p=0.6, q=0.4, then 2pq = 0.48 = He
Inbreeding, if Ho < He
Outbreeding, if Ho> He
40
Equilibrium Heterozygosity (∆H = 0)
H* = 2Nm
H = heterozygosityN = population sizem = mutation rate
Therefore, smaller populations have lower equilibrium heterozygosity
Assumption: reduced genetic variation in a population correlated
with reduced ability to adapt to changing environmental conditions.
21
41
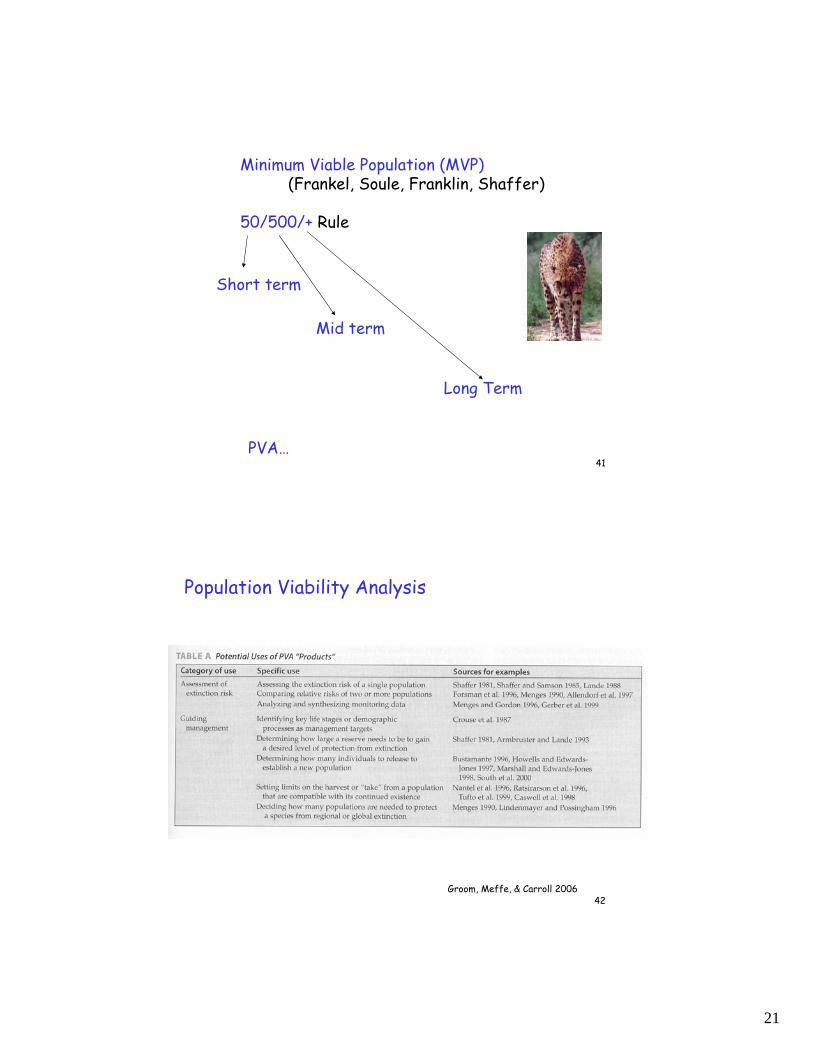
Minimum Viable Population (MVP)(Frankel, Soule, Franklin, Shaffer)
50/500/+ Rule
Short term
Mid term
Long Term
PVA…
42Groom, Meffe, & Carroll 2006
Population Viability Analysis
22
43
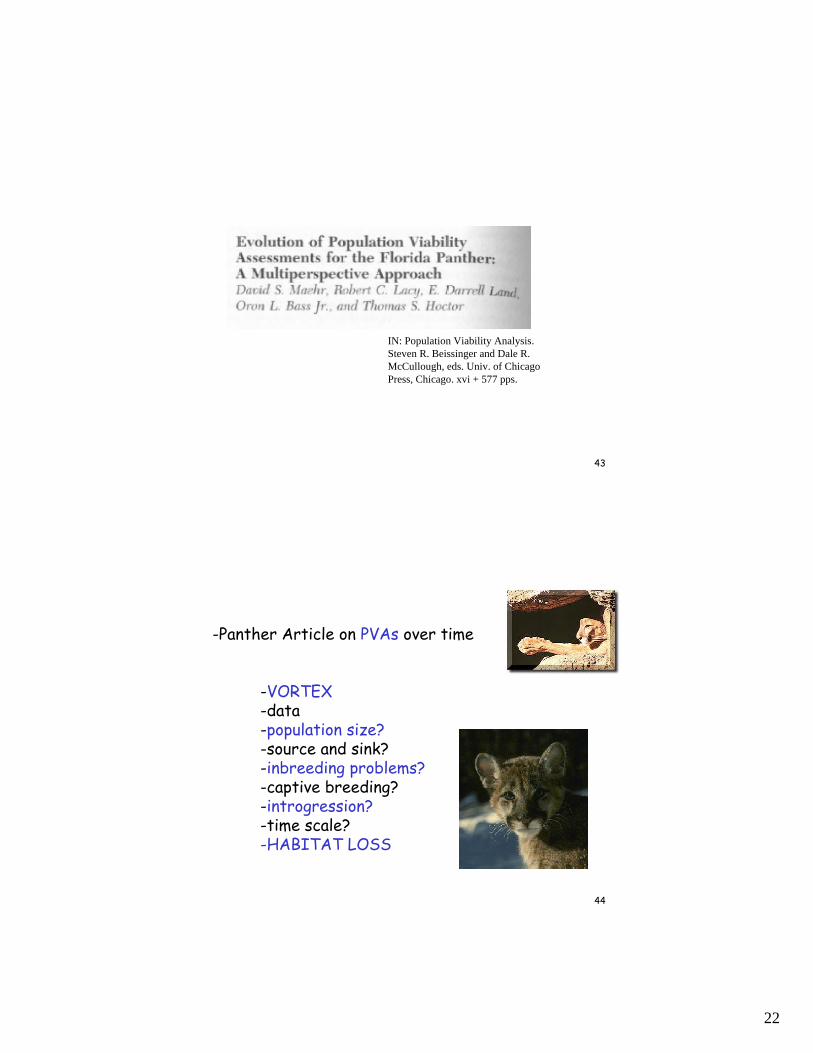
IN: Population Viability Analysis. Steven R. Beissinger and Dale R. McCullough, eds. Univ. of Chicago Press, Chicago. xvi + 577 pps.
44
-Panther Article on PVAs over time
-VORTEX-data-population size?-source and sink?-inbreeding problems?-captive breeding?-introgression?-time scale?-HABITAT LOSS
23
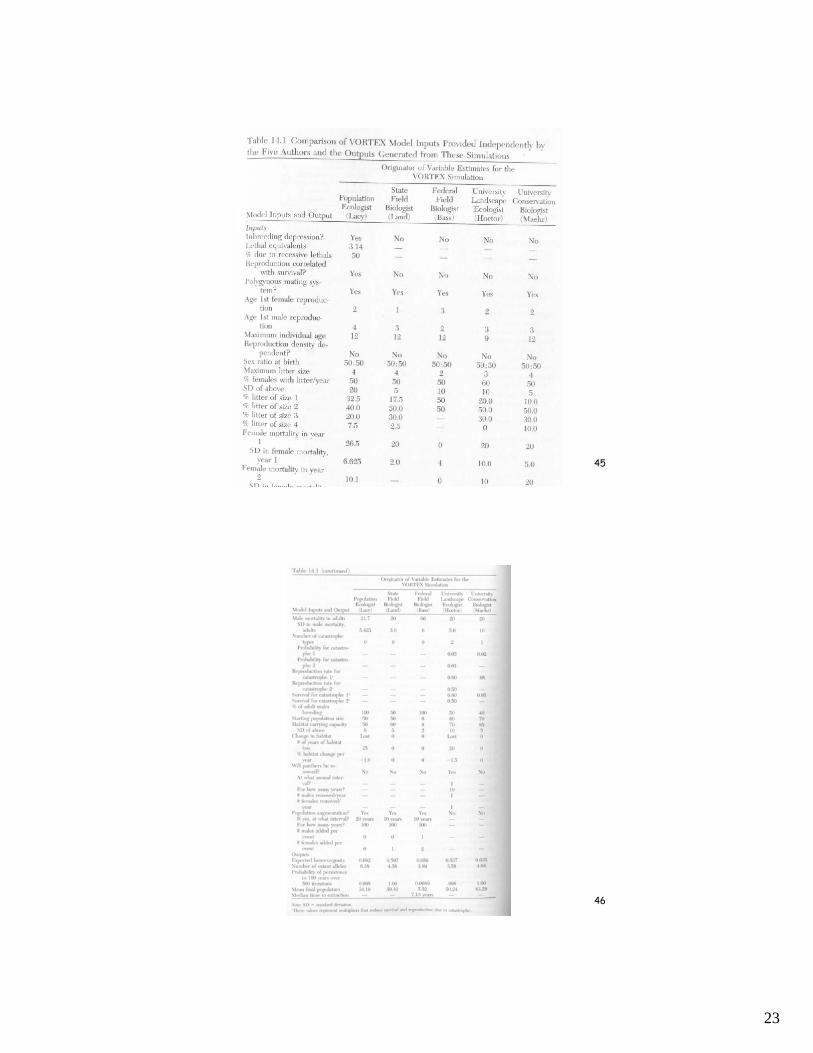
45
46
24
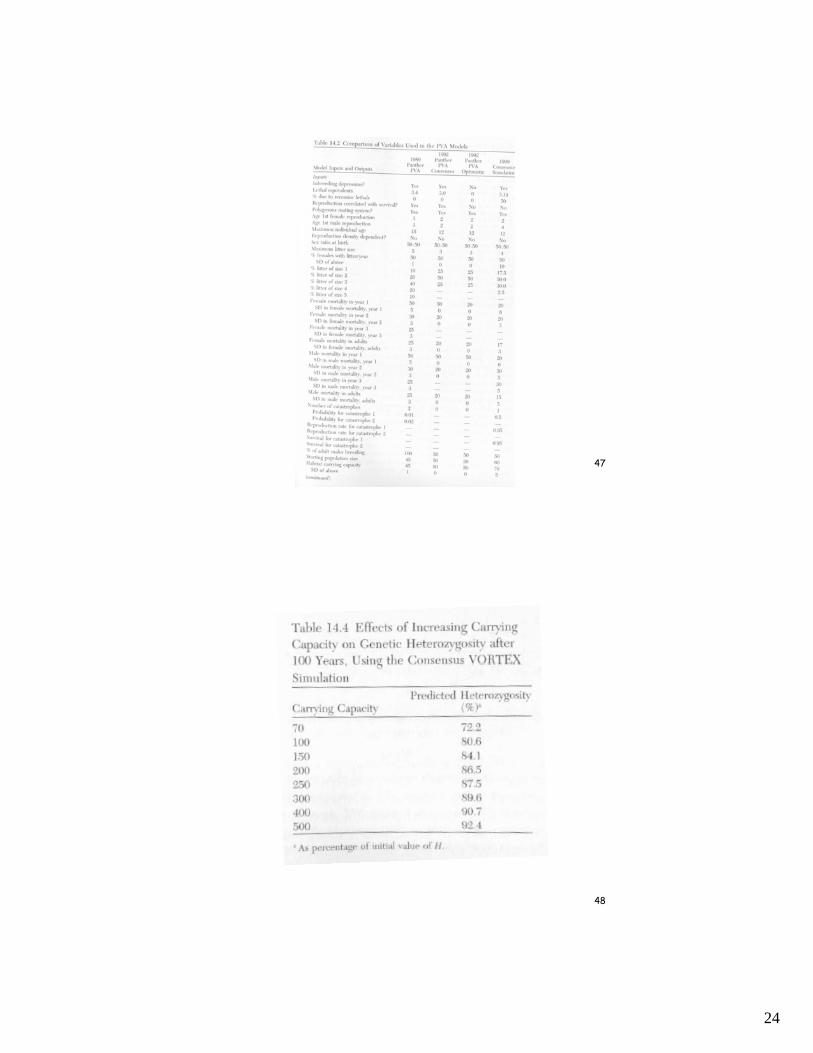
47
48
25
49
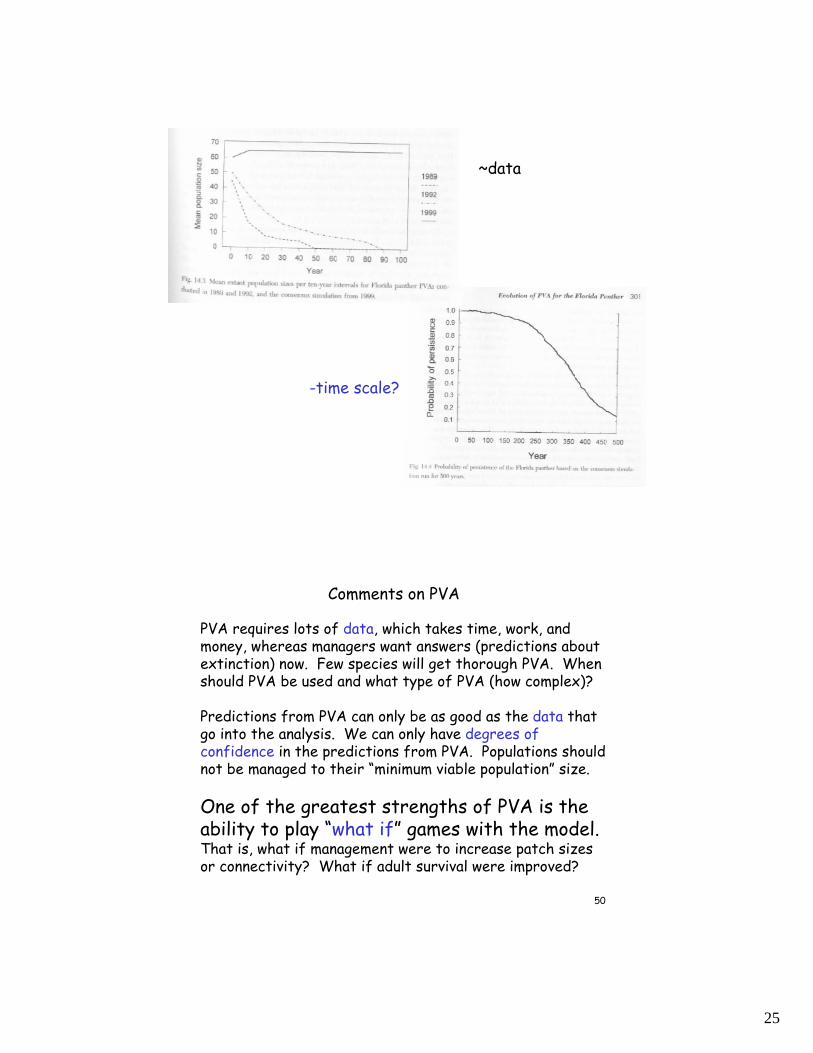
-time scale?
~data
50
PVA requires lots of data, which takes time, work, and money, whereas managers want answers (predictions about extinction) now. Few species will get thorough PVA. When should PVA be used and what type of PVA (how complex)?
Predictions from PVA can only be as good as the data that go into the analysis. We can only have degrees of confidence in the predictions from PVA. Populations should not be managed to their “minimum viable population” size.
One of the greatest strengths of PVA is the ability to play “what if” games with the model. That is, what if management were to increase patch sizes or connectivity? What if adult survival were improved?
Comments on PVA