Embed Size (px)
Citation preview
4096-OFDM Implementation on the HFC plant with Fiber Deep and Distributed Access Architecture
Maxwell Huang
Study on 4096-OFDM Implementation on R-PHY + FD Architecture
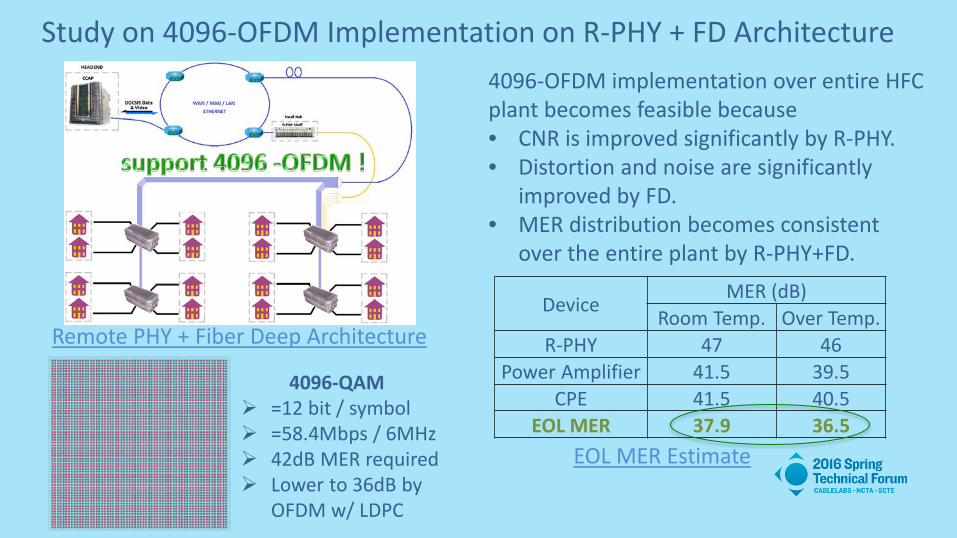
Remote PHY + Fiber Deep Architecture
4096-OFDM implementation over entire HFC plant becomes feasible because • CNR is improved significantly by R-PHY. • Distortion and noise are significantly
improved by FD. • MER distribution becomes consistent
over the entire plant by R-PHY+FD.
EOL MER Estimate
Device MER (dB)
Room Temp. Over Temp. R-PHY 47 46
Power Amplifier 41.5 39.5 CPE 41.5 40.5
EOL MER 37.9 36.5
4096-QAM =12 bit / symbol =58.4Mbps / 6MHz 42dB MER required Lower to 36dB by
OFDM w/ LDPC
Study on PAPR Increase
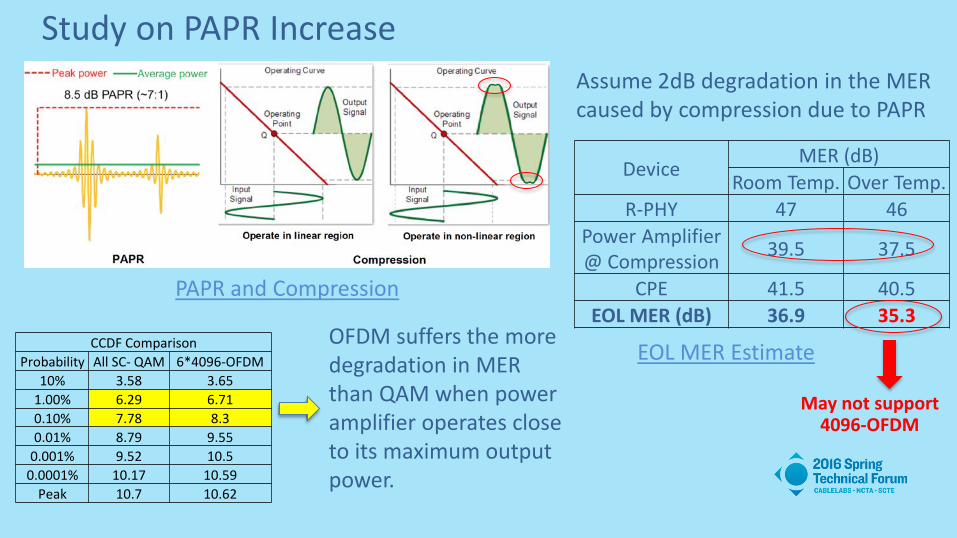
PAPR and Compression
OFDM suffers the more degradation in MER than QAM when power amplifier operates close to its maximum output power.
EOL MER Estimate
Device MER (dB)
Room Temp. Over Temp. R-PHY 47 46
Power Amplifier @ Compression 39.5 37.5
CPE 41.5 40.5 EOL MER (dB) 36.9 35.3
Assume 2dB degradation in the MER caused by compression due to PAPR
May not support 4096-OFDM
CCDF Comparison Probability All SC- QAM 6*4096-OFDM
10% 3.58 3.65 1.00% 6.29 6.71 0.10% 7.78 8.3 0.01% 8.79 9.55
0.001% 9.52 10.5 0.0001% 10.17 10.59
Peak 10.7 10.62
Partial Band CFR _ A Solution Under Investigation
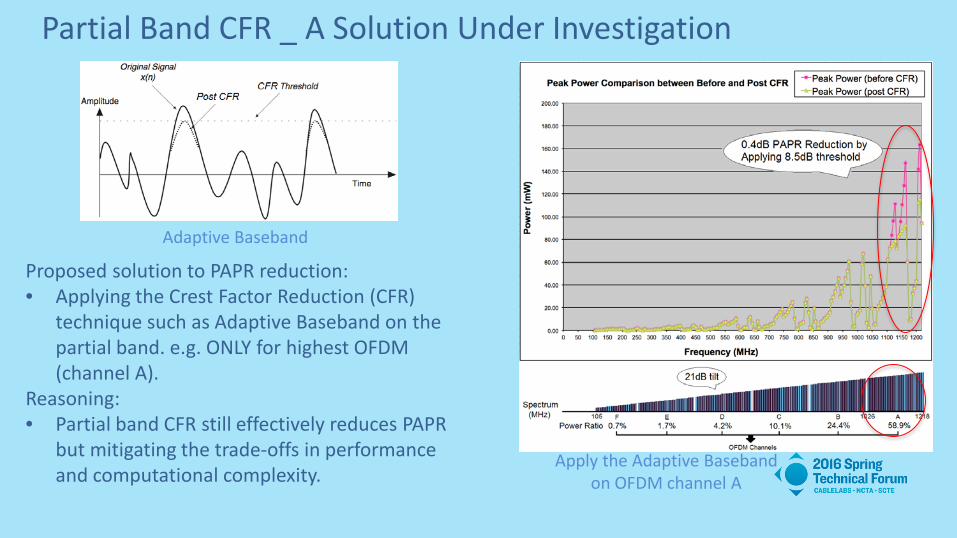
Apply the Adaptive Baseband on OFDM channel A
Proposed solution to PAPR reduction: • Applying the Crest Factor Reduction (CFR)
technique such as Adaptive Baseband on the partial band. e.g. ONLY for highest OFDM (channel A).
Reasoning: • Partial band CFR still effectively reduces PAPR
but mitigating the trade-offs in performance and computational complexity.
Adaptive Baseband
Study on Power Increase R-PHY + FD architecture could bring an unprecedented thermal challenges for the node because • Roughly 25 watt of DC power increase results from enabling the super high output
capability needed for fiber deep deployment. • Roughly 20Watt DC power increase results from introducing R-PHY module in the
node.
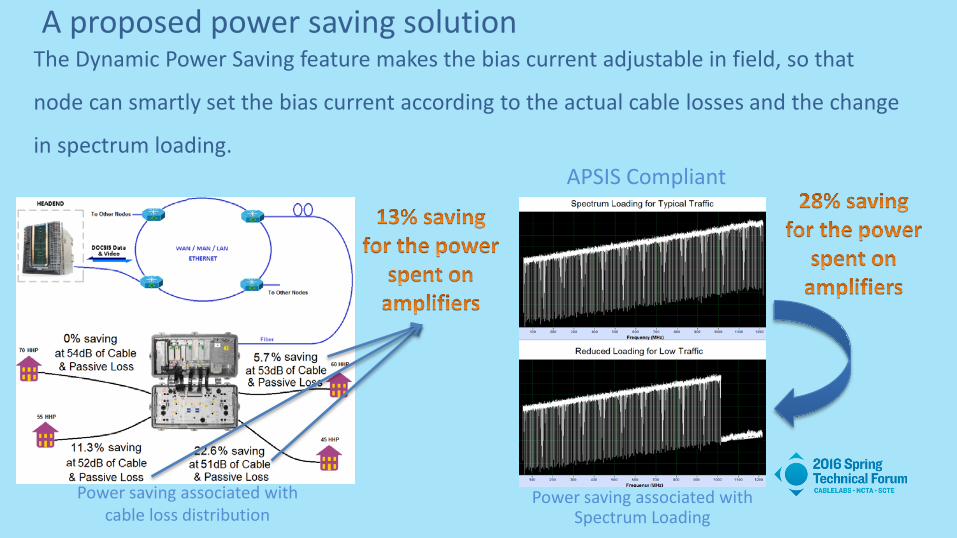
A proposed power saving solution
Power saving associated with cable loss distribution
Power saving associated with Spectrum Loading
The Dynamic Power Saving feature makes the bias current adjustable in field, so that
node can smartly set the bias current according to the actual cable losses and the change
in spectrum loading. APSIS Compliant

Thank You!
The Capacity of Analog Optics in DOCSIS 3.1 HFC Networks
Michael He
John Skrobko, Wen Zhang, Qi Zhang
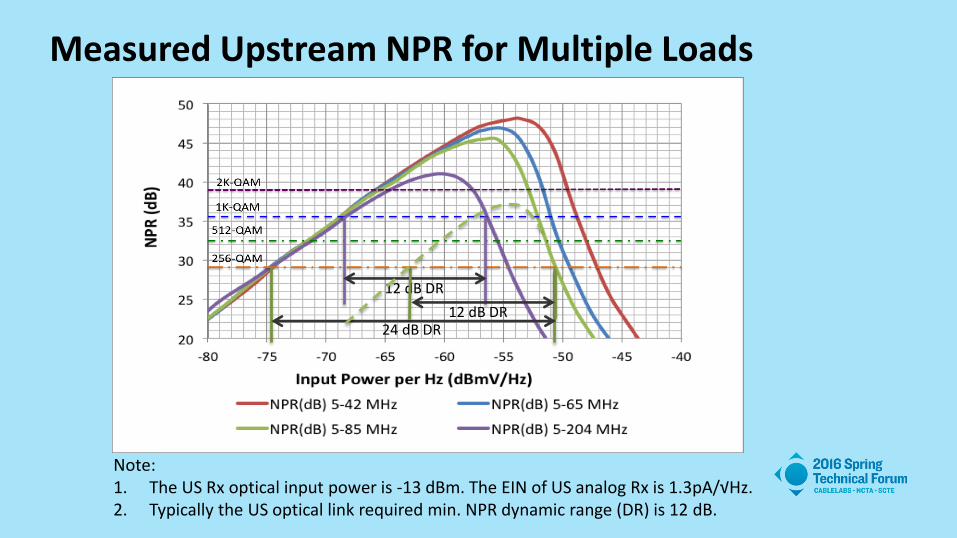
Measured Upstream NPR for Multiple Loads
Note: 1. The US Rx optical input power is -13 dBm. The EIN of US analog Rx is 1.3pA/√Hz. 2. Typically the US optical link required min. NPR dynamic range (DR) is 12 dB.
12 dB DR
24 dB DR 12 dB DR
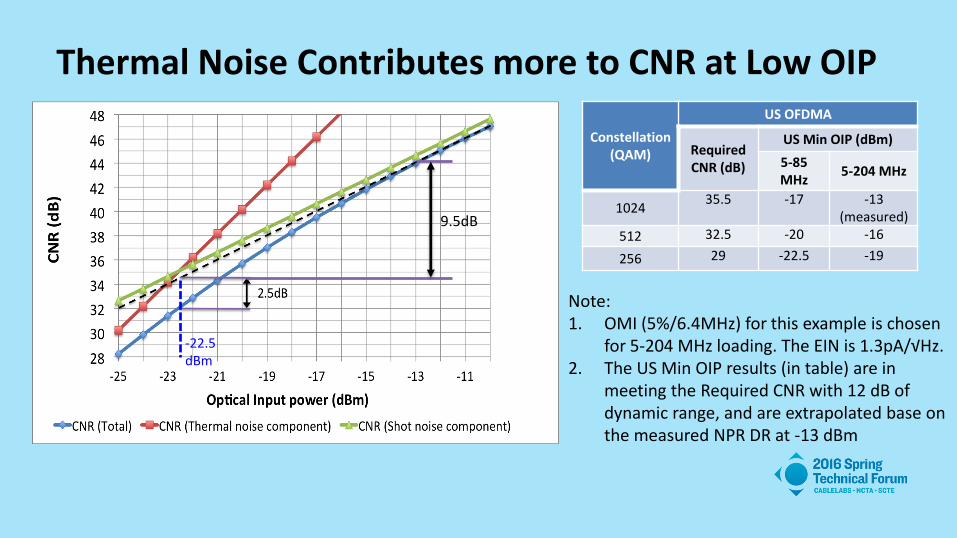
Thermal Noise Contributes more to CNR at Low OIP
9.5dB
Constellation (QAM)
US OFDMA
Required CNR (dB)
US Min OIP (dBm)
5-85 MHz
5-204 MHz
1024 35.5 -17 -13
(measured)
512 32.5 -20 -16
256 29 -22.5 -19
Note: 1. OMI (5%/6.4MHz) for this example is chosen
for 5-204 MHz loading. The EIN is 1.3pA/√Hz. 2. The US Min OIP results (in table) are in
meeting the Required CNR with 12 dB of dynamic range, and are extrapolated base on the measured NPR DR at -13 dBm
-22.5 dBm
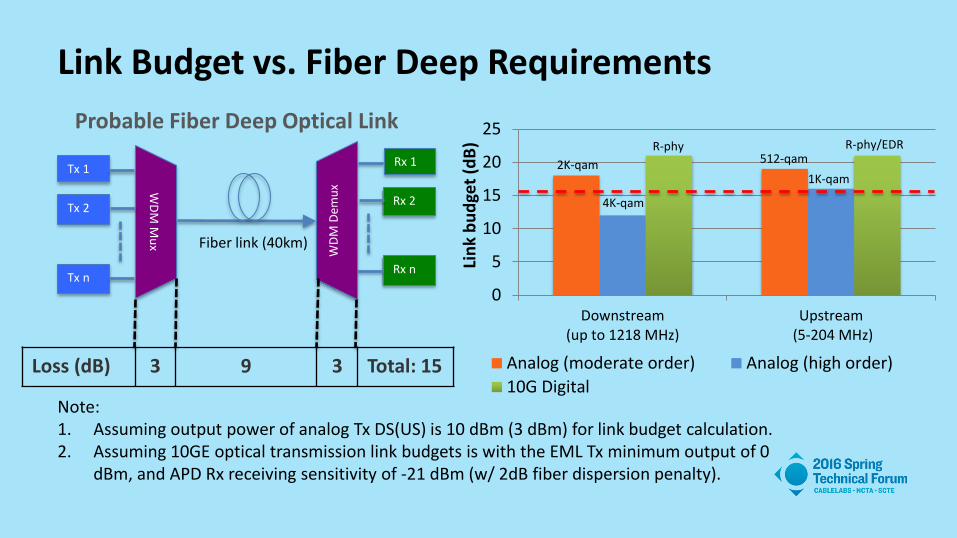
Link Budget vs. Fiber Deep Requirements
WD
M M
ux W
DM
Dem
ux
Rx n
Rx 1
Rx 2
Fiber link (40km)
Tx n
Tx 1
Tx 2
Loss (dB) 3 9 3 Total: 15
0
5
10
15
20
25
Downstream(up to 1218 MHz)
Upstream (5-204 MHz)
Lin
k b
ud
get
(dB
)
Analog (moderate order) Analog (high order)
10G Digital
4K-qam
1K-qam 2K-qam 512-qam
Probable Fiber Deep Optical Link R-phy R-phy/EDR
Note: 1. Assuming output power of analog Tx DS(US) is 10 dBm (3 dBm) for link budget calculation. 2. Assuming 10GE optical transmission link budgets is with the EML Tx minimum output of 0
dBm, and APD Rx receiving sensitivity of -21 dBm (w/ 2dB fiber dispersion penalty).
Summary CNR of analog optical links is dominated by EIN of the optical Rx at
low optical input power.
Analog optical link is still workable for 4K-qam OFDM DS (up to 1218 MHz) at -2dBm OIP, while for 1K-qam OFDMA US (5-204MHz) at -13dBm OIP.
Digital optics can support 4K/1K OFDM/OFDMA with 9 dB and 5 dB more link power budget than DS/US analog optics, respectively.
DOCSIS 3.1 Profile Management Application and Algorithms Greg White, Karthik Sundaresan
(CableLabs)
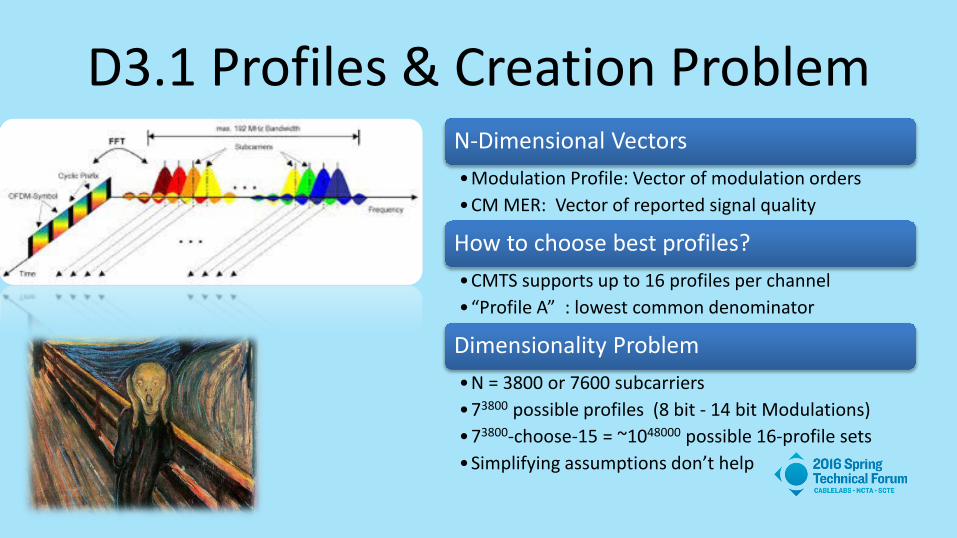
D3.1 Profiles & Creation Problem N-Dimensional Vectors •Modulation Profile: Vector of modulation orders •CM MER: Vector of reported signal quality
How to choose best profiles? •CMTS supports up to 16 profiles per channel •“Profile A” : lowest common denominator
Dimensionality Problem •N = 3800 or 7600 subcarriers •73800 possible profiles (8 bit - 14 bit Modulations) •73800-choose-15 = ~1048000 possible 16-profile sets •Simplifying assumptions don’t help
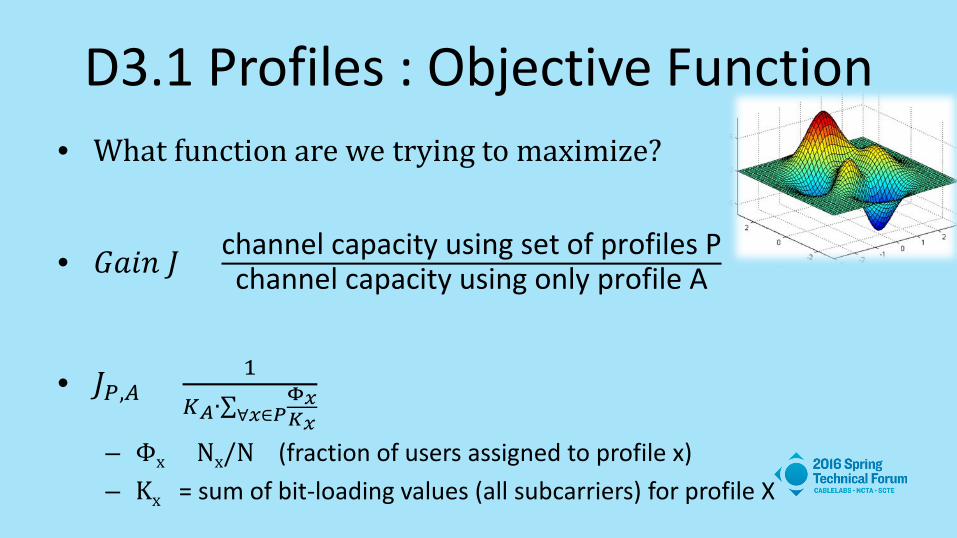
D3.1 Profiles : Objective Function • What function are we trying to maximize?
• 𝐺𝐺𝐺𝐺𝐺𝐺𝐺𝐺 𝐽𝐽 = channel capacity using set of profiles Pchannel capacity using only profile A
• 𝐽𝐽𝑃𝑃,𝐴𝐴 = 1
𝐾𝐾𝐴𝐴∙∑Φ𝑥𝑥𝐾𝐾𝑥𝑥∀𝑥𝑥∈𝑃𝑃
– Φx = Nx/N (fraction of users assigned to profile x) – Kx = sum of bit-loading values (all subcarriers) for profile X
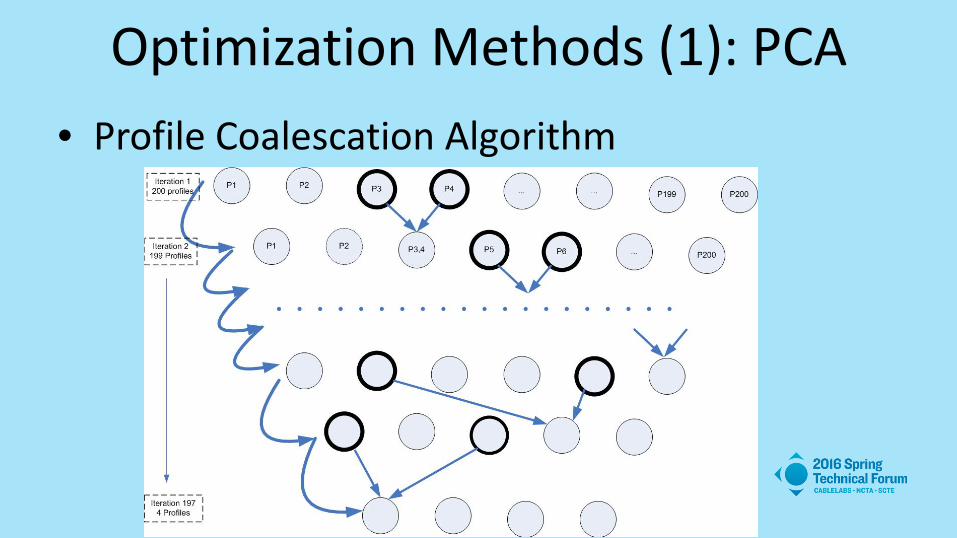
Optimization Methods (1): PCA • Profile Coalescation Algorithm
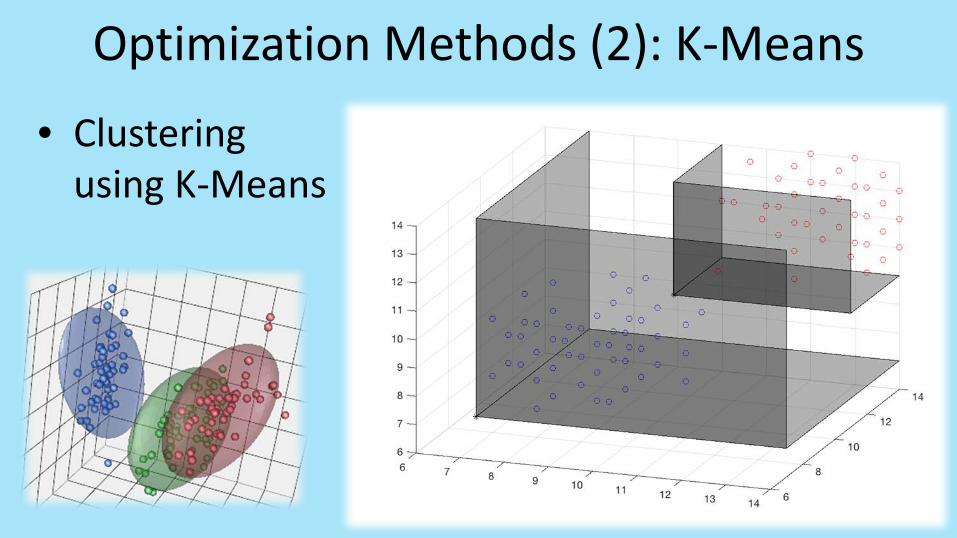
Optimization Methods (2): K-Means
• Clustering using K-Means
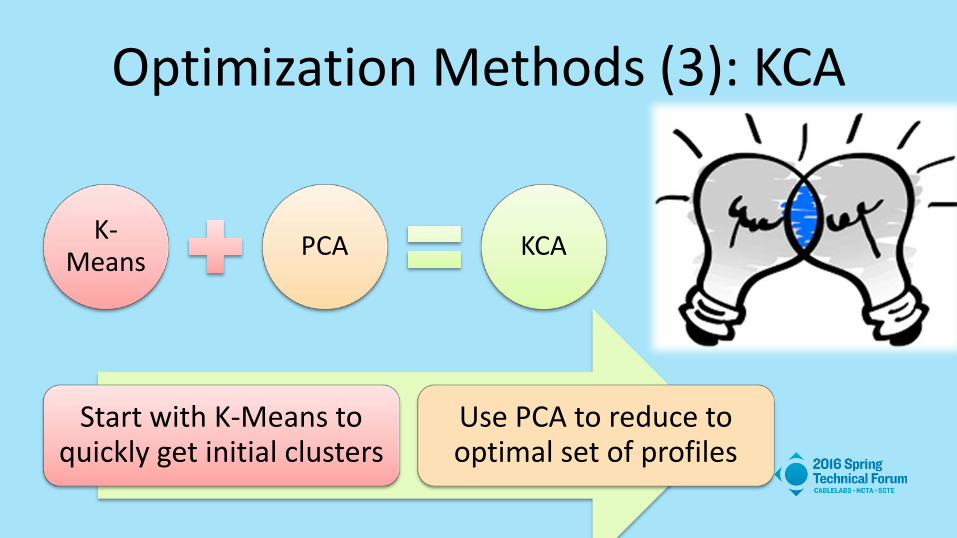
Optimization Methods (3): KCA
K-Means PCA KCA
Start with K-Means to quickly get initial clusters
Use PCA to reduce to optimal set of profiles
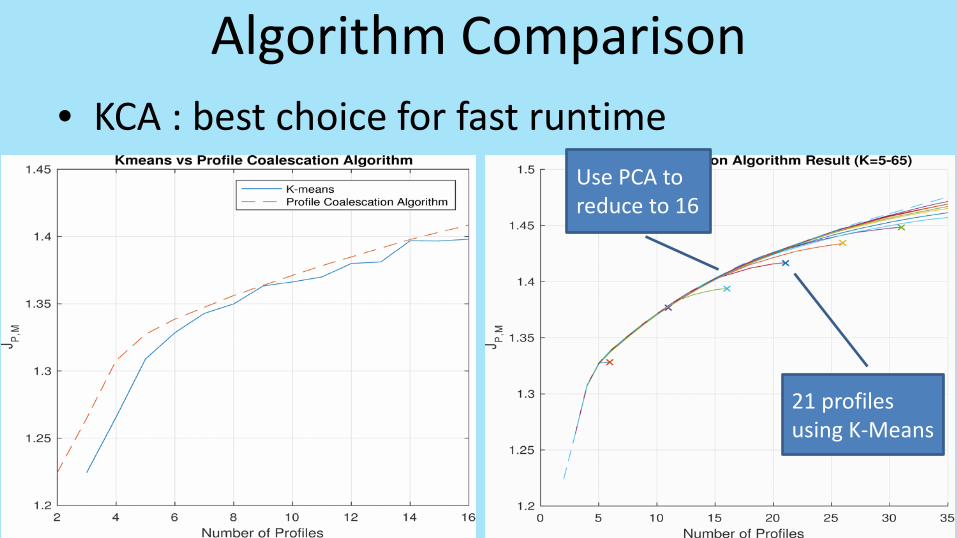
Algorithm Comparison • KCA : best choice for fast runtime
21 profiles using K-Means
Use PCA to reduce to 16
DOCSIS 3.1 Multicast Profile Management Mechanism
Evan Sun Ph.D. Standard Engineer
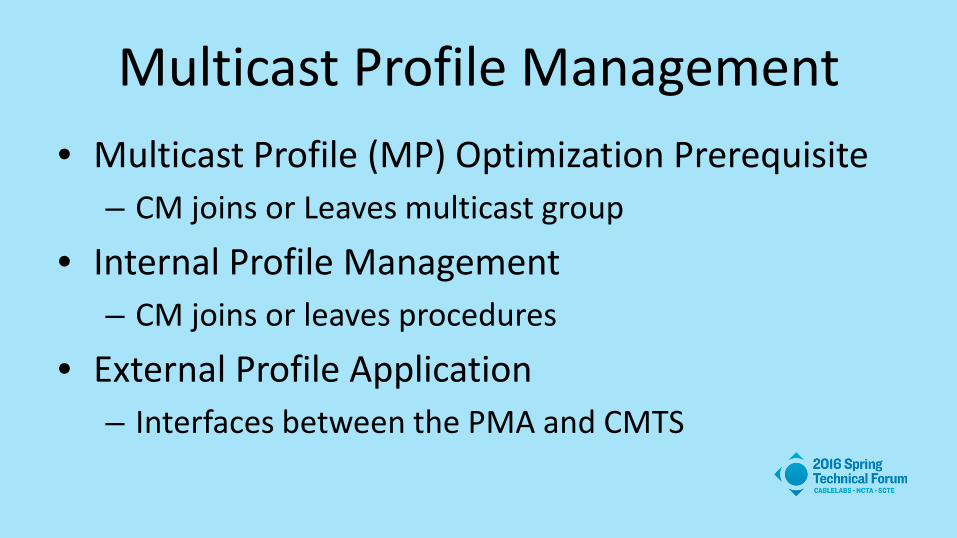
Multicast Profile Management • Multicast Profile (MP) Optimization Prerequisite
– CM joins or Leaves multicast group
• Internal Profile Management – CM joins or leaves procedures
• External Profile Application – Interfaces between the PMA and CMTS
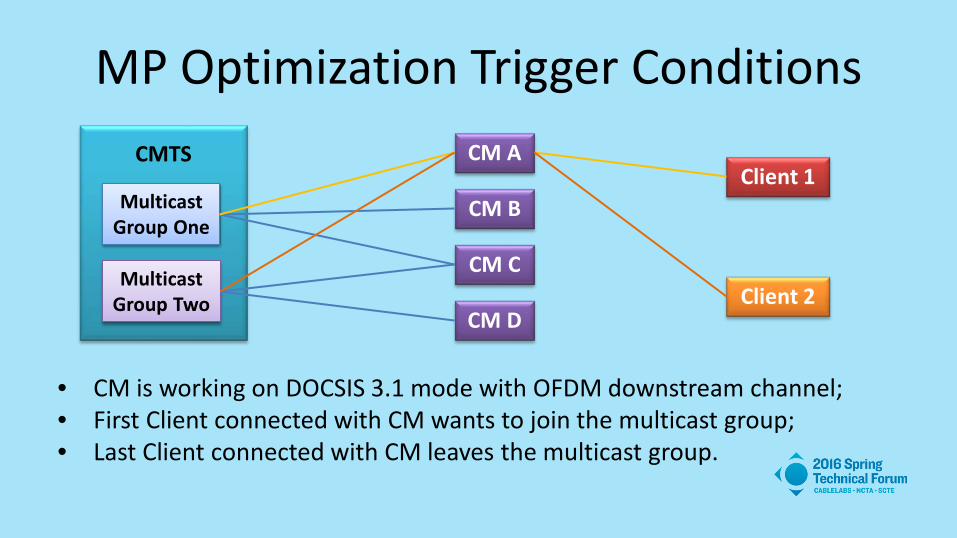
MP Optimization Trigger Conditions
• CM is working on DOCSIS 3.1 mode with OFDM downstream channel; • First Client connected with CM wants to join the multicast group; • Last Client connected with CM leaves the multicast group.
CM A
Multicast Group One
CMTS
Multicast Group Two
CM B
CM C
CM D Client 2
Client 1
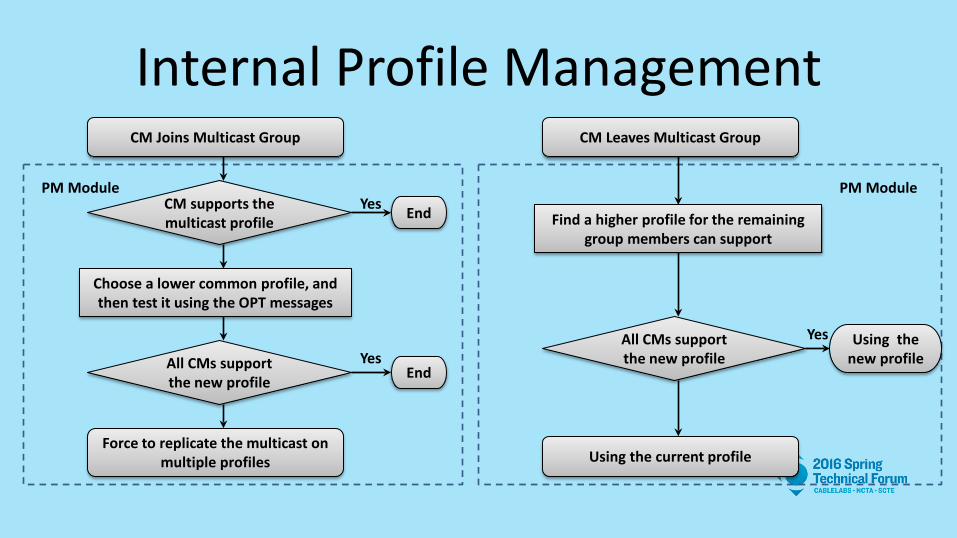
Internal Profile Management CM Joins Multicast Group
CM supports the multicast profile
Choose a lower common profile, and then test it using the OPT messages
All CMs support the new profile
Force to replicate the multicast on multiple profiles
End
End
PM Module
CM Leaves Multicast Group
Find a higher profile for the remaining group members can support
All CMs support the new profile
Using the new profile
PM Module
Using the current profile
Yes
Yes Yes
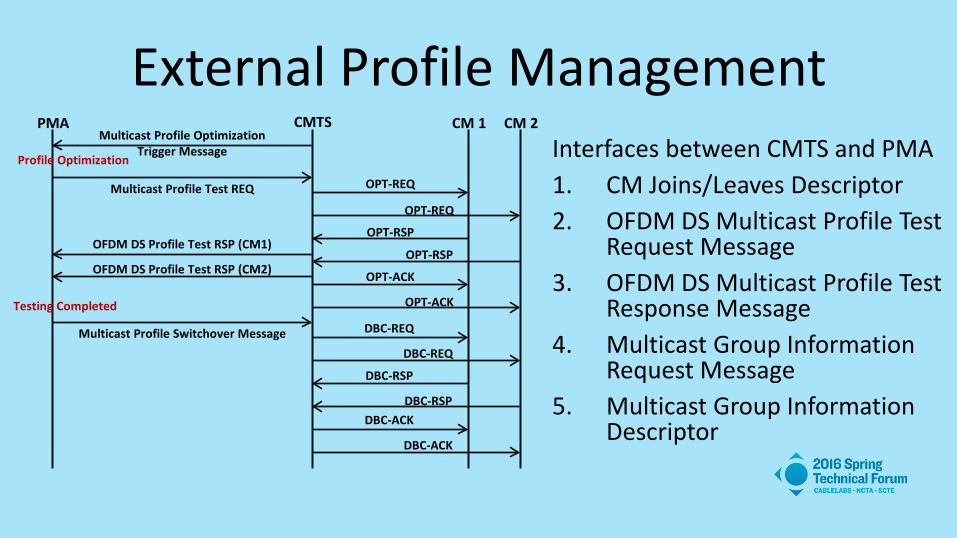
External Profile Management Interfaces between CMTS and PMA 1. CM Joins/Leaves Descriptor 2. OFDM DS Multicast Profile Test
Request Message 3. OFDM DS Multicast Profile Test
Response Message 4. Multicast Group Information
Request Message 5. Multicast Group Information
Descriptor
Multicast Profile Optimization Trigger Message
Profile Optimization
Multicast Profile Test REQ
OFDM DS Profile Test RSP (CM1)
OFDM DS Profile Test RSP (CM2)
Testing Completed
Multicast Profile Switchover Message
OPT-REQ
OPT-REQ
OPT-RSP
OPT-RSP
OPT-ACK
OPT-ACK
DBC-REQ
DBC-REQ
DBC-RSP
DBC-RSP DBC-ACK
DBC-ACK
PMA CMTS CM 1 CM 2

HUAWEI To enrich life through communication
The World Is Flat Capacity Optimization in a Coaxial
Network, Constrained by Total RF Power
Karl Moerder PhD, Futurewei Technologies Inc. Fred Harris PhD, San Diego State University
The world is flat • Capacity Optimization
• What do we think? • What do we know? • What can we prove? • What does it mean?
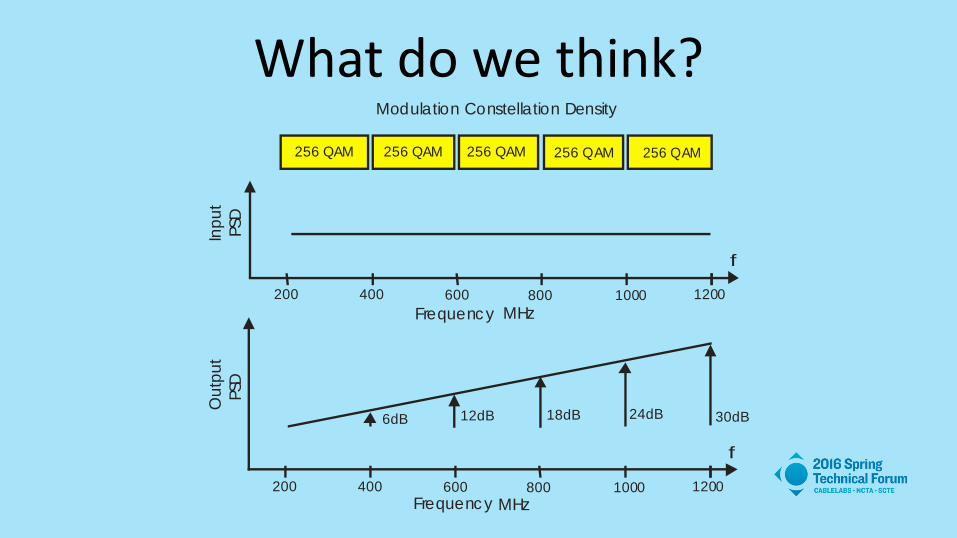
What do we think? 256 QAM256 QAM 256 QAM 256 QAM 256 QAM
Inpu
t P
SDO
utpu
t P
SD
Frequenc y
Frequenc y
200
200
400
400
600
600
800
800
1000
1000
1200
1200
MHz
MHz
f
f
6dB 12dB 18dB 24dB 30dB
Modulation Constellation Density
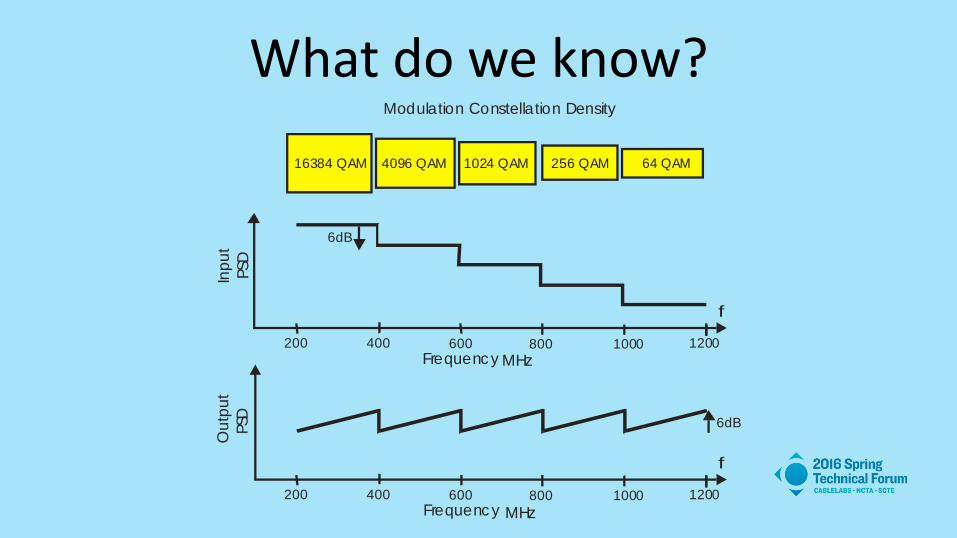
What do we know? 1024 QAM16384 QAM 4096 QAM 256 QAM 64 QAM
Inpu
t P
SDO
utpu
t P
SD
Modulation Constellation Density
Frequenc y
Frequenc y
200
200
400
400
600
600
800
800
1000
1000
1200
1200
MHz
MHz
f
f
6dB
6dB
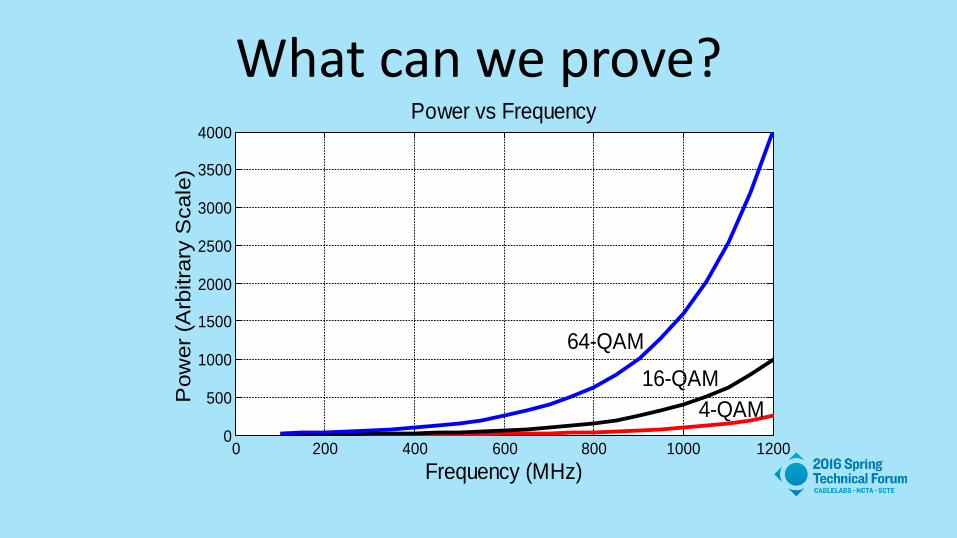
What can we prove?
0 200 400 600 800 1000 12000
500
1000
1500
2000
2500
3000
3500
4000Power vs Frequency
Frequency (MHz)
Pow
er (A
rbitr
ary
Sca
le)
64-QAM 16-QAM
4-QAM
What does it mean? • It means the closer we come to a flat power spectral density out of the amplifier and into the coax, the more efficiently we use our limited RF power. • For the same total RF power, a nearly flat spectrum at the amplifier output significantly reduces the distortion from the amplifier. • The above points become increasingly important as the total bandwidth gets wider. • Pre-emphasis can be approximated with smaller constellations at higher frequency and boosting the gain for the smaller constellations.
Hi Ho, Hi Ho to a Gigabit We Go Positioning the HFC Network for the New Gigabit Era
Phil Miguelez Comcast
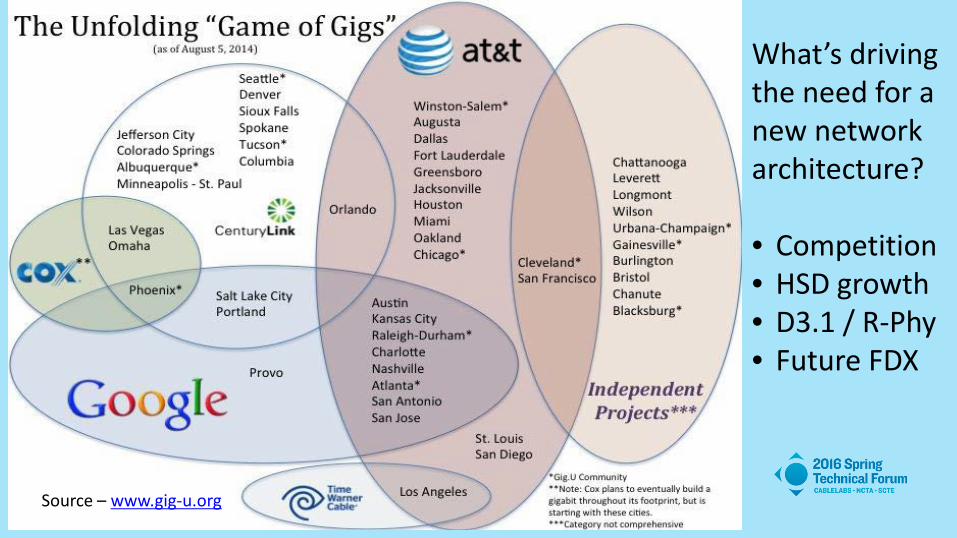
Source – www.gig-u.org
What’s driving the need for a new network architecture? • Competition • HSD growth • D3.1 / R-Phy • Future FDX
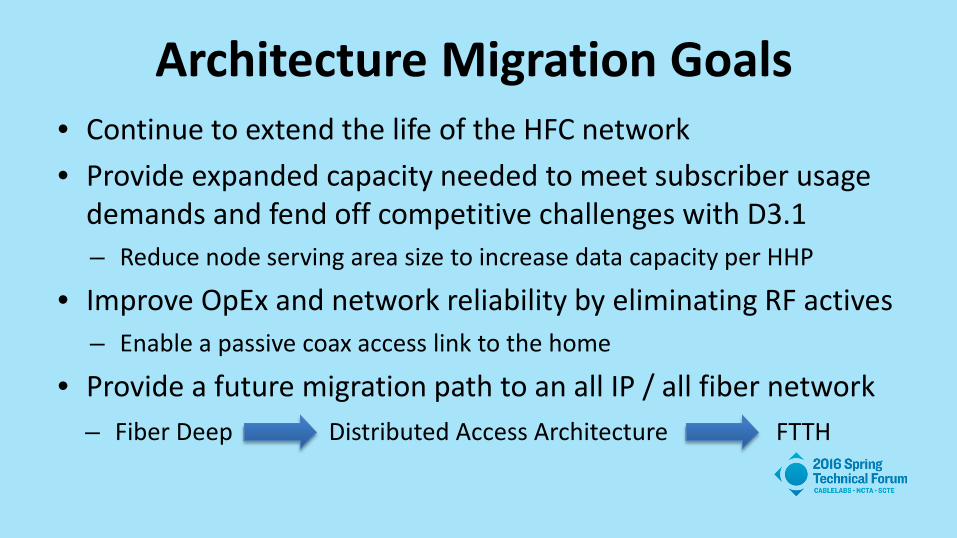
Architecture Migration Goals • Continue to extend the life of the HFC network • Provide expanded capacity needed to meet subscriber usage
demands and fend off competitive challenges with D3.1 – Reduce node serving area size to increase data capacity per HHP
• Improve OpEx and network reliability by eliminating RF actives – Enable a passive coax access link to the home
• Provide a future migration path to an all IP / all fiber network – Fiber Deep Distributed Access Architecture FTTH
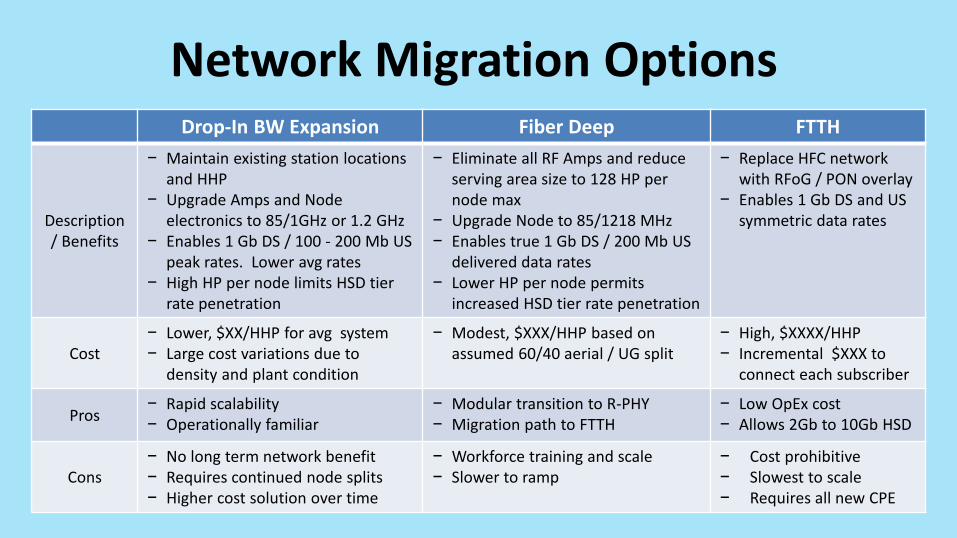
Network Migration Options Drop-In BW Expansion Fiber Deep FTTH
Description / Benefits
− Maintain existing station locations and HHP
− Upgrade Amps and Node electronics to 85/1GHz or 1.2 GHz
− Enables 1 Gb DS / 100 - 200 Mb US peak rates. Lower avg rates
− High HP per node limits HSD tier rate penetration
− Eliminate all RF Amps and reduce serving area size to 128 HP per node max
− Upgrade Node to 85/1218 MHz − Enables true 1 Gb DS / 200 Mb US
delivered data rates − Lower HP per node permits
increased HSD tier rate penetration
− Replace HFC network with RFoG / PON overlay
− Enables 1 Gb DS and US symmetric data rates
Cost − Lower, $XX/HHP for avg system − Large cost variations due to
density and plant condition
− Modest, $XXX/HHP based on assumed 60/40 aerial / UG split
− High, $XXXX/HHP − Incremental $XXX to
connect each subscriber
Pros − Rapid scalability − Operationally familiar
− Modular transition to R-PHY − Migration path to FTTH
− Low OpEx cost − Allows 2Gb to 10Gb HSD
Cons − No long term network benefit − Requires continued node splits − Higher cost solution over time
− Workforce training and scale − Slower to ramp
− Cost prohibitive − Slowest to scale − Requires all new CPE
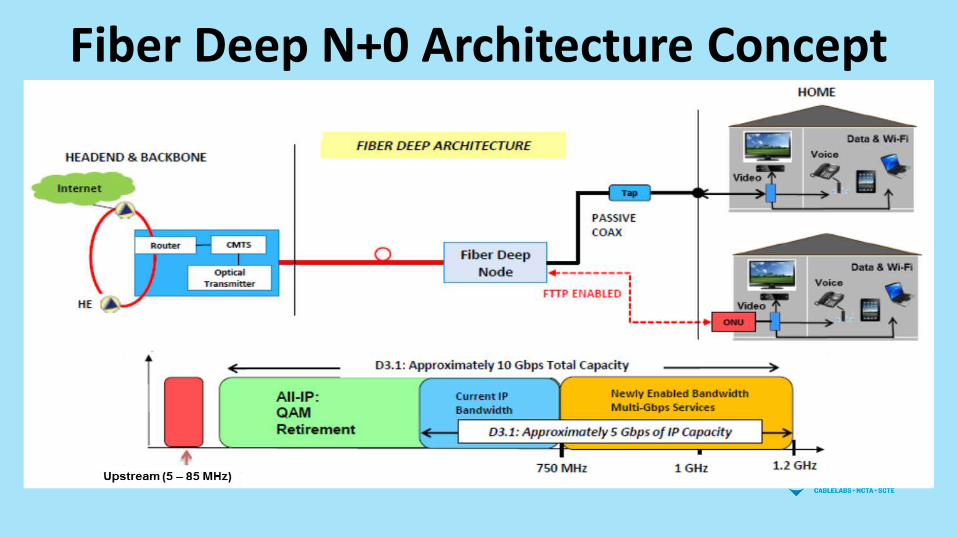
Fiber Deep N+0 Architecture Concept
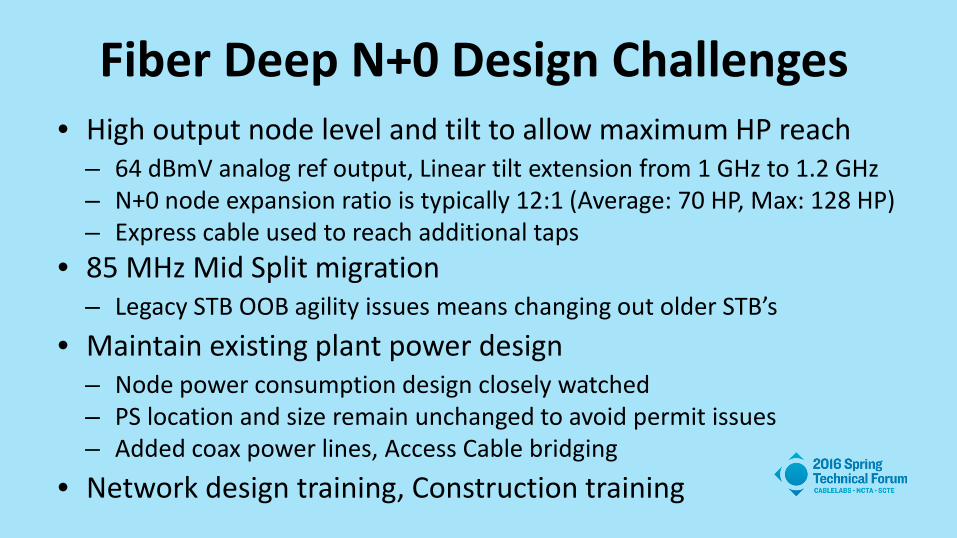
Fiber Deep N+0 Design Challenges • High output node level and tilt to allow maximum HP reach
– 64 dBmV analog ref output, Linear tilt extension from 1 GHz to 1.2 GHz – N+0 node expansion ratio is typically 12:1 (Average: 70 HP, Max: 128 HP) – Express cable used to reach additional taps
• 85 MHz Mid Split migration – Legacy STB OOB agility issues means changing out older STB’s
• Maintain existing plant power design – Node power consumption design closely watched – PS location and size remain unchanged to avoid permit issues – Added coax power lines, Access Cable bridging
• Network design training, Construction training
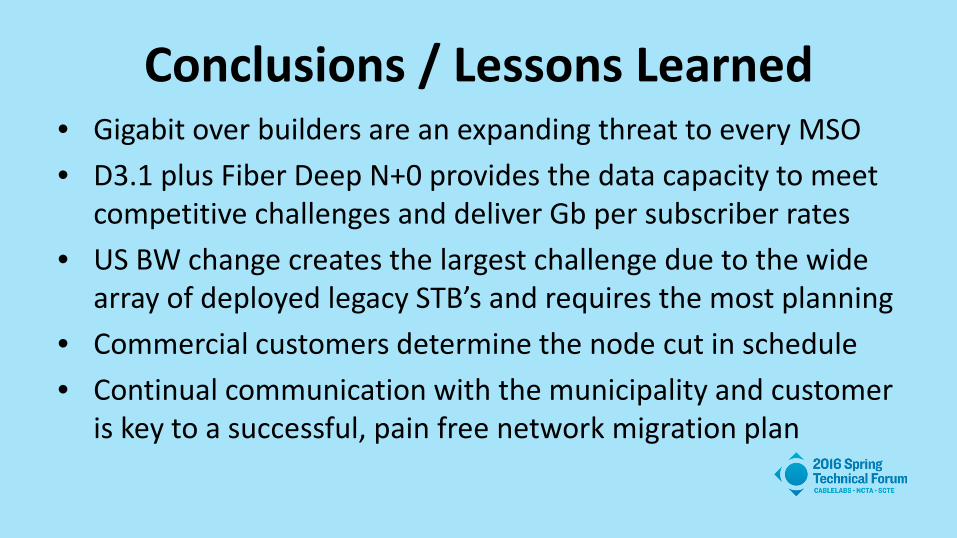
Conclusions / Lessons Learned • Gigabit over builders are an expanding threat to every MSO • D3.1 plus Fiber Deep N+0 provides the data capacity to meet
competitive challenges and deliver Gb per subscriber rates • US BW change creates the largest challenge due to the wide
array of deployed legacy STB’s and requires the most planning • Commercial customers determine the node cut in schedule • Continual communication with the municipality and customer
is key to a successful, pain free network migration plan


![Cable Based Networks.ppt [Read-Only] - Cisco - Global …€¦ · • Distribution network: In a hybrid fiber/coax (HFC) architecture, optical fiber replaces some or all of the traditional](https://img.pdfslide.net/doc/110x75/5ac1d9bd7f8b9ad73f8d632e/cable-based-read-only-cisco-global-distribution-network-in-a-hybrid.jpg)