Embed Size (px)
Citation preview
CHAPTER 4 ANNEALING OF RADIATION DAMAGE IN SrTiO3 99
4.1 EC: Lattice site location of 89Sr in SrTiO3
The implantation and annealing process in SrTiO3 was studied by EC using the
isoelectronic 89Sr ( d5.50t 21 = ) probe, which was implanted with fluences of 2.5×10¹³ at/cm2 and
8×10¹⁴ at/cm2. It is evident that the thermodynamically most stable configuration for Sr in
SrTiO3 is the substitutional Sr site. However, since ion implantation is a non-equilibrium
process, implanted Sr could also be incorporated into other lattice sites. For instance,
interstitials or non-perfect (displaced) substitutional Sr sites formed due to the presence of
defects (e.g. Frenkel pairs) in the substitutional probe vicinity. Nevertheless, after annealing at
sufficiently high temperature, perfect incorporation into substitutional Sr sites is expected.
Therefore, this experiment allowed investigating the role of implantation damage in SrTiO3, the
efficiency of high temperature annealing and the typical temperatures that are needed to remove
implantation defects. Additionally, insight about implantation damage recovery as a function of
fluence was also obtained.
As the implanted fluence increases, the implantation damage to the crystal structure
becomes more extensive and eventually the channels become obliterated if the sample
completely amorphizes. In addition, channelled electrons can be scattered from implanted atoms
in the crystal if they are not incorporated on substitutional lattice sites. As the fluence increases
continually more electrons will become partly channelled instead of fully channelled (i.e. those
in undamaged channels), thereby decreasing the emission channeling yields. As an example, the
normalized ß- EC yields along the major SrTiO3 crystalline directions, shown in figure 4.1,
decrease significantly by increasing the fluence from 2.5×10¹³ to 8×10¹⁴ at/cm2. Such decrease
is more pronounced in the as implanted state and at very low annealing temperatures. While the
CHAPTER 4 ANNEALING OF RADIATION DAMAGE IN SrTiO3 100
8×10¹⁴ at/cm2 implanted sample shows a
broad recovery step that stretches from
200ºC to 1000ºC, a pronounced recovery
step is absent in the 2.5×10¹³ at/cm2
implanted sample.
The measured ß- yields were all
corrected for electron scattering by
subtracting a uniform background,
according to equation 3.69. The
backscattering contribution was quantified
by means of Monte Carlo simulations as
referred in page 106. It was found that the
scattering for this isotope was nearly
independent of the sample orientation,
although proper correction factor to each
direction was applied.
In order to analyze the experimentally recorded ß- patterns, theoretical angular
distributions were calculated by the manybeam code. The simulations were carried out for the
emitter atom 89Sr in different lattice sites but, including more than one site in the fit didn’t
improve its quality. In addition, the simulated patterns were calculated for atomic and ionic DT
potentials as well as for different angular smoothing Gaussian distribution widths (see page 96).
Fit quality improved ∼10% by considering ionic DT potentials, which make them the correct
potential choice, and by ∼20% considering broader smoothing Gaussian distributions. The later
improvement should be caused by a physical effect, either related with fluence and/or ion
0 200 400 600 800 1000 1200 14000.0
0.5
1.0
1.5
2.0
2.5
3.0
axia
l χm
ax
annealing temperature TA [ºC]
0 200 400 600 800 1000 1200 14000.0
0.5
1.0
1.5
2.0
2.5
3.0
(b)
(a)
<100> <111> <110> <211> <411>
axia
l χm
ax
annealing temperature TA [ºC]
Fig. 4.1 Normalized EC yield χmax measured along the
major crystallographic directions of SrTiO3 following
SrTiO3 implantation with 2.5×10¹³ (a) and 8×10¹⁴ 89Sr
at/cm-2 (b) and as a function of annealing temperature.

CHAPTER 4 ANNEALING OF RADIATION DAMAGE IN SrTiO3 101
implantation energy (40 keV, c.f. table 3.1), since, the experimental angular resolution didn’t
change during the experiment.
Emission channeling effects are absent in samples that are locally nearly or fully
amorphous. Then, probe atoms occupy random positions in a highly damaged neighbourhood.
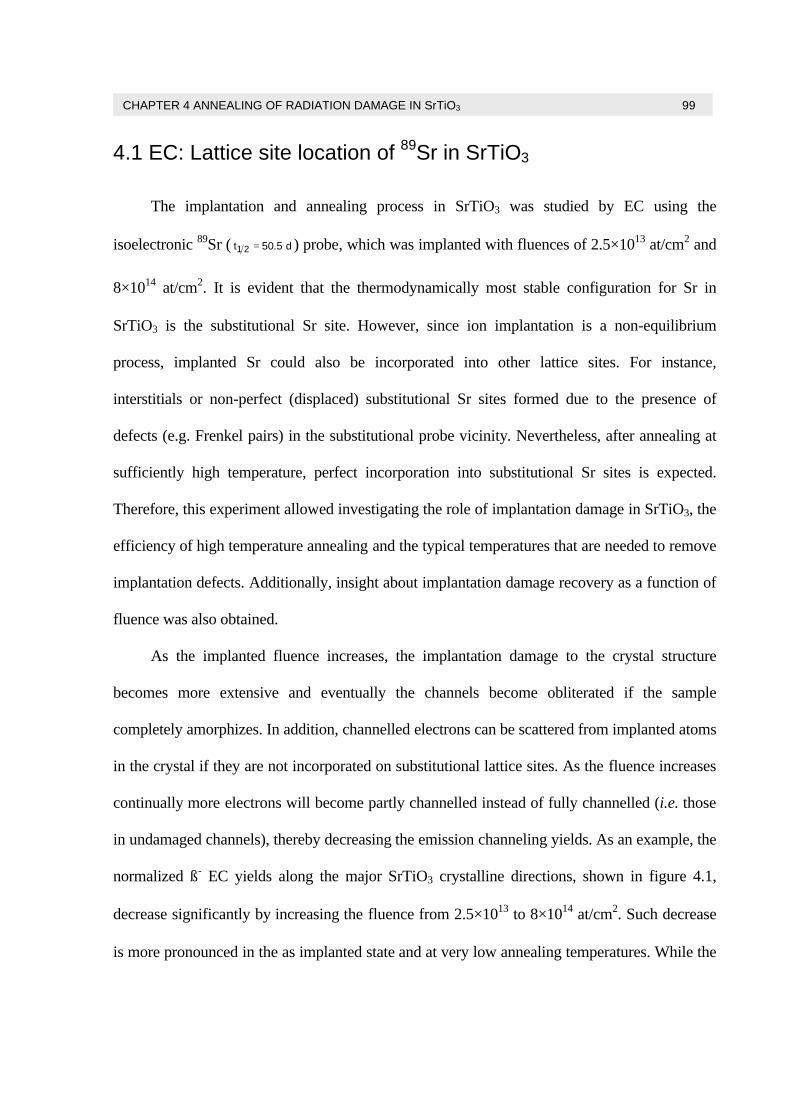
However, as figure 4.2 shows, this wasn’t observed in the sample implanted with 8×10¹⁴ 89Sr
at/cm2, indicating that this fluence value is still below the amorphization threshold. EC studies
performed in 56Fe-implanted SrTiO3 to higher fluences suggested that the amorphization
threshold may be between 8×10¹⁴ and 1×10¹⁵ at/cm2. This because the channeling effects of the
low fluence 56Fe-implanted sample are barely seen following implantation and totally absent
until 500ºC annealing in the high fluence 56Fe-implanted sample. Further details are given in
section 5.3.
Figures 4.2 (a) and (b) show the angular ß- emission pattern measured along <100> and
<211> axes in the as implanted state of the highest fluence 89Sr-implanted sample. The axial
channeling effect and the planar effects already suggest that 89Sr must majority occupy
substitutional sites or sites which are close to substitutional positions along the atomic rows of
those axes. EC effects along <211> direction indicate in particular that any fraction of 89Sr
occupying Ti sites must be small, since Ti sites lead to a characteristic double peak structure
along this direction [1] (c.f. figs. 5.6, 5.10, 5.15 and 5.16), which is not observed in this
experiment. The best fits of the simulated patterns to the experimental ones are shown in figures
4.2 (c) and (d). The best single fraction fit corresponds to a fraction of 65% of 89Sr atoms
occupying near-Sr sites with rms displacements varying from 0.05 Å (perpendicular to <100>)
to 0.17 Å (perpendicular to <111>). The remainder is situated in random sites, which
isotropically contribute to the emission yield. These random sites correspond to low-symmetry
sites, or sites with very disordered or amorphous surroundings.

CHAPTER 4 ANNEALING OF RADIATION DAMAGE IN SrTiO3 102
The simulated patterns of figures 4.2 (c) and (d) were convoluted with a Gaussian
distribution of smoothing sigma equal 0.4º, which is much bigger than that of 0.1º, considered to
a perfect crystal, in which case only the experimental resolution of the setup is taken into
account. Along <110> and <111> axes somewhat larger values were achieved. This may really
indicate the development of a lattice mismatch between the implanted layer and the sample
substrate, which is known to introduce effects like crystal mosaicity. The misorientation can be
split up into two components: mosaic tilt and twist. The influence of crystal mosaicity on the
crystal causes broader axial channeling peaks in the 2D patterns, whose fit to the correspondent
theoretical patterns result from considering a smoothing Gaussian distribution given by the
combination of the Gaussian distribution with sigma equal 0.1º and the one with sigma resulting
from the superposition of tilt and twist. The FWHM of that smoothing Gaussian is given by:
( ) ( )2M
2S Wº24.0W θ+= (4.1)
Where 0.24º corresponds to the FWHM of a Gaussian with sigma equal to 0.1º and WM to the
width of a Gaussian taking into account the tilt and twist mosaicity effects.
From equation 4.1 it can be deduced that mosaicity spread is only expected to influence
the EC patterns if it is of the order of magnitude of 0.24º or larger, i.e. if the smoothing sigma is
of the order of 0.1º or larger. This does expect that, the low Sr-implanted sample (2.5×10³
at/cm2) also suffers from mosaicity since, following implantation or after annealing, the
measured smoothing sigma of 0.2º, i.e. bigger than the angular resolution. However since the
smoothing sigma of the other sample in the as implanted state doubled with fluence, mosaicity
is expected to affect this sample channeling experiments to a larger extent.
CHAPTER 4 ANNEALING OF RADIATION DAMAGE IN SrTiO3 103
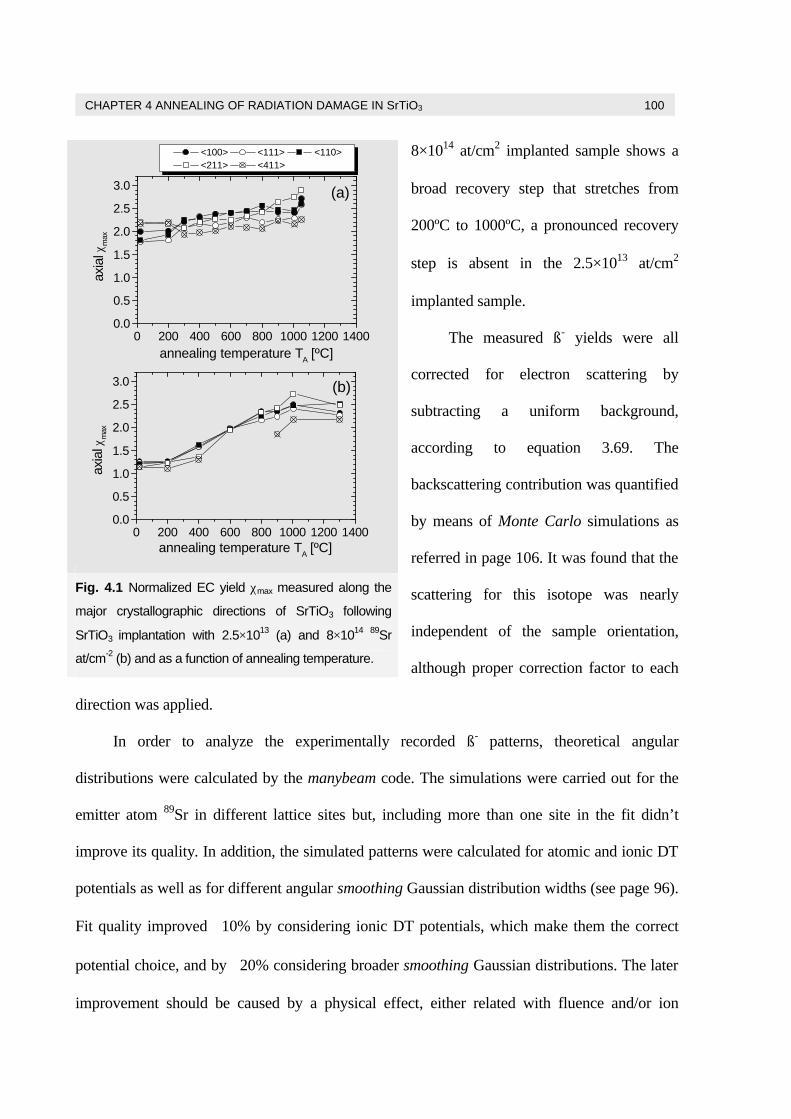
Figures 4.3 (a)-(e) and 4.4 (a)-(d) show the experimental emission channeling yields
following the last annealing step, performed at 1050 ºC and 1300 ºC, in low- and high- fluence
samples, respectively. The axial and planar channeling effects reveal indeed that, despite the
large fluence, the 89Sr atoms continue ending up in substitutional Sr lattice sites. The best single
fraction fits for each 89Sr-implanted samples are shown in figures 4.3 (f)-(j) and 4.4 (e)-(h). The
similar rms displacements extracted from best fits, following 1050 ºC and 1300 ºC annealing,
with the vibration amplitude of u1(Sr) indicates almost perfect incorporation and large local
defect recovery of the implanted 89Sr into SSr sites. This observation is very important since it
shows that the simulations can faithfully reproduce the experimental channeling patterns for
impurities located on perfect substitutional Sr sites. Therefore, when in EC experiments
impurities exhibit rms displacements much larger than the thermal vibration amplitude of Sr, we
can be confident that the effect is not due to a deviation between simulation and experiment, but
really due to a physical displacement or change in the local environment of the probe atoms.
Most likely due to mosaic broadening, that in some cases is hardly visible in EC experiments
dealing with samples implanted to low fluences. This may lead to a loss of information in the
experimental EC patterns of SrTiO3 samples implanted with other impurities to similar fluences.
-2
-1
0
1
2
-1 0 1 2 3
{110}
{100}experiment
-1 0 1 2 3
(b)
(c) <100> 1.07 -- 1.09 1.05 -- 1.07 1.03 -- 1.05 1.01 -- 1.03 0.996 -- 1.01 0.978 -- 0.996 0.959 -- 0.978 0.940 -- 0.959
simulation best fit
(a)
-2
-1
0
1
2
{210}
{210}
{110}
1.07 -- 1.09 1.05 -- 1.07 1.03 -- 1.05 1.01 -- 1.03 0.996 -- 1.01 0.978 -- 0.996 0.959 -- 0.978 0.940 -- 0.959
(d) <211>
[deg]
Fig. 4.2 Angular distributions
of ß- particles emitted from 89Sr in SrTiO3 around the (a)
<100> and (b) <211> axes
following RT implantation of
the highest dose sample. The
best fits of the simulated
patterns to the experimental
ones are shown in (c)–(d).

CHAPTER 4 ANNEALING OF RADIATION DAMAGE IN SrTiO3 104
As a result has to be concluded that is not possible to accurately deduce the root mean square
displacements from ideal Sr- and Ti- sites, as will be extensively demonstrated in the next
chapter.
However, figures 4.3 and 4.4 allow the extraction of additional physical information on
the lattice site location of impurities in mosaic layers obtained from different 89Sr fluences
implanted in SrTiO3 samples. For this specific case, a single Gaussian was used to convolute the
-2
-1
0
1
2
-2 -1 0 1 2
1.66 -- 1.80 1.51 -- 1.66 1.37 -- 1.51 1.22 -- 1.37 1.08 -- 1.22 0.938 -- 1.08 0.794 -- 0.938 0.650 -- 0.794
(b)
(a)
{100}
{110}
experiment
-2 -1 0 1 2
simulation best fit
(f) <100>
-2
-1
0
1
2 1.66 -- 1.80 1.51 -- 1.66 1.37 -- 1.51 1.22 -- 1.37 1.08 -- 1.22 0.938 -- 1.08 0.794 -- 0.938 0.650 -- 0.794
{110}
(h) <211>
(g) <110>
-2
-1
0
1
2 1.66 -- 1.80 1.51 -- 1.66 1.37 -- 1.51 1.22 -- 1.37 1.08 -- 1.22 0.938 -- 1.08 0.794 -- 0.938 0.650 -- 0.794
{110}
(c)
[deg]
-2
-1
0
1
2
1.66 -- 1.80 1.51 -- 1.66 1.37 -- 1.51 1.22 -- 1.37 1.08 -- 1.22 0.938 -- 1.08 0.794 -- 0.938 0.650 -- 0.794
1.66 -- 1.80 1.51 -- 1.66 1.37 -- 1.51 1.22 -- 1.37 1.08 -- 1.22 0.938 -- 1.08 0.794 -- 0.938 0.650 -- 0.794
(d)
{110}
(i) <411>
-2 -1 0 1 2-2
-1
0
1
2(e)
{110}
-2 -1 0 1 2
(j) <111>
-2-1012
-2 -1 0 1 2
{110}
{100}experiment
-2 -1 0 1 2
(d)
(c)
(b)
(a) 1.47 -- 1.56 1.38 -- 1.47 1.29 -- 1.38 1.20 -- 1.29 1.12 -- 1.20 1.03 -- 1.12 0.939 -- 1.03 0.850 -- 0.939
simulation best fit
(e) <100>
-2-1012
{211}
{110}
1.47 -- 1.56 1.38 -- 1.47 1.29 -- 1.38 1.20 -- 1.29 1.12 -- 1.20 1.03 -- 1.12 0.939 -- 1.03 0.850 -- 0.939
(f) <111>
-2-1012
{210}
{210}
{110}
1.47 -- 1.56 1.38 -- 1.47 1.29 -- 1.38 1.20 -- 1.29 1.12 -- 1.20 1.03 -- 1.12 0.939 -- 1.03 0.850 -- 0.939
(g) <211>
[deg]-2 -1 0 1 2-2-1012 1.47 -- 1.56
1.38 -- 1.47 1.29 -- 1.38 1.20 -- 1.29 1.12 -- 1.20 1.03 -- 1.12 0.939 -- 1.03 0.850 -- 0.939
{111}
{110}
-2 -1 0 1 2
(h) <110>
Fig. 4.3 Angle dependent ß- emission yields
from implanted 89Sr in SrTiO3 to a fluence of
2.5×10¹³ following 1050 ºC annealing around the
(a) <100>, (b) <110>, (c) <211>, (d) <411> and (e)
<111> axes. Best fits (f)-(j) of simulated channeling
patterns for SSr sites to experimental yield.
Fig. 4.4 Angle dependent ß- emission yields from
implanted 89Sr in SrTiO3 to a fluence of 8×10¹⁴
following 1300 ºC annealing around the (a) <100>,
(b) <111>, (c) <211> and (d) <110> axes. Best fits
(e)-(h) of simulated channeling patterns for SSr sites
to experimental yield.
CHAPTER 4 ANNEALING OF RADIATION DAMAGE IN SrTiO3 105
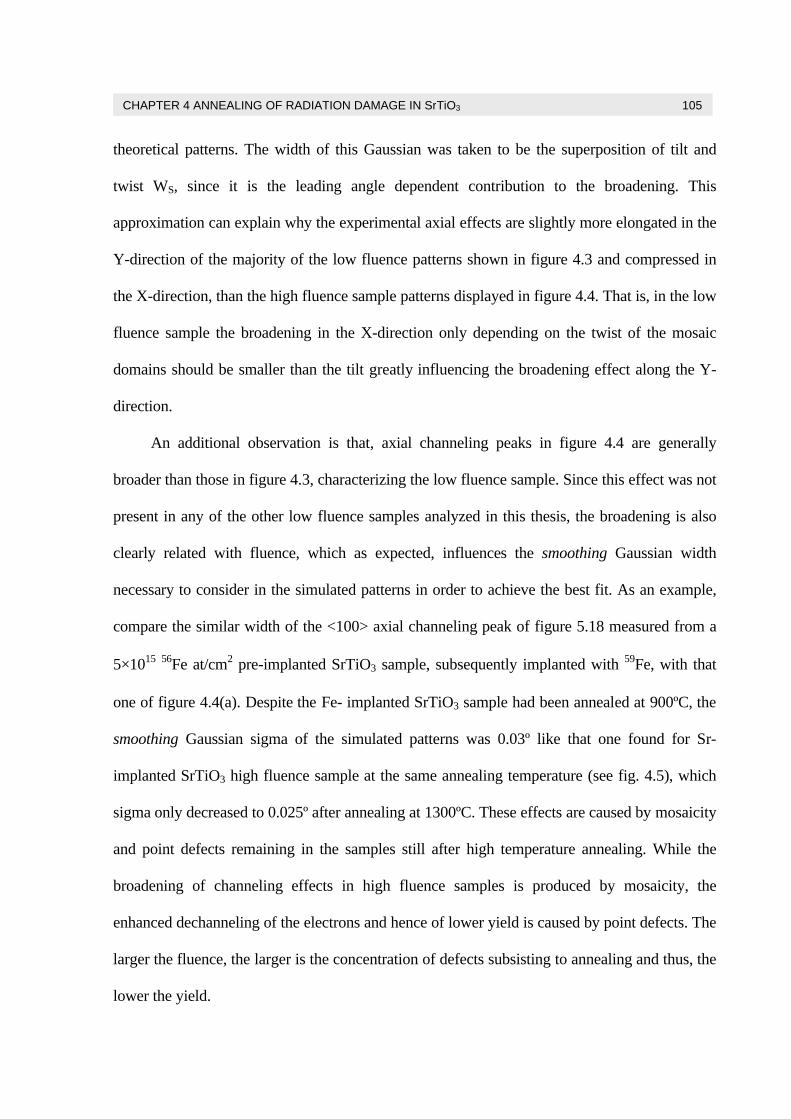
theoretical patterns. The width of this Gaussian was taken to be the superposition of tilt and
twist WS, since it is the leading angle dependent contribution to the broadening. This
approximation can explain why the experimental axial effects are slightly more elongated in the
Y-direction of the majority of the low fluence patterns shown in figure 4.3 and compressed in
the X-direction, than the high fluence sample patterns displayed in figure 4.4. That is, in the low
fluence sample the broadening in the X-direction only depending on the twist of the mosaic
domains should be smaller than the tilt greatly influencing the broadening effect along the Y-
direction.
An additional observation is that, axial channeling peaks in figure 4.4 are generally
broader than those in figure 4.3, characterizing the low fluence sample. Since this effect was not
present in any of the other low fluence samples analyzed in this thesis, the broadening is also
clearly related with fluence, which as expected, influences the smoothing Gaussian width
necessary to consider in the simulated patterns in order to achieve the best fit. As an example,
compare the similar width of the <100> axial channeling peak of figure 5.18 measured from a
5×10¹⁵ 56Fe at/cm2 pre-implanted SrTiO3 sample, subsequently implanted with 59Fe, with that
one of figure 4.4(a). Despite the Fe- implanted SrTiO3 sample had been annealed at 900ºC, the
smoothing Gaussian sigma of the simulated patterns was 0.03º like that one found for Sr-
implanted SrTiO3 high fluence sample at the same annealing temperature (see fig. 4.5), which
sigma only decreased to 0.025º after annealing at 1300ºC. These effects are caused by mosaicity
and point defects remaining in the samples still after high temperature annealing. While the
broadening of channeling effects in high fluence samples is produced by mosaicity, the
enhanced dechanneling of the electrons and hence of lower yield is caused by point defects. The
larger the fluence, the larger is the concentration of defects subsisting to annealing and thus, the
lower the yield.
CHAPTER 4 ANNEALING OF RADIATION DAMAGE IN SrTiO3 106
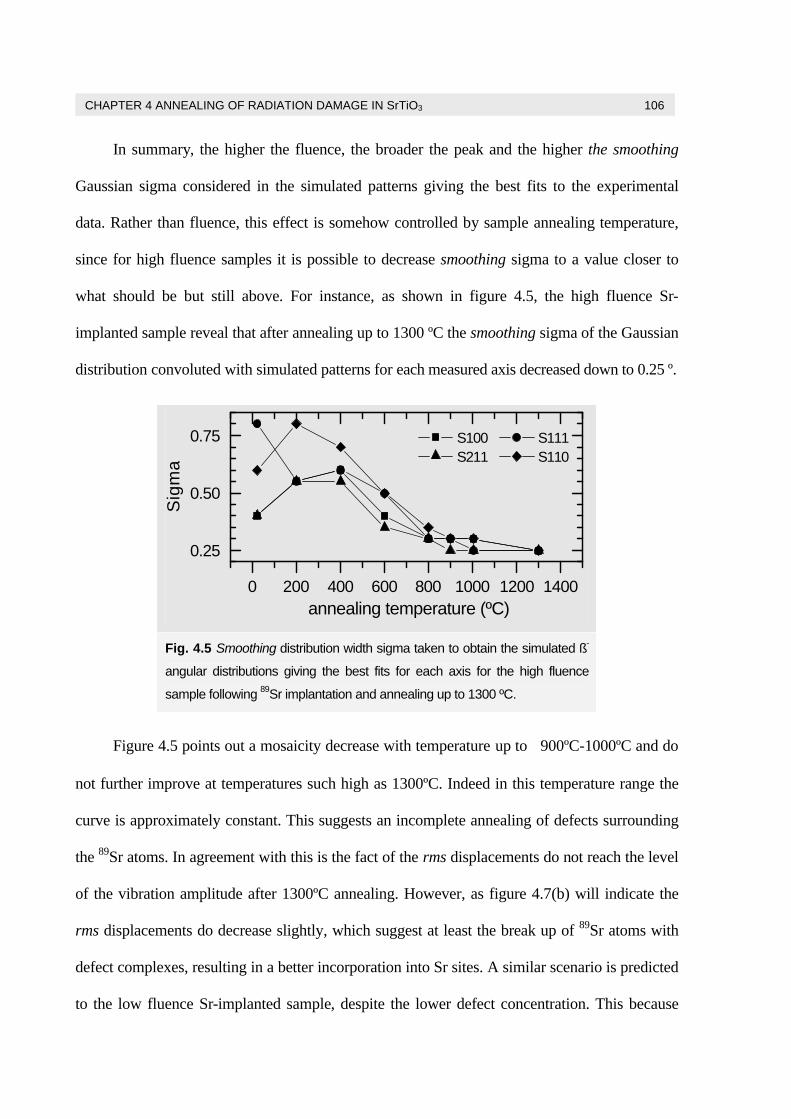
In summary, the higher the fluence, the broader the peak and the higher the smoothing
Gaussian sigma considered in the simulated patterns giving the best fits to the experimental
data. Rather than fluence, this effect is somehow controlled by sample annealing temperature,
since for high fluence samples it is possible to decrease smoothing sigma to a value closer to
what should be but still above. For instance, as shown in figure 4.5, the high fluence Sr-
implanted sample reveal that after annealing up to 1300 ºC the smoothing sigma of the Gaussian
distribution convoluted with simulated patterns for each measured axis decreased down to 0.25 º.
Figure 4.5 points out a mosaicity decrease with temperature up to ∼900ºC-1000ºC and do
not further improve at temperatures such high as 1300ºC. Indeed in this temperature range the
curve is approximately constant. This suggests an incomplete annealing of defects surrounding
the 89Sr atoms. In agreement with this is the fact of the rms displacements do not reach the level
of the vibration amplitude after 1300ºC annealing. However, as figure 4.7(b) will indicate the
rms displacements do decrease slightly, which suggest at least the break up of 89Sr atoms with
defect complexes, resulting in a better incorporation into Sr sites. A similar scenario is predicted
to the low fluence Sr-implanted sample, despite the lower defect concentration. This because
0 200 400 600 800 1000 1200 1400
0.25
0.50
0.75
annealing temperature (ºC)
Sig
ma
S100 S111 S211 S110
Fig. 4.5 Smoothing distribution width sigma taken to obtain the simulated ß-
angular distributions giving the best fits for each axis for the high fluence
sample following 89Sr implantation and annealing up to 1300 ºC.

CHAPTER 4 ANNEALING OF RADIATION DAMAGE IN SrTiO3 107
best fits were achieved to simulated yields smoothed with a Gaussian distribution of sigma of
0.02 º, which is higher than the angular resolution of 0.01º for undoped SrTiO3 samples.
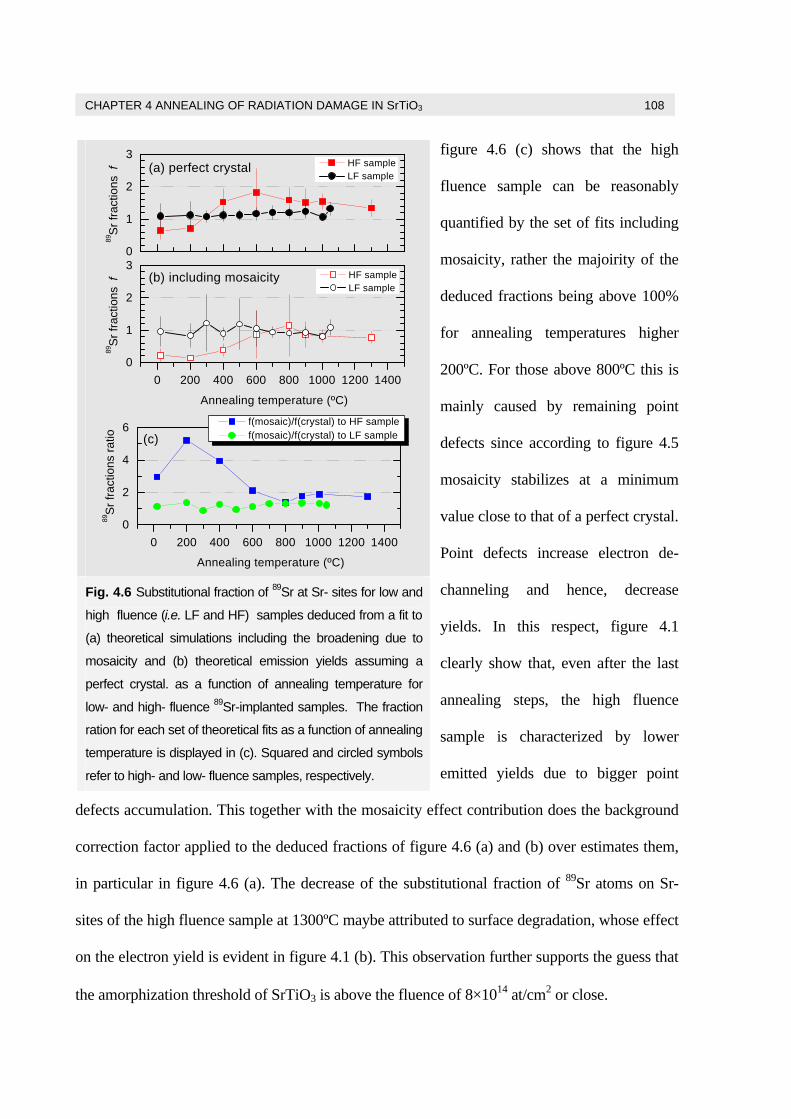
In order to check the influence of mosaicity in the quantification of the substitutional
fraction of 89Sr atoms in Sr sites as a function of annealing temperature, the fitting procedure
was performed with two sets of theoretical emission yields: one, including the mosaic
broadening, and other assuming a perfect crystal lattice. The deduced fractions of 89Sr from
each of the referred set of theoretical emission yields are shown in figure 4.6(a) and (b). Each of
these figures reveal that 89Sr atoms are all stable on substitutional Sr-sites of the low fluence
sample, following implantation and annealing up to 1050ºC, irrespectively of the chosen set of
theoretical emission yields. Furthermore, as can be seen in figure 4.6(a) and (b) each fitting
procedure resulted in slightly different substitutional 89Sr fraction, within experimental error
bars of about ∼20%. This demonstrates that SrTiO3 implanted to low fluences such as 2.5×10¹³
at/cm2 is marginally affected by the detected mosaic spread and that the broadening of the
experimental EC effects may be explained by the fitting procedure of figure 4.6 (a). On the
other hand, mosaic spread seem to have a detrimental effect on the Sr-substitutional fraction of
SrTiO3 implanted to a fluence of 8×10¹⁴ at/cm2 of 89Sr atoms. This clearly evidenced by the
blue curve shown in figure 4.6 (c) revealing the significant differences between the Sr
substitutional fractions found for both set of theoretical emission yields. These differences are
more pronounced for low annealing temperatures and are mainly due to mosaic spread and
point defects induced by ion implantation. The curve shown in
CHAPTER 4 ANNEALING OF RADIATION DAMAGE IN SrTiO3 108
figure 4.6 (c) shows that the high
fluence sample can be reasonably
quantified by the set of fits including
mosaicity, rather the majoirity of the
deduced fractions being above 100%
for annealing temperatures higher
200ºC. For those above 800ºC this is
mainly caused by remaining point
defects since according to figure 4.5
mosaicity stabilizes at a minimum
value close to that of a perfect crystal.
Point defects increase electron de-
channeling and hence, decrease
yields. In this respect, figure 4.1
clearly show that, even after the last
annealing steps, the high fluence
sample is characterized by lower
emitted yields due to bigger point
defects accumulation. This together with the mosaicity effect contribution does the background
correction factor applied to the deduced fractions of figure 4.6 (a) and (b) over estimates them,
in particular in figure 4.6 (a). The decrease of the substitutional fraction of 89Sr atoms on Sr-
sites of the high fluence sample at 1300ºC maybe attributed to surface degradation, whose effect
on the electron yield is evident in figure 4.1 (b). This observation further supports the guess that
the amorphization threshold of SrTiO3 is above the fluence of 8×10¹⁴ at/cm2 or close.
0
1
2
3
89S
r fra
ctio
ns f
HF sample LF sample
0 200 400 600 800 1000 1200 14000
1
2
3
Annealing temperature (ºC)
89S
r fra
ctio
ns f
HF sample LF sample
0 200 400 600 800 1000 1200 14000
2
4
6(c)
(b) including mosaicity
(a) perfect crystal
Annealing temperature (ºC)
89S
r fra
ctio
ns ra
tio
f(mosaic)/f(crystal) to HF sample f(mosaic)/f(crystal) to LF sample
Fig. 4.6 Substitutional fraction of 89Sr at Sr- sites for low and
high fluence (i.e. LF and HF) samples deduced from a fit to
(a) theoretical simulations including the broadening due to
mosaicity and (b) theoretical emission yields assuming a
perfect crystal. as a function of annealing temperature for
low- and high- fluence 89Sr-implanted samples. The fraction
ration for each set of theoretical fits as a function of annealing
temperature is displayed in (c). Squared and circled symbols
refer to high- and low- fluence samples, respectively.

CHAPTER 4 ANNEALING OF RADIATION DAMAGE IN SrTiO3 109
Accurate fractions may only be obtained by fitting a procedure that takes in account the
convolution of the theoretical emission yields with a smoothing width where WM may be well
known. It may be determined by X-ray diffraction measurements since this characterization
technique allows to quantify the size and the domain spread (tilt and twist) with respect to the
surface axis. This will be in fact an interesting point to address in future. For now, one can only
conclude that the sigma of the mosaicity distribution might be between 0.1º and 0.25º.
Finally, the best fits shown in figure 4.6(a) and (b) were obtained for rms displacements
ranging from ∼0.4º to ∼0.1º and ∼0.3º to ∼0.1º as can be seen in figure 4.7 (a) and (b). While the
accuracy of these values is limited as a result of the mosaic broadening, these can give an idea
of the size of the average displacements, in particular, to the low fluence sample after the
majority of annealing temperatures and, to the high fluence sample, at or above 1000 ºC. At this
temperature, the rms displacements perpendicular to all measured axes are stabilized to a
minimum value and are of the order of magnitude of those measured from impurity implanted
SrTiO3 EC studies, which did not reveal mosaicity.
0.0
0.2
0.4 <100> <111> <211> <110> <411>
u1(89
Sr)
[Å]
(a)
u1(89
Sr)
[Å]
u1(Ti)u1(Sr)
0 200 400 600 800 1000 12000.0
0.2
0.4 <100> <111> <211> <110>
(b)
u1(Ti)u1(Sr)
annealing temperature TA [°C]
Fig. 4.7 One dimensional rms displacements
perpendicular to the channeling axes, measured as
a function of annealing temperature for low- (a) and
high- (b) fluence samples. The dashed and dotted
lines correspond to the vibration amplitude of Sr and
Ti in SrTiO3, u1(Sr) = 0.077 Å and u2(Ti) = 0.06 Å.

CHAPTER 4 ANNEALING OF RADIATION DAMAGE IN SrTiO3 110
4.2 RBS: Crystalline quality
56Fe-implanted SrTiO3 samples to fluences of 1×1015 cm−2 and 5×1015 cm−2 were
subsequently implanted with 59Fe to fluences of 1×10¹⁴ and 1.9×10¹⁴ at/cm2 in order to study
sample’s crystalline quality following 900 ºC vacuum annealing by RBS/C. As reference, a
virgin and two 56Fe implanted samples to the same 1×10¹⁵ and 5×10¹⁵ at/cm2 fluence following
implantation were also characterized.
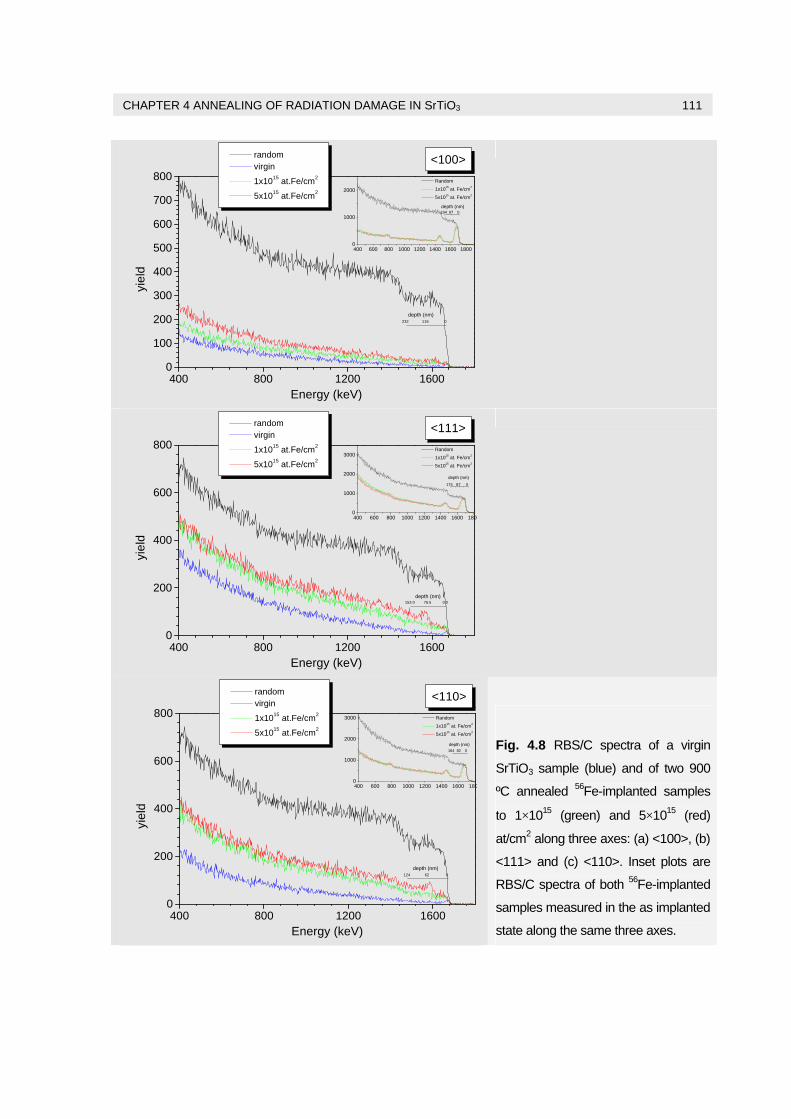
Figure 4.8 show from (a) to (c) the RBS/C spectra of the annealed 56Fe-implanted samples
taken along the <100> (perpendicular to the surface), <111> and <110> axes. In addition, the
aligned RBS/C spectra of a virgin sample and the random spectrum of the high-fluence sample
are also included in the plots of figure 4.8. The inset plots show the spectra of 56Fe-implanted
samples in the as implanted state. These spectra were acquired in chamber II, therefore have
different experimental parameters and are shown separately. Nevertheless, comparison of defect
distribution over depth on the Sr-sublattice among plots is possible, since the energy scale was
converted to a depth scale by means of the stopping power dxdE (see page 46).
The as-implanted RBS/C spectra of figure 4.8 illustrate the damage produced by the Fe
ions in the implanted layer. The overlap of aligned and random spectra taken from the samples
along the three measured crystalline axes indicates that the amorphization threshold is
somewhat below 1×10¹⁵ 56Fe at/cm2 at RT. The amorphized region in both samples also extends
to almost the same depth, ∼67 nm (averaged). A fluence five times higher only produces an
amorphized region ∼10 nm deeper.
CHAPTER 4 ANNEALING OF RADIATION DAMAGE IN SrTiO3 111
400 800 1200 16000
100
200
300
400
500
600
700
800
depth (nm)
depth (nm)
random virgin
1x10¹⁵ at.Fe/cm2
5x10¹⁵ at.Fe/cm2
<100>
yiel
d
Energy (keV)
400 600 800 1000 1200 1400 1600 18000
1000
2000
Random
1x10¹⁵ at. Fe/cm2
5x10¹⁵ at. Fe/cm2
232 116 0
194 97 0
400 800 1200 16000
200
400
600
800
depth (nm)
depth (nm)
random virgin
1x10¹⁵ at.Fe/cm2
5x10¹⁵ at.Fe/cm2
<111>
yiel
d
Energy (keV)
400 600 800 1000 1200 1400 1600 18000
1000
2000
3000 Random
1x10¹⁵ at. Fe/cm2
5x10¹⁵ at. Fe/cm2
153.0 76.5 0.0
174 87 0
400 800 1200 16000
200
400
600
800
depth (nm)
depth (nm)
random virgin
1x10¹⁵ at.Fe/cm2
5x10¹⁵ at.Fe/cm2
<110>
yiel
d
Energy (keV)
400 600 800 1000 1200 1400 1600 18000
1000
2000
3000 Random
1x10¹⁵ at. Fe/cm2
5x10¹⁵ at. Fe/cm2
124 62 0
164 82 0
Fig. 4.8 RBS/C spectra of a virgin
SrTiO3 sample (blue) and of two 900
ºC annealed 56Fe-implanted samples
to 1×10¹⁵ (green) and 5×10¹⁵ (red)
at/cm2 along three axes: (a) <100>, (b)
<111> and (c) <110>. Inset plots are
RBS/C spectra of both 56Fe-implanted
samples measured in the as implanted
state along the same three axes.

CHAPTER 4 ANNEALING OF RADIATION DAMAGE IN SrTiO3 112
The expected projected range and straggling of Fe ions in SrTiO3 according to Stopping
and Range of Ions in Matter (SRIM) 2003 code are 31 nm and 14 nm, respectively (with 8º of
incidence angle). Therefore, the Fe profile is placed inside the amorphized region.
The annealing at 900 ºC in vacuum produced significant recovery of crystallinity (the
minimum yield of SrTiO3 host decreased from ∼80% to ∼9% in the implanted region of both
fluence samples along the <100> axis). This behaviour was also observed along the other
directions on both samples. That is, the minimum yield of the substrate in the implanted region
of the lower fluence sample along the <111> and <110> directions decreased ∼84% and from
∼87%, to ∼13% and ∼11%, respectively. These values are ∼6% higher for the highest fluence
sample, which indicate slightly lower damage removal with thermal annealing on this sample.
Despite the fact that the minimum yield at the Sr damage peak decreases to values ∼10-18%
indicating significant recovery of the implantation damage, those values are still higher than for
the perfect crystal (∼2-3%). To interpret these differences, and in particular, to decrease them as
much as possible, further studies considering two higher annealing temperatures (1000 ºC and
1250 ºC) were performed. Only 1050 °C and 1250 °C annealing reduced the RBS/C minimum
yields to ~4% and ~2.5%, respectively, which is similar to those found in a virgin crystal
(~2%). It has been reported in the literature that amorphous SrTiO3 recrystallizes at a
temperature around 400 ºC-600 °C [2]. However, EC, RBS/C and PAC (see next section) have
shown that significantly higher temperatures (~1000 ºC-1300 °C) are needed in order to restore
the crystalline quality of the lattice to similar levels as in virgin crystals. This is in line with an
old semiconductor processing rule of thumb, known since 1970, stating that full lattice recovery
from implantation damage and electrical dopant activation are only achieved after annealing the
material at approximately 2/3 of its melting temperature Tmelt. Hence, according to it, and since
SrTiO3 melting temperature is 2080 °C = 2353 K, optimum annealing temperature would be
CHAPTER 4 ANNEALING OF RADIATION DAMAGE IN SrTiO3 113
expected around 1300 ºC. Although, SrTiO3 is an oxide and not a conventional semiconductor,
it also seems to follow the 2/3 Tmelt trend.
An overview of the minimum yields calculated from the RBS/C spectra and mentioned
during discussion is given in table 4.2. The width of the window used in the calculation was of
20 channels, meaning that was placed in the first 20 nm right below the surface.
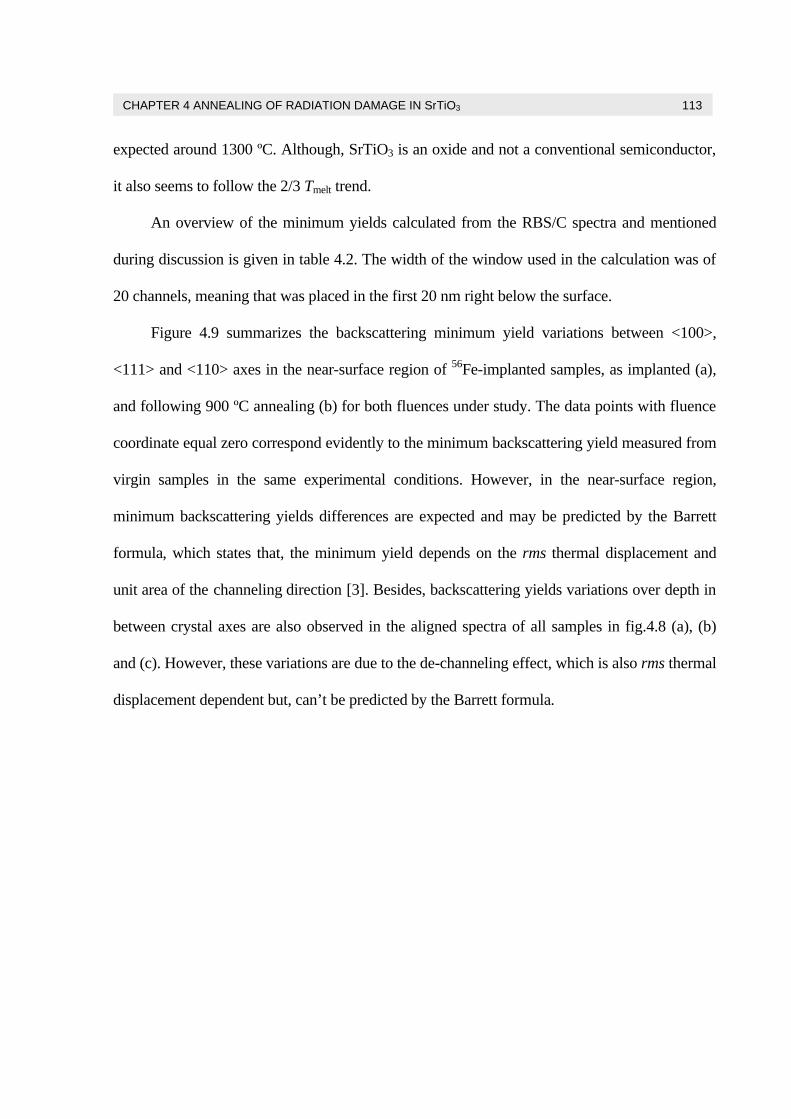
Figure 4.9 summarizes the backscattering minimum yield variations between <100>,
<111> and <110> axes in the near-surface region of 56Fe-implanted samples, as implanted (a),
and following 900 ºC annealing (b) for both fluences under study. The data points with fluence
coordinate equal zero correspond evidently to the minimum backscattering yield measured from
virgin samples in the same experimental conditions. However, in the near-surface region,
minimum backscattering yields differences are expected and may be predicted by the Barrett
formula, which states that, the minimum yield depends on the rms thermal displacement and
unit area of the channeling direction [3]. Besides, backscattering yields variations over depth in
between crystal axes are also observed in the aligned spectra of all samples in fig.4.8 (a), (b)
and (c). However, these variations are due to the de-channeling effect, which is also rms thermal
displacement dependent but, can’t be predicted by the Barrett formula.
CHAPTER 4 ANNEALING OF RADIATION DAMAGE IN SrTiO3 114
0
50
100
ANNEALED TO 900ºC
AS IMPLANTED
χ min (
%)
<100> <111> <110>
χ min (
%)
dose (at. Fe/cm2) [x1015]0 1 2 3 4 5 6
0
10
20
Fig. 4.9 2 MeV He+ RBS/C minimum yield χmin(Sr) along <100>, <111> and
<110> directions as a function of Fe- implanted sample fluence measured in
the as implanted state (a) and after 900ºC annealing (b).
Table 4.1: RBS/C minimum yields of virgin and 56Fe-
implanted SrTiO3 samples.
sample Axis expminχ
<100> 0.0208 <111> 0.0278 Virgin as
bought <110> 0.0245 <100> 0.8344 <111> 0.8370 as imp. <110> 0.8736 <100> 0.1005
<111> 0.1282
Implanted to 1×10¹⁵ at.
Fe/cm2 after 900ºC
annealing <110> 0.1048 <100> 0.7681 <111> 0.9134 as imp. <110> 0.9898 <100> 0.0823 <111> 0.1850
Implanted to 5×10¹⁵ at.
Fe/cm2 after 900ºC
annealing <110> 0.1769
CHAPTER 4 ANNEALING OF RADIATION DAMAGE IN SrTiO3 115
4.3 PAC: Recovery of point defects
SrTiO3 recovery of implantation damage and point defects were also studied using
perturbed angular correlation (PAC) of γ-rays. This technique was first applied to probe the
interaction of implanted 111Ag/111Cd (low fluence of 1×10¹³ at/cm2) with remaining defects on a
900 ºC annealed SrTiO3 sample, previously used in EC studies (see page 134). And secondly,
PAC was used with 111mCd implanted-probe (low dose of 1.5×10¹² at/cm2) into virgin and
2%Nb doped SrTiO3 single crystals in order to probe the electric field gradients (EFGs) to
which Cd atoms are subjected in as implanted and 1000 ºC annealed samples.
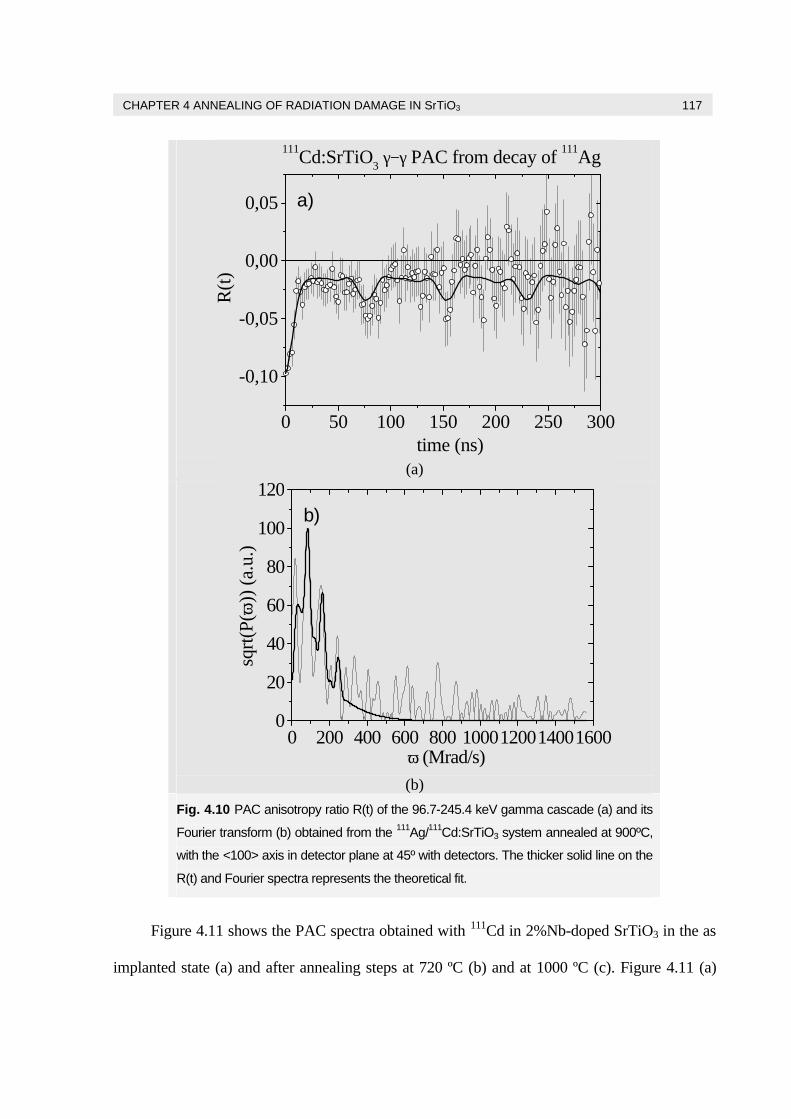
Figure 4.10 shows 111Ag/111Cd experimental time differential anisotropy, ( )tR , (a) and its
Fourier transform (b) spectra following 111Ag implantation into SrTiO3 and vacuum annealing
at 900ºC. The R(t) function shows a strong damping that reveals most of the 111Cd atoms to be
still interacting with defect distributions, with non-cubic local symmetry. Since the PAC
measurement is done on 111Cd, after the 111Ag decay, it should be discussed if the Cd is on the
same site as its precursor Ag atom. In fact, during decay the β- particles with end-point energy
of 1.03 MeV impart to the Cd atoms a recoil energy less than 5 eV, which is not enough to
create Frenkel pairs or move Cd atoms away from the Ag sites. Additionally, PAC experiments
with 111mCd/111Cd directly implanted in SrTiO3 revealed Cd atoms to occupy unique lattice
sites. Therefore the frequency distributions observed in this first experiment must depend on
111Ag/111Cd interaction with remaining defects. The 111mCd/111Cd PAC experiments have also
shown that the local environment of Cd atoms only recovers to almost perfect cubic symmetry
by annealing at 1000ºC, indicating that point defects do not completely recover at a lower
annealing temperature. In the case of 111Ag 20% of the Ag/Cd atoms interact with a well
defined EFG1, characterized by ω0 = 81.8 ± 1.0 MRad/s with a small asymmetry parameter, η =
CHAPTER 4 ANNEALING OF RADIATION DAMAGE IN SrTiO3 116
0.13 ± 0.02. This fraction value is consistent with that measured by EC studies. As will be
discussed in the next chapter, EC studies previously performed with this sample revealed that
upon annealing, near-Sr and near-Ti occupancies increased to 64% and 18%, while an
octahedral interstitial fraction vanished. Ag atoms on those near-substitutional sites are still
displaced by 0.2 Å from ideal cubic positions. Therefore, the comparison of PAC and EC
fractions suggests that 20% of Ag near Ti sites corresponds to the fraction of Ag experiencing
EFG1, revealing the presence of a specific defect in the AgTi neighborhood. The fact that the
remaining 80% of Cd atoms interact with a broad EFG distribution hints that both the Ag atoms
on near Sr sites as well as those on random sites are considerably influenced by nearby point
defects. Since, in contrast to AgTi, there is no evidence for a specific configuration that would
lead to a well defined EFG, i.e. a new characteristic frequency set in the PAC R(t) spectrum.
The aim of PAC studies of implanted 111mCd in stoichiometric SrTiO3 and 2%Nb-doped
SrTiO3 samples was twofold: (1) to study the damage recovery caused by the implantation, (2)
as well as the incorporation of the 111mCd probe atoms in both crystalline sub-lattices. While the
2%Nb-doped SrTiO3 sample was studied in the as implanted state and following two annealing
steps (720 ºC and 1000 ºC), the stoichiometric SrTiO3 sample was only studied following
1000 ºC annealing. The reason was that previous studies had shown SrTiO3 lattice recovery
only at that temperature or slightly above it.
CHAPTER 4 ANNEALING OF RADIATION DAMAGE IN SrTiO3 117
0 50 100 150 200 250 300
-0,10
-0,05
0,00
0,05 a)
111Cd:SrTiO3 γ−γ PAC from decay of 111Ag
R(t)
time (ns) (a)
0 200 400 600 800 10001200140016000
20
40
60
80
100
120b)
sqrt(
P(ω
)) (a
.u.)
ω (Mrad/s) (b)
Fig. 4.10 PAC anisotropy ratio R(t) of the 96.7-245.4 keV gamma cascade (a) and its
Fourier transform (b) obtained from the 111Ag/111Cd:SrTiO3 system annealed at 900ºC,
with the <100> axis in detector plane at 45º with detectors. The thicker solid line on the
R(t) and Fourier spectra represents the theoretical fit.
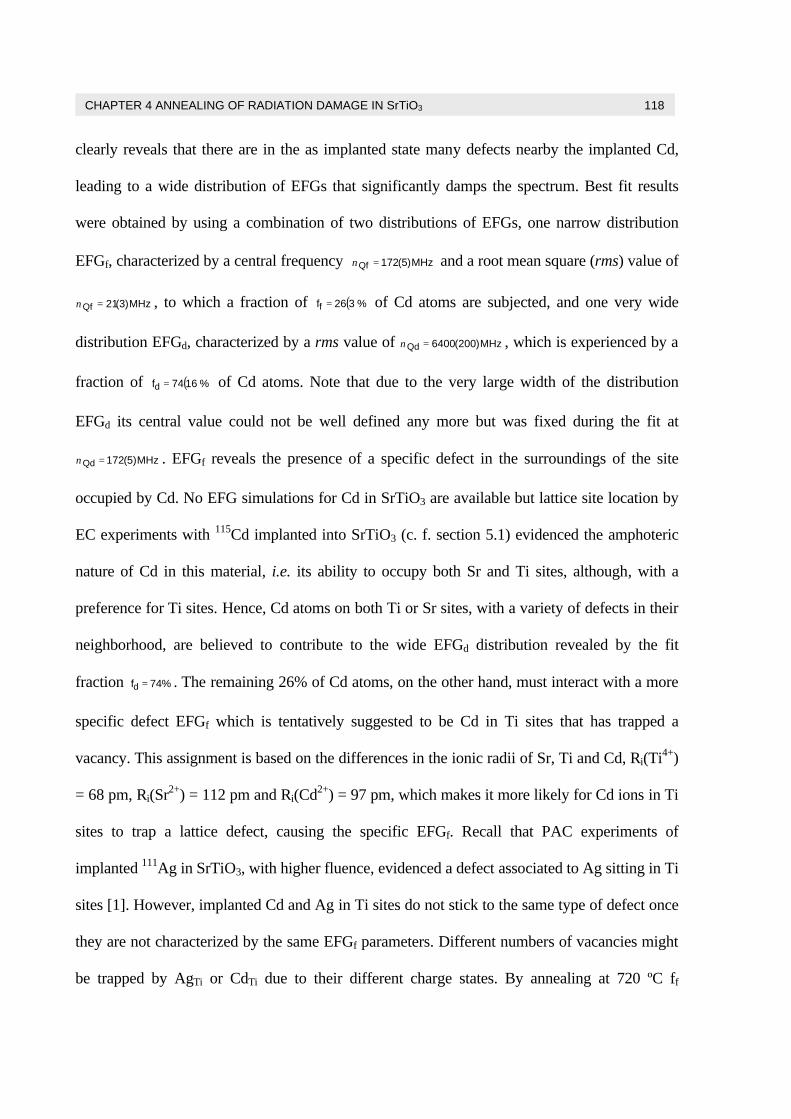
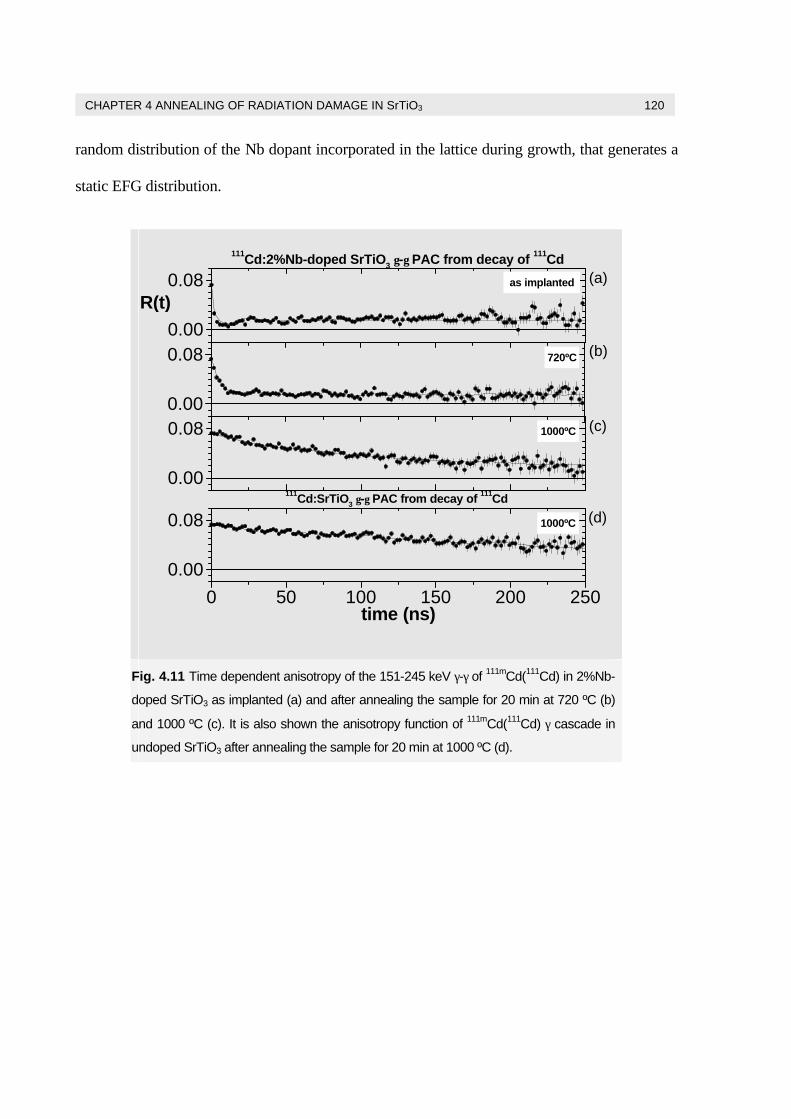
Figure 4.11 shows the PAC spectra obtained with 111Cd in 2%Nb-doped SrTiO3 in the as
implanted state (a) and after annealing steps at 720 ºC (b) and at 1000 ºC (c). Figure 4.11 (a)
CHAPTER 4 ANNEALING OF RADIATION DAMAGE IN SrTiO3 118
clearly reveals that there are in the as implanted state many defects nearby the implanted Cd,
leading to a wide distribution of EFGs that significantly damps the spectrum. Best fit results
were obtained by using a combination of two distributions of EFGs, one narrow distribution
EFGf, characterized by a central frequency MHz)5(172Qf =ν and a root mean square (rms) value of
MHz)3(21Qf =ν , to which a fraction of ( )%326ff = of Cd atoms are subjected, and one very wide
distribution EFGd, characterized by a rms value of MHz)200(6400Qd =ν , which is experienced by a
fraction of ( )%1674fd = of Cd atoms. Note that due to the very large width of the distribution
EFGd its central value could not be well defined any more but was fixed during the fit at
MHz)5(172Qd =ν . EFGf reveals the presence of a specific defect in the surroundings of the site
occupied by Cd. No EFG simulations for Cd in SrTiO3 are available but lattice site location by
EC experiments with 115Cd implanted into SrTiO3 (c. f. section 5.1) evidenced the amphoteric
nature of Cd in this material, i.e. its ability to occupy both Sr and Ti sites, although, with a
preference for Ti sites. Hence, Cd atoms on both Ti or Sr sites, with a variety of defects in their
neighborhood, are believed to contribute to the wide EFGd distribution revealed by the fit
fraction %74fd = . The remaining 26% of Cd atoms, on the other hand, must interact with a more
specific defect EFGf which is tentatively suggested to be Cd in Ti sites that has trapped a
vacancy. This assignment is based on the differences in the ionic radii of Sr, Ti and Cd, Ri(Ti4+)
= 68 pm, Ri(Sr2+) = 112 pm and Ri(Cd2+) = 97 pm, which makes it more likely for Cd ions in Ti
sites to trap a lattice defect, causing the specific EFGf. Recall that PAC experiments of
implanted 111Ag in SrTiO3, with higher fluence, evidenced a defect associated to Ag sitting in Ti
sites [1]. However, implanted Cd and Ag in Ti sites do not stick to the same type of defect once
they are not characterized by the same EFGf parameters. Different numbers of vacancies might
be trapped by AgTi or CdTi due to their different charge states. By annealing at 720 ºC ff
CHAPTER 4 ANNEALING OF RADIATION DAMAGE IN SrTiO3 119
decreases to 14(3) % and then completely vanishes by further annealing to 1000 ºC.
Simultaneously, the annealing led to the gradual recovery of the Cd environment as can be seen
by the decrease of the damping of the PAC spectra in figures 4.11 (b) and (c). After annealing at
1000 ºC, most of the Cd atoms interact with a smooth EFG distribution centered at a rather low
central frequency ( )MHz63.2NbQc
=ν with rms ( )MHz46.8NbQc
=σ . In figure 4.11 (d) the R(t) function
measured on undoped SrTiO3 after annealing at 1000 ºC is shown. The best fit was achieved by
considering )%2(95fuc = of the Cd atoms interacting with a narrow distribution of the EFGs
centered at MHz)5(08.2uQc
=ν with rms ( )MHz17.1uQc
=σ . The rest of the atoms interact with the same
specific EFGf found for the 2% Nb-doped SrTiO3 system. Since in a cubic lattice, EFGs should
vanish by symmetry reasons, one concludes that in the last annealing step Cd was mostly
incorporated in regular lattice sites, within a reconstructed lattice. Still, notice the fact that uQc
ν is
very small, but not vanishing as would be for ideal sites of perfect cubic symmetry. This small
value hints at local relaxation of the lattice atoms around the Cd impurity in Nb-doped and
undoped samples, thus, inducing a small local deviation from cubic symmetry. In what concerns
the remaining damping/rms contribution in the undoped sample, as measured at RT after
annealing at 1000 ºC, it cannot be said if that originates from one (or both) of the following
effects: a) from a still remaining low density of defects, which are static at RT, or, b) from local
dynamic – temperature dependent – vibrations or electronic state transitions of the Cd ions. A
probe element that has its local environment changing with time, within different charge
distributions can produce damped spectra when ever the frequency rates are comparable with
the time range of the PAC analysis (the half-life of the probing state). In future experiments this
can be learned by studying the rms values as a function of measuring temperature. For the
doped sample, however, with much larger rms value, a major contribution results from the
CHAPTER 4 ANNEALING OF RADIATION DAMAGE IN SrTiO3 120
random distribution of the Nb dopant incorporated in the lattice during growth, that generates a
static EFG distribution.
0 50 100 150 200 2500.00
0.08
time (ns)
0.00
0.08
111Cd:2%Nb-doped SrTiO3 γ-γ PAC from decay of 111Cd
111Cd:SrTiO3 γ-γ PAC from decay of 111Cd
1000ºC
1000ºC
(c)
(b)
(d)
(a)
0.00
0.08 720ºC
R(t)
0.00
0.08 as implanted
Fig. 4.11 Time dependent anisotropy of the 151-245 keV γ-γ of 111mCd(111Cd) in 2%Nb-
doped SrTiO3 as implanted (a) and after annealing the sample for 20 min at 720 ºC (b)
and 1000 ºC (c). It is also shown the anisotropy function of 111mCd(111Cd) γ cascade in
undoped SrTiO3 after annealing the sample for 20 min at 1000 ºC (d).

CHAPTER 4 ANNEALING OF RADIATION DAMAGE IN SrTiO3 121
4.4 Conclusion
The main objective of this chapter was to investigate the annealing of implantation
induced damage to the SrTiO3 lattice by means of EC, RBS/C and PAC using different probes
and fluences. The main conclusions based on the findings of the research carried out by EC,
RBS/C and PAC characterization techniques are summarized in the table 4.3. By triangulation
one may conclude that:
1. Negligible influence of damage in site location for low fluences: ions fully substitute.
2. Amorphization threshold lays close to 8×1014 cm-2 possibly at 1015 cm-2.
3. Annealing of implantation damage begins being effective only above 800-900 ºC. Total
recovery only occurs at temperatures equal or above 1000-1300 ºC depending on the
implanted ions and implantation fluence.
4. Residual damage, after ion implantation, happens close to meltT32 .
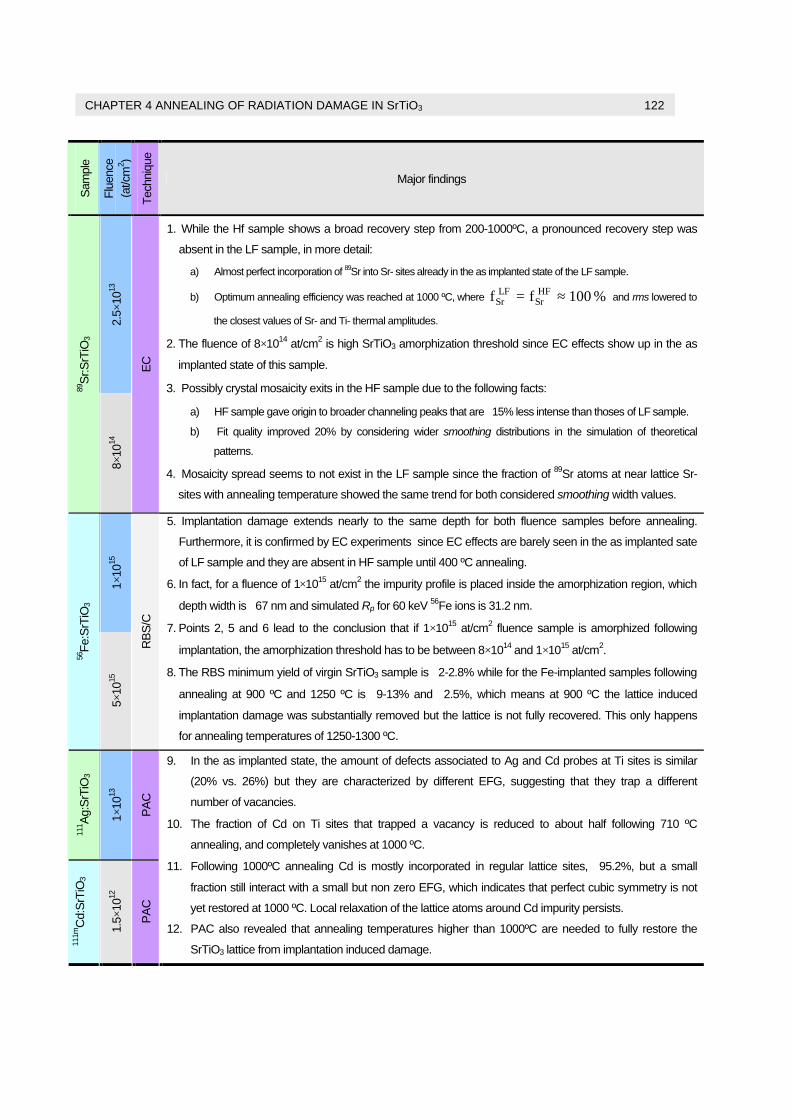
CHAPTER 4 ANNEALING OF RADIATION DAMAGE IN SrTiO3 122
Sam
ple
Flue
nce
(a
t/cm
2 )
Tech
niqu
e
Major findings
2.5×
1013
89S
r:SrT
iO3
8×10
14
EC
1. While the Hf sample shows a broad recovery step from 200-1000ºC, a pronounced recovery step was
absent in the LF sample, in more detail:
a) Almost perfect incorporation of 89Sr into Sr- sites already in the as implanted state of the LF sample.
b) Optimum annealing efficiency was reached at 1000 ºC, where %100ff HFSr
LFSr ≈= and rms lowered to
the closest values of Sr- and Ti- thermal amplitudes.
2. The fluence of 8×10¹⁴ at/cm2 is high SrTiO3 amorphization threshold since EC effects show up in the as
implanted state of this sample.
3. Possibly crystal mosaicity exits in the HF sample due to the following facts:
a) HF sample gave origin to broader channeling peaks that are ∼15% less intense than thoses of LF sample.
b) Fit quality improved 20% by considering wider smoothing distributions in the simulation of theoretical
patterns.
4. Mosaicity spread seems to not exist in the LF sample since the fraction of 89Sr atoms at near lattice Sr-
sites with annealing temperature showed the same trend for both considered smoothing width values.
1×10
15
56Fe
:SrT
iO3
5×10
15
RB
S/C
5. Implantation damage extends nearly to the same depth for both fluence samples before annealing.
Furthermore, it is confirmed by EC experiments since EC effects are barely seen in the as implanted sate
of LF sample and they are absent in HF sample until 400 ºC annealing.
6. In fact, for a fluence of 1×10¹⁵ at/cm2 the impurity profile is placed inside the amorphization region, which
depth width is ∼67 nm and simulated Rp for 60 keV 56Fe ions is 31.2 nm.
7. Points 2, 5 and 6 lead to the conclusion that if 1×10¹⁵ at/cm2 fluence sample is amorphized following
implantation, the amorphization threshold has to be between 8×10¹⁴ and 1×10¹⁵ at/cm2.
8. The RBS minimum yield of virgin SrTiO3 sample is ∼2-2.8% while for the Fe-implanted samples following
annealing at 900 ºC and 1250 ºC is ∼9-13% and ∼2.5%, which means at 900 ºC the lattice induced
implantation damage was substantially removed but the lattice is not fully recovered. This only happens
for annealing temperatures of 1250-1300 ºC.
111 A
g:S
rTiO
3
1×10
13
PA
C
111m
Cd:
SrT
iO3
1.5×
1012
PA
C
9. In the as implanted state, the amount of defects associated to Ag and Cd probes at Ti sites is similar
(20% vs. 26%) but they are characterized by different EFG, suggesting that they trap a different
number of vacancies.
10. The fraction of Cd on Ti sites that trapped a vacancy is reduced to about half following 710 ºC
annealing, and completely vanishes at 1000 ºC.
11. Following 1000ºC annealing Cd is mostly incorporated in regular lattice sites, ∼95.2%, but a small
fraction still interact with a small but non zero EFG, which indicates that perfect cubic symmetry is not
yet restored at 1000 ºC. Local relaxation of the lattice atoms around Cd impurity persists.
12. PAC also revealed that annealing temperatures higher than 1000ºC are needed to fully restore the
SrTiO3 lattice from implantation induced damage.

CHAPTER 4 ANNEALING OF RADIATION DAMAGE IN SrTiO3 123
References
[1] A. C. MARQUES, U. WAHL, J. G. CORREIA, E. RITA, J. C. SOARES, Nucl. Instr. Meth. B 249 (2006) 882–885.
[2] C. W. WHITE, L. A. BOATNER, P. S. SKLAD, C. J. MCHARGUE, J. RANKIN, G. C. FARLOW, M. J. AZIZ, Nucl. Instr. and Meth. B
32 (1988) 11.
[3] JOHN H. BARRETT, Phys. Rev. B, vol. 3, issue 5, pp. 1527-1547.


![ALINE DO NASCIMENTO RODRIGUES€¦ · Figura 17-Imagem térmica da estrutura monocristalina SrTiO 3 dopada com Cr sob forma da estrutura planar Pt/SrTiO 3 /Pt [53]..... 48 Figura](https://img.pdfslide.net/doc/110x75/606f11164f45027ef53763d3/aline-do-nascimento-rodrigues-figura-17-imagem-trmica-da-estrutura-monocristalina.jpg)


![From Lattice Boltzmann Method to Lattice Boltzmann Flux … · From Lattice Boltzmann Method to Lattice Boltzmann Flux Solver Yan Wang 1, ... flows [8,13–15], compressible flows](https://img.pdfslide.net/doc/110x75/5cadf91b88c9938f4d8c0cd6/from-lattice-boltzmann-method-to-lattice-boltzmann-flux-from-lattice-boltzmann.jpg)