Embed Size (px)
Citation preview

4.1 Winds au
Qinmuau (tind direction)
MT103 8 7
(1 knot = 1.85 n.u/zr.li FI%I,~;I~I'U wtiu'la~a;irrm,lu.a,)
1 IuI;M'.La (nautical mile) = 1.15 lu&n
= 1.85 n.u
P 4 v2 (P = naiuhirali , v = R7111 t5aau)
~ws~x~:~u P = Kv2 (da K = m'md )
r&l K = 0.004, P = 0.004 v2
;I v fGlLi% bJa/u.u P %B&rChA IJuun/Pr5.*
un#laa&o,& doma~ui%aautvi~fk 60 lui/u.u n,)~utiuuouaun'?ua~lmiiuUk
p = 0.004 (60)2 = 14.4 lklu~jns. *
88 MT103
MT 103 8 9
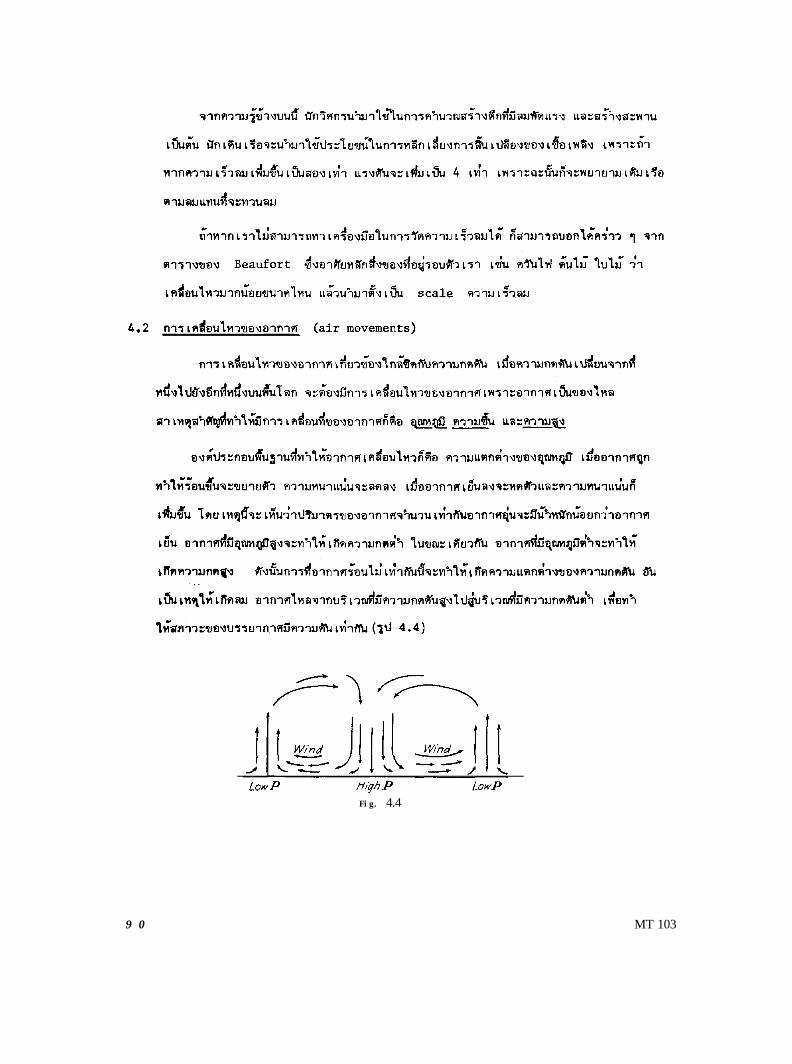
Fig. 4.4
9 0 MT 103

MT 103 91

L&J Isobars ua:: Pressure Gradients
1wb.n and Prsrwn Gmdient.
92 MT 103

MT 103 9 3

Gradient wind
(a) (b)
9 4 MT 103

HIGH PRESSURE
d .’I.#& 1005 Ub
-999 Yb
Figure4 .ll(Left) Wind velocitiesaround low- and high-pressure an-ten near the ground in the NorthernHemisphere when frictional forces.F, arc important. The etTect of fric-tion is to reduce wind speed andcause a deviation of the uind towardlower pressure. As a result, air blowsinto low-pressure centers and out ofhigh-pressure centers.
MT103 95

Sigure4.13 Simplified schemata representation of the general circulation of the atmo-sphere .
9 6 MT 103

MT103 9 7

subtropical high (lat 30'-40") LKGBU easterlies duflwmd~7an ni'lGri?n
WY cyclonic n% low luau westerlies, a"ln-7uau easterlies l3J L iiwnd
l&m polar high ~uLKrn-57nnl5~~910\107n7lmquS-~u~~\ru" N &Tan
P o l a r hiqhFig.4.12 The ideal primary or kwesrrial pressure and wind sysmns
9 8 MT 103

MT103 9 9

-d--
A
Figure~.l&4veraSe sea-level winds and pressures (isobars in millibars exceeding 1000 mb)over the earth in (A) January and (B) July. The heavy solid line is the intertropical conver-gence. ZOIE. From Introduction IO the Atmosphere by Herbert Rishl. Copyright 1972. Usedwith permission of McGraw-Hil l Book Company.
1 0 0 MT 103

MT103 101

A S
Figure 4.15 July wind tit eulation: A,polar highs: B, tropical highs.
A SA S
Figure 4.16 January windcimularwm: A, polar highs; B trupicalhighs.
1 0 2

MT 103 103

1 0 4 MT 103

105

~uun (Land breeze)
1 0 6 MT103

au~~~lqua;a~~ (Moubtain a n d V a l l e y b r e e z e s )-
Fig.4.23 Principle of the mountain and valley breezes
MT 103 1 0 7

1 0 8 MT103

fig. 4.24 Prinupal au maser and source regmnr of Ihe world
MT 103 1 0 9

1 1 0 MT 103

MT 103 1 1 1
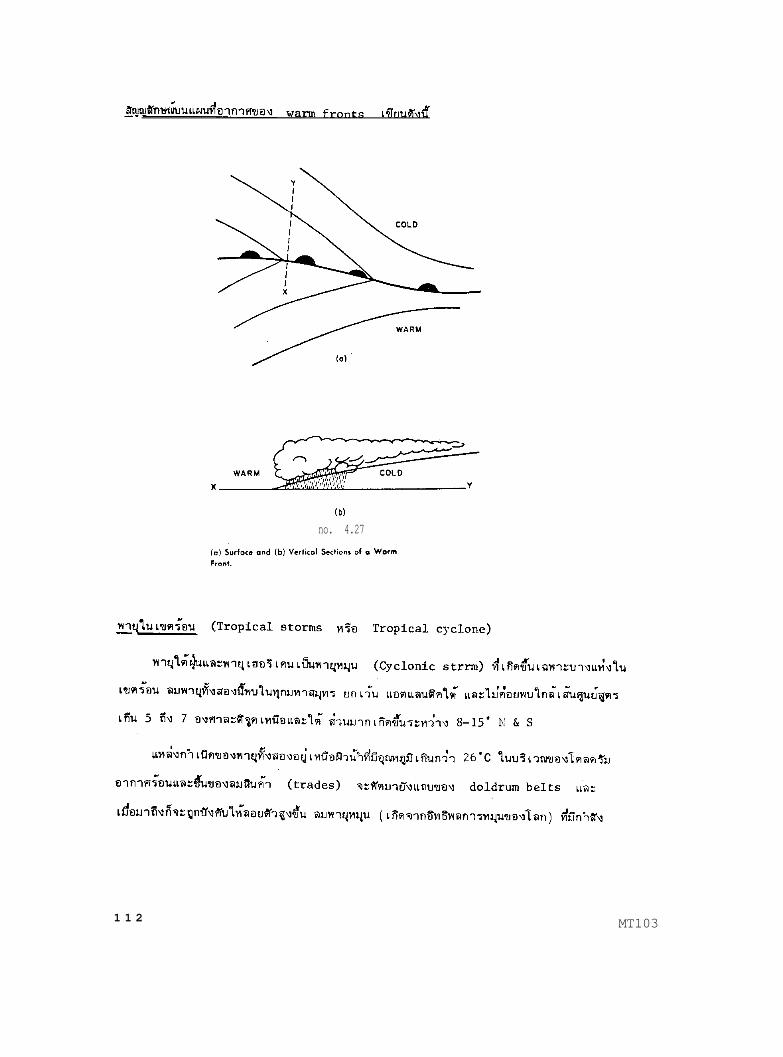
Cb)
no. 4.27
1 1 2 MT103

A diagram of o tropical cyclone,showing rmn area. wind, and the eye of the storm.
MT103 1 1 3

Flgwe4.29Schematic cross sectionshowing temperature distribution andair motions in a mature hurricane.The heavy solid lines show theboundaries of the eye. Based on omodel by E. Palmen.
Hurr icane model
L e f t s i d e R i g h t s i d e1 2 3 4 5 6 7
(Primary energy-cell 111 Convective clouds(“Hot towers”)
&$ Altostratus WKh Cirrus
flS. 4.30 Hurricane model. The primary energy cell (convective chimney) islocated in the area enclosed by the broken line. After Project Stormlury. 1965 An-nual Report, ESSA et al.
1 1 4 MT 103

MT 103 1 1 5

ni-dudfwnq?RlcJu tads twm@uui&a twmr&km75~wai 19x1 t=&&kZhtt3 A,B,C..,
t& A n n a , B e t s y , C a r l a , D e b b i e . . . t&J&
ngno4;1Tn
1 1 6 MT 103

Fig. 4.32 Sketch of a tornado thunderstorm. Courtesy J. R Fulks. Repon No. 4.NBtional Severe Storms Pro ject , U.S. Weather Bureau.
MT 1031 1 7

1 1 8 MT 103

A
00 RAIN + SNOW o ICE CRY.5
B c
MT103

PrfInd 3 Frontal thunderstorm ~Fin~lnuuxl~nxnnin duln;la’i7uirr&
1 2 0 MT103