Embed Size (px)
Citation preview
DECEMBER 12, 2014
DISHWASHER TEMPERATURE CONTROL 2013 DATA
JAMES LARSON SUBMITTED TO DR. W. ROBERT STEPHENSON
DISHWASHER TEMPERATURE CONTROL SUMMARY 12/12/2014
JAMES LARSON 1
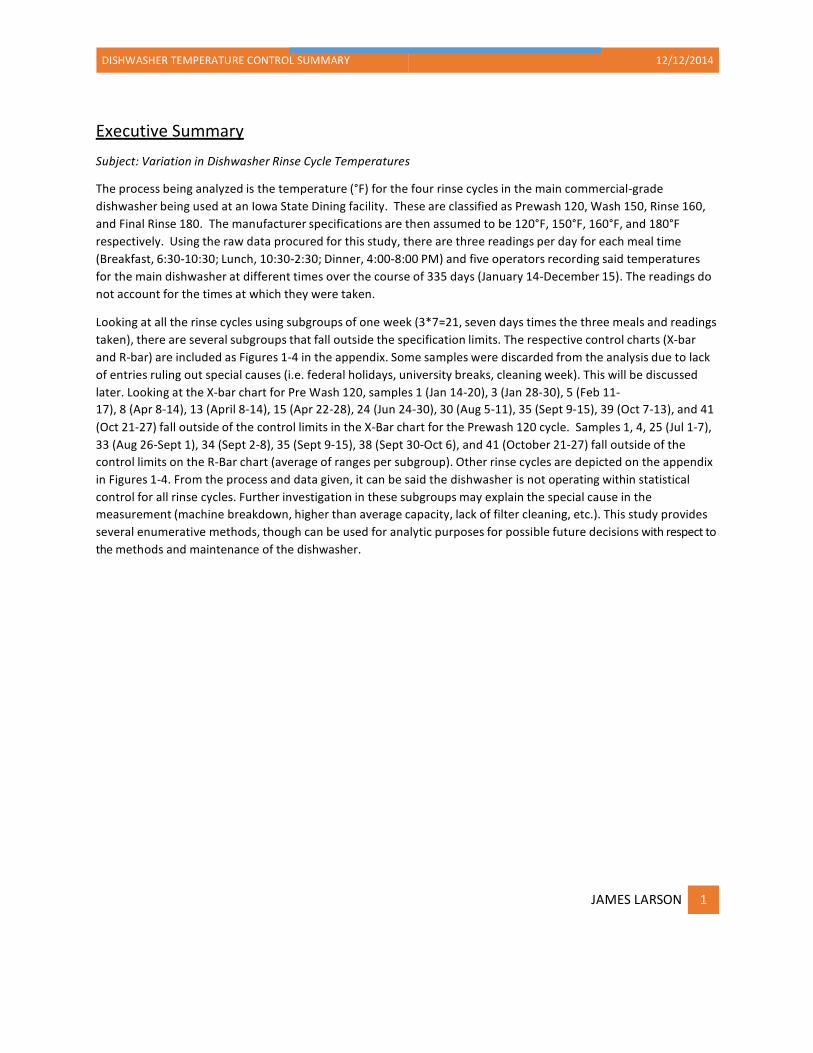
Executive Summary Subject: Variation in Dishwasher Rinse Cycle Temperatures
The process being analyzed is the temperature (°F) for the four rinse cycles in the main commercial-‐grade dishwasher being used at an Iowa State Dining facility. These are classified as Prewash 120, Wash 150, Rinse 160, and Final Rinse 180. The manufacturer specifications are then assumed to be 120°F, 150°F, 160°F, and 180°F respectively. Using the raw data procured for this study, there are three readings per day for each meal time (Breakfast, 6:30-‐10:30; Lunch, 10:30-‐2:30; Dinner, 4:00-‐8:00 PM) and five operators recording said temperatures for the main dishwasher at different times over the course of 335 days (January 14-‐December 15). The readings do not account for the times at which they were taken.
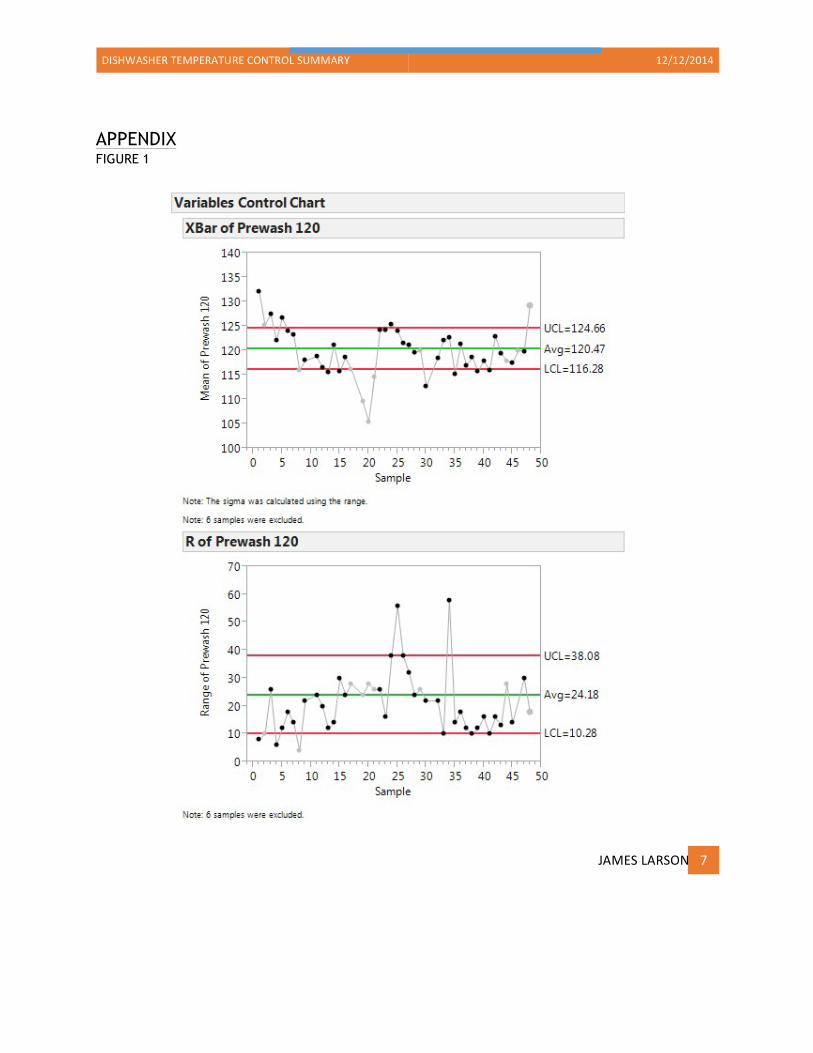
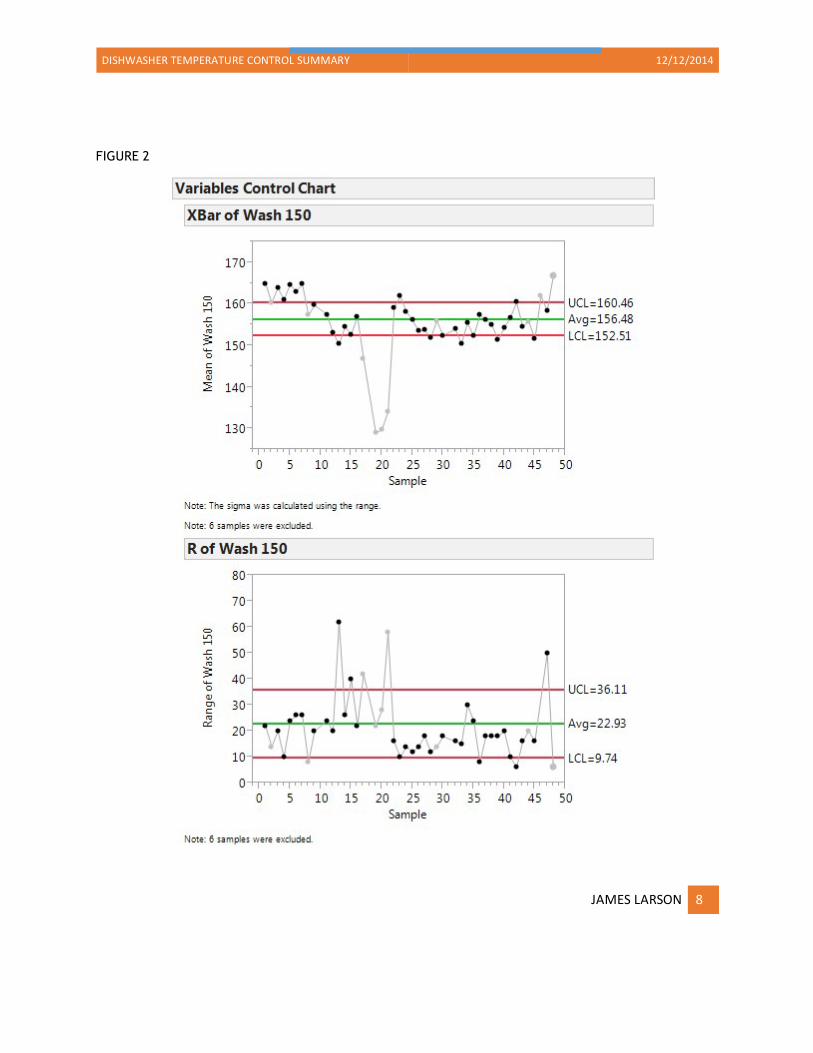
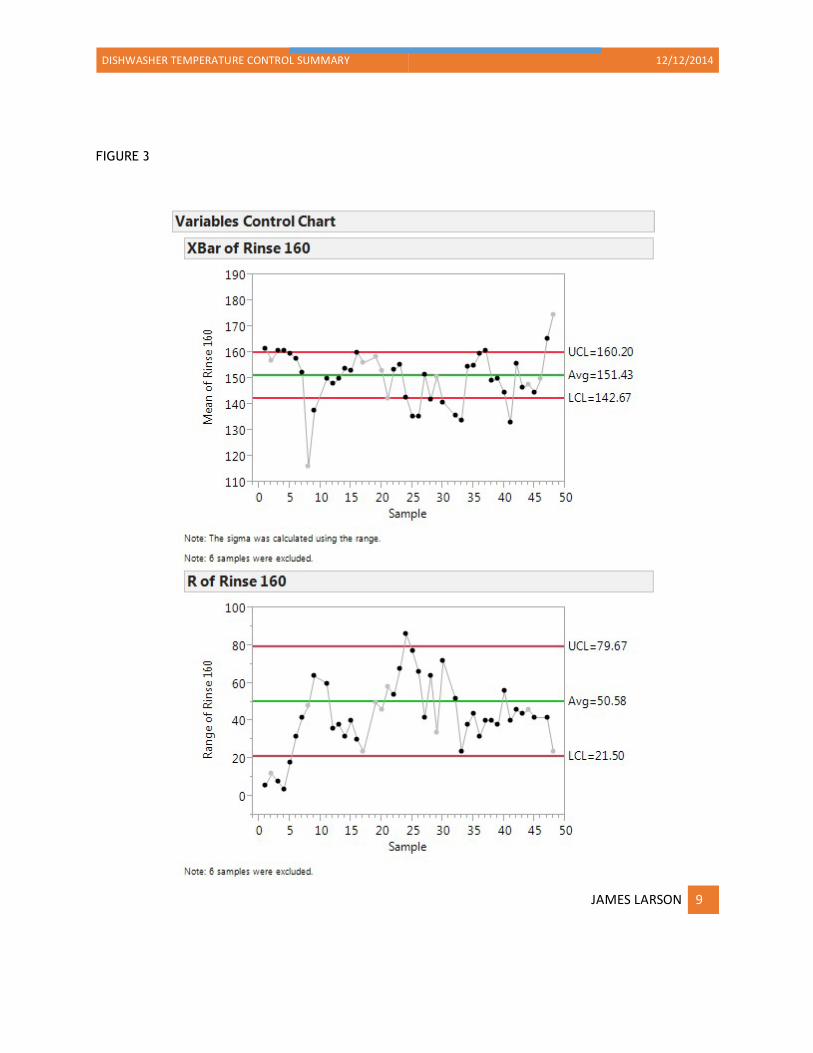
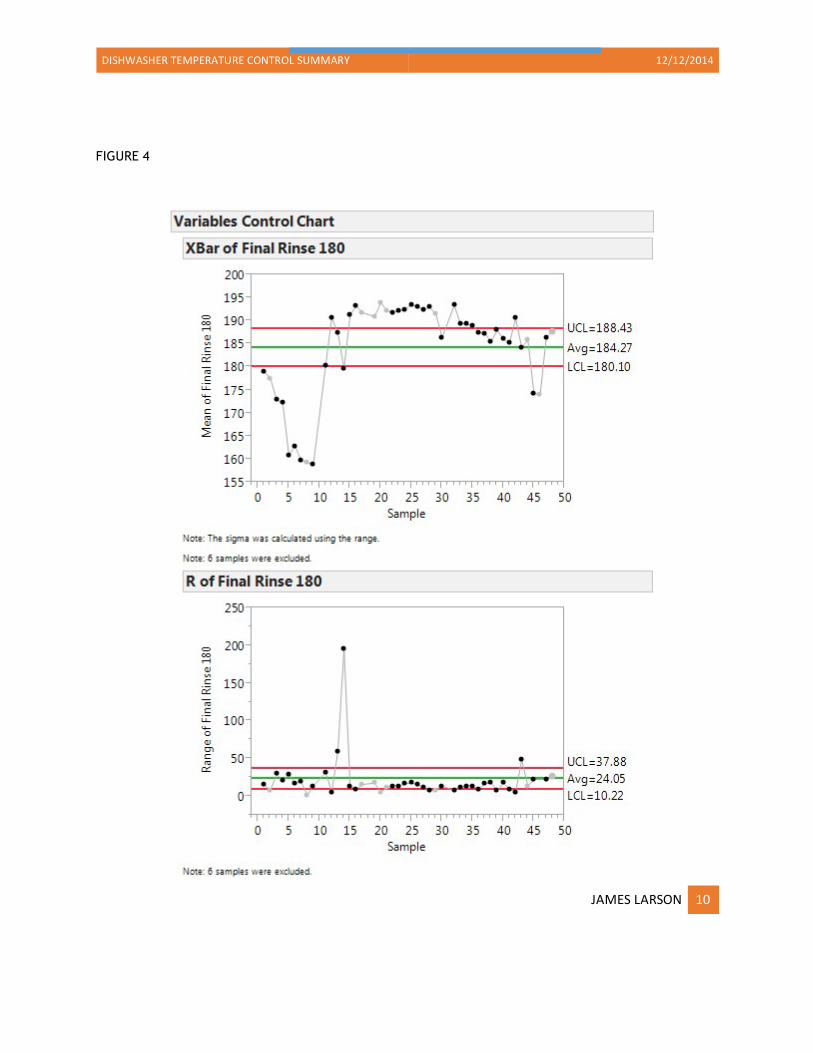
Looking at all the rinse cycles using subgroups of one week (3*7=21, seven days times the three meals and readings taken), there are several subgroups that fall outside the specification limits. The respective control charts (X-‐bar and R-‐bar) are included as Figures 1-‐4 in the appendix. Some samples were discarded from the analysis due to lack of entries ruling out special causes (i.e. federal holidays, university breaks, cleaning week). This will be discussed later. Looking at the X-‐bar chart for Pre Wash 120, samples 1 (Jan 14-‐20), 3 (Jan 28-‐30), 5 (Feb 11-‐ 17), 8 (Apr 8-‐14), 13 (April 8-‐14), 15 (Apr 22-‐28), 24 (Jun 24-‐30), 30 (Aug 5-‐11), 35 (Sept 9-‐15), 39 (Oct 7-‐13), and 41 (Oct 21-‐27) fall outside of the control limits in the X-‐Bar chart for the Prewash 120 cycle. Samples 1, 4, 25 (Jul 1-‐7), 33 (Aug 26-‐Sept 1), 34 (Sept 2-‐8), 35 (Sept 9-‐15), 38 (Sept 30-‐Oct 6), and 41 (October 21-‐27) fall outside of the control limits on the R-‐Bar chart (average of ranges per subgroup). Other rinse cycles are depicted on the appendix in Figures 1-‐4. From the process and data given, it can be said the dishwasher is not operating within statistical control for all rinse cycles. Further investigation in these subgroups may explain the special cause in the measurement (machine breakdown, higher than average capacity, lack of filter cleaning, etc.). This study provides several enumerative methods, though can be used for analytic purposes for possible future decisions with respect to the methods and maintenance of the dishwasher.
DISHWASHER TEMPERATURE CONTROL SUMMARY 12/12/2014
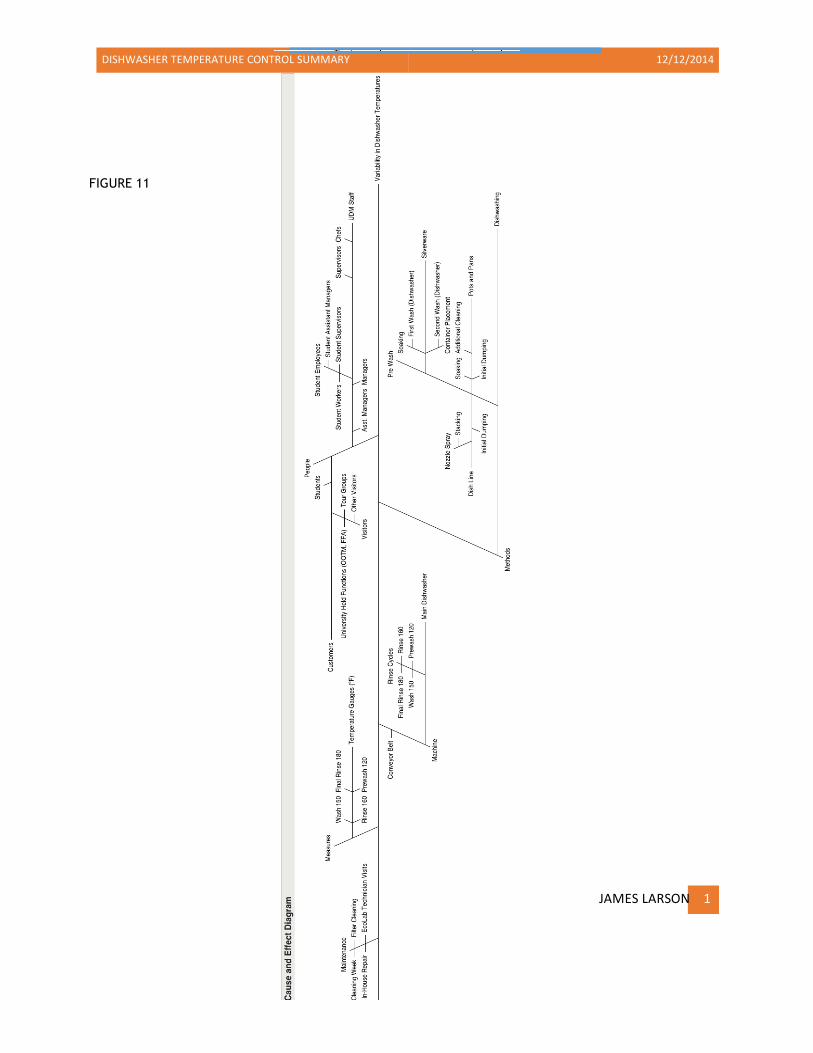
*The overall process diagram is included in the Appendix under Figure 11 JAMES LARSON 2
Variability of Dishwasher Temperatures
People The people involved in the process are the several dining facility staff and student staff, including but not limited to student workers, student supervisors, and student assistant managers. Non-‐student staff includes the managers, chefs, and non-‐student supervisors within the facility.
Process*
The washing of dishes begins with the source of the used dishes and what type was used. Certain dishes (bulk plates/bowls, metal serving/prep pans and pan covers, silverware, plastic trays/containers/lids, plastic/ceramic cups) are sent through the main dishwasher after being pre washed on either the belt line or the “Pots and Pans” section of the dish room. When used dishes are sent via the conveyor belt (belt line), the dishes are first dumped of excess food matter in compost bins; afterwards, they are sent via the belt to a series of spray nozzles where they are then further cleaned by either student workers or supervisors (depending on staffing that day) and sent via another conveyor belt to the dishwasher. These dishes are then placed in their respective containers (bulk dish carts) or place of origin (Back of House, other venues)
Metal serving/prep pans and plastic trays/containers are taken to Pots and Pans where they are first rid of excess food matter and sprayed by a separate nozzle apparatus; the pan is then set to soak in a large sink of warm, soapy water to loosen the remaining/burned matter and is cleaned further before being sent to the main dishwasher. When these are put through the dishwasher cycles, they are shelved close-‐by before being placed in their place of origin (Back of House or other venue)
Silverware is deposited through chutes above the main conveyor belt entering the dish room. The silverware is soaked in a cleaning agent before being sent through the dishwasher for an initial cleaning. The silverware is then organized into round containers for each type of silverware (forks, knives, spoons) and sent through the dishwasher again.
Cooking utensils (knives, spatulas, etc.), metal sheet trays used (often from another dining facility), and other metal dishes are sent through a different dishwasher denoted as “Pots and Pans”.
Maintenance
The maintenance of the dishwasher typically occurs once per shift by one or several student workers or a supervisor, though this varies depending on new student staffing inflows and student/visitor traffic and facility capacity at a given time. Each rinse cycle has a filter; the water for each is first drained one at a time before each filter has its contents dumped and sprayed out to remove other excess food matter.
Measurement
Dishwasher rinse cycle temperatures are read from gauges on the side of the in degrees Fahrenheit (ºF). A measurement is logged during one mealtime per day with three meals per day (hence three readings a day). Five operators took three readings per day (21 readings a week, the subgroup used) at several different times (i.e. 370 of the 1005 readings are from Operator 1, while 8 are from Operator 5). These operators are typically the non-‐student supervisors during the respective meal times.
DISHWASHER TEMPERATURE CONTROL SUMMARY 12/12/2014
JAMES LARSON 3
Further Quantitative Results
Data Log Issues
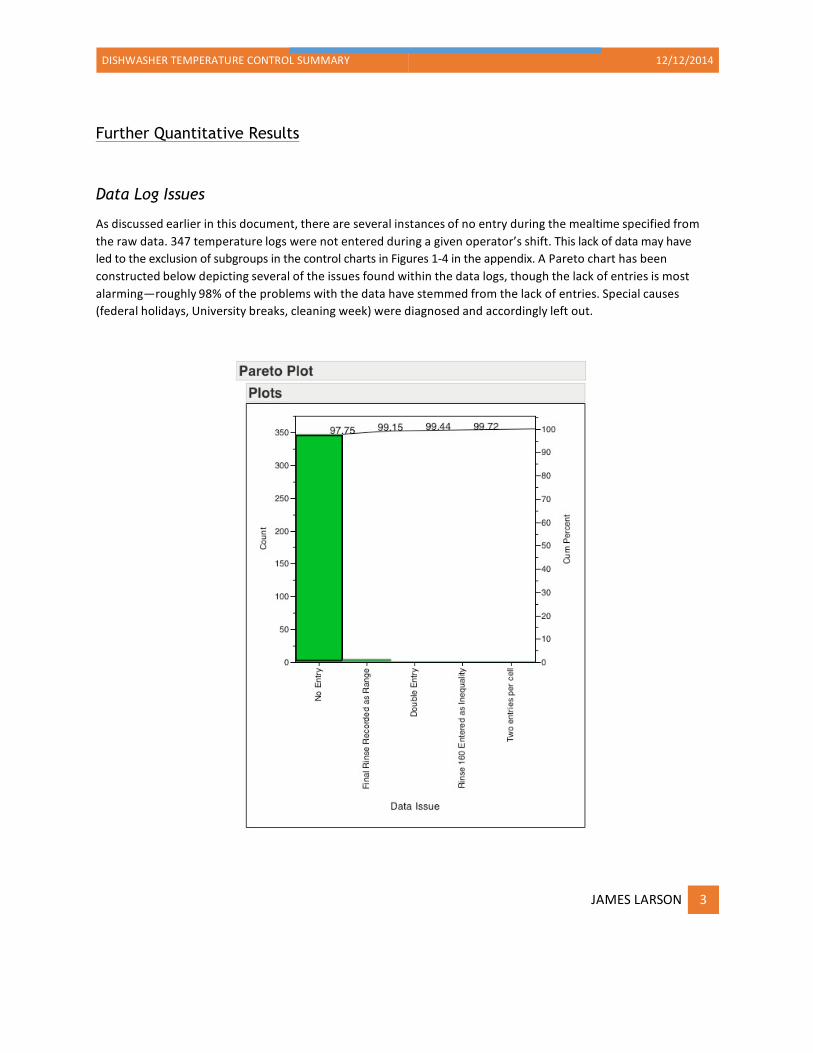
As discussed earlier in this document, there are several instances of no entry during the mealtime specified from the raw data. 347 temperature logs were not entered during a given operator’s shift. This lack of data may have led to the exclusion of subgroups in the control charts in Figures 1-‐4 in the appendix. A Pareto chart has been constructed below depicting several of the issues found within the data logs, though the lack of entries is most alarming—roughly 98% of the problems with the data have stemmed from the lack of entries. Special causes (federal holidays, University breaks, cleaning week) were diagnosed and accordingly left out.
DISHWASHER TEMPERATURE CONTROL SUMMARY 12/12/2014
JAMES LARSON 4
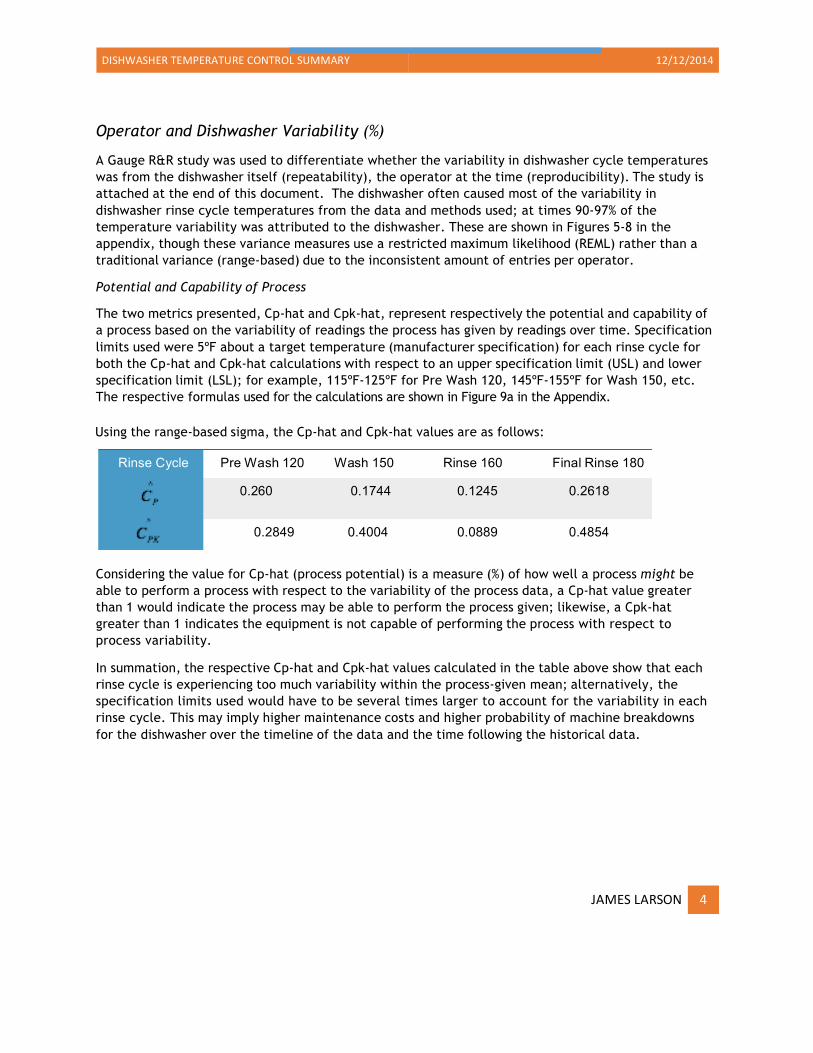
Rinse Cycle Pre Wash 120 Wash 150 Rinse 160 Final Rinse 180
0.1744 0.1245 0.2618
0.2849 0.4004 0.0889
Operator and Dishwasher Variability (%)
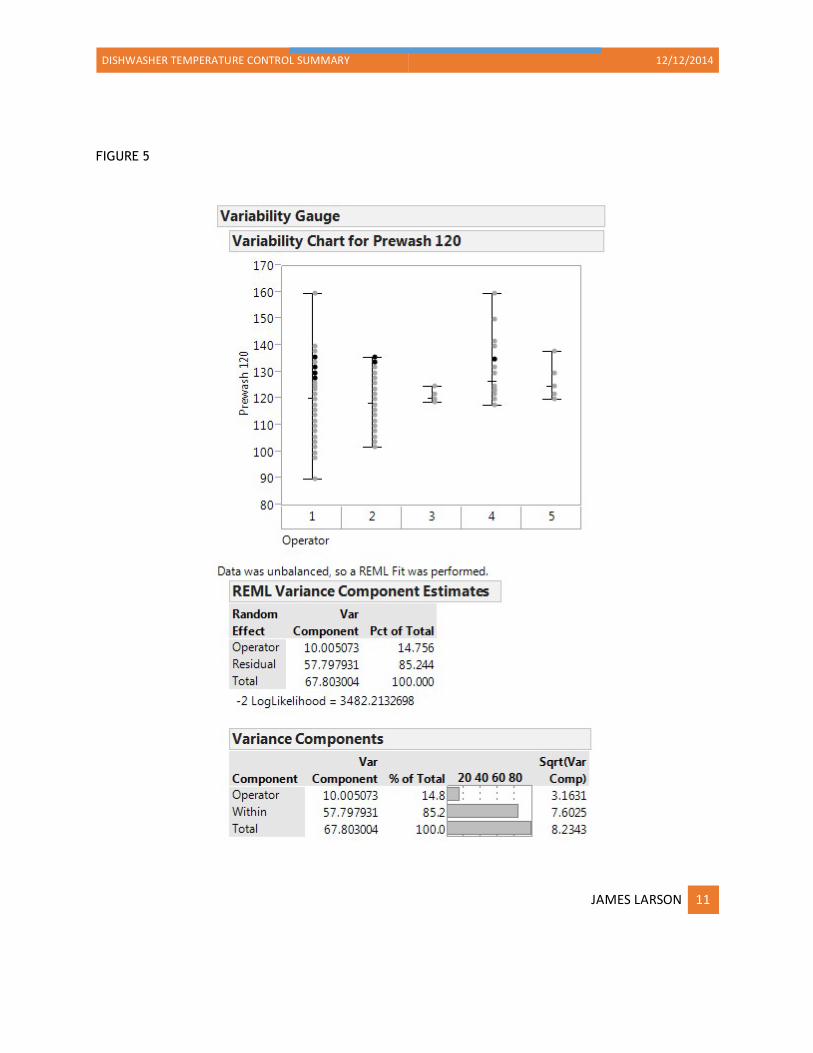
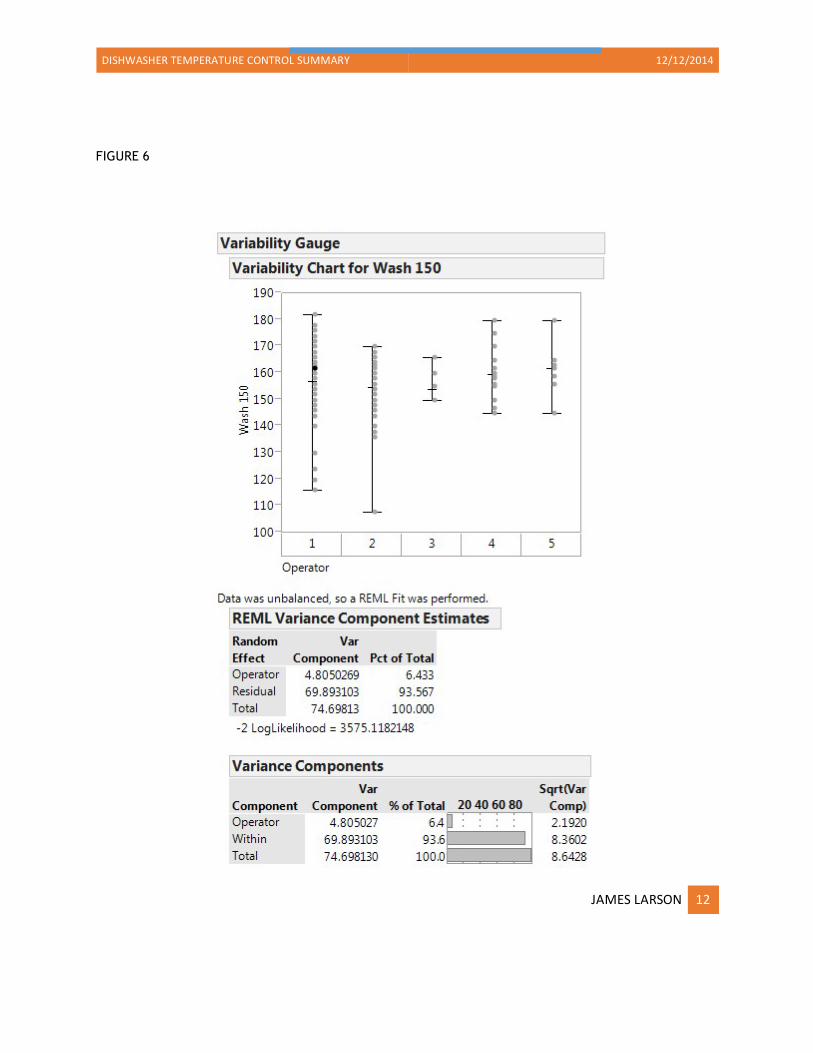
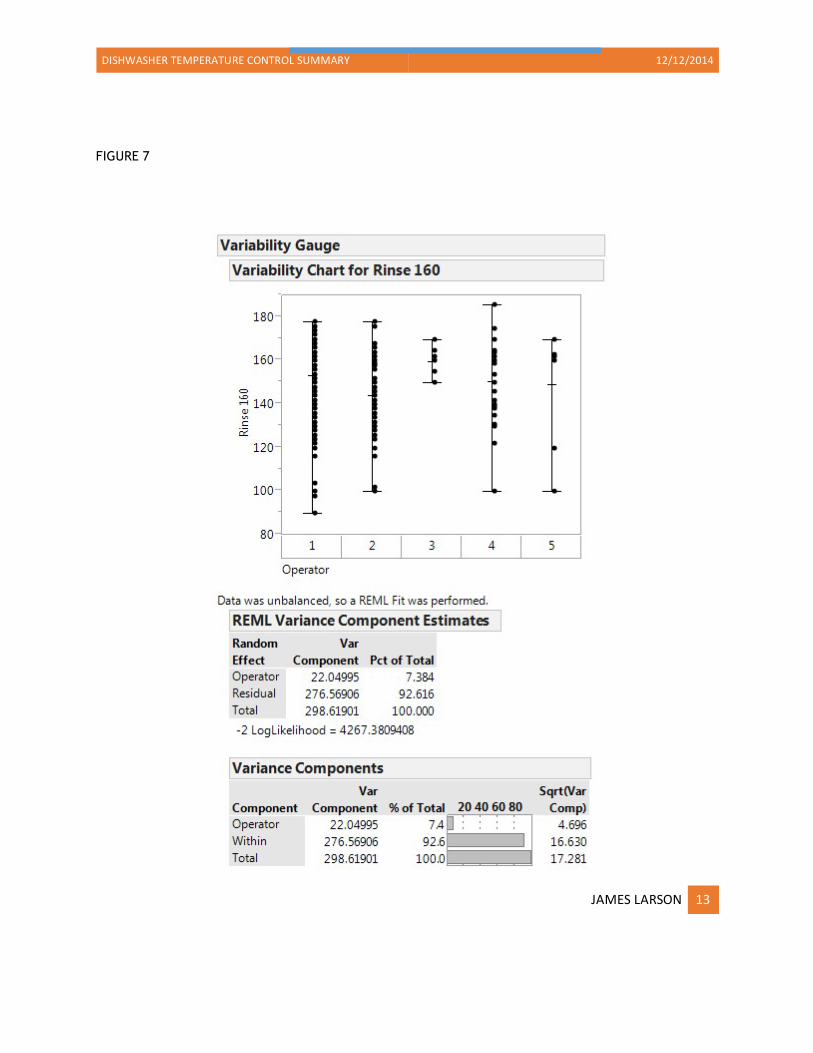
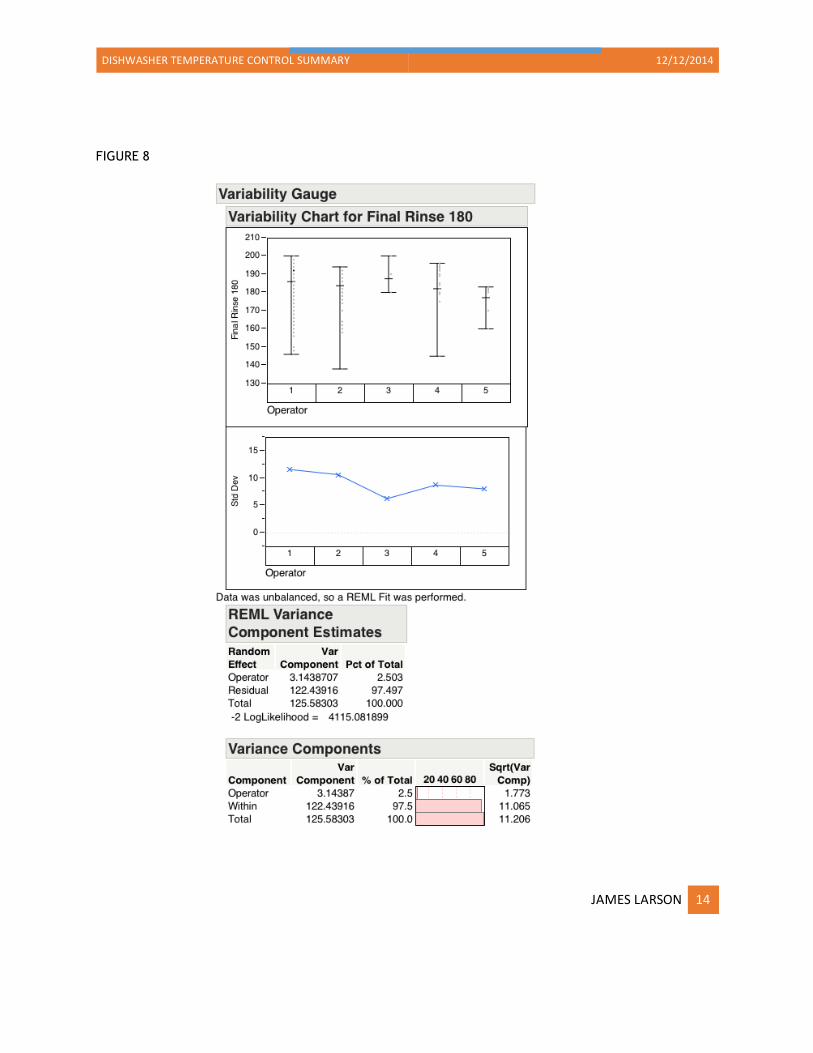
A Gauge R&R study was used to differentiate whether the variability in dishwasher cycle temperatures was from the dishwasher itself (repeatability), the operator at the time (reproducibility). The study is attached at the end of this document. The dishwasher often caused most of the variability in dishwasher rinse cycle temperatures from the data and methods used; at times 90-97% of the temperature variability was attributed to the dishwasher. These are shown in Figures 5-8 in the appendix, though these variance measures use a restricted maximum likelihood (REML) rather than a traditional variance (range-based) due to the inconsistent amount of entries per operator.
Potential and Capability of Process
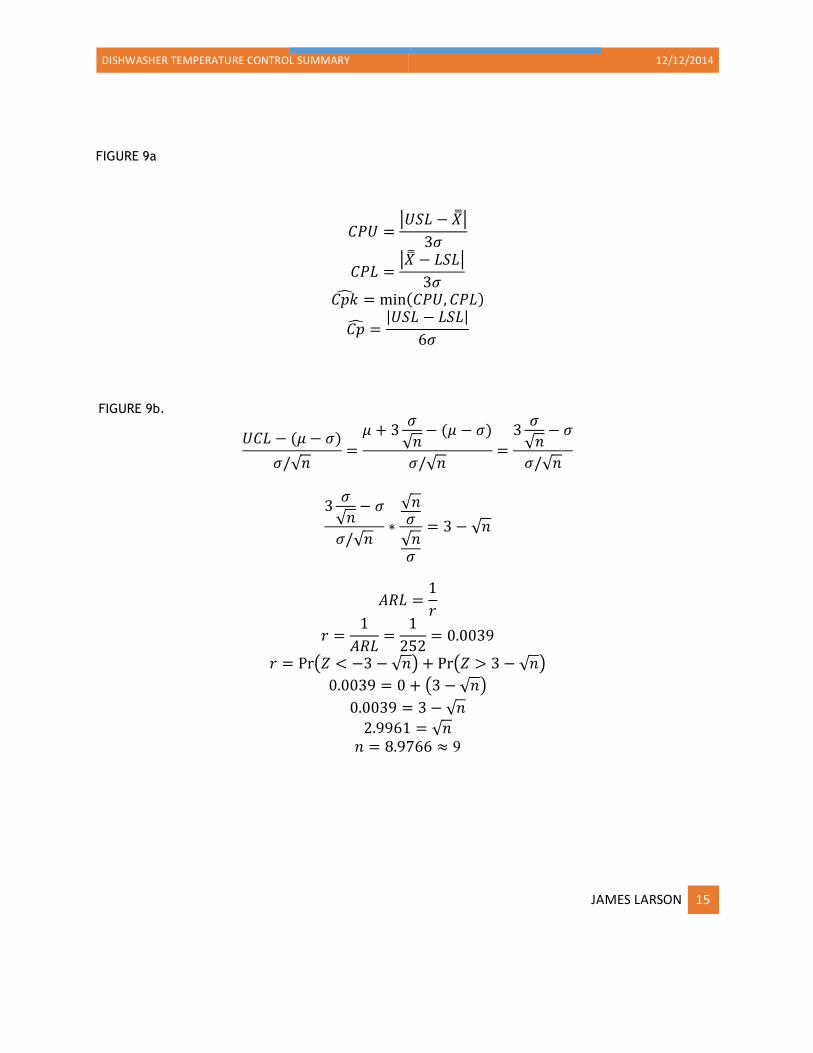
The two metrics presented, Cp-hat and Cpk-hat, represent respectively the potential and capability of a process based on the variability of readings the process has given by readings over time. Specification limits used were 5ºF about a target temperature (manufacturer specification) for each rinse cycle for both the Cp-hat and Cpk-hat calculations with respect to an upper specification limit (USL) and lower specification limit (LSL); for example, 115ºF-125ºF for Pre Wash 120, 145ºF-155ºF for Wash 150, etc. The respective formulas used for the calculations are shown in Figure 9a in the Appendix.
Using the range-based sigma, the Cp-hat and Cpk-hat values are as follows:
Considering the value for Cp-hat (process potential) is a measure (%) of how well a process might be able to perform a process with respect to the variability of the process data, a Cp-hat value greater than 1 would indicate the process may be able to perform the process given; likewise, a Cpk-hat greater than 1 indicates the equipment is not capable of performing the process with respect to process variability.
In summation, the respective Cp-hat and Cpk-hat values calculated in the table above show that each rinse cycle is experiencing too much variability within the process-given mean; alternatively, the specification limits used would have to be several times larger to account for the variability in each rinse cycle. This may imply higher maintenance costs and higher probability of machine breakdowns for the dishwasher over the timeline of the data and the time following the historical data.
DISHWASHER TEMPERATURE CONTROL SUMMARY 12/12/2014
JAMES LARSON 5
Possible Solutions
Future Entry and Special Cause Identification
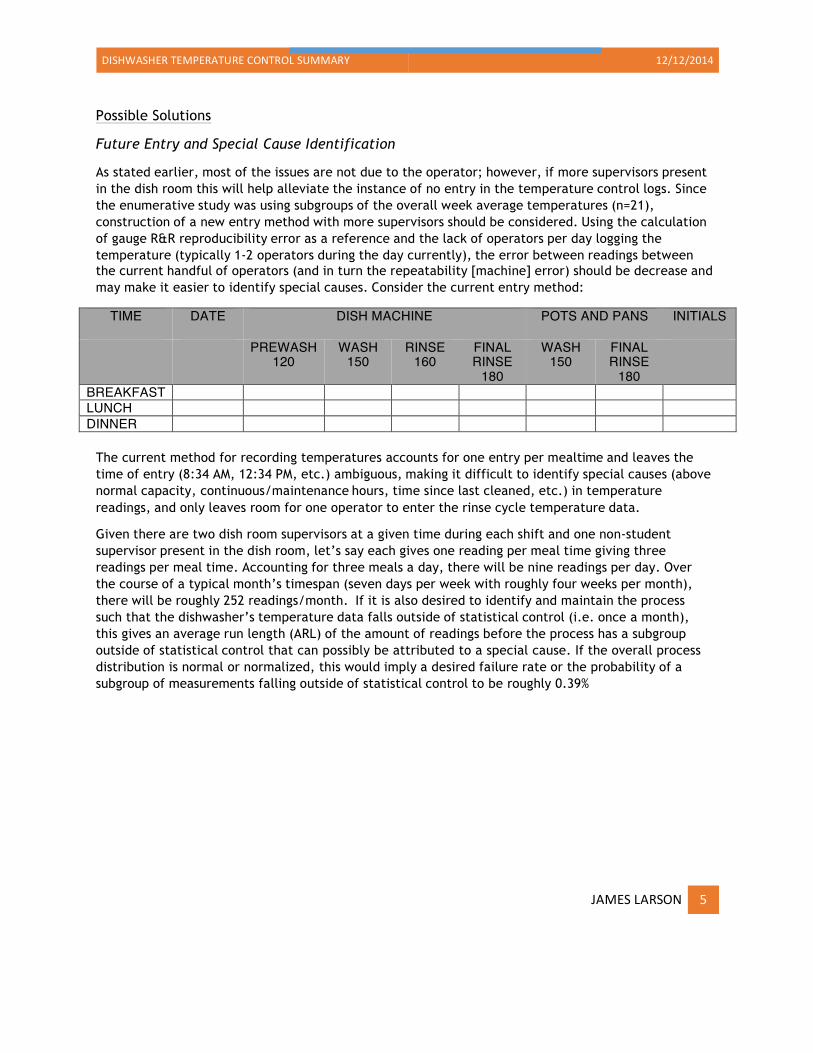
As stated earlier, most of the issues are not due to the operator; however, if more supervisors present in the dish room this will help alleviate the instance of no entry in the temperature control logs. Since the enumerative study was using subgroups of the overall week average temperatures (n=21), construction of a new entry method with more supervisors should be considered. Using the calculation of gauge R&R reproducibility error as a reference and the lack of operators per day logging the temperature (typically 1-2 operators during the day currently), the error between readings between the current handful of operators (and in turn the repeatability [machine] error) should be decrease and may make it easier to identify special causes. Consider the current entry method:
TIME DATE DISH MACHINE POTS AND PANS INITIALS
PREWASH
120 WASH
150 RINSE
160 FINAL RINSE
180
WASH 150
FINAL RINSE
180
BREAKFAST LUNCH DINNER
The current method for recording temperatures accounts for one entry per mealtime and leaves the time of entry (8:34 AM, 12:34 PM, etc.) ambiguous, making it difficult to identify special causes (above normal capacity, continuous/maintenance hours, time since last cleaned, etc.) in temperature readings, and only leaves room for one operator to enter the rinse cycle temperature data.
Given there are two dish room supervisors at a given time during each shift and one non-student supervisor present in the dish room, let’s say each gives one reading per meal time giving three readings per meal time. Accounting for three meals a day, there will be nine readings per day. Over the course of a typical month’s timespan (seven days per week with roughly four weeks per month), there will be roughly 252 readings/month. If it is also desired to identify and maintain the process such that the dishwasher’s temperature data falls outside of statistical control (i.e. once a month), this gives an average run length (ARL) of the amount of readings before the process has a subgroup outside of statistical control that can possibly be attributed to a special cause. If the overall process distribution is normal or normalized, this would imply a desired failure rate or the probability of a subgroup of measurements falling outside of statistical control to be roughly 0.39%
DISHWASHER TEMPERATURE CONTROL SUMMARY 12/12/2014
JAMES LARSON 6
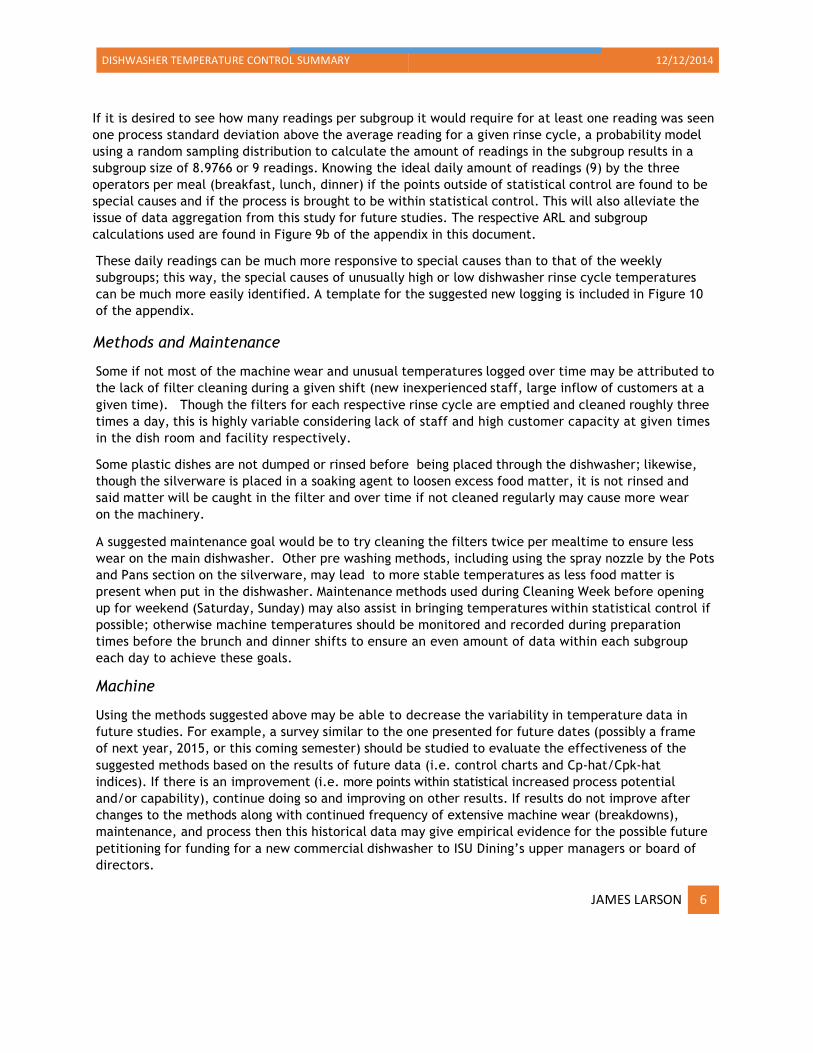
If it is desired to see how many readings per subgroup it would require for at least one reading was seen one process standard deviation above the average reading for a given rinse cycle, a probability model using a random sampling distribution to calculate the amount of readings in the subgroup results in a subgroup size of 8.9766 or 9 readings. Knowing the ideal daily amount of readings (9) by the three operators per meal (breakfast, lunch, dinner) if the points outside of statistical control are found to be special causes and if the process is brought to be within statistical control. This will also alleviate the issue of data aggregation from this study for future studies. The respective ARL and subgroup calculations used are found in Figure 9b of the appendix in this document.
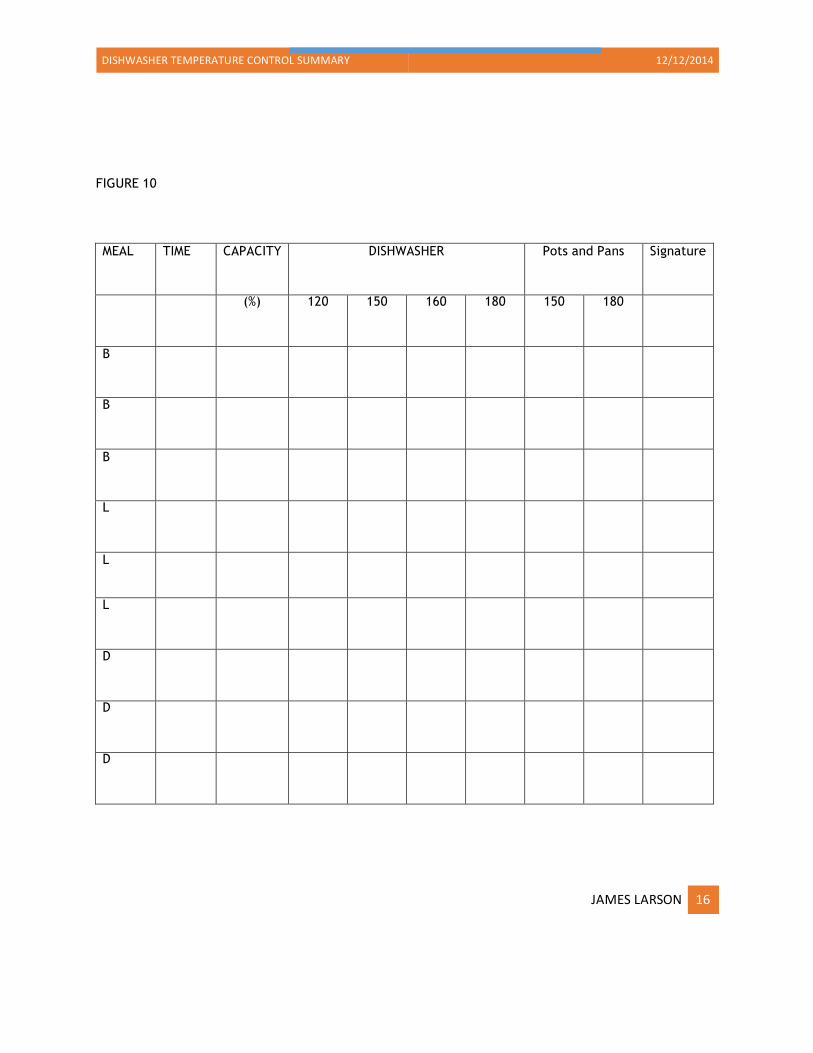
These daily readings can be much more responsive to special causes than to that of the weekly subgroups; this way, the special causes of unusually high or low dishwasher rinse cycle temperatures can be much more easily identified. A template for the suggested new logging is included in Figure 10 of the appendix.
Methods and Maintenance
Some if not most of the machine wear and unusual temperatures logged over time may be attributed to the lack of filter cleaning during a given shift (new inexperienced staff, large inflow of customers at a given time). Though the filters for each respective rinse cycle are emptied and cleaned roughly three times a day, this is highly variable considering lack of staff and high customer capacity at given times in the dish room and facility respectively.
Some plastic dishes are not dumped or rinsed before being placed through the dishwasher; likewise, though the silverware is placed in a soaking agent to loosen excess food matter, it is not rinsed and said matter will be caught in the filter and over time if not cleaned regularly may cause more wear on the machinery.
A suggested maintenance goal would be to try cleaning the filters twice per mealtime to ensure less wear on the main dishwasher. Other pre washing methods, including using the spray nozzle by the Pots and Pans section on the silverware, may lead to more stable temperatures as less food matter is present when put in the dishwasher. Maintenance methods used during Cleaning Week before opening up for weekend (Saturday, Sunday) may also assist in bringing temperatures within statistical control if possible; otherwise machine temperatures should be monitored and recorded during preparation times before the brunch and dinner shifts to ensure an even amount of data within each subgroup each day to achieve these goals.
Machine
Using the methods suggested above may be able to decrease the variability in temperature data in future studies. For example, a survey similar to the one presented for future dates (possibly a frame of next year, 2015, or this coming semester) should be studied to evaluate the effectiveness of the suggested methods based on the results of future data (i.e. control charts and Cp-hat/Cpk-hat indices). If there is an improvement (i.e. more points within statistical increased process potential and/or capability), continue doing so and improving on other results. If results do not improve after changes to the methods along with continued frequency of extensive machine wear (breakdowns), maintenance, and process then this historical data may give empirical evidence for the possible future petitioning for funding for a new commercial dishwasher to ISU Dining’s upper managers or board of directors.
DISHWASHER TEMPERATURE CONTROL SUMMARY 12/12/2014
JAMES LAR
APPENDIX FIGURE 1
SON 7
DISHWASHER TEMPERATURE CONTROL SUMMARY 12/12/2014
JAMES LARSON 8
FIGURE 2
DISHWASHER TEMPERATURE CONTROL SUMMARY 12/12/2014
JAMES LARSON 9
FIGURE 3
DISHWASHER TEMPERATURE CONTROL SUMMARY 12/12/2014
JAMES LARSON 10
FIGURE 4
DISHWASHER TEMPERATURE CONTROL SUMMARY 12/12/2014
JAMES LARSON 11
FIGURE 5
DISHWASHER TEMPERATURE CONTROL SUMMARY 12/12/2014
JAMES LARSON 12
FIGURE 6
DISHWASHER TEMPERATURE CONTROL SUMMARY 12/12/2014
JAMES LARSON 13
FIGURE 7
DISHWASHER TEMPERATURE CONTROL SUMMARY 12/12/2014
JAMES LARSON 14
FIGURE 8
DISHWASHER TEMPERATURE CONTROL SUMMARY 12/12/2014
JAMES LARSON 15
FIGURE 9a
𝐶𝑃𝑈 =𝑈𝑆𝐿 − 𝑋3𝜎
𝐶𝑃𝐿 =𝑋 − 𝐿𝑆𝐿3𝜎
𝐶𝑝𝑘 = min 𝐶𝑃𝑈,𝐶𝑃𝐿
𝐶𝑝 =𝑈𝑆𝐿 − 𝐿𝑆𝐿
6𝜎
FIGURE 9b.
𝑈𝐶𝐿 − (𝜇 − 𝜎)𝜎/ 𝑛
=𝜇 + 3 𝜎
𝑛− (𝜇 − 𝜎)
𝜎/ 𝑛=3 𝜎
𝑛− 𝜎
𝜎/ 𝑛
3 𝜎
𝑛− 𝜎
𝜎/ 𝑛∗
𝑛𝜎𝑛𝜎
= 3− 𝑛
𝐴𝑅𝐿 =1𝑟
𝑟 =1𝐴𝑅𝐿 =
1252 = 0.0039
𝑟 = Pr 𝑍 < −3− 𝑛 + Pr 𝑍 > 3− 𝑛 0.0039 = 0+ 3− 𝑛
0.0039 = 3− 𝑛 2.9961 = 𝑛 𝑛 = 8.9766 ≈ 9
DISHWASHER TEMPERATURE CONTROL SUMMARY 12/12/2014
JAMES LARSON 16
FIGURE 10
MEAL TIME CAPACITY DISHWASHER Pots and Pans Signature
(%) 120 150 160 180 150 180
B
B
B
L
L
L
D
D
D
DISHWASHER TEMPERATURE CONTROL SUMMARY 12/12/2014 FIGURE 11
JAMES LARSON 1


![[INSERT PROJECT NAME]€¦ · Project name Project Number [Where applicable] Project Manager Project Controller Project location [Insert brief details of project location, including](https://img.pdfslide.net/doc/110x75/603496f741d854077e52cec0/insert-project-name-project-name-project-number-where-applicable-project-manager.jpg)