Embed Size (px)
Citation preview

4/19/05 1
A3 Report Writing
Toyota’s preferred method of
written communication
Copied from the Toyota Auburn Hills Training package. For Delphi Use Only.
Delphi Course
#62004527
4/19/05 2
A3 Report Writing Agenda
Introductions History of Toyota Objectives Module 1: Toyota Principles/Characteristics Module 2: A3 (&A4) Types Module 3: Standard Elements Creating an A3 Wrap-up/Review

4/19/05 3
Toyota History Sakichi Toyoda Invents an automatic loom (1894) Sakichi Toyoda decides to enter the car market (1920’s) Kiichiro Toyoda devises the just-in-time system of production Change name to Toyota (1936) Taiichi Ohno transferred from Toyoda Spinning & Weaving to
the Toyota Motor Company First cars shipped to US in 1957 Second best selling nameplate in US (1970) Began truck bed fabrication and vehicle assembly (mid 70s) NUMMI vehicle manufacturing (1986) Today Toyota is one of the 10 largest companies in the world.

4/19/05 4
Objectives
Understand importance of A3 reporting standard Learn the 4 basic types of A3 reports Learn the elements of each type of report Study the layout and formats of A3s Practice developing and writing an A3
4/19/05 5
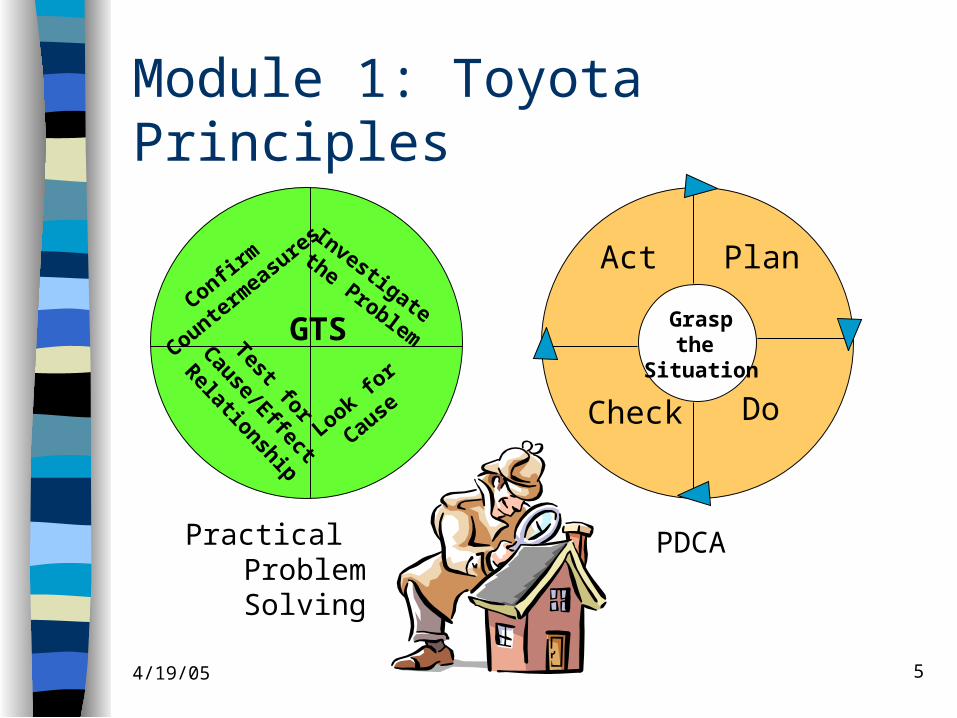
Module 1: Toyota Principles
Graspthe
Situation
Plan
DoCheck
ActConfir
m
Countermea
sure
s Investigate
the Problem
Test for
Cause/Effect
Relationship
Look for
Cause
GTS
Practical Problem Solving
PDCA

4/19/05 6
Module 1: Toyota PrinciplesBenefits of using the A3 Format
1. Kaizen Clarifies the goal Shows the standard and deviation Forces addressing all issues Outlines new goal and method to reach it
2. Front-line Decision Making Grasp the situation Shows facts / data Shows decision process Shows options

4/19/05 7
Toyota PrinciplesBenefits of using the A3 Format (cont.)
3. Cost Consciousness– Shows cost analysis– Shows alternatives– Supports cost justification (ringi-sho)
4. Process Management– A-3 is a STORY about the
LOGICAL THINKING PROCESS– A-3 shows “grasp the situation”– Helps management understand process used– Establishes vital points
4/19/05 8
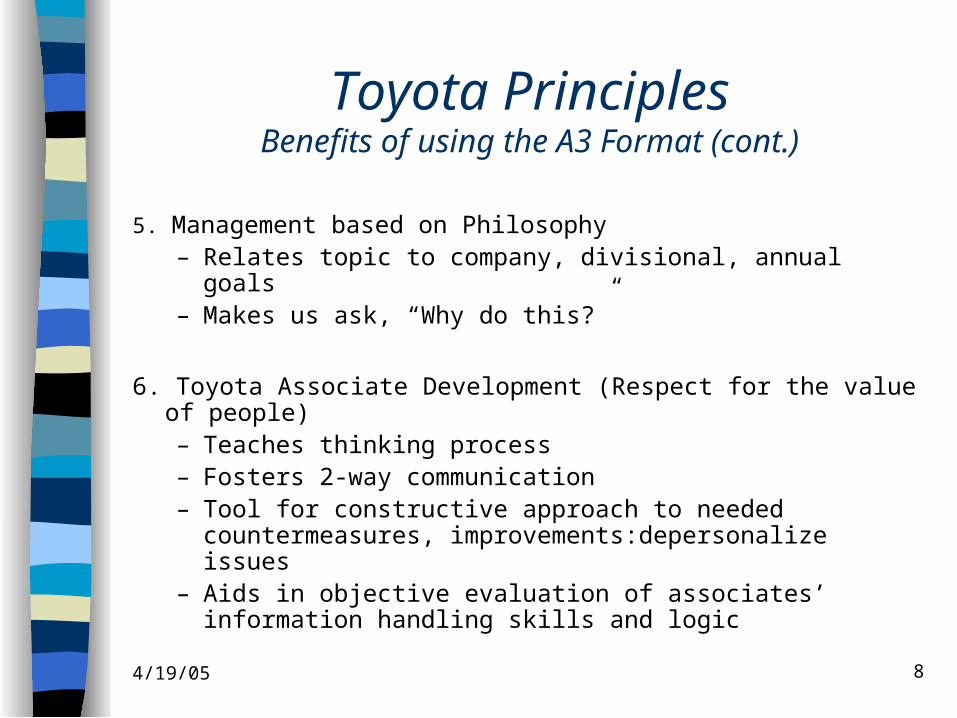
5. Management based on Philosophy– Relates topic to company, divisional, annual goals– Makes us ask, “Why do this?”
6. Toyota Associate Development (Respect for the value of people)– Teaches thinking process– Fosters 2-way communication– Tool for constructive approach to needed countermeasures,
improvements:depersonalize issues– Aids in objective evaluation of associates’ information
handling skills and logic
Toyota PrinciplesBenefits of using the A3 Format (cont.)

4/19/05 9
Toyota PrinciplesBenefits of using the A3 Format (cont.)
7. Teamwork & Communication Standard form facilitates communication
All can understand All have same information
Simple, brief, clear Can be done collectively Allows “3-D” communication
Manager
Team Member
Inside Outside
Future
Past

4/19/05 10
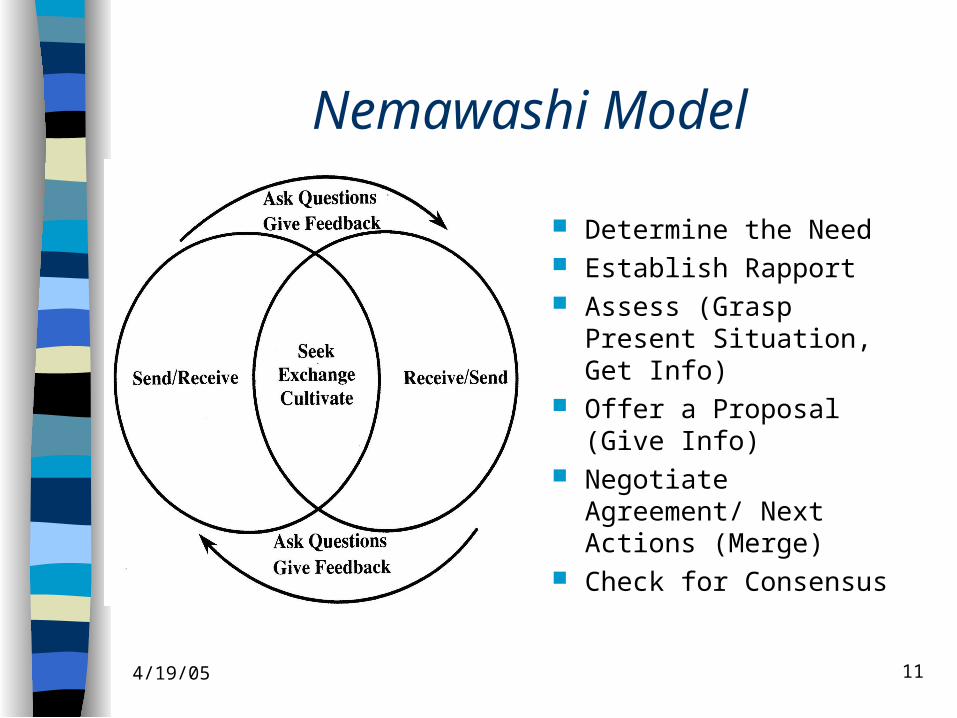
What is Nemawashi?
“To dig around the root of a tree to prepare for transplanting”
4/19/05 11
Nemawashi Model
Determine the Need Establish Rapport Assess (Grasp Present
Situation, Get Info) Offer a Proposal
(Give Info) Negotiate Agreement/
Next Actions (Merge) Check for Consensus
4/19/05 12
Background
Problem Solving format surfaced in the early 1960’s after Deming’s visit
Utilized within Q.C. circles for shop problems
(supports TPS) A-3 use evolved in Toyota Management during 1970s
with direct focus on reader understanding

4/19/05 13
Toyota CharacteristicsReflects Company’s Vision (Image)
OperatingPrinciples
Stated Philosophy
Underlying Beliefs,Values, AssumptionsGround Level
4/19/05 14
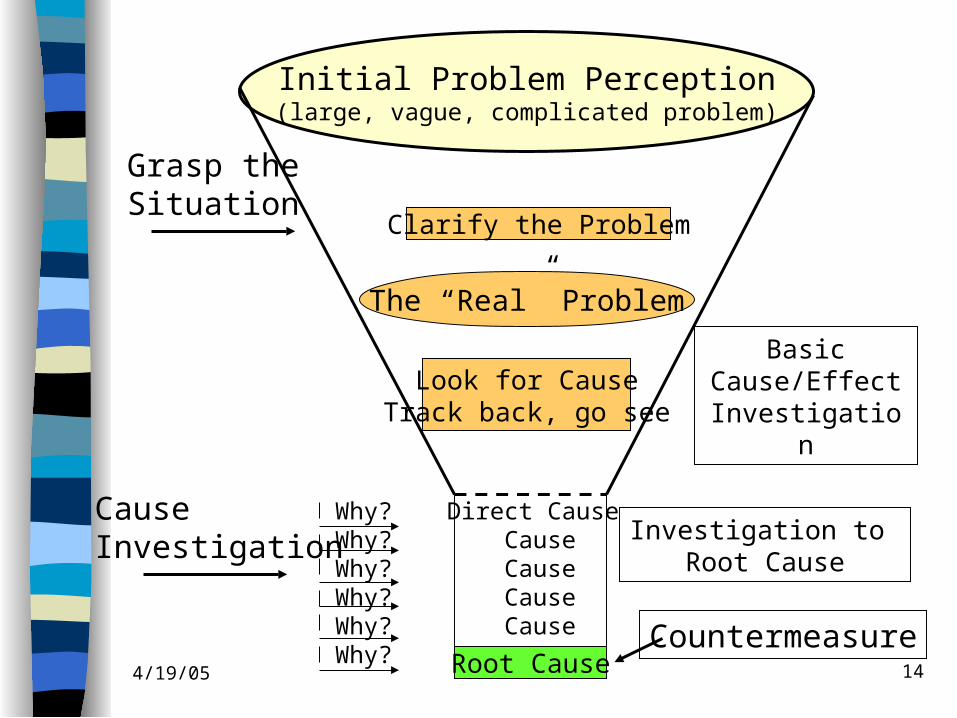
Initial Problem Perception(large, vague, complicated problem)
Clarify the Problem
The “Real” Problem
Look for CauseTrack back, go see
Root Cause
Direct Cause Cause Cause Cause Cause
Why?Why?Why?Why?Why?Why?
Grasp theSituation
CauseInvestigation
Basic Cause/EffectInvestigation
Investigation to Root Cause
Countermeasure
4/19/05 15
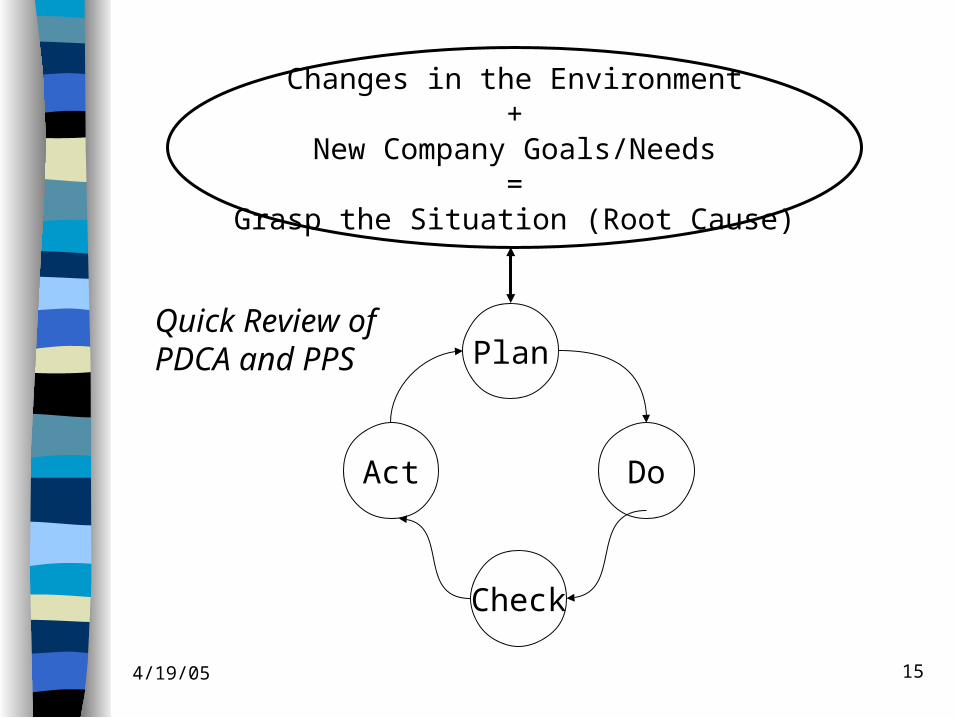
Changes in the Environment+
New Company Goals/Needs=
Grasp the Situation (Root Cause)
Plan
Act Do
Check
Quick Review of PDCA and PPS

4/19/05 16
PlanIdentify SituationAnalyze Situation
DORecommendCountermeasuresImplementation
CheckFollow-up
ActionStandardize orStart Again
The Relationship between Process and Proposal
Situation
Target
Countermeasures
Implementation
Follow-up
Theme
Analysis

4/19/05 17
Reflection – Module 1
Quick Quiz
AnyQuestions
?

4/19/05 18
Quick Quiz – Module 1
1) What are Toyota’s
Operating Principles?
Stated Philosophies?
Underlying Beliefs, Values, Assumptions?

4/19/05 19
Quick Quiz – Module 1
2) List the 5 steps of Practical Problem Solving
Step 1: _________________________________
Step 2: _________________________________
Step 3: _________________________________
Step 4: _________________________________
Step 5: _________________________________
4/19/05 20
Quick Quiz – Module 1
3) List the 5 steps of PDCA
Step 1: _________________________________
Step 2: _________________________________
Step 3: _________________________________
Step 4: _________________________________
Step 5: _________________________________
4/19/05 21
Module 2: Types of A3s?

4/19/05 22
When To Use a Story Board (A3)
Anytime you wish to clearly tell a story
– Especially when you wish to simplify or clarify a complicated story.

4/19/05 23
WHAT is an A3?An A3 is a one-page report used by Toyota that includes all
information needed for the reader to: make a decision on a stated PROPOSAL or PROBLEM, or
to communicate the STATUS of, or plans for, a specific goal
7
SITUATION
ANALYSIS
COUNTERMEASURE
PLAN
FOLLOW-UP
THEME OF A3
• Toyota does not teach a set format
• Guidelines are established such as the inverted “N” flow to the right
• Every Toyota associate receives A3
Training
SIGNATURE BLOCK

4/19/05 24
WHY Use the A3 Format?
BECAUSE AN A3 REPORT...

4/19/05 25
1. Tell a Story
2. Flow
3. Simple
4. Follows PDCA or PPS or DPS
5. Based on Facts, Not Opinion
6. Clear and Concise
7. Picture is Worth a Thousand Words (Graphics)
Vital Parts of an A3

4/19/05 26
Types of A3/A4s
1) Problem Solving Story
2) Proposal Story
3) Status Report
4) Informational Story

4/19/05 27
Types of A3 Reports
P.S.Story
ProposalStory
StatusStory
InfoStory
Report Types
Problem Consciousness
Current Situation

4/19/05 28
Tell a Problem Solving StoryWhen:
A plan, goal or standard is not being met.
4/19/05 29
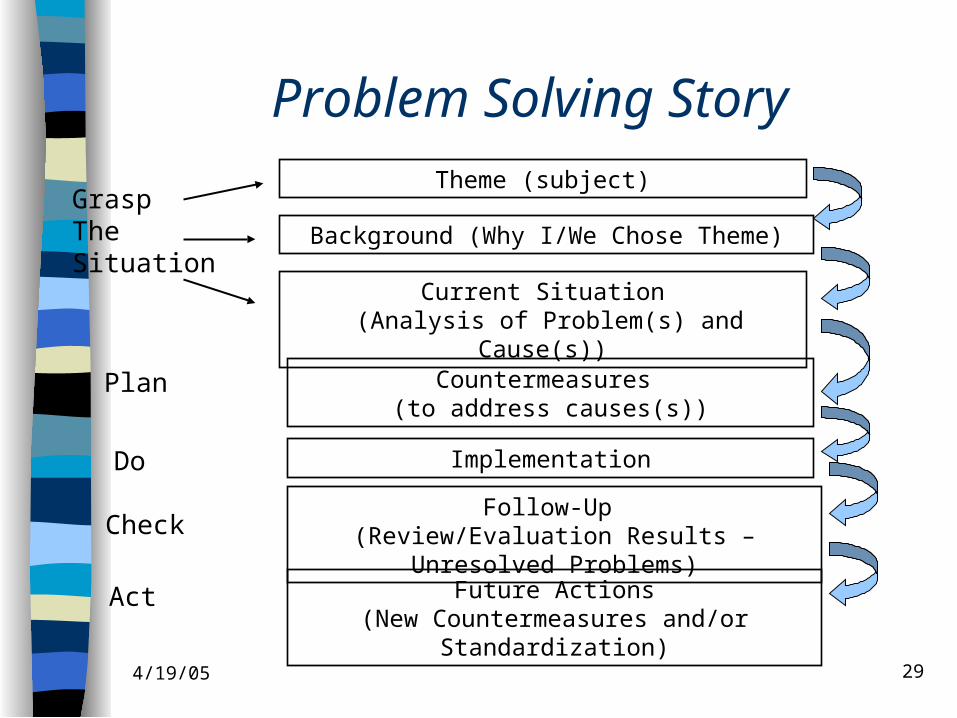
Problem Solving StoryTheme (subject)
Background (Why I/We Chose Theme)
Current Situation (Analysis of Problem(s) and Cause(s))
Countermeasures (to address causes(s))
Implementation
Follow-Up (Review/Evaluation Results – Unresolved Problems)
Future Actions(New Countermeasures and/or Standardization)
GraspTheSituation
Plan
Do
Check
Act

4/19/05 30
Problem Solving Report StoryTheme:
Answers the question, “What are we trying to do?”
I. Problem Situation
•The Standard•Current Situation• Discrepancy/Extent of the ProblemRationale for picking up problem (importance to business activity, goals and values of the organization)
II. Target/Goal
• Measurable description of what you want to change;quantity, time
III. Cause Analysis
Problem: Potential Causes Most likely direct cause Why? Why? Why? Why? Why?Root Cause:
IV. Countermeasures
(Resulting from Cause Analysis)• Temporary Measure• Long Term Countermeasure
V. Implementation
What Where Who WhenAction to Place Respons- Times, be taken ible person DatesCost
VI. Follow-up
•Unresolved issues & actions to address them?•How will you check effects?• When will you check the effects?• How will you report your findings?•When will you report your findings?
Signature Block

4/19/05 31
Tell a Proposal Story When:
• There is no plan or goal but there is a company value which needs to be addressed.
• A plan or goal existed, but situation has changed and a new goal, policy or plan needs to be made.
• A new direction or policy is made and a goal/plan must be made to address it.

4/19/05 32
Proposal Story
Title
Background (Existing Value, Expectation, Policy, Goal or Plan)
Current Situation (Analysis of Need(s) and Contributing Conditions)
Recommendations(Cost/Benefits)
Implementation(Details of the Plan)
Follow-Up (Review/Evaluation Results – Unresolved Problems)
GraspTheSituation
Plan
Do
Check
4/19/05 33
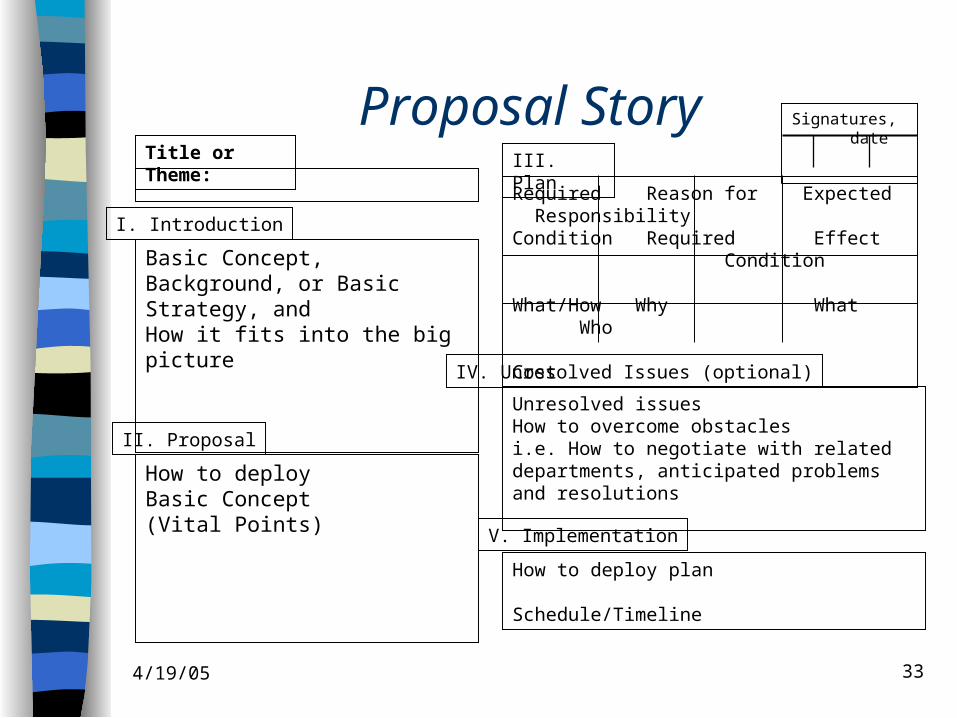
Proposal StoryTitle or Theme:
I. Introduction
Basic Concept, Background, or Basic Strategy, andHow it fits into the big picture
II. Proposal
How to deployBasic Concept(Vital Points)
III. Plan
Required Reason for Expected ResponsibilityCondition Required Effect Condition
What/How Why What Who
Cost
IV. Unresolved Issues (optional)
Unresolved issuesHow to overcome obstaclesi.e. How to negotiate with related departments, anticipated problems and resolutions
V. Implementation
How to deploy plan
Schedule/Timeline
Signatures, date

4/19/05 34
Proposal StoryTitle (Project)
I. Background & Basic Concept
II. Selection of the Plan
Option A
Option B
X
III. Example of other companies
A __________ B ___________
IV. Contents of the Plan
Timing ________ ________Members ______, _______, __________Cost ________
Curriculum
Expected Effect __________ ( )
V. Implementation Schedule
0
0
Signatures, date
Legend: Preferred Slight risk High Risk X

4/19/05 35
Tell a Status Report Story When:
Establishing activities for a new goal Reporting on the major points of large goals
– Annual plans
– Mid & year end reviews
– Monthly vehicle status report

4/19/05 36
Status Report StoryTheme:
I. Background
Reason for choosing Theme
III. Implementation
Objectives Activity Achievements Eval- Future expl. uation Problems
IV. Total Effect
Impact to dept/company, expected benefits
V. Future Actions
Unresolved Problems Actions
II. Objectives
Vital points of strategy or policy
X
Signatures, date
Legend: Preferred Slight risk High Risk X
4/19/05 37
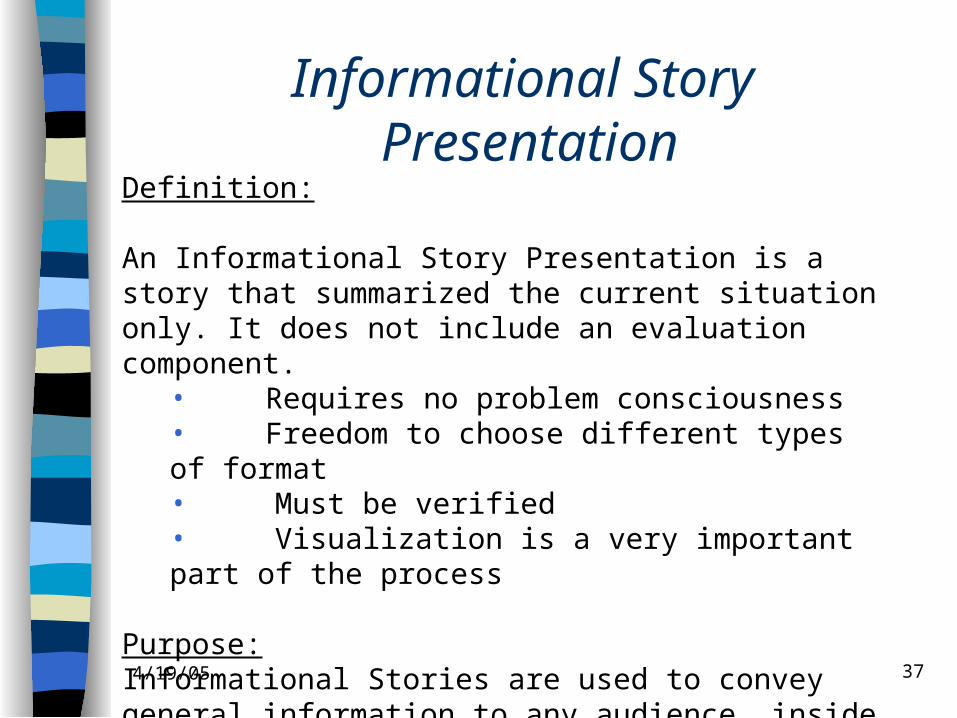
Informational Story Presentation
Definition:
An Informational Story Presentation is a story that summarized the current situation only. It does not include an evaluation component.
• Requires no problem consciousness• Freedom to choose different types of format• Must be verified• Visualization is a very important part of the process
Purpose:Informational Stories are used to convey general information to any audience, inside or outside the company.

4/19/05 38
Reflection – Module 2
Quick Quiz
AnyQuestions
?

4/19/05 39
Quick Quiz
1) List the 4 basic types of A3s
1: _________________________________________
2: _________________________________________
3: _________________________________________
4: _________________________________________

4/19/05 40
Quick Quiz
2) You are requesting to purchase a new piece of “capital”
equipment. What type of A3 would be best suited for this situation?
____________________________________

4/19/05 41
Quick Quiz - Proposal Story
I.
Basic Concept, Background, or Basic Strategy, andHow it fits into the big picture
II.
How to deployBasic Concept(Vital Points)
III.
Required Reason for Expected ResponsibilityCondition Required Effect Condition
What/How Why What Who
Cost
IV.
Unresolved issuesHow to overcome obstaclesi.e. How to negotiate with related departments, anticipated problems and resolutions
V.
How to deploy plan
Schedule/Timeline
3) Fill in the title blocks
4/19/05 42
Quick Quiz
4) Name at least two things all A3/A4 reports have in common?
1. _______________________________________
2. _______________________________________
3. _______________________________________
4/19/05 43
Module 3: A3 Vital Points

4/19/05 44
Module 3: A3 Vital Points
Plan time to grasp the ENTIRE situation:
– Consider a wide range of information sources
– Consider others involved – Nemawashi
– Base story on facts, not opinion alone
– Consider the long-term effect Decide what kind of story you need to tell:
– Write to your audience
– Consider needs, knowledge of situation Relate the story to company values, philosophy

4/19/05 45
A3 Vital Points (continued)
Make your story flow in a logical sequence. Include only points needed to tell the story.
Save words – use graphs and visuals to tell your story when possible.
Clarify the accuracy of the data used. Make every word count – be specific, avoid specialized
language. Consider visual effect of each box on the page in helping
you tell the story.

4/19/05 46
Layout GuidelinesOne Page (A3) Reporting
I. Title, Signature Boxes, Author and Date
Title Placement Place in top left or top center of page (top left is
preferable because it ensures that the title is still visible if the sheet is tri-folded)
Clearly indicate the subject and purpose of the report
Title Signature Boxes
Author: Date

4/19/05 47
Layout GuidelinesOne Page (A3) Reporting (Cont.)
Signature Boxes Place in top right corner of report Boxes are to display approval from management Signatures should appear highest to lowest in rank order
(left to right)
Author and Date Clearly indicate the source and age of the report Place on top right side of report
TitleSignature Boxes
Author: Date
4/19/05 48
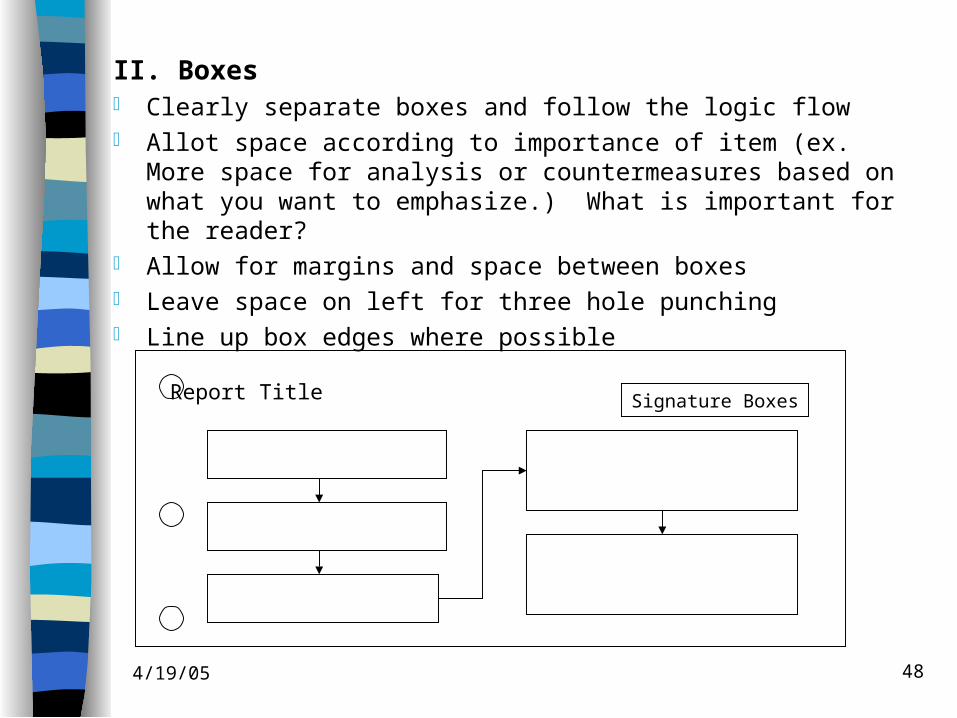
II. Boxes Clearly separate boxes and follow the logic flow Allot space according to importance of item (ex. More space for
analysis or countermeasures based on what you want to emphasize.) What is important for the reader?
Allow for margins and space between boxes Leave space on left for three hole punching Line up box edges where possible
Report Title Signature Boxes

4/19/05 49
III. Size and Font of Text
Key point is readability
Maintain same fonts or typestyles throughout (one for headings, one for body text)
If you will be reducing any text or graphics, use larger type
Typical Font Sizes
Headings = 12 point minimum
Body Text = 10 point
Note: One Font Type

4/19/05 50
IV. Numbering (or bullets) and Line Spacing
Use numbered lists (or bullets) instead of sentences and paragraphs.
Numbering makes items easier to reference in discussion
The order of numbered items should be based on importance, sequence, or time.
Leave a blank line between each number or bullet for readability and flow.

4/19/05 51
Use of Bulleted Lists
Example:
Less effective:
Due to new vehicle line-off in June, which will run parallel with other vehicle production, it will be necessary to improve the layout and system of operation in our plant.
Better:
• A new vehicle line-off will begin in June• Its production will parallel our current production• Improve the plant layout and operation

4/19/05 52
V. Underlining or Bolding Text
Use underlining or bolding of text to focus attention on key points
Reader should be able to grasp the story by only following the bold information
New Equipment for ’94 Model
Background
New Model start /93
Objectives
Need new equipment
Schedule
Pilot build 1/93
Effects:
Cost $3 million
Future Actions:
Find vendor 6/92
Install12/92

A3 Report WritingConstructive Analysis of A3/A4s
A3 Report WritingChoosing the right chart or graph

4/19/05 55
United Way Funding % Participation as of Jan-03
0
20
40
60
80
100
Eng Finance H.R. Legal Plant Sales Purch
2000 2001 2002 Jan-03
Goal: To increase department participation in contributing to the United Way campaign. Which of the four graphs works best?
United Way Participation
Eng
13%
Finance
12%
H.R.
17%Legal
13%Plant
8%
Sales
18%
Purch
19%
United Way Participation
0
20
40
60
80
100
Eng Finance H.R. Legal Plant Sales Purch
2002 Jan-03
Goal by
May 1
Graph 1 Graph 2
Graph 3 Graph 4
United Way Participation
0
20
40
60
80
Eng Finance H.R. Legal Plant Sales Purch
Jan-03
Goal by
May 1
4/19/05 56
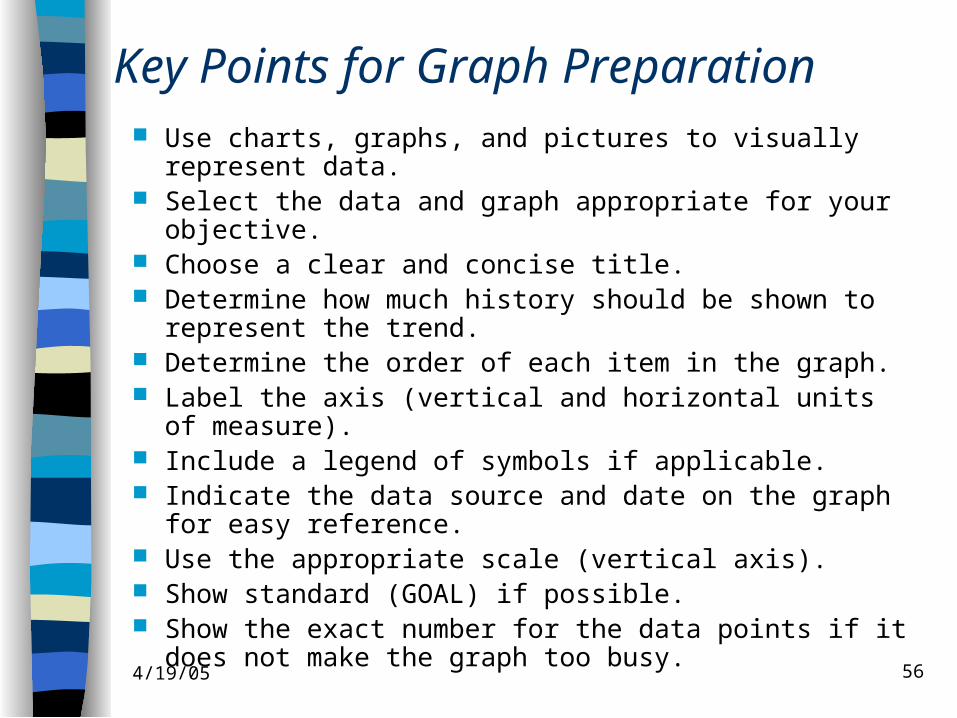
Key Points for Graph Preparation Use charts, graphs, and pictures to visually represent data. Select the data and graph appropriate for your objective. Choose a clear and concise title. Determine how much history should be shown to represent the
trend. Determine the order of each item in the graph. Label the axis (vertical and horizontal units of measure). Include a legend of symbols if applicable. Indicate the data source and date on the graph for easy
reference. Use the appropriate scale (vertical axis). Show standard (GOAL) if possible. Show the exact number for the data points if it does not make
the graph too busy.

4/19/05 57
VI. Charts and GraphsEXAMPLE:
Less Effective:
Cars produced May 28, 1998
White 35; Red 40; Blue 10;
Teal 10; Grey 5; Lt Blue 5
Cars Colors Produced 5/28/98
White
Red
Blue
Teal
Grey
Lt Blue
Better:
4/19/05 58
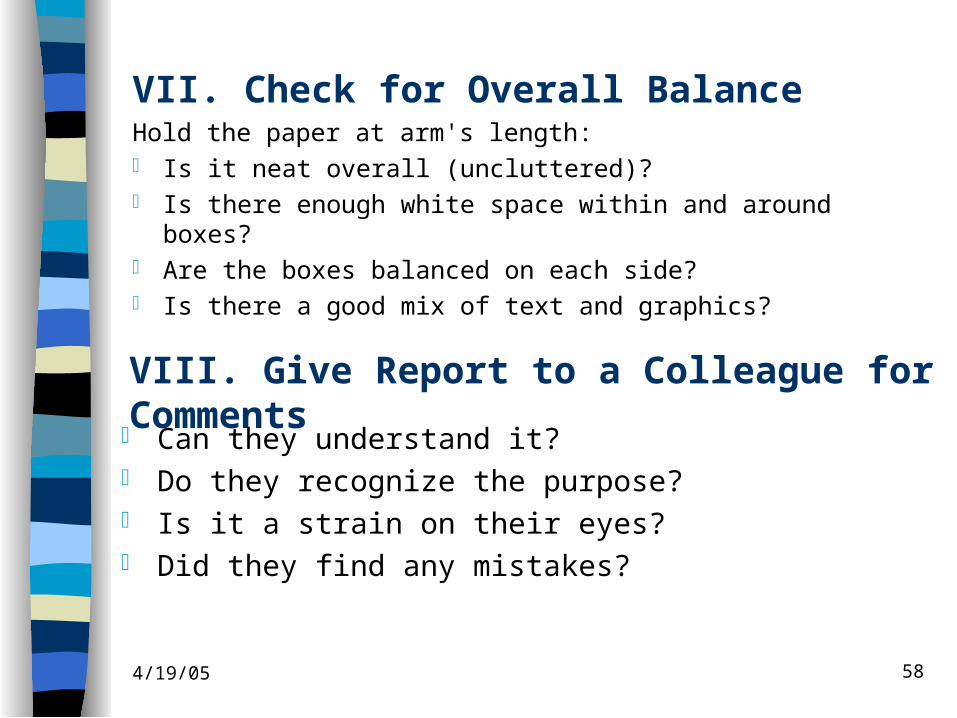
VII. Check for Overall BalanceHold the paper at arm's length: Is it neat overall (uncluttered)? Is there enough white space within and around boxes? Are the boxes balanced on each side? Is there a good mix of text and graphics?
VIII. Give Report to a Colleague for Comments Can they understand it? Do they recognize the purpose? Is it a strain on their eyes? Did they find any mistakes?

4/19/05 59
• When you don’t know what you’re talking about
• When you’re trying to hide the truth
• When you want to impress your professor
• When you own Xerox stock
• When you wish to create a clerical staff empire
• When you need to fill up your time
• When you get paid by the word
• To combat the “Lonely In-Box Syndrome”
• To put your audience to sleep
When To Use A 50-Page Report

4/19/05 60
Key Points to Take Away
1. The burden is on the subordinate to convince the manager – therefore, must tell a convincing story
2. The manager must educate and lead, but not tell the subordinate what to do, therefore, must ask the right questions
3. A3 is a tool that supports both and helps with the original question, why does lean take so long, why is it so difficult …. This is the missing engine
4. The purpose is to practice developing a convincing story & asking questions

4/19/05 61
WHY Use the A3 Format?
Enhances Logical Thinking - What/How to accomplish goal Enhances Decision-making - All facts thought out &
included Provides Standardized Method of Communication - Is
easy for each department/division to recognize and read Focuses on Problem Solving Activities – 5 Whys used
instead of simply trying to solve the perceived problem Eliminates Waste – Easier to spot errors in thinking Forces you to ask:
– Why do I think we should do this? – Does it make sense?– Will it improve our current process?– Will it address the root cause of the problem?
BECAUSE AN A3 REPORT...

4/19/05 62
VISUALCONTROLS • Because it’s a Standardized Format - Visually "User Friendly"
Ties Into The Delphi DMS and I&CIM Initiatives
ERRORPROOFING
• Concise, Clear Communication• Easier To Spot Defects - less to review
LEAD TIMEREDUCTION
• Promotes Quicker Decision Making - less reading of material
STANDARDIZEDWORK • A3 is a Standardized Approach To Business Communication
• Used To Develop People
• Standardized Format; one type of form used by all
QUICK SET-UP Standardized Format; easy tool; familiar layout
• Eliminates Waste• Lowers Costs• Improves Profits
REDUCTION IN VARIATION
Summary – Benefits of an A3?

A3 Reporting WritingGroup Exercise