Embed Size (px)
Citation preview

Robertson, A.H.F., Emeis, K.-C., Richter, C., and Camerlenghi, A. (Eds.), 1998Proceedings of the Ocean Drilling Program, Scientific Results, Vol. 160
42. ACOUSTIC PROPERTIES FROM LOGS AND DISCRETE MEASUREMENTS (SITES 966 AND 967) ON ERATOSTHENES SEAMOUNT: CONTROLS AND GROUND TRUTH1
John M. Woodside,2 Jeroen A.M. Kenter,2 and Ad Köhnen2
ABSTRACT
Acoustic properties (P-wave velocities, densities, and porosities) and insoluble residues were measured at in situ pressuresin 68 core plugs taken from cores recovered at Ocean Drilling Project Sites 966 and 967 and compared with wireline loggingdata. Study of the parameters that control the acoustic properties and the quality of the logging data reveals: (1) velocity-poros-ity and velocity-density relationships within the discrete data follow the general trend of the general empirical equation but areoffset with respect to it. Insoluble residue and dolomite content are the primary controls on the acoustic velocities of the coreplugs, whereas lithologic facies has no or a minor effect; and (2) velocity-porosity and velocity-density relationships in the log-ging data show considerable deviation and trends that cross those from the general relationships that are believed to approxi-mate fundamental physical principles. Calculated uncertainties in the laboratory measurements are at least one order ofmagnitude smaller than the difference between laboratory measurements and those from the wireline logs in several intervals.As a consequence, we believe that the downhole wireline measurements are unreliable in large intervals at both sites. Possiblecauses of the unreliability are poor hole conditions, upscaling effects, and consequent difficulties in making realistic correctionsof the raw log data. The wireline logs were found to be of such poor quality that they are untrustworthy sources of acousticparameters for making synthetic seismograms. This study clearly indicates that logging data should be carefully evaluated andcalibrated with petrophysical relationships from literature and from discrete measurements before interpretation or use as inputfor synthetic seismograms when hole conditions are poor.
uth-
t al., area67 is
ast at waterf car-.on-1984;t al., ve-f po-city
andt butue. lim-y, di-ber-
s for ob-ever,It isentalcks
s likeloci- ob-
INTRODUCTION
One of the objectives of Ocean Drilling Project (ODP) Leg 160drilling was to provide a means of calibrating seismic reflection datafrom Eratosthenes Seamount, and perhaps the region around it, byobtaining ground truth petrophysical data. The physical causes ofseismic reflectors are dependent primarily on contrasts in the acousticvelocity and density of rocks and sediments with depth, and second-arily on both the geometry of interfaces separating units with distinctacoustic properties and gradients and inhomogeneities in these prop-erties. Furthermore, it is known that shipboard and downhole wire-line measurements may not always provide reliable estimates of insitu acoustic velocities, porosities, and densities (e.g., Paillet andCheng, 1991; Theys, 1991; Kenter and Ivanov, 1995). Therefore, thisstudy was undertaken to make such measurements and to use them(a) to find the parameters controlling the acoustic properties, (b) toexamine deviations between logging and laboratory measurementsand address the quality of these data, and (c) to use the data obtainedin the creation of synthetic seismograms that could be compared di-rectly with the site survey seismic reflection profiles. Goal (c) is notaddressed in this paper. The ultimate goal is to understand the seismicresponse of the geology.
A secondary aim of this paper is to shed a little light on the use ofwireline logging information in scientific research as carried outwithin ODP. To paraphrase Theys (1991) in the preface to his book,because wireline logging has been seen by some to be an esoteric artshrouded in some mystery because of the paucity of informationabout it, little attention has been given to the underlying physical pro-cesses and the meaning and relevance of the wireline data. We feelthat this is especially true in the case of ODP, where drilling condi-tions are often difficult and the scientific requirements of the logs can
1Robertson, A.H.F., Emeis, K.-C., Richter, C., and Camerlenghi, A. (Eds.), 1998.Proc. ODP, Sci. Results, 160: College Station, TX (Ocean Drilling Program).
2Department of Earth Sciences, Vrije Universiteit, De Boelelaan 1085, 1081 HVAmsterdam, The Netherlands. Woodside: [email protected]
be quite different than those used in the exploration industry wherelogging was developed. We need to address the problems of loggingquality and the underlying petrophysical influences of logging vari-ability.
The Eratosthenes Seamount is a major topographic feature in theeastern Mediterranean. It is a slightly north-northeast–south-sowest elongated block of about 100 × 70 km that rises over 1200 mfrom the seafloor ~100 km south of Cyprus (Emeis, Robertson, e1996). Site 966 is located on the northern margin of the plateauof the Eratosthenes Seamount in a water depth of 940 m. Site 9located on a small ridge trending west-southwest to east-northethe base of the northern slope of the Eratosthenes Seamount in2554 m deep. The samples from Holes 966F and 967E consist obonate rocks, some pure but most with small admixtures of clay
Little information is available on the acoustic behavior of carbates. Several studies have been made (e.g., Rafavich et al. Anselmetti and Eberli, 1993; Kenter and Ivanov, 1995; Kenter e1997a, 1997b) that show the primary factors controlling acousticlocity in nearly pure carbonates are both the amount and type orosity, diagenetic properties, and mineralogy. The classic velotransforms, Wyllie’s time-average equation (Wyllie et al., 1958) Gardner’s empirical relation (Gardner et al., 1974), can predicP-wave velocity from porosity or bulk density in single data sets,fail to account for the variation in velocity at a given porosity valFor carbonates in general, such empirical relationships have bigitations because they do not take into account the type of porositagenetic parameters or mixed mineralogy (e.g., Anselmetti and Eli, 1993; Kenter et al., 1997a). In general, the empirical equationcarbonates do not satisfactorily explain much of the variationserved in discrete data sets. Trends in most published data, howfollow the time average and Gardner et al.’s (1974) equation. thus accepted that the latter two relationships represent fundamphysical principles in the elastic behavior of sedimentary ro(Bourbié et al., 1987). As such, even though extrinsic parameterpressure and temperature are different, velocity-porosity and vety-density relationships in log data should obey general trendsserved in the empirical relationships (Theys, 1991).
1

J.M. WOODSIDE, J.A.M. KENTER, A. KÖHNEN
ts c. T dssors
d
( for
ights thatmitef do-. Ally do-
es of
ostes-CaO us-
the re-ate.sing
sured
iumf car-inly
alu- and, ac-
holeich-luesedfor-ngeffectsulk
Lith-os-ver-ringor-tson, ob-her-de-
OM,
s inaluellielo-ersityent vs.urve this
shiplowg in-
In this paper, we report on the controls of the acoustic propertiesof the nearly pure carbonates recovered from Holes 966E and 967F.In addition, we compare and evaluate the variations in velocity, den-sity, and porosity between the discrete data set and the wireline log-ging data. Our main objective is to assess the reliability and qualityof the wireline logging data when used for synthetic seismograms toaid in correlating the rock record with seismic reflection data.
METHODS
Although sufficient for our purposes, the sampling was not idealbecause of poor core recovery. Recovery for Holes 966F and 967Ewas 22.1% and 14.8%, respectively. Sixty-eight minicores (or coreplugs of 2.54 cm in diameter and of similar length) were taken fromthese cores. The downhole representation of physical properties bythe samples is limited by (a) the possibly poorly representative recov-ery, and (b) the limited sampling within the recovered sections. Fur-thermore, the samples are not evenly distributed over the depth rangebecause of bad recovery from several depth intervals. The minicoreswere stored in plastic containers filled with seawater from the cores.Twenty-four samples were taken from Hole 966F between 125 and350 mbsf, and 43 samples from Hole 967E between 130 and 410mbsf. One sample from Hole 967A is included because it was veryclose to Hole 967E. Fifty-nine samples were oriented vertically andnine horizontally to check for anisotropy in the direction of measure-ments.
Measurements of sonic velocity under in situ pressure conditionsand other petrophysical properties (bulk density, grain density, andporosity) were made on the 68 2.54-cm-diameter core plugs. Thinsections were made from all samples for petrographic observations toclassify the samples by rock fabric and by type of porosity. The phys-ical properties measurements were combined with values of carbon-ate content and X-ray fluorescence spectroscopy (XRF) observationsto determine the mineralogic composition of the samples. In the lab-oratory, the core plugs were removed from their seawater immersionand stored in a seawater equivalent under vacuum for a period of 72hr to ensure that they were saturated with brine.
The experimental procedure for obtaining the acoustic velocitiesinvolves measuring the one-way travel time along the sample axisand dividing by the sample length. In the experiment, a source and re-ceiver pair of similar crystals are selected through an ultrasonic signalselector switch. The source crystal is excited by a fast rise time elec-trical voltage pulse, which produces a broadband ultrasonic pulsewith frequencies between 300 and 800 kHz. The arrival time ispicked when the signal exceeds a threshold voltage equal to 3% of theoverall peak-to-peak amplitude of the first three half-cycles of thesignal. Precision of the velocity measurement in low-porosity car-bonates is within approximately 0.5%. The ultrasonic measurementswere conducted at effective pressures ranging from 2 to 40 MPa inconfining/pore pressure combinations of 2/0, 6/2, 12/4, 21/7, 45/15,and 60/20 and back in the same steps to 6/2 MPa; however, the valuesreported here were all from measurements made at 12/4 MPa with aneffective pressure of 8 MPa.
Following the measurement of the acoustic velocities, saturatedsample mass and sample volume were measured with the assumptionthat the samples were perfectly cylindrical (within the estimated errorof ≤0.1% and ≤2% respectively, including possible “rebound” effecassociated with the reduced pressure at the return to laboratoryditions). Subsequently, the samples were dried for 72 hr at 70°Cdry mass of the samples was measured, and the wet-bulk andbulk densities (ρb and ρd) calculated from the saturated and dry maand volume, respectively, each with an estimated possible err≤2%. From each sample, subsamples were taken for the meaments of grain density and carbonate content. Grain density (ρg) wascalculated to better than 1% from the mass and volume of the powmeasured with a helium pycnometer. Total porosity (φ) was calculat-
2
on-hery-, ofure-
er,
ed (estimated error of 3%) from the grain density and dry densityρgand ρd). Table 1 summarizes the petrophysical measurementsSites 966F and 967E, respectively.
X-ray fluorescence spectroscopy was used to define the wepercentages of the predominant minerals. In 25 selected samplerepresent the different lithologies, the weight percentages of doloand calcite in the samples were calculated from the partitioning olomite and calcium carbonate as determined from the XRF datathe MgO present in the samples was assumed to be contributed blomite. The selected samples containing high weight percentagMgO do not contain relevant amounts of SiO2 and Al2O3, thus ex-cluding the presence of clay minerals that would be the other mlikely contributor of MgO. We can not exclude, however, the prence of clay minerals in the remaining samples. The amount of and MgO needed for the precipitation of dolomite was calculateding an MgO:CaO ratio of 10:8 (Reeder, 1983). After subtractingCaO calculated for the dolomite from the total amount of CaO, themaining CaO was assumed to be entirely from calcium carbonDolomite content in 100% carbonate samples was calculated uthe grain density data from Table 1. Carbonate content was meafollowing the “Scheibler” procedure which has a precision of ≤3%(Kenter et al., 1997b). The two standards for dolomite and calccarbonate were added and checked against the total amount obonate. The non-carbonate fraction, or insoluble residue, is maorganic material and small amounts of quartz. As stated earlier,minum oxides are only present in very small weight percentagesas such, are negligible. The microscopic fabrics were classifiedcording to the system described by Lucia (1995).
Shipboard measurements of physical properties and downwireline logging are described in detail by Emeis, Robertson, Rter, et al. (1996). Wireline logging data provided independent vaof P-wave velocities, porosity, and bulk density. A Long-SpacSonic Tool and a Digital Sonic Tool were used to obtain in situ mation velocities at each hole, with a vertical resolution in the raof 0.61 m, assuming that the measurements were free from the eof formation damage and enlarged bore hole from the drilling. Bdensity measurements were obtained by High-Temperature odensity Tool with a vertical resolution of around 0.45 m. The pority was derived from a Compensated Neutron Porosity Tool to a tical resolution also of about 0.45 m. Caliper measurements dulogging provided both an indication of hole conditions and key infmation that was used in correcting logging data (Emeis, RoberRichter, et al., 1996). The logging data used in this study weretained directly from the Borehole Research Group at Lamont-Doty Earth Observatory, following processing and correction as scribed in Emeis, Robertson, Richter, et al. (1996; see CD-Rback pocket, this volume).
RESULTS
Cross plots of discrete measurements of P-wave velocity vs. po-rosity and density for both holes are shown in Figure 1. VelocitieHole 966F show a variation of about 1 km/s at a given porosity vand generally follow the trend of the time-average curves by Wyet al. (1958) for 4.5 km/s to 7.3 km/s (the matrix velocity of domite). However, velocities in Hole 967E plot considerably highthan the time-average equation would predict. The velocity-pororange of core plugs from the two holes have significantly differranges that show little overlap. Similarly, cross plots of densityvelocity show that Hole 966F data scatter around the limestone cof Gardner et al. (1974), whereas the Hole 967F data lie abovecurve (Fig. 1B).
Figure 2A shows that insoluble residue has a clear relationwith sonic velocity for both holes. At insoluble residue values beabout 1%-4%, velocities are higher than 3.6 km/s. With increasin

ACOUSTIC PROPERTIES CONTROLS AND GROUND TRUTH
Table 1. Summary of index properties and acoustic properties for samples from Sites 966 and 967.
Notes: Vp = P-wave velocity or compressional-wave velocity; Vs = S-wave velocity or shear-wave velocity; CaCO3 = carbonate fraction of total weight of sample determined with car-bonate bomb; dolomite = dolomite fraction calculated from xrf weight percentages of MgO and CO3, assuming that no relevant amounts of clays are present (see text for discus-sion).
Laboratory number
Core, section,interval (cm)
Depth (mbsf)
Dry density (g/cm3)
Bulk density (g/cm3)
Grain density (g/cm3)
Porosity (fraction)
Vp (km/s)
Vs(km/s) Vp/Vs
CaCO3 (wt%)
Dolomite (wt%)
160-966F-1 8R-1, 58-62 125.58 2.19 2.37 2.722 0.20 4.797 2.402 1.997 0.97 0.052 10R-1, 105-109 145.25 2.33 2.45 2.751 0.15 5.646 2.938 1.922 1.00 0.223 10R-2, 37-41 146.07 2.56 2.60 2.757 0.07 5.722 3.022 1.893 1.00 0.264 11R-1, 119-122 154.99 2.07 2.30 2.757 0.25 4.349 2.371 1.835 1.05 0.275 12R-1, 114-116 164.64 2.39 2.53 2.813 0.15 5.550 3.031 1.831 1.08 0.646 12R-1, 117-121 164.67 2.41 2.54 2.873 0.16 5.430 3.035 1.789 1.06 1.057 13R-1, 87-91 173.97 1.97 2.22 2.717 0.27 4.078 2.230 1.828 0.99 0.008 14R-1, 125-129 183.95 2.37 2.52 2.828 0.16 5.580 3.082 1.811 1.06 0.749 15R-1, 4-8 192.44 2.54 2.60 2.838 0.10 6.151 3.117 1.973 1.08 0.81
10 15R-1, 139-143 193.79 2.32 2.49 2.850 0.19 5.359 2.967 1.806 1.08 0.8911 16R-1, 60-64 202.60 2.26 2.44 2.834 0.20 5.287 2.803 1.886 1.05 0.7912 16R-2, 44-48 203.93 2.31 2.48 2.853 0.19 5.556 3.060 1.816 1.06 0.9113 17R-3, 87-91 215.33 2.03 2.30 2.846 0.29 4.623 2.528 1.829 1.07 0.8614 18R-1, 144-148 222.74 2.13 2.37 2.814 0.24 4.486 2.497 1.797 1.08 0.6515 19R-2, 125-129 233.63 1.98 2.25 2.762 0.28 3.712 1.857 1.998 1.00 0.3016 26R-3, 60-64 301.11 1.77 2.04 2.682 0.34 3.066 1.668 1.838 0.63 0.0017 27R-1, 9-14 307.99 1.60 1.98 2.696 0.41 2.948 1.536 1.919 0.77 0.0018 28R-2, 56-60 318.68 1.73 2.09 2.708 0.36 3.053 1.578 1.935 0.89 0.0019 28R-2, 62-65 318.74 1.73 2.08 2.710 0.36 3.252 1.682 1.933 0.92 0.0020 28R-5, 139-143 323.81 1.83 2.14 2.706 0.32 3.242 1.688 1.921 0.88 0.0021 30R-1, 78-80 337.58 1.72 2.08 2.708 0.36 3.299 1.682 1.961 0.89 0.0022 30R-1, 81-85 337.61 1.72 2.07 2.710 0.37 3.103 1.623 1.911 0.92 0.0023 31R-1, 2-6 346.42 1.95 2.21 2.710 0.28 3.350 1.727 1.940 0.92 0.0024 31R-3, 43-48 349.65 1.95 2.22 2.709 0.28 3.404 1.786 1.906 0.91 0.0025 16X-1, 15-21 138.85 1.72 2.07 2.695 0.36 2.418 0.76 0.00
160-967E-26 3R-1, 130-133 130.00 1.72 2.06 2.697 0.36 2.522 1.230 2.051 0.79 0.0027 4R-2, 111-120 140.89 1.78 2.11 2.707 0.34 2.665 1.304 2.043 0.89 0.0029 5R-1, 135-140 149.35 1.79 2.12 2.709 0.34 2.963 1.500 1.976 0.91 0.0030 5R-2, 1-9 149.45 1.80 2.12 2.714 0.34 2.969 1.496 1.985 0.91 0.0331 5R-3, 1-10 150.91 1.70 2.04 2.708 0.37 2.728 1.458 1.871 0.89 0.0032 5R-4, 93-103 153.14 1.76 2.09 2.707 0.35 2.847 1.438 1.979 0.88 0.0033 6R-1, 58-67 158.28 1.81 2.14 2.708 0.33 3.012 1.568 1.921 0.90 0.0034 6R-2, 34-47 159.51 1.73 2.07 2.709 0.36 2.861 1.555 1.840 0.91 0.0035 6R-3, 35-40 160.78 1.68 2.04 2.703 0.38 2.709 1.356 1.998 0.85 0.0036 7R-1, 30-38 167.60 1.66 2.04 2.720 0.39 2.881 1.429 2.015 0.88 0.1137 8R-1, 21-29 177.11 1.56 1.96 2.696 0.42 2.292 0.78 0.0038 8R-2, 31-37 178.60 1.66 2.01 2.702 0.39 2.624 1.429 1.836 0.83 0.0139 9R-1, 95-98 87.45 1.77 2.11 2.715 0.35 3.159 1.619 1.951 0.93 0.0340 9R-2, 30-33 188.06 1.71 2.03 2.729 0.37 2.919 1.520 1.920 0.91 0.1541 9R-3, 38-41 189.31 1.67 2.02 2.769 0.40 3.083 1.640 1.880 0.94 0.4142 10R-1, 120-126 197.40 1.64 2.03 2.757 0.41 2.922 1.501 1.946 0.95 0.3143 10R-2, 42-49 198.00 1.65 2.04 2.737 0.40 2.917 1.510 1.932 0.93 0.1944 10R-3, 85-90 199.75 1.65 2.04 2.732 0.40 3.060 1.583 1.932 0.95 0.1445 11R-1, 60-66 206.40 1.56 1.97 2.710 0.42 2.990 1.531 1.952 0.92 0.0046 11R-2, 77-82 207.60 1.72 2.07 2.710 0.37 2.994 1.504 1.990 0.92 0.0047 11R-3, 32-38 208.15 1.65 2.03 2.708 0.39 2.990 1.523 1.963 0.90 0.0048 12R-1, 81-86 216.21 2.710 3.137 0.92 0.0049 12R-3, 65-70 218.81 1.65 2.04 2.713 0.39 3.011 1.544 1.949 0.95 0.0050 13R-1, 129-135 226.39 1.74 2.09 2.715 0.36 3.167 1.623 1.951 0.97 0.0051 13R-2, 82-88 227.36 1.73 2.08 2.711 0.36 3.089 1.559 1.981 0.93 0.0052 14R-1, 99-104 235.69 1.72 2.07 2.710 0.37 3.117 1.575 1.980 0.92 0.0053 14R-2, 37-43 236.57 1.77 2.11 2.713 0.35 3.093 1.584 1.953 0.94 0.0054 15R-1, 28-36 244.58 1.75 2.10 2.711 0.35 3.011 1.549 1.944 0.93 0.0055 15R-2, 113-118 246.86 1.71 2.01 2.710 0.37 2.887 1.545 1.869 0.92 0.0056 16R-1, 52-56 254.42 1.65 1.95 2.711 0.39 2.917 1.636 1.783 0.93 0.0057 16R-2, 128-133 256.68 1.82 2.15 2.711 0.33 2.989 1.493 2.001 0.92 0.0058 16R-3, 72-79 257.57 1.72 2.08 2.710 0.37 3.059 1.556 1.967 0.92 0.0059 17R-1, 70-77 264.20 1.84 2.15 2.710 0.32 3.109 1.602 1.941 0.92 0.0060 17R-2, 87-92 265.77 1.80 2.13 2.709 0.33 3.019 1.510 1.999 0.91 0.0061 18R-1, 124-128 274.34 1.85 1.97 2.700 0.32 2.985 0.81 0.0062 18R-2, 64-70 275.02 1.53 1.95 2.714 0.44 2.919 1.493 1.955 0.96 0.0063 18R-3, 86-90 276.66 1.68 2.05 2.714 0.38 3.100 1.610 1.925 0.96 0.0064 19R-1, 108-112 283.78 1.87 2.09 2.708 0.31 3.257 0.90 0.0065 25R-2, 77-83 342.73 1.85 2.18 2.710 0.32 3.122 1.663 1.877 0.92 0.0066 28R-1, 85-90 370.15 1.74 2.08 2.711 0.36 3.132 1.658 1.888 0.93 0.0067 29R-1, 54-59 379.34 2.02 2.24 2.706 0.25 3.356 0.88 0.0068 32R-1, 30-35 408.00 1.92 2.20 2.715 0.29 3.627 1.918 1.891 0.96 0.00
re inure-
soluble residue from about 1%-4% up to 25% (range in insoluble res-idues for the data set), velocity displays a very gradual, nearly linear,decrease from 3.6 km/s to about 2.5 km/s. Dolomite shows a compa-rable but inverted and more scattered effect on sonic velocity (Fig.2B). Samples with dolomite content lower than about 50% have ve-locities ranging from 2.3 to nearly 6 km/s, whereas samples with do-lomite content higher than 50% have velocities between 4.2 and 6km/s.
Petrographic analyses of thin sections were used to classify thesamples in six different groups based on fabric and pore type accord-ing to Lucia (1995) and Dunham (1962; Fig. 2C). Two groups (thecalcitic grainstone and the calcitic mudstone) are not statistically use-ful for correlation purposes because they are represented by only oneor two samples. The two dolomite groups (dolomite wackestones andmudstones, Lucia’s [1995] groups 2.4 and 2.5, respectively) aagreement with the dolomitic group determined from XRF meas
3

J.M. WOODSIDE, J.A.M. KENTER, A. KÖHNEN
u9
srio,
ms
naoof i6 h ah b
en- of no(see
leata
8e
n.
ments. They are recrystallized shallow-water rocks with fossil frag-ments recrystallized to micrite grain size, and rocks with pore spacesthat are filled with crystals of sparite up to 100 µm. The calcite gro(mud-dominated packstone and wackestones of Lucia’s [19groups 3.1 and 3.3, respectively) correspond to the calcite grouptermined from XRF measurements; they are foraminiferal deepsediments with foraminifers up to 450 µm, but they also contain thmixed calcite-dolomite samples. In general, there is no clear relatship between petrographic grouping and sonic velocity. Insteadseems that mineralogy, variations in insoluble residues, and dolocontent are overprinting the effect of texture and fabric on acoubehavior of the samples.
The discrete measurements of physical properties as a functiodepth in each hole are plotted in Figures 3 and 4 along with the sphysical properties determined from the wireline logs. What is mobvious is that the log-derived values and the measured values dcoincide for the upper part of Hole 966F (above about 218 mbsFig. 3) and are offset from each other in Hole 967E, but show simtrends (Fig. 4). The two data sets from the lower section of Hole 9correspond relatively well. The greatest discrepancies betweenwireline data and the laboratory measurements occur where theconditions are poorest, as indicated either by large variations inhole diameter shown by the caliper measurements (given for ehole in Figs. 3, 4) or by the hole diameter exceeding the breadtthe calipers in their most extended condition (e.g., the section
Vp
(Pe=
8 M
Pa, k
m/s
)
Porosity (fraction)
dolomite
calcite
5.5 km/s4.5 km/s
1
2
3
4
5
6
0 0.1 0.2 0.3 0.4 0.5 0.6 0.7
Bulk density (g/cm3)
general
limestone
dolomite
1
2
3
4
5
6
1.2 1.4 1.6 1.8 2 2.2 2.4 2.6 2.8
HOLE 966FHOLE 967E
HOLE 966FHOLE 967E
A
B
Vp
(Pe=
8 M
Pa, k
m/s
)
Figure 1. Cross plots of P-wave velocity for (A) porosity fraction, with Wyl-lie’s time-average equations for dolomite and calcite (Wyllie et al., 195and (B) bulk density, with curves from Gardner’s empirical studies of limstone, dolomite, and shale (Gardner et al., 1974).
4
ps5]de-eaeen- ititetic
ofmest notin
lar6Ftheole
thech ofe-
tween 240 and 280 mbsf in Hole 966F, where the Shipboard Scitific Party [1996a] reported very low recovery and the presencefracturing in the rocks). Where the calipers are wide open there isguarantee that the sensor pads are against the wall of the hole also Paillet and Cheng, 1991).
Strong variability in the hole diameter in the upper part of Ho966F coincides with the largest discrepancies between the two d
),-
0 0.05 0.1 0.15 0.2 0.25 0.31
2
3
4
5
6
HOLE 966FHOLE 967E
Insoluble residue (fraction)
AThreshold at 1% - 4%
Vp
(Pe=
8 M
Pa, k
m/s
)
0 0.2 0.4 0.6 0.8 11
2
3
4
5
6
HOLE 966FHOLE 967E
B
Dolomite (fraction)
Vp
(Pe=
8 M
Pa, k
m/s
)
Calcitic grainstoneDolomitic wackestoneDolomitic mudstoneCalcitic packstoneCalcitic wackestoneCalcitic mudstone
Porosity (fraction)
dolomite
calcite
5.5 km/s4.5 km/s
1
2
3
4
5
6
0 0.1 0.2 0.3 0.4 0.5 0.6 0.7
C
Vp
(Pe=
8 M
Pa, k
m/s
)
Figure 2. Dependence of P-wave velocity on fraction of each sample contain-ing (A) insoluble residues, where gray box shows transition zone betweeninsoluble residues, and (B) dolomite. The dependence of P-wave velocity onporosity fraction for all the samples (C) is shown with the rock fabric typeindicated according to Lucia’s (1995) classification. See text for discussio

ACOUSTIC PROPERTIES CONTROLS AND GROUND TRUTH
1 0 1 4 1 8 0 . 2 0 . 4 0 . 6 2 3 4 5 1 . 6 2 2 . 4 4 8 1 2
Hole 966F
CNT porosity (fraction)
SDT longspacedVp (km/s)
HLDT density(g/cm)
Impedance(106 kgs-1m-2)
5 0
1 0 0
1 5 0
2 0 0
2 5 0
3 0 0
3 5 0
Dep
th (
mbs
f)
218
Zone of graysapropels
Zone of massmovements and
debris flows
Zone offracturing;no recovery
Lithologic Units
Remarks
Bivalves
Oncolites
Coralgal
Chert
Zon
e of
bio
clas
tic li
mes
tone
Bryozoa
I
II
III
IV
Zone of bituminouscalcilutite with
foraminifers
Bioturbatedbiomicrite with
foraminifers
Lithology
Caliper (inch)
Figure 3. Physical properties of the core plugs (open circles) plotted on the corresponding log-derived downhole variations of the same parameters for Hole966F (continuous solid lines). Also shown are the general lithology and caliper log on the left. Depths are in meters below seafloor (mbsf). The two intervalsindicated by the solid line through all parts of the figure have specific velocity-porosity relationships. See text for discussion.
0.eud th
tt h flrre
hevu
e neu-osity.icalt var-d to
ree ofe,ecteds becity, very
cross-
966Frvesy the
the a sig-
sets. It is only in the deeper part of the hole (below 300 mbsf in Fig.3) that the data sets agree, where the caliper reading is around 12 in.Although some spikes in the P-wave velocity indicate values as highas the laboratory measurements, there is no correlation between thetwo. It is clear that in the upper part of the hole there is a lower limitset for the P-wave velocities, to which unrealistically low values areset. The spikes in the bulk density are primarily in the opposite direc-tion to the level of the laboratory measurements, which are all ~0.2 g/cm3 higher than the wireline log level above 218 mbsf. The ntron porosity is consistently about twice as high as the measurerosities. This difference is nearly two orders of magnitude larger the estimated error in the laboratory measurements (≤3%).
The caliper log indicates that Hole 967E (Fig. 4) is in much becondition than Hole 966F. There are only a few places where thediameter is excessively large and where there are very few largetuations in hole diameter downhole. This is reflected in better colation between the log-derived physical properties and those msured on the core plugs. There is an increasing difference downbetween the neutron porosity and the measured porosity; howthe other plots in Figure 4 show the same trends for both meas
1–-
po-an
eroleuc-e-a-
oleer,red
and log-derived parameters. Density and P-wave velocities derivedfrom the wireline logs are less than the measured values, and thtron porosity tends to overestimate the laboratory measured por
An important additional way to evaluate the log-derived physproperties in comparison to the measured values is to cross ploious combinations of parameters, which are theoretically relateeach other in definable ways. For example, the greater the degporosity in a sample, the lower the P-wave velocity is expected to band the greater the bulk density of a sample, the greater the expP-wave velocity in general. Density and porosity may sometimeused as a proxy for acoustic velocity. In the cross plots of velodensity, and porosity that are shown in Figures 5 and 6, there is ahigh degree of scatter in the log-derived parameters, as well as overs with discrete data and empirical relationships.
The measured velocities, porosities, and densities for Hole samples shown in Figure 5 do not follow closely the empirical cuor discrete measurements also plotted. They do show roughlsame trends, however, except that the decrease in P-wave velocitywith increasing porosity fraction is greater than that shown bycurves for nearly pure carbonates. Secondly, the log data show
5
J.M. WOODSIDE, J.A.M. KENTER, A. KÖHNEN
1 2 1 4 1 6 1 8 0 . 2 0 . 4 0 . 6 1 2 3 4 5 1 . 6 1 . 8 2 2 . 2 2 4 6 8 1 0 1 2
Hole 967E
CNT porosity (fraction)
SDT longspacedVp (km/s)
HLDT density(g/cm)
Impedance(106 kgs-1m-2)
1 0 0
2 0 0
3 0 0
4 0 0
5 0 0
6 0 0
134
173
383
Dep
th (
mbs
f)
Remarks
Foraminiferal-nannofossil chalk to
calcareous ooze
Calcareous chalkwith foraminiferal
ooze
Calcareous chalkwith foraminiferal
ooze
Porous biospariteforaminiferal ooze -
nanno chalk
Well-cementedshallow water
grainstone
Limestone breccia
Nannofossil ooze -rock fragments -
recrystallized calcite
II
III
IV
V
Lithologic Units
Lithology
Caliper (inch)
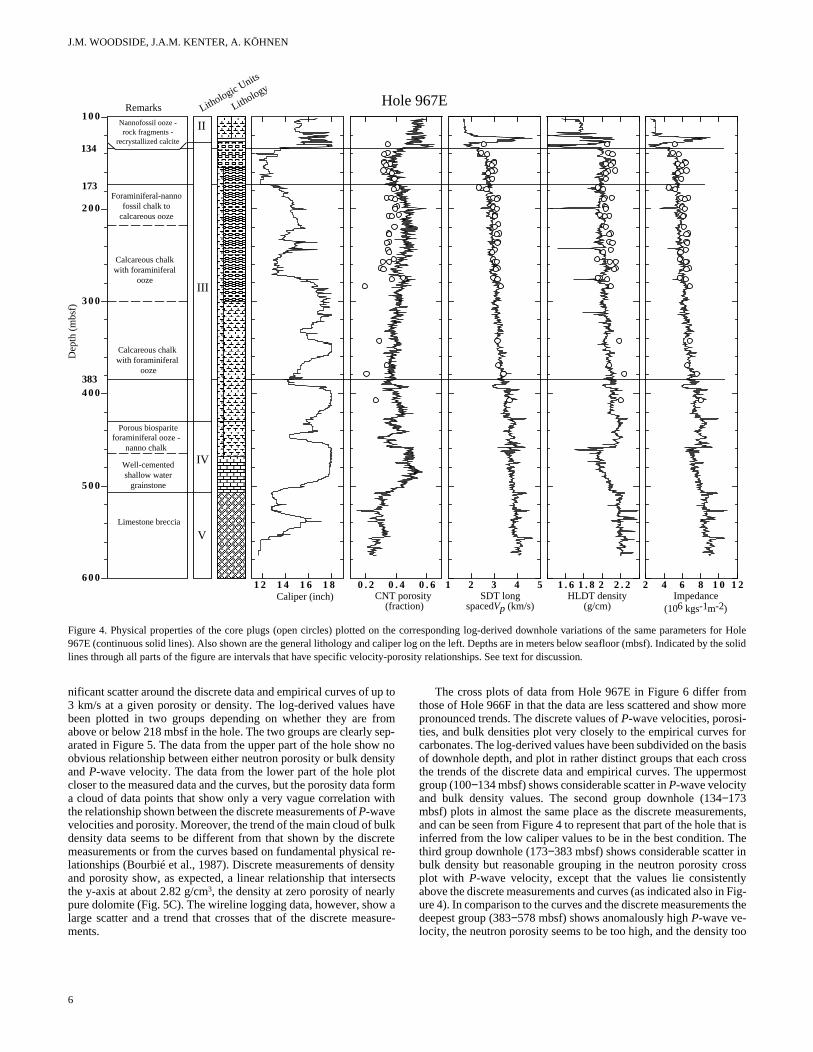
Figure 4. Physical properties of the core plugs (open circles) plotted on the corresponding log-derived downhole variations of the same parameters for Hole967E (continuous solid lines). Also shown are the general lithology and caliper log on the left. Depths are in meters below seafloor (mbsf). Indicated by the solidlines through all parts of the figure are intervals that have specific velocity-porosity relationships. See text for discussion.
nsselywas
ore
orasis
ossost
ents,at ishenss
ly Fig-s the
too
nificant scatter around the discrete data and empirical curves of up to3 km/s at a given porosity or density. The log-derived values havebeen plotted in two groups depending on whether they are fromabove or below 218 mbsf in the hole. The two groups are clearly sep-arated in Figure 5. The data from the upper part of the hole show noobvious relationship between either neutron porosity or bulk densityand P-wave velocity. The data from the lower part of the hole plotcloser to the measured data and the curves, but the porosity data forma cloud of data points that show only a very vague correlation withthe relationship shown between the discrete measurements of P-wavevelocities and porosity. Moreover, the trend of the main cloud of bulkdensity data seems to be different from that shown by the discretemeasurements or from the curves based on fundamental physical re-lationships (Bourbié et al., 1987). Discrete measurements of deand porosity show, as expected, a linear relationship that interthe y-axis at about 2.82 g/cm3, the density at zero porosity of nearpure dolomite (Fig. 5C). The wireline logging data, however, sholarge scatter and a trend that crosses that of the discrete mements.
6
itycts
aure-
The cross plots of data from Hole 967E in Figure 6 differ fromthose of Hole 966F in that the data are less scattered and show mpronounced trends. The discrete values of P-wave velocities, porosi-ties, and bulk densities plot very closely to the empirical curves fcarbonates. The log-derived values have been subdivided on the bof downhole depth, and plot in rather distinct groups that each crthe trends of the discrete data and empirical curves. The uppermgroup (100−134 mbsf) shows considerable scatter in P-wave velocityand bulk density values. The second group downhole (134−173mbsf) plots in almost the same place as the discrete measuremand can be seen from Figure 4 to represent that part of the hole thinferred from the low caliper values to be in the best condition. Tthird group downhole (173−383 mbsf) shows considerable scatter ibulk density but reasonable grouping in the neutron porosity croplot with P-wave velocity, except that the values lie consistentabove the discrete measurements and curves (as indicated also inure 4). In comparison to the curves and the discrete measurementdeepest group (383−578 mbsf) shows anomalously high P-wave ve-locity, the neutron porosity seems to be too high, and the density

ACOUSTIC PROPERTIES CONTROLS AND GROUND TRUTH
igtio th
xt
ghtionthe allt for
dolomite
calcite
5.5 km/s4.5 km/s
73-218 mbsf218-330 mbsf
Hole 966Fdiscrete measurements
1
2
3
4
5
6
0 0 . 1 0 . 2 0 . 3 0 . 4 0 . 5 0 . 6 0 . 7
1 . 2
1 . 4
1 . 6
1 . 8
2 . 2
2 . 4
2 . 6
2 . 8
2.0
0 0 . 1 0 . 2 0 . 3 0 . 4 0 . 5 0 . 6 0 . 7
C
discrete measurements
Hole 966F
73-218 mbsf218-330 mbsf
Porosity, (fraction)
Bul
k de
nsity
, b
(g/
cm3)
1 . 2 1 . 4 1 . 6 1 . 8 2 2 . 2 2 . 4 2 . 6 2 . 81
2
3
4
5
6
Vp
(Pe=
8 M
Pa, k
m/s
)
Porosity (fraction)
Bulk density (g/cm3 )
general
limestone
dolomite
Hole 966F
A
B discretemeasurements
Vp
(Pe=
8 M
Pa, k
m/s
)
73-218 mbsf218-330 mbsf
b = 2.82 - 2.06 ,R= 0.98
Figure 5. Cross plots of P-wave velocity for (A) porosity, (B) bulk density,and (C) bulk density plotted against porosity, for different intervals in Hole966F. Discrete measurements are shown as large open squares, and the log-derived values are plotted according to their depth range below seafloor. Alsoshown are Wyllie’s curves in (A) and Gardner’s curves in (B). The straline in (C) is the best fit through the data, with the coefficient of correlagiven as R. Note that the log-derived porosity-velocity relationships forvarious intervals (indicated in Fig. 3) each have a different trend, anddeviate from the discrete data and general velocity transforms. See tediscussion.
htne
all for
1.2 1.4 1.6 1.8 2 2.2 2.4 2.6 2.81
2
3
4
5
6
Vp
(Pe=
8 M
Pa, k
m/s
)
Bulk density (g/cm3)
general
limestone
dolomite
Hole 967E
100-134 mbsf134-173 mbsf173--383 mbsf383-578 mbsf
B
discrete measurements
1
2
3
4
5
6
0 0.1 0.2 0.3 0.4 0.5 0.6 0.7
Bul
k de
nsity
, b
(g/
cm3 )
Porosity, (fraction)
1.2
1.4
1.6
1.8
2.2
2.4
2.6
2.8
2.0
0 0.1 0.2 0.3 0.4 0.5 0.6 0.7
b = 2.62 -1.52 , R= 0.84
100-134 mbsf134-173 mbsf173--383 mbsf383-578 mbsf
Hole 967E
C
discrete measurements
dolomite
calcite
5.5 km/s4.5 km/s
Porosity (fraction)
100-134 mbsf134-173 mbsf173--383 mbsf383-578 mbsf Hole 967E
A
discrete measurements
Vp
(Pe=
8 M
Pa, k
m/s
)
Figure 6. Cross plots of P-wave velocity for (A) porosity, (B) bulk density,and (C) bulk density plotted against porosity, for different intervals in Hole967E. Discrete measurements are shown as large open squares, and the log-derived values are plotted according to their depth range below seafloor. Alsoshown are Wyllie’s curves in (A) and Gardner’s curves in (B). The strailine in (C) is the best fit through the data, with the coefficient of correlatgiven as R. Note that the log-derived porosity-velocity relationships for various intervals (indicated in Figure 4) each have a different trend, anddeviate from the discrete data and general velocity transforms. See texdiscussion.
7

J.M. WOODSIDE, J.A.M. KENTER, A. KÖHNEN
Tl
th du ~oooeo, uce
a1w
be the
ig- Holetage’sive
d byf thepopu-slight
hipig-6F. low
s. Ittime84])catter
r, but notithin
forshal-s, asilart sec-ge.ions thection that
po-B),ouldpear that that
werebsf,
. Theis-to below.e seen onee the the
mea-com-ismo-ith
anderal.of theetic
erivedwed re-
ismo-s theicantis the
low. Similarly, density-porosity relationships cross those of discretemeasurements and their trends would suggest deviations of 2.1 to 2.3g/cm3 at zero porosity for nearly pure carbonate (Fig. 6C).
DISCUSSION
The controls on the acoustic properties of carbonate rocks, in or-der of significance, are porosity, insoluble residue, and dolomite con-tent. In general the Hole 966F data follow the time-average equationby Wyllie et al. (1958) and the limestone curve by Gardner et al.(1974). The relationships are very similar to published data of nearlypure carbonates (e.g., Anselmetti and Eberli, 1993; Anselmetti, 1994;Kenter and Ivanov, 1995). The negative effect of insoluble residue onthe acoustic velocities of carbonates has earlier been documented byKing et al. (1992) and Stafleu et al. (1994). Careful study of the dif-ferent dolomite textures shows that the most common is dolomite re-placement after calcite: in other words, mimetic dolomite cement.According to recent findings by F.S. Anselmetti (pers. comm., 1997)and published work by Anselmetti (1994), the mimetic dolomitemaintains velocities that, at given porosities, are even higher than thematrix velocity of the dolomite crystal (~7.2 km/s at 0% porosity).
In general, the time-average equation of Wyllie et al. (1958) andthe empirical limestone equation by Gardner et al. (1974) fail to ex-plain the variation of P-wave velocity at a given porosity value butthe laboratory data do show a similar trend. Whether from wirelinelogs or discrete laboratory measurements, it is expected that velocity,porosity, and density interrelationships remain similar. The wirelinelogging data, however, show excessive scatter and, for certain inter-vals, trends that cross those present in the discrete data and thoseknown from the literature (e.g., Wyllie et al., 1958; Gardner et al.,1974; Rafavich et al., 1984; Anselmetti and Eberli, 1993; Kenter andIvanov, 1995; Kenter et al., 1997b) The scatter present along the gen-eral trends of velocity-porosity and velocity-density transforms canbe attributed to the effect of parameters like mineralogy, cement type,pore type, and so on. Extrinsic parameters like pressure and temper-ature will certainly have an effect on the variation along these trendsbut not change the orientation of the trend. This is similar to the betterdocumented relationships in siliciclastic systems.
In all of the figures and the table, the measured values should beconsidered to be accurate representations of the downhole variationsof physical properties from discrete samples of the different forma-tions because the laboratory conditions approximate the in situ con-ditions of the samples. The values obtained from the wireline logs aredependent on hole conditions, the calculations that transform thelogged data into the acoustic parameters (including the correctionsthat compensate for variations in the hole condition), and sensitivityand resolution of the tools, regardless of the skill of the loggers. Un-der poor hole conditions it can be expected that the wireline data mayshow low P-wave velocities and density and high neutron porosity(Theys, 1991; Paillet and Cheng, 1991; Bourbié et al., 1987). wireline data used here from Holes 966F and 967E vary in quafrom good to very poor, with more poor data than good data. Ofactors that may bias or affect the comparison between discreteand log data are different scales, acoustic frequencies, and measdistances. For example, the sonic tool averages velocities overcm and therefore “smooths” thin alternations of high and low velities toward lower log velocities. Finally, the presence of a borehis a physical discontinuity of the petrophysical properties of the fmation (Bourbié et al., 1987). It is apparent that post-logging corrtions to the data (already applied to these data) may locally shift sunrealistic relationships to more physically accepted values (e.g.realistically low velocities shifted up to 1.550 km/s), but the corretions do not necessarily render the data consistent with the documed velocity transforms for the given rock formations.
Based on the caliper data the wireline data plotted in Figure 3clearly of poor quality in the upper section of the hole, above 2mbsf (and possibly from above 290 mbsf). The discrete data sho
8
heityerataring60
c-ler-c-men--nt-
re8 a
certain variability also, suggesting that a variable lithology mayone of the reasons for the variability in the condition of the hole inupper section. Figure 5 shows that there is a group of high P-wave ve-locity samples from Hole 966F that does not fit Wyllie’s curves. Fure 2 indicates that the reasons for this are that the upper part of966F contains nearly pure carbonate of which a very high percenis dolomite with a moldic, vuggy pore type, in terms of Lucia(1995) classification. Downhole, the dolomitic wackestones gway to calcitic carbonates that plot closer to the curves deriveWyllie et al. (1958). Thus, the apparent discrepancy in trend odata with respect to the curves could be seen as a result of two lations of data that are simply separated from each other by a shift in P-wave velocity near a porosity value of 0.25 to 0.30.
The scatter of wireline data and lack of a well-defined relationsof P-wave velocity to either bulk density of neutron porosity in Fure 5 confirms the poor quality of the log-derived data for Hole 96The data from the upper part of the hole form a cluster near thevelocity limit, almost regardless of density and porosity variationis assumed that corrections to the velocity logs (e.g., for transit stretching or cycle skipping when the signal is weak [Serra, 19are responsible for the abnormal clusters because of the large sof data. The data from deeper samples exhibit a similar scatteplot in roughly the expected part of the graph. Nevertheless, it ispossible to separate out the correct from the incorrect values wthis cloud.
Figure 6 displays a different type of noise. The wireline dataHole 967E are separated into distinct populations by depth. The lowest data are probably incorrect because of bad hole conditionindicated by the caliper plot in Figure 4; and they plot in a simmanner to shallow data in Hole 966F. The data from the deepestion of the hole show too high a porosity for the given velocity ranThis can be explained by noting that the neutron porosity variatbelow 383 mbsf in Figure 4 are not only directly correlated withcaliper log but also are consistently higher than those for the seabove (which is possible, but in this case improbable). It appearsthe deep data could be ‘corrected’ by shifting them into a lowerrosity region of Figure 6A (or a higher density region of Figure 6but the trend would not be corrected and the amount of shifting wbe arbitrary. Thus, although the wireline data from Hole 967E apto be somewhat reasonable in Figure 4, it is clear from Figure 6they are probably much worse than Figure 4 would suggest, andsimple corrections are not to be found.
The samples used for discrete measurements in Hole 967Eobtained mainly from the section between 134 mbsf and 300 mwhere Figure 4 shows that the hole conditions are probably goodwireline data from this part of the hole largely coincide with the dcrete measurements except that the neutron porosities tend slightly too high and some of the bulk densities are anomalously The samples used for discrete measurements, therefore, can bto be representative of only a small part of the hole—less thanthird. Hole 966F is poorly represented by samples also becaussampling interval is greater in the upper half of the hole and inlowest 30 m than in the sampled part of Hole 967E.
One impetus for this study was the desire to use the discretesurements to ‘calibrate’ the logging data and then to use the bined data set to make synthetic seismograms. The synthetic segrams are useful both for linking important seismic reflectors wthe geologic source for better interpretation of seismic profiles,for studying the physical causes of seismic reflections in genThat means that they should be based on an accurate model physical properties variations downhole. During this study, synthseismograms that were based on acoustic impedance logs dfrom the wireline data (uncorrected by the ground truth data), shosome similarities with site survey seismic profiles. The researchported here demonstrates that correlation of such synthetic segrams with seismic profiles is fortuitous rather than real. Perhapacoustic impedance variations do match some of the more signifgeological variations that are expected in the holes, because it

ACOUSTIC PROPERTIES CONTROLS AND GROUND TRUTH
–4ve rloro
ami
sidd ts
d
atsam thf
thm
ndtican
gs.RFynerhane In-
s re-is re-hysi-ity in
posi-
loc-
tialrain-
rop-69.
),
uke,loci-San
ter
pore
shiponate
).
.,
of a
ntaldia.
changes in these parameters rather than their absolute values that aremore important; however, the very high level of noise, or variability,in the logs for the holes makes it unlikely that the geological varia-tions could be well-modeled by noisy acoustic impedance variations.Therefore, although the synthetic seismograms might look correct,geological inferences from them would be wrong.
It is also unlikely that the discrete measurements reported here canbe used to improve or correct the wireline data from the two holesstudied to the point where the logs would be acceptable for syntheticseismograms. Downhole diversity in lithology, porosity, and degreeof consolidation is responsible not only for the variability in theacoustic properties, but also for the varying hole conditions and corerecovery. Without being able to correct for missing sections the exer-cise is futile. This is true even of Hole 967E where the lithology isthought to be relatively monotonous from the apparent lack of largefluctuations downhole in the well-log data as well as from the coredescriptions and petrographic observations (Shipboard ScientificParty, 1996b). Simply shifting the level of the wireline data, as is sug-gested from Figure 4, would only shift the large volume of noise thatis present, as shown in Figure 6. Continuing research will examinethe possibility of characterizing acoustic properties downhole forsampled units definable, for example, in the Formation Micro-Scan-ner (FMS) logs. If there is a correlation between sampled units anddistinct units determined from other logs like FMS, then it may bepossible to assign acoustic properties to the discrete units and reducethe noise level in the log-derived parameters by using discrete valuesin units where wireline logs are noisy.
CONCLUSIONS
Careful comparison between discrete measurements (68 coreplugs) of acoustic properties, general velocity transforms, and log-ging data from Holes 966F and 967E from ODP leg 160, resulted inthe following conclusions.
Discrete measurement of acoustic properties indicate that P-wavevelocities are controlled, in order of significance, by porosity, insol-uble residue, and type of dolomite. Insoluble residues below 1%do not affect velocity, but contents higher than this threshold hanegative, nearly linear effect on sonic velocity. Some types ofplacement dolomite, here mimetic, can produce higher sonic veties than predicted by the time-average equation for similar poties.
The wireline logs underestimate the velocities and densitiesoverestimate the porosities in Holes 966F and 967E. One of the reasons is poor hole conditions, expressed by deviations in the wof the hole and resulting in poor contact between the tools and of the holes. Other reasons are upscaling effects of frequency antance. Corrections made to the logs may add noise, even thoughmay improve the values in some cases. However, the correctionnot result in data that are consistent with the generally acceptelocity transforms for given rock formations.
It would be dangerous to try to correct the wireline logging donly on the basis of a small set (68) of possibly unrepresentative ples. Moreover it would be dangerous to make synthetic seisgrams either with the log-derived acoustic parameters or withmeasurements from the samples alone. Determining the downvariations in acoustic properties must follow from a more careanalysis of other logging data, general velocity transforms forgiven lithologies, and, ideally, an extensive database of discrete surements on core plugs for ground truth measurements.
ACKNOWLEDGMENTS
One of the authors (Woodside) thanks the Netherlands Foution for Geosciences (Stichting GOA) for financial support for paripation on ODP Leg 160. We wish to thank Nanda Rave-Koot
% a
e-ci-si-
ndaindthes
dis-hey dove-
am-o-
heoleule
ea-
a--d
Volker Wiederhold for their assistance in preparing the rock pluMarianne Broekema and Ed Verdurmen are acknowledged for Xanalyses. The ultrasonic equipment was engineered by Carl Coand benefited from rapid and successful electronic first-aid by Jode Lange. Funding to the second author was provided through thdustrial Associates Program of Wolfgang Schlager. The analysiported here is a part of Köhnen’s undergraduate thesis work. Thsearch is a contribution to ongoing research on the geological/pcal sources of seismic reflections carried out at the Free UniversAmsterdam.
REFERENCES
Anselmetti, F.S., 1994. Physical properties and seismic response of carbonatesediments and rocks [Ph.D. thesis]. ETH Geol. Inst.
Anselmetti, F.S., and Eberli, G.P., 1993. Controls on sonic velocity in car-bonates. Pure Appl. Geophys., 141:287−323.
Bourbié, T., Coussy, O., and Zinszner, B., 1987. Acoustics of Porous Media:Paris (Ed. Technip.).
Dunham, R.J., 1962. Classification of carbonate rocks according to detional texture. In Ham, W.E. (Ed.), Classification of Carbonate Rocks.AAPG Mem., 108−121.
Emeis, K.-C., Robertson, A.H.F., Richter, C., et al., 1996. Proc. ODP, Init.Repts., 160: College Station, TX (Ocean Drilling Program).
Gardner, G.H.F., Gardner, L.W., and Gregory, A.R., 1974. Formation veity and density: the diagnostic basics for stratigraphic traps. Geophysics,39:770−780.
Kenter, J.A.M., Fouke, B.W., and Reinders, M., 1997a. Effects of differencementation on the sonic velocities of Late Cretaceous skeletal gstones (Southeastern Netherlands). J. Sediment. Res., 67:178−185.
Kenter, J.A.M., and Ivanov, M., 1995. Parameters controlling acoustic perties of carbonate and volcaniclastic sediments at Sites 866 and 8InWinterer, E.L., Sager, W.W., Firth, J.V., and Sinton, J.M. (Eds.), Proc.ODP, Sci. Results, 143: College Station, TX (Ocean Drilling Program287−303.
Kenter, J.A.M., Podladchikov, F.F., Reinders, M., van der Gaast, S., FoB.W., and Sonnenfeld, M.D., 1997b. Parameters controlling sonic veties in a mixed carbonate-siliciclastics Permian shelf-margin (upper Andres Formation, Last Chance Canyon, New Mexico). Geophysics,62:1−16.
King, M.S., Shams-Kanshir, M., and Worthington, M.H., 1992. Witchesseismic cross-hole test site: petrophysics studies of core. Int. Conf. Off-shore Oil and Gas Field Prosp., Moscow.
Lucia, F.J., 1995. Rock-fabric/petrophysical classification of carbonate space for reservoir characterization. AAPG Bull., 79:1275−1300.
Paillet, F.L., and Cheng, C.H., 1991. Acoustic Waves in Boreholes: BocaRaton, FL (CRC Press).
Rafavich, F., Kendall, C.H.St.C., and Todd, T.P., 1984. The relationbetween acoustic properties and the petrographic character of carbrocks. Geophysics, 49:1622−1636.
Reeder, R.J. (Ed.), 1983. Carbonates: Mineralogy and Chemistry. Rev. Min-eral., 11:1−399.
Serra, O., 1984. Fundamentals of Well-Log Interpretation (Vol. 1): TheAcquisition of Logging Data: Dev. Pet. Sci., 15A: Amsterdam (Elsevier
Shipboard Scientific Party, 1996a. Site 966. In Emeis, K.-C., Robertson,A.H.F., Richter, C., et al., Proc. ODP, Init. Repts., 160: College Station,TX (Ocean Drilling Program), 155−213.
————, 1996b. Site 967. In Emeis, K.-C., Robertson, A.H.F., Richter, Cet al., Proc. ODP, Init. Repts., 160: College Station, TX (Ocean DrillingProgram), 215−287.
Stafleu, J., Everts, A.J.W., and Kenter, J.A.M., 1994. Seismic models prograding carbonate platform: Vercors, South-east France. Mar. Pet.Geol., 16:517−537.
Theys, P.P., 1991. Log Data Acquisition and Quality Control: Paris (Ed.Technip).
Wyllie, M.R.J., Gregory, A.R., and Gardner, G.H.F., 1958. An experimeinvestigation of factors affecting elastic wave velocities in porous meGeophysics, 23:400.
Date of initial receipt: 14 February 1997Date of acceptance: 31 October 1997Ms 160SR-032
9


![Time-MemoryTrade-offsforParallelCollision … · factoring and discrete logs, ... mapping f. The parallel collision search algorithm, proposed by van Oorschot and Wiener [18], builds](https://img.pdfslide.net/doc/110x75/5b3a685e7f8b9a4a728f3e48/time-memorytrade-osforparallelcollision-factoring-and-discrete-logs-.jpg)