Embed Size (px)
Citation preview
CNdV africa PROVINCIAL SPATIAL DEVELOPMENT FRAMEWORK environmental planning, landscape architecture, urban design 7 NOVEMBER 2005
4-57
4.2 BUILT SYSTEMS
CNdV africa PROVINCIAL SPATIAL DEVELOPMENT FRAMEWORK environmental planning, landscape architecture, urban design 7 NOVEMBER 2005
4-58
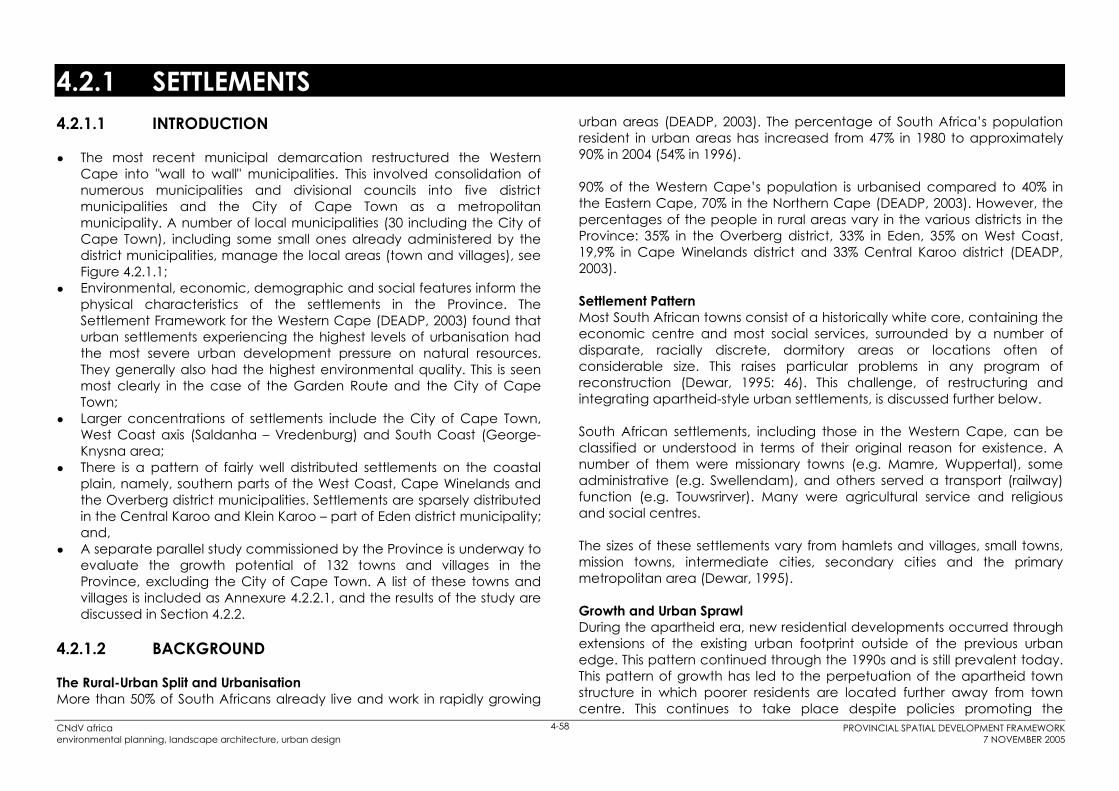
4.2.1 SETTLEMENTS 4.2.1.1 INTRODUCTION
The most recent municipal demarcation restructured the Western Cape into "wall to wall" municipalities. This involved consolidation of numerous municipalities and divisional councils into five district municipalities and the City of Cape Town as a metropolitan municipality. A number of local municipalities (30 including the City of Cape Town), including some small ones already administered by the district municipalities, manage the local areas (town and villages), see Figure 4.2.1.1; Environmental, economic, demographic and social features inform the physical characteristics of the settlements in the Province. The Settlement Framework for the Western Cape (DEADP, 2003) found that urban settlements experiencing the highest levels of urbanisation had the most severe urban development pressure on natural resources. They generally also had the highest environmental quality. This is seen most clearly in the case of the Garden Route and the City of Cape Town; Larger concentrations of settlements include the City of Cape Town, West Coast axis (Saldanha – Vredenburg) and South Coast (George-Knysna area; There is a pattern of fairly well distributed settlements on the coastal plain, namely, southern parts of the West Coast, Cape Winelands and the Overberg district municipalities. Settlements are sparsely distributed in the Central Karoo and Klein Karoo – part of Eden district municipality; and, A separate parallel study commissioned by the Province is underway to evaluate the growth potential of 132 towns and villages in the Province, excluding the City of Cape Town. A list of these towns and villages is included as Annexure 4.2.2.1, and the results of the study are discussed in Section 4.2.2.
4.2.1.2 BACKGROUND
The Rural-Urban Split and Urbanisation More than 50% of South Africans already live and work in rapidly growing
urban areas (DEADP, 2003). The percentage of South Africa’s population resident in urban areas has increased from 47% in 1980 to approximately 90% in 2004 (54% in 1996).
90% of the Western Cape’s population is urbanised compared to 40% in the Eastern Cape, 70% in the Northern Cape (DEADP, 2003). However, the percentages of the people in rural areas vary in the various districts in the Province: 35% in the Overberg district, 33% in Eden, 35% on West Coast, 19,9% in Cape Winelands district and 33% Central Karoo district (DEADP, 2003).
Settlement Pattern Most South African towns consist of a historically white core, containing the economic centre and most social services, surrounded by a number of disparate, racially discrete, dormitory areas or locations often of considerable size. This raises particular problems in any program of reconstruction (Dewar, 1995: 46). This challenge, of restructuring and integrating apartheid-style urban settlements, is discussed further below.
South African settlements, including those in the Western Cape, can be classified or understood in terms of their original reason for existence. A number of them were missionary towns (e.g. Mamre, Wuppertal), some administrative (e.g. Swellendam), and others served a transport (railway) function (e.g. Touwsrirver). Many were agricultural service and religious and social centres.
The sizes of these settlements vary from hamlets and villages, small towns, mission towns, intermediate cities, secondary cities and the primary metropolitan area (Dewar, 1995).
Growth and Urban Sprawl During the apartheid era, new residential developments occurred through extensions of the existing urban footprint outside of the previous urban edge. This pattern continued through the 1990s and is still prevalent today. This pattern of growth has led to the perpetuation of the apartheid town structure in which poorer residents are located further away from town centre. This continues to take place despite policies promoting the
CNdV africa PROVINCIAL SPATIAL DEVELOPMENT FRAMEWORK environmental planning, landscape architecture, urban design 7 NOVEMBER 2005
4-59
opposite, as a result of other contradictory policies. For example, massive transport subsidies encourage sprawl by reducing the cost effect of distance (DEADP, 2003).
There is a continuing dynamic of deep-seated structural forces that in many instances reinforces decline of small towns. Research has shown that smaller towns decline relative to larger cities due to factors such as consolidation of commercial farming and de-densification of the rural periphery, increased accessibility to large towns, the emergence of marketing boards that prevented smaller manufacturers from buying local material directly, and transport tariff structures that favour agro-processing close to the larger urban markets (Dewar, 1995).
Most of the stagnating and declining settlements are located in the inland arid areas with the highest moisture loss (Central Karoo, northern Cape Winelands, and the northern parts of the West Coast). The continuing under-development of these areas will deepen poverty and inequality, (DEADP, 2003) reinforced by the trend for the more skilled and literate to be the first to leave.
Settlement Framework Policy The Settlement Framework for the Western Cape (DEADP, 2003) aims to promote the approach of the primary concentration of settlement in the City of Cape Town and to balance this with the promotion of secondary concentrations in a selected number of second order towns. By aligning their local roles with their respective development potentials the policy aims to promote a sustainable urban settlement pattern in the Province.
Its objectives are: Establishing a broad provincial framework that will serve as a guide to future settlement, taking due cognisance of bioregional planning principles; Creating urban settlements that are spatially integrated and compact as well as proactive in absorbing growth; Establishing cities and towns that are economically robust; Ensuring that human settlements are environmentally sustainable; Providing appropriate levels of services for all and making optimal use of existing and planned services; Ensuring that subsidised housing is provided equitably and that it plays a meaningful role in the management of human settlement both in
urban and rural contexts; and, Ensuring that urban and rural settlements are governed effectively and efficiently.
Other strategies include: Integration of the framework with national objectives and similar policies of other Provinces; Rendering of support to the West Coast Investment Initiative as a “desirable national developmental initiative”; Creation of more racially and spatially integrated cities; Establishing balance between the various land demands; Achieving development goals through public infrastructure investment and ensuring that the provision of subsidised housing complements the provincial settlement policy; and, Ensuring sustainability of settlements and their effective and efficient management.
If these strategies are implemented the following settlement pattern could emerge (DEADP, 2003):
A dominant metropolitan area – already in place; A strongly developed West Coast Corridor; The adoption of a policy to encourage large scale settlement in other towns, but concentrating on their inherent potential and their roles in local rather than provincial context; and, The management of stagnant and declining towns.
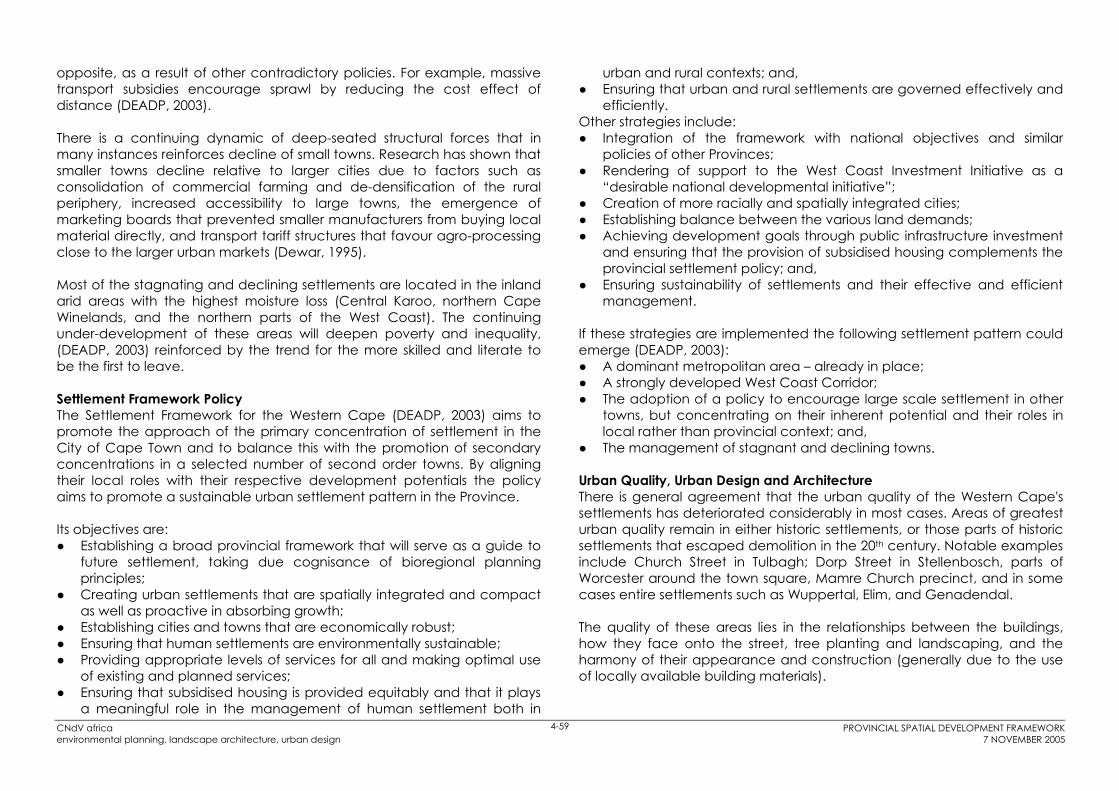
Urban Quality, Urban Design and Architecture There is general agreement that the urban quality of the Western Cape's settlements has deteriorated considerably in most cases. Areas of greatest urban quality remain in either historic settlements, or those parts of historic settlements that escaped demolition in the 20th century. Notable examples include Church Street in Tulbagh; Dorp Street in Stellenbosch, parts of Worcester around the town square, Mamre Church precinct, and in some cases entire settlements such as Wuppertal, Elim, and Genadendal.
The quality of these areas lies in the relationships between the buildings, how they face onto the street, tree planting and landscaping, and the harmony of their appearance and construction (generally due to the use of locally available building materials).

CNdV africa PROVINCIAL SPATIAL DEVELOPMENT FRAMEWORKenvironmental planning, landscape architecture, urban design 7 NOVEMBER 2005
4-60
It is important to note that these qualities are not important only as part ofthe heritage of important settler and emancipated slave culture (e.g.mission villages) but can bring very real economic benefits because oftheir attraction to tourists and their impact on property values.
It should be stressed that the attractiveness of these areas is not due tomonotonous uniformity, such as is found in many RDP housing schemes, butwas achieved through general consistencies in scale, shape of door andwindow openings and layout. Within this consistency there were many detailed variations in window and door sizes, height of roof pitches andeaves ends. There were five different architectural styles that characterisedthis period, namely rural long houses, Cape Dutch, Georgian, Victorianand Edwardian. However, although these styles had elements directlycopied from other contexts, most notably the McFarlane's catalogue ofwrought iron work "broekie lace", they were generally adapted to localclimate building materials and colours.
After the 1940s this pattern began to change. The greater accessibilityafforded by the motor car, coupled with non-existent policy on containingthe outward growth of towns meant that land on the urban fringe wascheap and large plots greater than 600 metres affordable to the middleclasses.
North American and English illusions of rural living saw the placement of buildings moving to the middle of the plot back from the street, therebydestroying its function as social and pedestrian space. This principle ofbuildings located as isolated pavilions in the middle of their plots remainsenshrined in many zoning schemes. This process was reinforced by thewide setbacks required by transport policy, particularly along the mainstreet of many towns.
Zoning scheme conditions continue to reinforce this non-urban form and appearance.
Reinforcement of Apartheid Urban Settlement StructureSadly, and to the concern of many observers from the Presidentdownwards, the pattern of development in the urban settlements since1994 has been one of "business as usual". They remain apartheidsettlements with low density central business districts and extravagant roadreserves and open spaces keeping the various suburbs apart (see Figure
4.2.1.2). Growth is generally outwards without integration occurring at thecentre. Figure 4.2.1.3 shows the village of Darling with Nuwedorp as anexample of this pattern.
Figure 4.2.1.2 Typical Urban Settlement Structure
Figure 4.2.1.3 Darling and Nuwedorp (source: Surveyor General)

CNdV africa PROVINCIAL SPATIAL DEVELOPMENT FRAMEWORKenvironmental planning, landscape architecture, urban design 7 NOVEMBER 2005
4-61
Murraysburg (see Figure 4.2.1.4) has recently completed housing projectsalmost 4km from the original centre of town, reinforcing the apartheidurban structure.
GOLF ESTATE CONSERVANCYESTATE
N.T.S.
De Zalze GolfEstate
JamestownShopping
(a) before (b) by 2015
Figure 4.2.1.4 Murraysburg
Figure 4.2.1.5a shows the footprints of all buildings in Stellenbosch. Figure4.2.1.5b illustrates how the footprint of the town has been extended by therecently approved Jamestown shopping centre and De Zalze golf courseestate.
Figure 4.2.1.5 Stellenbosch
Urban sprawl and out-of-town shopping centres have drawn muchcriticism in recent years in South Africa and particularly overseas becauseof the negative impacts they have on agricultural and scenic land,transport patterns and existing business areas. It is important that theconsequences of such projects are understood when they are approved.Historic town New housing
A considerable body of research has been completed on the negativeimpacts of out-of-town shopping centres in the UK. This has resulted in itbeing almost impossible to gain approval for this kind of developmentproject. Similar work is required in the Western Cape. Currently out-of-townshopping centres are being constructed in George, Worcester and Paarl,and one has been recently completed outside Stellenbosch.
Increasing affluence and mobility coupled with a desire for rural andsecure lifestyles have led to another form of urban development outsidethe urban edge of towns, namely golf course and “eco”-estates. Whilesome of these are low key, carefully conceived designed resorts fulfillingstrong agricultural and biodiversity aims, most are large mini-townscontaining between 500 and1000 units. Figure 4.2.1.6 shows a golf courseproposed near Tulbagh. The area of the golf course is almost larger thanthe current area of town.
Sim
on N
icks
Figure 4.2.1.6 Tulbagh Proposed Golf Course (source: Surveyor General)
CNdV africa PROVINCIAL SPATIAL DEVELOPMENT FRAMEWORKenvironmental planning, landscape architecture, urban design 7 NOVEMBER 2005
4-62
(a)1980
F
Other "Growth Shapers"
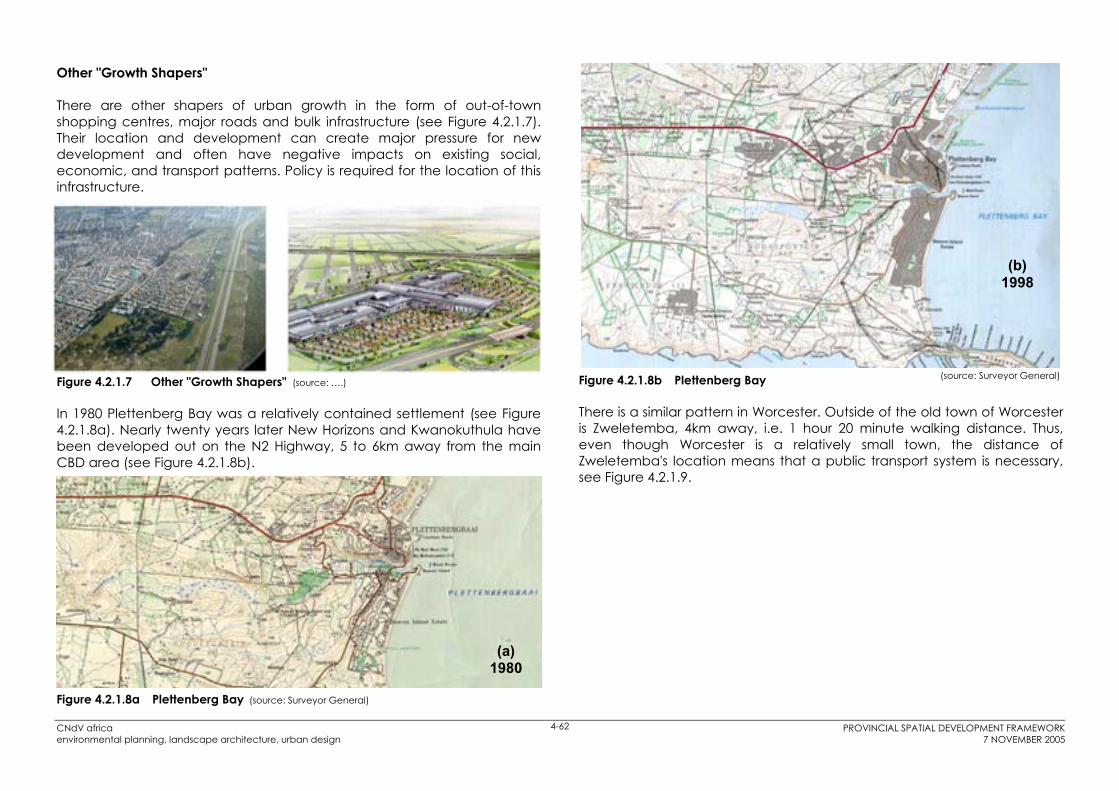
There are other shapers of urban growth in the form of out-of-townshopping centres, major roads and bulk infrastructure (see Figure 4.2.1.7).Their location and development can create major pressure for newdevelopment and often have negative impacts on existing social,economic, and transport patterns. Policy is required for the location of thisinfrastructure.
igure 4.2.1.8a Plettenberg Bay (source: Surveyor General)
(b)1998
(source: Surveyor General)Figure 4.2.1.7 Other "Growth Shapers" (source: ….)
In 1980 Plettenberg Bay was a relatively contained settlement (see Figure4.2.1.8a). Nearly twenty years later New Horizons and Kwanokuthula havebeen developed out on the N2 Highway, 5 to 6km away from the mainCBD area (see Figure 4.2.1.8b).
Figure 4.2.1.8b Plettenberg Bay
There is a similar pattern in Worcester. Outside of the old town of Worcesteris Zweletemba, 4km away, i.e. 1 hour 20 minute walking distance. Thus,even though Worcester is a relatively small town, the distance of Zweletemba's location means that a public transport system is necessary,see Figure 4.2.1.9.

CNdV africa PROVINCIAL SPATIAL DEVELOPMENT FRAMEWORKenvironmental planning, landscape architecture, urban design 7 NOVEMBER 2005
4-63
(source: Surveyor General)
1km20 min
4km1 hr 20 min
Zweletemba
1km20 min
4km1 hr 20 min
(source: Surveyor General)Figure 4.2.1.9 Worcester
Beaufort West is an interesting contrast to the typical apartheid settlementpattern in certain respects, as it is more integrated than many other townseven though individual suburbs remain largely segregated. Mandlenkoziand Essopville are very much within walking distance of the centre of thetown (see Figure 4.2.1.10). New housing is proposed in the Mooivlakte area,near the centre of town, unlike the pattern in most settlements in theProvince where most public housing is located on the periphery.
In some instances this approach leads to new low income townships beinglocated on the other side of high speed arterial routes such as the N2 andN1 Freeways. In almost all cases this pattern has led to a rapid increase in vehicle accidents and pedestrian fatalities and should be avoided at allcosts.
Figure 4.2.10a Beaufort West

CNdV africa PROVINCIAL SPATIAL DEVELOPMENT FRAMEWORKenvironmental planning, landscape architecture, urban design 7 NOVEMBER 2005
4-64
Brackenfell
KuilsriverKhayelitsha Mitchells Plain
R300
N1
Sim
on N
icks
Figure 4.2.10b
Figure 4.2.10c
Figure 4.2.1.11 illustrates the low density sprawling urban form dissected by large road reserves and redundant open space of the Eastern Sector ofthe City of Cape Town. Most of this area was developed in the last 40years.
Figure 4.2.1.11 Eastern Metro looking south towards False Bay
CNdV africa PROVINCIAL SPATIAL DEVELOPMENT FRAMEWORKenvironmental planning, landscape architecture, urban design 7 NOVEMBER 2005
4-65
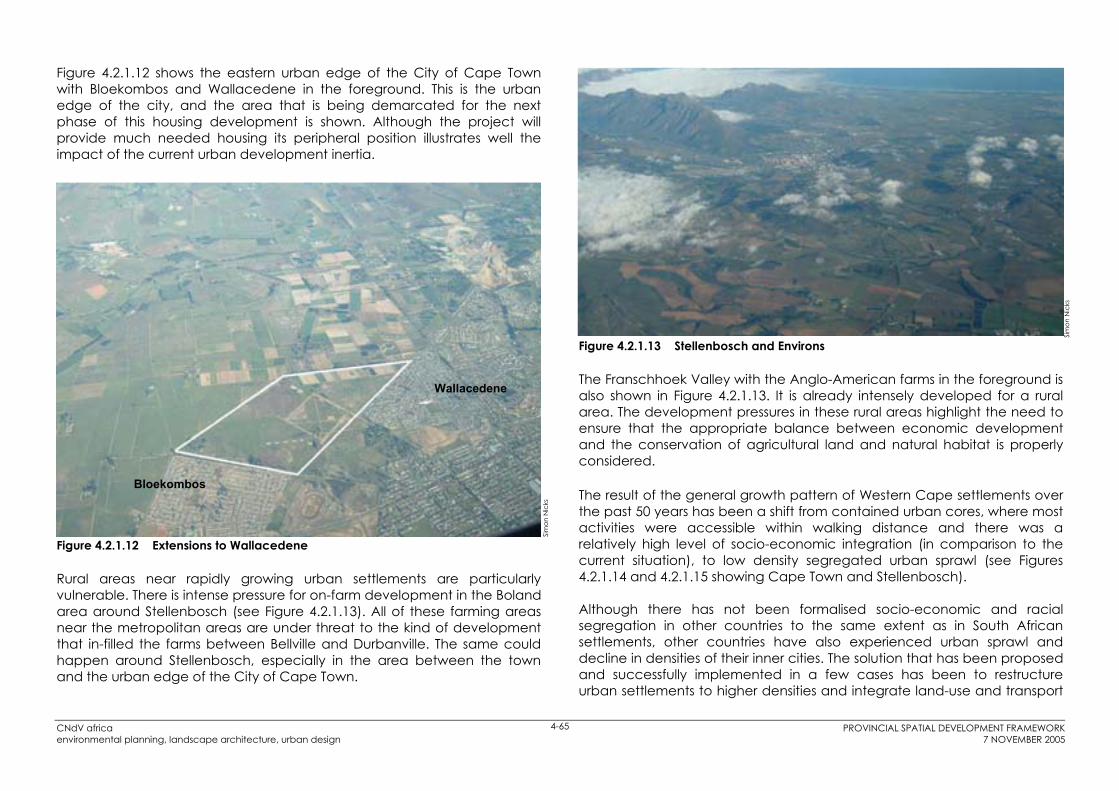
Figure 4.2.1.12 shows the eastern urban edge of the City of Cape Townwith Bloekombos and Wallacedene in the foreground. This is the urbanedge of the city, and the area that is being demarcated for the nextphase of this housing development is shown. Although the project willprovide much needed housing its peripheral position illustrates well theimpact of the current urban development inertia.
Sim
on N
icks
Bloekombos
Wallacedene
Sim
on N
icks
Figure 4.2.1.12 Extensions to Wallacedene
Rural areas near rapidly growing urban settlements are particularlyvulnerable. There is intense pressure for on-farm development in the Bolandarea around Stellenbosch (see Figure 4.2.1.13). All of these farming areasnear the metropolitan areas are under threat to the kind of developmentthat in-filled the farms between Bellville and Durbanville. The same couldhappen around Stellenbosch, especially in the area between the townand the urban edge of the City of Cape Town.
Figure 4.2.1.13 Stellenbosch and Environs
The Franschhoek Valley with the Anglo-American farms in the foreground isalso shown in Figure 4.2.1.13. It is already intensely developed for a rural area. The development pressures in these rural areas highlight the need toensure that the appropriate balance between economic developmentand the conservation of agricultural land and natural habitat is properlyconsidered.
The result of the general growth pattern of Western Cape settlements overthe past 50 years has been a shift from contained urban cores, where mostactivities were accessible within walking distance and there was a relatively high level of socio-economic integration (in comparison to thecurrent situation), to low density segregated urban sprawl (see Figures4.2.1.14 and 4.2.1.15 showing Cape Town and Stellenbosch).
Although there has not been formalised socio-economic and racialsegregation in other countries to the same extent as in South African settlements, other countries have also experienced urban sprawl anddecline in densities of their inner cities. The solution that has been proposedand successfully implemented in a few cases has been to restructureurban settlements to higher densities and integrate land-use and transport

CNdV africa PROVINCIAL SPATIAL DEVELOPMENT FRAMEWORKenvironmental planning, landscape architecture, urban design 7 NOVEMBER 2005
4-66
and infrastructure planning so that providing these services is moreaffordable and efficient.
1679 1900 20031679 1900 2003
Source: Urban Dynamics
Source: Barrie Gasson
Figure 4.2.1.14 Apartheid Cape Town
Figure 4.2.1.15 Apartheid Stellenbosch (source: Urban Dynamics et al, 2003)
Densification Targets Figure 4.2.1.16 indicates the impact of different urban densities. At lowdensities of only 50 people per hectare, large amounts of land are consumed and other urban services are not viable. As densities increase,more activities can be found within walking distance, and business and public transport services become more viable.
Figure 4.2.1.16 Impact of Urban Densities (source: Towards an Urban Renaissance)

CNdV africa PROVINCIAL SPATIAL DEVELOPMENT FRAMEWORKenvironmental planning, landscape architecture, urban design 7 NOVEMBER 2005
4-67
Studies in South Africa and elsewhere have identified 100 people perhectare as the minimum threshold where good supportive neighbourhoodfacilities, public transport services and walking become convenient(Dewar, 1995: 50du/ha; TCPA, 2004: 35du/ha; Roger, 1999: 25du/ha). Urbanquality also tends to be higher at these densities, although this alsodepends on urban design. An average density of 25 dwelling units perhectare or 100 people per hectare generally represents a doubling ofcurrent densities, and can be used as a benchmark to analyse the state of urban settlements in the Province.
Figure 4.2.1.17 indicates the densities for 132 settlements in the Provinceand the City of Cape Town within its urban edge. With the exception ofhigh density informal settlements most of the formal settlements have lowdensities. The average formal settlement density is approximately 9-12du/ha.
Average density of settlements in Province
Figure 4.2.1.17 Densities, urban settlements, Western Cape (source: ….)
The difference between the minimum density threshold of 100pp/ha andthe current situation is summarised in Figure 4.2.1.18. At four people per dwelling unit 100pp/ha translates to 25du/ha. At 3.5 people per dwellingunit it increases to 28.5du/ha.
0
50
100
150
200
250
300
350
400
Figure 4.2.1.18 Densities Threshold
peo
ple
er h
eta
e
The difference between the two density factors highlights the extent ofstructural change required in Western Cape settlements. Not surprisinglythe change required is probably of the same order as occurred with theimplementation of the Group Areas Act. However, it clearly cannot be accomplished using the same or similar means. This transformation shouldbe achieved through an alignment with market forces that naturallysupport concentration and agglomeration. It can also be seen as returningto the pre-apartheid development pattern where many settlements wereof far higher densities before densities were reduced by the Group AreasAct and the effects of Modernist town planning (see Figures 4.2.1.14 and4.2.1.15).
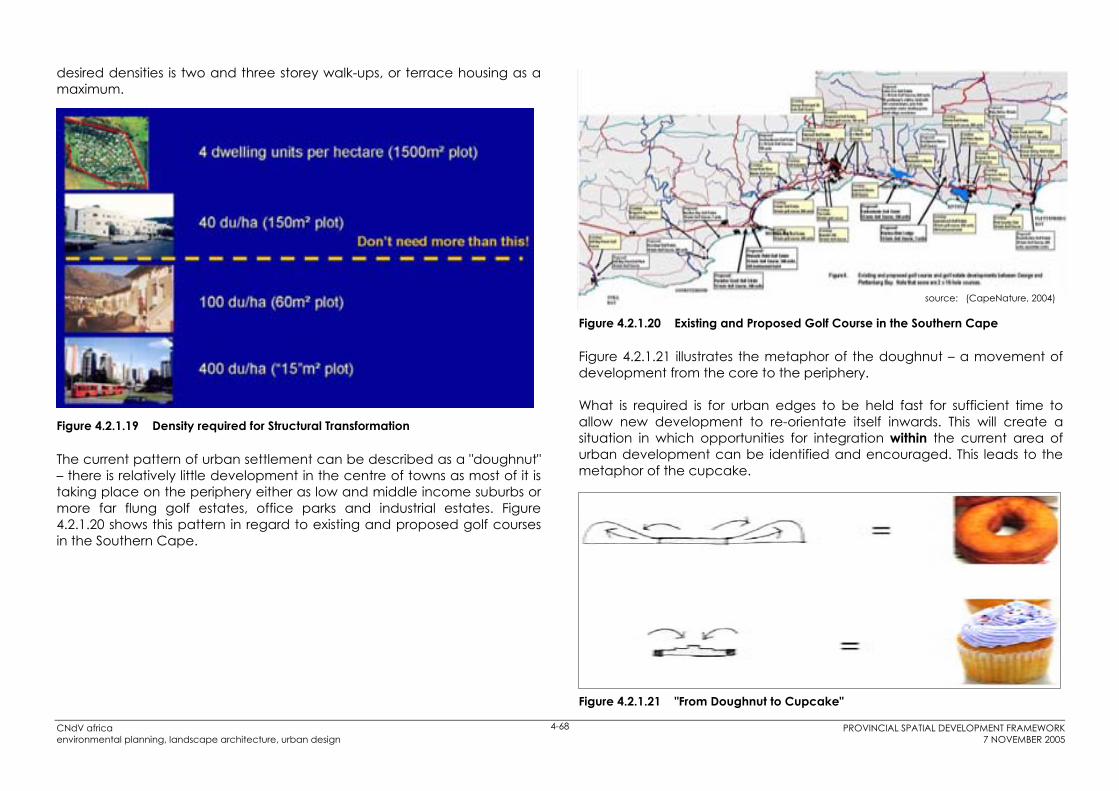
Figure 4.2.1.19 illustrates the kind of built environment that will achieve adensity of 40du/ha based on two- to three-storey walk-ups. To achieve anaverage density of 25du/ha some areas will have to have higher densitiesand others can have lower densities. It is important to note that 20 storeytower blocks are entirely unnecessary and all that is required to achieve
pc
r
towns
100pp/ha
Urban Settlements : Western Cape
CNdV africa PROVINCIAL SPATIAL DEVELOPMENT FRAMEWORKenvironmental planning, landscape architecture, urban design 7 NOVEMBER 2005
4-68
desired densities is two and three storey walk-ups, or terrace housing as a maximum.
Figure 4.2.1.19 Density required for Structural Transformation
The current pattern of urban settlement can be described as a "doughnut"– there is relatively little development in the centre of towns as most of it is taking place on the periphery either as low and middle income suburbs ormore far flung golf estates, office parks and industrial estates. Figure 4.2.1.20 shows this pattern in regard to existing and proposed golf coursesin the Southern Cape.
source: (CapeNature, 2004)
Figure 4.2.1.20 Existing and Proposed Golf Course in the Southern Cape
Figure 4.2.1.21 illustrates the metaphor of the doughnut – a movement ofdevelopment from the core to the periphery.
What is required is for urban edges to be held fast for sufficient time toallow new development to re-orientate itself inwards. This will create a situation in which opportunities for integration within the current area ofurban development can be identified and encouraged. This leads to themetaphor of the cupcake.
Figure 4.2.1.21 "From Doughnut to Cupcake"

CNdV africa PROVINCIAL SPATIAL DEVELOPMENT FRAMEWORK environmental planning, landscape architecture, urban design 7 NOVEMBER 2005
4-69
The cup can be likened to the urban edge. Within this there is an intensity and integration of activity illustrated by the icing and rainbow hundreds and thousands!
There are other built environment issues in addition to densities and the urban edge, such as major roads, bulk infrastructure and out-of-town shopping centres, which also need to be thought about carefully and which can support the process of transforming urban settlements from doughnuts to cupcakes. These are addressed in Section 6 which sets out the PSDF proposals.
4.2.1.3 LEGISLATIVE CONTEXT
The following acts and ordinances have relevance to settlements: Municipal Systems Act, 2000; Development Facilitation Act; Physical Planning Act; Land Use Planning Ordinance; Land Use Management Bill; Western Cape Planning and Development Act; Less Formal Township Establishment Act; National Heritage Resources Act; Environmental Conservation Act; National Environmental Management Act; Extension of Security of Tenure Act; Provision of Land And Assistance Act; Restitution of Land Rights Act; and, Transformation of Certain Rural Areas Act (TRANCA).
4.2.1.4 KEY ISSUES
Lack of integration of settlements and the need to restructure apartheid settlements; The negative effects of low densities and urban sprawl, especially in the City of Cape Town and the coastal resorts along the West Coast and Garden Route (SoER 2004; Non-existing, unclearly defined or non-statutory urban edge lines in most cases;
Geographically disproportional investment pattern in infrastructure and housing (DEADP 2003; Lack of conservation of cultural, historical and architectural assets that leads to the loss of sense of place and character and potentially to disinvestment; Need to manage development pressure according to the development potential on the coastline and particularly in the Garden Route; and, Distorted settlement concentration in the mainly small wealthier areas along the coast (DEADP 2003).
4.2.1.5 SUMMARY
Western Cape settlements are generally characterised by racially separated areas and little success has been achieved in changing this pattern in the new political dispensation. In most cases extensions to the existing areas, which often house the lower income groups, are located even further from the opportunities and services in the core of the settlements.
In addition, most settlements are continuing the low density urban sprawl pattern of development and do not appear to be taking the need for restructuring seriously. As a result little progress is being made towards the PGWC's vision of settlements becoming "a home for all".
The fact that most settlements are primarily designed around low densities and the need to accommodate private vehicles, has made these places dangerous, unfriendly and hostile environments for pedestrians and residents and has created non-responsive urban environments. The densities in South African towns and villages are generally below 15du/ha (see Figure.4.2.1.1). This is far below the internationally researched average of 25 to 40 dwelling units per hectare that has been shown to be the ideal density for making services, including public transport, viable.
The majority of the population of the Province is located within urban areas and there is a desperate need to ensure that these urban areas become sustainable, efficient and a home for all – rich and poor.

CNdV africa PROVINCIAL SPATIAL DEVELOPMENT FRAMEWORK environmental planning, landscape architecture, urban design 7 NOVEMBER 2005
4-70
REFERENCES AND ACKNOWLEDGEMENTS Department of Environmental Affairs and Development Planning, State of the Environment Overview Report, 2004; Dept Environmental Affairs and Development Planning, A Settlement Framework for the Western Cape Province: Green Paper, Provincial Government Western Cape, 2003;Dewar et al. South African Cities A Manifesto for Change, Urban Problems Research Unit, University of Cape Town, 1991; Dewar, D. Small Towns in Development: Towards a South African Perspective, 1995; Gasson, B. The Biophysical Environment of the Western Cape Province in relation to its economy and settlements, School of Architecture and Planning, University of Cape Town for the Department of Local Government and Housing (Directorate of Development Promotion) of the Province of the Western Cape, 1998; Urban Task Force: Towards an Urban Renaissance, 1998; Statistics South Africa, Census Counts (1996, 2001 and Midyear Estimates 2002); Surveyor General : Surveys and Mapping, 2001;CNdV africa. Towards a Growth Management Strategy for Stellenbosch Technical Report: Preliminary Draft: working document for discussion purposes only. Stellenbosch Municipality, 2003.

Figure 4.2.1.1 Settlements
CNdV africa PROVINCIAL SPATIAL DEVELOPMENT FRAMEWORKenvironmental planning, landscape architecture, urban design 7 NOVEMBER 2005
4-71

CNdV africa PROVINCIAL SPATIAL DEVELOPMENT FRAMEWORKenvironmental planning, landscape architecture, urban design 7 NOVEMBER 2005
4-72CNdV africa PROVINCIAL SPATIAL DEVELOPMENT FRAMEWORKenvironmental planning, landscape architecture, urban design 7 NOVEMBER 2005
4-72

CNdV africa PROVINCIAL SPATIAL DEVELOPMENT FRAMEWORK environmental planning, landscape architecture, urban design 7 NOVEMBER 2005
4-72
4.2.2 GROWTH POTENTIAL AND HUMAN NEED 4.2.2.1 INTRODUCTION
The need to research the growth potential and human need of settlements in the Western Cape emerged from the following factors:
A concern from the Provincial Government of the Western Cape about the decline of a number of rural towns, associated increase in poverty, and the role that changes in the agricultural and tourism areas may play in these settlements’ fortunes; A recommendation in a Green Paper, A Settlement Framework for the Western Cape, which also identified the need for such a study (Dr Bertie van Zyl, DEADP, 2003); The requirement of the National Spatial Development Perspective that public investment targeting must distinguish between fixed investmentand social investment;Fixed investment should be directed towards settlements that have the potential for sustainable economic growth. These settlements are also likely to attract the bulk of migrants as well have significant social needs, so government’s objectives of addressing both economic growth and poverty alleviation can be achieved most efficiently;
In areas of low potential government should concentrate on social investment which should primarily directed at programs such as human resource development, labour market intelligence and social transfers, so as to provide people with the necessary resources to successfully move to areas with greater economic potential; Understanding the growth potential of the towns would provide the basis for targeting the R38 billion rand in infrastructure development (to be spent nationally) that the President mentioned in his state of the nation address on 21 May 2004; The Provincial Economic Review and Outlook (PERO) of 2003 noted that most economic growth was occurring in the tertiary sector which tended to be based in the main settlements. Agriculture (largely rural) and domestic workers (largely urban) provided the greatest number of jobs for unskilled workers. The PERO also noted that income inequality and levels of relative poverty appeared to be worsening although poor people had benefited considerably from the provision of services over
the period 1995 to 2003. Therefore, there was a twin and possibly contradictory challenge in that settlements needed both to provide opportunities for the tertiary sector to flourish, i.e. to provide high quality lifestyles that would attract tertiary sector workers and a high skills base (generally lacking), and to provide opportunities for those sectors that could generate low skilled jobs (PERO, 2003); and, The Migration Study in the Western Cape 2001 indicated that most migrants were attracted firstly to the City of Cape Town, and secondly to certain rural districts where there appeared to be a stronger probability of finding jobs than others. These rural districts included the Southern Cape, Saldanha-Vredenburg, parts of the Overberg and Olifants River Valley, and the Boland part of the Cape Winelands district. There is also a significant move outwards of wealthy residents from the cities and towns to rural districts. This could also contribute to increasing demand in these areas. (source: Lehan Fouche)
4.2.2.2 BACKGROUND
The study’s research methodology consisted of a variety of research tools that were combined in the form of 82 variables that were measured for each of the 131 towns.
These variables were aggregated into ten compound indices which in turn were grouped into four composite indices as shown in Table 4.2.2.1.

CNdV africa PROVINCIAL SPATIAL DEVELOPMENT FRAMEWORKenvironmental planning, landscape architecture, urban design 7 NOVEMBER 2005
4-73
Table 4.2.2.1 Research Indicators Relationship (source: van der Merwe, 2005)
These quantitative indicators were supplemented by an in-depth interviewwith key stakeholders in each town that was used to corroborate orcontradict the statistical research as relevant. In most cases there wasfound to be quite a good correlation between the quantitative andqualitative measures. A descriptive profile was also drawn up of each townto capture its “sense of place”.
The results of the study were collated into a set of tables and charts thatillustrated the relationship between high and low growth potential andhigh and low human needs in various ways.
Figure 4.2.2.1 shows the towns in ascending order of developmentpotential. The towns with high development potential are generallylocated on the coastal plain between the sea and the first range of mountains, with the exception of Worcester and Oudtshoorn.
Figure 4.2.2.1 Composite Development Potential Index (source: van der Merwe,2005)
By contrast Figure 4.2.2.2 indicates human need in ascending order. Thetowns with high levels of human need tend to be located inland.

CNdV africa PROVINCIAL SPATIAL DEVELOPMENT FRAMEWORKenvironmental planning, landscape architecture, urban design 7 NOVEMBER 2005
4-74
Figure 4.2.2.2 Human Needs Index (source: van der Merwe, 2005)
For the purpose of the PSDF it is necessary to group the towns into a singleset of relationships as investment decisions and policy implementationcannot easily deal with multiple sets of overlapping variables. The followinggroups of towns were defined, with an associated priority order for fixedinfrastructure investment spending:
Priority for fixed investment Growth Potential Need
First High HighSecond High LowThird Low HighFourth Low Low
The reasons for this priority ranking for fixed investment are as follows:
Investing in towns with high growth potential and high need will ensure notonly that that expenditure will have the highest leverage but also that it will
have the greatest possibility for social benefits. Many of the coastal towns,as well as the City of Cape Town, have both high levels of human needand the greatest potential for growth. Therefore, the benefits of spendingtax rands are likely to be maximised in these towns.
Towns with high growth potential but low human need rank second, togive effect to the policy of prioritising fixed investment spending insettlements with the highest potential rather than those with low growthpotential. It is at this point that there may be strong pressure for fixedinvestment to be directed to settlements with high human need withouttaking into consideration that fixed investment is unlikely to mobilise thekind of leverage that it may be able to effect if growth potential was high.
It is at the juncture of ranking towns with high growth potential and low human need above those with low growth potential and high humanneed that political will must stand firm. Such a policy could be accused ofbeing anti-poor and displaying an unacceptable level of urban bias as it is the larger urban centres that are likely to display the highest growthpotential. It is important to note that this priority ranking applies only tofixed investment, not to social investment. Social investment must be donein all towns and these towns will not be neglected by government.
The third category is low growth potential and high human need. Lowgrowth potential is common to the third and fourth categories and it is onlydifferences in human need that distinguish them. Clearly the mostequitable choice will be to target those centres with high human need.The emphasis in these towns should be on social investment rather thanfixed investment.
The fourth level of priority is those settlements with both low growthpotential and low human need. In this situation the choices speak for themselves, see Table 4.2.2.2.

CNdV africa PROVINCIAL SPATIAL DEVELOPMENT FRAMEWORKenvironmental planning, landscape architecture, urban design 7 NOVEMBER 2005
4-75
Table 4.2.2.2 Proposed Investment Strategy (source: van der Merwe, 2005)
However, this grouping gives rise to some anomalies in that there areextremely small settlements such as Redlinghuys and Aurora which, whenthe balance of opportunities and issues confronting them is taken intoaccount as isolated settlements on their own, appear as centres of greateconomic growth potential ranking far above some much larger towns.
To address this anomaly the PSDF document applied a cut-off of apopulation of 5000 people to the town ranking. This figure took intoaccount the minimum number of people or households required to supportmajor social infrastructure such as schools and the level at which a townwas big enough to create the necessary critical mass for sustainingbusinesses, etc. (see Figure 4.2.2.3).
Figure 4.2.2.3 Settlement Investment Priority
Applying this index creates a much more convincing investment patternwith the ranking altered so that towns with populations greater than 5 000people with low growth potential but high human need ranking rateabove small towns with high growth potential. These very small towns withhigh growth potential are unlikely to attract fixed investment anyway astheir populations are too small to justify this unless there are exceptionalcircumstances.
Leader townsThe study revealed that there were a number of well resourced towns inthe Province that were one or two levels of magnitude above the rest interms of growth potential. These towns were described as leader townsand are shown in Figure 4.2.2.4.

CNdV africa PROVINCIAL SPATIAL DEVELOPMENT FRAMEWORKenvironmental planning, landscape architecture, urban design 7 NOVEMBER 2005
4-76
Figure 4.2.2.4 Leader Towns (source: van der Merwe, 2005)
Social investment should occur in all settlements as necessary The focus of this work has been on where fixed investments should bemade. It should be clearly understood that this does not imply that thereshould not be any investment in those settlements with low growthpotential or that are very small. Rather the kind of investment that shouldbe made in these settlements should be of a programmatic rather thaninfrastructural nature. In other words, training and capacity buildingprogrammes, networking events, Adult Basic Education and Training(ABET), and business and technical training. There activities should be runfrom existing or refurbished buildings wherever possible. Innovative thinkingshould also occur, for example, it may be more practical to have abuilding such as a school hitherto “owned” by one department opened upfor multiple use and possibly ownership by a wide range of governmentdepartments and possibly other users as well, than to invest in additionalbuildings.
Encouraging Urban Initiative While it is essential for the long-term economic sustainability of the countryto be committed to following the investment strategy described by theNSDP this should not by default undermine innovative initiatives by settlements that may be classified as having low growth potential. In certain cases settlements may have innovative strategies that shouldreceive public support in whatever way necessary, in an appropriate ratio.
4.2.2.2 LEGISLATIVE AND POLICY CONTEXT
National Spatial Development PerspectiveGreen Paper, A Settlement Framework for the Western Cape ProvincePresident Mbeki, State of the Nation Address, 21 May 2004W Cape Provincial Minister for Environmental Affairs and DevelopmentPlanning, Budget Speech, 21 June 2004.Socio-economic Review 2003 of the Western Cape, Provincial Treasury,2003iKapa Elihlumayo 2004 – 2007 (Department of the Premier, 2004)
4.2.2.3 KEY ISSUES
AspatialThere are insufficient resources to meet the full fixed investment needsof all the settlements in the province, so prioritisation is necessary.While the intention to direct fixed investment towards towns witheconomic potential makes sound economic sense, it will be a greatchallenge to convince municipalities about this, and to allmunicipalities that appropriate social investment will receive thenecessary attention at all towns / places.
SpatialThe study has clearly shown that movement of people from less wellendowed areas to better endowed areas is still in progress.This is manifesting itself as a move to the coastal plains and an emptying out of the inland areas of the Province.

CNdV africa PROVINCIAL SPATIAL DEVELOPMENT FRAMEWORK environmental planning, landscape architecture, urban design 7 NOVEMBER 2005
4-77
4.2.2.4 SUMMARY
Towns with high growth potential and high human need are the top priority for investment in fixed infrastructure. Towns with high human need should be prioritized for social investment, whether or not they have high growth potential. A set of leader towns has been identified for the province. These towns have exceptionally high growth potential, and also tend to have high levels of human need. A responsibility rests on the shoulders of these towns to fulfil a critical role in their regions to support and uplift other surrounding towns and settlements in proximity to them.
REFERENCES AND ACKNOWLEDGEMENTS Department of Environmental Affairs and Development Planning. A Settlement Framework for the Western Cape Province : Green Paper, Provincial Government Western Cape, 2003; President Mbeki, State of the Nation Address, 21 May 2004;Van der Merwe, I.J. Growth Potential of Towns in the Western Cape, Centre for Geographical Analysis, University of Stellenbosch, 2005; President Mbeki, State of the Nation Address, 21 May 2004;Western Cape Provincial Minister for Environmental Affairs and Development Planning, Budget Speech, 21 June 2004;Provincial Treasury (Treasury) : Macro Economic Analysis Western Cape Socio-Economic Review, Provincial Government: Western Cape (PG:WC), Government Printers, RSA, 2003;Provincial Treasury (Treasury): Provincial Economic Review and Outlook (PERO), Provincial Government: Western Cape (PG:WC), 2005;Department of the Premier, iKapa Elihlumayo 2004 – 2007, Provincial Government Western Cape, 2004.

PROVINCIAL SPATIAL DEVELOPMENT FRAMEWORK CNdV africa environmental planning, landscape architecture, urban design 7 NOVEMBER 2005
4-78
4.2.3 TRANSPORT 4.2.3.1 INTRODUCTION
Transport is a supportive sector which plays a key role in meeting objectives such as economic growth, improved access to employment opportunities and increased social integration.
Transport, both public and private, is a primary spatial structuring element providing access and mobility to both urban and rural communities. Internationally, successful urban settlements rely heavily on advanced public transport networks incorporating high, medium and low mobility routes within regional development frameworks allowing for an integrated development approach. According to the Western Cape SoER (2004) transport infrastructure remains the largest single investment in the Western Cape, with both the public and private sectors playing key roles in the maintenance and development of infrastructure and services.
The Western Cape has a relatively well-developed road and rail network and high quality sea and airports, which have enabled the Province, and especially Cape Town, to grow rapidly in importance as a leading gateway to South Africa and recently to West Africa. The Province has two major international gateways, Cape Town International Airport and the Port of Cape Town. Most visitors to the Western Cape arrive through Cape Town International Airport while most freight moves through the Port of Cape Town. Secondary international gateways include the Port of Saldanha and to a lesser extent Mossel Bay harbour and George Airport.
One of the underlying success factors of any regional economy relates to the movement of goods, people and services. It is important that the role and functioning of the different modes of transport and the impact on the infrastructure are clearly understood in order to focus different investment on the areas of opportunity and need.
Without strategic investment in transport infrastructure and especially public transport, the Western Cape will struggle to compete effectively nationally and internationally, attract international and domestic investment and ensure the future economic growth and socio-economic development of the Province’s inhabitants.
4.2.3.2 BACKGROUND
Private Motor Vehicle Ownership, Usage and Congestion According to City of Cape Town (April, 2003), 54% of households in Cape Town had access to a private motor vehicle in 1999. Car ownership in the City of Cape Town has increased, especially in the middle and low income groups, with total vehicle ownership increasing by 45% from 1990 to 2000, and the number of motor cars doubling in the last 25 years. These figures translate to a current ratio of 178 cars per 1000 people in Cape Town. This increase is evident in congestion on freeways, especially during peak hours. According to the City of Cape Town's Transport Department, private motor vehicle volumes on the N1 Freeway and the M3 route increased by 63% and 67% respectively during the last 13 years. This increase has led to problems relating to increased fuel consumption, pollution (65% of CO2
emissions are from motor vehicle traffic) and congestion. For example, tailbacks of several kilometres are a daily occurrence on the N1, N2, M3, M5 and Koeberg routes into Cape Town CBD. Tailbacks and severe congestion are also experienced on the N1 Freeway, on the Willie van Schoor - Durban Road couplet, and in the Rondebosch and Claremont areas, especially during the school term.
Morning peak congestion is also increasingly being experienced in Paarl, Stellenbosch and George. Traffic congestion also occurs at other times. During the weekend and on Friday afternoons and Mondays severe congestion is experienced on the N2 Freeway descending from Sir Lowry's Pass and on both directions into Knysna. Severe congestion is also experienced on a daily basis on Louis Fourie Road in Mossel Bay and on the Hawston to Hermanus Road.
It should be noted that merely widening the affected roads will have little long- or even medium-term benefits. Experience has shown that adding road capacity to a network tends to attract usage over and above normal traffic volumes. More imaginative solutions that will have to embrace public transport in integrated approaches will be required.

CNdV africa PROVINCIAL SPATIAL DEVELOPMENT FRAMEWORK environmental planning, landscape architecture, urban design 7 NOVEMBER 2005
4-79
Road Infrastructure The provincial road network for which the Provincial Department is responsible comprises 6 354km of surfaced roads, 10 424km unsurfaced roads and approximately 21 000km of unsurfaced minor roads (SoER, 2004).
The overall condition of the surfaced network has dropped from 71% in 2001 to 67% in 2004 (100% equals perfect condition). Roughly 11% of the surfaced roads are in a poor or very poor condition, 36% in a fair condition, while 92% of the pavements are 16 years and older. Deterioration models indicate that the percentage of roads in a poor condition will grow to approximately 40% of the network by 2012/13. The gravel road network has 5 885km (57%) in poor or very poor condition. The average gravel thickness decreased from 63mm over 5 years to only 31mm in 2002. Currently 73% of the gravel network has potential passability problems requiring R680 million to regravel (Department of Transport & Public Works, 2004).
Table 4.2.3.1 indicates the category of road in kilometres and the percentage distribution between district municipalities for the 2003/04 financial year.
2003/04 per district municipality
Category of road % distribution TOTAL
City of CapeTown
WestCoast
CapeWinelands Overberg Eden Central
Karoo
Trunk Roads (km) %
3 299 100
1665
79824
41313
46714
83325
62219
Main Roads (km) %
5 071 100
75215
1 265 24
96419
48910
91018
69014
Divisional Roads (km) %
9 512 100
2783
1 901 20
1 494 16
1 362 14
2 774 29
1 703 18
Minor Roads (km) %
21 116 100
890.5
6 976 33
2 288 11
1 804 8.5
3 845 18
6 114 29
TOTAL%
38 999 100
1 284 3
10 940 28
5 160 13
4 122 11
8 364 22
9 129 23
Source (Department of Transport and Public Works, 2004) Table 4.2.3.1 Percentage distribution of roads between District Municipalities
Note: Percentages have been rounded off
The maintenance backlog of road infrastructure based on a 2002 survey was estimated at R2 142 billion, which translates into an average 5-year capital fund allocation of R976 million per annum, required to meet current standards. The present capital budget for maintenance and rehabilitation is an average of R383 million per annum, resulting in the condition of the
road network continuing to deteriorate and suggesting that in future routine maintenance expenditure will have to grow to the detriment of capital spending (SoER, 2004). An ever-increasing component of available funds will have to be allocated for routine maintenance, drawing funds away from preventative maintenance, rehabilitation and reconstruction.
One of the major factors in deteriorating road condition is the overloading of heavy vehicles, which is estimated to cost the taxpayer between R120m and R150m per annum in road maintenance. The Province currently has nine weighbridges in operation, see Figure 4.2.3.1 and a doubling of shifts at five weighbridge stations has seen an increase in the hours of operation from eight hours to 16 hours per day. Improvements have been made to the infrastructure required at these facilities to improve effectiveness and efficiency. This has resulted in a reduction in the number of overloaded vehicles from 10,8% in 2001 to 7,7% in 2002 (Department of Transport & Public Works, 2003 – (T&PW)).
SANRAL has been considering the tolling of the N1, N2 and R300 freeways to be able to afford the cost of maintenance and necessary upgrades of those routes. The provincial government is considering a fuel levy as a means to increase maintenance funding. The impact of tolling within urban catchment areas and the effect of both proposals on the provincial economy needs to be investigated to ensure that the preferred measures are implemented in a way that supports economic growth and development.
The Impact of By-pass Routes During the 1960s and 1970s a number of by-passes were affected around many rural towns. This precipitated a three stage process of diminishing mainly retail opportunities. First, passing trade was rerouted around rather than through the town. Second, new large filling stations were allowed to have direct access to the national route thereby impacting on fuel stations in the towns. Third, retail and restaurant activities were permitted on the service station forecourts thereby undermining these activities in the towns. A fourth impact on Local Economic Development was that these new service stations and retail operations were part of national chains rather than being owned by local business people. While larger towns, e.g. George and Worcester, were able to withstand the drop in passing trade, a number of smaller towns have not. Mitigating measures to restore some

CNdV africa PROVINCIAL SPATIAL DEVELOPMENT FRAMEWORKenvironmental planning, landscape architecture, urban design 7 NOVEMBER 2005
4-80
of the attractiveness of these to the passing travellers should be studied,see Figure 4.2.3.2.
Figure 4.2.3.2 Uniondale
Public TransportPublic transport is a basic need for a large proportion of the population of the Western Cape in both urban and rural areas. In the City of Cape Town,where 67% of the population of the Province resides, the relatively low carownership rate combined with the need to use other means of transportfor work trips mean that 56% of people depend on public transport use. It isimperative that public facilities and non-motorised transport be made anoverall transport priority : the vision in developing the Western CapeTransport Policy, as set out in the White Paper of 1997 was "Public TransportFirst" and this remains valid.Historic settlement patterns and the separation of work and residence have resulted in an urban transport system where the urban poor have to
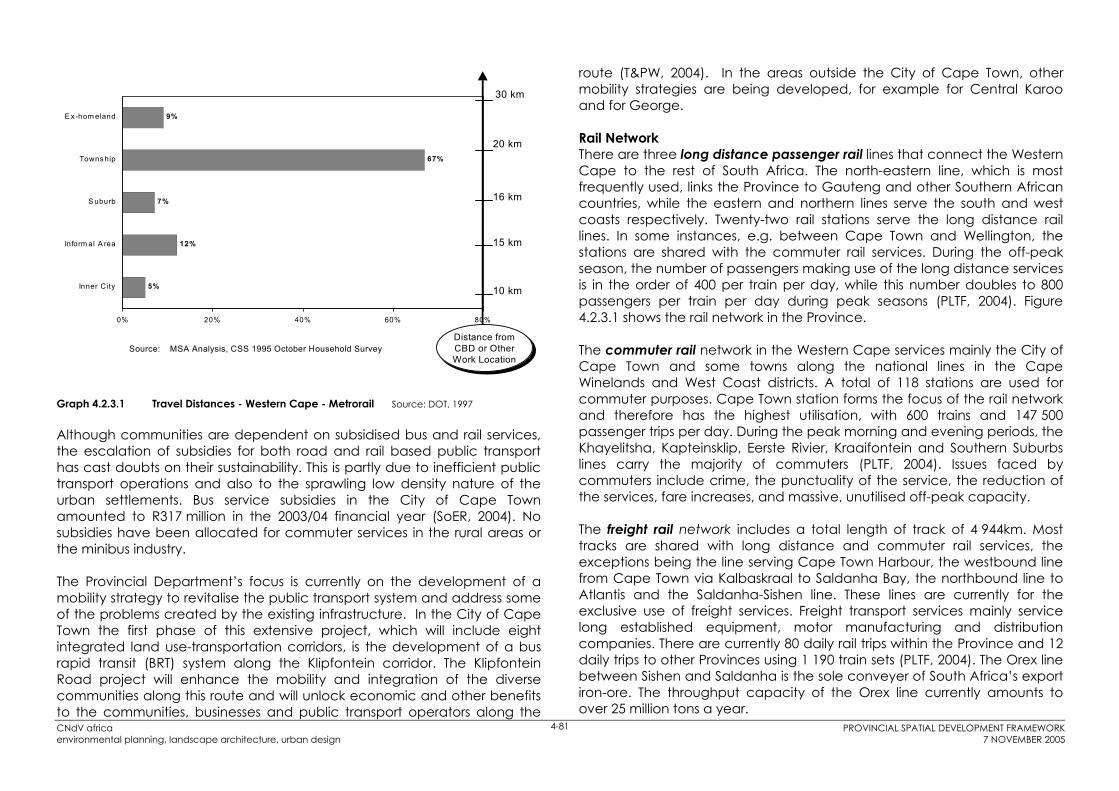
commute long distances to employment centres. This discrepancy has resulted in an inefficient and heavily subsidised public transport system and the need for investment in road infrastructure due to the reliance onprivate vehicle ownership, as well as high maintenance costs of road infrastructure. Graph 4.2.3.1 shows that township residents, comprising 67%of urban residents, have to travel an average of 18kms in one direction toget to work. Informal settlements, on the other hand tend to be betterlocated than even the suburbs and especially townships, although theiraverage trip distance is still high at approximately 15km.
In rural areas, where services are less frequent and accessible, and carownership lower than in the City of Cape Town, many people are virtuallystranded. In farming communities, workers often depend on occasional liftsfrom their employers, even for essential travel requirements. In these ruralareas, communities are forced to walk long distances to reach basicamenities and services, simply because no form of transport is available or the available public transport is unaffordable (PLTF, 2004).
A major issue with public transport, whether it be rail or road services in theCity of Cape Town or rural school bus services, is their excess capacity inoff-peak hours. This is directly related to the spatial structure of settlementswhich has created morning and evening long distance "tidal flows" between home and school and home and work. The pattern is notintegrated in most cases, with notable exceptions such as the SouthernSuburbs railway line in the City of Cape Town, and distances are too far for people to walk or cycle.
Modes of transport used for the provision of public transport services in theProvince are commuter trains, buses, minibus taxis and metered taxis.Commuter rail is the most utilised mode of passenger travel in publictransport. However, personal safety is a major issue. Minibus-taxis providethe largest road based service in the City, and in the case of rural areasthey provide the largest of all public transport services. The fleet of some10 000 minibus-taxis in the Province, generates approximately 15 000 jobs.Formal bus transport employs approximately 5 000 people, metered-taxis1 000, and Metrorail more than 2 000. The number of people gainfullyemployed in carrying out public transport duties in the Province totalssome 23 000 (Department of Transport & Public Works, 2004).
PROVINCIAL SPATIAL DEVELOPMENT FRAMEWORKCNdV africa
Source: MSA Analysis, CSS 1995 October Household Survey
5%
12%
7%
67%
9%
0% 20% 40% 60% 80%
Inner City
Inform al A rea
S uburb
Township
E x -hom eland
Distance fromCBD or OtherWork Location
Distance fromCBD or OtherWork Location
10 km
15 km
16 km
20 km
30 km
Graph 4.2.3.1 Travel Distances - Western Cape - Metrorail Source: DOT, 1997
Although communities are dependent on subsidised bus and rail services,the escalation of subsidies for both road and rail based public transporthas cast doubts on their sustainability. This is partly due to inefficient publictransport operations and also to the sprawling low density nature of theurban settlements. Bus service subsidies in the City of Cape Town amounted to R317 million in the 2003/04 financial year (SoER, 2004). No subsidies have been allocated for commuter services in the rural areas or the minibus industry.
environmental planning, landscape architecture, urban design 7 NOVEMBER 20054-81
The Provincial Department’s focus is currently on the development of a mobility strategy to revitalise the public transport system and address someof the problems created by the existing infrastructure. In the City of CapeTown the first phase of this extensive project, which will include eightintegrated land use-transportation corridors, is the development of a busrapid transit (BRT) system along the Klipfontein corridor. The KlipfonteinRoad project will enhance the mobility and integration of the diversecommunities along this route and will unlock economic and other benefitsto the communities, businesses and public transport operators along the
route (T&PW, 2004). In the areas outside the City of Cape Town, othermobility strategies are being developed, for example for Central Karooand for George.
Rail NetworkThere are three long distance passenger rail lines that connect the WesternCape to the rest of South Africa. The north-eastern line, which is mostfrequently used, links the Province to Gauteng and other Southern African countries, while the eastern and northern lines serve the south and westcoasts respectively. Twenty-two rail stations serve the long distance raillines. In some instances, e.g. between Cape Town and Wellington, thestations are shared with the commuter rail services. During the off-peakseason, the number of passengers making use of the long distance servicesis in the order of 400 per train per day, while this number doubles to 800passengers per train per day during peak seasons (PLTF, 2004). Figure4.2.3.1 shows the rail network in the Province.
The commuter rail network in the Western Cape services mainly the City ofCape Town and some towns along the national lines in the CapeWinelands and West Coast districts. A total of 118 stations are used forcommuter purposes. Cape Town station forms the focus of the rail networkand therefore has the highest utilisation, with 600 trains and 147 500passenger trips per day. During the peak morning and evening periods, theKhayelitsha, Kapteinsklip, Eerste Rivier, Kraaifontein and Southern Suburbslines carry the majority of commuters (PLTF, 2004). Issues faced bycommuters include crime, the punctuality of the service, the reduction ofthe services, fare increases, and massive, unutilised off-peak capacity.
The freight rail network includes a total length of track of 4 944km. Mosttracks are shared with long distance and commuter rail services, theexceptions being the line serving Cape Town Harbour, the westbound linefrom Cape Town via Kalbaskraal to Saldanha Bay, the northbound line toAtlantis and the Saldanha-Sishen line. These lines are currently for theexclusive use of freight services. Freight transport services mainly servicelong established equipment, motor manufacturing and distributioncompanies. There are currently 80 daily rail trips within the Province and 12daily trips to other Provinces using 1 190 train sets (PLTF, 2004). The Orex linebetween Sishen and Saldanha is the sole conveyer of South Africa’s export iron-ore. The throughput capacity of the Orex line currently amounts toover 25 million tons a year.

CNdV africa PROVINCIAL SPATIAL DEVELOPMENT FRAMEWORKenvironmental planning, landscape architecture, urban design 7 NOVEMBER 2005
4-82
The current state of rail transport is of grave concern. As the Province'seconomic growth continues and hopefully accelerates there will beincreasing passenger and freight movement between Saldanha-Vredenburg, the City of Cape Town, Winelands and the Southern Cape, as well as with Gauteng. Rail has the potential to carry large volumes of trafficwithout requiring extensions, increasing hazards, and contributing topollution. However, the current state of affairs is resulting in increasingtraffic on the road network contributing to road maintenance needs,traffic hazards, congestion and related problems.
Figure 4.2.3.3 Road Trains
Hazardous and Toxic WasteOperations such as nuclear power stations, hospitals and clinics, and theProvincial Waste Management Strategy which is centralising especiallyhazardous and toxic waste to three hazardous waste sites in the Province,are creating a demand for the transport of these materials. Safe methodsof transporting such waste must be investigated.
Non-Motorised Transport (NMT) The movement of people through non-motorised transport has not enjoyedhigh priority until recently, but there is a growing focus on bicycle andpedestrianisation projects in both rural and urban areas, as part of thedevelopment of mobility strategies for rural areas and along development
corridors in urban areas. Affordable and sustainable mobility in rural areas can be further enhanced through the roll out of non-motorised transportinitiatives, including the provision of safer pedestrian pathways and facilities and the expansion of the Shova Kalula bicycle programme.
Shova Kalula is a National Department of Transport project aimed atpromoting cycling among schoolchildren and workers who walk longdistances every day in disadvantaged rural and urban areas. Later, the project will refocus and encourage cycling among a much broader usercommunity. The initiative aims to provide sustainable and affordable mobility to communities through access to bicycles and the establishmentof a self-sustaining bicycle micro-business in the community (T&PW, 2004).
Bicycle transport has the potential to make a major contribution totransport on the Province, especially in flatter areas, but it requiresdedicated safe ways.
AirportsCape Town International Airport (CTIA) is the most important national andinternational gateway in the Western Cape. The current passenger total of5.6 million is predicted to increase to 14 million by 2015. Of the current total,1.2 million are international passengers (Johannesburg currently has6 million international passengers per annum and Durban 50 000). The existing airport is accessibly located and there is land available for futureairside and landside developments. The relocation of the airport is out ofthe question as it has a R1.3 billion replacement value meaning that thedepreciation of capital will be more than CTIA’s current profit (interviewVracar and Wood).
An important land use planning issue concerning airports is the alignmentof noise contours and land use restrictions within them. There areinternational conventions on what land uses should be permitted. Thesecontours should be proclaimed well in advance of urban developmentand protected accordingly.
Even during peak season there is capacity at the airport and the proposedsecond runway will provide sufficient capacity for the next 50 years. The main restrictions on the number of flights to CTIA include factors such asroute regulation, landing rights agreements and airline operation strategies(e.g. hub and spoke, etc.) rather than physical constraints. It is in the

CNdV africa PROVINCIAL SPATIAL DEVELOPMENT FRAMEWORK environmental planning, landscape architecture, urban design 7 NOVEMBER 2005
4-83
interest of the Western Cape (City of Cape Town) to get more direct flights to CTIA as this will help to reduce the seasonality of airport volumes, extend the tourism season and have general up- and downstream economic benefits.
Cargo demand is in a similar position to passenger demand, in that Airports Company South Africa (ACSA) can provide more space and capacity should demand increase. At present the cargo demand at CTIA is low as 90% of cargo is destined for Johannesburg and 80% of all cargo is carried in passenger aircraft. Cargo movement is also mainly one-way from South Africa to export destinations, with relatively little cargo arriving by air. ACSA has a proposal to develop a Freight City in order to accommodate the needs of freight agents situated at CTIA with facilities to store fish, fruit and vegetables.
ACSA works on a just-in-time principle to reduce risk and cost of new development. Additional apron and aircraft parking space is being constructed, while two multi-storey car parkades for an additional 2 000 vehicles, a new domestic terminal and a further extension to the international terminal are planned (interview Vracar and Wood). The Soccer World Cup is likely to bring these projects forward and increase their scope to provide sufficient capacity in 2010. There is a need to improve access to the airport, both road and rail-based. A rail corridor to the airport is currently being investigated but greater provision of road-based public transport and enhanced facilities within the airport precinct to accommodate those modes needs investigation as well.
George Airport has experienced an increase in air traffic but is still mainly seasonal. The current runway system has enough capacity to accommodate a substantial increase. The current domestic passenger throughput is 400 000 – 500 000 passengers/annum. Cargo traffic includes flowers, fish, oysters, herbs and ferns. The increasing popularity of the Garden Route as a tourist destination is expected to boost passenger growth at George Airport even further.
Plettenberg Bay Airport has recently been privatised and is expected to play an important role in the town's future development.
Ports The Port of Cape Town is a full service, general cargo port, operating 24 hours a day, seven days a week and is equipped to handle all types of general break bulk and containerised cargo via its specialised terminals. The port is world renowned for its deciduous fruit, perishable and frozen product exports. The fishing industry at the Port of Cape Town is of major proportions. Conventional cargo is shipped through Duncan Dock and a container terminal is situated at the Ben Schoeman Dock. The rail/road transport network contributes towards the total logistical chain for containerised as well as conventional cargo.
The Port also has significant potential as a passenger liner terminal and a number of cruise ships visit every year. However, the facilities for these operations are poor and this is believed to be constraining the realisation of this potential.
The Port serves as a hub for cargoes between Europe and the Americas and Africa, Asia and Oceania. It is generally regarded as a gateway for African countries, and should become a hub port for the West African coast. The Container Terminal has the advantage that, in respect of United Kingdom, European and American bound time-sensitive cargoes, a five day saving in transit time on containers to and from the Gauteng area can be achieved. This is made possible by the direct railage of containers which eliminates the sailing time to other ports. Throughput capacity at the container terminal stands at 420 000 TEUs (twenty-foot equivalent units) a year, but will be increased by a further 50 000 in the near future (National Ports Authority). However, it should be noted that the Port is vulnerable to competition from Walvis Bay due to the recently completed Trans-Kalahari highway connecting this port directly to Gauteng via Botswana.
Periodically, serious bottlenecks occur at the container terminal, especially at the end of summer and during April with its many public holidays, during which period there is a rush to export fruit. Some problems have been blamed on operational efficiency rather than infrastructure capacity. The Port Plan indicates that the container terminal will be too small within the next five years and thereafter extensions will be needed.
The Port of Saldanha is the deepest and largest natural port in Southern Africa. The port is the only iron ore handling port in South Africa and also serves base metal mines, the heavy minerals smelter as well as the crude

CNdV africa PROVINCIAL SPATIAL DEVELOPMENT FRAMEWORK environmental planning, landscape architecture, urban design 7 NOVEMBER 2005
4-84
oil storage facility near the port. A R650 million upgrade to the iron ore export plant has recently been implemented.
Apart from serving the manufacturing industry, investigation is underway to establish Saldanha as a focus for the piping of oil and gas. The port has substantial spare capacity.
Mossel Bay has always been a fishing port of substance with limited commercial cargo activity, but the development of Mossgas and PetroSA has played a major role in the development of the port. The port also serves the oil industry as an oil rig supply boat base and is the only South African port that operates two off-shore mooring points within port limits. However, the harbour has a relatively limited capacity due to its entrance depth of only 8m.
Institutional Issues A major problem facing the delivery of effective and convenient public transport services in the Western Cape has been the lack of a central, co-ordinated transport planning authority with effective management control over the various services making up public transport. This is a particular problem for the City of Cape Town. The operational and commuter service divisions of the suburban rail system, SARCC and Metrorail, are controlled from a head office in Pretoria. The various bus companies, of which Golden Arrow in the City of Cape Town is the largest, are private companies although they receive public subsidies in many instances. The mini-bus taxi industry comprises many different operators loosely combined into a number of associations. The industry does not receive government subsidies and there is intense competition for routes which becomes violent and sometimes deadly from time to time.

CNdV africa PROVINCIAL SPATIAL DEVELOPMENT FRAMEWORKenvironmental planning, landscape architecture, urban design 7 NOVEMBER 2005
4-85
Figure 4.2.3.1 Transport

CNdV africa PROVINCIAL SPATIAL DEVELOPMENT FRAMEWORK environmental planning, landscape architecture, urban design 7 NOVEMBER 2005
4-86
4.2.3.3 KEY ISSUES
Urban planning has impacted on the viability of public transport in the metropolitan area due to the low densities and dispersed nature of land uses, creating morning and evening one-way tidal flow movement patterns; The large number of roleplayers in the transport sector, as well and the separation of planning, management and operations, creates challenges in terms of service delivery, co-ordination, efficiency and responsibility; In the City of Cape Town there is great need for a transport authority to ensure accountability; The public transport system in the Province is inadequate, especially in the rural areas; The public transport sector with the exception of mini-bus taxis is heavily reliant on subsidies; The regulation and integration of the taxi industry into the public transport sector is urgently required; There is a lack of investment in the maintenance and provision of public transport infrastructure, especially the rail network. The maintenance backlog also impacts on service delivery and economic development will be constrained without strategic investment. The deterioration of the network has been outstripping the rate at which maintenance and rehabilitation can be done; Unless transport infrastructure, especially rail, is efficient to overcome the problem of the Western Cape being located far away from key markets, the Province will lose its competitive edge with other Provinces, SADC and development areas such as the Gauteng-Durban corridor; Overloading of heavy vehicles directly impacts on the functional lifespan and cost of road infrastructure; The growth areas in the City of Cape Town, namely the Milnerton, Table View and Durbanville, areas are not served by rail, nor are bus and mini-bus taxi services adequate. This makes these areas dependent on private transport which is leading to the metropolitan area experiencing an increase in congestion, especially during peak hours when the road network capacity is exceeded in some areas; The impact of by-passes on the economy of small rural towns requires investigation and possible identification of mitigating measures to
restore some of the attractiveness of these towns to the passing travellers; The City’s future economic growth prospects depend significantly on its logistics efficiency, and will be negatively affected by efficiency-reducing factors such as congestion; Levels of service in rail freight are a problem. Due to its pricing, cost and efficiency, rail cannot currently compete with road freight transport; Underutilisation of rail infrastructure is evident as there is spare capacity on all routes; the lack of train sets and shortcomings of the signalling also hampers the quality of services; There is a need for a hub within the CBD, integrated with key infrastructure such as the Cape Town Station from where long distance coaches can operate. Attention to facilities along primary routes to accommodate the long distance coaches is needed; In the interest of road safety, rest stops along primary routes to cater for trucks and private motorcars are also needed; Cape Town Port is at capacity while Saldanha Port has substantial capacity available; Cape Town International Airport can accommodate additional growth, but opportunities should be explored to divert general and business aviation to an alternative airport such as Fisantekraal or Ysterplaat in the longer term. The feasibility of other national airport locations within the Province is unlikely; The importance of Cape Town as a hub port for cargoes from West Africa is increasing, while there is also growth in the number of transhipments between the Far East and West African ports; There are environmental issues surrounding the expansion of the ports regarding coastline equilibrium that need to be effectively addressed; Environmental legislation has increased the planning timeframes needed before new transport infrastructure can be implemented (i.e. the lag between planning and implementation has increased); There is a need to expand the key air and seaports strategically to meet the growing demand for the movement of passengers and cargo; Noise contours w.r.t. airports and their associated land use controls should be designated well in advance of future urban development; and,
CNdV africa PROVINCIAL SPATIAL DEVELOPMENT FRAMEWORK environmental planning, landscape architecture, urban design 7 NOVEMBER 2005
4-87
Tolling the N1, N2 and R300 freeways within urban areas may have an impact on the economy and travel costs, especially for low and middle income people.
4.2.3.4 SPATIAL SUMMARY
Land use densification: Densification is key to the efficiency and urban restructuring of public transport, especially the rail service within the Metro. Therefore policy should focus on the intensification of land uses within walking distance from stations and public transport corridors. Trends internationally focus on the identification of Transport Development Areas. There is also a need to understand the difference in the relationship between land use and road transport and land use and rail transport. The contact points of rail and land use are at and around stations. It is within these zones that high intensity urban development will create the thresholds that will make the rail service successful. An investigation should be made as to what level of population density will be necessary within walking distance of rail stations and bus stops to make these services viable.
Urban restructuring should occur: o firstly, at a local scale, where there is a vast need for improved and
safer pedestrian circulation, cycling and other means of non-motorised transport, as well for general aesthetic and other qualitative improvements (i.e. creating dignified urban spaces); and,
o secondly, by developing a cost-effective, integrated, yet pragmatic bundle of land use and transport investment and management strategies to contain and redress the increasing level of automobile dependence that is caused by crime, overcrowding on public transport, dispersal of job opportunities and the dominance of “car culture” (PLTF, 2004).
Travel patterns: There is a significant difference between the urban structure and travel patterns of Cape Town and those of most other South African cities. Despite the legacy of apartheid, and the effects of ongoing urban sprawl and commercial decentralisation, Cape Town still has:
o a relatively good spatial match between its main public transport corridors and the main concentrations of jobs and people (especially public transport users);
o a fairly high proportion of jobs within its inner city; o a CBD/harbour area (i.e. V&A Waterfront) which is regaining its
attractiveness to tourists, shoppers and investors (bucking the general trend of urban decay, increasing crime and disinvestment being experienced in most other South African cities), and
o a fairly frequent and extensive network of rail passenger services (PLTF, 2004).
Provincial gateways: The Province has two major international gateways, namely Cape Town International Airport and the Port of Cape Town. Most visitors to the Western Cape arrive through Cape Town International Airport while the majority of freight is handled at the port. Other significant gateways are the Port of Saldanha, to a lesser extent Mossel Bay harbour and George Airport, which serves mainly visitors to the Southern Cape area. Priority should be given to the main gateways, but the capacity of the other facilities, such as Saldanha Port, should be utilised to facilitate economic opportunity. Giving George Airport international status could improve tourism and import/export possibilities.
Transport networks: Rural transport improvements can increase market access and thereby lower agricultural production costs and also facilitate the development of the non-agricultural rural economy. Urban transport improvements can increase labour market efficiency and access to amenities. Inter-urban transport improvements can facilitate domestic and international trade by speeding up the movement of freight and people. Conversely, in many developing countries, the inadequacy of transport infrastructure and the inefficiency of transport services are recognised as being amongst the main bottlenecks to socio-economic development and social integration.
Potential key public transport links o Cape Town CBD to Cape Town International Airport; o extension of Khayelitsha rail network to its eastern extremity;
CNdV africa PROVINCIAL SPATIAL DEVELOPMENT FRAMEWORK environmental planning, landscape architecture, urban design 7 NOVEMBER 2005
4-88
o a possible connection between City of Cape Town and Saldanha which could include Atlantis and service areas such as Table View and Milnerton;
o False Bay Coast: Muizenberg to Gordon’s Bay; o more direct links into the adjacent Winelands towns; and, o an improved rail service between City of Cape Town and the
Southern Cape and Gauteng that will bring regional development advantages to many of those towns situated on these routes.
Needs of the tourism sector: Investment in tourism related infrastructure should focus on o access to the Province: CTIA, Cruise Liner Terminal at Cape Town
Port, encouragement of more direct flights to the Province; o movement within CBD: public transport such as priority buses, etc; o movement within the City of Cape Town: public transport links to
key sites; and, o movement within the Province: road and public transport links to
and between Tourism Development Areas.
Rural/agricultural perspective: The rural-urban divide in the Western Cape, although clearly present, is not as pronounced as in many other parts of the country. In addition, the Southern Cape benefits from tourism, a diversified agricultural sector and the Mossgas PetroSA project as important growth forces. The West Coast Investment Initiative, which incorporates the Saldanha Steel project, is bringing new jobs and investment opportunities to the relatively underdeveloped north-west area of the Province. The Cape Winelands area is taking advantage of the new and expanded opportunities for tourism and agri-processing. Other remote sub-regions are taking advantage of increased opportunities for tourism, and a number of small towns have benefited from the expansion of services (from garages and "ultra-cities" to guest houses) to meet the demands of the increasing road traffic on the N1, N2 and N7, as well as on new tourist routes such as the R62 through the Little Karoo and the Mission Stations and Bird routes. The deterioration of provincial roads does however have an impact on agriculture, tourism (West Coast and Southern Cape) and other non-metropolitan economic activities.
Rural mobility: Due to the dispersed population distribution in most of the rural areas, public transport systems are not viable and taxi
operators are relatively expensive over longer distances. Options to provide local mobility to rural population through alternatives such as NMT initiatives (bicycles, etc) are being further investigated. The school bus service, currently under review, is an example of these unviable rural, public transport services. This, integrated with public transport options along key routes, could assist in expanding the economic and social opportunities of the rural population.
REFERENCES AND ACKNOWLEDGEMENTS Airports Company South Africa (ACSA) Goran Vracar, Assistant Group Executive Airport Planning and David Wood Manager Property Cape Town International (pers com); Ben Veldman: Assistant Executive Manager: Roads Infrastructure, PG:WC (pers com); Cape Regional Chamber: Jeannie Taljaard, Business Information Manager (pers com); Department of Transport & Public Works, Annual Report, 2003;Department of Transport & Public Works, Annual Report, 2004;Department of Transport, Annual Report, 1997;SARCC: Peter Hahn, General Manager, Network Planning and Development (pers com); Department of Environmental Affairs and Development Planning, SRK Consulting. Western Cape State of the Environment Overview Report (SoER), 2004;MSA Analysis, CSS 1995 October Household Survey, 1995;Wesgro: Ismail Dockrat, Chief Executive (pers com).

CNdV africa PROVINCIAL SPATIAL DEVELOPMENT FRAMEWORKenvironmental planning, landscape architecture, urban design 7 NOVEMBER 2005
4-89CNdV africa PROVINCIAL SPATIAL DEVELOPMENT FRAMEWORKenvironmental planning, landscape architecture, urban design 7 NOVEMBER 2005
4-89

CNdV africa PROVINCIAL SPATIAL DEVELOPMENT FRAMEWORKenvironmental planning, landscape architecture, urban design 7 NOVEMBER 2005
4-89
4.2.4 WATER SUPPLY INFRASTRUCTURE (DEMAND & SUPPLY) 4.2.4.1 INTRODUCTION
The importance and scarcity of water resources has been discussed inSection 4.1.4.1, and the fact that South Africa is a water-scarce country.The Western Cape's freshwater ecosystems are under great pressure. In thissection the demand for water, and water supply infrastructure will beaddressed. The challenge that South Africa and the Western Cape face isto manage water demand so that South Africa and the Western Capecan achieve a sustainable development path.
The availability of affordable water can be a limiting factor for economicgrowth and social development, especially in South Africa where water isa relatively scarce resource that is distributed unevenly – geographically,seasonally and socio-politically. The Western Cape’s annual rainfall issubstantially lower than the South African average of 452 mm/year. TheProvince’s high evaporation rates almost always exceed rainfall, meaningthat little water finds its way into the region’s rivers, dams and wetlands.Rainfall is also highly seasonal and erratic, resulting in unpredictableperiods of drought. Furthermore, droughts may become more frequent as a result of climate change. These challenges, along with the high influx ofpeople from other Provinces into the Western Cape, put increasingpressure on the Province’s already stressed water resources (DEADP, 2004).
4.2.4.2 BACKGROUND
The demand and supply of water is summarised here according to the fourWater Management Areas (WMAs) in the Western Cape: the Berg, Breede,Gouritz and Olifants Doring. The Breede WMA is the only one that has a surplus based on existing infrastructure. This surplus is small and is mainly inprivately owned dams (Karen Shippey, pers com).
Water demand
WMA Irrigation Urban Rural Mining & BulkIndustrial
Afforestation
Berg 43% 55% 2%Breede 91% 6% 2% 1%Gouritz 75% 15% 3% 2% 5%Olifants/Doring 95% 2% 2% 1%
Table 4.2.4.1 Catchment water requirements per WMA in 2000
Figure 4.2.4.1 Water Management Areas and Population Distribution
Berg WMA Geographically 56% of total requirements for water occurs within theGreater Cape Town and 31% in the Upper Berg sub-area;

CNdV africa PROVINCIAL SPATIAL DEVELOPMENT FRAMEWORK environmental planning, landscape architecture, urban design 7 NOVEMBER 2005
4-90
Irrigated agriculture mainly produces high value table grapes, fruit and wine for the export market and vegetables for local consumption; More than 45% of water used in urban areas becomes available as effluent, part of which could potentially be re-used (in Cape Town approximately 6% of return flows are used, compared to 15% in Durban, and close to 100% in Johannesburg); Future growth expected as a result of tourism and other developments along the west coast; and, Continued concentration of economic development in Greater Cape Town (with strong growth in water requirements) and additional water needs for irrigation.
Breede WMA Nearly 75% of the water use in the area is in the Upper Breede sub-area, followed by the Overberg West, the Riversonderend and the Lower Breede sub-areas, with irrigation by far the largest water use sector in all these areas; Large quantities of water already needed for transfer to Berg WMA, mainly for urban use; Coastal developments expected in the Overberg West sub-area, possible growth in the Upper Breede sub-area, as well as additional irrigation development; and, Additional transfers to Berg WMA likely to be required.
Gouritz WMA Most important land use impacts on surface water runoff are the reduction in runoff due to alien infestation and afforestation; Water use by irrigation highly variable from year to year, much of land lies fallow and is only irrigated in years of high runoff when sufficient water is available; Substantial proportion of water used for urban and industrial purposes is used non-consumptively, and becomes available as effluent; General expectations are for future economic and population growth to be concentrated in the coastal belt, mainly from Mossel Bay to Plettenberg Bay (Coastal sub-area); Growth expected in the Gamka and Olifants sub-areas, associated with increased economic activity at Beaufort –West and Oudtshoorn respectively;
Options also exists for additional afforestation in some of the high rainfall areas as well as possible irrigation development in the catchments west of the Gouritz River; and, Water resources currently developed are already fully utilised, some inland towns experience insufficient reliability of supply, while serious deficits may result from the implementation of the Reserve in the Coastal sub-area.
Olifants/Doring Most of the water use in the management area is in the Olifants sub-area, representing over 65% of the total requirements for water in the area. Close to 20% is used in the Koue Bokkeveld, about 10% in the Sandveld and smaller quantities in the Doring and Knersvlakte sub-areas; Although mining requires only 3 million m3 per year, it represents nearly 50% of the total water availability in the Knersvlakte sub-area; and, Strong economic growth, could be reflected in increased water demand in tourism and other development along the West Coast and in the Olifants River valley.
Water Availability Water availability is a fundamental determinant of population carrying capacity. Table 4.2.4.2 summarises the population carrying capacity of the Province according to how much water is left after addressing ecological requirements. It can be seen that in 1986 the Berg River catchment was approaching capacity while there was still considerable capacity in other catchments. However, these figures did not take into account high seasonal demand, for instance, at coastal resorts over December where local supplies are often exceeded over the short term.
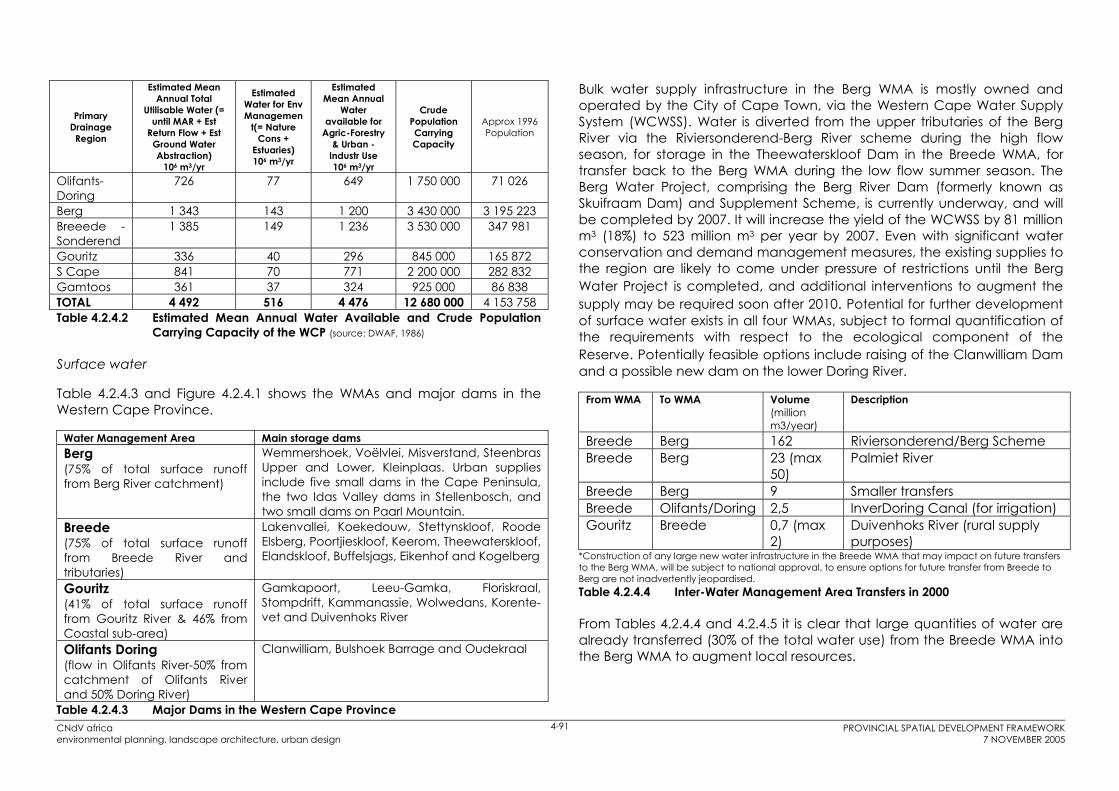
CNdV africa PROVINCIAL SPATIAL DEVELOPMENT FRAMEWORK environmental planning, landscape architecture, urban design 7 NOVEMBER 2005
4-91
Primary DrainageRegion
Estimated Mean Annual Total
Utilisable Water (= until MAR + Est
Return Flow + Est Ground Water Abstraction)
106 m3/yr
EstimatedWater for Env Managemen
t(= Nature Cons +
Estuaries) 106 m3/yr
EstimatedMean Annual
Wateravailable for
Agric-Forestry & Urban -
Industr Use 106 m3/yr
CrudePopulation CarryingCapacity
Approx 1996 Population
Olifants-Doring
726 77 649 1 750 000 71 026
Berg 1 343 143 1 200 3 430 000 3 195 223 Breeede - Sonderend
1 385 149 1 236 3 530 000 347 981
Gouritz 336 40 296 845 000 165 872 S Cape 841 70 771 2 200 000 282 832 Gamtoos 361 37 324 925 000 86 838 TOTAL 4 492 516 4 476 12 680 000 4 153 758 Table 4.2.4.2 Estimated Mean Annual Water Available and Crude Population
Carrying Capacity of the WCP (source: DWAF, 1986)
Surface water
Table 4.2.4.3 and Figure 4.2.4.1 shows the WMAs and major dams in the Western Cape Province.
Water Management Area Main storage dams Berg(75% of total surface runoff from Berg River catchment)
Wemmershoek, Voëlvlei, Misverstand, Steenbras Upper and Lower, Kleinplaas. Urban supplies include five small dams in the Cape Peninsula, the two Idas Valley dams in Stellenbosch, and two small dams on Paarl Mountain.
Breede(75% of total surface runoff from Breede River and tributaries)
Lakenvallei, Koekedouw, Stettynskloof, Roode Elsberg, Poortjieskloof, Keerom, Theewaterskloof, Elandskloof, Buffelsjags, Eikenhof and Kogelberg
Gouritz(41% of total surface runoff from Gouritz River & 46% from Coastal sub-area)
Gamkapoort, Leeu-Gamka, Floriskraal, Stompdrift, Kammanassie, Wolwedans, Korente-vet and Duivenhoks River
Olifants Doring (flow in Olifants River-50% from catchment of Olifants River and 50% Doring River)
Clanwilliam, Bulshoek Barrage and Oudekraal
Table 4.2.4.3 Major Dams in the Western Cape Province
Bulk water supply infrastructure in the Berg WMA is mostly owned and operated by the City of Cape Town, via the Western Cape Water Supply System (WCWSS). Water is diverted from the upper tributaries of the Berg River via the Riviersonderend-Berg River scheme during the high flow season, for storage in the Theewaterskloof Dam in the Breede WMA, for transfer back to the Berg WMA during the low flow summer season. The Berg Water Project, comprising the Berg River Dam (formerly known as Skuifraam Dam) and Supplement Scheme, is currently underway, and will be completed by 2007. It will increase the yield of the WCWSS by 81 million m3 (18%) to 523 million m3 per year by 2007. Even with significant water conservation and demand management measures, the existing supplies to the region are likely to come under pressure of restrictions until the Berg Water Project is completed, and additional interventions to augment the supply may be required soon after 2010. Potential for further development of surface water exists in all four WMAs, subject to formal quantification of the requirements with respect to the ecological component of the Reserve. Potentially feasible options include raising of the Clanwilliam Dam and a possible new dam on the lower Doring River.
From WMA To WMA Volume(million m3/year)
Description
Breede Berg 162 Riviersonderend/Berg SchemeBreede Berg 23 (max
50) Palmiet River
Breede Berg 9 Smaller transfersBreede Olifants/Doring 2,5 InverDoring Canal (for irrigation) Gouritz Breede 0,7 (max
2) Duivenhoks River (rural supply purposes)
*Construction of any large new water infrastructure in the Breede WMA that may impact on future transfers to the Berg WMA, will be subject to national approval, to ensure options for future transfer from Breede to Berg are not inadvertently jeopardised. Table 4.2.4.4 Inter-Water Management Area Transfers in 2000
From Tables 4.2.4.4 and 4.2.4.5 it is clear that large quantities of water are already transferred (30% of the total water use) from the Breede WMA into the Berg WMA to augment local resources.
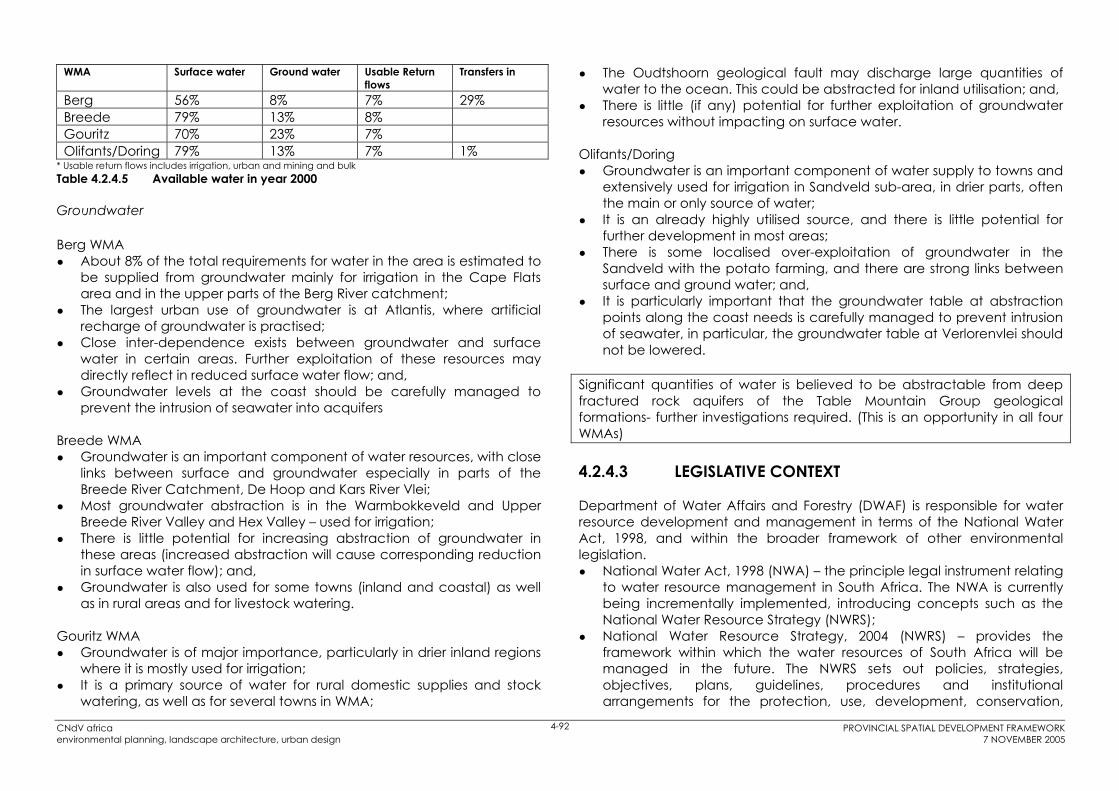
CNdV africa PROVINCIAL SPATIAL DEVELOPMENT FRAMEWORK environmental planning, landscape architecture, urban design 7 NOVEMBER 2005
4-92
WMA Surface water Ground water Usable Return flows
Transfers in
Berg 56% 8% 7% 29%Breede 79% 13% 8%Gouritz 70% 23% 7%Olifants/Doring 79% 13% 7% 1%
* Usable return flows includes irrigation, urban and mining and bulk Table 4.2.4.5 Available water in year 2000
Groundwater
Berg WMA About 8% of the total requirements for water in the area is estimated to be supplied from groundwater mainly for irrigation in the Cape Flats area and in the upper parts of the Berg River catchment; The largest urban use of groundwater is at Atlantis, where artificial recharge of groundwater is practised; Close inter-dependence exists between groundwater and surface water in certain areas. Further exploitation of these resources may directly reflect in reduced surface water flow; and, Groundwater levels at the coast should be carefully managed to prevent the intrusion of seawater into acquifers
Breede WMA Groundwater is an important component of water resources, with close links between surface and groundwater especially in parts of the Breede River Catchment, De Hoop and Kars River Vlei; Most groundwater abstraction is in the Warmbokkeveld and Upper Breede River Valley and Hex Valley – used for irrigation; There is little potential for increasing abstraction of groundwater in these areas (increased abstraction will cause corresponding reduction in surface water flow); and, Groundwater is also used for some towns (inland and coastal) as well as in rural areas and for livestock watering.
Gouritz WMA Groundwater is of major importance, particularly in drier inland regions where it is mostly used for irrigation; It is a primary source of water for rural domestic supplies and stock watering, as well as for several towns in WMA;
The Oudtshoorn geological fault may discharge large quantities of water to the ocean. This could be abstracted for inland utilisation; and, There is little (if any) potential for further exploitation of groundwater resources without impacting on surface water.
Olifants/Doring Groundwater is an important component of water supply to towns and extensively used for irrigation in Sandveld sub-area, in drier parts, often the main or only source of water; It is an already highly utilised source, and there is little potential for further development in most areas; There is some localised over-exploitation of groundwater in the Sandveld with the potato farming, and there are strong links between surface and ground water; and, It is particularly important that the groundwater table at abstraction points along the coast needs is carefully managed to prevent intrusion of seawater, in particular, the groundwater table at Verlorenvlei should not be lowered.
Significant quantities of water is believed to be abstractable from deep fractured rock aquifers of the Table Mountain Group geological formations- further investigations required. (This is an opportunity in all four WMAs)
4.2.4.3 LEGISLATIVE CONTEXT
Department of Water Affairs and Forestry (DWAF) is responsible for water resource development and management in terms of the National Water Act, 1998, and within the broader framework of other environmental legislation.
National Water Act, 1998 (NWA) – the principle legal instrument relating to water resource management in South Africa. The NWA is currently being incrementally implemented, introducing concepts such as the National Water Resource Strategy (NWRS); National Water Resource Strategy, 2004 (NWRS) – provides the framework within which the water resources of South Africa will be managed in the future. The NWRS sets out policies, strategies, objectives, plans, guidelines, procedures and institutional arrangements for the protection, use, development, conservation,

CNdV africa PROVINCIAL SPATIAL DEVELOPMENT FRAMEWORK environmental planning, landscape architecture, urban design 7 NOVEMBER 2005
4-93
management and control of the country’s water resources. Objectives for the strategy include to achieve equitable access to water, sustainable use of water and efficient and effective water use; Water Services Act, 1997 – provides for the rights of access to basic water supply and basic sanitation, a regulatory framework for water services institutions and water services intermediaries, etc.; Catchment Management Strategies (CMS) – the country has been divided into 19 Water Management Areas (WMAs), with four being located in the Western Cape. The delegation of water resource management from central government to catchment level will be achieved by the establishment of Catchment Management Agencies (CMAs) at WMA level. Each CMA will develop a Catchment Management Strategy (CMS) for the protection, use, development, conservation, management and control of water resources within its WMA. DWAF’s aim is to eventually hand over certain water resource management functions to CMAs, but until such time as the CMAs are established and fully operational, the regional offices of DWAF will continue to manage the water resource in their areas of jurisdiction; Internal Strategic Perspectives (ISPs) – the objective of the ISPs is to provide a framework for DWAF’s management of the water resources in each WMA, until such time as the regional offices can hand over their management functions to an established CMA; National Environmental Management Act, 1998; and, Environment Conservation Act, 1989.
4.2.4.4 KEY ISSUES
Given current patterns of water demand, future growth in water requirements in Cape Town will exceed the remaining undeveloped resource potential in WMA. There is an urgent need to develop and implement water demand management strategies in Cape Town and other urban areas; Irrigation for agriculture is a major use of water in the Province. There is a need to explore ways to grow the agricultural economy in the most water-efficient way possible; There is a need to prioritise water requirements between urban development and agriculture. Large quantities of water are already transferred from Breede WMA for high value (urban, industrial) uses in Berg WMA;
Rainwater harvesting, grey water recycling and other demand management strategies must be implemented; The ecological reserve needs to be comprehensively determined and implemented for rivers in the Western Cape, and will impact on the current water balances as well as the potential for future development; Climate change is expected to have a major impact on future water availability as well as requirements for water (including impacts on recharge of groundwater); Shortfalls in water supply are currently experienced at some coastal towns – mostly seasonal, projections shows increased growth in these areas, with associated water requirements; Water quality – special attention need to be given to the management of the quality of water especially in the Berg River. Poor water quality impacts on high water quality standards for export purposes, causes health risks etc.; Co-operative governance, planning and implementation in the management of water resources – good co-ordination between the various role players required for an integrated approach to managing water resources; There are strong links/interdependence between surface and groundwater – further exploitation of groundwater resources could impact negatively on surface water availability; and, Exploitation of the Table Mountain Group aquifers is possible and requires investigation.
4.2.4.5 SUMMARY
The Western Cape is clearly heading for a water demand and supply crisis. The City of Cape Town has once again had water restrictions imposed on it for the 2004 summer season, and such restrictions are regular on some small coastal towns over the Christmas period.
It is clear that water demand management, beyond crisis water use restrictions, is required for a long-term sustainable solution. Many technologies for reducing water demand are already available, but their use has not become part of mainstream policy. Implementing water demand management strategies and technologies, in urban areas and the agricultural sector, is undoubtedly one of the most important elements of achieving sustainable development in the Western Cape. Water demand management involves maintaining and upgrading existing water

CNdV africa PROVINCIAL SPATIAL DEVELOPMENT FRAMEWORK environmental planning, landscape architecture, urban design 7 NOVEMBER 2005
4-94
supply infrastructure, for example to deal with leaks, and changing domestic, agricultural and industrial water consumption patterns.
REFERENCES AND ACKNOWLEDGEMENTS Department of Environmental Affairs & Development Planning; du Plessis H, Provincial Department of Local Government, 2004; Enright W, Department of Water Affairs and Forestry, Cape Town Regional Office (pers com); Gasson, B. The Biophysical Environment of the Western Cape Province in Relation to its Economy and Settlements, University of Cape Town, 1998; Mouski F, Department of Water Affairs and Forestry, Cape Town Regional Office (pers com); Shippey, K Department of Water Affairs and Forestry, Cape Town (pers com); van Zyl G, Department of Water Affairs and Forestry, Cape Town Regional Office (pers com); Department of Water Affairs (DWA), Annual Report,1986.

Figure 4.2.4.2 Rivers, Dams and Water Supply
CNdV africa PROVINCIAL SPATIAL DEVELOPMENT FRAMEWORKenvironmental planning, landscape architecture, urban design 7 NOVEMBER 2005
4-95

CNdV africa PROVINCIAL SPATIAL DEVELOPMENT FRAMEWORKenvironmental planning, landscape architecture, urban design 7 NOVEMBER 2005
4-96CNdV africa PROVINCIAL SPATIAL DEVELOPMENT FRAMEWORKenvironmental planning, landscape architecture, urban design 7 NOVEMBER 2005
4-96

CNdV africa PROVINCIAL SPATIAL DEVELOPMENT FRAMEWORK environmental planning, landscape architecture, urban design 7 NOVEMBER 2005
4-96
4.2.5 SEWERAGE 4.2.5.1 INTRODUCTION
Failing sewerage systems are creating major health hazards and damaging river ecosystems throughout the Western Cape (Cape Argus, October 2004). This is the sad reality for many areas in the Western Cape where the necessary funding is not being allocated to deal with the disposal and treatment of sewage.
On the one hand, sewerage in the Western Cape is not seen as a priority from a national perspective, as there are other Provinces seen to be more needy, while on the other hand municipalities often don’t see the need to spend significant amounts of their budgets on sewerage.
According to the Constitution, municipalities have executive authority over removal, management and disposal of waste, whereas Provinces have the exclusive legislative competence to establish, monitor, support and capacitate municipalities in this respect. At present the City of Cape Town and the Local Municipalities in the Province have direct responsibility for sewage treatment and management in their respective areas.
4.2.5.2 BACKGROUND
Sewerage works or Waste Water Treatment Works (WWTWs) are managed by municipalities. The Department of Water Affairs and Forestry is responsible for the issuing of permits for sewerage works and for monitoring the compliance of these permits. Although there are many WWTWs in the Province in need of upgrading, most municipalities have chosen to focus their spending on other elements of infrastructure provision, as indicated in Table 4.2.5.1 below.
Percentage Local Municipality 1 –10% Beaufort West, Lainsburg, Prince Albert, Langeberg, Overstrand 11 –20% Stellenbosch, Kannaland, Oudshoorn, Plettenberg Bay, Swellendam, City of
Cape Town (17%) 21 – 30% Breede Valley, Breede River / Winelands, Witzenberg, Knysna, Cape Agulhas,
Cederberg, Matzikama 31 – 40% Theewaterskloof, Saldanha Bay 41 – 50% Drakenstein, Mossel Bay, Bergriver 51 – 60% George61 – 70% Swartland (61%)
Table 4.2.5.1 Percentage of Consolidated Municipal Infrastructure Programme (CMIP)Funding spent on sewerage infrastructure by each Local Municipality, 1997-2003 (Source: CMIP Municipal Status Report)
The City of Cape Town has 19 Waste Water Treatment Works and three Marine Outfalls. Only 20% of the WWTWs in the City of Cape Town comply with the quality requirements specified in their permits. Further problems experienced at the WWTWs are sludge disposal, plant maintenance and the bacteriological quality of effluent. The City needs approximately R1.1 billion (2004 estimate) to bring the WWTWs up to the required standard and to cope with increasing demands. According to DWAF, there is an unacceptably high number of pump-station failures resulting in raw sewage flowing into rivers. Furthermore, the ocean at marine outfalls is not being monitored due to budget constraints. The City of Cape Town has allocated R50 million for upgrading of treatment works in the current financial year, 2004/05. This amount is not sufficient for the upgrading and extension of WWTWs that is needed.
Figure 4.2.5.1 shows the various WWTWs in the Province in need of upgrading.
The findings of a recent study undertaken by the City of Cape Town showed that the biggest cause of contamination of rivers in the metropole is as a result of WWTWs producing sub-standard effluent, together with pump-stations which overflow into rivers. For example, during the period April to June 2004 six major spillages from pump-stations were reported.

CNdV africa PROVINCIAL SPATIAL DEVELOPMENT FRAMEWORK environmental planning, landscape architecture, urban design 7 NOVEMBER 2005
4-97
Monwabesi Pump-station was out of action for five days, with the result that 30-50 million litres of raw sewage flowed into the sea (McConkey, 2004). According to DWAF, which monitors WWTWs, the towns in need of upgrading include Plettenberg Bay, George, Paarl, Wellington, Robertson, Ashton. The most needy towns are Ladismith, where the system has collapsed (i.e. there is no effluent coming out of the sewerage works as there is no effluent going in), Citrusdal and Clanwilliam.
4.2.5.3 LEGISLATIVE CONTEXT
The National Water Act (36 of 1988) informs management issues pertaining to sewerage i.e. it provides standards and guidelines. This Act requires that all WWTWs are licensed, and there are effluent quality standards and management conditions attached to each licence. Non-compliance with these standards and conditions is a criminal offence (McConkey, 2004). The conditions attached to each licence may vary from one WWTW to another. For example, WWTWs that discharge into the ocean would have a condition requiring the monitoring of the marine environment. Local authorities are responsible for the quality of effluent that they discharge and the control of diffuse pollution arising within their areas of jurisdiction.
4.2.5.4 KEY ISSUES
Local authorities are under-funded, with the result that systems are not maintained or upgraded. There is a concern that funding for maintenance and upgrading is not being given sufficient priority in the IDPs; In the past expenditure has focused on capital costs, with little or no money earmarked for operational budgets; Pollution and the threat of disease as a result of inadequate sewage disposal is an issue affecting all informal settlements; A further problem with informal settlements is that they are often located over sewerage infrastructure, which makes the servicing of this infrastructure impossible. One such an example is in Khayelitsha, where informal dwellings have been located over the interceptors (large, council sewer pipes), thus these cannot be serviced; All pump stations have the ability for any overflow of sewage to be directed into the storm water system. Consequently there are times
when raw sewage flows into the storm water system, ending up in the ocean; All the pump stations in the City of Cape Town have telemetry systems, which detect when there is pump station failure. These telemetry systems are connected to a central point, from which they are monitored. However, not all these telemetry systems are operational; In areas where rapid development is taking place, this development is outpacing infrastructure provision. In the City of Cape Town for example, this is happening up the West Coast (Melkbos, Parklands etc), as well as in the Durbanville, Helderberg and Botleray areas. The WWTWs responsible for servicing these areas are as follows:
o West Coast – Potsdam (Kilarney), Melkbos & Atlantis; o Durbanville: Kraaifontein, Scottsdene & Bellville; o Helderberg: Khayelitsha & Macassar; o Botleray: Bellville, Macassar & Khayelitsha;
Once a site for a new WWTW has been identified, it takes between four and five years before it becomes operational. This has implications when planning any new large housing development; Opportunities exist for the re-use of effluent from WWTW; DWAF has found that sewage discharges often far exceed the standards and conditions demanded by licenses (Berg ISP, 2004); In the larger urban centres (e.g. Oudtshoorn) vandalism of the sewerage reticulation and pump-station infrastructure occasionally leads to sewage spills from the system (Gouritz ISP, March 2004, DWAF); Many of the WWTWs in the City of Cape Town discharge into already severely modified rivers e.g. the Salt River and the Black River. The question needs to be asked whether or not the further degradation of these rivers should be allowed; WWTWs discharging in close proximity to estuaries should pump their effluent to an upstream discharge point to facilitate dilution before entering the estuary itself. The financial constraints on the part of local authorities to implement such measures will need to be addressed; Informal settlements are often situated close to rivers or streams, which end up being polluted by raw sewage; Diffuse pollution from poorly serviced informal settlements and the use of soak-aways on the banks of the Lower Breede River as well as other large rivers in the Province are a cause for concern. This pollution into rivers not only has negative ecological and social (health) implications, but it also has negative economic implications. The latter is particularly
CNdV PROVINCIAL SPATIAL DEVELOPMENT FRAMEWORK africa environmental planning, landscape architecture, urban design 7 NOVEMBER 2005
4-98
the case where farms downstream from polluted rivers are making use of this water for their crops; and, In relatively small quantities, dried sewerage sludge can be used as fertiliser for agricultural purposes. The use of even minimal amounts of sewerage sludge may limit access to certain markets, which insist that sewerage sludge is not used in food production. (Note: EuropGAP, the European Good Agricultural Practise, does not support the use of human waste as fertiliser.)
4.2.5.5 SPATIAL SUMMARY
There is a particular problem with high density informal settlements in Stanford which do not have adequate sanitation facilities. This poses a pollution problem for the water resources in the area; Waste Water Treatment Works that need to be upgraded or rehabilitated are those in the following towns: Rawsonville, Robertson, Greyton, Montagu, Ashton, Gansbaai, Kleinmond and Bredasdorp, Plettenberg Bay, George, Paarl, Wellington, Ladismith, Citrusdal and Clanwilliam; The capacity of WWTWs at Pearly Beach, Onrus and Kleinmond, and often all other coastal towns in the Breede River Water Management Area (from Witsand in the east to Pringle Bay in the West), are exceeded during the peak season; The existing WWTWs at the towns of Paarl and Wellington are under pressure due to the increased load being placed on them as a result of industrial and urban growth. The existing facilities at both towns consist of closed systems (evaporation ponds) and these pose a risk of spillage into the Berg River, particularly during the winter months. The ponds at Wellington are unlined and seepage occurs from them (Berg ISP, DWAF); The Tulbagh WWTW is designed for domestic effluent, however traces of fruit waste are common. Vandalism and pipe blockages in the reticulation system cause spills from manholes into the stormwater system (Berg ISP, DWAF); Diffuse pollution takes place along the Klein Berg River from nearby informal settlements and as a result of agricultural activities; The Onrus River (in the Overberg District) is regularly polluted as a result of sewage spills occurring in the peak season, due to a reticulation system that is incapable of accommodating peak loads (Breede ISP, Oct 2004);
Polluted runoff from inadequately serviced dense settlements and industrial point discharges poses a risk of pollution to the water resource. This is a problem with regard to the informal settlements at Grabouw and the surrounding industries. The local municipality ((Theewaterskloof) is planning an additional 1500 RDP houses despite the fact that there are already insufficient services to cater for the existing population, with raw sewage spilling from the reticulation network into the Klip River on a fairly regular basis; The industrial expansion taking place in the Oudtshoorn area will introduce an additional load on the WWTW and the upgrading of the works will be necessary to avoid spills (Gouritz ISP, DWAF); At Riversdale the WWTW sludge dams are situated in close proximity to the Goukou River. The WWTW has reached its design capacity, posing a risk of spills during the peak season whilst seepage into the river from the pond remains an ongoing risk (Gouritz ISP, DWAF); The effluent from the WWTW at George does not meet the standards required by DWAF. The pump station was upgraded three years ago but the effluent quality seems to have worsened. Pump station overflows also occur, which impact on the water quality of the Gwaing River; The Knysna WWTW discharges effluent directly into the Knysna Lagoon, rather than diverting it to a preferred upstream point on the river, to facilitate some dilution before reaching the lagoon; At Great Brak seepage from soak-away facilities poses a threat to the estuary; Inadequately serviced dense settlements at George, Plettenberg Bay and at Knoetzie (Knysna) result in diffuse pollution into nearby streams and rivers; The lack of adequate sanitation for farm workers in the Koue Bokkeveld area has given rise to water quality concerns in the area. The situation is exacerbated by the influx of seasonal workers during harvesting. (Olifants Doring ISP, DWAF); and, The WWTWs at Graafwater, Citrusdal and Clanwilliam do not meet the legislated standards (Olifants Doring ISP, DWAF).
It is clear that sewage treatment infrastructure throughout the Province is in a state of crisis. Alternative technologies ranging from septic tanks and French drains as well as dry systems such as Enviro-loos and Urine Diversion toilets should be urgently investigated.

CNdV africa PROVINCIAL SPATIAL DEVELOPMENT FRAMEWORK environmental planning, landscape architecture, urban design 7 NOVEMBER 2005
4-99
REFERENCES AND ACKNOWLEDGEMENTS Berg Internal Strategic Perspective, January, DWAF, 2004; Breede Internal Strategic Perspective, Draft 5, October, DWAF, 2004; Cape Argus, October 2004;CMIP Municipal Status Report;Constitution of the Republic of South Africa, Act 108 of 1996; Gouritz Internal Strategic Perspective, DWAF, 2004; Olifants Doring Internal Strategic Perspective, Version 2, DWAF, 2004; Presentation given by Gareth McConkey of DWAF, to Trading Services Portfolio Committee of the City of Cape Town, 2004.

Figure 4.2.5.1 SewerageCNdV africa PROVINCIAL SPATIAL DEVELOPMENT FRAMEWORKenvironmental planning, landscape architecture, urban design 7 NOVEMBER 2005
4-100

CNdV africa PROVINCIAL SPATIAL DEVELOPMENT FRAMEWORKenvironmental planning, landscape architecture, urban design 7 NOVEMBER 2005
4-101CNdV africa PROVINCIAL SPATIAL DEVELOPMENT FRAMEWORKenvironmental planning, landscape architecture, urban design 7 NOVEMBER 2005
4-101

CNdV africa PROVINCIAL SPATIAL DEVELOPMENT FRAMEWORK environmental planning, landscape architecture, urban design 7 NOVEMBER 2005
4-101
4.2.6 SOLID WASTE MANAGEMENT 4.2.6.1 INTRODUCTION
There are many different definitions for commonly used terms such as pollution, waste and hazardous waste. The Environmental Conservation Act (73 of 1989) (ECA) defines waste as “… any matter whether gaseous, liquid or solid or any combination thereof, originating from any residential, commercial, industrial or agricultural area identified by the Minister of Environmental Affairs and Tourism as an undesirable or superfluous by-product, emission, residue or remainder of any process or activity”. It is estimated that about 90% of the total waste generated in South Africa is disposed of on land (Provincial SoER Overview, 2004).
Waste is grouped into two classes, general waste and hazardous waste. General waste (indicated by the letter G) is all waste that does not fall into the definition of hazardous waste, and includes domestic, commercial and some industrial waste, and builder’s rubble. General waste may be disposed of on any permitted landfill. Hazardous waste includes inorganic waste (e.g. heavy metal sludges and solutions, organic waste, putrescible organic waste e.g. waste that contains small quantities of highly dispersed hazardous substances); and miscellaneous waste (e.g. infectious waste such as diseased human or animal tissue, soiled bandages and syringes). Hazardous waste is rated 1 to 4 according to its toxicity and has to be treated and disposed of in facilities appropriate for its rating (Provincial SoER Overview, 2004). Extremely hazardous waste (hazard rating of 1 or 2) is disposed of in stringently designed and operated landfills, designated H:H, whereas low to moderately hazardous waste (hazard rating 3 or 4) is disposed of in H:h landfill sites.
In addition to the challenges of managing increasing waste volumes and decreasing land available for waste disposal, the Western Cape, along with other Provinces, has to deal with waste management problems caused by inequitable development and inadequate service delivery. Waste issues are often closely associated with poverty, environmental health and social justice issues. It is generally acknowledged that the poor and previously disenfranchised bear much of the social cost of pollution and poor waste management (Albertyn, 1998).
According to the Constitution, municipalities have executive authority over removal, management and disposal of waste, whereas Provinces have the exclusive legislative competence to establish, monitor, support and capacitate municipalities in this respect. At present the City of Cape Town and the Local Municipalities in the Province have direct responsibility for refuse removal and management in their respective areas.
4.2.6.2 BACKGROUND
Waste Generation Waste production/generation is driven by a number of factors, primarily the increasing production of goods, an ever expanding population and a growing economy (DEAT, 2002 / Provincial SoER Overview, 2004).
In South Africa, average unit generation rates e.g. tons of waste per household per year, are used to calculate waste quantities due to a lack of a more reliable method. The information derived from this method is potentially unreliable because average unit generation varies amongst different communities. In addition, the census data regarding population figures is not always reliable. Calculations used in local waste services planning are dependent on two variables, namely, a) population and dwelling density and, b) income level and living standard.
The Western Cape generates about 8 827 000m3 of waste per year (excluding mining waste) making it the Province with the second highest average waste production in the country (Stats SA 2002). (Note that 1m3 is not equal to 1 ton, hence the discrepancy between the figure given here and the figure of waste received at landfill sites in the Western Cape given below). This is apart from the tons of effluent and gaseous waste produced by the Province each year (Provincial SoER Overview, 2004). The City of Cape Town generates 5000 to 6000 tons of solid waste per day (2003/04).
A total of 1 446 450 tons of waste were received at landfill sites in the Western Cape during 2001. Table 4.2.6.1 indicates the waste received by each District Municipality in 2001.

CNdV africa PROVINCIAL SPATIAL DEVELOPMENT FRAMEWORK environmental planning, landscape architecture, urban design 7 NOVEMBER 2005
4-102
DistrictMunicipalities
& Metro
TotalPopulation
Total Waste (tons/annum)
Per capita waste generation
West Coast 140632 49235 0.35 City of Cape Town 2940628 1079014 0.36 Cape Winelands 364088 159585 0.43 Overberg 156492 43619 0.28Eden 459326 108853 0.23 Central Karoo 33332 6194 0.18 Combined Total 4094498 1446500 0.35
(source: Provincial SoER Overview, 2004) Table 4.2.6.1 Annual Waste Received per District
The Koeberg nuclear power plant produces low to medium level hazardous, radioactive waste which is currently disposed of outside of the Province, at Vaalputs in the Northern Cape. In addition it produces high level hazardous, radioactive waste which is stored on-site at Koeberg.
Waste Collection In relation to South Africa as a whole, the Western Cape has relatively high levels of refuse removal, with 88% of the households in the Province receiving refuse removal at least once a week. The average figure for South Africa is 55 % (Census 2001, Stats SA)
Currently, 7% of households do not receive waste collection services in the Western Cape. In addition, many of the informal areas and rural areas do not have weekly waste collection services but rather rely on skips or their own informal waste dumps, see Table 4.2.6.2. The cost of cleaning up dumped waste and litter is roughly eight times that of containerised waste (Wesgro, 2002).
District Municipalities and Metro % Not Receiving Waste Collection Cape Winelands 2.0% Central Karoo 0.3% City of Cape Town 1.4% Eden 1.7%Overberg 1.1%West Coast 0.6% Average 1.18%
Table 4.2.6.2 Percentage of Population within District Municipalities and the Metro without Waste Collection Services (Stats SA, 2002)
Waste DisposalAs landfills across the Western Cape continue to fill, acceptable sites for new landfills become more difficult to find. There are currently 74 landfill sites in the Western Cape. By 2005 all landfill sites are intended to be registered or permitted. Of the 74 sites, only three are hazardous waste landfills, two of which are commercially used and located at Visserhok in Cape Town (one of these is privately owned). The third hazardous waste landfill is located at PetroSA, and serves the PetroSA facility (Mosgas) in Mossel Bay.
Hazardous waste from other areas in the Province is transported by road or rail to the Vissershok Hazardous Waste Management Facilities managed by the City of Cape Town and Enviroserv / Wasteman.
Landfills are classified in terms of waste class i.e. general or hazardous, the size of the operation, and the potential for significant leachate (which is determined by rainfall minus evaporation in combination with site specific factors).
There are 15 waste incineration facilities in the Western Cape and one private electro thermal deactivation plant for the treatment of Health Care Waste. This was closed down in January 2005. Three of these waste incineration facilities are situated in the City of Cape Town. Of the 15 incinerators, of which two are decommissioned. Three of these are privately owned (two in the City of Cape Town and one in the Eden District).

CNdV africa PROVINCIAL SPATIAL DEVELOPMENT FRAMEWORK environmental planning, landscape architecture, urban design 7 NOVEMBER 2005
4-103
A large number of local authorities, NGOs and private companies are involved in the managing and recycling of waste in the Western Cape. The City of Cape Town has seen a 62% increase in the number of recycling operations since 1999 (Provincial SoER, 2004).
There has been a dramatic increase in the cost of waste disposal in South Africa since the early 1990s. This can be attributed largely to local waste management being brought in line with DWAF’s minimum requirements, resulting in improved public health and environmental standards.
In terms of the existing waste disposal facilities in the City of Cape Town, there are only between seven and ten years of airspace remaining. This situation has come about in part because of the increase in the total amount of waste generated and disposed of in the City of Cape Town, which has far exceeded the expected increase. It was predicted that there would be a 3% increase per annum in the total amount of waste generated and disposed of, and the actual increase was 6% per annum.
The development of a new waste disposal site (depending on the size), takes approximately five years, and costs approximately R20 million. In addition a transport network to service the site, i.e. a rail or road network, has to be developed.
Integrated Solid Waste ManagementFor solid waste management to be effective an integrated approach that involves cleaner production, waste minimization and recycling is required.This concept should underpin all activities in the Province from the householder to the factory floor.
4.2.6.3 LEGISLATIVE CONTEXT
The National Waste Management Strategy, October 1999 This strategy requires that Local Municipalities draft Integrated Waste Management Plans (IWMP). These plans form one of the required sectoral plans of Municipal Integrated Development Plans and require that the entire cycle of waste is addressed i.e. “from cradle to grave”. These plans are indicative of a change in policy focus away from waste management by impact management and remediation, towards a focus on waste prevention and minimisation.
DEADP has instructed district municipalities to draft Integrated Waste Management Plans as one of the sectoral plans of municipal IDPs.
The National Waste Management Strategy requires that Provinces develop Hazardous Waste Management Plans. In these plans, Provinces need to identify priority issues and put forward solutions as to how to address them. DEADP has begun with the process of drafting such a plan for the Province.
In terms of the Environmental Conservation Act (73 of 1989) (ECA) permits for waste disposal sites are authorised by the Department of Water Affairs and Forestry (DWAF). In addition, DWAF has the mandate to regulate waste disposal sites of national importance. It is foreseen that the ECA will be replaced by new provisions in the National Environmental Management Act and authorisations have been transferred from DWAF to the Department of Environmental Affairs and Tourism (DEAT) (1 October 2005), which will in turn assign them to their provincial counterparts, i.e. DEADP in the case of the Western Cape (1 April 2006).
The National Water Act (36 of 1998) also empowers DWAF to impose restrictions on all manner of waste production activities that could threaten the country’s water resources.
As part of the national strategy to deal with the problem of waste, national government has adopted an integrated pollution and waste management approach. The National White Paper on Integrated Pollution and Waste Management for South Africa emphasises the shift from control to prevention. It adopts a holistic approach to waste and pollution issues, prioritising the avoidance of waste rather than the management of existing waste (Provincial SoER Overview, 2004).
Other relevant legislation includes: Municipal Systems Act; and, Municipal Structures Act.
4.2.6.4 KEY ISSUES
A key constraint that hinders more widespread adoption of waste minimisation and recycling, at the domestic, commercial and industrial levels, is the lack of sufficient incentives due to an inappropriate

CNdV africa PROVINCIAL SPATIAL DEVELOPMENT FRAMEWORK environmental planning, landscape architecture, urban design 7 NOVEMBER 2005
4-104
regulatory and financial policy framework (City of Cape Town Integrated Waste Management Plan, Final Status Quo Report, March 2004). There is currently no legislation in South Africa which explicitly requires “Waste Minimisation” measures as part of day-to-day waste management;Nationally there is more than one department responsible for issues pertaining to solid waste, which causes confusion; There is a need for government to work in a more co-operative manner when identifying the location of new waste disposal sites. This is important both at the district and the local level; The Local and District Municipalities roles and responsibilities in the solid waste management chain are defined in the Municipal Structures Act; Municipalities need to work together on the issue of recycling; In 1998, after a long public participation process, DWAF introduced the second version of their minimum requirements for waste disposal by landfill. Many local authorities then realized that their budgets would not support the required management standard and began looking at the option of regionalisation of waste disposal sites. In this way funds could be maximised through developing partnerships. However, there has been a problem in identifying these sites, particularly because no one wants a waste disposal site in their area; A challenge is to minimise waste at source, thereby reducing the need for waste disposal facilities. Presently the opposite appears to be happening e.g. in the City of Cape Town waste generation grew double the forecasted rate; There is a need for a greater number of transfer stations i.e. places where solid waste is taken to be compacted before being taken to waste disposal sites, as these stations reduce the rate at which the waste disposal facilities are filled; DWAF favours the provision of a regional solid waste disposal site rather than many small sites, which are not as easily monitored (Gouritz ISP, DWAF); In order to reduce high transportation costs, waste disposal sites should be located close to urban areas; Inappropriate waste storage as a result of no waste removal or inadequate waste removal is an issue which pertains particularly to informal areas; Expansion of urban areas within close proximity to landfill sites; Thorough waste management information is needed to better manage waste;
There is a problem with solid waste management in that capacity constraints are not being considered when urban developments are approved; The full costs of developments, in terms of waste collection and disposal, are not factored into Environmental Impact Assessments, with the result that municipalities are burdened with the cost of increased infrastructural provision; New developments should follow service provision rather than the other way around; DEADP runs a programme, the Western Cape Clean Up Operation, which provides funds through municipalities for various community based projects dealing with waste recycling, clean up operations, the greening of the environment and generally improving the quality of life in poorer communities. Currently R5.25 million is allocated to 28 municipalities, with more than 1500 jobs being created; Another programme initiated by DEADP is the Cleaner Production and Waste Minimisation Programme, which looks at pollution prevention and waste minimisation. It has been tested at three pilot sites in the Western Cape. Through this programme the Breede River Winelands Winery managed to save R1.6 million, seven SMMEs at Sacks Circle Industrial area in the City of Cape Town saved R3.3 million, and R250 000 was saved at the Eben Donges Hospital. During the 2004/05 financial year, this programme will be rolled out in the Hospitality and Tourism sector, targeting SMMEs; This cleaner production approach is to be marketed to all sectors of the economy, in partnership with DEAT and the DTI; The Waste Minimisation Programme in particular, and to a lesser extent the Western Cape Clean Up Operation, provide an opportunity for extending the lifecycle of waste disposal sites through waste minimisation; The disposal of health care (medical) waste remains problematic, due to the illegal dumping of this waste; Waste disposal facilities reduce air quality, primarily because they are a source of atmospheric emissions, and a source of odours if not managed properly; Informal pickers found at waste disposal sites are exposing themselves to severe health risk; The practice of illegally dumping hazardous waste at general waste disposal facilities has meant that many municipalities have had to dig
CNdV africa PROVINCIAL SPATIAL DEVELOPMENT FRAMEWORK environmental planning, landscape architecture, urban design 7 NOVEMBER 2005
4-105
trenches around their general waste sites, to stop vehicles from entering; and, The control of solid waste on farms can be problematic as farmers often dump solid waste near river courses resulting in pollution (Olifants Doring ISP, DWAF).
4.2.6.5 SPATIAL SUMMARY
As can be seen from Figure 4.2.6.1 the issue of waste disposal facilities must be addressed in the very near future as there are many towns in the Province where the existing waste disposal facilities have remaining life spans of between one and five years; In the Eden District for example, the waste generated in the towns along the coast from George to Natures Valley is being transferred to the PetroSA site at Mosgas. This site is meant for hazardous waste, but is now being used for co-disposal (both hazardous and general waste), which will shorten its lifespan by half, from seven to three and a half years. Considering that the site serves most of the towns on the coast between Mossel Bay and the Eastern Cape, this has serious implications for the area; According to DWAF, those towns with the most serious waste disposal problems are Clanwilliam, Citrusdal and Graafwater. In addition, although the Vredendal site is well operated, it is positioned badly as it is on a hill, with runoff flowing directly into a river at the bottom of the hill. The Onrus, Struisbaai, Greyton, McGregor, Arniston and De Dorings Solid Waste Disposal sites need upgrading or rehabilitation; Many towns operate their own small solid waste disposal sites, some of which are situated close to rivers, e.g. the McGregor solid waste disposal site lies adjacent to the Korings River. The site is no longer in use, but has yet to be rehabilitated. The solid waste disposal site at Calitzdorp, adjacent to the Nels River, is an example of a site which is inappropriately located as it poses a pollution threat to the river (Gouritz ISP, DWAF); The disposal of fruit waste at Ceres and Wolseley poses a threat to the local groundwater resource. The solid waste disposal site at Ceres is due to be closed; and, New waste disposal sites should be identified years in advance to ensure that communities are not located too close to future sites.
REFERENCES AND ACKNOWLEDGEMENTS Albertyn. Environmental Justice: An NGO Perspective. Environmental Justice and Legal Process Conference Proceedings, University of Cape Town and Macquarie, 1998; City of Cape Town, Integrated Waste Management Plan, Final Status Quo Report, March 2004; Department of Environmental Affairs & Development Planning, Provincial State of Environment Overview Report (SoER), 2004; Department of Environmental Affairs and Tourism, 2002; Gouritz Internal Strategic Perspective, Department of Water Affairs and Forestry, 2004; Kamaseelan Chetty, Western Cape Provincial Department of Environmental Affairs and Development Planning (pers com); Mr Gottlieb Arendse, Western Cape Provincial Department of Environmental Affairs and Development Planning (pers com); Olifants Doring Internal Strategic Perspective Version 2, Department of Water Affairs and Forestry, 2004; Stats SA (Statistics South Africa). Census 2001 and 2002.
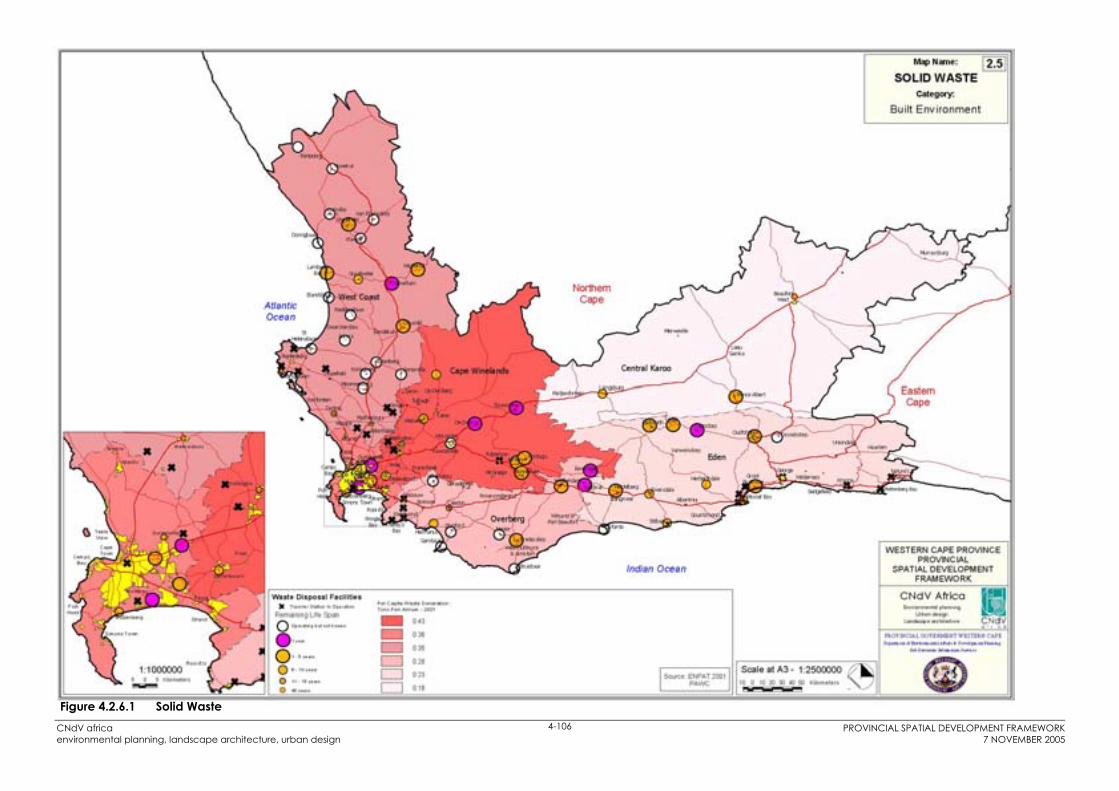
Figure 4.2.6.1 Solid Waste CNdV africa PROVINCIAL SPATIAL DEVELOPMENT FRAMEWORKenvironmental planning, landscape architecture, urban design 7 NOVEMBER 2005
4-106
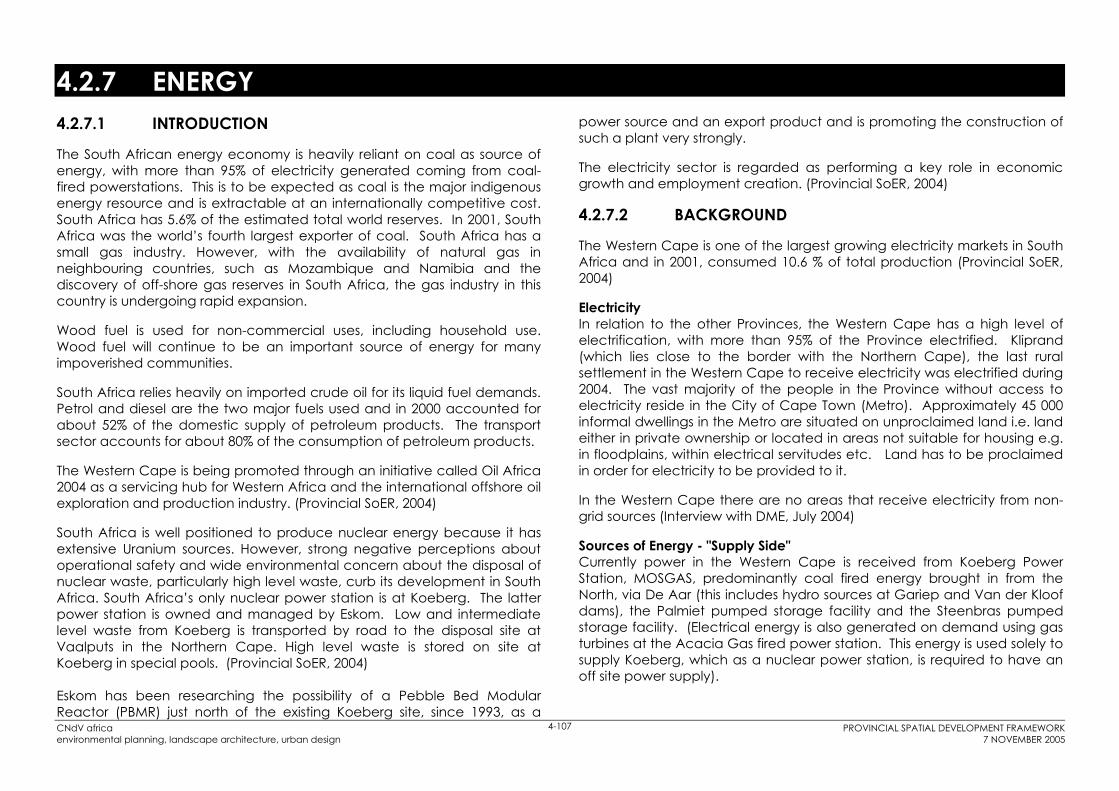
PROVINCIAL SPATIAL DEVELOPMENT FRAMEWORK CNdV africa environmental planning, landscape architecture, urban design 7 NOVEMBER 2005
4-107
4.2.7 ENERGY 4.2.7.1 INTRODUCTION
The South African energy economy is heavily reliant on coal as source of energy, with more than 95% of electricity generated coming from coal-fired powerstations. This is to be expected as coal is the major indigenous energy resource and is extractable at an internationally competitive cost. South Africa has 5.6% of the estimated total world reserves. In 2001, South Africa was the world’s fourth largest exporter of coal. South Africa has a small gas industry. However, with the availability of natural gas in neighbouring countries, such as Mozambique and Namibia and the discovery of off-shore gas reserves in South Africa, the gas industry in this country is undergoing rapid expansion.
Wood fuel is used for non-commercial uses, including household use. Wood fuel will continue to be an important source of energy for many impoverished communities.
South Africa relies heavily on imported crude oil for its liquid fuel demands. Petrol and diesel are the two major fuels used and in 2000 accounted for about 52% of the domestic supply of petroleum products. The transport sector accounts for about 80% of the consumption of petroleum products.
The Western Cape is being promoted through an initiative called Oil Africa 2004 as a servicing hub for Western Africa and the international offshore oil exploration and production industry. (Provincial SoER, 2004)
South Africa is well positioned to produce nuclear energy because it has extensive Uranium sources. However, strong negative perceptions about operational safety and wide environmental concern about the disposal of nuclear waste, particularly high level waste, curb its development in South Africa. South Africa’s only nuclear power station is at Koeberg. The latter power station is owned and managed by Eskom. Low and intermediate level waste from Koeberg is transported by road to the disposal site at Vaalputs in the Northern Cape. High level waste is stored on site at Koeberg in special pools. (Provincial SoER, 2004)
Eskom has been researching the possibility of a Pebble Bed Modular Reactor (PBMR) just north of the existing Koeberg site, since 1993, as a
power source and an export product and is promoting the construction of such a plant very strongly.
The electricity sector is regarded as performing a key role in economic growth and employment creation. (Provincial SoER, 2004)
4.2.7.2 BACKGROUND
The Western Cape is one of the largest growing electricity markets in South Africa and in 2001, consumed 10.6 % of total production (Provincial SoER, 2004)
Electricity In relation to the other Provinces, the Western Cape has a high level of electrification, with more than 95% of the Province electrified. Kliprand (which lies close to the border with the Northern Cape), the last rural settlement in the Western Cape to receive electricity was electrified during 2004. The vast majority of the people in the Province without access to electricity reside in the City of Cape Town (Metro). Approximately 45 000 informal dwellings in the Metro are situated on unproclaimed land i.e. land either in private ownership or located in areas not suitable for housing e.g. in floodplains, within electrical servitudes etc. Land has to be proclaimed in order for electricity to be provided to it.
In the Western Cape there are no areas that receive electricity from non-grid sources (Interview with DME, July 2004)
Sources of Energy - "Supply Side" Currently power in the Western Cape is received from Koeberg Power Station, MOSGAS, predominantly coal fired energy brought in from the North, via De Aar (this includes hydro sources at Gariep and Van der Kloof dams), the Palmiet pumped storage facility and the Steenbras pumped storage facility. (Electrical energy is also generated on demand using gas turbines at the Acacia Gas fired power station. This energy is used solely to supply Koeberg, which as a nuclear power station, is required to have an off site power supply).

PROVINCIAL SPATIAL DEVELOPMENT FRAMEWORK CNdV africa environmental planning, landscape architecture, urban design 7 NOVEMBER 2005
4-108
Options for energy provision to the Western Cape that are currently being investigated are the Saldanha Combined Cycle Gas Power Station, with gas brought in from the iBubezi Gas Field which lies north of Saldanha, the Pebble Bed Modular Reactor at Koeberg, Kudu Gas at Oranjemund, a Combined Cycle Gas Power Station at COEGA in Port Elizabeth, bringing in hydro electrically generated power from the Democratic Republic of Congo through Angola and Namibia. A solar powered supply station may be developed in Upington, but this remains a long term concept. At this stage the most advanced of all these concepts is the provision of energy from Kudu Gas at Oranjemund.
There has been talk of the construction of a pipeline from the IBubezi Gas Field to supply energy to MOSGAS. This could involve piping gas from Saldanha via Cape Town or via the Breede River Valley. The decision as to whether or not this pipeline is to go ahead is still awaited. Currently a feasibility study is being undertaken to see if it would be viable to pipe gas to Mossel Bay – based on existing servitudes (road, rail or Eskom servitudes). The pipeline would not be viable should large amounts of privately owned land have to be bought. A study has also commenced on the feasibility of wind power in the Province.
Electricity Use - "Demand Side" To try and make electricity more affordable and accessible to all, national government has introduced a poverty tariff, whereby the first 50 kilowatt–hours (50 units) of electricity per month are provided free of charge to each household, after that normal rates apply.
Research has shown that even when electricity is provided to those households where previously there was none, it is not simply a question of affordability but also a cultural choice as to whether or not it is used. (According to studies undertaken, it takes on average, approximately 5 years before households who have received electricity begin to use it above other energy sources, such as paraffin).
The table below shows the percentages of people using electricity vs paraffin (the top two energy sources), for three different types of uses i.e. cooking, heating and lighting, in 1996 and then again in 2001. It is interesting to note that the percentage of people using electricity did not increase significantly between 1996 and 2001, particularly when it came to electricity as a source of heating. If one considers that there must have been a significant increase in the number of households with access to
electricity between 1996 and 2001, these statistics seem to support the notion of a lag between electricity being made available and its actual use.
Year Energy source for cooking
Energy source for heating
Energy source for lighting
1996 Electricity = 76% Paraffin = 13.4%
Electricity= 71.3% Paraffin = 13.8%
Electricity = 84.9% Paraffin = 8.2%
2001 Electricity = 78.8% Paraffin = 14%
Electricity = 73.4% Paraffin = 14.8%
Electricity = 88% Paraffin = 7%
(source of information, Stats SA, Census 1996 and 2001) Table 4.2.7.1 Electricity Demand
Renewable Energy Although various forms of renewable energy such as wind and wave energy are being monitored by Eskom, it does not consider them financially viable at present. However, it is clear that renewable sources of energy could become more viable if a number of aspects are changed. For example, if renewable energy sources become mainstream and were produced at scale then unit costs would significantly reduce. Furthermore, long term lifecycle costs and bulk infrastructure costs are often left out to the equation making costs of conventional infrastructure appear lower than they really are, thus obscuring the costs advantages of alternatives. (Both the Klipheuwel Wind Farm and the proposed Darling Wind Farm are subsidised by the Department of Minerals and Energy). However, the proponents of renewable energy believe that its potential for job creation, the possibility of trading debt for renewable energy, technology investment and technology transfer, provide enough motivation for pursuing renewable energy initiatives. (Provincial SoER, 2004). Furthermore, it is pointed out that although Eskom claims to have one of the lowest unit prices for electricity in the world, this does not take into account external costs such as pollution. It is interesting to note that less than 40% of the energy in coal is converted into electricity, the remainder of the energy goes to waste.
In South Africa, renewable energy plays a limited yet significant role. Given the potential role of renewable energy as an alternative generation option, Eskom has established the South African Bulk Renewable Electricity Generation project (SABRE-Gen). The project’s ultimate aim is to determine whether utility scale, renewable electricity generation (primarily solar,

CNdV africa PROVINCIAL SPATIAL DEVELOPMENT FRAMEWORK environmental planning, landscape architecture, urban design 7 NOVEMBER 2005
4-109
thermal, wind, biomass, wave energy and ocean currents), is a viable supply option for Eskom and South Africa.
Currently, the most important form of renewable energy is hydro-electric power generation. However, potential for hydro-electric power is severely restricted due to the limited surface water resources. The most significant hydro-electric power scheme in the Western Cape is the Palmiet Pumped Storage Scheme, located in the Kogelberg Biosphere Reserve.
As mentioned above, another form of renewable energy is wind. Eskom has developed a demonstration facility at Klipheuwel in the Western Cape. The three year experiment is designed to test the effectiveness of three types of turbines and the viability of wind power for large scale grid applications. (Provincial SoER, 2004).
The DEADP has since 2004 investigated locational criteria for wind farms and has produced a draft manual composed of the Regional Guiding Criteria and the Landscape Assessment Methodology in this regard. Further investigations by the department which will culminate in a comparative analysis of the two methods are underway (November 2005). This will lead to a method for assessment to be used at a regional site specific scale.
Pollution and Air QualityFossil fuels, particularly coal and oil, have major implications for pollution, especially air quality in their production and use. For example, South Africa produces over 50% of Africa's emissions, due, in part, to its extensive use of coal of which less than 40% is converted into energy. The remainder goes to waste. (Cowan, 2003)
Problems with air quality generally occur from three sources: Domestic burning of fossil and wood fuels, mainly over low income townships; Motor vehicle emissions, mainly in the City of Cape Town but likely to become an issue in other rapidly growing towns such as George, Stellenbosch, Paarl; and Industrial smoke stacks, mainly over the City of Cape Town and Saldanha's industrial areas.
4.2.7.3 LEGISLATIVE CONTEXT
White Paper on Renewable Energy, November 2003, DME; Approximately 4% of projected energy demand by 2013 should be derived from renewable energy sources; Greater levels of competition in the electricity market; Human capacity building programmes; and, Integrated Energy Centres – brining energy services to the disadvantaged communities. Link energy needs with other needs, health, job creation, environment and tourism.
Currently government policy is to diversify energy sources - security of supply through diversity.
Draft Energy Efficiency Strategy of the Republic of South Africa, April 2004, DME; Electricity Distribution Restructuring Bill; The Mineral and Petroleum Resources Development Act, Act No.28 of 2002; National Gas Infrastructure Development Plan (explains how government sees gas infrastructure development); White Paper on Energy Policy (DME, 1998); Universal household access to electricity by 2013. The priority for government remains those areas that were disadvantaged in the past. (Access to electricity is taken to include grid supplies, solar home systems, generators, hybrid systems, battery systems or any other supply solution which provides an appropriate and affordable electricity supply) o Stimulate the development of new and renewable energy
sources. Renewable energy should lead to the empowerment of the deprived so that development and job creation can take place;
o Establish regulations which promote a cost-of-supply approach to electricity pricing for non-domestic consumers;
o Investigate an environmental levy on energy sales to fund development of renewable energy, energy efficiency and sustainable energy activities; and,
o Adjust electricity market structures to achieve effective forms of competition. (Provincial SoER, 2004).

CNdV africa PROVINCIAL SPATIAL DEVELOPMENT FRAMEWORK environmental planning, landscape architecture, urban design 7 NOVEMBER 2005
4-110
4.2.7.4 KEY ISSUES
Wood fuels are most plentiful in the higher rainfall regions of the Western Cape which in turn largely coincide with higher population densities and levels of forestation; Access to affordable energy services (Just electrifying households is not enough. Multiple fuel use persists as electrification is often not financially viable for the poor.) When households do not have access to affordable electricity they are then cut off from the benefits of modern appliances and telecommunications; Education for energy users - many people in poor households do not have information on the costs associated with different energy sources and therefore cannot make informed decisions about the best options for different uses e.g. heating, cooking, lighting. In addition, people need to be provided with information so that they can understand the connection between energy and development, or different energy options and the health and safety aspects; Energy use has resulted in significant air pollution problems, particularly in the metropolitan area of Cape Town. In 1997 for example, the Brown Haze Study (Wicking – Baird M.C. et al) showed that vehicle emissions contributed significantly to the air quality problem in the Cape Town region. Petrol and diesel used in motor vehicles were responsible for 65% of the air emissions, industry for 22%, while the burning of wood as an energy source was responsible for 11% of the air emissions; The extensive use of fossil fuels, in informal communities in urban areas is responsible for the deterioration of air quality around these communities, as well as downwind of these communities. Air pollution from domestic burning is exacerbated during the cold winter months when meteorological conditions prevent adequate dispersion of the pollutants and an increase in heating requirements is needed. (Wicking – Baird M.C. et al, 1997); Lack of integration, between suppliers of energy and other services; Poor socio-economic conditions of household and communities results in people not being able to afford to pay for energy sources, thus a crucial challenge is the alleviation of poverty. Due to the link between poverty and energy problems, poverty stricken households in urban and rural areas experience similar energy problems; Energy is required for productive activity, which in turn allows for job creation; and,
Through modelling exercises done by the National Electricity Regulator, Eskom and large energy – intensive industries, the conclusion was reached that electricity demand will exceed supply in South Africa in 2008, resulting in routine blackouts unless new electricity policy and investment decisions are formulated and implemented in this year. (Business Day Report , 29 July 2004)
4.2.7.5 SPATIAL SUMMARY
A reason for concern is the extent to which Eskom may have installed electricity grids into poverty stricken areas which cannot afford either running or capital costs. In these cases renewable energy may be of greater importance; Cape Town is suffering from pollution due to its concentrated use and dependence on fossil fuels, particularly diesel and petrol used in the private motor vehicle, bus and mini-bus taxi fleets; Rail's use of electricity is probably a major advantage in this regard; and, There has not been extensive Province wide monitoring of air quality i.e. outside of Cape Town, but indications are that the major industrial areas of concern are the Saldanha region (metal and steel industry); Robertson and Riebeeck Wes (cement and raw materials processing), Mossel Bay (refinery), Knysna (wood milling activities), Oudtshoorn (brick works) and George (numerous industrial activities).
REFERENCES AND ACKNOWLEDGEMENTS SRK Consulting. Department of Environmental Affairs & Development Planning. State of the Environment Overview Report. Provincial Government of the Western Cape, Cape Town, 2004; Statistics SA, Census 1996 and 2001;Interview with Department of Minerals and Energy, July 2004;Business Day Report, 29 July 2004;Department of Environmental Affairs and Development Planning, Provincial Renewable Energy Policy (forthcoming), 2005.
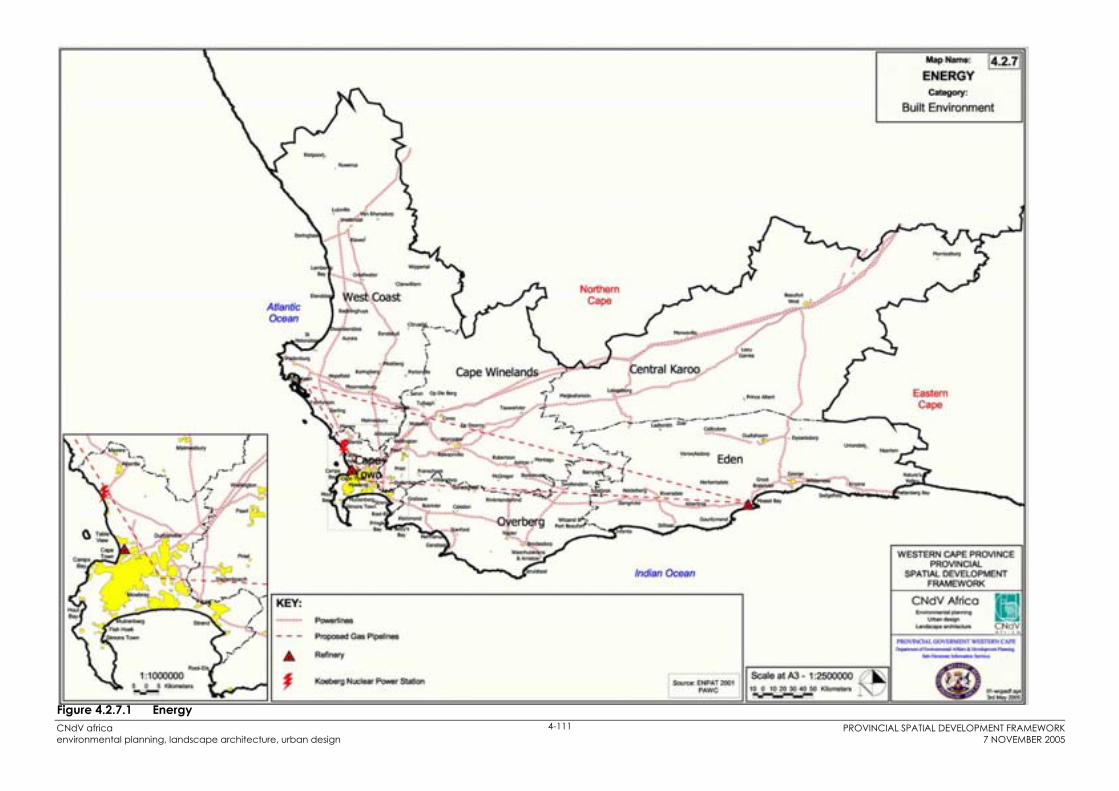
Figure 4.2.7.1 EnergyCNdV africa PROVINCIAL SPATIAL DEVELOPMENT FRAMEWORKenvironmental planning, landscape architecture, urban design 7 NOVEMBER 2005
4-111

CNdV africa PROVINCIAL SPATIAL DEVELOPMENT FRAMEWORKenvironmental planning, landscape architecture, urban design 7 NOVEMBER 2005
4-112

CNdV africa PROVINCIAL SPATIAL DEVELOPMENT FRAMEWORK environmental planning, landscape architecture, urban design 7 NOVEMBER 2005
4-112
4.2.8 TELECOMMUNICATIONS 4.2.8.1 INTRODUCTION
On the whole, South Africa has better telecommunication infrastructure and Information and Communication Technology (ICT) access than the rest of the continent, but is far behind Europe and other developed nations. According to the International Telecommunications Union, in 2001 South Africa had 11.35 fixed lines per 100 people and 21 mobile phones per 100 people. In contrast the United Kingdom had 57.78 fixed lines per 100 people, and 78.28 mobile phones per 100 people, while Africa as a whole had 2.62 fixed line phones per 100 people and 2.93 mobile phones per 100 people. (City of Cape Town, 2002)
In 1998, 87% of South Africans had access to a telephone within a 60 minute walk (± 4km). In 2002, nearly 98% of South Africans lived within two kilometers of a telephone. Personal computer (PC) density shows a similar figure to teledensity figures. It is estimated that there are 6.85 PC’s per 100 inhabitants in South Africa, versus 1.06 per 100 inhabitants in Africa and 36.62 per 100 people in the United Kingdom. It is estimated that 7% of the South African population had Internet access in 2001. (City of Cape Town, 2002)
Between 1996 and 2001 Telkom connected 2.8 million fixed lines nationally, however rates of disconnection are as high as 50 -70%, with most lines being disconnected within a few months. (This process of connection and then disconnection is referred to as “churn”). Telkom cites the reasons for the disconnections as being 1) non-payment due to the poor economic climate and 2) an apparent public shift from fixed to mobile telephone services. Since 60 % of disconnections countrywide were due to non-payment, it can be concluded that the disconnections are disproportionately affecting the poor sectors of the population. (City of Cape Town, 2002)
According to the Western Cape Socio – Economic Review of 2003 in South Africa, there were 10 million cellphone subscribers in 2003 and this was expected to grow to 15 million subscribers by 2007. The number of Internet users nationally is expected to rise from 2,6 million in 2002 to an estimated
3.9 million in 2007. The low ownership of personal computers will remain a major constraint to the expansion of Internet access, see Figure 4.2.8.1. (Western Cape Socio- Economic Review, 2003 - Provincial Treasury).
One of the cellular network providers, Vodacom has met its obligation to provide 22 000 lines to the disadvantaged by setting up small businesses running subsidized “phone shops” in areas where there is limited or no access to fixed line services. There are approximately 2 335 Vodacom phone shops in South Africa, 23 of which are situated in the Western Cape. (City of Cape Town, 2002)
Access to ICT is limited by the same kinds of socio-cultural factors that have lead to other social and economic inequalities. Around the world, discrimination based on age, race and gender has discouraged old people, minorities, and women from participating in the information age. (City of Cape Town, 2002)
4.2.8.2 BACKGROUND
The table below shows the percentage of households in the Province that have access to telephone facilities (both mobile and fixed line).
Telephone Facilities Percentage of total number of households in the Province *
Telephone in dwelling and cellphone 28.7 % Telephone in dwelling only 21.7 % Cellphone only 12.6 % At a neighbour nearby 7.0 % At a public telephone nearby 25.2 % At another location nearby 1.9 % At another location not nearby 1.0 % No access to a telephone 1.6 %
Information taken from Census in brief – Second edition, Census 2001 Table 4.2.8.1 Levels of Telephone (Mobile and Fixed Line) Access
CNdV africa PROVINCIAL SPATIAL DEVELOPMENT FRAMEWORK environmental planning, landscape architecture, urban design 7 NOVEMBER 2005
4-113
From the above table it is clear that 63% of households in the Western Cape have a fixed line telephone or a cellular telephone in the dwelling. This is the highest figure out of all the Provinces, with Gauteng at the second highest at 56.1%. The average percentage for South Africa is 42.4 %. (Census 2001).
LibrariesOf the City of Cape Towns 105 libraries, 33 had computers open to the public in 2002.
Post Offices At national level there have been numerous attempts at using post office infrastructure to supply public access to ICT. The Public Information Terminals for Post Offices (PIT’s) kiosks provide various ICT services including an online business directory, public email communication facility a CV creator service etc. Eleven PIT’s were installed in the Western Cape during 2001, namely in Beaufort West, Caledon, Cape Town, Ceres, De Doorns, Gugulethu, Khayelitsha, Stellenbosch, Oudshoorn, Vredendal and Worcester.
Internet AccessThere appears to be widespread dissatisfaction with the lack of availability and high costs to high speed internet access systems such as Broadband. This is believed to considerably increase the costs of doing business in South Africa and with overseas.
The main urban centres in the Western Cape could take a lead in this. Knysna and City of Cape Town considering cabling for free internet access.
4.2.8.3 LEGISLATIVE CONTEXT
4.2.8.4 CHALLENGES AND OPPORTUNITIES
International practice suggests that high costs of basic ICT services such as telephones can be reduced by making use of value added network facilities such as Voice Over Internet Protocol, which is currently controlled and effectively banned except in rural areas with low telecommunications access, by Telkom (City of Cape Town, 2002); The majority of people below the poverty line do not have fixed or mobile telephones, nor do they have access to computer, email or internet (City of Cape Town, 2002); and, Schools in the Western Cape and Gauteng are more likely to have Internet Access (49% of schools in Gauteng and 38% in the Western Cape). (City of Cape Town, 2002).
4.2.8.5 SPATIAL SUMMARY
Access to telecommunications is a major contributor to economic development with cellphone access having taken over from fixed lines; MTN has more extensive coverage in the West Coast whereas Vodacom has slightly better coverage in the Klein Karoo part of Eden; Low cost high speed network services should be made available in the main centres in the Province; Internet access into strategic locations such as schools in marginalized parts of the urban settlements should be accelerated; and, Vodacom has provided 23 "phone shops" in the Western Cape in areas with limited or no access to fixed line services.
REFERENCES AND ACKNOWLEDGEMENTS Department of Environmental Affairs and Development Planning, SRK Consulting. State of the Environment Overview Report. Provincial Government of the Western Cape, Cape Town, 2002; Provincial Treasury (Treasury) : Macro Economic Analysis Western Cape Socio-Economic Review, Provincial Government: Western Cape (PG:WC), Government Printers, RSA, 2003. Statistics SA Census 2001.

Figure 4.2.8.2 TelecommunicationsCNdV africa PROVINCIAL SPATIAL DEVELOPMENT FRAMEWORKenvironmental planning, landscape architecture, urban design 7 NOVEMBER 2005
4-114

CNdV africa PROVINCIAL SPATIAL DEVELOPMENT FRAMEWORKenvironmental planning, landscape architecture, urban design 7 NOVEMBER 2005
4-115CNdV africa PROVINCIAL SPATIAL DEVELOPMENT FRAMEWORKenvironmental planning, landscape architecture, urban design 7 NOVEMBER 2005
4-115

CNdV africa PROVINCIAL SPATIAL DEVELOPMENT FRAMEWORK environmental planning, landscape architecture, urban design 7 NOVEMBER 2005
4-115
4.2.9 HOUSING 4.2.9.1 INTRODUCTION
The main concentrations of settlements are located around the Metropolitan Area (City of Cape Town), west coast axis (Saldanha – Vredenburg) and south coast (George Knysna area) (DEADP 2003);The Province is 90% urbanised;The provision of housing is one of the most visible forms of growth and investment (DEADP 2003). Comprising up to 70% of the land use in some urban settlements; Making housing more affordable to all is a national policy. Therefore, housing should be promoted in those areas that have good access to employment, educational, recreational and commercial opportunities (DEADP 2003); Recent housing development, especially subsidy housing, has had a negative impact on the urban environment mainly due to the one house one plot housing models (including form, township layout and type) applied and their location, in most cases outside or on the periphery of the existing urban settlements. This has resulted in poorly integrated development and towns with no access to existing economic, transport and service related infrastructure (SoER 2004); More than 300 000 households in the lower income groups in the Province are inadequately housed and more than half of them live in informal dwellings. (DEADP 2003); One of the objectives of the Settlement Framework Policy (DEADP 2003) is to provide appropriate levels of housing and services for all and to make optimal use of existing and planned services. Another is to ensure that subsidised housing is provided equitably and that it plays a meaningful role in the management of human settlement in both urban and rural contexts; and, Population growth, particularly high birth rates, in-migration, and poor access to predictable sources of income to newly-arrived residents have led to bottlenecks in the delivery of housing to coloured and black communities in the lower income groups (DEADP 2003).
4.2.9.2 BACKGROUND
Housing Need and Demand Note: "Need" refers to the overall requirement for housing and does not take affordability into account. "Demand" refers to the ability of those needing housing to pay for it, i.e. affordability, which is a function of people’s income.
The largest housing backlog is in the City of Cape Town and was estimated at 245 000 houses in 2001 (SoER 2004) whereas the Provincial Housing Plan suggests this to be 219000, see Table 4.2.9.1.
2001 Census Housing Plan
Cape Town
Boland District
Overberg District
Central Karoo District
Eden District
West Coast District
157 711
21 172
9 371
589
19 701
6 847
73%
10%
4%
0%
9%
3%
219 000
30 968
13 829
2 001
23 368
7 334
73,9%
10,4%
4,7%
0,7%
7,9%
2,5%
215 391 100% 296 500 100%
Table 4.2.9.1 Housing Backlog (Housing Dept. 2004) (source: Housing Backlog by Municipal Area (PGWC: Housing Dept. 2004) (excluding overcrowding)
Table 4.2.9.2 compares the share of housing projects approved from April 1994 to February 2002 with population by district.

CNdV africa PROVINCIAL SPATIAL DEVELOPMENT FRAMEWORK environmental planning, landscape architecture, urban design 7 NOVEMBER 2005
4-116
Housing Units ApprovedDistrict
Municipality Number %
Built or under Construction
Comparative1996 Provincial
PopulationCape Town 97 366 57,0 65Cape Winelands 17 156 10,0 14Eden 27 654 16,2 10West Coast 15 717 9,2 6Overberg 10 101 5,9 4Central Karoo 2 742 1,6 1TOTAL 170 735 100 127 108 100
Table 4.2.9.2 State Housing Projects (1994 to 2002) (DEADP 2004)
Generally, non-metropolitan infrastructural and housing provision by the State is proportional to the population distribution. 48% of the housing and related infrastructure in the Province took place in the City of Cape Town mainly as part of the iSLP (Integrated Serviced Land Project). (DEADP 2004)
The current backlog of housing for the poor is 296 500 households. To this should be added a projected 27 000 households per annum population increase through to 2010.
Figure 4.2.9.1 shows the relationship between the housing need of each town compared to the housing units that have been funded. Only 38% of the need is being addressed by current housing projects.
Formal vs Informal Housing Split: Status Quo In the City of Cape Town it appears that the relationship between formal and informal housing is stabilising and improving slowly (DEADP 2004).
In the Overberg District Municipality the ratio of formal to informal housing is 75:10. In the Eden District Municipality 14% of the population resides in informal housing whilst 28% of the households in George and Mossel Bay (along the migration route from the Eastern Cape) live in informal housing.
Blacks ColouredsFood 30,8% 24,7%Housing and Electricity 13,3% 23,7% Transport 6,4% 7,2%Fuel and Light 0,8% 0,3% Education 3,3% 2,4%Other 45,4% 41,7%
Table 4.2.9.3 Housing affordability (Security of tenure vs ownership) Household Expenditure patterns (1998)
The Palmer Development Group during October 1999 found that households in the R0 to R1500 income bracket in the CMS (65% of households) generally could not afford current service charges.
Not all poor households are able to afford home-ownership as required by the current state subsidy scheme and may need rental accommodation instead.
Provincial Housing Plan An important element of demand is the capacity of specific places to accommodate low income people. That capacity may be expressed in terms of the ability of such places to sustain low income development with economic opportunities. This ought to be done town-by-town. This would then assist in determining the "low income development potential contours". The Growth Potential Study has gone some way in addressing this requirement (Van der Merwe, 2003)
Housing form (golf course estates, security estates!) A study into the environmental sustainability of golf and polo field estates has been commissioned by the DEADP. Although these provide housing it is evident that this type of housing is more of a recreational than permanent type.

CNdV africa PROVINCIAL SPATIAL DEVELOPMENT FRAMEWORK environmental planning, landscape architecture, urban design 7 NOVEMBER 2005
4-117
Farm Worker Housing/ Rural Housing Farm workers traditionally lived in housing on farms. This left them vulnerable to shelter needs particularly if they lost their jobs or retired. In some instances a benevolent farmer may have allowed a retiree to remain, but generally they had to leave. The establishment of Security of Tenure for Farm Labourers Act intended to address this situation by providing for tenure either on farms or the nearest appropriate settlement. One of the unintended consequences of this Act has been to precipitate a wave of farm workers to the nearest urban settlement, or in some arid areas with few villages or towns to squat by the side of the road.
4.2.9.3 LEGISLATIVE CONTEXT
Development Facilitation Act; Land Use Planning Ordinance; Land Use Management Bill; Western Cape Planning and Development Act; Less Formal Township Establishment Act; National Heritage Resources Act; Environmental Conservation Act; National Environmental Management Act; Extension of Security of Tenure Act; National Building Standards and Building Regulations; Prevention of Illegal Eviction from Unlawful Occupation of Land Act; Removal of Restrictions Act; Restitution of Land Rights Act; and, Housing Act.
Province is currently in a law reform process to consolidate it land use planning, environmental and heritage laws into one single piece of legislation. See note under Settlements
4.2.9.4 KEY ISSUES
AspatialLack of character and sense of place of newer developments and the lack of appreciation of historical and architectural character which leads to monotonous environments;
Subsidy structure perpetuates inefficient urban forms of development; Subsidy does not make provision for those who cannot afford rates and services charges, repayments and other costs associated with housing; The Provincial Housing Plan only focuses on low income housing. It is necessary to understand the entire housing spectrum including related activities such as industrial, commercial, open space requirements, i.e. integrated and sustainable human settlements. There is a need to make special provision for the middle income housing market that, due to difficulties in obtaining finance or unaffordable high income development, is being crowded out especially in rapidly growing parts of the metro and major towns. This then results in people who should not be there moving down into the low income / subsidy housing market; Housing is to be seen as an asset, a commodity that can be traded and used to improve the financial standing of the owners opposed to it just being a social benefit. Therefore, it should be located in ways and places so as to generate direct income, should be able to be used as collateral against loans and be bequeathed as inheritance; The requirement to produce R2479 to obtain a subsidy house prevented transfers and forced families to remain in informal settlements, but is no longer applicable; The slow pace of delivery due to a lack of capacity, limited resources and migration resulted in only 38% of the backlog to be funded; The one-house-fits-all scenario does not recognise that there are households with different needs; Low residential densities that leads to inefficient and unsustainable settlements; Infrastructure and service provision is a major factor in housing and settlements. This should ideally be linked to integrated planning and delivery processed as well as budgets; and, A variety of building forms, tenure and delivery systems of housing are obviously needed and need to be investigated. However, the constraints to affordability need to be noted.
SpatialOutwardly sprawling residential development leads to inefficient settlements; The negative impact of low densities and urban sprawl particularly in the City of Cape Town and coastal resorts along the West Coast and

CNdV africa PROVINCIAL SPATIAL DEVELOPMENT FRAMEWORK environmental planning, landscape architecture, urban design 7 NOVEMBER 2005
4-118
Garden Route and mainly for medium and high income housing (SoER 2004); Non-existing (not clearly defined) or non-statutory urban edge lines (in most cases); Need to place housing close to facilities – within walking distances and the spatial planning need to provide for this to allow for the optimum and efficient utilisation of resources; Housing provision in appropriate locations needs to be linked to the "banking" of suitably located land. SDF’s and other spatial planning tools need to make provision for housing in appropriate locations; and, Thus, the location of land to address housing need should be strongly linked to the urban structure and the SDF to guide the form, nature and direction of urban growth. This is also important for the protection of the environment and optimising economic opportunity. Currently, housing subsidy is only granted once per individual who may already have exercised it in the rural areas. Such a beneficiary may no longer have work or family or other future and moves to the towns or cities. This person doesn't qualify for another subsidy (while their house in the rural area may stand empty). This situation suggests that housing represents an economic infrastructure investment that should be prioritised in areas where there is economic opportunity. Rental opportunities, provided by either public or private landlords should also be possible for temporary urban residents.
4.2.9.5 SUMMARY
The population of the Western Cape is growing at a rate of 14,3% pa (1996 vs 2001 Census). This together with the approximately 300 000 housing backlog, 1% in-migration and the reduction of households sizes from approximately 4 persons per household to 3,8 persons per household leads to increased housing need and demand.
Currently the housing supply does not match the demand or the backlog and lags at a rate of 38%.
The greatest housing need is found within the City of Cape Town, Boland and Eden Districts. This correlates with the greatest concentrations of the populations over the Province.
REFERENCES AND ACKNOWLEDGEMENTSChittenden Nicks de Villiers. Towards a New Housing Policy for Stellenbosch Municipality, 2001; Department of Environmental Affairs and Development Planning. A Settlement Framework for the Western Cape Province : Green Paper, Provincial Government Western Cape, 2003; Department of Environmental Affairs & Development Planning, Integrated Serviced Land Project, 2004; Van der Merwe, I. Growth Potential and Human Need of Towns in the Western Cape, University of Stellenbosch, 2003;Western Cape Housing Consortium. City Housing Plan Business Plan, Volume 3, Draft 1, 2003a; Western Cape Housing Consortium. City Housing Plan, Volume 2, Draft 2, 2000b; Western Cape Housing Consortium. Provincial Housing Plan Western Cape : Updating of the 2001 Five Year Housing Plan & Three Year Business Plan : Task 4, 2004; Department of Environmental Affairs and Development Planning, SRK Consulting. Western Cape State of the Environment Overview Report, 2004.

Figure 4.2.9.1 HousingCNdV africa PROVINCIAL SPATIAL DEVELOPMENT FRAMEWORKenvironmental planning, landscape architecture, urban design 7 NOVEMBER 2005
4-119

CNdV africa PROVINCIAL SPATIAL DEVELOPMENT FRAMEWORKenvironmental planning, landscape architecture, urban design 7 NOVEMBER 2005
4-120CNdV africa PROVINCIAL SPATIAL DEVELOPMENT FRAMEWORKenvironmental planning, landscape architecture, urban design 7 NOVEMBER 2005
4-120


![Urban Sprawl[Date] Today I will: Know the causes, problems and solutions to Urban Sprawl](https://img.pdfslide.net/doc/110x75/568166eb550346895ddb35ac/urban-sprawldate-today-i-will-know-the-causes-problems-and-solutions-to.jpg)