Embed Size (px)
Citation preview
California Department of Forestry and Fire Protection 4.2-1 Vegetation Treatment Program Draft Environmental Impact Report
4.2 Wildfire Trends
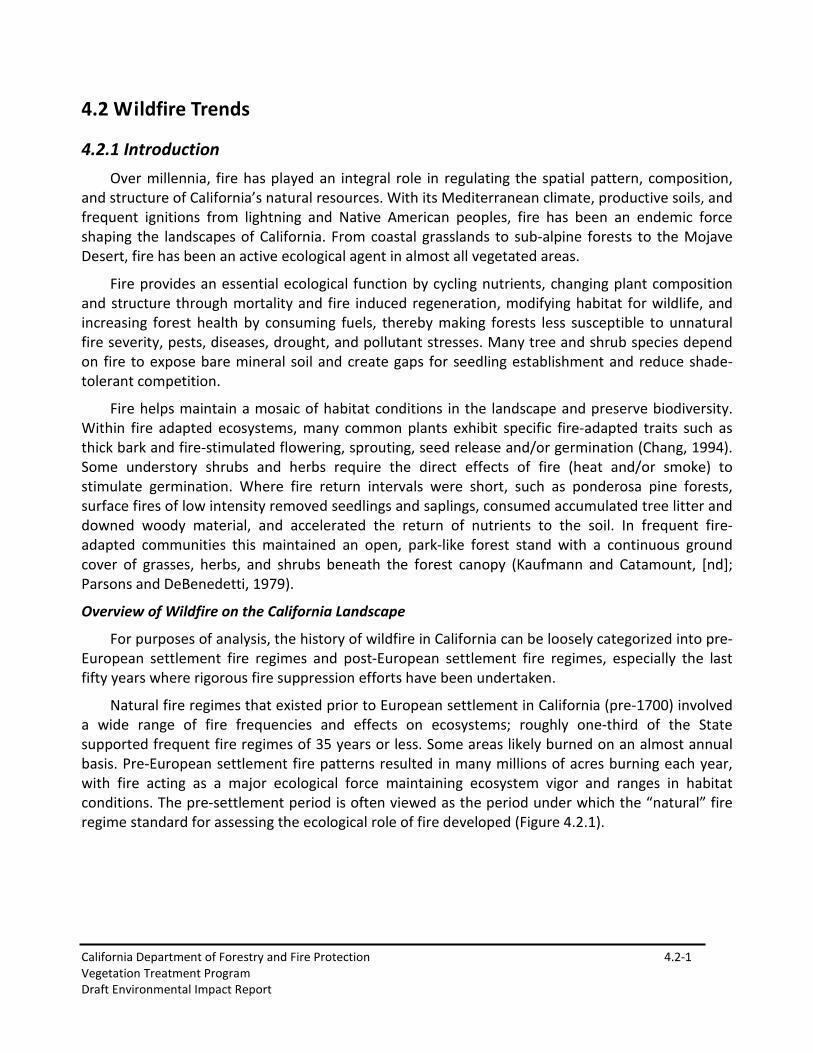
4.2.1 Introduction Over millennia, fire has played an integral role in regulating the spatial pattern, composition,
and structure of California’s natural resources. With its Mediterranean climate, productive soils, and frequent ignitions from lightning and Native American peoples, fire has been an endemic force shaping the landscapes of California. From coastal grasslands to sub-alpine forests to the Mojave Desert, fire has been an active ecological agent in almost all vegetated areas.
Fire provides an essential ecological function by cycling nutrients, changing plant composition and structure through mortality and fire induced regeneration, modifying habitat for wildlife, and increasing forest health by consuming fuels, thereby making forests less susceptible to unnatural fire severity, pests, diseases, drought, and pollutant stresses. Many tree and shrub species depend on fire to expose bare mineral soil and create gaps for seedling establishment and reduce shade-tolerant competition.
Fire helps maintain a mosaic of habitat conditions in the landscape and preserve biodiversity. Within fire adapted ecosystems, many common plants exhibit specific fire-adapted traits such as thick bark and fire-stimulated flowering, sprouting, seed release and/or germination (Chang, 1994). Some understory shrubs and herbs require the direct effects of fire (heat and/or smoke) to stimulate germination. Where fire return intervals were short, such as ponderosa pine forests, surface fires of low intensity removed seedlings and saplings, consumed accumulated tree litter and downed woody material, and accelerated the return of nutrients to the soil. In frequent fire-adapted communities this maintained an open, park-like forest stand with a continuous ground cover of grasses, herbs, and shrubs beneath the forest canopy (Kaufmann and Catamount, [nd]; Parsons and DeBenedetti, 1979).
Overview of Wildfire on the California Landscape
For purposes of analysis, the history of wildfire in California can be loosely categorized into pre-European settlement fire regimes and post-European settlement fire regimes, especially the last fifty years where rigorous fire suppression efforts have been undertaken.
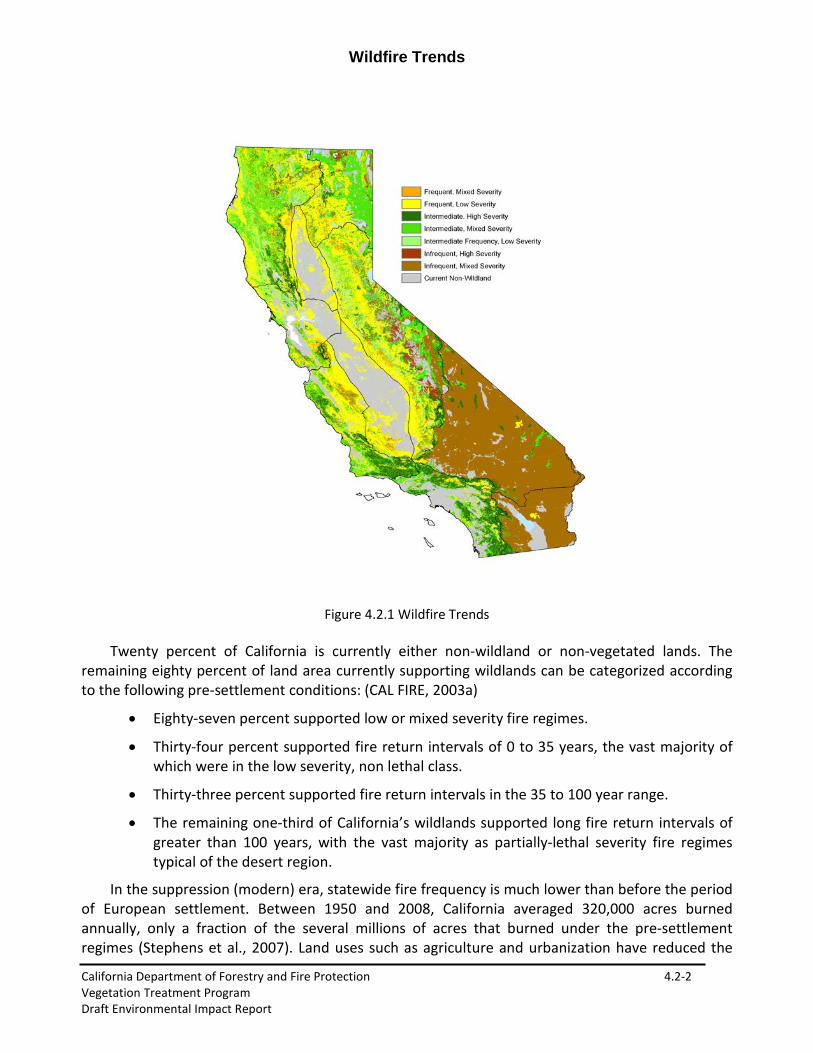
Natural fire regimes that existed prior to European settlement in California (pre-1700) involved a wide range of fire frequencies and effects on ecosystems; roughly one-third of the State supported frequent fire regimes of 35 years or less. Some areas likely burned on an almost annual basis. Pre-European settlement fire patterns resulted in many millions of acres burning each year, with fire acting as a major ecological force maintaining ecosystem vigor and ranges in habitat conditions. The pre-settlement period is often viewed as the period under which the “natural” fire regime standard for assessing the ecological role of fire developed (Figure 4.2.1).
Wildfire Trends
California Department of Forestry and Fire Protection 4.2-2 Vegetation Treatment Program Draft Environmental Impact Report
Figure 4.2.1 Wildfire Trends
Twenty percent of California is currently either non-wildland or non-vegetated lands. The
remaining eighty percent of land area currently supporting wildlands can be categorized according to the following pre-settlement conditions: (CAL FIRE, 2003a)
• Eighty-seven percent supported low or mixed severity fire regimes.
• Thirty-four percent supported fire return intervals of 0 to 35 years, the vast majority of which were in the low severity, non lethal class.
• Thirty-three percent supported fire return intervals in the 35 to 100 year range.
• The remaining one-third of California’s wildlands supported long fire return intervals of greater than 100 years, with the vast majority as partially-lethal severity fire regimes typical of the desert region.
In the suppression (modern) era, statewide fire frequency is much lower than before the period of European settlement. Between 1950 and 2008, California averaged 320,000 acres burned annually, only a fraction of the several millions of acres that burned under the pre-settlement regimes (Stephens et al., 2007). Land uses such as agriculture and urbanization have reduced the
Wildfire Trends
California Department of Forestry and Fire Protection 4.2-3 Vegetation Treatment Program Draft Environmental Impact Report
amount of burnable landscape, and most wildland fires are effectively suppressed to protect resources, commodities, and people.
Before the twentieth century, many forests within California were generally open and park like due to the thinning effects of recurrent fire. Decades of fire suppression and other forest management have left a legacy of increased fuel loads and ecosystems dense with an understory of shade-tolerant, late-succession plant species. The widespread level of dangerous fuel conditions is a result of highly productive vegetative systems accumulating fuels and/or reductions in fire frequency from fire suppression. In the absence of fire, these plant communities accrue biomass, and alter the arrangement of it in ways that significantly increase fuel availability and expected fire intensity. As such, many ecosystems are conducive to large, severe fires, especially during hot, dry, windy periods in late summer through fall. Additionally, the spatial continuity of fuels has increased with fewer structural breaks to retard fire spread and intensity. The increased accumulations of live and dead fuels may burn longer and more completely, threatening the integrity and sustainability of the ecosystems.
Species composition within these forests is also rapidly changing. Plant and animal species that require open conditions and/or highly patchy edge ecotones are declining and streams are drying as evapotranspiration increases due to increased stocking. Additionally, streams are being infiltrated by silt and debris following high severity fires, and unnaturally severe wildfires have destroyed vast areas of forest (Bonnicksen, 2003). Some insects and disease have reached epidemic proportions in parts of the State and forest conditions are conducive to more outbreaks. The understory of these once open forests is now dominated by smaller shade tolerant trees that would have previously been thinned and/or consumed by fire.
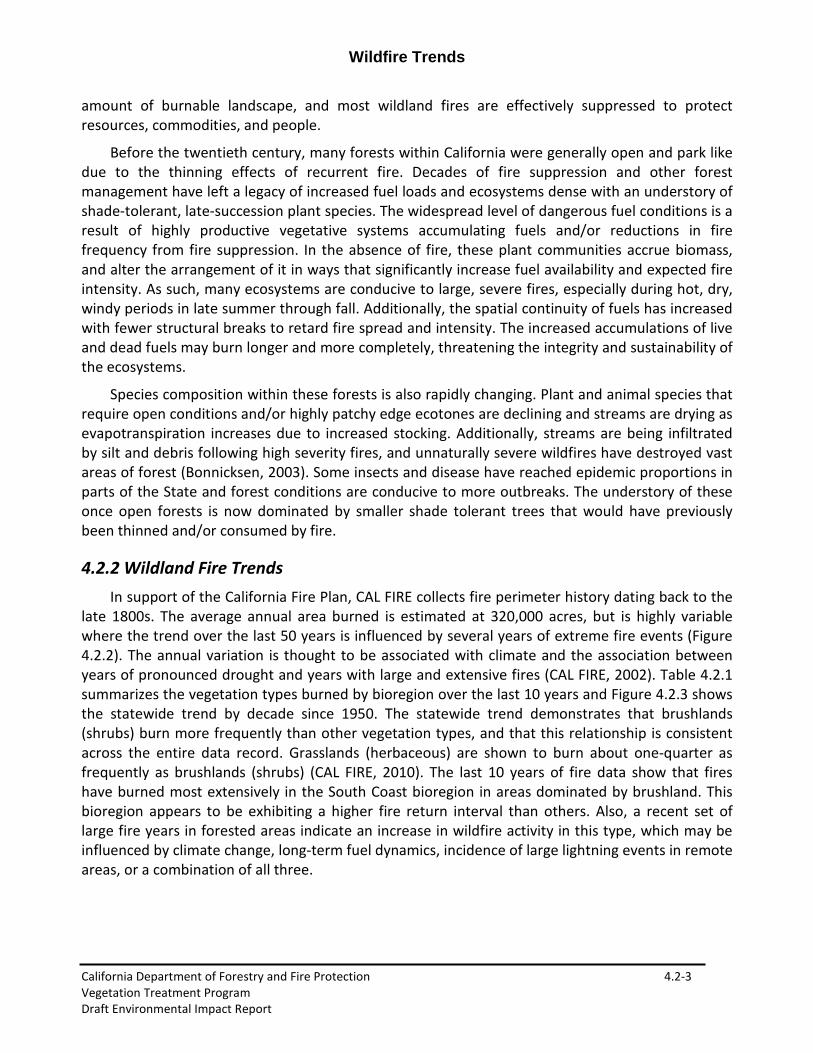
4.2.2 Wildland Fire Trends In support of the California Fire Plan, CAL FIRE collects fire perimeter history dating back to the
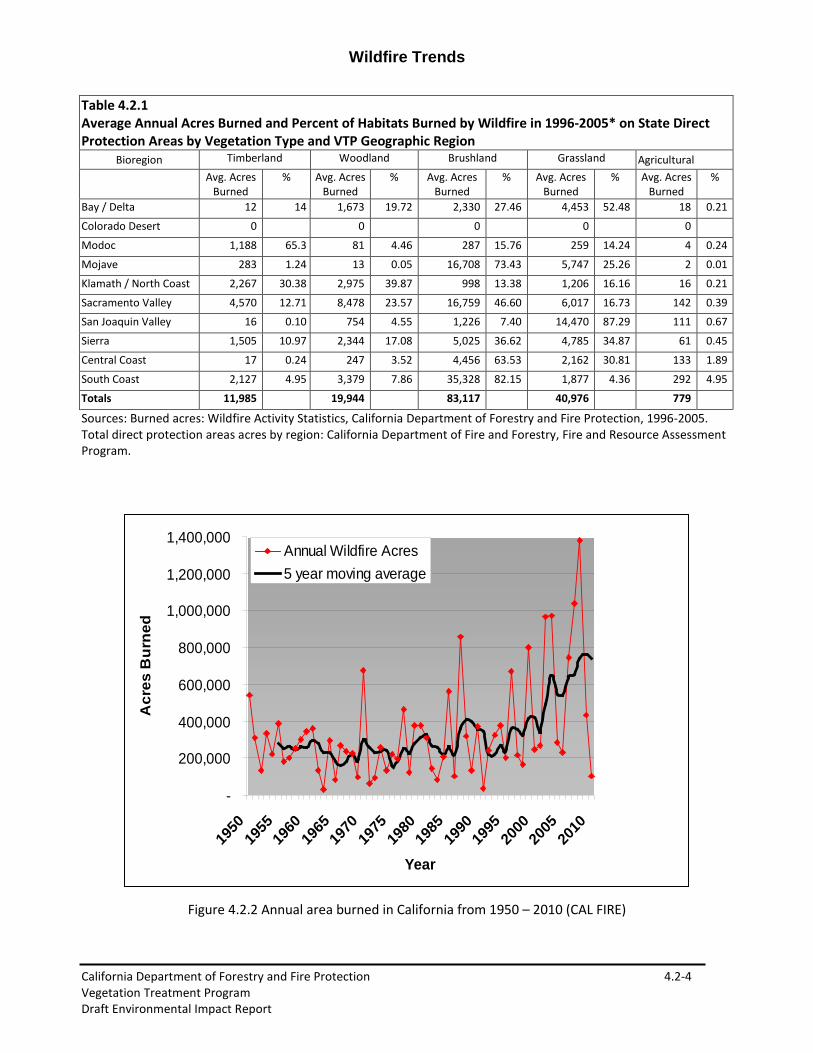
late 1800s. The average annual area burned is estimated at 320,000 acres, but is highly variable where the trend over the last 50 years is influenced by several years of extreme fire events (Figure 4.2.2). The annual variation is thought to be associated with climate and the association between years of pronounced drought and years with large and extensive fires (CAL FIRE, 2002). Table 4.2.1 summarizes the vegetation types burned by bioregion over the last 10 years and Figure 4.2.3 shows the statewide trend by decade since 1950. The statewide trend demonstrates that brushlands (shrubs) burn more frequently than other vegetation types, and that this relationship is consistent across the entire data record. Grasslands (herbaceous) are shown to burn about one-quarter as frequently as brushlands (shrubs) (CAL FIRE, 2010). The last 10 years of fire data show that fires have burned most extensively in the South Coast bioregion in areas dominated by brushland. This bioregion appears to be exhibiting a higher fire return interval than others. Also, a recent set of large fire years in forested areas indicate an increase in wildfire activity in this type, which may be influenced by climate change, long-term fuel dynamics, incidence of large lightning events in remote areas, or a combination of all three.
Wildfire Trends
California Department of Forestry and Fire Protection 4.2-4 Vegetation Treatment Program Draft Environmental Impact Report
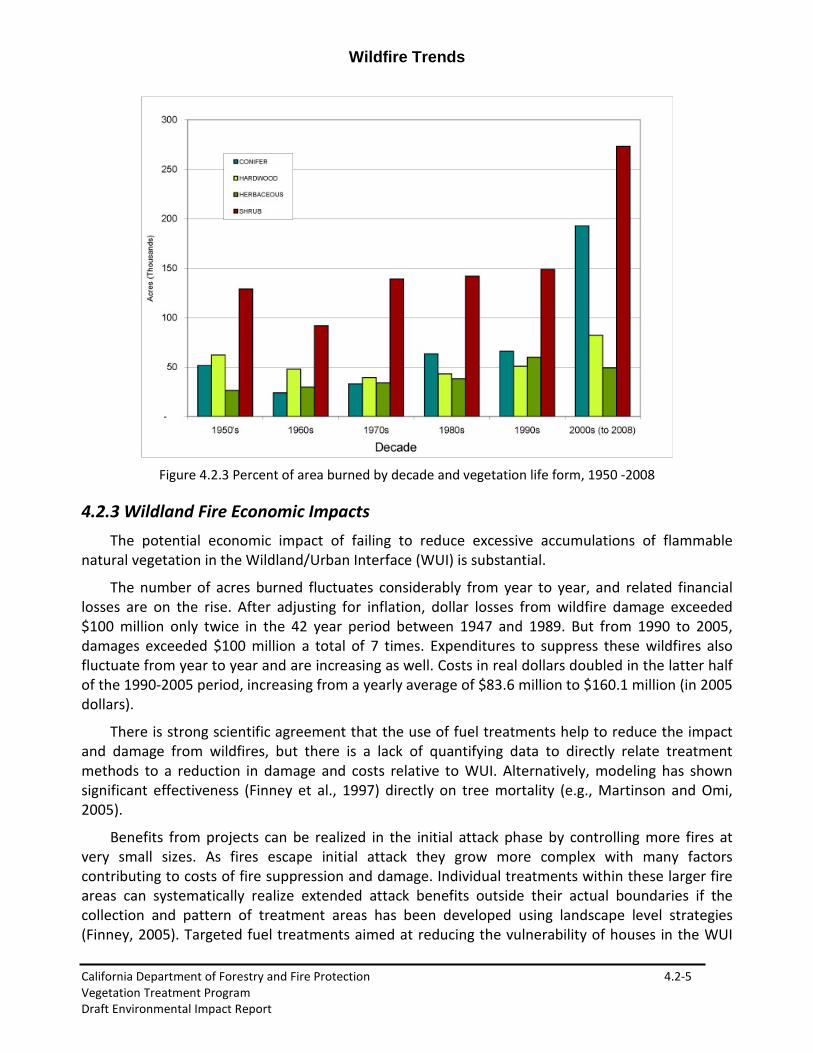
Table 4.2.1 Average Annual Acres Burned and Percent of Habitats Burned by Wildfire in 1996-2005* on State Direct Protection Areas by Vegetation Type and VTP Geographic Region
Bioregion Timberland Woodland Brushland Grassland Agricultural Avg. Acres
Burned % Avg. Acres
Burned % Avg. Acres
Burned % Avg. Acres
Burned % Avg. Acres
Burned %
Bay / Delta 12 14 1,673 19.72 2,330 27.46 4,453 52.48 18 0.21
Colorado Desert 0 0 0 0 0
Modoc 1,188 65.3 81 4.46 287 15.76 259 14.24 4 0.24
Mojave 283 1.24 13 0.05 16,708 73.43 5,747 25.26 2 0.01
Klamath / North Coast 2,267 30.38 2,975 39.87 998 13.38 1,206 16.16 16 0.21
Sacramento Valley 4,570 12.71 8,478 23.57 16,759 46.60 6,017 16.73 142 0.39
San Joaquin Valley 16 0.10 754 4.55 1,226 7.40 14,470 87.29 111 0.67
Sierra 1,505 10.97 2,344 17.08 5,025 36.62 4,785 34.87 61 0.45
Central Coast 17 0.24 247 3.52 4,456 63.53 2,162 30.81 133 1.89
South Coast 2,127 4.95 3,379 7.86 35,328 82.15 1,877 4.36 292 4.95
Totals 11,985 19,944 83,117 40,976 779
Sources: Burned acres: Wildfire Activity Statistics, California Department of Forestry and Fire Protection, 1996-2005. Total direct protection areas acres by region: California Department of Fire and Forestry, Fire and Resource Assessment Program.
-
200,000
400,000
600,000
800,000
1,000,000
1,200,000
1,400,000
1950
1955
1960
1965
1970
1975
1980
1985
1990
1995
2000
2005
2010
Year
Acr
es B
urne
d
Annual Wildfire Acres5 year moving average
Figure 4.2.2 Annual area burned in California from 1950 – 2010 (CAL FIRE)
Wildfire Trends
California Department of Forestry and Fire Protection 4.2-5 Vegetation Treatment Program Draft Environmental Impact Report
Figure 4.2.3 Percent of area burned by decade and vegetation life form, 1950 -2008
4.2.3 Wildland Fire Economic Impacts The potential economic impact of failing to reduce excessive accumulations of flammable
natural vegetation in the Wildland/Urban Interface (WUI) is substantial.
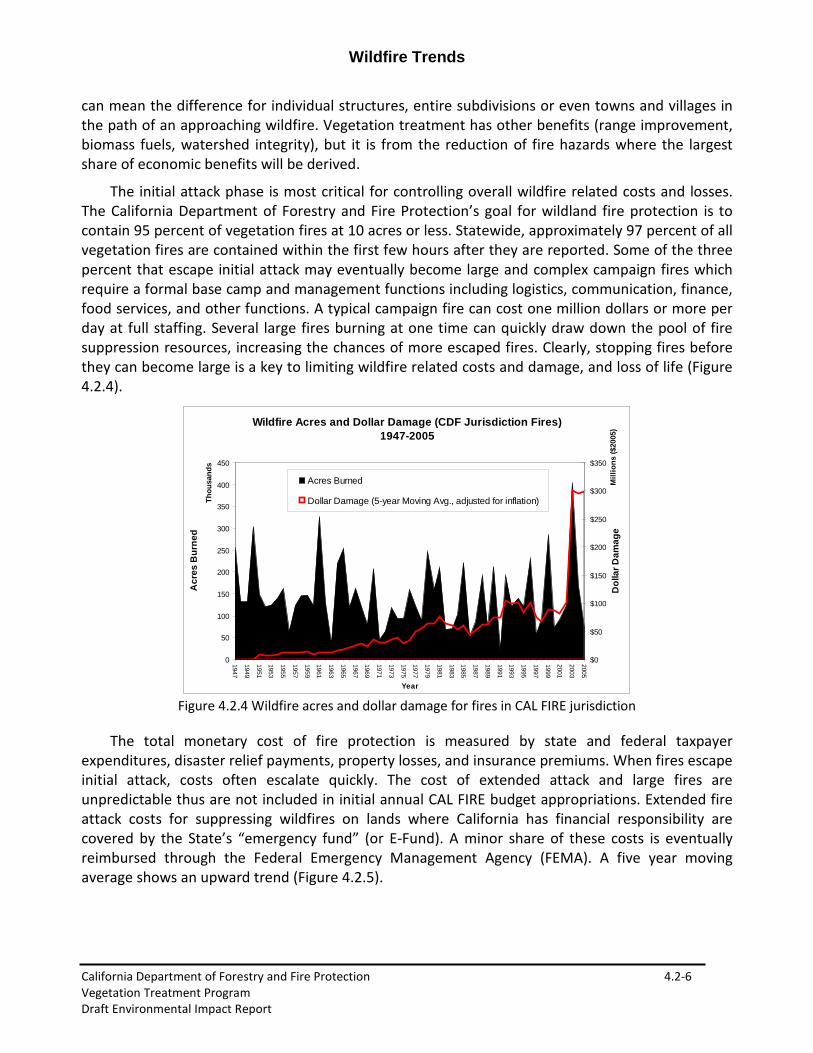
The number of acres burned fluctuates considerably from year to year, and related financial losses are on the rise. After adjusting for inflation, dollar losses from wildfire damage exceeded $100 million only twice in the 42 year period between 1947 and 1989. But from 1990 to 2005, damages exceeded $100 million a total of 7 times. Expenditures to suppress these wildfires also fluctuate from year to year and are increasing as well. Costs in real dollars doubled in the latter half of the 1990-2005 period, increasing from a yearly average of $83.6 million to $160.1 million (in 2005 dollars).
There is strong scientific agreement that the use of fuel treatments help to reduce the impact and damage from wildfires, but there is a lack of quantifying data to directly relate treatment methods to a reduction in damage and costs relative to WUI. Alternatively, modeling has shown significant effectiveness (Finney et al., 1997) directly on tree mortality (e.g., Martinson and Omi, 2005).
Benefits from projects can be realized in the initial attack phase by controlling more fires at very small sizes. As fires escape initial attack they grow more complex with many factors contributing to costs of fire suppression and damage. Individual treatments within these larger fire areas can systematically realize extended attack benefits outside their actual boundaries if the collection and pattern of treatment areas has been developed using landscape level strategies (Finney, 2005). Targeted fuel treatments aimed at reducing the vulnerability of houses in the WUI
Wildfire Trends
California Department of Forestry and Fire Protection 4.2-6 Vegetation Treatment Program Draft Environmental Impact Report
can mean the difference for individual structures, entire subdivisions or even towns and villages in the path of an approaching wildfire. Vegetation treatment has other benefits (range improvement, biomass fuels, watershed integrity), but it is from the reduction of fire hazards where the largest share of economic benefits will be derived.
The initial attack phase is most critical for controlling overall wildfire related costs and losses. The California Department of Forestry and Fire Protection’s goal for wildland fire protection is to contain 95 percent of vegetation fires at 10 acres or less. Statewide, approximately 97 percent of all vegetation fires are contained within the first few hours after they are reported. Some of the three percent that escape initial attack may eventually become large and complex campaign fires which require a formal base camp and management functions including logistics, communication, finance, food services, and other functions. A typical campaign fire can cost one million dollars or more per day at full staffing. Several large fires burning at one time can quickly draw down the pool of fire suppression resources, increasing the chances of more escaped fires. Clearly, stopping fires before they can become large is a key to limiting wildfire related costs and damage, and loss of life (Figure 4.2.4).
Wildfire Acres and Dollar Damage (CDF Jurisdiction Fires) 1947-2005
0
50
100
150
200
250
300
350
400
450
1947
1949
1951
1953
1955
1957
1959
1961
1963
1965
1967
1969
1971
1973
1975
1977
1979
1981
1983
1985
1987
1989
1991
1993
1995
1997
1999
2001
2003
2005
Thou
sand
s
Year
Acr
es B
urne
d
$0
$50
$100
$150
$200
$250
$300
$350
Mill
ions
($20
05)
Dol
lar D
amag
e
Acres Burned
Dollar Damage (5-year Moving Avg., adjusted for inflation)
Figure 4.2.4 Wildfire acres and dollar damage for fires in CAL FIRE jurisdiction
The total monetary cost of fire protection is measured by state and federal taxpayer
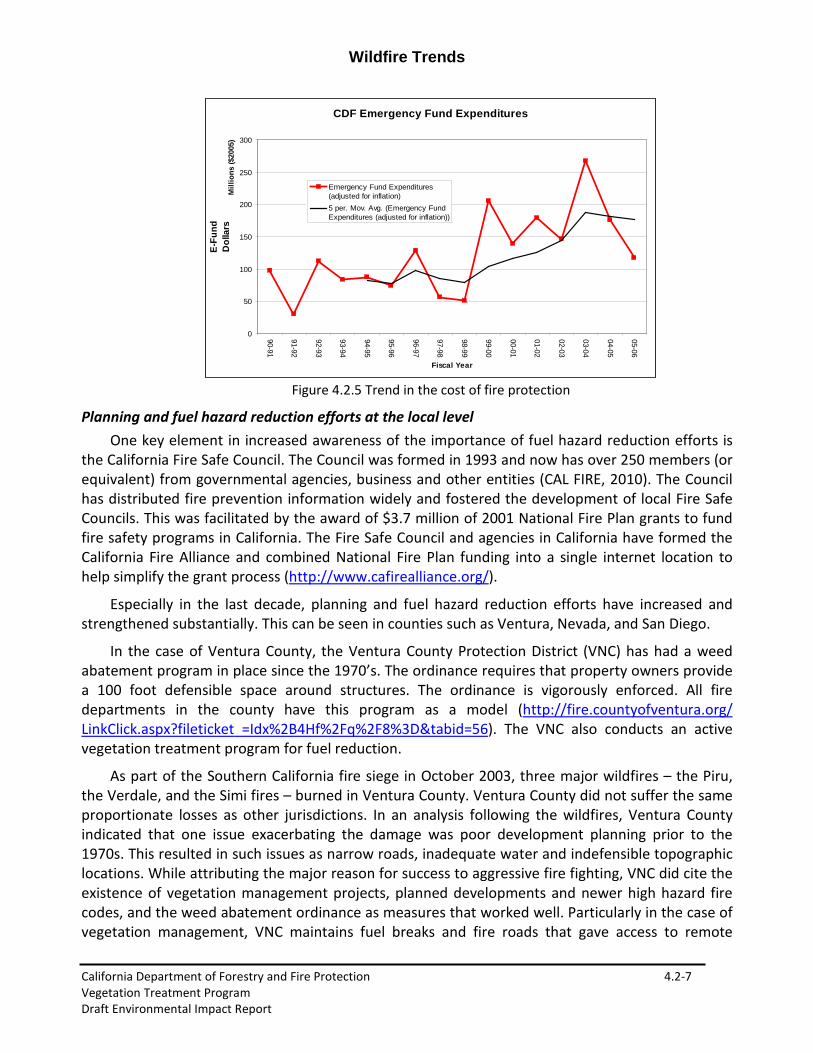
expenditures, disaster relief payments, property losses, and insurance premiums. When fires escape initial attack, costs often escalate quickly. The cost of extended attack and large fires are unpredictable thus are not included in initial annual CAL FIRE budget appropriations. Extended fire attack costs for suppressing wildfires on lands where California has financial responsibility are covered by the State’s “emergency fund” (or E-Fund). A minor share of these costs is eventually reimbursed through the Federal Emergency Management Agency (FEMA). A five year moving average shows an upward trend (Figure 4.2.5).
Wildfire Trends
California Department of Forestry and Fire Protection 4.2-7 Vegetation Treatment Program Draft Environmental Impact Report
CDF Emergency Fund Expenditures
0
50
100
150
200
250
300
90-91
91-92
92-93
93-94
94-95
95-96
96-97
97-98
98-99
99-00
00-01
01-02
02-03
03-04
04-05
05-06
Mill
ions
($20
05)
Fiscal Year
E-Fu
nd
Dol
lars
Emergency Fund Expenditures(adjusted for inflation)5 per. Mov. Avg. (Emergency FundExpenditures (adjusted for inflation))
Figure 4.2.5 Trend in the cost of fire protection
Planning and fuel hazard reduction efforts at the local level One key element in increased awareness of the importance of fuel hazard reduction efforts is
the California Fire Safe Council. The Council was formed in 1993 and now has over 250 members (or equivalent) from governmental agencies, business and other entities (CAL FIRE, 2010). The Council has distributed fire prevention information widely and fostered the development of local Fire Safe Councils. This was facilitated by the award of $3.7 million of 2001 National Fire Plan grants to fund fire safety programs in California. The Fire Safe Council and agencies in California have formed the California Fire Alliance and combined National Fire Plan funding into a single internet location to help simplify the grant process (http://www.cafirealliance.org/).
Especially in the last decade, planning and fuel hazard reduction efforts have increased and strengthened substantially. This can be seen in counties such as Ventura, Nevada, and San Diego.
In the case of Ventura County, the Ventura County Protection District (VNC) has had a weed abatement program in place since the 1970’s. The ordinance requires that property owners provide a 100 foot defensible space around structures. The ordinance is vigorously enforced. All fire departments in the county have this program as a model (http://fire.countyofventura.org/ LinkClick.aspx?fileticket =Idx%2B4Hf%2Fq%2F8%3D&tabid=56). The VNC also conducts an active vegetation treatment program for fuel reduction.
As part of the Southern California fire siege in October 2003, three major wildfires – the Piru, the Verdale, and the Simi fires – burned in Ventura County. Ventura County did not suffer the same proportionate losses as other jurisdictions. In an analysis following the wildfires, Ventura County indicated that one issue exacerbating the damage was poor development planning prior to the 1970s. This resulted in such issues as narrow roads, inadequate water and indefensible topographic locations. While attributing the major reason for success to aggressive fire fighting, VNC did cite the existence of vegetation management projects, planned developments and newer high hazard fire codes, and the weed abatement ordinance as measures that worked well. Particularly in the case of vegetation management, VNC maintains fuel breaks and fire roads that gave access to remote
Wildfire Trends
California Department of Forestry and Fire Protection 4.2-8 Vegetation Treatment Program Draft Environmental Impact Report
areas. VNC also indicated that they have done several VTP projects, largely to improve grazing for ranchers, which turned out to be strategic control points during the fires. (Ventura County Wildland Fire Siege, October 2003 at http://fire.countyofventura.org/LinkClick.aspx?fileticket=Idx%2B4Hf% 2Fq%2F8%3D&tabid=56.
Within Nevada County, because of the significant urban intermix problem, much of the fire prevention effort has been spent on reducing the potential for large damaging fires. This has been accomplished through the efforts of a seasonal fire prevention inspector who in 2011 conducted Public Resource Code 4291 inspections on 2,772 residents within the battalion, along with a schedule ‘A’ Fire Protection Planner whose focus has been placed on land use review, concentrating on fuel modification, adequate access and egress and water storage for fire protection. CAL FIRE has also been instrumental in the newly developed Nevada County Fire Plan addressing the need for hazardous fuel modification. CAL FIRE is also involved with the Nevada County Fire Safe Council that oversees the Nevada County chipping program. The PRC 4291 inspections serve a dual purpose, vegetation management and public education. In 2000 the local CAL FIRE unit found in its Nevada County Inspection program that only about five percent of the residences require a second inspection to ensure compliance with PRC 4291. Approximately one percent of the residences required a third inspection.
In its August 2003 report, the San Diego Wildland Task Force agreed that fuel or vegetation management is the single most effective tool available to mitigate fires. The build-up of fuel greatly affected the intensity and speed of the recent fires contributing to the loss of lives and property. Prescribed burning, thinning, weed abatement, brushing and clearing, and fire breaks are principle methods of fuel management that the County could utilize to lessen the strength of another catastrophic fire.
4.2.4 Characterizing Wildfire Rotation
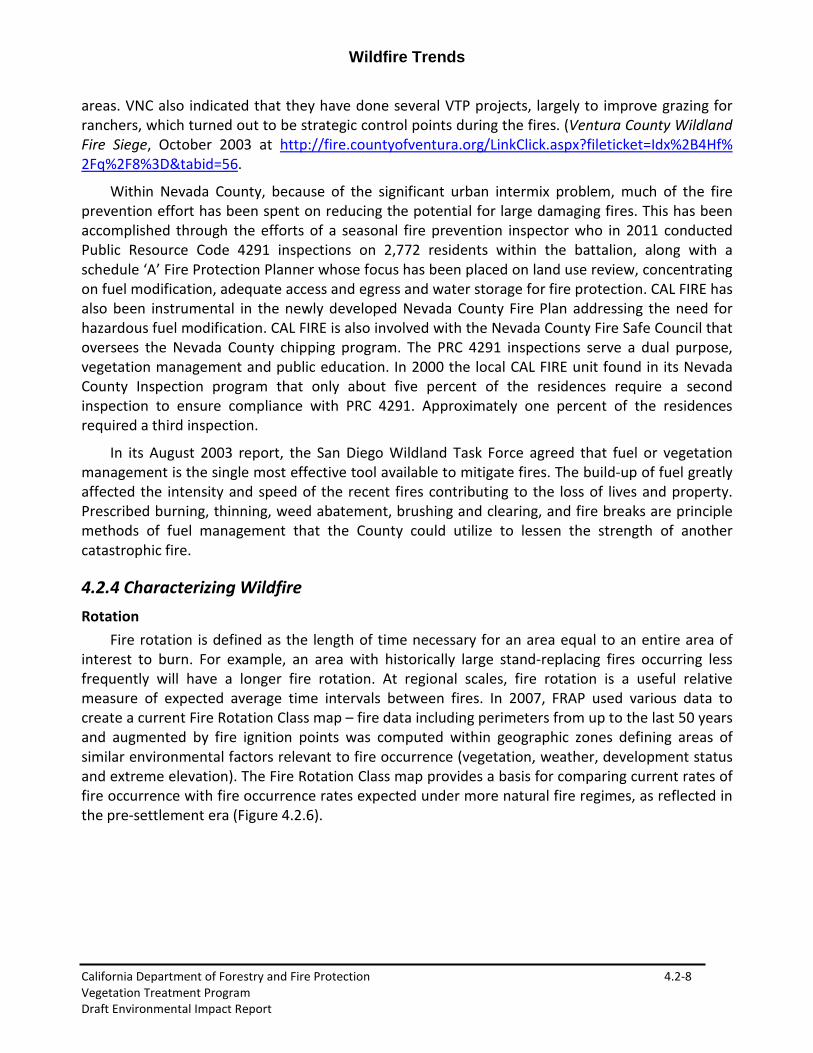
Fire rotation is defined as the length of time necessary for an area equal to an entire area of interest to burn. For example, an area with historically large stand-replacing fires occurring less frequently will have a longer fire rotation. At regional scales, fire rotation is a useful relative measure of expected average time intervals between fires. In 2007, FRAP used various data to create a current Fire Rotation Class map – fire data including perimeters from up to the last 50 years and augmented by fire ignition points was computed within geographic zones defining areas of similar environmental factors relevant to fire occurrence (vegetation, weather, development status and extreme elevation). The Fire Rotation Class map provides a basis for comparing current rates of fire occurrence with fire occurrence rates expected under more natural fire regimes, as reflected in the pre-settlement era (Figure 4.2.6).
Wildfire Trends
California Department of Forestry and Fire Protection 4.2-9 Vegetation Treatment Program Draft Environmental Impact Report
Figure 4.2.6 Fire Rotation
Much of the dry forest and woodland areas of California are clearly burning less frequently than
was typical under the pre-settlement regimes. Distribution of fire is biased to the Southwest, especially the South Coast interior, interior areas of the North Coast mountains, and the Sierra foothills. Low values in the desert reflect yearly variation in herbaceous fuel crops.
Depending on type and area, lands in the frequent fire regime are burning up to 100 times less frequently in the modern era (Martin and Sapsis, 1992; Skinner and Chang, 1996). Most of the brush and chaparral systems are probably operating close to their natural range of variation in fire frequency, with the notable exception of isolated areas of coastal sage scrub and light brush that appears to be burning more frequently, likely due to the invasion of annual grass species that fundamentally change fuel dynamics in the post-fire environment, making them highly flammable after fire (Keeley and Fotheringham, 2001).
Wildfire Trends
California Department of Forestry and Fire Protection 4.2-10 Vegetation Treatment Program Draft Environmental Impact Report
Where suppression has increased the times between fires, significant ecological and public safety concerns can be raised. This is particularly true where the absence of fire alters fuelbed characteristics resulting in significant increases in expected fire behavior. An example of this type of change is the lower elevation ponderosa pine/mixed-conifer ecosystems under CAL FIRE protection where FRAP has calculated fire rotation for the Sierra bioregion conifer to be 618 years. The expected fire frequency under the natural fire regimes would have likely been between five and 15 years (Skinner and Chang, 1996). In the specific case of chaparral, while the frequency may not have changed significantly, and ecological stability appears not to be at risk (at least in terms of fire occurrence), there still exists the potential for extreme fire behavior, and such hazards do pose significant risks to people and property.
Fire Behavior Potential Fire behavior describes how a particular fire acts – how fast it spreads, how much fuel it
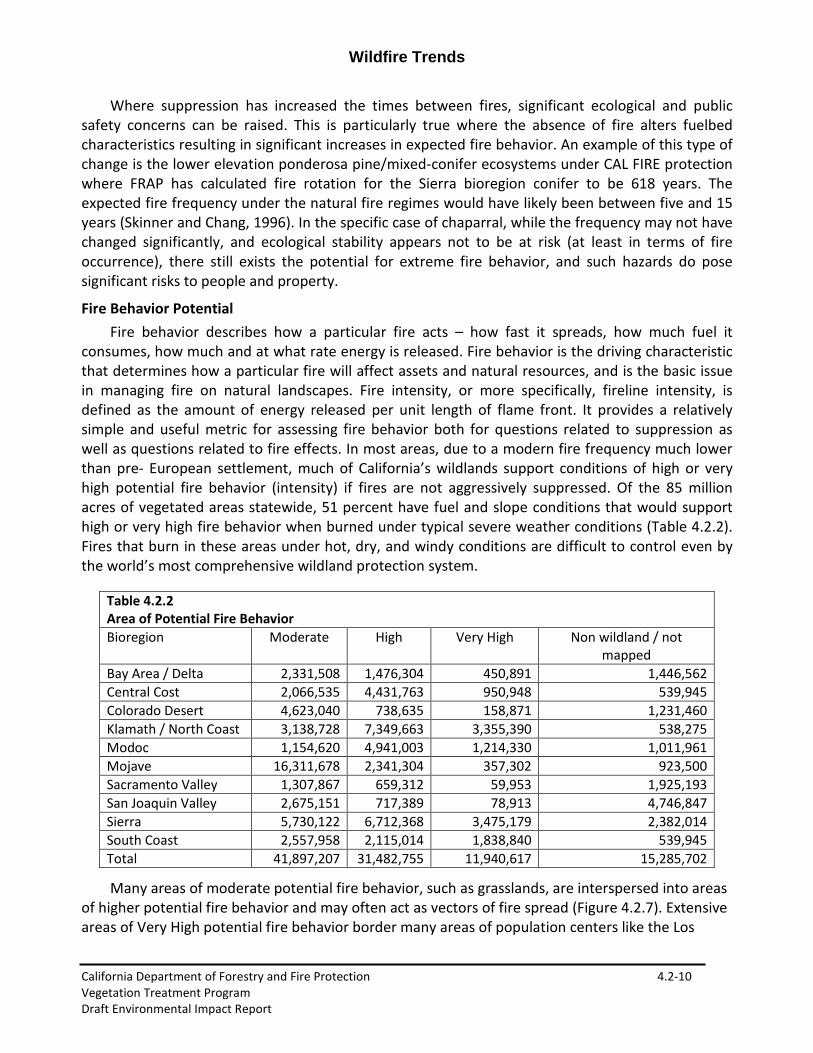
consumes, how much and at what rate energy is released. Fire behavior is the driving characteristic that determines how a particular fire will affect assets and natural resources, and is the basic issue in managing fire on natural landscapes. Fire intensity, or more specifically, fireline intensity, is defined as the amount of energy released per unit length of flame front. It provides a relatively simple and useful metric for assessing fire behavior both for questions related to suppression as well as questions related to fire effects. In most areas, due to a modern fire frequency much lower than pre- European settlement, much of California’s wildlands support conditions of high or very high potential fire behavior (intensity) if fires are not aggressively suppressed. Of the 85 million acres of vegetated areas statewide, 51 percent have fuel and slope conditions that would support high or very high fire behavior when burned under typical severe weather conditions (Table 4.2.2). Fires that burn in these areas under hot, dry, and windy conditions are difficult to control even by the world’s most comprehensive wildland protection system.
Table 4.2.2 Area of Potential Fire Behavior Bioregion Moderate High Very High Non wildland / not
mapped Bay Area / Delta 2,331,508 1,476,304 450,891 1,446,562 Central Cost 2,066,535 4,431,763 950,948 539,945 Colorado Desert 4,623,040 738,635 158,871 1,231,460 Klamath / North Coast 3,138,728 7,349,663 3,355,390 538,275 Modoc 1,154,620 4,941,003 1,214,330 1,011,961 Mojave 16,311,678 2,341,304 357,302 923,500 Sacramento Valley 1,307,867 659,312 59,953 1,925,193 San Joaquin Valley 2,675,151 717,389 78,913 4,746,847 Sierra 5,730,122 6,712,368 3,475,179 2,382,014 South Coast 2,557,958 2,115,014 1,838,840 539,945 Total 41,897,207 31,482,755 11,940,617 15,285,702
Many areas of moderate potential fire behavior, such as grasslands, are interspersed into areas of higher potential fire behavior and may often act as vectors of fire spread (Figure 4.2.7). Extensive areas of Very High potential fire behavior border many areas of population centers like the Los
Wildfire Trends
California Department of Forestry and Fire Protection 4.2-11 Vegetation Treatment Program Draft Environmental Impact Report
Angeles Basin, while the western flank of the Sierra Nevada forms a continuous belt of dangerous fuels.
Figure 4.2.7 Potential fire behavior
Threat
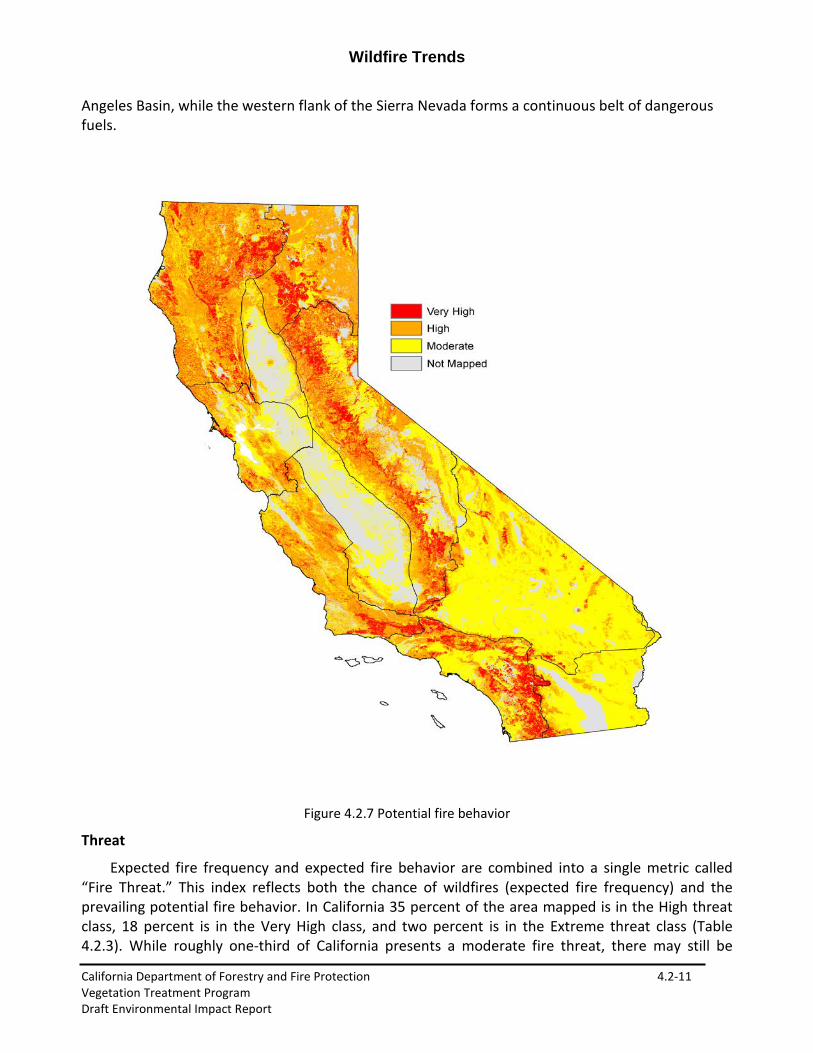
Expected fire frequency and expected fire behavior are combined into a single metric called “Fire Threat.” This index reflects both the chance of wildfires (expected fire frequency) and the prevailing potential fire behavior. In California 35 percent of the area mapped is in the High threat class, 18 percent is in the Very High class, and two percent is in the Extreme threat class (Table 4.2.3). While roughly one-third of California presents a moderate fire threat, there may still be
Wildfire Trends
California Department of Forestry and Fire Protection 4.2-12 Vegetation Treatment Program Draft Environmental Impact Report
significant impacts from wildfires should they burn under extreme fire weather conditions. Many of the locations of greatest concern for fire threats are also located in the Los Angeles basin, and the western flank of the Sierra Nevada (Figure 4.2.8)
Table 4.2.3 Statewide Fire Threat
Fire threat Acres % of State % of area mapped (non-wildland excluded)
Moderate 36,942,600 37 45 High 30,370,766 30 35 Very High 15,769,155 16 18 Extreme 2,249,365 2 2 Not mapped 15,582,151 15 --
Figure 4.2.8 Threat of wildfire
Wildfire Trends
California Department of Forestry and Fire Protection 4.2-13 Vegetation Treatment Program Draft Environmental Impact Report
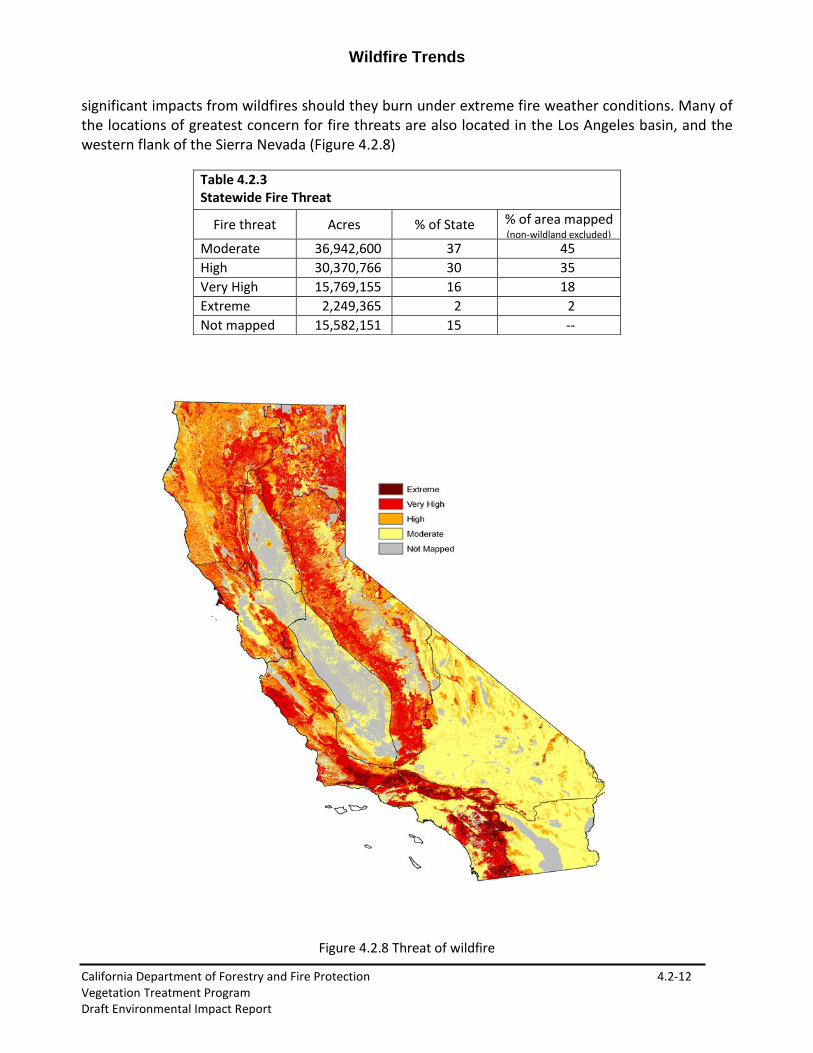
Condition Class Wildfire can cause serious and long-lasting damage to ecosystems. A fire regime condition class
has been developed as a way to describe the degree of departure from the natural pre-settlement fire regime. These classes are assigned based on current vegetation type, structure, an understanding of its pre-settlement fire regime, current conditions, expected fire frequency, and potential fire behavior. For fire-adapted ecosystems, much of their ecological structure and processes are driven by fire, and disruption of fire regimes leads to changes in plant composition and structure, uncharacteristic fire behavior and other disturbance agents (pests), altered hydrologic processes and increased smoke production (Figure 4.2.9, Table 4.2.4).
Figure 4.2.9 Condition Class
Wildfire Trends
California Department of Forestry and Fire Protection 4.2-14 Vegetation Treatment Program Draft Environmental Impact Report
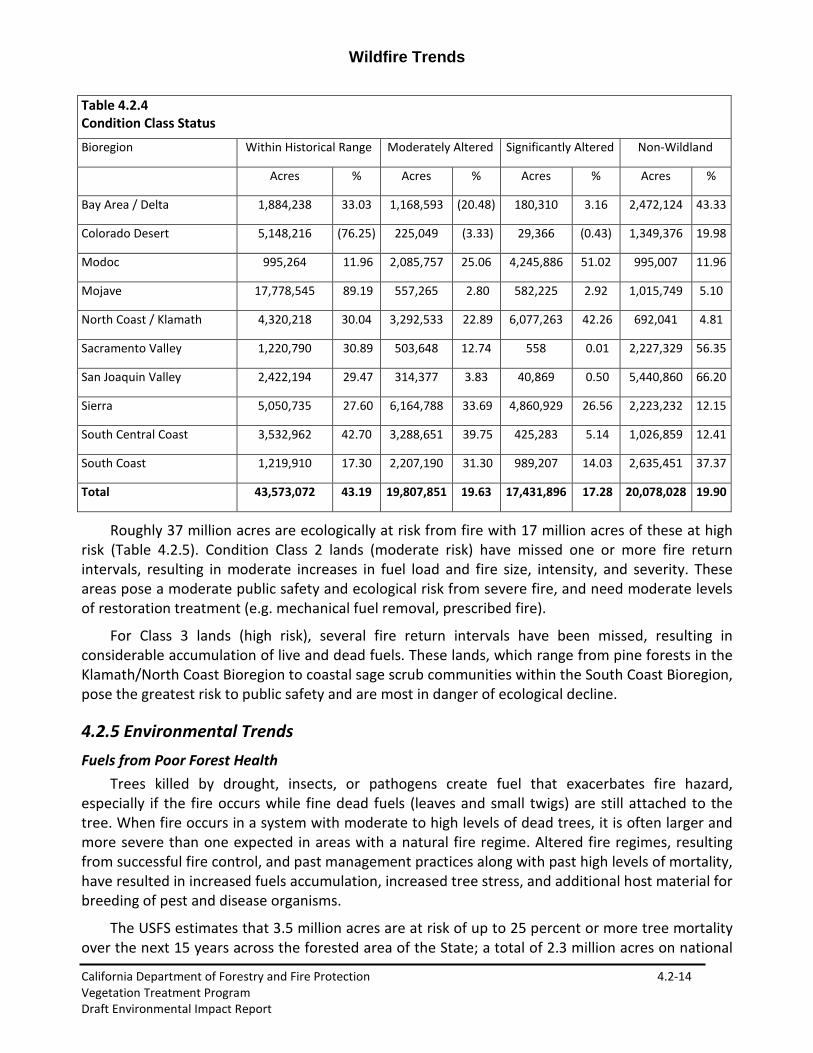
Table 4.2.4 Condition Class Status
Bioregion Within Historical Range Moderately Altered Significantly Altered Non-Wildland
Acres % Acres % Acres % Acres %
Bay Area / Delta 1,884,238 33.03 1,168,593 (20.48) 180,310 3.16 2,472,124 43.33
Colorado Desert 5,148,216 (76.25) 225,049 (3.33) 29,366 (0.43) 1,349,376 19.98
Modoc 995,264 11.96 2,085,757 25.06 4,245,886 51.02 995,007 11.96
Mojave 17,778,545 89.19 557,265 2.80 582,225 2.92 1,015,749 5.10
North Coast / Klamath 4,320,218 30.04 3,292,533 22.89 6,077,263 42.26 692,041 4.81
Sacramento Valley 1,220,790 30.89 503,648 12.74 558 0.01 2,227,329 56.35
San Joaquin Valley 2,422,194 29.47 314,377 3.83 40,869 0.50 5,440,860 66.20
Sierra 5,050,735 27.60 6,164,788 33.69 4,860,929 26.56 2,223,232 12.15
South Central Coast 3,532,962 42.70 3,288,651 39.75 425,283 5.14 1,026,859 12.41
South Coast 1,219,910 17.30 2,207,190 31.30 989,207 14.03 2,635,451 37.37
Total 43,573,072 43.19 19,807,851 19.63 17,431,896 17.28 20,078,028 19.90
Roughly 37 million acres are ecologically at risk from fire with 17 million acres of these at high risk (Table 4.2.5). Condition Class 2 lands (moderate risk) have missed one or more fire return intervals, resulting in moderate increases in fuel load and fire size, intensity, and severity. These areas pose a moderate public safety and ecological risk from severe fire, and need moderate levels of restoration treatment (e.g. mechanical fuel removal, prescribed fire).
For Class 3 lands (high risk), several fire return intervals have been missed, resulting in considerable accumulation of live and dead fuels. These lands, which range from pine forests in the Klamath/North Coast Bioregion to coastal sage scrub communities within the South Coast Bioregion, pose the greatest risk to public safety and are most in danger of ecological decline.
4.2.5 Environmental Trends Fuels from Poor Forest Health
Trees killed by drought, insects, or pathogens create fuel that exacerbates fire hazard, especially if the fire occurs while fine dead fuels (leaves and small twigs) are still attached to the tree. When fire occurs in a system with moderate to high levels of dead trees, it is often larger and more severe than one expected in areas with a natural fire regime. Altered fire regimes, resulting from successful fire control, and past management practices along with past high levels of mortality, have resulted in increased fuels accumulation, increased tree stress, and additional host material for breeding of pest and disease organisms.
The USFS estimates that 3.5 million acres are at risk of up to 25 percent or more tree mortality over the next 15 years across the forested area of the State; a total of 2.3 million acres on national
Wildfire Trends
California Department of Forestry and Fire Protection 4.2-15 Vegetation Treatment Program Draft Environmental Impact Report
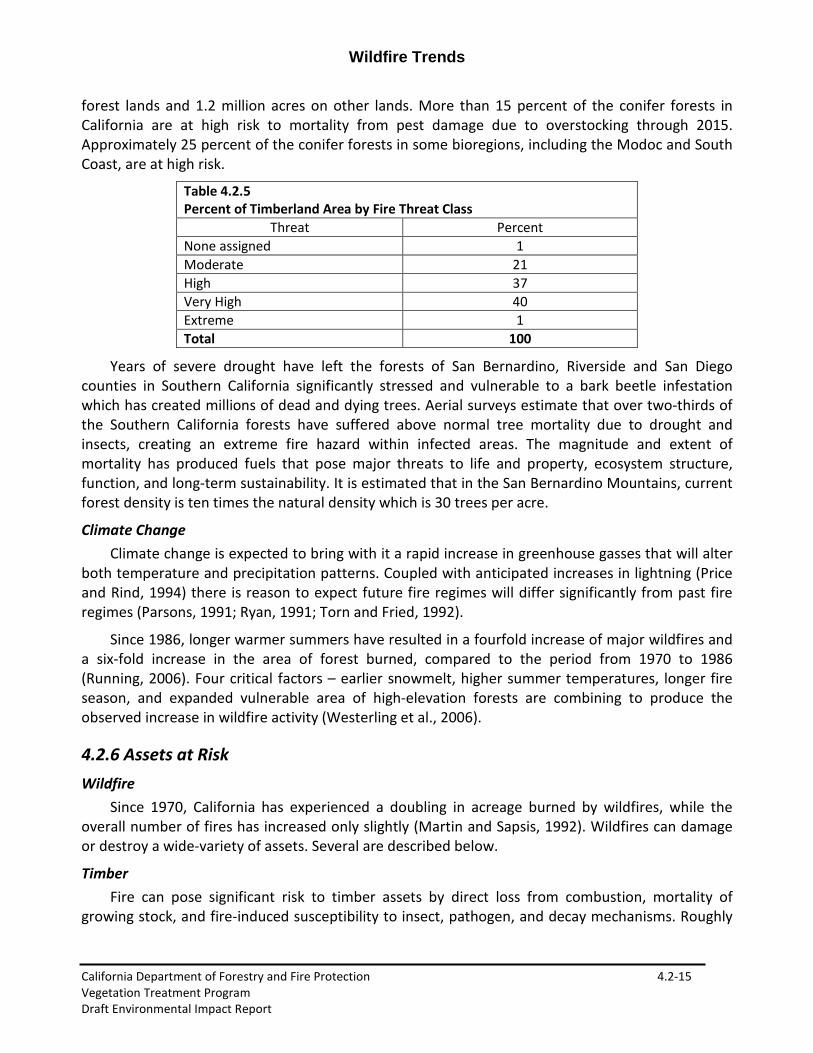
forest lands and 1.2 million acres on other lands. More than 15 percent of the conifer forests in California are at high risk to mortality from pest damage due to overstocking through 2015. Approximately 25 percent of the conifer forests in some bioregions, including the Modoc and South Coast, are at high risk.
Table 4.2.5 Percent of Timberland Area by Fire Threat Class
Threat Percent None assigned 1 Moderate 21 High 37 Very High 40 Extreme 1 Total 100
Years of severe drought have left the forests of San Bernardino, Riverside and San Diego counties in Southern California significantly stressed and vulnerable to a bark beetle infestation which has created millions of dead and dying trees. Aerial surveys estimate that over two-thirds of the Southern California forests have suffered above normal tree mortality due to drought and insects, creating an extreme fire hazard within infected areas. The magnitude and extent of mortality has produced fuels that pose major threats to life and property, ecosystem structure, function, and long-term sustainability. It is estimated that in the San Bernardino Mountains, current forest density is ten times the natural density which is 30 trees per acre.
Climate Change Climate change is expected to bring with it a rapid increase in greenhouse gasses that will alter
both temperature and precipitation patterns. Coupled with anticipated increases in lightning (Price and Rind, 1994) there is reason to expect future fire regimes will differ significantly from past fire regimes (Parsons, 1991; Ryan, 1991; Torn and Fried, 1992).
Since 1986, longer warmer summers have resulted in a fourfold increase of major wildfires and a six-fold increase in the area of forest burned, compared to the period from 1970 to 1986 (Running, 2006). Four critical factors – earlier snowmelt, higher summer temperatures, longer fire season, and expanded vulnerable area of high-elevation forests are combining to produce the observed increase in wildfire activity (Westerling et al., 2006).
4.2.6 Assets at Risk Wildfire
Since 1970, California has experienced a doubling in acreage burned by wildfires, while the overall number of fires has increased only slightly (Martin and Sapsis, 1992). Wildfires can damage or destroy a wide-variety of assets. Several are described below.
Timber Fire can pose significant risk to timber assets by direct loss from combustion, mortality of
growing stock, and fire-induced susceptibility to insect, pathogen, and decay mechanisms. Roughly
Wildfire Trends
California Department of Forestry and Fire Protection 4.2-16 Vegetation Treatment Program Draft Environmental Impact Report
three quarters of California’s timberlands and two-thirds of its woodlands are in conditions that support High to Extreme Fire Threat.
Acres of timber burned vary greatly by year. Historic highs have reached over 125,000 acres on CAL FIRE jurisdiction with the highest burned acreage statewide in the last decade at just over 167,000 in 2008. Values lost also differ greatly. Losses can include mature and immature timber and related forest products.
Range Range forage is an important economic resource to the ranchers of California. Within California,
rangeland crosses a wide spectrum of vegetation cover types, from desert, to annual grasslands, to chaparral, to oak woodlands, to conifer forest. Of this area, an estimated 30,000,000 acres are actually grazed.
Fire can impose significant, short-term losses of forage when standing crops or fences are consumed by fire. Of the $138 million dollars of value ascribed to rangeland forage annually, a total of $2.5 million is estimated to be lost due to wildfire (CAL FIRE, 2003). The magnitude of the economic impact to the landowner depends upon the land’s carrying capacity, whether the land is being grazed, the time of year at which the fire occurs, the amount of the year’s forage already grazed, and the intensity of the fire.
Soil With the increased intensity of fire, comes the risk of hydrophobicity and soil erosion. Fires that
burn very hot leave a desolate landscape void of organic matter, vulnerable to erosion and land sliding. Hydrophobicity inhibits water infiltration into the soil, so it washes away, lowering the amount of water available to seeds that germinate on the site. This can result in loss of site productivity, increased surface runoff and peak flows, degradation of stream habitats, and damage to social infrastructure. Large quantities of eroded material works its way into streams and reservoirs, reducing water storage capacity and changing fish and macro-invertebrate habitat.
Roughly 29 million acres (~29%) of California is estimated to support High or Very High levels of surface erosion following wildfire. An additional 35 million acres are estimated to support Moderate levels of surface erosion.
Houses and People A significant and increasing risk from fire is posed to the people and houses in California, as
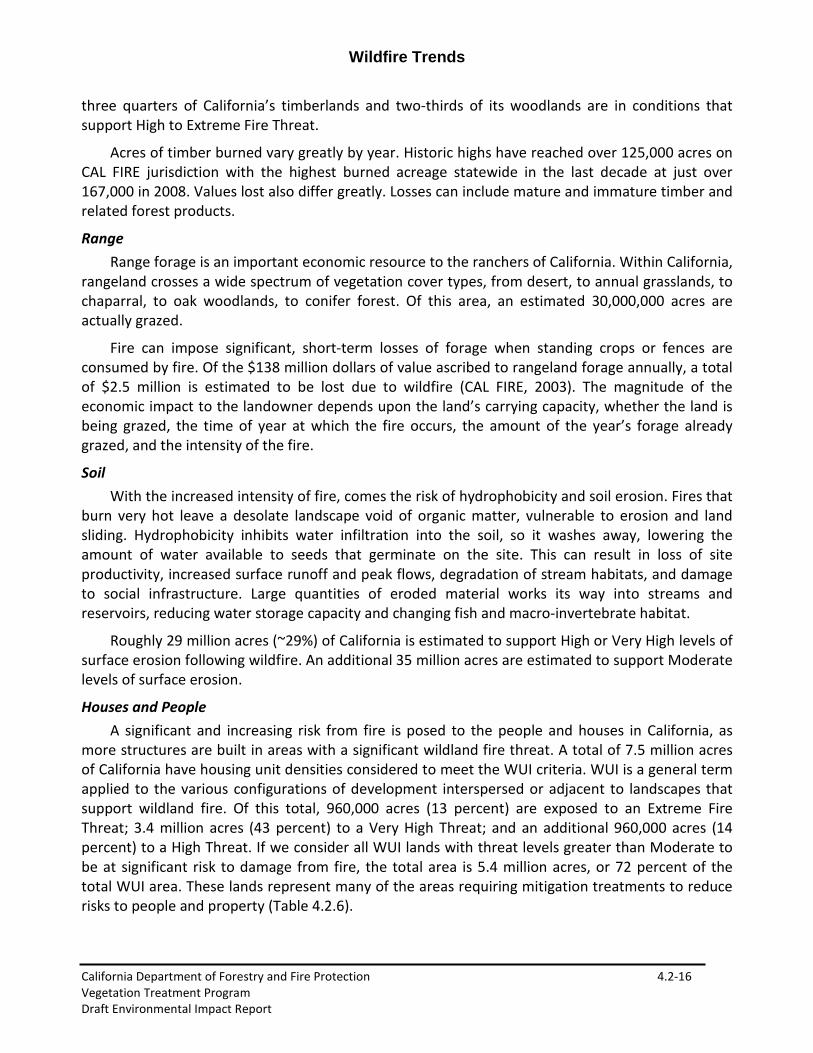
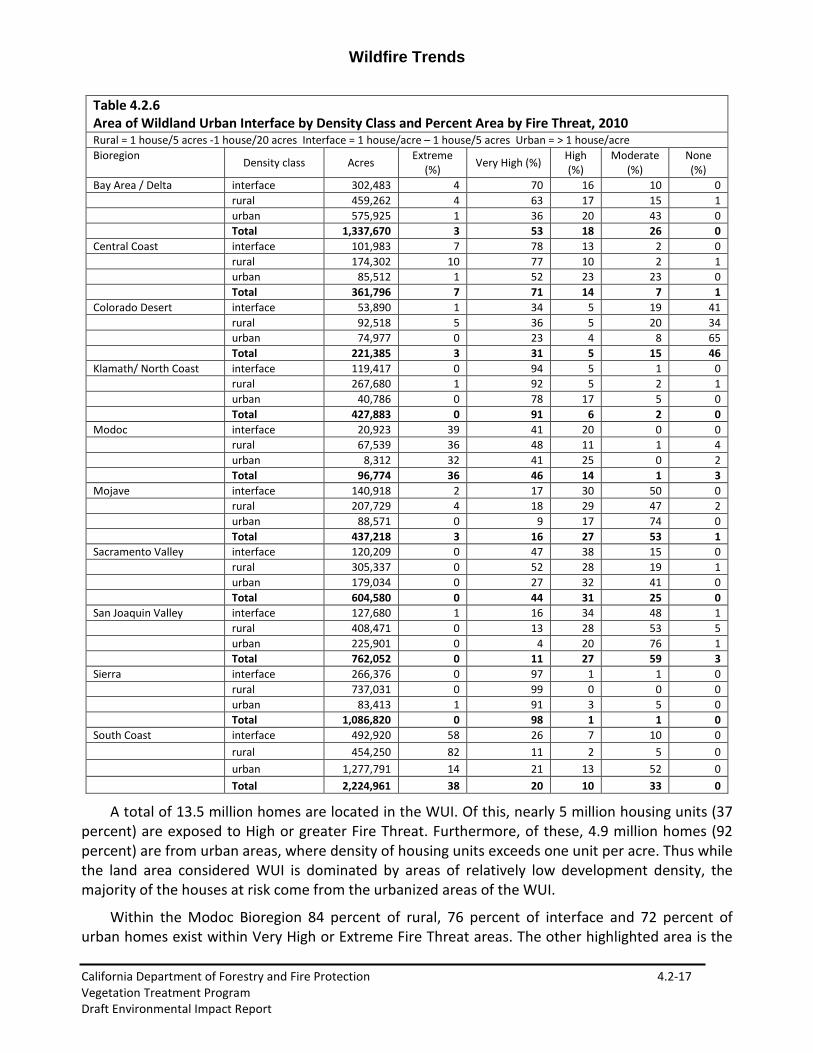
more structures are built in areas with a significant wildland fire threat. A total of 7.5 million acres of California have housing unit densities considered to meet the WUI criteria. WUI is a general term applied to the various configurations of development interspersed or adjacent to landscapes that support wildland fire. Of this total, 960,000 acres (13 percent) are exposed to an Extreme Fire Threat; 3.4 million acres (43 percent) to a Very High Threat; and an additional 960,000 acres (14 percent) to a High Threat. If we consider all WUI lands with threat levels greater than Moderate to be at significant risk to damage from fire, the total area is 5.4 million acres, or 72 percent of the total WUI area. These lands represent many of the areas requiring mitigation treatments to reduce risks to people and property (Table 4.2.6).
Wildfire Trends
California Department of Forestry and Fire Protection 4.2-17 Vegetation Treatment Program Draft Environmental Impact Report
Table 4.2.6 Area of Wildland Urban Interface by Density Class and Percent Area by Fire Threat, 2010 Rural = 1 house/5 acres -1 house/20 acres Interface = 1 house/acre – 1 house/5 acres Urban = > 1 house/acre Bioregion Density class Acres Extreme
(%) Very High (%) High (%)
Moderate (%)
None (%)
Bay Area / Delta interface 302,483 4 70 16 10 0 rural 459,262 4 63 17 15 1 urban 575,925 1 36 20 43 0 Total 1,337,670 3 53 18 26 0 Central Coast interface 101,983 7 78 13 2 0 rural 174,302 10 77 10 2 1 urban 85,512 1 52 23 23 0 Total 361,796 7 71 14 7 1 Colorado Desert interface 53,890 1 34 5 19 41 rural 92,518 5 36 5 20 34 urban 74,977 0 23 4 8 65 Total 221,385 3 31 5 15 46 Klamath/ North Coast interface 119,417 0 94 5 1 0 rural 267,680 1 92 5 2 1 urban 40,786 0 78 17 5 0 Total 427,883 0 91 6 2 0 Modoc interface 20,923 39 41 20 0 0 rural 67,539 36 48 11 1 4 urban 8,312 32 41 25 0 2 Total 96,774 36 46 14 1 3 Mojave interface 140,918 2 17 30 50 0 rural 207,729 4 18 29 47 2 urban 88,571 0 9 17 74 0 Total 437,218 3 16 27 53 1 Sacramento Valley interface 120,209 0 47 38 15 0 rural 305,337 0 52 28 19 1 urban 179,034 0 27 32 41 0 Total 604,580 0 44 31 25 0 San Joaquin Valley interface 127,680 1 16 34 48 1 rural 408,471 0 13 28 53 5 urban 225,901 0 4 20 76 1 Total 762,052 0 11 27 59 3 Sierra interface 266,376 0 97 1 1 0 rural 737,031 0 99 0 0 0 urban 83,413 1 91 3 5 0 Total 1,086,820 0 98 1 1 0 South Coast interface 492,920 58 26 7 10 0 rural 454,250 82 11 2 5 0 urban 1,277,791 14 21 13 52 0 Total 2,224,961 38 20 10 33 0
A total of 13.5 million homes are located in the WUI. Of this, nearly 5 million housing units (37 percent) are exposed to High or greater Fire Threat. Furthermore, of these, 4.9 million homes (92 percent) are from urban areas, where density of housing units exceeds one unit per acre. Thus while the land area considered WUI is dominated by areas of relatively low development density, the majority of the houses at risk come from the urbanized areas of the WUI.
Within the Modoc Bioregion 84 percent of rural, 76 percent of interface and 72 percent of urban homes exist within Very High or Extreme Fire Threat areas. The other highlighted area is the

Wildfire Trends
California Department of Forestry and Fire Protection 4.2-18 Vegetation Treatment Program Draft Environmental Impact Report
South Coast, with 93 percent of rural homes and 81 percent of interface homes falling under Extreme or Very High Fire Threat (Table 4.2.7).
Table 4.2.7 Number of Housing Units in the Wildland Urban Interface by Density Class and Percent of Housing Units by Fire Threat, 2010 Rural = 1 house/5 acres -1 house/20 acres Interface = 1 house/acre – 1 house/5 acres Urban = > 1 house/acre Bioregion
Density class Total houses Houses by Density class
Extreme (%)
Very High (%)
High (%) Moderate (%) None (%)
Bay Area / Delta interface 145,545 5 4 70 15 11 0 rural 46,819 1 4 65 17 13 1 urban 3,011,924 94 0 28 18 53 0 Total 3,204,289 100 1 31 18 51 0 Central Coast interface 45,925 11 6 77 13 3 0 rural 18,129 4 9 78 10 2 1 urban 351,489 85 1 46 23 31 0 Total 415,543 100 2 51 21 26 0 Colorado Desert interface 25,133 9 1 31 5 18 45 rural 9,187 3 5 35 5 20 36 urban 252,694 88 0 22 4 8 67 Total 287,014 100 0 23 4 9 64 Klamath/ North Coast interface 49,450 26 0 0 93 6 1 rural 25,838 14 0 92 5 2 0 urban 115,012 60 0 72 20 8 0 Total 190,300 100 0 80 15 5 0 Modoc interface 8,706 26 34 42 22 0 1 rural 6,097 18 36 48 12 1 3 urban 18,407 55 28 44 24 1 3 Total 33,210 100 31 45 21 1 2 Mojave interface 63,908 19 2 15 27 56 0 rural 22,154 7 4 18 30 46 1 urban 244,048 74 0 8 14 78 0 Total 330,111 100 1 10 18 71 0 Sacramento Valley interface 52,478 7 0 47 38 15 0 rural 28,975 4 0 52 29 18 0 urban 722,323 90 0 20 33 47 0 Total 803,776 100 0 23 33 44 0 San Joaquin Valley interface 58,615 6 1 14 33 51 1 rural 36,955 4 1 14 29 52 4 urban 840,766 90 0 3 19 77 1 Total 936,335 100 0 4 20 75 1 Sierra interface 108,113 28 1 97 1 1 0 rural 73,383 19 0 99 1 0 0 urban 204,070 53 1 86 6 7 0 Total 385,565 100 1 92 4 4 0 South Coast interface 251,921 4 52 29 8 11 0 rural 47,340 1 80 13 2 5 0 urban 6,570,686 96 8 15 12 65 0 Total 6,869,947 100 10 15 12 63 0
As populations within the WUI areas increase, property losses due to wildfires have correspondingly increased, highlighting the need to address high-fire hazards in these areas.
Wildfire Trends
California Department of Forestry and Fire Protection 4.2-19 Vegetation Treatment Program Draft Environmental Impact Report
Annually, 1,446 homes were destroyed by wildfires within CAL FIRE jurisdiction between 2001 and 2005, with a record high of 5,394 structures destroyed in 2003.
4.2.7 Regulatory Environment Federal
After the massive fire season of 2000, the National Fire Plan was established allocating major new levels of funding to deal with fire preparedness and program needs. The Western Governor’s Association then issued the guidance document “A Collaborative Approach for Reducing Wildland Fire risks to Communities and the Environment – 10 Year Comprehensive Strategy Implementation Plan” to complement the implementation of both federal fire policy and the National Fire Plan.
Today, the regulatory environment for fire management on federal lands (suppression, prescribed, and fuels management) is complex. Nine principles (NIFC, 2003) and seventeen policy statements broadly guide federal wildland fire management operations.
A comprehensive Fire Management Plan (FMP) exists for each federal agency which formally documents the fire program based on the Resource Management Plan (L/RMO). The FMP expands strategic direction into specific fire management direction for each fire management unit delineated in the FMP. The FMP provides specific details of the fire program that most efficiently meets fire management direction for the planning period, including: organization, facilities, equipment, activities, timing, locations, and related costs. These documents need to be reviewed and updated annually.
Managing wildland fires for natural resource benefit (formerly known as Wildland Fire Use (WFU)) is an option available to Federal agencies that have an approved land use plan and fire management plan. These plans include predefined areas in which naturally ignited wildland fires accomplish specific pre-stated resource management objectives. These fires are managed in the same manner as wildfires; receiving management attention and policies and with the exception of specific differences related to ignition sources and management action success.
Prescribed fires contain measurable objectives, a predetermined prescription, and an escape fire plan. Land managers must obtain approval of prescribed fire plans from applicable federal or state agencies before conducting planned burns. In addition, all applicable requirements under the National Environmental Policy Act (NEPA) must be met on federal lands. Before federal land management activities (i.e., trail building, timber harvesting, use of fire, etc.) are conducted, NEPA requires that the environmental impacts of these activities be analyzed to assess their impacts on cultural resources, wetlands, soil, water quality, air quality, visibility, and other resources.
Healthy Forests Restoration Act
The Healthy Forests Restoration Act (HFRA) of 2003 (P.L. 108-148) contains a variety of provisions to expedite hazardous-fuel reduction and forest-restoration projects on specific types of Federal land that are at risk of wildland fire or insect and disease epidemics. The act helps rural communities, States, Tribes, and landowners restore healthy forest and rangeland conditions on State, Tribal, and private lands.
Wildfire Trends
California Department of Forestry and Fire Protection 4.2-20 Vegetation Treatment Program Draft Environmental Impact Report
Title I provides authorities for expedited vegetation treatments on certain types of NFS and BLM lands that are at risk of wildland fire; have experienced wind throw, blowdown, or ice-storm damage; are currently experiencing disease or insect epidemics; or are at imminent risk of such epidemics because of conditions on adjacent land.
If land falls within the WUI or Condition Class 2 or 3, the HFRA allows hazardous fuel reduction activities involving prescribed fire to be excluded from Environmental Analysis (EA) or Environmental Impact Statement (EIS) documentation as long as they do not involve more than 4,500 acres. Activities using mechanical methods for crushing, piling, thinning, pruning, cutting, chipping, mulching and mowing can be excluded if they do not include more than 1,000 acres.
Federal-State Contracts
Cooperative efforts via contracts and agreements between state, federal and local agencies are essential in response to emergencies like wildland and structure fires, floods, earthquakes, hazardous material spills, and medical aids and are known as the mutual aid system. This system provides economical fire protection to scattered and intermingled parcels of SRA land found within and adjacent to National Forest or other federal ownership boundaries, PRC 4141 allows the Department to contract with the U.S. Forest Service, Bureau of Land Management, Bureau of Indian Affairs, National Park Service and the Bureau of Reclamation to protect these lands. CAL FIRE is a partner in the statewide system and responds to requests for assistance from other fire agencies if personnel and equipment are available. The plan for protection of these lands is included in the California Fire Plan.
State
Fire Planning
Sections 4114 and 4130 of the Public Resources Code require that the Director prepare a plan for a fire protection system for SRA for approval by the Board of Forestry. The Board has adopted policy that balances integration of prevention, detection, ground and air attack forces, and fire modification efforts to provide guidance in the preparation, maintenance, and modification of the fire protection plan.
Consistent with PRC 4131, the Board has adopted the finding that the most effective long-term method of reducing conflagration threat, damage to natural resources, and life and property is a program of fire environment modification. Fire environment modification includes programs of fuel reduction, installation of fire defense improvements, and fire safety control of life and property exposures. The intent is to provide built-in fire protection to minimize conflagration potentials, to enable the initial attack forces to control a greater number of fire starts at a smaller size class, and to reduce the fire threat and damage potential to intermingled life and property exposures.
The two most prominent enforcement codes for fuel reduction and prevention are PRC 4291 and 4293. PRC 4291 mandates removal of all brush, flammable vegetation, or combustible growth that is located within 100 feet from the building or structure or to the property line. PRC 4293 requires clearance of 4 feet around any transmission line operating at 2,400 or more volts, 6 feet around any line operating at 72,000 or more volts, and 10 feet clearance around any line operating at 110,000 or more volts.
Wildfire Trends
California Department of Forestry and Fire Protection 4.2-21 Vegetation Treatment Program Draft Environmental Impact Report
2010 Strategic California Fire Plan
The State Board of Forestry (Board) and the CAL FIRE have drafted a comprehensive update of the fire plan for wildland fire protection in California. As the first statewide fire plan developed in concert between the Board and CAL FIRE, the 2010 Strategic Fire Plan (Plan) is a strikingly different fire plan than those developed in the past. The Board consulted a group of outside experts to complete a needs assessment and subsequently formed the Fire Plan Steering Committee. The Committee worked for over a year preparing a document (http://cdfdata.fire.ca.gov/fire_er/ fpp_planning_cafireplan) and it is believed that these efforts will lead to communities doing the best work for fuels reduction and fire safety. This Plan recognizes that fire will occur in California and works to answer the question of “How do we utilize and live with that inevitability of wildfire?”
The vision of the Plan is, “a natural environment that is more resilient and man-made assets which are more resistant to the occurrence and effects of wildland fire through local, state, federal and private partnerships."
Within the Plan, a great deal of planning and collaboration can be found in the goals and objectives. It is written so that each goal builds upon the previous one. Over time, each supporting objective will have measurement criteria to evaluate accomplishments and related effectiveness.
Goals as Summarized
The central goals critical to reducing and preventing the impacts of fire revolve around both suppression efforts and fire prevention efforts. Major components are:
• Improved availability and use of information on hazard and risk assessment • Land use planning: including general plans, new development, and existing
developments • Shared vision among communities and the multiple fire protection jurisdictions, including
county-based plans and community-based plans such as Community Wildfire Protection Plans (CWPP)
• Establishing fire resistance in assets at risk, such as homes and neighborhoods • Shared vision among multiple fire protection jurisdictions and agencies • Levels of fire suppression and related services • Post fire recovery
Unit Fire Plans
Individual CAL FIRE Unit Fire Management Plans document assessments of the fire situation within each of CAL FIRE's 21 Units and six contract counties. The plans include stakeholder contributions and priorities, and identify strategic areas for pre-fire planning and fuel treatment as defined by the people who live and work with the local fire problem. Each Unit plan is available at (http://cdfdata.fire.ca.gov/ fire_er/fpp_planning_plans).
Each Operational Unit varies greatly in size, terrain, and fire environment characteristics, and to some degree fire suppression operations. For this reason, individual Unit Fire Plans are completed annually to address how each Unit is achieving the goals and objectives of the Plan for California. To simplify the process for annual updates, a Unit Fire Plan Template has been created. This template will allow for the inclusion of minor updates in addendums to the existing plan. Major changes in
Wildfire Trends
California Department of Forestry and Fire Protection 4.2-22 Vegetation Treatment Program Draft Environmental Impact Report
Unit priorities, partnerships, projects, or plan components may require a new Unit Fire Plan to be submitted.
Each Unit Fire Plan is comprised of five sections and three required appendices. Vegetation treatment is specifically addressed in sections IV: Pre-Fire Management Strategies and Appendix A: High Priority Pre-Fire Projects.
Appendix A: High Priority Pre-Fire Projects. This section is where the Units list the high priority pre-fire projects which include but are not limited to:
• Reduction of available wildland fuels, particularly adjacent to identified Assets and Risk and primary access/egress routes
• Increased public awareness and education relative to wildland fire threat and defensible space
• Intensified property inspections (PRC 4291) and development of target areas • Community chipping and disposal programs • Cooperative federal and state defensible fuel zones / shaded fuel break projects to protect
at risk communities • Removal of ladder fuels to reduce crowning potential and improve forest health • Removal of dead or dying trees from insect or disease emergencies • Maintenance of ecological communities through prescribed fire • Prescribed fire for grazing land improvement, prairie retention and Native American cultural
tradition • Prescribed fire for wildlife habitat improvement
Vegetation Management Program
The Vegetation Management Program (VMP) provides CAL FIRE the authority to cooperatively treat vegetation and fuels on private lands. A variety of methods, including both prescribed fire and mechanical means are allowed. The current Vegetation Management Program (VMP) is the continuation of the Range Improvement Program that existed in California from the 1950’s to the 1970’s. The Range Improvement Program was carried out by cooperative groups of ranchers who would band together to conduct prescribed burns primarily for range improvement objectives. These cooperatives had the equipment and expertise to conduct burn projects with limited to no assistance from fire agencies. These groups continued until the mid-to late-1970’s. At this time, liability issues, available cooperators and air quality restrictions all came together to essentially stop all non-governmental range improvement burning. This led to the passage of Senate Bill 1704. This bill authorized CAL FIRE to assume the liability and project implementation for prescribed burns on private property and thus created the Vegetation Management Program that is utilized by CAL FIRE today. The program became operational with the adoption of the Final Environmental Impact Report for the Chaparral Management Program on May 18, 1981 (CAL FIRE, FKU Fireplan, 2005).
Implementation of VMP projects is by CAL FIRE Units. The projects which fit within a Unit's priority areas (e.g., those identified through the Fire Plan) and are considered to be of most value to the Unit, are those that will be completed. The VMP has been in existence since 1982 and has averaged approximately 28,000 acres per year since its inception.
Wildfire Trends
California Department of Forestry and Fire Protection 4.2-23 Vegetation Treatment Program Draft Environmental Impact Report
Proposition 40
CAL FIRE is implementing of a fuels reduction program funded by Proposition 40, the California Clean Water, Clean Air, Safe Neighborhood Parks, and Coastal Protection Act of 2002. The goal of the CAL FIRE Prop 40 Fuels Reduction Program is to reduce wildland fuel loadings that pose a threat to watershed resources and water quality on non-federal lands in 15 Sierra Nevada counties (Butte, Plumas, Sierra, Yuba, Nevada, Placer, El Dorado, Amador, Alpine, Calaveras, Tuolumne, Madera, Mariposa, Fresno, and Tulare). CAL FIRE is currently implementing the Prop 40 Program through four programs: Watershed and Fuels Community Assistance Grants Program Guidance, Vegetation Management Program (VMP), and California Forest Improvement Program (CFIP), and the Fuels Management Program.
The goal of the CAL FIRE Prop-40 Fuels Reduction Program is to reduce wildland fuel loadings that pose a threat to watershed resources and water quality. Funds are allocated for planning, administrative costs, and implementation of forest land and fuels management projects that protect watersheds from catastrophic wildfire, thereby improving water quality, protecting habitat and fisheries, and controlling erosion and sedimentation in the Sierra Nevada region.
State-Local
PRC 4129-4135 provides that a county may assume the responsibility for protection of SRA within the county. Counties assuming this responsibility pursuant to The Board policy found in Title 14, California Code of Regulations (14CCR), are known as “Contract Counties”.
Section 4142 of the PRC provides the authority for the State to enter into cooperative agreements “for the purpose of preventing and suppressing forest fires or other fires in any lands within any county, city or district which makes an appropriation for such purpose”. Section 55640 of the Government Code states that Local government has the authority to provide fire protection in Local Responsibility Areas (LRA) and may provide protection to structure and improvements in SRA.
County and Local Government
Numerous counties have fuel reduction ordinances. After the 2003 fire season, San Diego County strengthened its brush management program to reduce fire risk. The City’s Municipal Code regulates brush management and creates two Brush Management Zones with different requirements. Zone 1(65 feet from structure) must be irrigated regularly, must consist of mostly ornamental fire-resistant vegetation, trees and shrubs must be pruned away from structures and roofs, all wooden structures in zones 1 and 2 must have 1-hour fire resistance rating. Zone 2 (65 feet from structure) can have no permanent irrigation, and must be thinned and pruned vegetation. Enforcement is accomplished by declaring the presence of combustible vegetation, dead, dying or diseased trees, green waste, rubbish, and other materials as a public nuisance and proceeds to abatement.
Orange County uses their weed abatement program to educate and enforce the law as stated in Sections 14875-14922 of the California Health & Safety Code. The vegetation abatement programs focused on the removal of hazardous vegetation, as well as the consistent use and maintenance of fuel and fire breaks to create a more resistant community against wildfire.
Wildfire Trends
California Department of Forestry and Fire Protection 4.2-24 Vegetation Treatment Program Draft Environmental Impact Report
Weed Abatement
Weed abatement is used in many city codes as an implementation mechanism for fuel clearance. For example, the Roseville Fire Department manages a proactive program. Each spring the Fire Department notifies the owners of vacant parcels requiring proper fuelbreaks. If property owners do not comply, the fire department contracts out the weed abatement requirements and bills the property owner.
Fire-level benefits
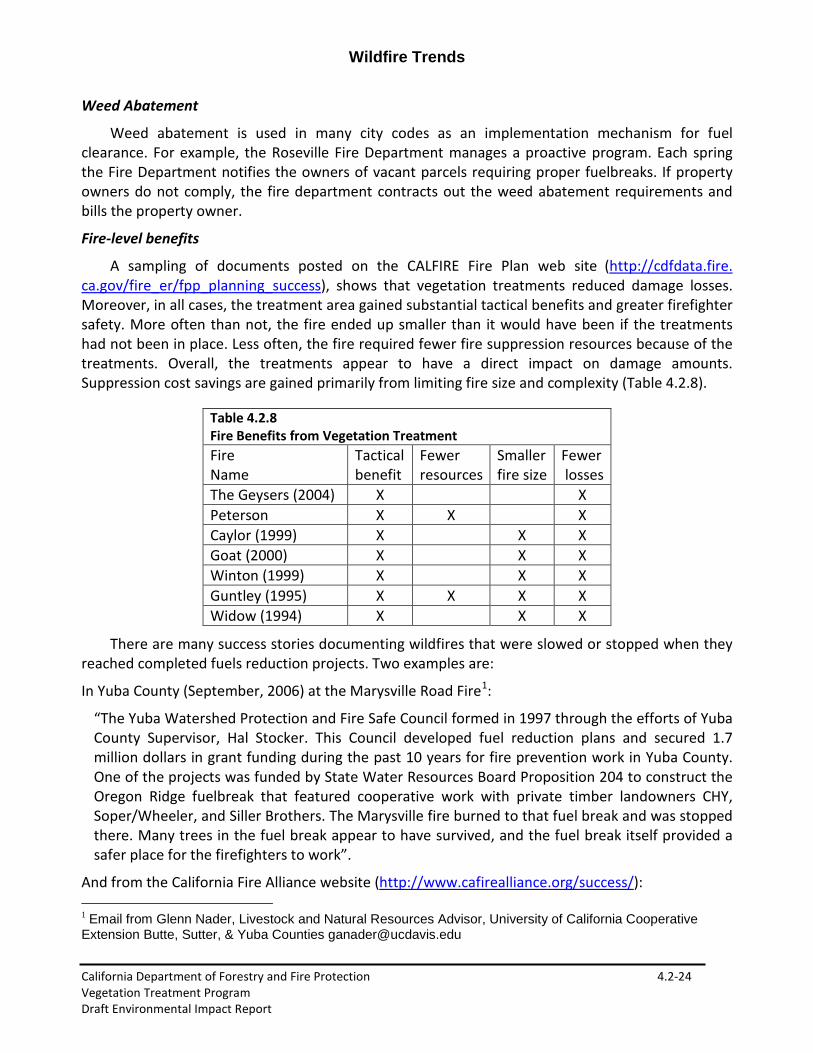
A sampling of documents posted on the CALFIRE Fire Plan web site (http://cdfdata.fire. ca.gov/fire_er/fpp_planning_success), shows that vegetation treatments reduced damage losses. Moreover, in all cases, the treatment area gained substantial tactical benefits and greater firefighter safety. More often than not, the fire ended up smaller than it would have been if the treatments had not been in place. Less often, the fire required fewer fire suppression resources because of the treatments. Overall, the treatments appear to have a direct impact on damage amounts. Suppression cost savings are gained primarily from limiting fire size and complexity (Table 4.2.8).
Table 4.2.8 Fire Benefits from Vegetation Treatment Fire Name
Tactical benefit
Fewer resources
Smaller fire size
Fewer losses
The Geysers (2004) X X Peterson X X X Caylor (1999) X X X Goat (2000) X X X Winton (1999) X X X Guntley (1995) X X X X Widow (1994) X X X
There are many success stories documenting wildfires that were slowed or stopped when they reached completed fuels reduction projects. Two examples are:
In Yuba County (September, 2006) at the Marysville Road Fire1:
“The Yuba Watershed Protection and Fire Safe Council formed in 1997 through the efforts of Yuba County Supervisor, Hal Stocker. This Council developed fuel reduction plans and secured 1.7 million dollars in grant funding during the past 10 years for fire prevention work in Yuba County. One of the projects was funded by State Water Resources Board Proposition 204 to construct the Oregon Ridge fuelbreak that featured cooperative work with private timber landowners CHY, Soper/Wheeler, and Siller Brothers. The Marysville fire burned to that fuel break and was stopped there. Many trees in the fuel break appear to have survived, and the fuel break itself provided a safer place for the firefighters to work”.
And from the California Fire Alliance website (http://www.cafirealliance.org/success/): 1 Email from Glenn Nader, Livestock and Natural Resources Advisor, University of California Cooperative Extension Butte, Sutter, & Yuba Counties [email protected]
Wildfire Trends
California Department of Forestry and Fire Protection 4.2-25 Vegetation Treatment Program Draft Environmental Impact Report
“The community of Gasquet, nestled in the heart of the Smith River National Recreation Area, Six Rivers National Forest, has been identified as a community at risk. Fuels reduction activities have been implemented to protect this community, beginning in the spring of 1996 [after] the Gasquet Shaded Fuelbreak was burned. This prescribed fire targeted smaller branches, twigs and needles that contribute to fire spread. The reduction in fuels proved to be critical when, in September 1996, the Panther Fire threatened Gasquet. The Panther Fire, pushed by a strong east wind, almost forced evacuations of the community. When the fire burned into an area that had received prescribed fire treatment the year before, fire behavior moderated, allowing fire crews to contain the advancing fire front. No structures were lost or damaged”.
4.2.8 Highly Sensitive Ecological and Urban Interface Area Drought related stresses in the 1980's and early 1990's led to the death of large numbers of
forest trees in the Lake Tahoe Basin. This raised concerns over wildfire threats to people, structures, habitat, water quality and forest resources. Fuels reduction work commenced in 1987, but grew substantially under the 1997 Presidential Commitments, and the 2000 Tahoe Restoration Act. In 2005, funding transferred to the Tahoe Amendment of the Southern Nevada Public Lands Management Act. There are about 165,000 acres in the Management Unit. Since 2000, 4,786 acres have been partially treated, 16,634 acres have been completely treated and there are plans for the treatment of 26,875 more acres (personal communication Kurt Tuber 6-28-2011). Depending on site conditions, treatments usually use hand and mechanical treatments, often followed by prescribed fire or chipping and mastication. Of this, direct project costs averaged $1,500/acre.
In addition, under the Santini-Burton Act of 1980 (Public Law 96-586), the federal government has obtained over 3,500 parcels, differing in size from a fraction of an acre to several hundred acres. These lands are managed by the Forest Service for their watershed and other environmental values. Of these acquired parcels, approximately 930 parcels (1,800 acres) remain that require some level of fuels reduction treatment. (http://www.fs.fed.us/r5/ltbmu/about/urban-lots/ULM_Fuels_Reduction_Brief_0306.pdf)
Conducting a fuel reduction program is exceedingly complex. Lake Tahoe is a very sensitive environmental resource and there are multiple agencies with many regulations. In 2007, a catastrophic fire tested the effectiveness of the treatments. The Angora fire burned 3071 acres of forest and urban interface, destroying 254 homes and costing $160 million dollars. The fuel treatments generally worked as designed, significantly changing the fire behavior and subsequent fire effects to the vegetation (Safford, et. al., 2009). Crown fire became surface fire within 50m of entering a treatment and trees had higher survival rates in those areas (Safford, et. al., 2009). The disastrous fire led to the Emergency California-Nevada Tahoe Basin Fire Commission and its report in May of 2008. After a complete review of laws, policies, practices and the many natural and human factors that make the basin susceptible to wildfire and its negative impacts, 48 findings were generated. The findings serve as a plan to reduce said wildfires and negative impacts in the future.
Project-level costs
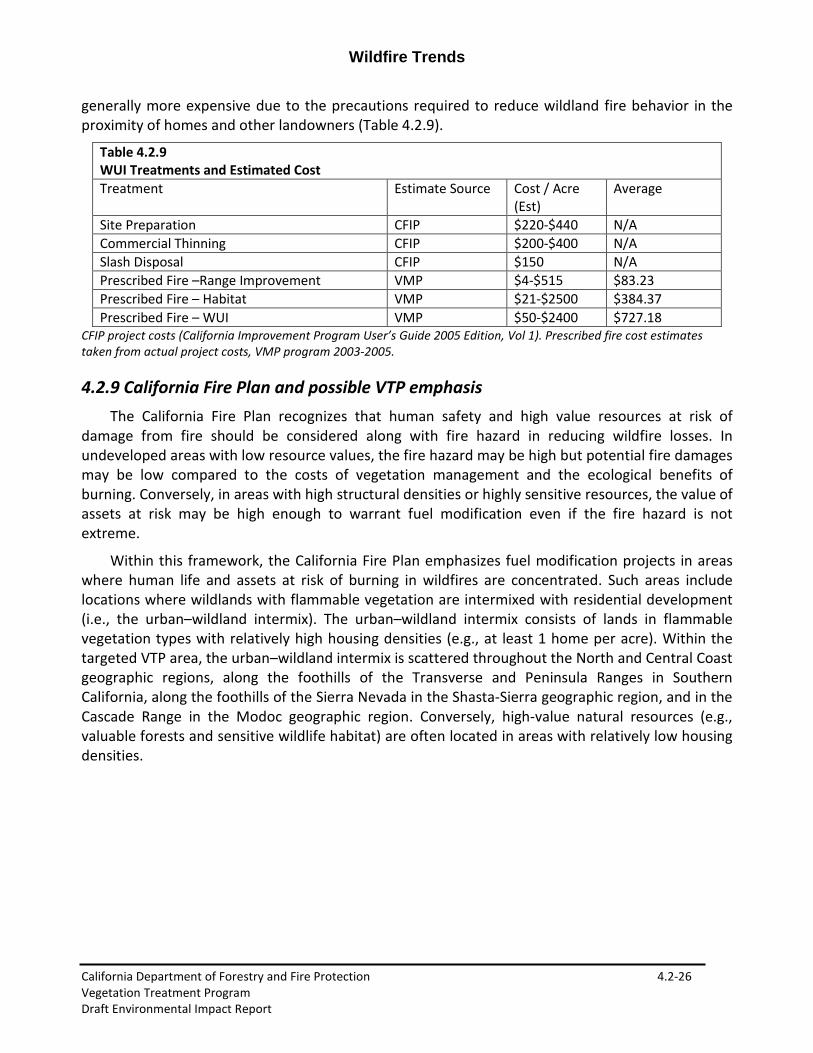
Project level costs are highly variable and depend greatly on the site conditions and practices. In general, the cost per acre decreases as the number of acres treated increases. WUI projects are
Wildfire Trends
California Department of Forestry and Fire Protection 4.2-26 Vegetation Treatment Program Draft Environmental Impact Report
generally more expensive due to the precautions required to reduce wildland fire behavior in the proximity of homes and other landowners (Table 4.2.9).
Table 4.2.9 WUI Treatments and Estimated Cost Treatment Estimate Source Cost / Acre
(Est) Average
Site Preparation CFIP $220-$440 N/A Commercial Thinning CFIP $200-$400 N/A Slash Disposal CFIP $150 N/A Prescribed Fire –Range Improvement VMP $4-$515 $83.23 Prescribed Fire – Habitat VMP $21-$2500 $384.37 Prescribed Fire – WUI VMP $50-$2400 $727.18
CFIP project costs (California Improvement Program User’s Guide 2005 Edition, Vol 1). Prescribed fire cost estimates taken from actual project costs, VMP program 2003-2005.
4.2.9 California Fire Plan and possible VTP emphasis The California Fire Plan recognizes that human safety and high value resources at risk of
damage from fire should be considered along with fire hazard in reducing wildfire losses. In undeveloped areas with low resource values, the fire hazard may be high but potential fire damages may be low compared to the costs of vegetation management and the ecological benefits of burning. Conversely, in areas with high structural densities or highly sensitive resources, the value of assets at risk may be high enough to warrant fuel modification even if the fire hazard is not extreme.
Within this framework, the California Fire Plan emphasizes fuel modification projects in areas where human life and assets at risk of burning in wildfires are concentrated. Such areas include locations where wildlands with flammable vegetation are intermixed with residential development (i.e., the urban–wildland intermix). The urban–wildland intermix consists of lands in flammable vegetation types with relatively high housing densities (e.g., at least 1 home per acre). Within the targeted VTP area, the urban–wildland intermix is scattered throughout the North and Central Coast geographic regions, along the foothills of the Transverse and Peninsula Ranges in Southern California, along the foothills of the Sierra Nevada in the Shasta-Sierra geographic region, and in the Cascade Range in the Modoc geographic region. Conversely, high-value natural resources (e.g., valuable forests and sensitive wildlife habitat) are often located in areas with relatively low housing densities.