Embed Size (px)
Citation preview
Nancee 249
International Journal on Arts, Management and Humanities 6(2): 249-261(2017)
ISSN No. (Online): 2319–5231
Consumer Buying Behaviour towards Organised and Unorganised Retail Stores in
Jalandhar and Ludhiana Cities
Dr. Nancee
Assistant Professor, Department of Commerce,
S.C.V.B. Govt. College Palampur, Himachal Pradesh.
(Corresponding author: Dr. Nancee)
(Received 14 September, 2017, Accepted 27 November, 2017)
(Published by Research Trend, Website: www.researchtrend.net)
ABSTRACT: Retail industry is the largest sectors in India and second largest employment provider after
agriculture; it plays a significant role in increasing the productivity across a wide range of goods and services.
In India, both organised and unorganised retail sector exists, majority of the share being under unorganised.
The main purpose of the present study is to identify the various factors which affect the satisfaction level of
consumers in organised and unorganised retail. The sample in the present study consists of 400 respondents,
200 each from Jalandhar and Ludhiana cities of Punjab who visit organised and unorganised retail stores for
shopping. For accomplishing the objectives of the study, both primary and secondary data has been utilized.
The present study is mainly a primary probe and is based on a survey of selected consumers with the help of
interview schedule. Further, secondary data has been also used to accomplish the present study.
Keywords: Consumer Buying Behaviour, Consumer satisfaction, Organized Retail, Unorganized Retail.
I. INTRODUCTION
In India, both organised and unorganised retail sector exists, majority of the share being under unorganised.
Organised retailing has finally emerged from the shadows of unorganised retailing and is contributing significantly
to the growth of Indian retail sector.
According to the survey of Associated Chamber of Commerce, the growth of organised retail is expected
to the extent of 637 billion in 2015. Organised retail industry was initially concentrated in metropolitan cities like
Bangalore, Mumbai, Delhi, Kolkata and they entered small towns to curb rural population. As the expansion of
organised retail outlets was happening in smaller cities and towns, it became imperative to understand the perception
of the customer about the retail service quality, in such smaller towns in comparison with metros where organised
retail outlet across the cities have already been accepted by the customers [1].
The word ‘retail’ is derived from French word retailers which means ‘to cut a price off ’or to break bulk. The
distribution of consumer products begins with the products and ends at the ultimate consumers. Between the
producer and the consumer there are middlemen– the retailer, who links the producers and the ultimate consumers.
A retailer is a person, agent, agency, company, or organization which is instrumental in providing the goods,
merchandise or service to the ultimate consumers. Retailing is defined as a conclusive set of activities or steps used
to sell a product or service to consumer for their personal or family use. It is responsible for matching individual
demand of the consumer with supplies of all manufacturers. In India both organized and unorganized retail exist and
organised retailing has finally emerged from the shadows of unorganised retailing and is contributing significantly to
the growth of Indian retail sector. The retail industry continued in India in the form of Kirana’s till 1980. Soon,
following the modernisation of retail sector in India, many companies started pouring in the retail industry in India like Bombay Dyeing, Grasim etc. As has been mentioned earlier the retail sector inIndia can be widely split into the
organised and unorganised sector. The unorganised sectoris predominant [2].
Philip Kotler “Retailing includes all the activities involved in selling goods or services to the final
consumers for personal or non-business use. A retailer or retail store is any business enterprise whose sale volume
comes primarily from retailing”
North American Industry Classification System (NAICS): “The retail trade sector comprises of
establishments primarily engaged in retailing merchandise, generally without transformation, and rendering services
incidental to the sales of merchandise.” [3].
The person who is involved in retailing is called retailer and his business is called retailed business. Retail
shops, departmental stores, showrooms, and government approved fair priced stores, the canteen stores, the post
office, mobile vendors, multiplexes, and many others are called retailers. Retailing is the last stage in any mode of distribution system. Banking, transportation, telecommunication, cyber marketing, internet, consumer guidance
agencies, etc. facilitate retailing [4].
Following are the key elements (features) of retailing.
• Retail must be ultimate stage of distribution; product must be sold after retailing.
IJA MH
Nancee 250
• Retailing must involve individual dealing or personal dealing between consumer and retailer.
• Products must be sold directly to consumers for their personal or family use.
• Products must be sold in original form, without making any type of change.
• Product must be sold to ultimate users in small quantity.
• Retailing must involve repeat transactions. Retailer sells the same merchandise repeatedly to same group of
consumers.
• All fundamentals of marketing can be applied to retailing, i.e. all marketing decisions can be applied to this
sector.
• Retail trade is carried out by manufacturers, their agents, or by independent organizations.
• Retailing must involve the transfer of ownership or title.
• Successful retailing needs various facilities such as banking, transportation, telecommunication, cyber
marketing, internet, and consumer guidance agencies [5].
It is difficult to explain stages of retail trade. Exact inception of retailing is a difficult state. Retailing is
assumed to be as old as human civilization. However, it has experienced drastic changes during its evolution to
reach today’s position. New forms could improve retailing practices but could not replace old modes of retailing.
For example, emergence of shopping malls cannot replace small retailers. Swapna Pathan considers specific stages
of retail trade evolution [6].
The structure of retail industry in India as follow:
Unorganised Retail Sector: The unorganised retail sector basically includes the local kiranas, hand cart, the
vendors on the pavement etc. This sector constitutes about 98% of the total retail trade. But Foreign Direct
Investment in the retail sector is expected to shrink the employment in the unorganised sector and expand that in the
organised one.
Organised Retail Sector: In the organised sector trading is undertaken by the licensed retailers who have registered
themselves to sales as well as income tax. The organised retail sectors have in their ambit, corporate backed
hypermarkets and retail chains. The private large business enterprises are also included under the organised retail
category [7].
Concept of malls in India: The concept of Retail as entertainment came to India with the advent of malls. Mall
fever has touched every facet of Indian society. Whatever is the income stratum of consumers, malls make no distinction in proffering most-revered national and global brands. Shopping Mall refers to a set of homogenous and
heterogeneous shops adjoining a pedestrian, or an exclusive pedestrian street, that make it easygoing for shopper to
walk from store to store without interference from vehicular traffic. Malls are incorporated with a whole bank of lifts
and escalators for smooth transit of shoppers. Malls are located in proximity to urban outskirts, and ranges from
60,000 sq ft to 70,000 sq ft and above. The future of organised retailing is largely in the hands of mall where the
shoppers get quality, quantity, aspirational appeal, recreation facilities and ambience. Under one roof, the flashy
malls promise just about everything under the sun, from foreign gizmos to the very desi, virtually an airbus full of
national and international brands, to say the least. Malls offer a plethora of attractions- high profile shopping,
impulse eating establishment, a glitzy and glamorous environment to discerning shoppers of more refined tastes, who are more concerned with quality and fashion and less concerned with budgets. Mall reveals six factors namely
comfort, diversity, luxury, mall essence, entertainment, and convenience which are a source of cynosure [8].
Organized VS Unorganized Retailing.
Criteria Organized Retailing Unorganized Retailing
Ownership House Corporate Business Household Business
Size Of Operation Comparatively Large Small Store
Selling Price Less Than MRP MRP
Nature of Employment Hired Members Generally Family Members
Store Ambience Excellent Poor
Location Distantly Located Located Round The Corner
Product Availability
Wide Range of Branded And Non Branded Products.
Selective Range Of Branded And Non Branded Products.
Promotions Joint Promotions Company Promotions Only
Tax Payments
Greater Enforcement of Taxation
Mechanism.
Evasions of Taxes
Market Experience Short Term Long Term
Supply Chain Efficient Inefficient
Range Wide Range of Products Limited Products
Source: Asian Journal of Management Research, Vol. 2, Issue 1, 2011.
Consumer behaviour is the study of individuals, groups, or organizations and the processes they use to select, secure,
and dispose of products, services, experiences, or ideas to satisfy needs and the impacts that these processes have on
the consumer and society.
Nancee 251
Consumer Behaviour. Consumer behaviour is the study of individuals, groups, or organizations and the processes
they use to select, secure, and dispose of products, services, experiences, or ideas to satisfy needs and the impacts
that these processes have on the consumer and society [9].
There are two different kinds of consuming entities: the personal consumer and the organizational
consumer. Personal Consumer buys goods and services for his or her own use, for the use of the household or as a
gift for a friend. The products are bought for final use by individuals, who are referred to as end users or ultimate consumers. Organizational consumers include profit and non-profit businesses, government agencies (local, state,
national) and institutional (e.g. schools, hospitals, and institutions), all of which buy products, equipment, and
services in order to run their organizations [10].
II. MATERIAL AND METHODS
Sampling Element: The study is carried out in Jalandhar and Ludhiana cities of Punjab. The consumers visiting
Organised (Departmental, Hypermarket/Supermarket) Stores and Unorganised (Kirana) Stores in these cities are
taken as target consumers.
Sampling Technique: Purposive, quota and judgement sampling method have been used in the present study. The
populations elements have been selected on the basis of own judgment.
Sample Size: The sample has been composed of 400 consumers, 200 each from Jalandhar and Ludhiana who visit
organised and unorganised retail stores for shopping. Keeping in view availability of various organised retail stores
in these cities.
Sampling Unit: The consumers shopping at different malls and traditional stores are the primary unit of analysis.
The behavior of these consumers is observed and data is collected through questionnaire method.
Tools and techniques of data collection: Secondary Data: In order to get a complete understanding of the marketing concept, its operationalisation and
implication, the secondary data is essential. Therefore, the first step in the research involves collection of secondary
data from all possible sources that directly or indirectly focuses on the theme. Secondary data was collected from
publications, journals, magazines, books, statistical reports, data bases and internet. Secondary data in shape of
literature review is guideline for data analysis, which is also helpful in finding the answer of research question to
value and compare primary data.
Primary Data: Primary data in the form of the response of consumers, which was of immense importance and
backbone of the study, was obtained from consumers with the help of widely used fully structured questionnaire. It has been prepared to get information from the consumers who visit organised and unorganised retail stores for
shopping. They are those consumers who are living in particular cities. In order to study their choice regarding retail
format, factors affecting the satisfaction level of consumers have been taken into consideration.
Analysis and Interpretation of Data: Keeping in view the nature of study, the data collected has been analysed and
interpreted with the help of the following methods:
Mathematical Methods: In the present study, the data collected has been analysed with the help of mathematical
methods such as simple average and percentage methods where needed.
Statistical Methods: Statistical methods provide an indispensable tool for collecting, organizing, analyzing and
interpreting data expressed in numerical terms.
Diagrammatic Methods: In the present study the collected data has been analysed with the help of pie diagrams.
III. RESULTS AND DISCUSSION
Demographic profile of the consumers. Demographics are the quantifiable statistics of a given population. Demographic variables reveal ongoing trends, such as shift in age, gender and income distribution that signal
business opportunities. Demographics are also used to identify the study of quantifiable subsets within a given
population which characterize that population at a specific point in time. Demographic profiling is essentially an
exercise in making generalizations about groups of people. Researcher typically has two objectives in this regard:
first to determine what segments or subgroups exist in the overall population and secondly to create a clear and
complete picture of the characteristics of a typical member of each of segments.
Distribution of Consumers on the basis of Domicile: Domicile is the country that a person treats as their
permanent home, or lives in and has a substantial connection with. Consumer’s preference for retail stores is
influenced by domicile of consumers.
Table 1: Distribution of Consumers on the Basis of Domicile.
City Frequency Percent Valid Percent Cumulative Percent
Ludhiana 200 50.0 50.0 50.0
Jalandhar 200 50.0 50.0 100.0
Total 400 100.0 100.0
Source: Data collected through Questionnaire.
As we know that consumers get influenced by the values, lifestyles and behavior of their society.
Table 1 and figure 1 depicts the distribution of the consumers on the basis of their domicile.
Nancee 252
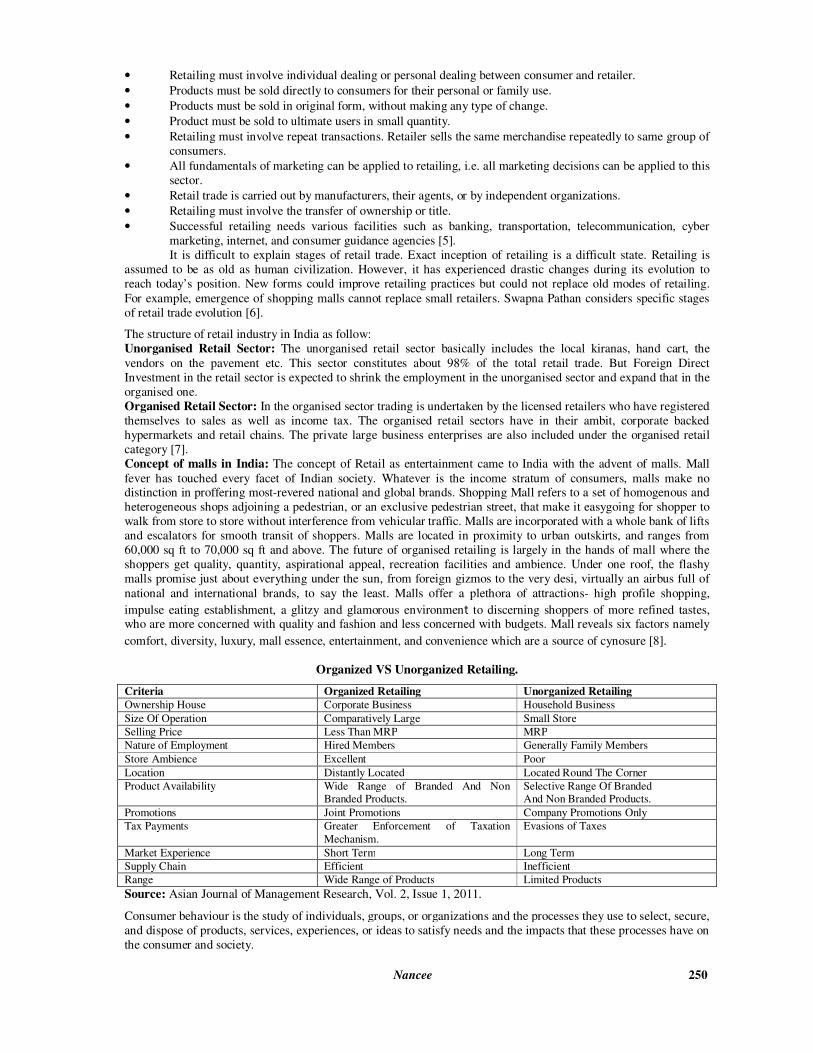
Fig. 1. Distribution of Consumers on the Basis of Domicile.
The above table further shows that, the sample of the present study is composed of 400 consumers, 200 each from
Jalandhar and Ludhiana, who go for shopping in organised and unorganised retail stores.
Gender- Wise Distribution of Consumers: Gender - wise distribution of consumers helps the researcher to classify the population to indicate composition of the
sample under study.
Table 2: Gender-Wise Distribution of Consumers.
Gender Frequency Percent Valid Percent Cumulative Percent
Male 134 33.5 33.5 33.5
Female 266 66.5 66.5 100.0
Total 400 100.0 100.0
Source: Data collected through Questionnaire.
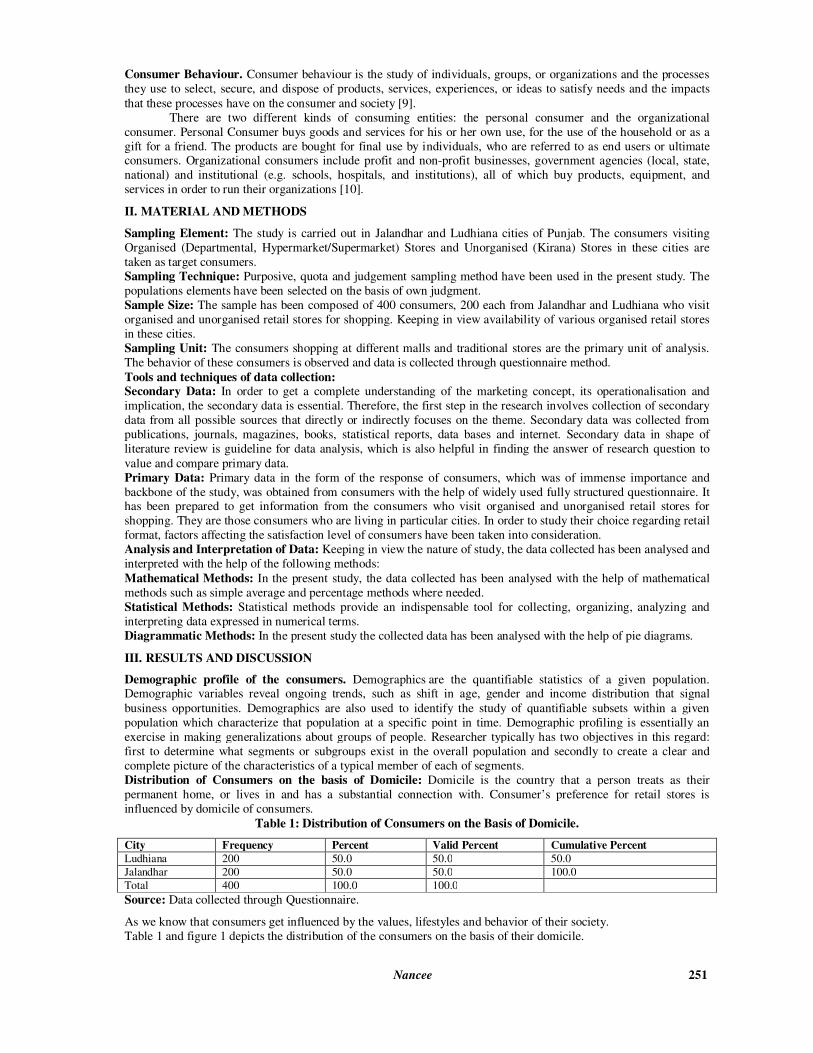
Table 2 and figure 2 shows the gender- wise distribution of consumers. Further, the table reveals that there
are 134 (33.5%) male consumers and 266 (66.5%) female consumers.
Fig. 2. Gender-Wise Distribution of Consumers.
The percentage of female consumers is more as compared to male consumers. Therefore, it can be said that females
go for shopping more as compared to males, as females are more experienced in purchasing the things and are better
aware of their family requirements.
Distribution of Consumers on the basis of Area: Consumer’s preference regarding organised and unorganised stores is affected by the area where the consumer
resides. It is really important for some consumers to visit organized store for shopping, whereas some consumers
like to go for shopping in unorganised stores. In the present study consumers of urban and rural area are taken.
Table 3: Distribution of Consumers on the basis of Area.
Area Frequency Percent Valid Percent Cumulative Percent
Rural 119 29.8 29.8 29.8
Urban 281 70.2 70.2 100.0
Total 400 100.0 100.0
Source: Data collected through Questionnaire.
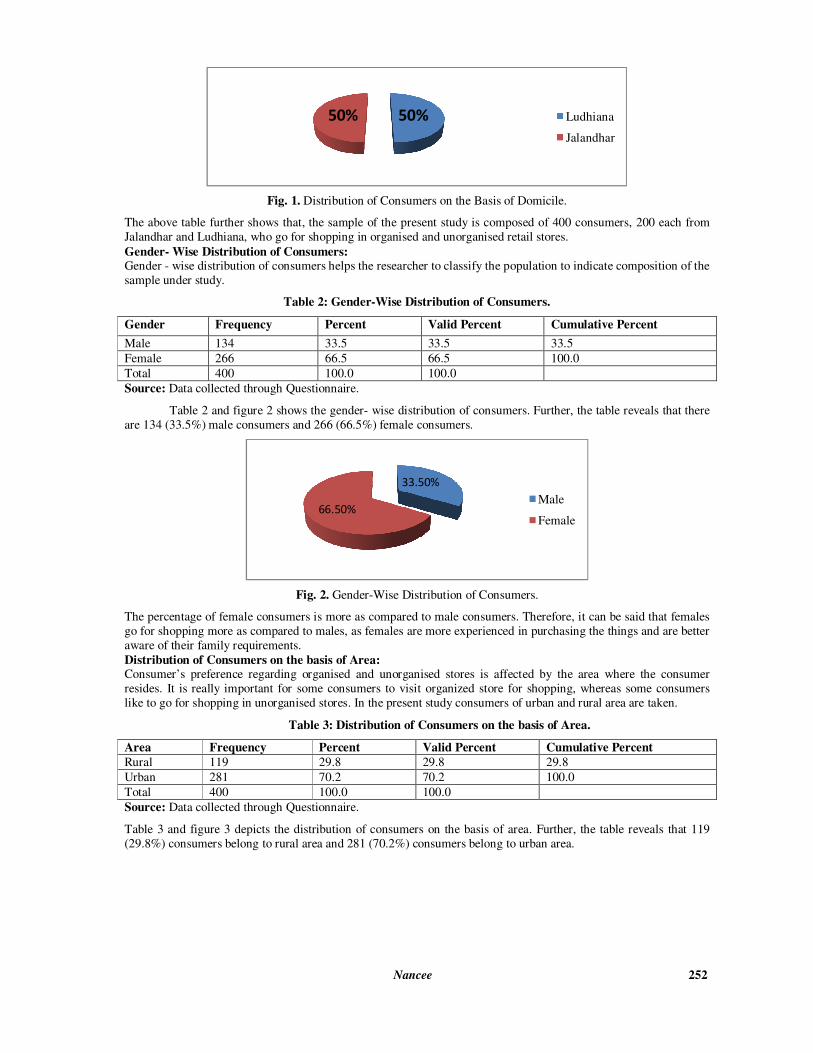
Table 3 and figure 3 depicts the distribution of consumers on the basis of area. Further, the table reveals that 119
(29.8%) consumers belong to rural area and 281 (70.2%) consumers belong to urban area.
50%50% Ludhiana
Jalandhar
33.50%
66.50%Male
Female
Nancee 253
Fig. 3. Distribution of Consumers on the basis of Area.
It shows that, consumers of rural area have a low tendency to go for shopping and consumers who belong to urban
area go for shopping more often.
Age- Wise Distribution of Consumers: Age of consumers play a vital role in selecting store for shopping. Teenager consumers are more interested in
shopping from departmental stores and hypermarkets/supermarkets, whereas middle aged or elder consumers prefer
unorganised retail store for shopping. The sample of the present study is composed of all the age groups.
Table 4: Age -Wise Distribution of Consumers.
Age
(in years)
Frequency Percent Valid Percent Cumulative Percent
18-25 91 22.8 22.8 22.8
26-35 98 24.5 24.5 47.3
36-45 99 24.8 24.8 72.1
46-55 67 16.7 16.7 88.8
Above 55 45 11.2 11.2 100.0
Total 400 100.0 100.0
Source: Data collected through Questionnaire.
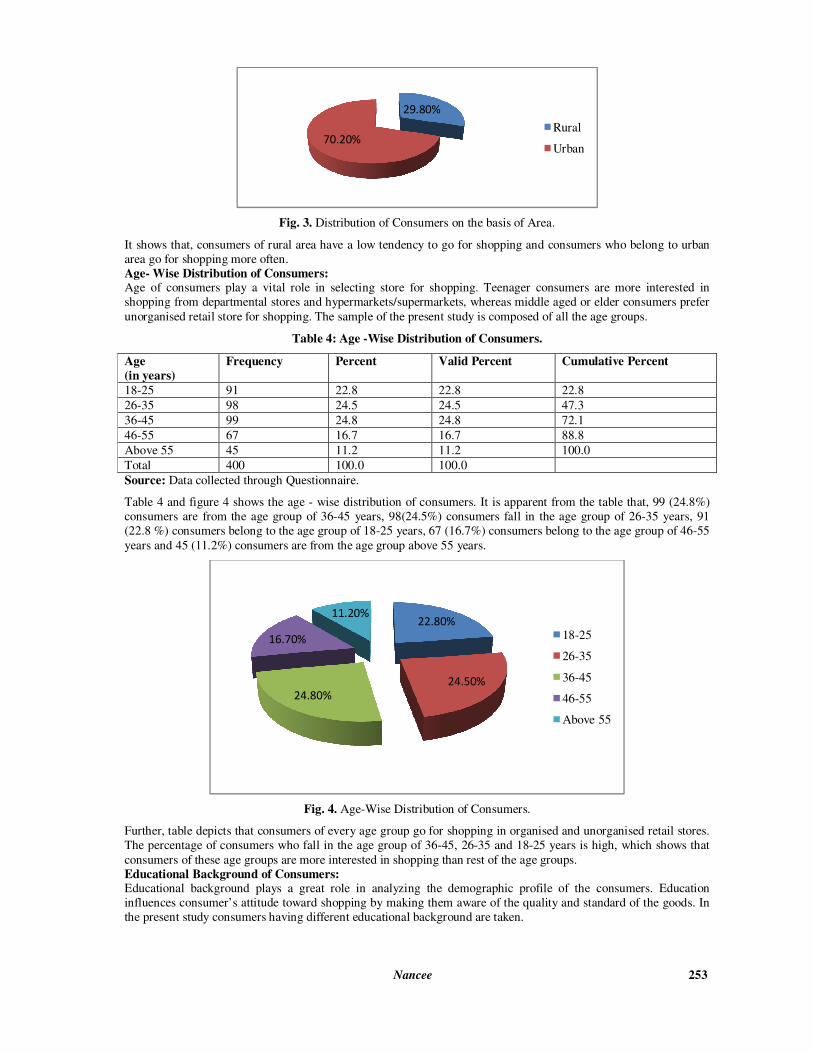
Table 4 and figure 4 shows the age - wise distribution of consumers. It is apparent from the table that, 99 (24.8%)
consumers are from the age group of 36-45 years, 98(24.5%) consumers fall in the age group of 26-35 years, 91
(22.8 %) consumers belong to the age group of 18-25 years, 67 (16.7%) consumers belong to the age group of 46-55
years and 45 (11.2%) consumers are from the age group above 55 years.
Fig. 4. Age-Wise Distribution of Consumers.
Further, table depicts that consumers of every age group go for shopping in organised and unorganised retail stores.
The percentage of consumers who fall in the age group of 36-45, 26-35 and 18-25 years is high, which shows that
consumers of these age groups are more interested in shopping than rest of the age groups.
Educational Background of Consumers: Educational background plays a great role in analyzing the demographic profile of the consumers. Education
influences consumer’s attitude toward shopping by making them aware of the quality and standard of the goods. In
the present study consumers having different educational background are taken.
29.80%
70.20%
Rural
Urban
22.80%
24.50%
24.80%
16.70%
11.20%
18-25
26-35
36-45
46-55
Above 55
Nancee 254
Table 5: Educational Background of Consumers.
Education Frequency Percent Valid
Percent
Cumulative Percent
Up to Intermediate 32 8.0 8.0 8.0
Undergraduate 77 19.2 19.2 27.2
Graduate 160 40.0 40.0 67.2
Post – Graduate or above 88 22.0 22.0 89.2
Other 43 10.8 10.8 100.0
Total 400 100.0 100.0
Source: Data collected through Questionnaire.
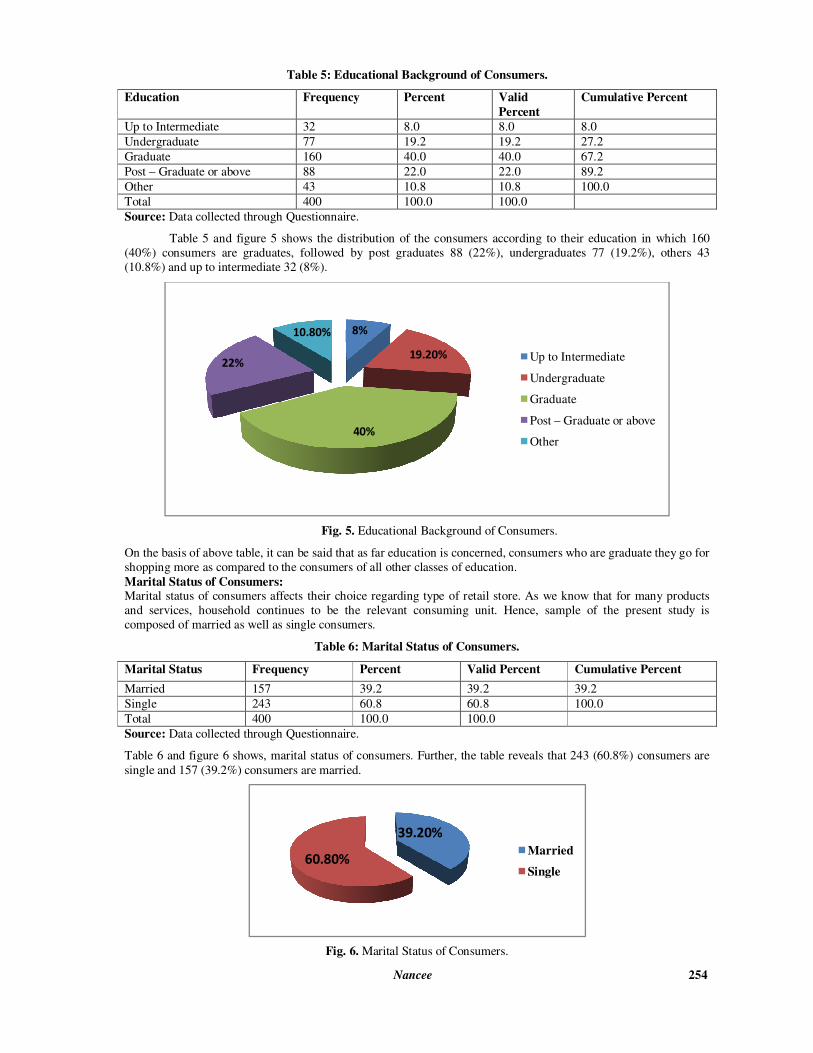
Table 5 and figure 5 shows the distribution of the consumers according to their education in which 160
(40%) consumers are graduates, followed by post graduates 88 (22%), undergraduates 77 (19.2%), others 43
(10.8%) and up to intermediate 32 (8%).
Fig. 5. Educational Background of Consumers.
On the basis of above table, it can be said that as far education is concerned, consumers who are graduate they go for
shopping more as compared to the consumers of all other classes of education.
Marital Status of Consumers: Marital status of consumers affects their choice regarding type of retail store. As we know that for many products
and services, household continues to be the relevant consuming unit. Hence, sample of the present study is
composed of married as well as single consumers.
Table 6: Marital Status of Consumers.
Marital Status Frequency Percent Valid Percent Cumulative Percent
Married 157 39.2 39.2 39.2
Single 243 60.8 60.8 100.0
Total 400 100.0 100.0
Source: Data collected through Questionnaire.
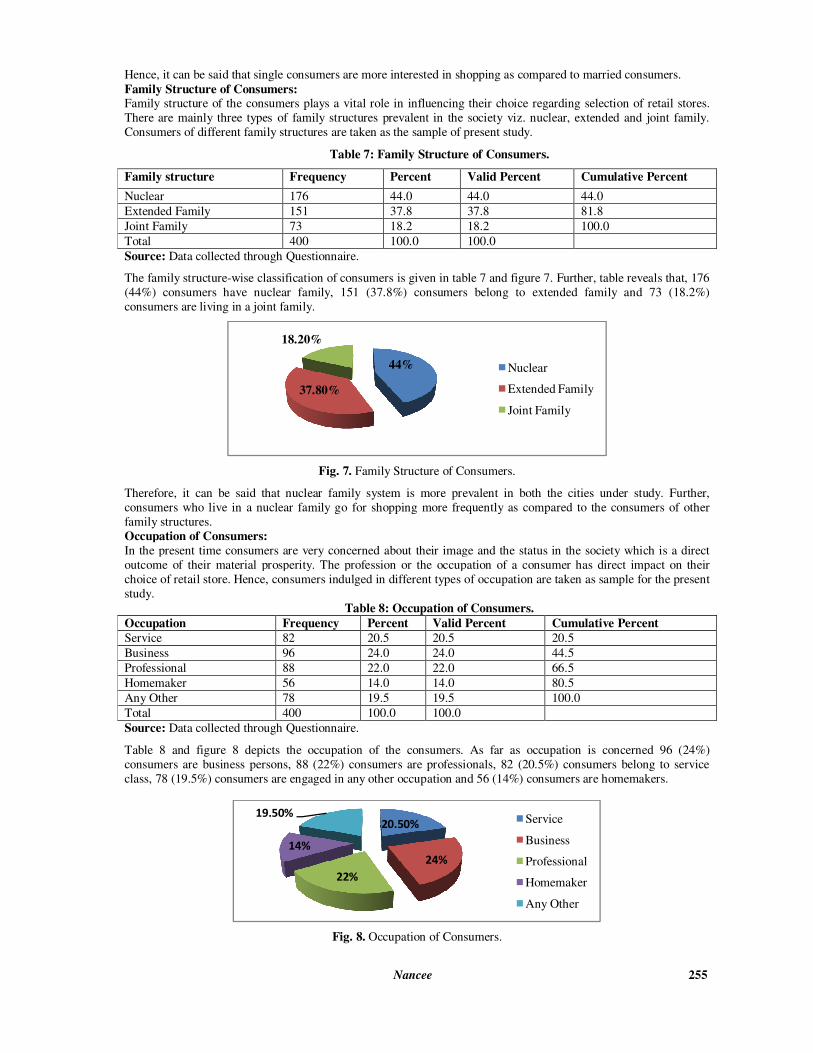
Table 6 and figure 6 shows, marital status of consumers. Further, the table reveals that 243 (60.8%) consumers are
single and 157 (39.2%) consumers are married.
Fig. 6. Marital Status of Consumers.
8%
19.20%
40%
22%
10.80%
Up to Intermediate
Undergraduate
Graduate
Post – Graduate or above
Other
39.20%
60.80%Married
Single
Nancee 255
Hence, it can be said that single consumers are more interested in shopping as compared to married consumers.
Family Structure of Consumers: Family structure of the consumers plays a vital role in influencing their choice regarding selection of retail stores.
There are mainly three types of family structures prevalent in the society viz. nuclear, extended and joint family.
Consumers of different family structures are taken as the sample of present study.
Table 7: Family Structure of Consumers.
Family structure Frequency Percent Valid Percent Cumulative Percent
Nuclear 176 44.0 44.0 44.0
Extended Family 151 37.8 37.8 81.8
Joint Family 73 18.2 18.2 100.0
Total 400 100.0 100.0
Source: Data collected through Questionnaire.
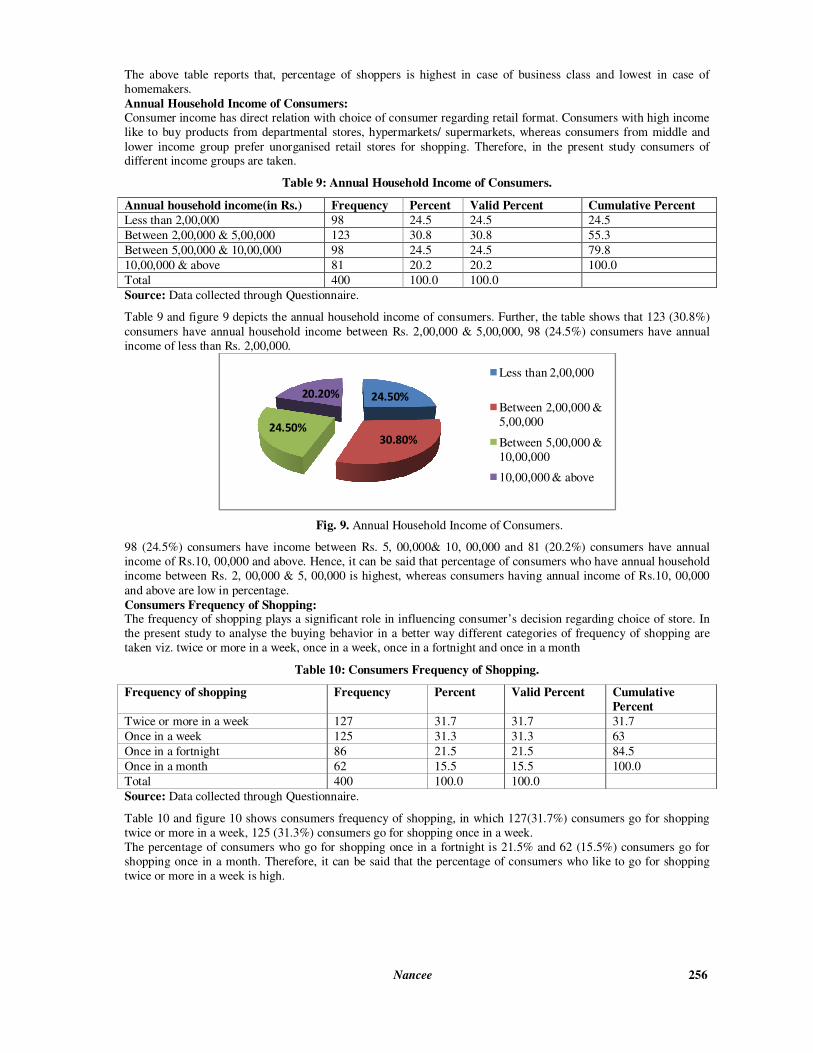
The family structure-wise classification of consumers is given in table 7 and figure 7. Further, table reveals that, 176
(44%) consumers have nuclear family, 151 (37.8%) consumers belong to extended family and 73 (18.2%)
consumers are living in a joint family.
Fig. 7. Family Structure of Consumers.
Therefore, it can be said that nuclear family system is more prevalent in both the cities under study. Further,
consumers who live in a nuclear family go for shopping more frequently as compared to the consumers of other
family structures.
Occupation of Consumers:
In the present time consumers are very concerned about their image and the status in the society which is a direct
outcome of their material prosperity. The profession or the occupation of a consumer has direct impact on their
choice of retail store. Hence, consumers indulged in different types of occupation are taken as sample for the present
study.
Table 8: Occupation of Consumers.
Occupation Frequency Percent Valid Percent Cumulative Percent
Service 82 20.5 20.5 20.5
Business 96 24.0 24.0 44.5
Professional 88 22.0 22.0 66.5
Homemaker 56 14.0 14.0 80.5
Any Other 78 19.5 19.5 100.0
Total 400 100.0 100.0
Source: Data collected through Questionnaire.
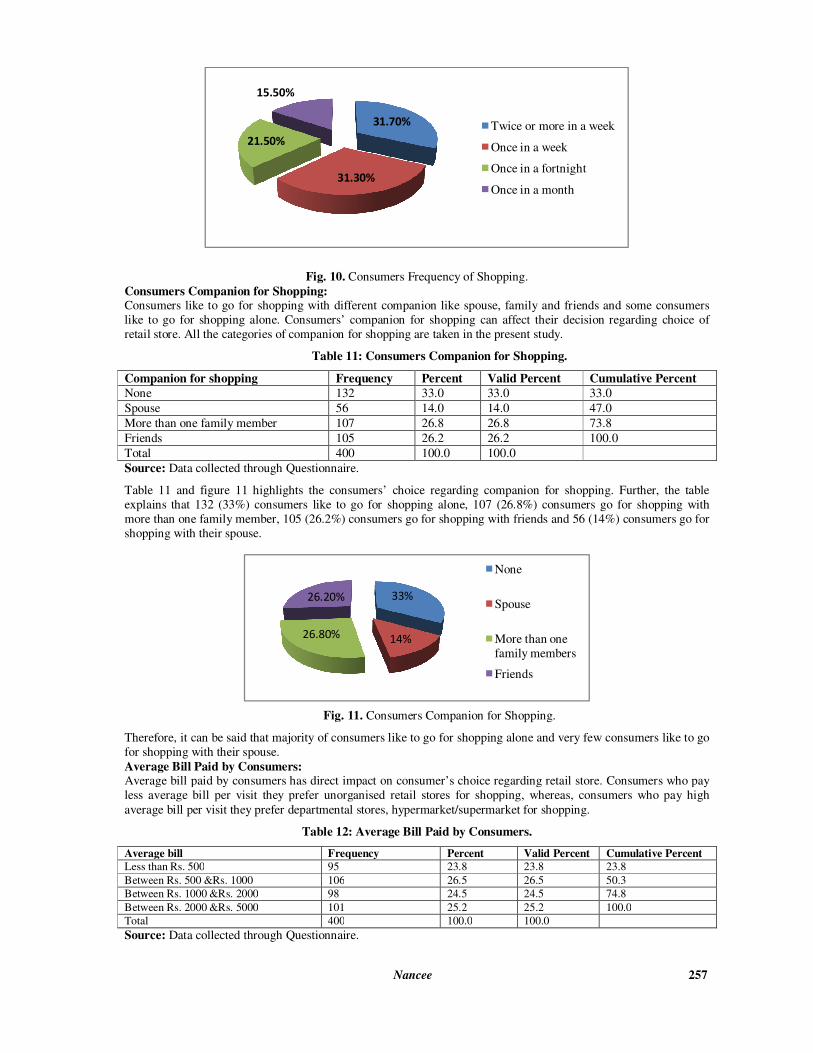
Table 8 and figure 8 depicts the occupation of the consumers. As far as occupation is concerned 96 (24%)
consumers are business persons, 88 (22%) consumers are professionals, 82 (20.5%) consumers belong to service
class, 78 (19.5%) consumers are engaged in any other occupation and 56 (14%) consumers are homemakers.
Fig. 8. Occupation of Consumers.
44%
37.80%
18.20%
Nuclear
Extended Family
Joint Family
20.50%
24%
22%
14%
19.50%Service
Business
Professional
Homemaker
Any Other
Nancee 256
The above table reports that, percentage of shoppers is highest in case of business class and lowest in case of
homemakers.
Annual Household Income of Consumers: Consumer income has direct relation with choice of consumer regarding retail format. Consumers with high income
like to buy products from departmental stores, hypermarkets/ supermarkets, whereas consumers from middle and
lower income group prefer unorganised retail stores for shopping. Therefore, in the present study consumers of different income groups are taken.
Table 9: Annual Household Income of Consumers.
Annual household income(in Rs.) Frequency Percent Valid Percent Cumulative Percent
Less than 2,00,000 98 24.5 24.5 24.5
Between 2,00,000 & 5,00,000 123 30.8 30.8 55.3
Between 5,00,000 & 10,00,000 98 24.5 24.5 79.8
10,00,000 & above 81 20.2 20.2 100.0
Total 400 100.0 100.0
Source: Data collected through Questionnaire.
Table 9 and figure 9 depicts the annual household income of consumers. Further, the table shows that 123 (30.8%)
consumers have annual household income between Rs. 2,00,000 & 5,00,000, 98 (24.5%) consumers have annual
income of less than Rs. 2,00,000.
Fig. 9. Annual Household Income of Consumers.
98 (24.5%) consumers have income between Rs. 5, 00,000& 10, 00,000 and 81 (20.2%) consumers have annual
income of Rs.10, 00,000 and above. Hence, it can be said that percentage of consumers who have annual household
income between Rs. 2, 00,000 & 5, 00,000 is highest, whereas consumers having annual income of Rs.10, 00,000
and above are low in percentage.
Consumers Frequency of Shopping: The frequency of shopping plays a significant role in influencing consumer’s decision regarding choice of store. In
the present study to analyse the buying behavior in a better way different categories of frequency of shopping are
taken viz. twice or more in a week, once in a week, once in a fortnight and once in a month
Table 10: Consumers Frequency of Shopping.
Frequency of shopping Frequency Percent Valid Percent Cumulative
Percent
Twice or more in a week 127 31.7 31.7 31.7
Once in a week 125 31.3 31.3 63
Once in a fortnight 86 21.5 21.5 84.5
Once in a month 62 15.5 15.5 100.0
Total 400 100.0 100.0
Source: Data collected through Questionnaire.
Table 10 and figure 10 shows consumers frequency of shopping, in which 127(31.7%) consumers go for shopping
twice or more in a week, 125 (31.3%) consumers go for shopping once in a week.
The percentage of consumers who go for shopping once in a fortnight is 21.5% and 62 (15.5%) consumers go for
shopping once in a month. Therefore, it can be said that the percentage of consumers who like to go for shopping
twice or more in a week is high.
24.50%
30.80%
24.50%
20.20%
Less than 2,00,000
Between 2,00,000 &
5,00,000
Between 5,00,000 &
10,00,000
10,00,000 & above
Nancee 257
Fig. 10. Consumers Frequency of Shopping.
Consumers Companion for Shopping: Consumers like to go for shopping with different companion like spouse, family and friends and some consumers
like to go for shopping alone. Consumers’ companion for shopping can affect their decision regarding choice of
retail store. All the categories of companion for shopping are taken in the present study.
Table 11: Consumers Companion for Shopping.
Companion for shopping Frequency Percent Valid Percent Cumulative Percent
None 132 33.0 33.0 33.0
Spouse 56 14.0 14.0 47.0
More than one family member 107 26.8 26.8 73.8
Friends 105 26.2 26.2 100.0
Total 400 100.0 100.0
Source: Data collected through Questionnaire.
Table 11 and figure 11 highlights the consumers’ choice regarding companion for shopping. Further, the table
explains that 132 (33%) consumers like to go for shopping alone, 107 (26.8%) consumers go for shopping with
more than one family member, 105 (26.2%) consumers go for shopping with friends and 56 (14%) consumers go for
shopping with their spouse.
Fig. 11. Consumers Companion for Shopping.
Therefore, it can be said that majority of consumers like to go for shopping alone and very few consumers like to go
for shopping with their spouse.
Average Bill Paid by Consumers: Average bill paid by consumers has direct impact on consumer’s choice regarding retail store. Consumers who pay
less average bill per visit they prefer unorganised retail stores for shopping, whereas, consumers who pay high
average bill per visit they prefer departmental stores, hypermarket/supermarket for shopping.
Table 12: Average Bill Paid by Consumers.
Average bill Frequency Percent Valid Percent Cumulative Percent
Less than Rs. 500 95 23.8 23.8 23.8
Between Rs. 500 &Rs. 1000 106 26.5 26.5 50.3
Between Rs. 1000 &Rs. 2000 98 24.5 24.5 74.8
Between Rs. 2000 &Rs. 5000 101 25.2 25.2 100.0
Total 400 100.0 100.0
Source: Data collected through Questionnaire.
31.70%
31.30%
21.50%
15.50%
Twice or more in a week
Once in a week
Once in a fortnight
Once in a month
33%
14%26.80%
26.20%
None
Spouse
More than one
family members
Friends
Nancee 258
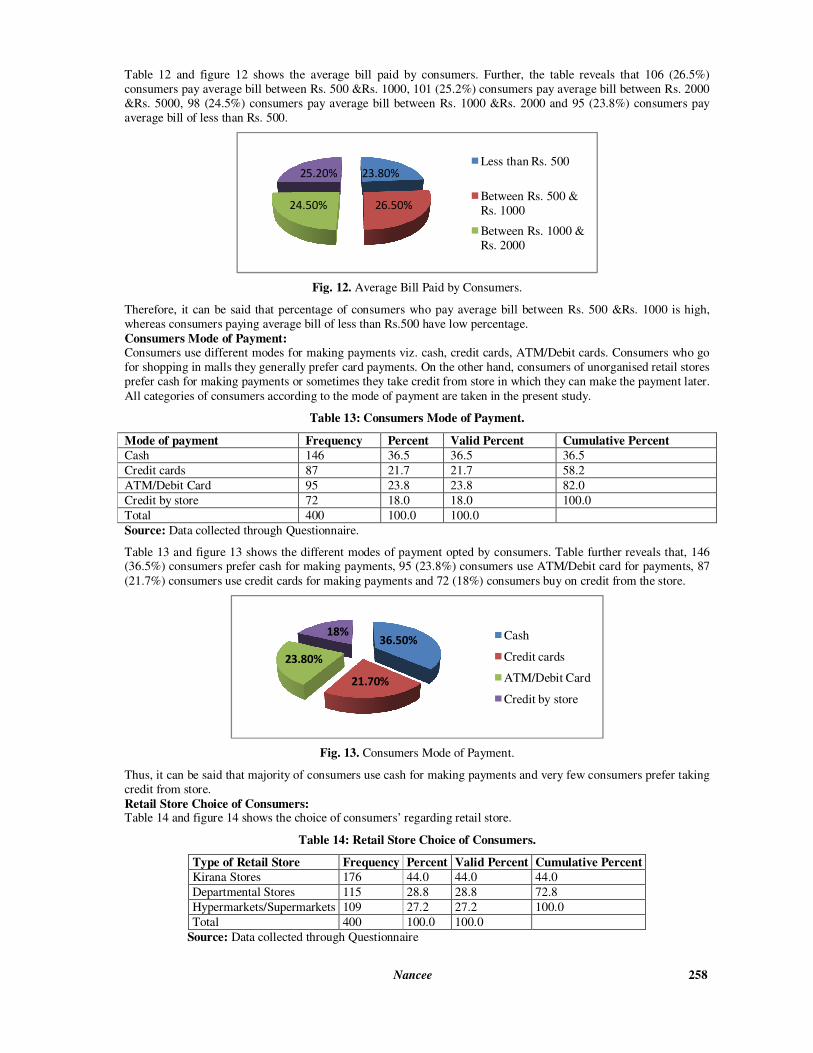
Table 12 and figure 12 shows the average bill paid by consumers. Further, the table reveals that 106 (26.5%)
consumers pay average bill between Rs. 500 &Rs. 1000, 101 (25.2%) consumers pay average bill between Rs. 2000
&Rs. 5000, 98 (24.5%) consumers pay average bill between Rs. 1000 &Rs. 2000 and 95 (23.8%) consumers pay
average bill of less than Rs. 500.
Fig. 12. Average Bill Paid by Consumers.
Therefore, it can be said that percentage of consumers who pay average bill between Rs. 500 &Rs. 1000 is high,
whereas consumers paying average bill of less than Rs.500 have low percentage.
Consumers Mode of Payment: Consumers use different modes for making payments viz. cash, credit cards, ATM/Debit cards. Consumers who go
for shopping in malls they generally prefer card payments. On the other hand, consumers of unorganised retail stores
prefer cash for making payments or sometimes they take credit from store in which they can make the payment later.
All categories of consumers according to the mode of payment are taken in the present study.
Table 13: Consumers Mode of Payment.
Mode of payment Frequency Percent Valid Percent Cumulative Percent
Cash 146 36.5 36.5 36.5
Credit cards 87 21.7 21.7 58.2
ATM/Debit Card 95 23.8 23.8 82.0
Credit by store 72 18.0 18.0 100.0
Total 400 100.0 100.0
Source: Data collected through Questionnaire.
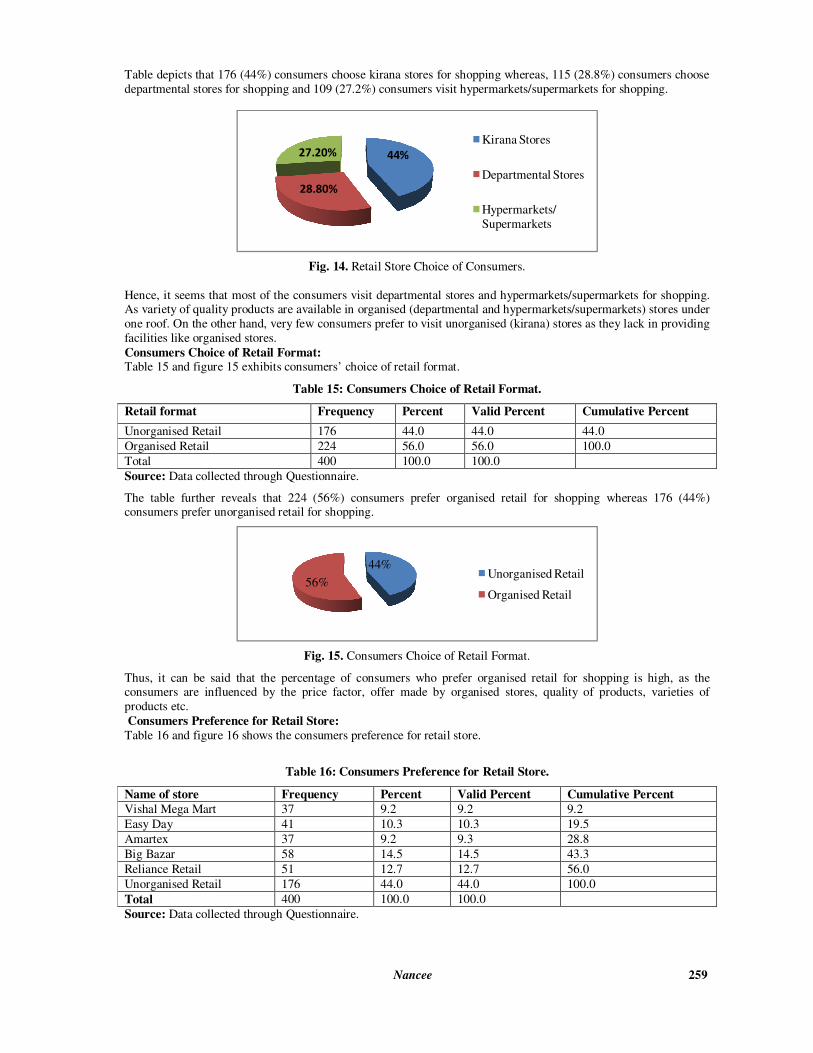
Table 13 and figure 13 shows the different modes of payment opted by consumers. Table further reveals that, 146 (36.5%) consumers prefer cash for making payments, 95 (23.8%) consumers use ATM/Debit card for payments, 87
(21.7%) consumers use credit cards for making payments and 72 (18%) consumers buy on credit from the store.
Fig. 13. Consumers Mode of Payment.
Thus, it can be said that majority of consumers use cash for making payments and very few consumers prefer taking
credit from store.
Retail Store Choice of Consumers: Table 14 and figure 14 shows the choice of consumers’ regarding retail store.
Table 14: Retail Store Choice of Consumers.
Type of Retail Store Frequency Percent Valid Percent Cumulative Percent
Kirana Stores 176 44.0 44.0 44.0
Departmental Stores 115 28.8 28.8 72.8
Hypermarkets/Supermarkets 109 27.2 27.2 100.0
Total 400 100.0 100.0
Source: Data collected through Questionnaire
23.80%
26.50%24.50%
25.20%
Less than Rs. 500
Between Rs. 500 &
Rs. 1000
Between Rs. 1000 &
Rs. 2000
36.50%
21.70%
23.80%
18% Cash
Credit cards
ATM/Debit Card
Credit by store
Nancee 259
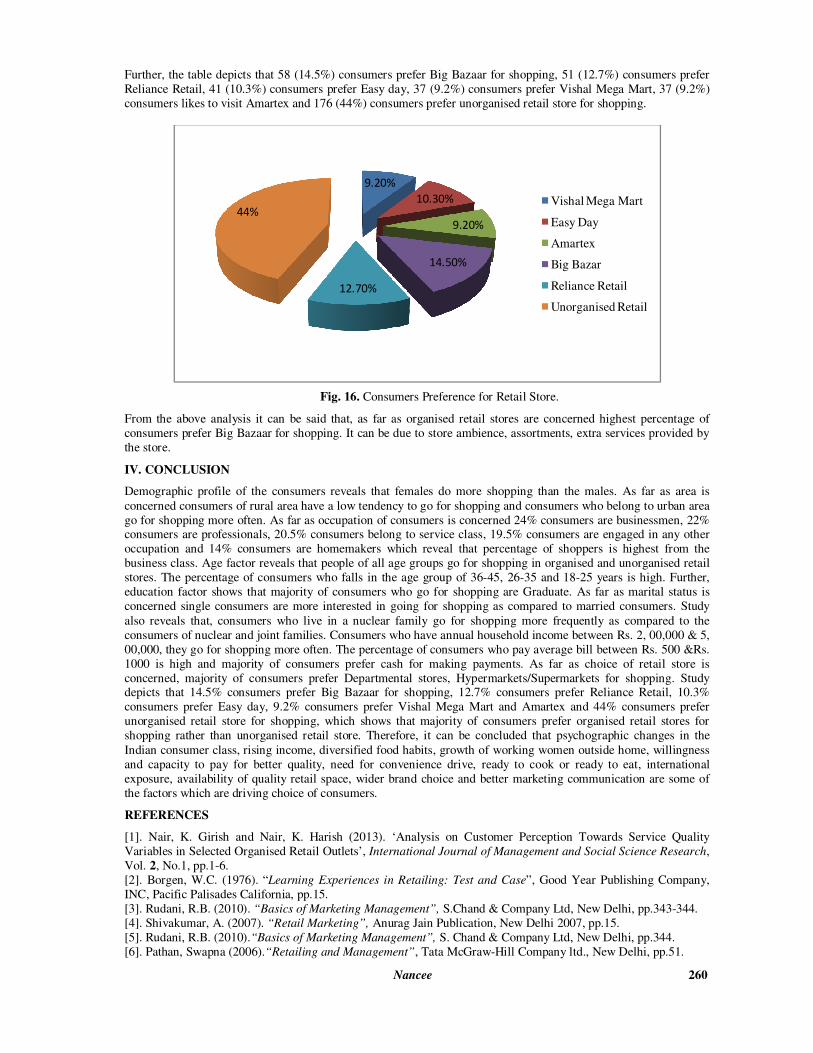
Table depicts that 176 (44%) consumers choose kirana stores for shopping whereas, 115 (28.8%) consumers choose
departmental stores for shopping and 109 (27.2%) consumers visit hypermarkets/supermarkets for shopping.
Fig. 14. Retail Store Choice of Consumers.
Hence, it seems that most of the consumers visit departmental stores and hypermarkets/supermarkets for shopping. As variety of quality products are available in organised (departmental and hypermarkets/supermarkets) stores under
one roof. On the other hand, very few consumers prefer to visit unorganised (kirana) stores as they lack in providing
facilities like organised stores.
Consumers Choice of Retail Format: Table 15 and figure 15 exhibits consumers’ choice of retail format.
Table 15: Consumers Choice of Retail Format.
Retail format Frequency Percent Valid Percent Cumulative Percent
Unorganised Retail 176 44.0 44.0 44.0
Organised Retail 224 56.0 56.0 100.0
Total 400 100.0 100.0
Source: Data collected through Questionnaire.
The table further reveals that 224 (56%) consumers prefer organised retail for shopping whereas 176 (44%) consumers prefer unorganised retail for shopping.
Fig. 15. Consumers Choice of Retail Format.
Thus, it can be said that the percentage of consumers who prefer organised retail for shopping is high, as the consumers are influenced by the price factor, offer made by organised stores, quality of products, varieties of
products etc.
Consumers Preference for Retail Store:
Table 16 and figure 16 shows the consumers preference for retail store.
Table 16: Consumers Preference for Retail Store.
Name of store Frequency Percent Valid Percent Cumulative Percent
Vishal Mega Mart 37 9.2 9.2 9.2
Easy Day 41 10.3 10.3 19.5
Amartex 37 9.2 9.3 28.8
Big Bazar 58 14.5 14.5 43.3
Reliance Retail 51 12.7 12.7 56.0
Unorganised Retail 176 44.0 44.0 100.0
Total 400 100.0 100.0
Source: Data collected through Questionnaire.
44%
28.80%
27.20%
Kirana Stores
Departmental Stores
Hypermarkets/
Supermarkets
44%
56%Unorganised Retail
Organised Retail
Nancee 260
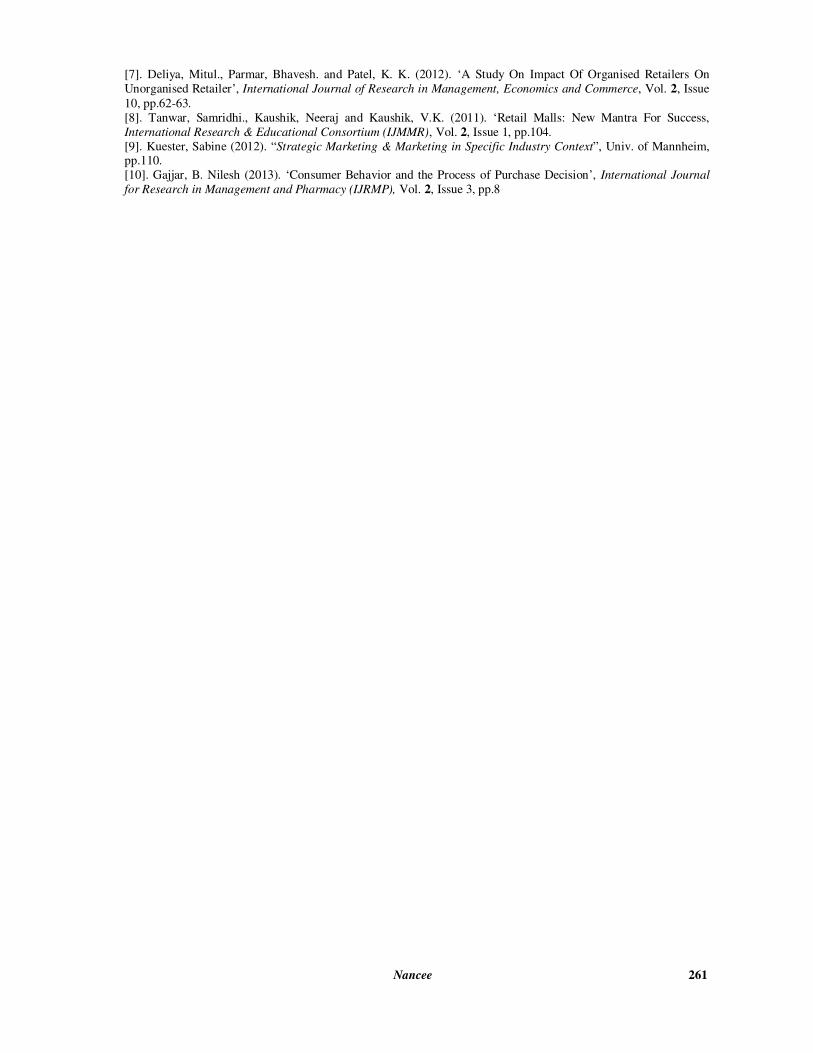
Further, the table depicts that 58 (14.5%) consumers prefer Big Bazaar for shopping, 51 (12.7%) consumers prefer
Reliance Retail, 41 (10.3%) consumers prefer Easy day, 37 (9.2%) consumers prefer Vishal Mega Mart, 37 (9.2%)
consumers likes to visit Amartex and 176 (44%) consumers prefer unorganised retail store for shopping.
Fig. 16. Consumers Preference for Retail Store.
From the above analysis it can be said that, as far as organised retail stores are concerned highest percentage of
consumers prefer Big Bazaar for shopping. It can be due to store ambience, assortments, extra services provided by
the store.
IV. CONCLUSION
Demographic profile of the consumers reveals that females do more shopping than the males. As far as area is
concerned consumers of rural area have a low tendency to go for shopping and consumers who belong to urban area
go for shopping more often. As far as occupation of consumers is concerned 24% consumers are businessmen, 22% consumers are professionals, 20.5% consumers belong to service class, 19.5% consumers are engaged in any other
occupation and 14% consumers are homemakers which reveal that percentage of shoppers is highest from the
business class. Age factor reveals that people of all age groups go for shopping in organised and unorganised retail
stores. The percentage of consumers who falls in the age group of 36-45, 26-35 and 18-25 years is high. Further,
education factor shows that majority of consumers who go for shopping are Graduate. As far as marital status is
concerned single consumers are more interested in going for shopping as compared to married consumers. Study
also reveals that, consumers who live in a nuclear family go for shopping more frequently as compared to the
consumers of nuclear and joint families. Consumers who have annual household income between Rs. 2, 00,000 & 5,
00,000, they go for shopping more often. The percentage of consumers who pay average bill between Rs. 500 &Rs.
1000 is high and majority of consumers prefer cash for making payments. As far as choice of retail store is
concerned, majority of consumers prefer Departmental stores, Hypermarkets/Supermarkets for shopping. Study depicts that 14.5% consumers prefer Big Bazaar for shopping, 12.7% consumers prefer Reliance Retail, 10.3%
consumers prefer Easy day, 9.2% consumers prefer Vishal Mega Mart and Amartex and 44% consumers prefer
unorganised retail store for shopping, which shows that majority of consumers prefer organised retail stores for
shopping rather than unorganised retail store. Therefore, it can be concluded that psychographic changes in the
Indian consumer class, rising income, diversified food habits, growth of working women outside home, willingness
and capacity to pay for better quality, need for convenience drive, ready to cook or ready to eat, international
exposure, availability of quality retail space, wider brand choice and better marketing communication are some of
the factors which are driving choice of consumers.
REFERENCES
[1]. Nair, K. Girish and Nair, K. Harish (2013). ‘Analysis on Customer Perception Towards Service Quality
Variables in Selected Organised Retail Outlets’, International Journal of Management and Social Science Research,
Vol. 2, No.1, pp.1-6.
[2]. Borgen, W.C. (1976). “Learning Experiences in Retailing: Test and Case”, Good Year Publishing Company,
INC, Pacific Palisades California, pp.15.
[3]. Rudani, R.B. (2010). “Basics of Marketing Management”, S.Chand & Company Ltd, New Delhi, pp.343-344.
[4]. Shivakumar, A. (2007). “Retail Marketing”, Anurag Jain Publication, New Delhi 2007, pp.15.
[5]. Rudani, R.B. (2010).“Basics of Marketing Management”, S. Chand & Company Ltd, New Delhi, pp.344.
[6]. Pathan, Swapna (2006).“Retailing and Management”, Tata McGraw-Hill Company ltd., New Delhi, pp.51.
9.20%
10.30%
9.20%
14.50%
12.70%
44%
Vishal Mega Mart
Easy Day
Amartex
Big Bazar
Reliance Retail
Unorganised Retail
Nancee 261
[7]. Deliya, Mitul., Parmar, Bhavesh. and Patel, K. K. (2012). ‘A Study On Impact Of Organised Retailers On
Unorganised Retailer’, International Journal of Research in Management, Economics and Commerce, Vol. 2, Issue
10, pp.62-63.
[8]. Tanwar, Samridhi., Kaushik, Neeraj and Kaushik, V.K. (2011). ‘Retail Malls: New Mantra For Success,
International Research & Educational Consortium (IJMMR), Vol. 2, Issue 1, pp.104.
[9]. Kuester, Sabine (2012). “Strategic Marketing & Marketing in Specific Industry Context”, Univ. of Mannheim, pp.110.
[10]. Gajjar, B. Nilesh (2013). ‘Consumer Behavior and the Process of Purchase Decision’, International Journal
for Research in Management and Pharmacy (IJRMP), Vol. 2, Issue 3, pp.8


![Buying behaviour[1]](https://img.pdfslide.net/doc/110x75/54b9b57a4a7959a4738b46d7/buying-behaviour1.jpg)