Embed Size (px)
Citation preview

Dynamic interaction of adjacent tall building structures on deep foundations
M. A. Rahgozar & M. Ghandil Department of Civil Engineering, University of Isfahan, Isfahan, Iran
Abstract
In design of low rise structures the effects of soil-structure interaction are often ignored. However, these effects are considerable for heavy structures such as skyscrapers or multi-level highway structures. The existence of this interaction phenomenon can also be extended to the adjacent buildings. For example, in an area congested with many nearby tall buildings, to account for the proximity effects of adjacent buildings will become critical. Previous few studies conducted in this area, were limited to 2D finite element plain-strain models. Assuming plain-strain for foundation soil may be valid, however, for a building structure which has limited dimensions in plan, this assumption could be erroneous. In the current study, in order to capture the proximity effects on the response of adjacent buildings under earthquake motions, 3D models of 15 and 30 storey building structures on group piles are used. The foundation soils considered are clay and sand. Dynamic analyses are performed under horizontal components of several actual earthquakes. Three different combinations of two adjacent buildings are considered, 1) two 15-stories, 2) two 30-stories, and 3) one 15- and one 30-stories. Seismic soil-structure interaction analyses in this study are based on direct method. Foundation soil behavior is assumed to be equivalent linear while structures are assumed to behave in elastic range. Results show that the interaction of adjacent buildings depends on structural heights, type and depth of the foundation soil, frequency content of the earthquake records, the type of proximity and the distance between the adjacent buildings. Keywords: dynamic time history analysis, equivalent linear method, soil-structure interaction, adjacent structures, tall buildings, group piles, frequency content, high amplitude record, low amplitude record, global response of structures.
www.witpress.com, ISSN 1743-3509 (on-line) WIT Transactions on The Built Environment, Vol 120, © 2011 WIT Press
Earthquake Resistant Engineering Structures VIII 173
doi:10.2495/ERES110 115

1 Introduction
In the design of ordinary structures the effects of soil-structure interaction (SSI) are often ignored. However, these effects are considerable for heavy structures. The existence of this interaction phenomenon can also be extended to the adjacent buildings on same foundation soil. Damages due to earthquakes, such as Kobe earthquake in 1995, show that structural response depends on its foundation and foundation soil. SSI is reported to be one the main reasons for these damages [1]. Behnamfar and Shugimura [2] conducted a comprehensive study on the dynamic responses of 1, 2, 10 and 20 story building structures, both individually and as pairs of adjacent structures. They found that, as the structures are closer, the amplification frequency increases and in some cases, the structural response increases too. Kermani et al. [3] modelled two adjacent buildings located on soft soils (foundation soil and the two structures modelled as one soil-structure system) in order to determine the natural frequencies of the system. They found that if the distance between two adjacent structures is less than 50% of the building dimension in plan, the effects of structural adjacency on seismic response of the structures are considerable and must be considered. Nateghi et al. [4] studied the effects of structure-soil-Structure interaction (SSSI) on seismic response of 2D tall building structures. Their model was in plane-strain. They observed that if site period is far from fundamental period of the structure, the buildings adjacency has minor effects on seismic response of structures. In all aforementioned studies, the FE model was 2D with the assumption of plain-strain behaviour for the whole soil-structure system. Nonetheless, all arrived at this conclusion that the structural adjacency in many seismic cases cannot be ignored. However, in order to have a more realistic view of the seismic interaction of adjacent structures, one must use 3D FE models without simplifying assumption of plain-strain behaviour. In this research, full 3D Structure-Soil-Structure models are developed and used. In order to capture the effects of earthquake frequency content on this building adjacency study, the final results are illustrated in two main earthquake types, High amplitude records and Low amplitude records.
2 Modelling methods of accounting for SSI
In general, two methods are considered for a SSI studies: the substructure and direct methods. The substructure method although simpler, for real soil-structure systems with different soil layers, group piles, non-circular or flexible footings, etc., may lead to very approximate results. In this method, the soil layer under the building foundation is represented by spring and dashpot elements. Direct method, however, is based on FE modeling of the whole soil-structure system and accounts for radiation of seismic waves in an unbounded medium, by implementing transmitting boundaries. The distance between the artificial soil boundaries and the building is usually several times the width of the structure [5]. A significant part of the FE mesh and the degrees of freedoms in this method belongs to the foundation soil. One may use as many soil layers and soil types as
www.witpress.com, ISSN 1743-3509 (on-line) WIT Transactions on The Built Environment, Vol 120, © 2011 WIT Press
174 Earthquake Resistant Engineering Structures VIII

required in this method. For a 3D adjacency study, the substructure method is far less accurate than the direct method. In order to study the seismic SSSI in this research, the direct method is used.
3 Description of structural models
Two 15 story and 30 story building structures representing mid-rise and high-rise Buildings are considered. The structures have 4 bays in each direction in plan. Each bay is 5 meters. Height of stories is 3 meters. The building site is assumed to be in Tehran/Iran, with high seismic hazard risk where design earthquake acceleration is 0.35g. Design gravity floor loads of DL=760 kg/m² and LL=200 kg/m² are used [6]. Lateral load resisting system is considered to be special moment resisting frame and designed according to ASCE7 2010 code with ETABS software [7]. All steel design provisions such as weak beam – strong column for these systems according to that code are considered. Site classification in structural design is assumed as type D.
4 Description of foundation and soil properties
Both structures rest on piles. Pile groups are designed for soil type D [8]. For 30 story structure, pile group includes 25 piles and for the 15 story structure, pile group has 16 piles. Each pile is 20 meter long. Piles are of reinforced concrete with reinforcements differing in the top 8 meter of the piles compared to its lower part. They are circular with a radius of 0.5 m for the 15-story and 0.8 m for the 30-story buildings. The pile caps are one meter deep and all design criteria including punching shear controls are performed. Two building sites are considered in this study. Site 1 includes 20 m of sandy soil in two layers, as per Table 1. Site 2 consists of 45 m of clay soil in three layers as per Table 2. Other relevant properties of these soil profiles are also shown in Tables 1 and 2. Figure 1 illustrates the soil nonlinearity curves (Soil shear modulus vs. Shear strain) for Sites 1 and 2.
Table 1: Soil properties at site 1.
Table 2: Soil properties at site 2.
Z (m) E (Kpa) G (Kpa) Vs (m/s)[0 ‐ 10] 107315 92121 224[10 ‐ 25] 168206 150303 277
Sand (OCR<1)
Z (m) Cu (Kpa) G (Kpa) ρ (kg/m3) Vs (m/s)[0 - 10] 148 61190 1936 178
[10 - 25] 206 85172 2178 197[25 - 45] 365 150957 2470 246
Clay (OCR<1)
www.witpress.com, ISSN 1743-3509 (on-line) WIT Transactions on The Built Environment, Vol 120, © 2011 WIT Press
Earthquake Resistant Engineering Structures VIII 175
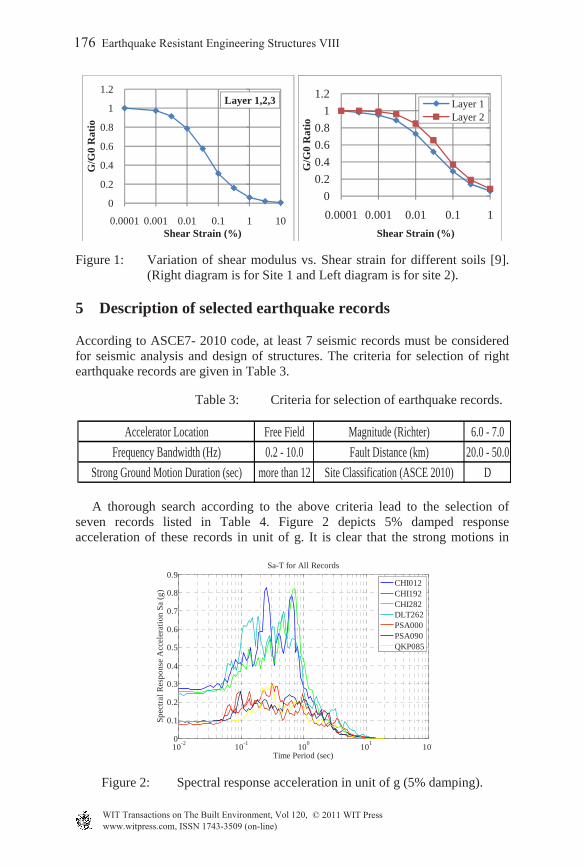
Figure 1: Variation of shear modulus vs. Shear strain for different soils [9].
(Right diagram is for Site 1 and Left diagram is for site 2).
5 Description of selected earthquake records
According to ASCE7- 2010 code, at least 7 seismic records must be considered for seismic analysis and design of structures. The criteria for selection of right earthquake records are given in Table 3.
Table 3: Criteria for selection of earthquake records.
A thorough search according to the above criteria lead to the selection of seven records listed in Table 4. Figure 2 depicts 5% damped response acceleration of these records in unit of g. It is clear that the strong motions in
Figure 2: Spectral response acceleration in unit of g (5% damping).
00.20.40.60.8
11.2
0.0001 0.001 0.01 0.1 1
G/G
0 R
atio
Shear Strain (%)
Layer 1Layer 2
0
0.2
0.4
0.6
0.8
1
1.2
0.0001 0.001 0.01 0.1 1 10
G/G
0 R
atio
Shear Strain (%)
Layer 1,2,3
Accelerator Location Free Field Magnitude (Richter) 6.0 - 7.0Frequency Bandwidth (Hz) 0.2 - 10.0 Fault Distance (km) 20.0 - 50.0
Strong Ground Motion Duration (sec) more than 12 Site Classification (ASCE 2010) D
10-2 10-1 100 101 1020
0.1
0.2
0.3
0.4
0.5
0.6
0.7
0.8
0.9
Time Period (sec)
Spec
tral R
espo
nse
Acc
eler
atio
n Sa
(g)
Sa-T for All Records
CHI012CHI192CHI282DLT262PSA000PSA090QKP085
www.witpress.com, ISSN 1743-3509 (on-line) WIT Transactions on The Built Environment, Vol 120, © 2011 WIT Press
176 Earthquake Resistant Engineering Structures VIII

these spectra happen almost in the same frequency/period range, while the amplitude in one group is high and in the other is low. Therefore, these records are classified as Low amplitude records shown in blue and High amplitude records in red. The final results of this research are also illustrated in these two formats/colours: High amplitude (in Red) and Low amplitude (in Blue). So, one can see the effects of earthquake frequency contents on the response of different soil-structure systems, more clearly. To achieve more realistic results, these records are scaled according to ASCE7-2010. The scaling width is 0.2T₁-1.5T₁ for each structure (T₁ is the first mode period of the structure). Final Scale Factors and PGA of the scaled records are presented in Table 4.
Table 4: Earthquakes scale factors and scaled PGAs per ASCE7-2010.
6 Dynamic analysis of Soil-Structure Interaction (SSI) and Structure-Soil-Structure Interaction (SSSI) systems
SAP2000 software is used to conduct time history dynamic analyses of seismic SSI and SSSI responses of 3D soil-structure systems [10]. These analyses are carried out for three different conditions: 1) one single structure (15 or 30 story) based on rigid support/bedrock, 2) one single structure on piles and on Site1 or Site 2, 3) Two adjacent structures on piles and on Site 1 or 2. Figure 3, for example, shows 3D view of FE model of two 30-story adjacent structures used in this research. For structural modelling, beam element is used for frame members and piles. Shell elements are used for rigid diaphragm and pile caps. Solid 3D element with 8 nodes is selected for soils. Structural elements assumed to behave linearly. To account for soil nonlinearities, an equivalent linear approach is assumed for soil behaviour. This method is effective, fast and sufficiently accurate for analysis of large scale soil media [11]. One of the main issues in SSI is the determination of the location of transmitting boundaries in plan. These boundaries should be considered far enough from the structure to ensure the earthquake energy dissipation conditions, and at the same time not considered too far so that the FE model becomes very
ID Earthquake Component 15 Story 30 Story
H-CHI012 0.38 0.57H-CHI282 0.35 0.53
P0169 Imperial Valley QKP085 0.29 0.44P0170 Imperial Valley H-DLT262 0.34 0.50P0267 Victoria, Mexico H-CHI192 0.27 0.40
PSA000 0.25 0.38PSA090 0.27 0.40
Blue : Low Amplitude RecordRed : High Amplitude Record
Selected Records Properties (Scaling Method : ASCE 2010 Code)Scaled PGA (g)
P0166 Imperial Valley
P0819 Landers
www.witpress.com, ISSN 1743-3509 (on-line) WIT Transactions on The Built Environment, Vol 120, © 2011 WIT Press
Earthquake Resistant Engineering Structures VIII 177

Figure 3: A typical 3D FE model of two 30-story adjacent buildings.
large to handle. Therefore, to find optimum locations, a sensitivity study on the location of these boundaries is run in this work. Where a two adjacent 30-story buildings on Site 2 in two different site plan dimensions of 40 x 160m and 60 x 180 m were analyzed under H-DLT262 record which is the most critical seismic excitation among the seven records. It was observed that the variation of for example the story lateral displacement in these two models were less than 3% (figure 4). Therefore, the site dimension used for all dynamic analyses in this research is considered 40 x 160 m in plan.
Figure 4: Variation of story displacements for two 30 story adjacent structures on Site 2, with two different site plan dimensions.
0.0
20.0
40.0
60.0
80.0
100.0
120.0
1 5 9 13 17 21 25 29
Stor
y D
ispl
acem
ent (
cm)
Story
40 m - 160 m60 m - 180 m
www.witpress.com, ISSN 1743-3509 (on-line) WIT Transactions on The Built Environment, Vol 120, © 2011 WIT Press
178 Earthquake Resistant Engineering Structures VIII

The nonlinear behaviour of soil must be considered during dynamic SSI analysis. Among the two common methods of Equivalent linear method and nonlinear visco-elastic method, the former is used in this study. In both methods shear strain as well as shear modulus of the soil are determined through an iteration procedure using the Seed and Idriss diagrams in Figure 1. In Equivalent linear method, however, the stiffness matrix is kept constant during each run and the shear strain and modulus are updated only at the end of each run until with a 5% error, convergence is achieved, while in nonlinear visco-elastic method, shear strain and modulus are updated for each element and at each time step. Equivalent linear method is fast and has acceptable accuracy whereas nonlinear visco-elastic method is time consuming and not with much higher accuracy [11]. Figure 5 compares story displacements for a 30 story adjacent to a 15 story on Site 2 under H-DLT262 record using different nonlinear analyses methods. Neglegible difference in the results justify the use of Equivalent linear method in this work.
Figure 5: Story displacements for a 30 story adjacent to a 15 story on Site 1 under H-DLT262 record using different nonlinear analyses methods.
It is expected that for two adjacent buildings, as they are closer, the interaction response of the structures is higher. This response becomes higher as the buildings are taller. To determine the critical distance of two adjacent buildings, one free standing single 30 story as well as two adjacent 30 story buildings, with variable distances, on site 2 were analyzed under H-DLT262 record. The adjacent building distances varies between 0.125a to 3a, where a is the lateral building dimension in plan (20m). By comparison of the lateral story displacements for these models, the following conclusions were made: 1) for building distances more than 0.5a, SSSI need not be considered. 2) The highest responses occur where building distances are between 0.125a to 0.25a. 0.125a
0.0
10.0
20.0
30.0
40.0
50.0
60.0
70.0
80.0
90.0
100.0
0 5 10 15 20 25 30
Stor
y C
entr
al M
ass D
ispl
acem
ent
(cm
)
Story
30Svs15S-S1_Equivalent Linear Method30Svs15S-S1_Nonlinear Viscoelastic
www.witpress.com, ISSN 1743-3509 (on-line) WIT Transactions on The Built Environment, Vol 120, © 2011 WIT Press
Earthquake Resistant Engineering Structures VIII 179

corresponds to 2.5 m, and no pounding happened at this distance. Therefore, in this study only these two distances, 0.125a and 0.25a are considered.
7 Results and discussions
Three main objectives are pursued by the seismic SSSI analyses in the research: 1) study local structural responses such as story lateral displacements, 2) study global structural responses such as base shears, 3) study the effects of frequency and amplitude of earthquake records on structural responses. All results are presented in two colors: High amplitude records in Red and Low amplitude records in Blue.
7.1 The effects of SSSI on story displacements
Figure 7 shows variation of story displacements for all adjacency cases for a 30 story. It is clear the highest response for a 30 story is when it is adjacent to another 30 story. If the adjacent building is 15 story, its response is less. It must be noted that "30S" stands for a single 30 story on rigid support, and "30S-S1" means a single 30 story on Site 1. According to Figure 6, the least response for a 15 story happens when it is next to a 30 story. According to the results, a taller building increases the response of a shorter adjacent building, and a shorter building decreases the response of a taller adjacent building.
Figure 6: Maximum story displacements for a 15 story structure on Site 1 in different adjacency cases, under High amplitude record (H-DLT262).
7.2 The effects of SSSI on structural base shear
According to the results in Figure 9, base shear in 30 story is higher when it is next to a 15 story. Also the base shear in 15 story is least when it is next to a 30 story. In this figure "Sin" stands for a single 30 story.
0.0
10.0
20.0
30.0
40.0
50.0
60.0
70.0
80.0
1 3 5 7 9 11 13 15
Stor
y D
ispl
acem
ent (
cm)
Story
15S15S-S115Svs15S-0.25d-S115Svs15S-0.125d-S130Svs15S-0.25d-S1 (15S)30Svs15S-0.125d-S1 (15S)
www.witpress.com, ISSN 1743-3509 (on-line) WIT Transactions on The Built Environment, Vol 120, © 2011 WIT Press
180 Earthquake Resistant Engineering Structures VIII
7.3 The effects of earthquake frequency content on structural response
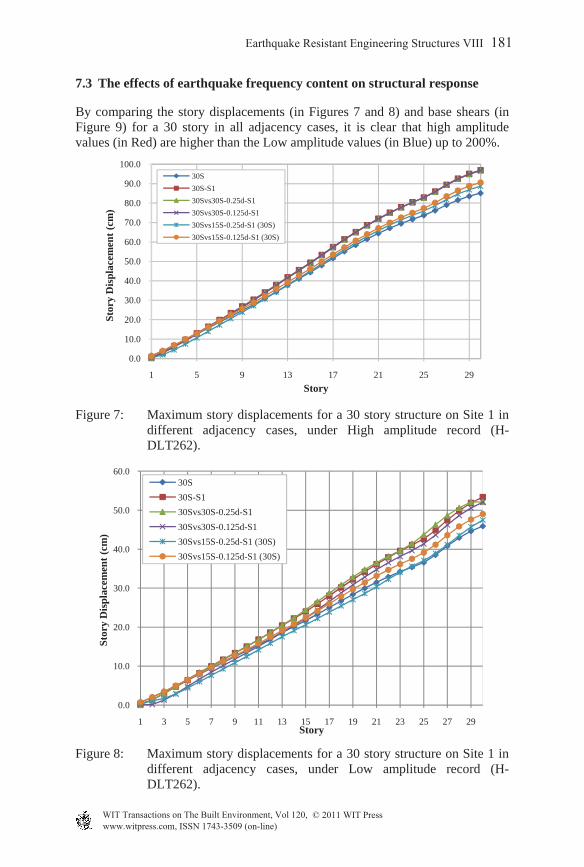
By comparing the story displacements (in Figures 7 and 8) and base shears (in Figure 9) for a 30 story in all adjacency cases, it is clear that high amplitude values (in Red) are higher than the Low amplitude values (in Blue) up to 200%.
Figure 7: Maximum story displacements for a 30 story structure on Site 1 in different adjacency cases, under High amplitude record (H-DLT262).
Figure 8: Maximum story displacements for a 30 story structure on Site 1 in
different adjacency cases, under Low amplitude record (H-DLT262).
0.0
10.0
20.0
30.0
40.0
50.0
60.0
70.0
80.0
90.0
100.0
1 5 9 13 17 21 25 29
Stor
y D
ispl
acem
ent (
cm)
Story
30S30S-S130Svs30S-0.25d-S130Svs30S-0.125d-S130Svs15S-0.25d-S1 (30S)30Svs15S-0.125d-S1 (30S)
0.0
10.0
20.0
30.0
40.0
50.0
60.0
1 3 5 7 9 11 13 15 17 19 21 23 25 27 29
Stor
y D
ispl
acem
ent (
cm)
Story
30S30S-S130Svs30S-0.25d-S130Svs30S-0.125d-S130Svs15S-0.25d-S1 (30S)30Svs15S-0.125d-S1 (30S)
www.witpress.com, ISSN 1743-3509 (on-line) WIT Transactions on The Built Environment, Vol 120, © 2011 WIT Press
Earthquake Resistant Engineering Structures VIII 181

Figure 9: Structural base shears in all 30 story structure adjacency cases.
8 Conclusions
In the current study, in order to study the adjacency effects on the response of structures under earthquakes with different frequency contents, 3D models of 15 and 30 storey structures on group piles and on different sites were analyzed. The results obtained are: 1) For a 30 story the highest story displacement occurs when it is adjacent to another 30 story. If the adjacent building is 15 story, its response is less. The least response for a 15 story happens when it is next to a 30 story. According to the results, a taller building increases the response of a shorter adjacent building, and a shorter building decreases the response of a taller adjacent building. 2) Base shear in 30 story is higher when it is next to a 15 story. Also the base shear in 15 story is least when it is next to a 30 story. 3) Earthquake frequency content influences the results significantly, for example, responses to High amplitude records are higher than to Low amplitude ones, up to 200%.
References
[1] Dynamic soil structure interaction analysis via coupled finite-element-boundary-element method, http://en.wikipedia.org/~soil-structure interaction.htm Shimomura, Y., 2006.
0.0
200.0
400.0
600.0
800.0
1,000.0
1,200.0B
ase
Shea
r X
(ton
)
Site 1 Site 2High Amplitude Records Low Amplitude Records High Amplitude Records Low Amplitude Records
Sin with 30 Story
with 15 Story
d=0.25a
d=0.125a
d=0.25a
d=0.125a
Sin with 30 Story
with 15 Story
d=0.25a
d=0.125a
d=0.25a
d=0.125a
Sin with 30 Story
with 15 Story
d=0.25a
d=0.125a
d=0.25a
d=0.125a
Sin with 30 Story
with 15 Story
d=0.25a
d=0.125a
d=0.25a
d=0.125a
www.witpress.com, ISSN 1743-3509 (on-line) WIT Transactions on The Built Environment, Vol 120, © 2011 WIT Press
182 Earthquake Resistant Engineering Structures VIII

[2] Behnamfar, F. & Sugimura, Y., Dynamic response of adjacent structures under spatially variable seismic waves, Probabilistic Engineering Mechanics, (14), pp 33–44. 1999.
[3] Kermani, M., Saadatpour, M. & Behnamfar, F., Study of Natural Frequency of Adjacent Structures on Flexible Soil, 6th Int. Conf. of Civil Engineering. Isfahan University of Technology, Isfahan, Iran, 2001.
[4] Nateghi, F., Tabrizi, A. & Behnamfar, F., Structure-soil-structure effects on nonlinear response of tall buildings, First European Conf. Earthquake Engineering. and Seism. (13), pp 206–215, 2006.
[5] John P. Wolf., Dynamic soil structure interaction, Prentice-Hall, Inc., Englewood Cliffs, New Jersey, 07632, 1985.
[6] American society of civil engineers, Minimum design loads for buildings and other structures, American Society of Civil Engineers, 1801 Alexander Bell Drive, Reston, Virginia 20191, 2010.
[7] Computers & Structures, Inc., ETABS, Integrated building design software, User Manual, Version 9, 1995 University Avenue Berkeley, California 94704 USA, 2005.
[8] M. G. Tomlinson., Pile design and construction practice, FN Spon, London 9966, 2004.
[9] Seed HB & Idriss IM., Soil moduli and damping factors for dynamic response analysis, University of California, Berkeley, CA, 1970.
[10] Computers & Structures, Inc., SAP2000, Linear and nonlinear static and dynamic analysis and design of three-dimensional structures, User Manual, Version 11, 1995 University Avenue Berkeley, California 94704 USA, 2006.
[11] Steven L. Kramer., Geotechnical Earthquake Engineering, Prentice-Hall, Inc., Englewood Cliffs, New Jersey 07458, 1996.
www.witpress.com, ISSN 1743-3509 (on-line) WIT Transactions on The Built Environment, Vol 120, © 2011 WIT Press
Earthquake Resistant Engineering Structures VIII 183

This page intentionally left blank