Embed Size (px)
Citation preview
04/18/2304/18/23 11
Current Status of Current Status of Manufacturing Manufacturing
Statistics Statistics
• 44thth – 7 – 7stst May 2009 May 2009• WS-ZAMBIAWS-ZAMBIA
• Isaac NdegwaIsaac Ndegwa

Kenya National Bureau of Statistics
• A semi-autonomous government agency
• The organization responsible for compilation of manufacturing statistics
• Decentralized statistical system
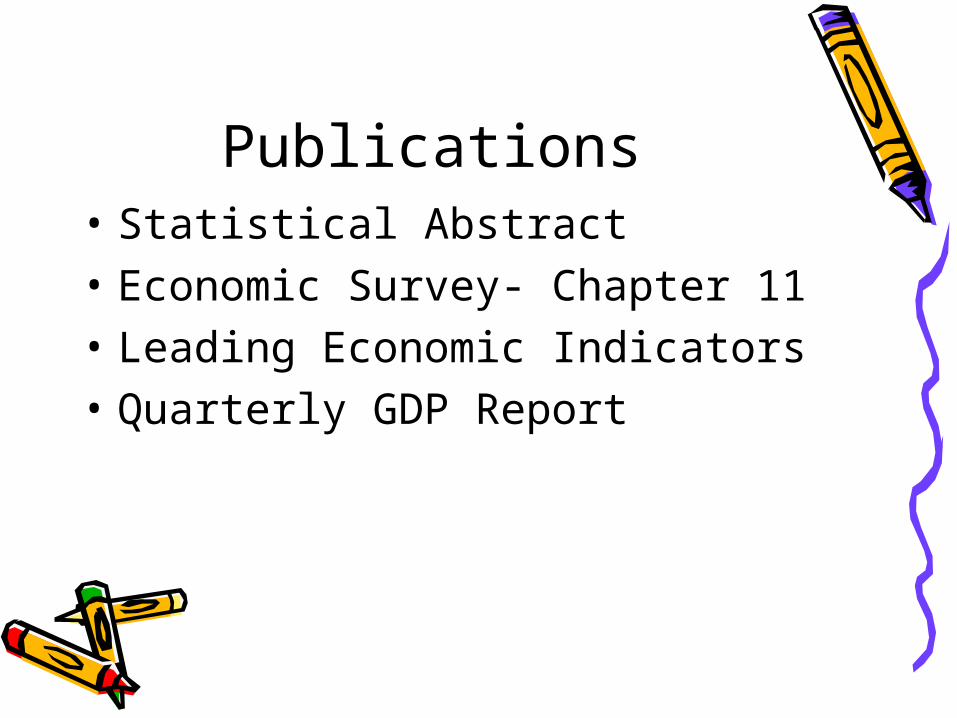
Publications• Statistical Abstract• Economic Survey- Chapter 11• Leading Economic Indicators• Quarterly GDP Report
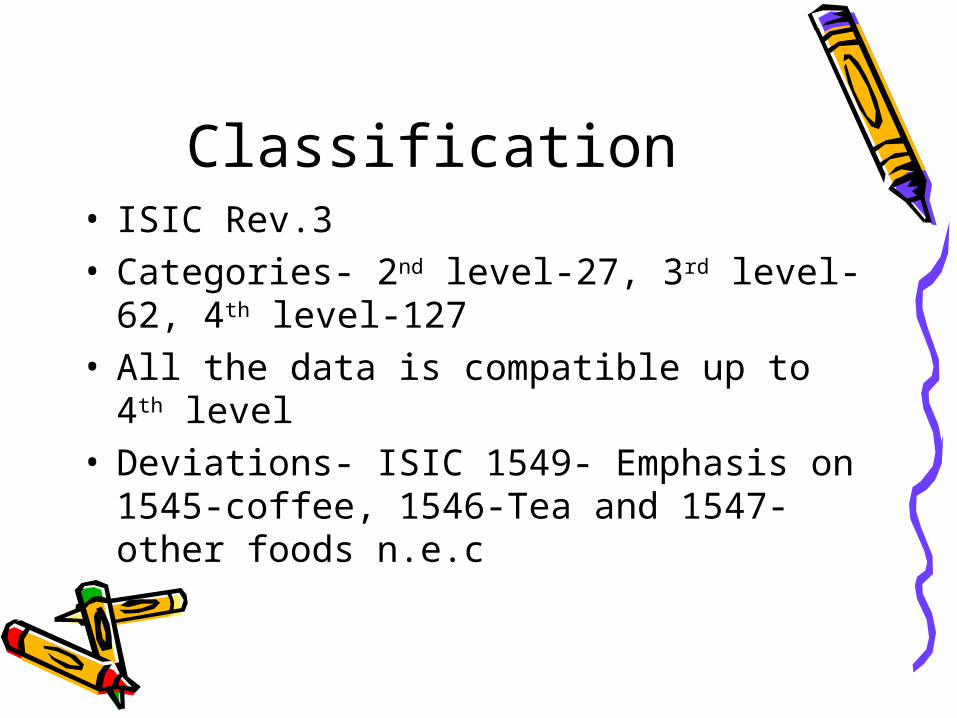
Classification• ISIC Rev.3• Categories- 2nd level-27, 3rd level-62, 4th
level-127• All the data is compatible up to 4th level• Deviations- ISIC 1549- Emphasis on
1545-coffee, 1546-Tea and 1547-other foods n.e.c
Manufacturing Statistics
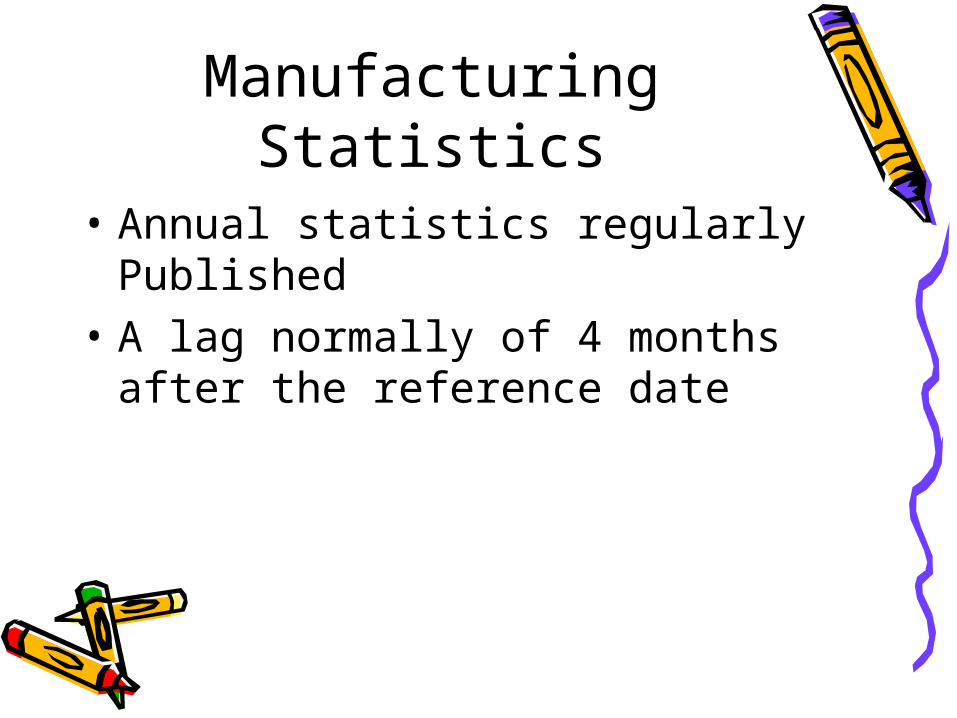
• Annual statistics regularly Published
• A lag normally of 4 months after the reference date
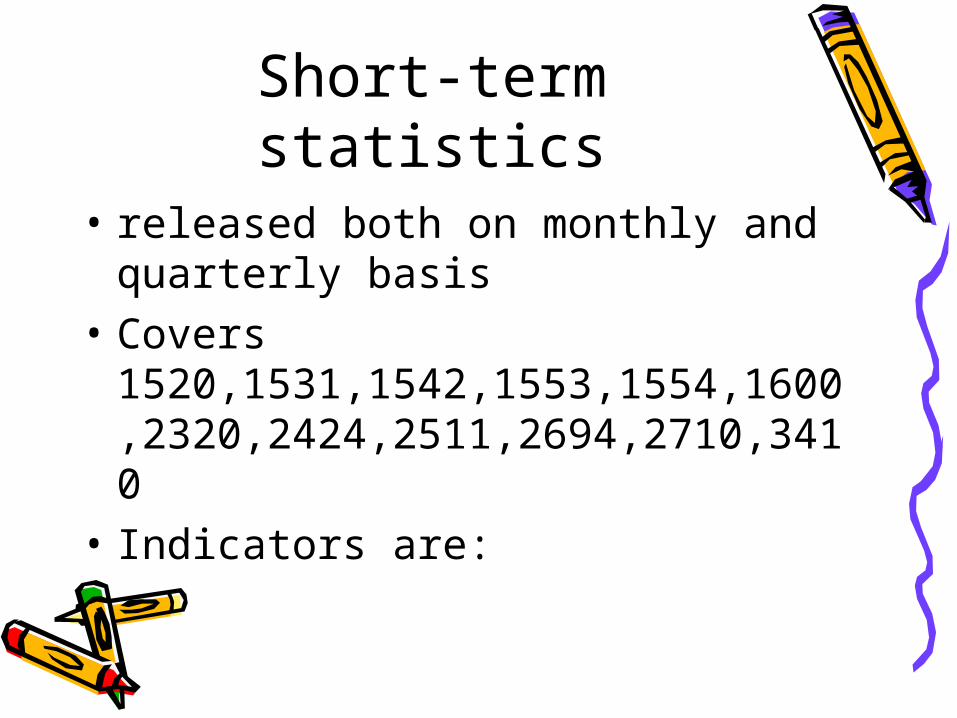
Short-term statistics• released both on monthly and
quarterly basis• Covers
1520,1531,1542,1553,1554,1600,2320,2424,2511,2694,2710,3410
• Indicators are:
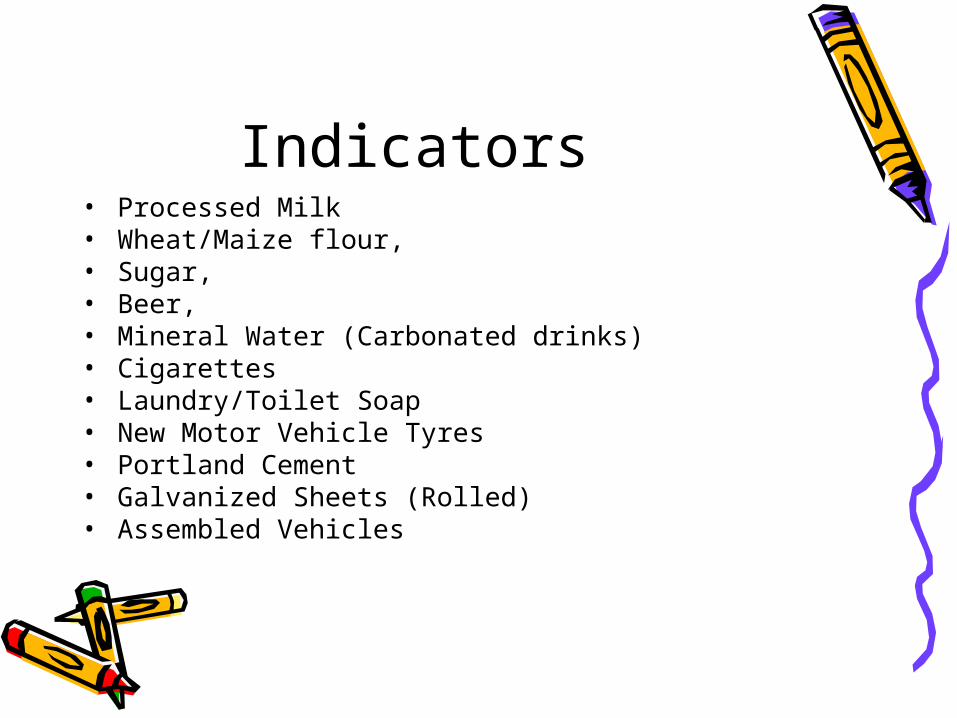
Indicators • Processed Milk• Wheat/Maize flour,• Sugar,• Beer,• Mineral Water (Carbonated drinks)• Cigarettes• Laundry/Toilet Soap• New Motor Vehicle Tyres• Portland Cement• Galvanized Sheets (Rolled)• Assembled Vehicles
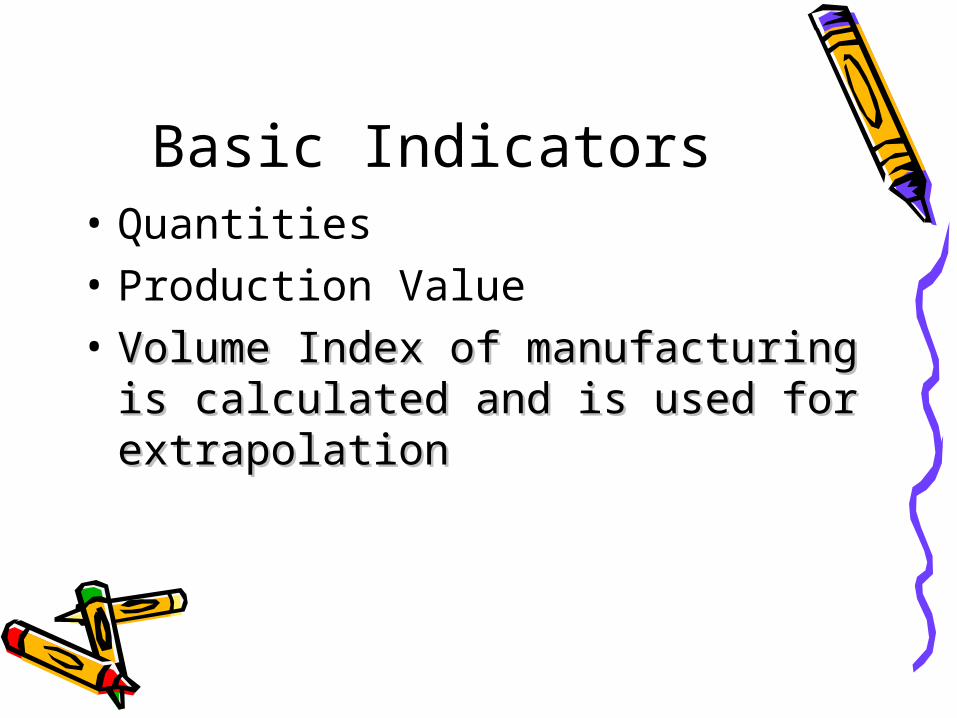
Basic Indicators• Quantities• Production Value • Volume Index of manufacturing is Volume Index of manufacturing is
calculated and is used for calculated and is used for extrapolationextrapolation
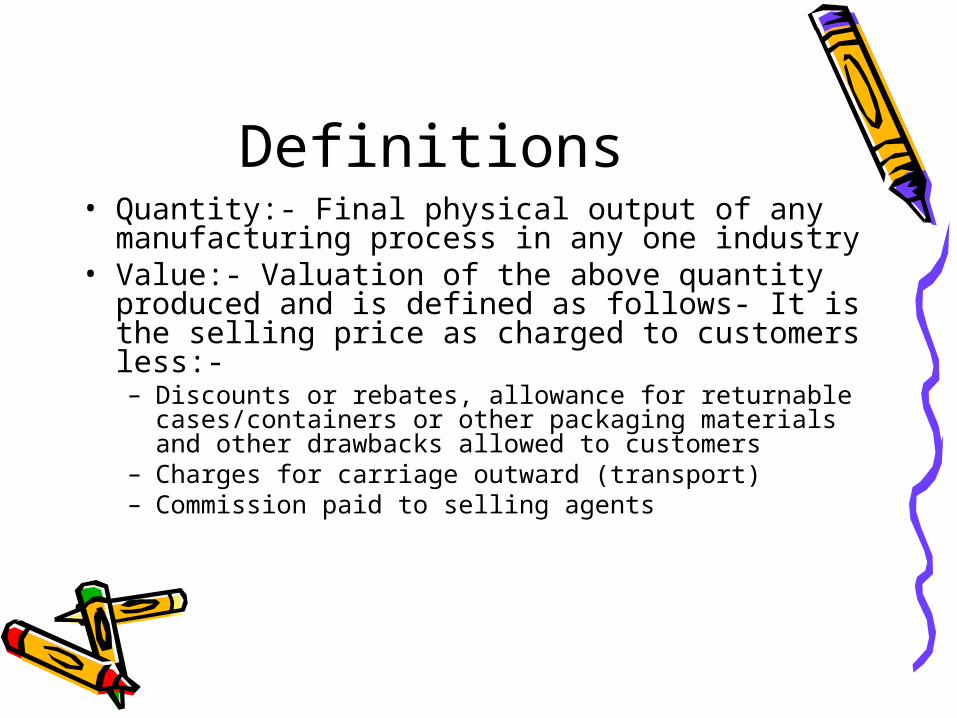
Definitions• Quantity:- Final physical output of any
manufacturing process in any one industry• Value:- Valuation of the above quantity
produced and is defined as follows- It is the selling price as charged to customers less:-– Discounts or rebates, allowance for returnable
cases/containers or other packaging materials and other drawbacks allowed to customers
– Charges for carriage outward (transport)– Commission paid to selling agents
04/18/2304/18/23 1010
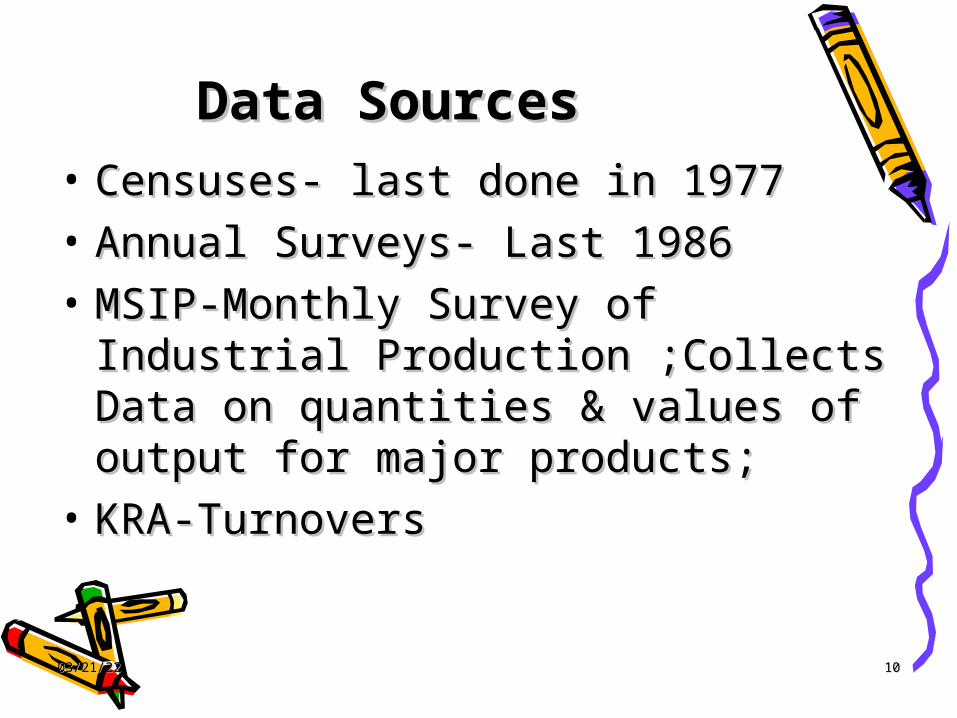
Data SourcesData Sources• Censuses- last done in 1977Censuses- last done in 1977• Annual Surveys- Last 1986Annual Surveys- Last 1986• MSIP-Monthly Survey of Industrial MSIP-Monthly Survey of Industrial
Production ;Collects Data on quantities Production ;Collects Data on quantities & values of output for major products; & values of output for major products;
• KRA-TurnoversKRA-Turnovers
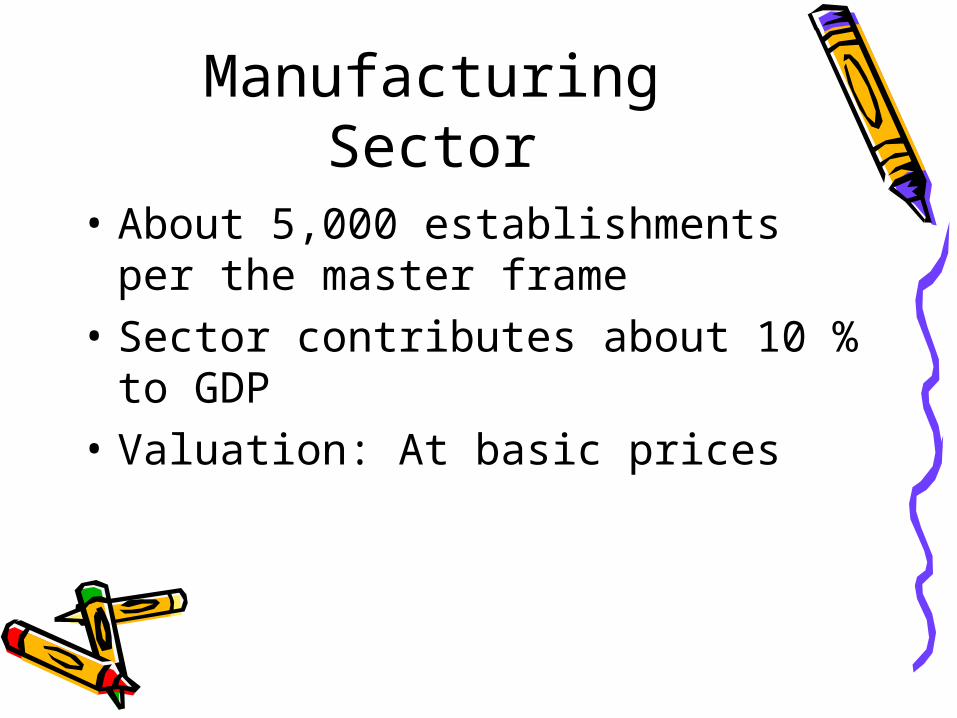
Manufacturing Sector• About 5,000 establishments per
the master frame• Sector contributes about 10 % to
GDP• Valuation: At basic prices
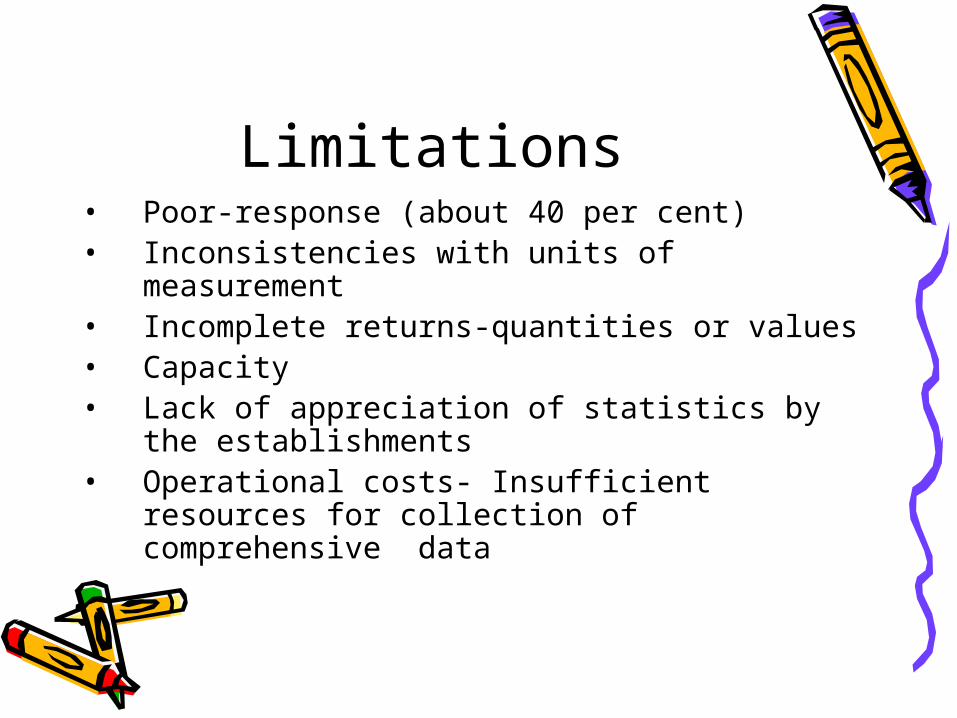
Limitations• Poor-response (about 40 per cent)• Inconsistencies with units of measurement• Incomplete returns-quantities or values• Capacity • Lack of appreciation of statistics by the
establishments• Operational costs- Insufficient resources for
collection of comprehensive data

Business Register• Available but outdated• In the second phase of updating
the register. System already in place
04/18/2304/18/23 1414
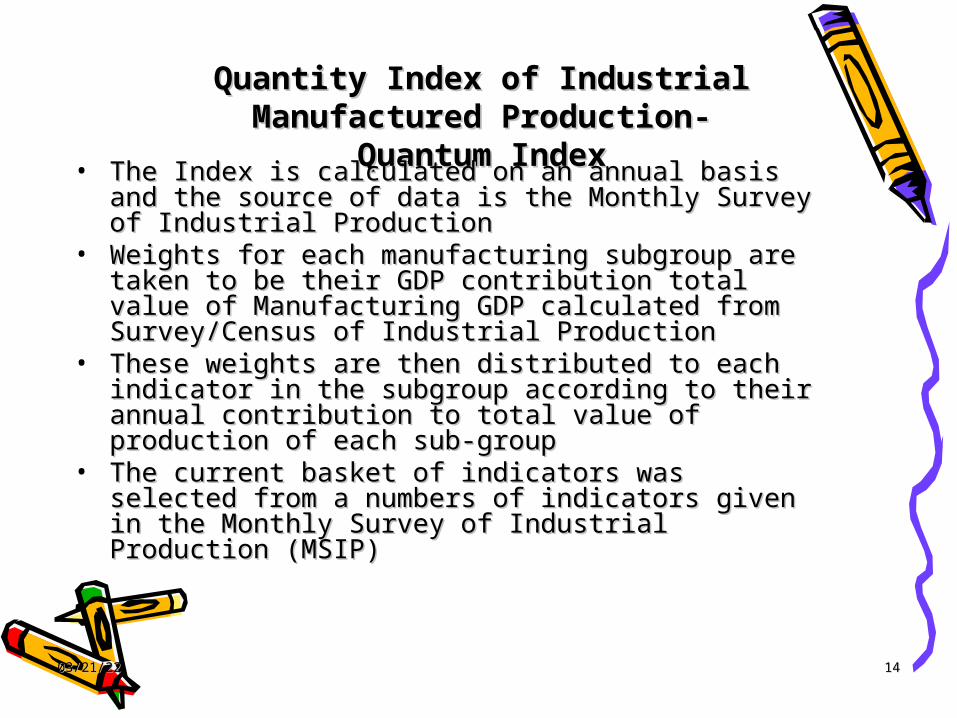
Quantity Index of Industrial Quantity Index of Industrial Manufactured Production- Manufactured Production-
Quantum IndexQuantum Index• The Index is calculated on an annual basis and the The Index is calculated on an annual basis and the source of data is the Monthly Survey of Industrial source of data is the Monthly Survey of Industrial ProductionProduction
• Weights for each manufacturing subgroup are taken Weights for each manufacturing subgroup are taken to be their GDP contribution total value of to be their GDP contribution total value of Manufacturing GDP Manufacturing GDP calculated from Survey/Census calculated from Survey/Census of Industrial Productionof Industrial Production
• These weights are then distributed to each indicator These weights are then distributed to each indicator in the subgroup according to their annual in the subgroup according to their annual contribution to total value of production of each sub-contribution to total value of production of each sub-group group
• The current basket of indicators was selected from a The current basket of indicators was selected from a numbers of indicators given in the Monthly Survey of numbers of indicators given in the Monthly Survey of Industrial Production (MSIP)Industrial Production (MSIP)
04/18/2304/18/23 1515
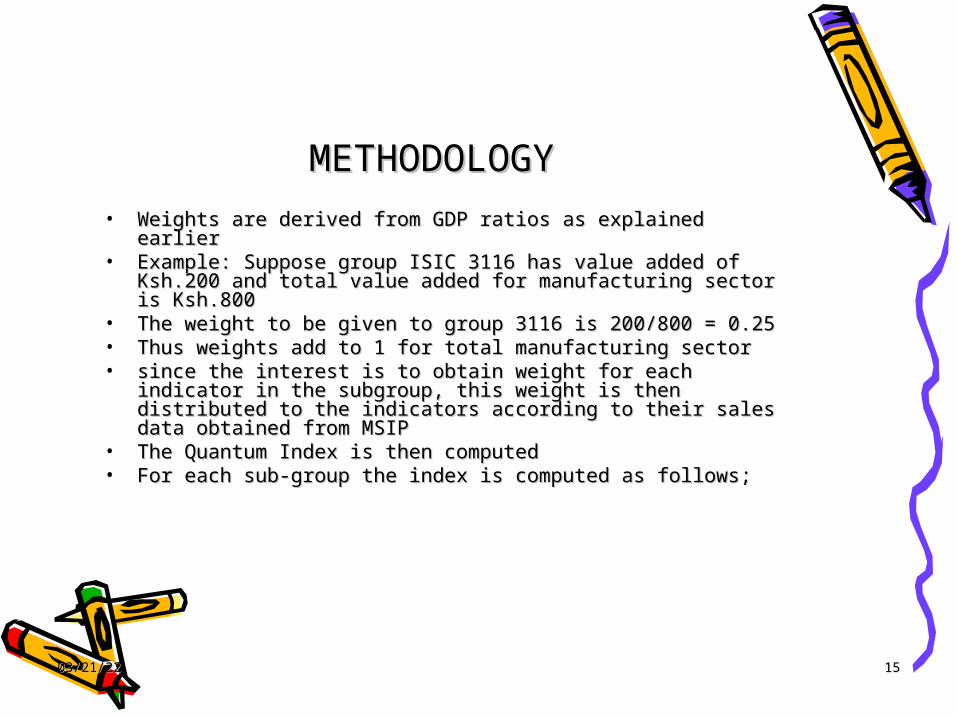
METHODOLOGYMETHODOLOGY
• Weights are derived from GDP ratios as explained earlierWeights are derived from GDP ratios as explained earlier• Example: Suppose group ISIC 3116 has value added of Example: Suppose group ISIC 3116 has value added of
Ksh.200 and total value added for manufacturing sector is Ksh.200 and total value added for manufacturing sector is Ksh.800Ksh.800
• The weight to be given to group 3116 is 200/800 = 0.25The weight to be given to group 3116 is 200/800 = 0.25• Thus weights add to 1 for total manufacturing sectorThus weights add to 1 for total manufacturing sector• since the interest is to obtain weight for each indicator in the since the interest is to obtain weight for each indicator in the
subgroup, this weight is then distributed to the indicators subgroup, this weight is then distributed to the indicators according to their sales data obtained from MSIP according to their sales data obtained from MSIP
• The Quantum Index is then computed The Quantum Index is then computed • For each sub-group the index is computed as follows;For each sub-group the index is computed as follows;
04/18/2304/18/23 1616
Quantum Index Quantum Index (1976=100). (1976=100).
• An annual volume index. An annual volume index. • It is a chained Laspeyers base year It is a chained Laspeyers base year
weighted index compiled at the 4-weighted index compiled at the 4-digit level of ISIC. digit level of ISIC.
• There are 194 indicators used in the There are 194 indicators used in the calculation of the index out of which calculation of the index out of which 192 are physical output indictors and 192 are physical output indictors and 2 are employment indicators. 2 are employment indicators.
• Weights derived from value added Weights derived from value added for the previous year. Benchmark for the previous year. Benchmark estimates based on the 1976 Census estimates based on the 1976 Census of Industrial Production brought of Industrial Production brought forward with earnings from the forward with earnings from the Labour Enumeration (LE) survey. Labour Enumeration (LE) survey.
04/18/2304/18/23 1717
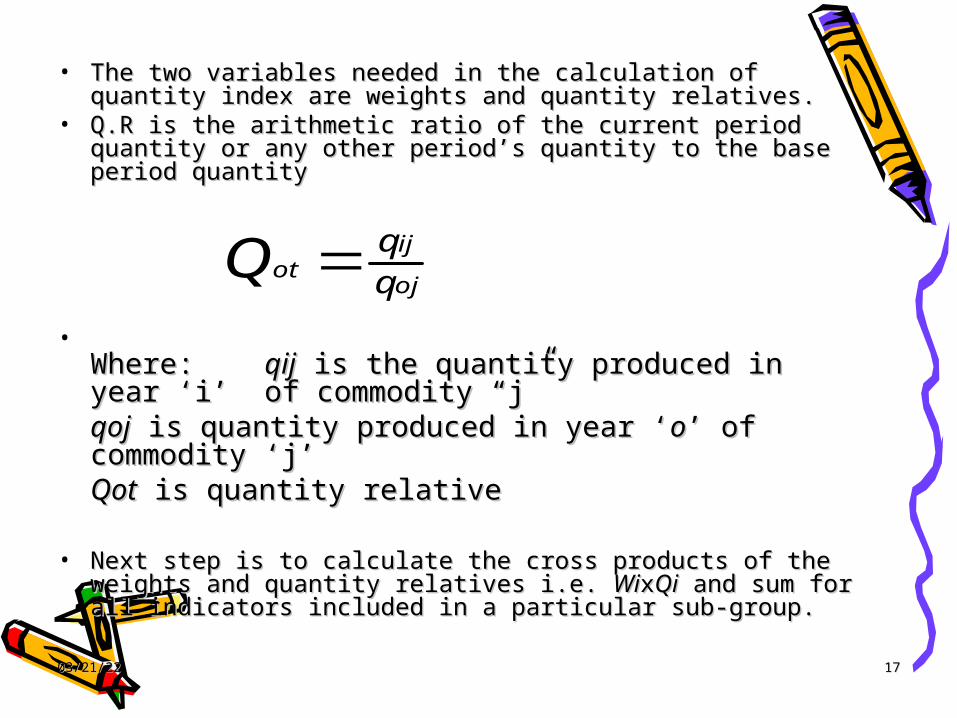
• The two variables needed in the calculation of quantity The two variables needed in the calculation of quantity index are weights and quantity relatives.index are weights and quantity relatives.
• Q.R is the arithmetic ratio of the current period quantity Q.R is the arithmetic ratio of the current period quantity or any other period’s quantity to the base period or any other period’s quantity to the base period quantityquantity
• Where:Where: qijqij is the quantity produced is the quantity produced in year ‘i’ in year ‘i’ of commodity “j” of commodity “j”
qojqoj is quantity produced in is quantity produced in year ‘year ‘oo’ of ’ of commodity ‘j’commodity ‘j’
QotQot is quantity relative is quantity relative
• Next step is to calculate the cross products of the Next step is to calculate the cross products of the weights and quantity relatives i.e. weights and quantity relatives i.e. WiWixxQiQi and sum for all and sum for all indicators included in a particular sub-group.indicators included in a particular sub-group.
oj
ijot q
04/18/2304/18/23 1818
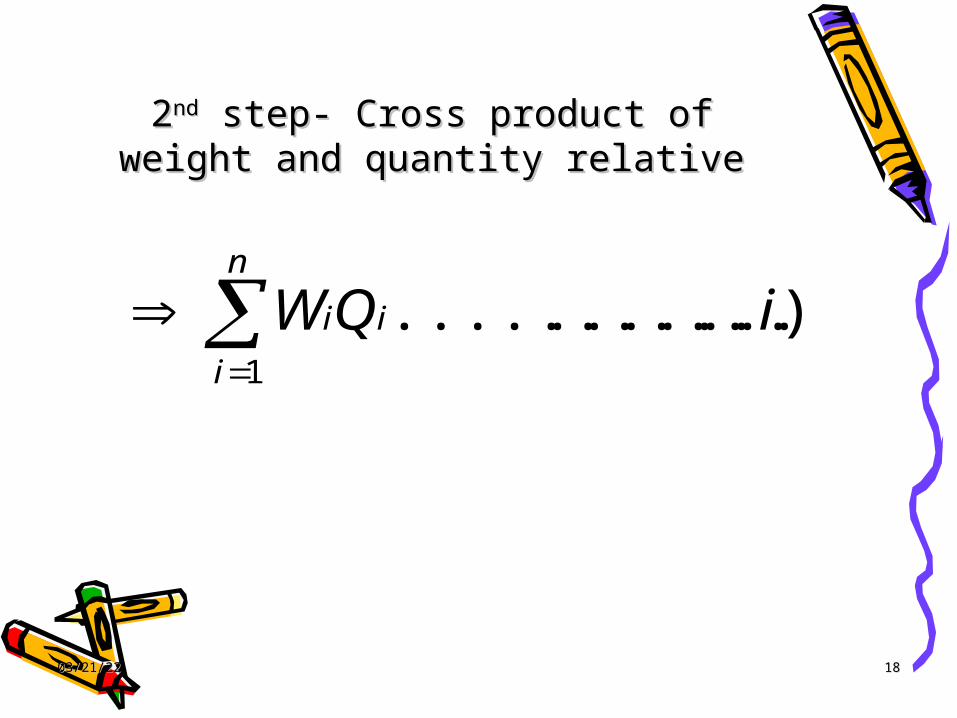
22ndnd step- Cross product of weight and step- Cross product of weight and quantity relativequantity relative
)...(....................1
iQWn
i
ii
04/18/2304/18/23 1919
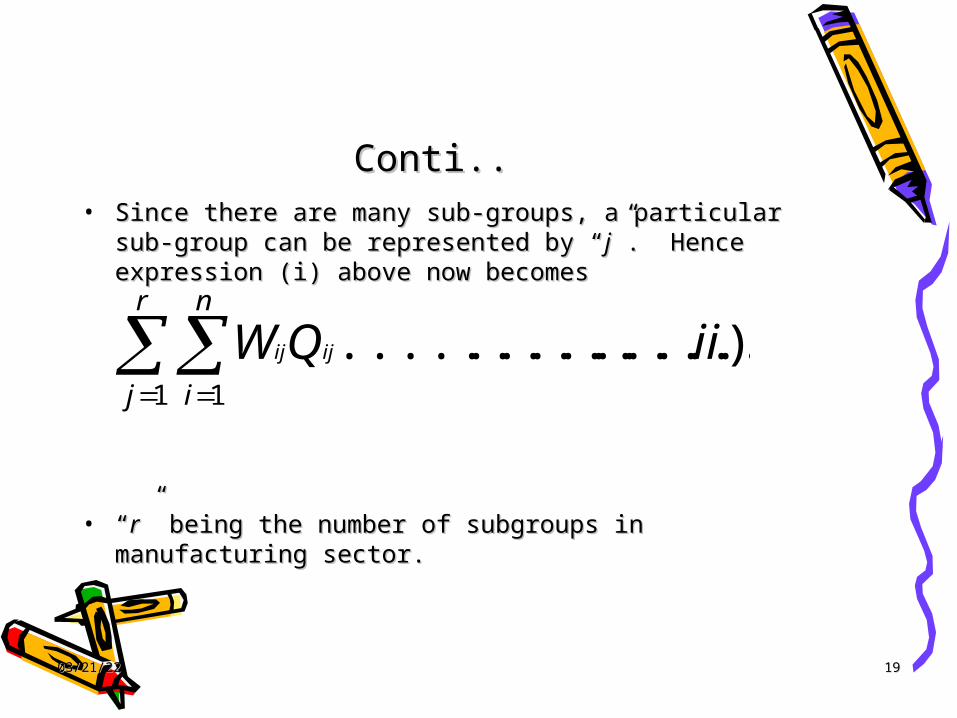
Conti..Conti..• Since there are many sub-groups, a particular sub-Since there are many sub-groups, a particular sub-
group can be represented by “group can be represented by “jj”. Hence ”. Hence expression (i) above now becomesexpression (i) above now becomes
• ““rr” being the number of subgroups in ” being the number of subgroups in manufacturing sector.manufacturing sector.
).......(....................1 1
iiQWr
j
n
i
ijij
04/18/2304/18/23 2020
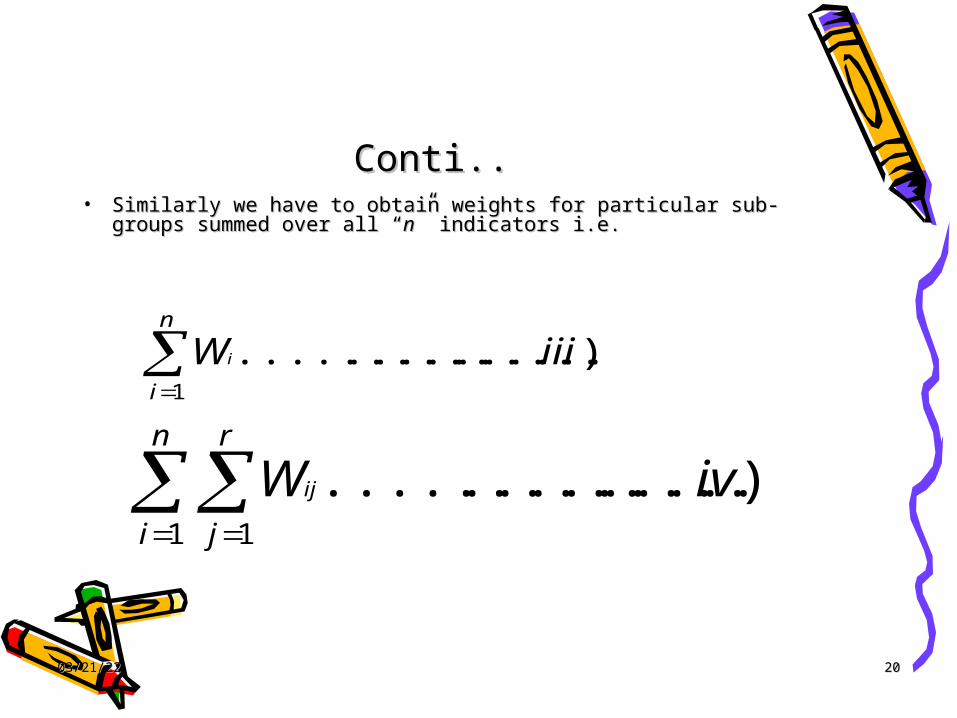
Conti..Conti..• Similarly we have to obtain weights for particular sub-Similarly we have to obtain weights for particular sub-
groups summed over all “groups summed over all “nn” indicators i.e.” indicators i.e.
).......(....................1
iiiWn
i
i
)......(....................1 1
ivWn
i
r
j
ij
04/18/2304/18/23 2121
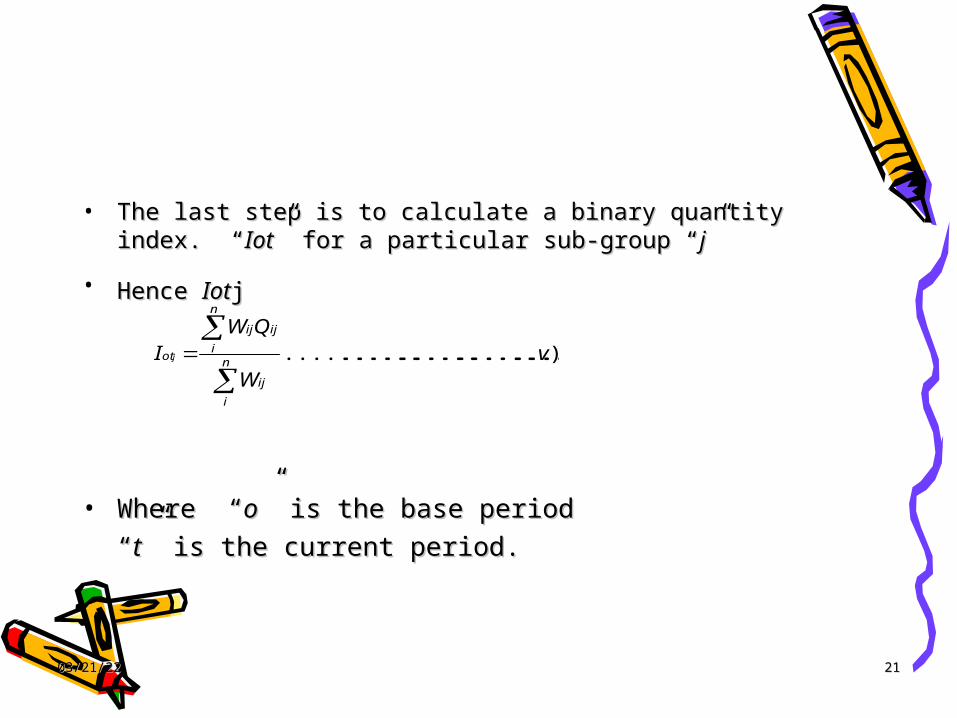
• The last step is to calculate a binary quantity index. The last step is to calculate a binary quantity index. ““IotIot” for a particular sub-group “” for a particular sub-group “jj” ”
• Hence Hence IotIotjj
• WhereWhere “ “oo” is the base period ” is the base period
““tt” is the current period.” is the current period.
)...(........................................ vW
QWI n
i
ij
n
i
ijij
otj
04/18/2304/18/23 2222
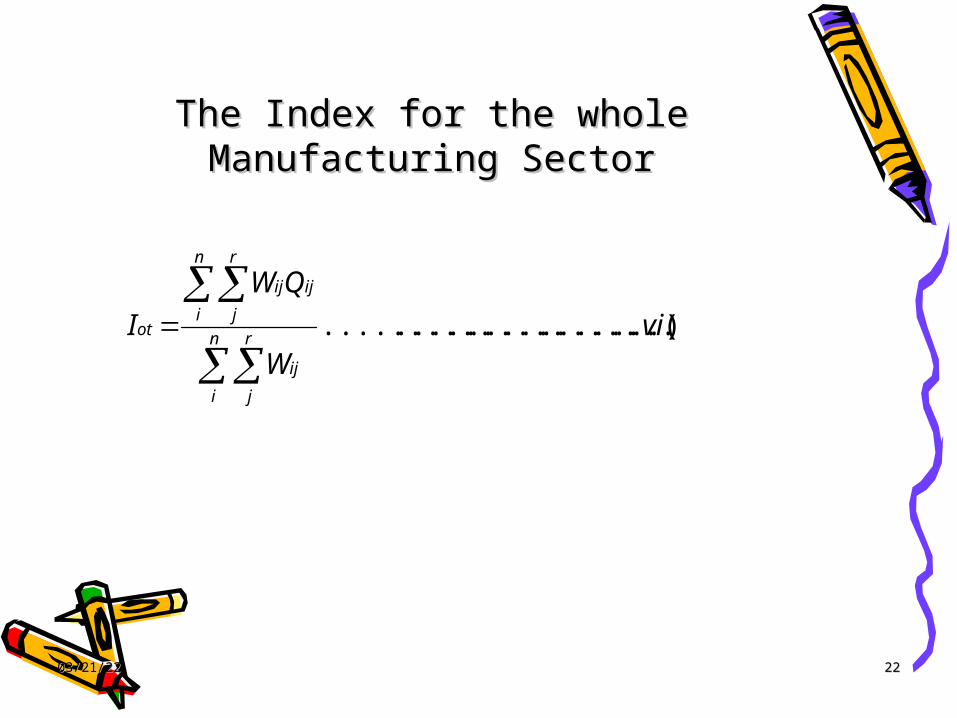
The Index for the whole The Index for the whole Manufacturing SectorManufacturing Sector
)...(........................................ viW
QW
I n
i
r
j
ij
n
i
r
j
ijij
ot
04/18/2304/18/23 2323
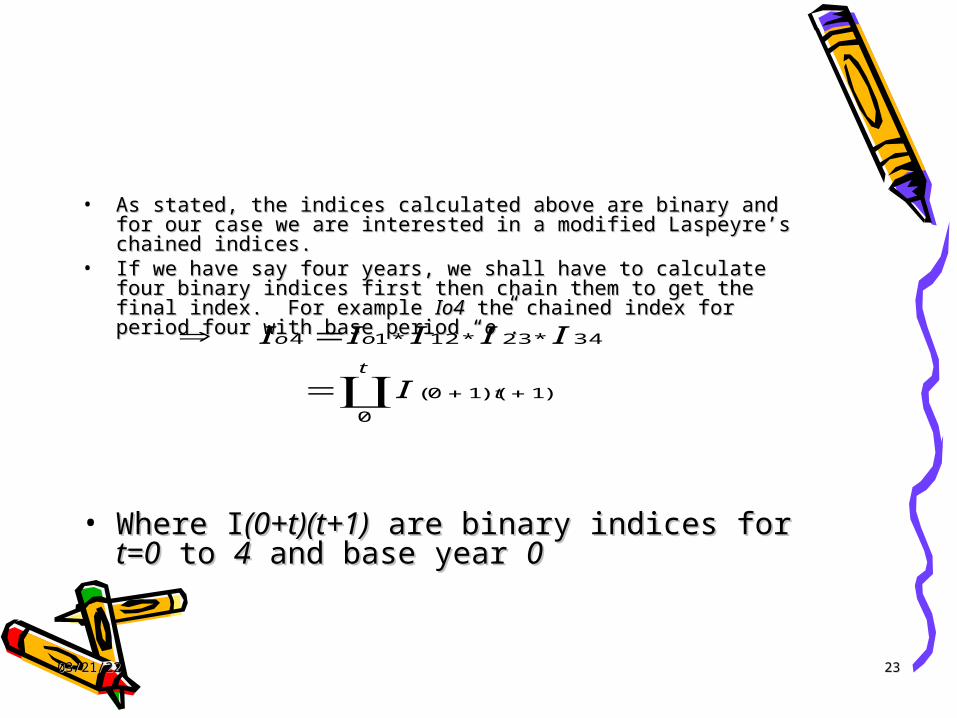
• As stated, the indices calculated above are binary and for our As stated, the indices calculated above are binary and for our case we are interested in a modified Laspeyre’s chained case we are interested in a modified Laspeyre’s chained indices. indices.
• If we have say four years, we shall have to calculate four binary If we have say four years, we shall have to calculate four binary indices first then chain them to get the final index. For example indices first then chain them to get the final index. For example Io4Io4 the chained index for period four with base period “ the chained index for period four with base period “oo”.”.
• Where IWhere I(0+t)(t+1)(0+t)(t+1) are binary indices for are binary indices for t=0t=0 to to 44 and base year and base year 00
)1
0
)(10(
34*23*12*14
t
t
oo
I
IIIII

04/18/2304/18/23 2424
ChallengeChallenge• This methodology is expected to give This methodology is expected to give
reliable results as it has the advantages reliable results as it has the advantages of chained indices modified to suit our of chained indices modified to suit our National demands. National demands.
• The big challenge to the Industry The big challenge to the Industry Section is to ensure that the figures on Section is to ensure that the figures on which these calculations are based are which these calculations are based are as reliable as possibleas reliable as possible
THANKSTHANKS