Embed Size (px)
Citation preview

43rd FLOOR ROBINSONS EQUITABLE TOWER ADB AVE. COR. POVEDA RD. ORTIGAS CENTER, PASIG CITY
TEL. NO.: 633-7631, 637-1670, 240-8801 FAX NO.: 633-9387 OR 633-9207
April 7, 2017
PHILIPPINE DEALING AND EXCHANGE CORP.
37/F, Tower 1, The Enterprise Center
6766 Ayala Avenue corner Paseo de Roxas
Makati City
Attention: Ms. Vina Vanessa S. Salonga
Head-Issuer Compliance and Disclosure Department
Gentlemen:
Please find attached a copy of the SEC Form 17-A of JG Summit Holdings, Inc. for the
fiscal year ended December 31, 2016 as filed with the Philippine Stock Exchange.
Thank you.
Very truly yours,
ROSALINDA F. RIVERA
Corporate Secretary
/mhd

COVER SHEET for
AUDITED FINANCIAL STATEMENTS
SEC Registration Number
1 8 4 0 4 4
C O M P A N Y N A M E
J G S U M M I T H O L D I N G S , I N C . A N D
S U B S I D I A R I E S
PRINCIPAL OFFICE( No. / Street / Barangay / City / Town / Province )
4 3 r d F l o o r , R o b i n s o n s - E q u i t a b l
e T o w e r , A D B A v e n u e c o r n e r P o v
e d a R o a d , P a s i g C i t y
Form Type Department requiring the report Secondary License Type, If Applicable
1 7 A
C O M P A N Y I N F O R M A T I O N
Company’s Email Address Company’s Telephone Number Mobile Number
[email protected] 633-7631
No. of Stockholders Annual Meeting (Month / Day) Fiscal Year (Month / Day)
1,043 2nd Thursday of June 12/31
CONTACT PERSON INFORMATION
The designated contact person MUST be an Officer of the Corporation
Name of Contact Person Email Address Telephone Number/s Mobile Number
Michele F. Abellanosa [email protected] 633-7631
CONTACT PERSON’s ADDRESS
41st Floor, Robinsons-Equitable Tower, ADB Avenue corner Poveda Road, Pasig City
NOTE 1 : In case of death, resignation or cessation of office of the officer designated as contact person, such incident shall be reported to the Commission within thirty (30) calendar days from the occurrence thereof with information and complete contact details of the new contact person designated. 2 : All Boxes must be properly and completely filled-up. Failure to do so shall cause the delay in updating the corporation’s records with the Commission and/or non-receipt of Notice of Deficiencies. Further, non-receipt of Notice of Deficiencies shall not excuse the corporation from liability for its deficiencies.

-1-
SECURITIES AND EXCHANGE COMMISSION
SEC FORM 17-A
ANNUAL REPORT PURSUANT TO SECTION 17
OF THE SECURITIES REGULATION CODE AND SECTION 141
OF THE CORPORATION CODE OF THE PHILIPPINES
1. For the fiscal year ended December 31, 2016
2. SEC Identification Number 184044 3. BIR Tax Identification No.000-775-860
4. Exact name of registrant as specified in its charter JG Summit Holdings, Inc.
5. Pasig City, Philippines 6. (SEC Use Only)
Province, Country or other jurisdiction of
incorporation or organization
Industry Classification Code:
7. 43rd Floor, Robinsons-Equitable Tower, ADB Ave. corner Poveda Road, Pasig City 1600
Address of principal office Postal Code
8. (632) 633-7631
Registrant's telephone number, including area code
9. Not Applicable
Former name, former address, and former fiscal year, if changed since last report.
10. Securities registered pursuant to Sections 8 and 12 of the RSC, or Sec. 4 and 8 of the RSA
Title of Each Class Number of Shares of Common Stock
Outstanding and Amount of Debt Outstanding
Common Stock 7,162,841,657
Long-term Debt 30,000,000,000
11. Are any or all of these securities listed on a Stock Exchange.
Yes [ / ] No [ ]
If yes, state the name of such stock exchange and the classes of securities listed herein:
Philippine Stock Exchange (PSE)
Common Stock
12. Check whether the registrant:
(a) has filed all reports required to be filed by Section 17 of the SRC and SRC Rule 17
thereunder or Section 11 of the RSA and RSA Rule 11(a)-1 thereunder and Sections 26 and
141 of The Corporation Code of the Philippines during the preceding 12 months (or for such
shorter period that the registrant was required to file such reports);
Yes [ / ] No [ ]
-2-
(b) has been subject to such filing requirements for the past 90 days.
Yes [ / ] No [ ]
13. State the aggregate market value of the voting stock held by non-affiliates of the registrant. The
aggregate market value shall be computed by reference to the price at which the stock was sold,
or the average bid and asked prices of such stock, as of a specified date within 60 days prior to
the date of filing. If a determination as to whether a particular person or entity is an affiliate
cannot be made without involving unreasonable effort and expense, the aggregate market value
of the common stock held by non-affiliates may be calculated on the basis of assumptions
reasonable under the circumstances, provided the assumptions are set forth in this Form. (See
definition of "affiliate" in “Annex B”).
The aggregate market value of stocks held by non-affiliates is P=463,679,943,019.

-3-
TABLE OF CONTENTS
Page No.
PART I - BUSINESS AND GENERAL INFORMATION
Item 1 Business............................................................................................. 4
Item 2 Properties........................................................................................... 37
Item 3 Legal Proceedings.............................................................................. 41
Item 4 Submission of Matters to a Vote of Security Holders.......................... 41
PART II - OPERATIONAL AND FINANCIAL INFORMATION
Item 5 Market for Registrant’s Common Equity and
Related Stockholder Matters............................................................... 42
Item 6 Management’s Discussion and Analysis or Plan of Operation............ 44
Item 7 Financial Statements........................................................................... 70
Item 8 Information on Independent Accountant
and other Related Matters...................................................... 70
PART III - CONTROL AND COMPENSATION INFORMATION
Item 9 Directors and Executive Officers of Registrant.................................. 71
Item 10 Executive Compensation................................................................... 78
Item 11 Security Ownership of Certain Record and Beneficial
Owners and Management....................................................... 79
Item 12 Certain Relationships and Related Transactions............................... 81
PART IV - CORPORATE GOVERNANCE
Item 13 Corporate Governance...................................................................... 82
PART V - EXHIBITS AND SCHEDULES
Item 14 Exhibits and Reports on SEC Form 17-C........................................... 82
SIGNATURES.................................................................................................... 83
INDEX TO FINANCIAL STATEMENTS AND
SUPPLEMENTARY SCHEDULES

-4-
PART I - BUSINESS AND GENERAL INFORMATION
Item 1. Description of Business
(A) Business Development
JG Summit Holdings, Inc. (JG Summit / the Company), which is controlled by the Gokongwei
Family, was incorporated in November 1990 as the holding company for a group of
companies with substantial business interests in foods, agro-industrial and commodities, real
estate and hotel, air transportation, banking and petrochemicals. The Company also has core
investments in telecommunications and power generation and distribution.
The Company is one of the largest and most diversified conglomerates within the Philippines.
The Company was listed on the PSE in 1993.
The Company and its subsidiaries (the Group), conduct businesses throughout the
Philippines, but primarily in and around Metro Manila (where it is based) and in the regions of
Luzon, Visayas and Mindanao.
The Group also has a branded consumer foods business in the People’s Republic of China (PRC), ASEAN and Oceania (New Zealand and Australia) regions, and a core investment in a property development company in Singapore. The Company has not been into any bankruptcy, receivership or similar proceedings for the past two years. The Gokongwei Family beneficially owns approximately 18.2% of the outstanding share capital of the Company. In addition, certain members of the Gokongwei Family are trustees of the Gokongwei Brothers Foundation, which holds interest in approximately 27.9% of the existing outstanding share capital of the Company.

-5-
(B) Business of Issuer
The industry segments where the Company and its subsidiaries and affiliates operate are
summarized below:
JG Summit Holdings, Inc.
Foods, Agro-Industrial & Commodities Petrochemicals Air Transportation
Banks Real Estate and Hotels Supplementary Businesses
CP Air Holdings, Inc. and Subsidiaries
(100%)
JG Summit Petrochemical
Corp. (100%)
Universal Robina Corporation and
Subsidiaries (55.3%)
Philippine Long Distance Telephone
Co. (8.0%)
Robinsons Bank Corporation
(60%) Robinsons Land Corporation and
Subsidiaries (61.0%)
JG Summit (Cayman), Ltd. (100%)
JG Summit Capital Services Corporation
and Subsidiaries (100%)
JG Summit Philippines Ltd. and Subsidiaries
(100%)
Batangas Agro-Industrial Development Corp. and
Subsidiaries (100%)
Express Holdings, Inc. (100%)
Unicon Insurance Brokers Corp. (100%)
Core Investments
JG Summit Olefins Corp. (100%)
United Industrial Corporation Ltd.
(37.0%)
Legazpi Savings Bank (100%)
Manila Electric Company (27.1%)
Cebu Air, Inc. (67.2%)
Global Business Power Corporation
(30.0%)

-6-
The following table shows the breakdown of the Company’s revenues and net profits from continuing operations by business areas (in millions except % amounts):
REVENUES Net Income attributable to Parent Co.
2016 2015 2014 2016 2015 2014
Peso % Peso % Peso % Peso % Peso % Peso %
Food, Agro-Industrial and
Commodity Food Products
112,458
47
111,779
49
96,578
52
7,172
66
7,738
34
6,668
36
Air Transportation 62,078 26 56,537 25 52,096 28 6,558 60 2,950 13 574 3
Petrochemicals 29,960 12 27,745 12 3,801 2 5,126 47 3,156 14 (759) (4)
Real estate and hotels 25,578 11 22,838 10 19,956 11 6,295 58 6,137 27 5,413 29
Banks 3,419 1 2,969 1 2,717 1 154 1 64 1 88 1
Other Supplementary
Businesses
7,941
3
8,400
3
10,274
6
(14,321)
(131)
2,663
11
6,309
35
Adjustments/eliminations (931) – (996) – (610) – (66) (1) (98) – (48) –
Total from Continuing
Operations 240,503 100 229,272 100 184,812 100 10,918 100 22,610 100 18,245 100
Information as to domestic and foreign revenues, including foreign currency denominated
revenues and dollar linked revenues, and their contributions to total revenues follow (in
millions except % amounts):
2016 2015 2014
Amount % Amount % Amount %
Domestic 163,546 68 152,282 66 134,050 73
Foreign 76,957 32 76,990 34 50,762 27
240,503 100 229,272 100 184,812 100
a) FOODS, AGRO-INDUSTRIAL AND COMMODITIES
Business Development
The Company operates its food business through Universal Robina Corporation (URC),
which is one of the largest branded food product companies in the Philippines, with the
distinction of being called the country’s first “Philippine Multinational.” It has established a
strong presence in ASEAN and has further expanded its reach to the Oceania region through
the acquisitions of Griffin’s Food Limited and Snack Brands Australia. URC was founded in
1954 when Mr. John Gokongwei, Jr. established Universal Corn Products, Inc., a cornstarch
manufacturing plant in Pasig. URC is involved in a wide range of food-related businesses,
including the manufacture and distribution of branded consumer foods, production of hogs
and day-old pullets, manufacture of animal feeds and veterinary products, flour milling, and
sugar milling and refining. It has also ventured into the renewables business for sustainability
through Distillery and Cogeneration divisions. In the Philippines, URC is a dominant player
with leading market shares in salty snacks, candies and chocolates and is a significant player
in biscuits. It is also the largest player in the RTD tea market and cup noodles, and is a
respectable 2nd player in coffee business. With the acquisition of Balayan Mill last February
2016, URC Sugar division is now the largest producer in the country based on capacity.

-7-
Principal Products or Services
URC operates its food business through operating divisions and wholly owned or majority-
owned subsidiaries that are organized into three core business segments: branded consumer
foods, agro-industrial products and commodity food products.
Branded consumer foods (BCF) segment, including our packaging division, is URC’s largest
segment contributing about 82.8% of revenues for the year ended December 31, 2016.
Established in the 1960s, the branded consumer foods segment manufactures and
distributes a diverse mix of salty snacks, chocolates, candies, biscuits, packaged cakes,
beverages, instant noodles and pasta, and tomato-based products. The manufacture,
distribution, sales, and marketing activities of URC’s consumer foods products are carried out
mainly through its branded consumer foods division consisting of snack foods, beverage, and
grocery groups, although it conducts some of its branded consumer foods operations through
its majority-owned subsidiaries and joint venture companies. URC established the Packaging
division to engage in the manufacture of bi-axially oriented polypropylene (BOPP) films for
packaging companies. The BOPP plant, located in Batangas, began its commercial
operations in June 1998 and holds the distinction of being the only Integrated Management
System ISO-certified BOPP plant in the country today, with its Quality ISO 9001:2008 and
Environmental ISO 14001:2004 Standards. URC also formed Food Service and Industrial
division that supply BCF products in bulk to certain institutions like hotels, restaurants, and
schools.
Majority of URC’s consumer foods business is conducted in the Philippines but has expanded
more aggressively into other ASEAN markets, primarily through its wholly-owned subsidiary,
URC International. In 2014, URC has expanded its reach to the Oceania region through the
acquisition of Griffin’s Foods Limited, a leading snackfoods player in New Zealand, which
owns many established brands such as Griffin’s, Cookie Bear, Eta, Huntley & Palmer’s, and
Nice & Natural. In September 2016, URC completed the acquisition of Consolidated Snacks
Pty Ltd., which trades under the company name Snack Brands Australia (SBA), the second
largest salty snacks player in Australia with a wide range of chips including the iconic brands
like Kettle, Thins, CC’s and Cheezels. The international operations contributed about 29.3%
of URC’s revenues for the year ended December 31, 2016.
URC’s agro-industrial products segment operates four segments: (1) Robina Farm-Hogs, (2)
Robina Farm-Poultry, (3) the manufacturing and distribution of animal feeds (URC Feeds),
and (4) the production and distribution of animal health products (URC Veterinary Drugs).
This segment contributed approximately 8.2% of URC’s revenues in 2016.
URC’s commodity food products segment operates three divisions: (1) sugar milling and
refining through Sugar division, (2) flour milling and pasta manufacturing through Flour
division, and (3) renewable energy development through Distillery and Cogeneration
divisions. This segment contributed approximately 9.0% of URC’s revenues in 2016.
The percentage contribution to URC’s revenues for the three years ended December 31,
2016, 2015 and 2014 by each of URC’s principal business segments is as follows:
For the years ended December 31
2016 2015 2014
Branded Consumer Foods 82.8% 84.0% 83.9% Agro-Industrial Products 8.2% 8.0% 8.7% Commodity Food Products 9.0% 8.0% 7.4%
100.0% 100.0% 100.0%

-8-
The geographic percentage distribution of URC’s revenues for the period ended
December 31, 2016, 2015 and 2014 is as follows:
For the years ended December 31
2016 2015 2014
Philippines 70.7% 69.2% 73.7% International 29.3% 30.8% 26.3%
100.0% 100.0% 100.0%
Customers
URC’s businesses are not dependent upon a single customer or a few customers that a loss
of anyone of them would have a material adverse effect on URC. URC has no single
customer that, based upon existing orders, will account for 20.0% or more of its total sale of
goods and services.
Distribution, Sales and Marketing
URC has developed an effective nationwide distribution chain and sales network that it
believes provide its competitive advantage. URC sells its branded food products primarily to
supermarkets, as well as directly to top wholesalers, large convenience stores, large scale
trading companies and regional distributors, which in turn sell its products to other small
retailers and down line markets. URC’s branded consumer food products are distributed to
approximately 120,000 outlets in the Philippines and sold through its direct sales force and
regional distributors. URC intends to enlarge its distribution network coverage in the
Philippines by increasing the number of retail outlets that its sales force and distributors
directly service.
The branded consumer food products are generally sold by URC from salesmen to
wholesalers or supermarkets, and regional distributors to small retail outlets. 15 to 30 day
credit terms are extended to wholesalers, supermarkets and regional distributors.
URC believes that its emphasis on marketing, product innovation and quality, and strong
brand equity has played a key role in its success in achieving leading market shares in the
different categories where it competes. In particular, URC launched “Jack n’ Jill” as a master
umbrella brand for all its snack food products in order to enhance customer recognition. URC
devotes significant expenditures to support advertising and branding to differentiate its
products and further expand market share both in the Philippines and its overseas markets,
including funding for advertising campaigns, such as television commercials and radio and
print advertisements, as well as trade and consumer promotions.
For URC’s agro-industrial segment, both hogs and poultry farms have been accredited as
GAHP (Good Animal Husbandry Practice) and its meats and eggs have been certified as No
Hormone, and Antibiotic residue free. This has allowed URC to aggressively capture the
quality conscious meat segment of the country as embodied by the Robina Farms brand with
its key positioning of Robina raised, Family safe products. Similarly, the Feeds business
headed by their brand champions such as Uno+, Supremo Gamefowl and Top Breed Dog
meals increased its distribution network supported by the Kabalikat Farm Program covering
Hog and Gamefowl raisers.

-9-
Competition
The consumer foods business is highly competitive and competition varies by country and
product category. URC believes that the principal competitive factors include price, taste,
quality, convenience, brand recognition and awareness, advertising and marketing,
availability of products and ability to get its products widely distributed. Generally, URC faces
competition from both local and multinational companies in all of its markets. In the
Philippines, major competitors in the market segments in which it competes include Liwayway
Manufacturing Corp., Columbia Foods International, Republic Biscuit Corporation, Suncrest
Foods Inc., Del Monte Phil. Inc., Monde Nissin Corporation, Nestle Philippines Inc., San
Miguel Pure Foods Company Inc. and Kraft Foods Inc. Internationally, major competitors
include Procter & Gamble, Effem Foods/Mars Inc., Lotte Group, Perfetti Van Melle Group,
Mayora Inda PT, Apollo Food, Frito-Lay, Nestlé S.A., Cadbury Schweppes PLC and Kraft
Foods International.
The market for the agro-industrial business is highly fragmented, very competitive, cyclical
and principally domestic. URC is focused and known in providing Total Agri-Solution and
farm management expertise including state of the art diagnostic capability.
URC’s commercial feeds segment principal competitive factors are quality, brand equity,
credit term and price. It faces competition from local, multinational companies, and even
foreign companies in all of its markets. Since the business is highly fragmented, it also faces
increasing speed of change in the market particularly customer preferences and lifestyle.
URC’s principal competitors are San Miguel Corporation (B-Meg and Integra), UNAHCO
(Sarimanok, Thunderbird and GMP), and Aboitiz Inc. (Pilmico). A number of multinationals
including Cargil Purina Phils. Inc, CJ and Sun Jun of Korea, and New Hope of China are also
key players in the market. The market for commercial drugs is dominated by multinationals
and URC AIG is one of the only few Philippine companies in this market. URC’s principal
competitors are Pfizer, Inc., UNAHCO (Univet), and Merial Limited, a company jointly owned
by Merk and Co., Inc. and Aventis. S.A.
URC believes that the principal competitive factors for hogs are quality, reliability of supply,
price, and proximity to market. Its principal competitors are San Miguel Corp. (Monterey) and
Aboitiz Inc. (Pilmico). URC considers quality, price, egg productivity, and disease resistance
as the principal competitive factors of its poultry business. Its principal competitors are
Bounty Farms, Inc., Foremost Farms, Inc., Brookdale Farms, and Heritage Vet Corp. for layer
chicks.
Enhancement and development of New Products
URC intends to continuously introduce innovative new products, product variants and line
extensions in the snackfoods (snacks, biscuits, candies, chocolates and bakery), beverage
and grocery (instant noodles and tomato-based) products. In 2016 alone, URC’s Philippines
branded consumer foods segment has introduced 44 new products.
URC supports the rapid growth of the business through line expansion, construction and
acquisition of plants.
Raw Materials/Suppliers
A wide variety of raw materials are required in the manufacture of URC’s food products,
including corn, wheat, flour, sugar, robusta coffee beans, palm oil and cocoa powder. Some
of which are purchased domestically and some of which were imported. URC also obtains a
major portion of its raw materials from its agro-industrial and commodity food products
segments, such as flour and sugar, and flexible packaging materials from its packaging

-10-
segment. A portion of flexible packaging material requirements is also purchased both locally
and from abroad (Vietnam and Indonesia), while aseptic packaging is purchased entirely from
China.
For its feeds segment, URC requires a variety of raw materials, including corn grains, soya
beans and meals, feed-wheat grains, wheat bran, wheat pollard, soya seeds, rice bran, copra
meal and fish meal. URC purchases corn locally from corn traders and imports feed-wheat
from suppliers in China, North America, and Europe. Likewise, soya seeds are imported from
the USA. For its animal health products, URC requires a variety of antibiotics and vitamins,
which it acquires from suppliers in Europe and Asia. URC maintains approximately two
months physical inventory and one month in-transit inventory for its imported raw materials.
For its hog business, URC requires a variety of raw materials, primarily close-herd breeding
stocks. For its poultry business, URC purchases the parent stock for its layer chicks from
Dekalb from Europe and Hyline from USA. Robina Farms obtains all of the feeds it requires
from its Feeds segment and substantially all of the minerals and antibiotics from its Veterinary
Drugs segment as part of its vertical integration. URC purchases vaccines, medications and
nutritional products from a variety of suppliers based on the values of their products.
URC obtains sugar cane from local farmers. Competition for sugar cane supply is very
intense and is a critical success factor for its sugar business. Additional material
requirements for the sugar cane milling process are either purchased locally or imported.
URC generally purchases wheat, the principal raw material for its flour milling and pasta
business, from suppliers in the United States, Canada and Australia.
URC’s policy is to maintain a number of suppliers for its raw and packaging materials to
ensure a steady supply of quality materials at competitive prices. However, the prices paid
for raw materials generally reflect external factors such as weather conditions, commodity
market fluctuations, currency fluctuations and the effects of government agricultural
programs. URC believes that alternative sources of supply of the raw materials that it uses
are readily available. Its policy is to maintain approximately 30 to 90 days of inventory.
Patents, Trademarks, Licenses, Franchises, Concessions or Labor Contract
URC owns a substantial number of trademarks registered with the Bureau of Trademarks
subject to the provisions of RA 8293 also known as the Intellectual Property Code of the
Philippines (IP Code) and recorded with the Intellectual Property Office of the Philippines
(IPOPhil). In addition, certain trademarks have been strategically registered in other
countries in which it operates. These trademarks are important in the aggregate because
brand name recognition is a key factor in the success of many of its product lines.
Trademark registration is a means to protect these brand names from counterfeiting and
infringement.
Trademarks registered under RA 166, also known as the Trademark Law, are registered for
twenty (20) years. Upon renewal, these trademarks become subject to the IP Code having a
registration period of ten (10) years and renewable thereafter. In general, trademarks in
other countries have a ten-year registration which are renewable as well, allowing relatively a
lifetime of territorial and limited trademark registration.
URC also uses brand names under licenses from third parties. These licensing arrangements are generally renewable based on mutual agreement. Its licensed brands include Nissin Cup Noodles, Nissin Yakisoba Instant Noodles and Nissin Pasta Express, as well as Hunt’s Tomato and Hunt’s Pork and Beans among others. Licensing Agreements are

-11-
voluntarily registered with the Documentation, Information and Technology Transfer Bureau of the IPOPhil. Regulatory Overview
As manufacturer of consumer food and commodity food products, URC is required to
guarantee that the products are pure and safe for human consumption, and that it conforms
to standards and quality measures prescribed by the Bureau of Food and Drugs.
URC’s sugar mills are licensed to operate by the Sugar Regulatory Administration and renew
its sugar milling licenses at the start of every crop year. URC is also registered with the
Department of Energy as a manufacturer of bio-ethanol and as a renewable energy
developer.
All of URC’s livestock and feed products have been registered with and approved by the
Bureau of Animal Industry, an agency of the Department of Agriculture which prescribes
standards, conducts quality control test of feed samples, and provides technical assistance to
farmers and feed millers.
Some of URC’s projects, such as the sugar mill and refinery, bioethanol production, biomass power cogeneration and hog and poultry farm operations are registered with the Board of Investments (BOI) which allows URC certain fiscal and non-fiscal incentives.
Effects of Existing or Probable Governmental Regulations on the Business
URC operates its businesses in a highly regulated environment. These businesses depend
upon licenses issued by government authorities or agencies for their operations. The
suspension or revocation of such licenses could materially and adversely affect the operation
of these businesses.
Research and Development
URC develops new products and variants of existing product lines, researches new
processes and tests new equipment on a regular basis in order to maintain and improve the
quality of its food products. In Philippine operations alone, about P=35 million was spent for
research and development activities for 2016 and approximately P=42 million and P=43 million
for 2015 and 2014, respectively.
URC has research and development staff for its branded consumer foods and packaging
divisions located in its research and development facility in Metro Manila and in each of its
manufacturing facilities. In addition, URC hires experts from all over the world to assist its
research and development staff. It conducts extensive research and development for new
products, line extensions for existing products and for improved production, quality control
and packaging as well as customizing products to meet the local needs and tastes in the
international markets. URC’s commodity foods segment also utilizes this research and
development facility to improve their production and quality control. It also strives to
capitalize on its existing joint ventures to effect technology transfers.
URC has a dedicated research and development team for its agro-industrial business that continually explores advancements in feeds, breeding and farming technology. It regularly conducts market research and farm-test for all of its products. As a policy, no commercial product is released if it was not tested and used in Robina Farms.
Transactions with Related Parties The largest shareholder, JG Summit Holdings, Inc., is one of the largest and most diversified conglomerates listed on the Philippine Stock Exchange. JG Summit provides URC with

-12-
certain corporate center services including corporate finance, corporate planning, procurement, human resources, legal and corporate communications. JG Summit also provides URC with valuable market expertise in the Philippines as well as intra-group synergies.
Costs and Effects of Compliance with Environmental Laws The operations of URC are subject to various laws enacted for the protection of the environment, including the Pollution Control Law (R.A. No. 3931, as amended by P.D. 984), the Solid Waste Management Act (R.A. No. 9003), the Clean Air Act (R.A. No. 8749), the Environmental Impact Statement System (P.D. 1586) and the Laguna Lake Development Authority (LLDA) Act of 1966 (R.A. No. 4850). URC believes that it has complied with all applicable environmental laws and regulations, an example of which is the installation of wastewater treatments in its various facilities. Compliance with such laws does not have, and in URC’s opinion, is not expected to have, a material effect upon its capital expenditures, earnings or competitive position. As of December 31, 2016, URC has invested about P=222 million in wastewater treatment in its facilities in the Philippines.
b) REAL ESTATE AND HOTELS
Business Development The Company operates its real estate business through Robinsons Land Corporation (RLC), which is one of the Philippines’ leading real estate developers in terms of revenues, number of projects and total project size. It is engaged in the development and operation of shopping malls and hotels, and the development of mixed-use properties, office and residential buildings, as well as land and residential housing developments, including socialized housing projects located in key cities and other urban areas nationwide. RLC adopts a diversified business model, with both an “investment” component, in which it develops, owns and operates commercial real estate projects (principally shopping malls, office buildings and hotels) and a “development” component, in which it develops residential real estate projects for sale (principally residential condominiums, upper-middle to high-end residential developments and low-and-middle cost lots and houses in its subdivision developments). RLC was incorporated on June 4, 1980 and its shares were offered to the public in an initial public offering and were subsequently listed in the Manila Stock Exchange and the Makati Stock Exchange (predecessors of the Philippine Stock Exchange) on October 16, 1989. On October 27, 2015, RLC won the bidding for the acquisition of land use right to a property located in Chengdu Province, China. The land use right was acquired by entering into a Contract for Assignment of the Right to the Use of State-owned Land with the Land and Resource Bureau of Chengdu Province (Chinese Government). This acquisition is in line with the normal course of RLC’s real estate business and its plan to explore opportunities internationally.
Principal Products or Services
RLC has four business divisions: a) Commercial Centers, b) Residential, c) Office Buildings,
and d) Hotels.
a.) Commercial Centers RLC’s Commercial Center Division develops, leases and manages shopping malls throughout the Philippines. As of December 31, 2016, it operated 44 shopping malls, comprising 9 malls in Metro Manila and 35 malls in other urban areas throughout the Philippines, and had another 7 new malls and 3 expansion projects in the planning and development stage for completion in the next two years.

-13-
The Commercial Centers Division’s main revenue stream is derived from the lease of commercial spaces. Revenues from the Commercial Centers Division, which represent recurring lease rentals, comprise significant part of RLC’s revenues. Historically, revenues from lease rentals have been a steady source of operating cash flows for RLC. RLC expects that the revenues and operating cash flows generated by the commercial centers business shall continue to be the driver for its growth in the future.
b.) Residential The Residential Division, which focuses on the construction of residential condominium and subdivision projects, is categorized into four brands. The different brands differ in terms of target market, location, type of development and price ranges to allow clear differentiation among markets. These four brands are.
Luxuria - builds its brand on providing a seamless pampered experience via its generous living spaces, distinctive style infrastructure, iconic locations and attention to service and detail. It provides uniquely luxurious living spaces through its projects located in iconic locations such as Cebu, Ortigas Center and Makati. As of December 31, 2016, there are 9 residential projects under the Luxuria portfolio, of which 7 have been completed and 2 projects are under various stages of development.
Robinsons Residences - offers the perfect urban home for professionals and urbanities, combining prime locations with contemporary designs, comfortably spacious units, stress-busting amenities and lifestyle perks and privileges. As of December 31, 2016, Robinsons Residences segment had a portfolio of 29 residential condominium buildings/towers, of which 22 had been completed and 7 projects are under various stages of development.
Robinsons Communities - is the residential brand of RLC which caters to the needs of early nesters, young mobile achievers and families coming from B to BB segment who wish to live independently and comfortably close to their workplace, schools and leisure centers. As of December 31, 2016, Robinsons Communities had completed 25 residential condominium buildings/towers and 2 subdivision projects. It has 5 on-going projects in different stages that are scheduled for completion over the next 5 years. Robinsons Communities is currently focusing on the development of both Mid-rise and High-rise residential condominium projects that primarily offer compact units with price levels below P=3.0 million. Its condominium projects are located in Metro Manila and Tagaytay City while the subdivisions are in Quezon City.
Robinsons Homes - offers choice lots in master planned, gated subdivisions with option for house construction to satisfy every Filipino’s dream of owning his own home. As of December 31, 2016, Robinsons Homes has 36 projects in its portfolio. 13 of these projects are on-going construction, 2 of which are awaiting for the receipt of License to Sell (LS) to launch. Among the 36 projects, 25 have been substantially completed and sold.
c.) Office Building Office Buildings division develops office buildings for lease. As of December 31, 2016, the Office Buildings Division of RLC has completed 13 office developments with the completion of Tera Tower, Galleria Cebu Office and Robinsons Place Ilocos Office, and is building six more office building projects in Metro Manila and non-Metro Manila areas.
d.) Hotels
RLC’s Hotels division owns and operates hotels in Metro Manila and other urban areas
throughout the Philippines. Currently, it has a portfolio of 15 hotel properties under the three
brand segments, namely Crowne Plaza Manila Galleria and Holiday Inn Manila Galleria both
managed by the InterContinental Hotels Group, Summit Circle Cebu (formerly Cebu Midtown

-14-
Hotel), Summit Ridge Tagaytay and Summit Hotel Magnolia under the Summit brand, and a
network of 10 Go Hotels all over the Philippines. Go Hotels is present in Mandaluyong-
Manila, Tacloban, Dumaguete, Bacolod, Puerto Princesa, Otis-Manila, Iloilo, Ortigas Center-
Manila, Butuan and Lanang-Davao.
Although the hotels division is an important part of RLC’s business, RLC considers its primary
value to be as a complement to its other developments. Over the next years, we will see
more Go Hotels and Summit Hotels in major cities of the country.
Serving over 1.8 million guests to date, Go Hotels has steadily increased its presence in the
Philippines with 10 operational branches, offering a total of almost 1,300 rooms, in strategic
cities across the country. Its thrust is to build in locations with high market demand. To
support expansion of the brand, Go Hotels has also opened its business to franchising.
The percentage contribution to RLC’s revenues for the three years ended December 31,
2016, 2015 and 2014 by each of its business segment is as follows:
For the years ended December 31
2016 2015 2014
Commercial Centers 44.5% 46.2% 47.8% Residential Buildings 34.4% 33.0% 33.7% Office Buildings 13.2% 12.0% 9.5% Hotels 7.9% 8.8% 9.0%
100.0% 100.0% 100.0%
Competition
Commercial Centers Division
RLC has two major competitors in its commercial centers division – SM Prime Holdings, Inc.
(SM) and Ayala Land, Inc. (ALI). Each of these companies has certain distinct advantages
over RLC, including SM’s considerably larger mall portfolio and ALI’s access to prime real
estate in the heart of Metro Manila. There are a number of other players in the shopping mall
business in the Philippines, but they are significantly smaller and, because of the high
barriers to entry into the business (which include cost, branding, reputation, scale and access
to prime real estate), RLC expects that it will continue to compete principally with these two
major companies in this market sector for the foreseeable future. RLC has, however,
recently seen an increase in the development of specialty malls by companies that are not
traditional players in the industry, and it is unclear whether or how this trend might affect the
competitive landscape. Shopping mall operators also face competition from specialty stores,
general merchandise stores, discount stores, warehouse outlets, street markets and online
stores.
RLC believes its strength is in its mixed-use, retail, commercial and residential developments.
RLC operates on the basis of its flexibility in developing malls with different sizes depending
on the retail appetite of the market per location. It is focused on balancing its core tenant mix
and providing a more distinctive shopping mall experience to its loyal customers, as well as
its ability to leverage the brand equity and drawing power of its affiliated companies in the
retail trade business.

-15-
Residential Division
Robinsons Luxuria
The Robinsons Luxuria brand continues to develop projects that cater to the high-end
market. It strives to compete with developers who have already established their
names in tapping this slice of the market. RLC aims to increase its share of this elite
market segment and steer buyers of competitors such as Ayala Land Premier,
Rockwell Land (Rockwell), Century Properties and Megaworld Corporation
(Megaworld) to its developments.
Robinsons Residences
RLC’s competitors (Alveo Land, Megaworld, Filinvest and Ortigas & Co.) under this
segment target the same market and offer similar products. There are also a number
of players who try to compete in this segment of the market with one or two projects.
Projects under Robinsons Residences remain one of the top of mind developments
as a result of our growing experienced sales and distribution network and our
convenient locations. Our projects are found within Central Business Districts or a
RLC mixed-use development.
Robinsons Communities
RLC Robinsons Communities in particular, has numerous competitors in the middle
income segment. This is in part a function of the fact that as compared to other
business areas, RLC does not enjoy the same "early mover" advantage. Currently,
Robinsons Communities' competitors include companies like Avida Land (AL),
Filinvest Land (FL), SM Development Corporation (SMDC) and DMCI Homes. Based
on public records and independent industry reports and its own market knowledge,
RLC believes that it is among the top five middle-ranged condominium developers in
the Philippines in terms of revenues from sales. RLC believes that it can successfully
compete in this market segment on the basis of its brand name, technical expertise,
financial standing and track record of successfully completed, quality projects.
Robinsons Homes Robinsons Homes stands in close competition with ALI, FL and Vista Land (VL). It competes on the basis of location. It is a nationwide residential subdivision developer with projects in Laoag, Tarlac, Pampanga, Antipolo, Cavite, Batangas, Puerto Princesa, Bacolod, Cebu, Cagayan de Oro, Davao and General Santos. Robinsons Homes is creating not just subdivisions but is forming nurturing communities with lifestyle amenities and support developments in response to the changing lifestyle of Filipinos. RLC believes that its market specific branding, reliability to deliver and consistent quality products at an affordable price has contributed to its ability to generate sales and its overall success. In order to cater to varying market profiles, Robinsons Homes launched its four sub-brands namely: Happy Homes for socialized housing, Springdale for affordable market segment, Brighton for mid-cost development and Bloomfields for high-end market.
Office Buildings Division RLC believes that competition for office space is principally on the basis of location, availability of space and quality of office space. The biggest competitors of RLC under this segment are ALI, Megaworld and SM. It competes in this market on the basis of the strategic locations of its buildings, including their proximity to its malls and residences as part of mixed-use developments, and has also began to design its office space with BPO and call center-specific requirements in mind, in order to better serve that market and make its office buildings more attractive to those potential tenants. RLC also believes that its established reputation for completing projects on time and true to its deliverables and commitment resulted to becoming one of the preferred choices or first in mind of call centers, BPO as well as local and multinational companies. RLC is committed in providing an excellent customer

-16-
experience and satisfaction by developing office projects of high quality and reliability, meeting the evolving needs of its customers. Hotel Hotel occupancy trends in the Philippines are affected by a variety of factors, including the general levels of business and tourist travel to the Philippines, which are in turn influenced by general political and economic conditions within the country. The Philippines is a preferred destination in the global tourism industry because of its competitiveness in terms of pricing hotel rooms and airline ticket, natural resources and eco-tourism. However, concerns on safety and security/travel advisories, infrastructure and health and hygiene must be addressed. The hotel business has seen a continued stabilized situation due to remittances from Filipino overseas workers, the continued booming of business outsource processing & IT infrastructure projects in the Philippines, and the continuous drive of the local tour operators in developing affordable tour packages. The tourism outlook in the Philippines seems optimistic, driven by the presence of low cost carriers and with several hotels opening in Makati, Ortigas, and Fort Bonifacio CBD. With total expected supply of 8,500 rooms from year 2016-2017, the Department of Tourism (DoT) continues to attract in bound tourism by an aggressive global marketing campaign and brand awareness. The Word Economic Forum (WEF), in its “Travel & Tourism Competiveness Report 2013”, ranked the Philippines 12 places higher than in 2012 at 82nd overall and 16th regionally – the largest improvement of any country within the Asia-Pacific Region. Taking advantage of the increasing inbound and outbound travels looking for accommodation, a number of local and foreign competitors have entered or signified interest to enter the country. These chains, considered competitors of its Go Hotels, include Red Planet, Fave Hotels of Indonesia, Microtel by Wyndham and the local Islands Stay Hotels. Other hotel chains which have also been growing geographically include Park Inn by Radisson, Novotel, Seda Hotels by Ayala, and Remington Hotel. These hotel chains cater to the mid-scale market and are thus considered competitors of RLC’s Summit Hotel brand. In the Ortigas Central Business District, new players such as Marco Polo, Citadines, Accor, Exchange Regency and Oakwood compete with RLC’s two IHG-managed hotels. Crowne Plaza Manila Galleria has celebrated its 10th year of service in 2015, with this new service experience are yet to be expected to ensure Travelling for Success --- Sleep Advantage supporting the environment expected by our high achiever and Meetings Success, assuring a unique guest experience when conducting meetings and celebrating milestones. Holiday Inn remains to be the only international mid-market brand in Ortigas which caters of both Leisure and Corporate Transient business in the area. Raw Materials/Suppliers Construction and development of malls, high-rise office and condominium units as well as land and housing construction are awarded to various reputable construction firms subject to a bidding process and management’s evaluation of the price and qualifications of and its relationship with the relevant contractor. Most of the materials used for the construction are provided by the contractors themselves in accordance with the underlying agreements, although sometimes RLC will undertake to procure the construction materials when it believes that it has an advantage in doing so. RLC typically will require the contractor to bid for a project on an itemized basis, including separating the costs for project materials that it intends to charge. If RLC believes that it is able to acquire any of these materials (such as

-17-
cement or steel) at a more competitive cost than is being quoted to it, it may remove these materials from the project bid and enter into a separate purchase order for the materials itself, to reduce project costs.
Customers
RLC has a broad market base. The loss of any one customer would not have a materially
adverse effect upon RLC.
Related Party Transactions
RLC leases significant portions of its commercial centers and office buildings to various
subsidiaries and affiliates. Anchor tenants of the shopping malls are generally composed of
affiliates in the retail trade business, namely Robinsons Department Store, Robinsons
Supermarket and Handyman. Other affiliates include Top Shop, Robinsons Savings Bank
and Cebu Pacific. RLC’s lease contracts and/or supply services with these affiliate
companies are under commercial terms at least as favorable as the terms available to non-
affiliated parties.
In addition, JG Summit also provides RLC with certain corporate services including debt management, corporate finance, corporate planning, procurement, human resources, controller and treasury services, legal and corporate communications.
Regulatory and Environmental Matters
Shopping Malls
Shopping mall centers are regulated by the local government unit of the city or municipality
where the establishment is located. In line with this, mall operators must secure the required
mayor’s permit or municipal license before operating. In addition, no mall shall be made
operational without complying first with the provisions of the fire code and other applicable
local ordinances. Furthermore, shopping malls with food establishments must obtain a
sanitary permit from the Department of Health. It is also compulsory for shopping malls
discharging commercial waste water to apply for a waste water discharge permit from the
Department of Environment and Natural Resources (DENR) and to pay the fee incidental to
the permit.
As a tourism-related establishment, shopping malls may obtain accreditation from the DoT. A
shopping mall can only be accredited upon conformity with the minimum physical, staff and
service requirements promulgated by the DoT.
Residential Condominium and Housing and Land Projects
Presidential Decree No. 957, as amended, is the principal statute which regulates the
development and sale of real property as part of a condominium project or subdivision.
Presidential Decree No. 957 covers subdivision projects and all areas included therein for
residential, commercial, industrial and recreational purposes as well as condominium projects for
residential or commercial purposes. The Housing and Land Use Regulatory Board (HLURB) is
the administrative agency of the Government which, together with local government units,
enforces this decree and has jurisdiction to regulate the real estate trade and business.
All subdivision and condominium plans for residential, commercial, industrial and other
development projects are subject to approval by the relevant local government unit in which the
project is situated. The development of subdivision and condominium projects can commence
only after the relevant government body has issued the development permit.

-18-
Further, all subdivision plans and condominium project plans are required to be filed with and
approved by the HLURB. Approval of such plans is conditional on, among other things, the
developer’s financial, technical and administrative capabilities. Alterations of approved plans
which affect significant areas of the project, such as infrastructure and public facilities, also
require the prior approval of the relevant local government unit. Owners of or dealers in real
estate projects are required to obtain licenses to sell before making sales or other dispositions of
lots or real estate projects. Dealers, brokers and salesmen are also required to register with the
HLURB. Project permits and licenses to sell may be suspended, cancelled or revoked by the
HLURB by itself or upon a verified complaint from an interested party for reasons such as non-
delivery of title to fully-paid buyers or deviation from approved plans. A license or permit to sell
may only be suspended, cancelled or revoked afer a notice to the developer has been served
and all parties have been given an opportunity to be heard in compliance with the HLURB’s rules
of procedure and other applicable laws. Subdivision or condominium units may be sold or
offered for sale only after a license to sell has been issued by the HLURB. The license to sell
may be issued only against a performance bond posted to guarantee the completion of the
construction of the subdivision or condominium project and compliance with applicable laws and
regulations.
There are essentially two different types of residential subdivision developments, which are distinguished by different development standards issued by the HLURB. The first type of subdivision, aimed at low-cost housing, must comply with Batas Pambansa Blg. 220, which allows for a higher density of building and relaxes some construction standards. Other subdivisions must comply with Presidential Decree 957, which set out standards for lower density developments. Both types of development must comply with standards regarding the suitability of the site, road access, necessary community facilities, open spaces, water supply, the sewage disposal system, electrical supply, lot sizes, the length of the housing blocks and house construction.
Under current regulations, a developer of a residential subdivision is required to reserve at least 30% of the gross land area of such subdivision for open space for common uses, which include roads and recreational facilities. A developer of a commercial subdivision is required to reserve at least 3.5% of the gross project area for parking and pedestrian malls.
Further, Republic Act (RA) No. 7279 requires developers of proposed subdivision projects to develop an area for socialized housing equivalent to at least 20% of the total subdivision area or total subdivision project cost, at the option of the developer, within the same or adjacent regions, whenever feasible, and in accordance with the standards set by the HLURB. Alternatively, the developer may opt to buy socialized housing bonds issued by various accredited government agencies or enter into joint venture arrangements with other developers engaged in socialized housing development. RLC has benefited from providing low-income housing or projects of such types which are financially assisted by the government. These policies and programs may be modified or discontinued in the future. The Government may also adopt regulations which may have the effect of increasing the cost of doing business for real estate developers. Under current law, income derived by domestic corporations from the development and sale of socialized housing which currently, among other things, must have a basic selling price of no more than P=300,000, is exempt from project related income taxes. Under the current Investment Priorities Plan issued by the Board of Investments, mass housing projects including development and fabrication of housing components, are eligible for government incentives subject to certain policies and guidelines. In the future, since the sale of socialized housing units comprise a portion of homes sold by RLC, any changes in the tax treatment of income derived from the sale of socialized housing units may affect its effective rate of taxation.

-19-
Hotels
The Philippine DoT promulgated the Hotel Code of 1987 (the “Hotel Code”) in order to govern
the business and operation of all hotels in the Philippines. Investors that wish to operate a
hotel must first register and apply for a license with the local government of the city or
municipality where the hotel is located. For purposes of registration and licensing, hotels are
classified into four groups: De Luxe Class, First Class, Standard Class and Economy Class.
The Hotel Code provides minimum standards for the establishment, operation and
maintenance of hotels depending on the hotel’s classification. The Philippine DoT is in the
process of revising the current classification from Hotel Class System to Hotel Star Rating
System.
A certificate of registration and license as a hotel will not be granted unless the relevant
establishment has passed all the conditions of the Hotel Code, the Fire and Building Codes,
Zoning Regulations and other municipal ordinances. Furthermore, hotels can only be opened
for public patronage upon securing of a sanitary permit from the city or municipal health office
having jurisdiction over the establishment. The DoT is the government agency which is
tasked with the accreditation of hotels. The Department promulgates the minimum standards
and procedures for hotel accreditation. While accreditation is non-compulsory, accredited
hotels are given incentives by the DoT.
Zoning and Land Use
Under the agrarian reform law currently in effect in the Philippines and the regulations issued
thereunder by the Department of Agrarian Reform (DAR), land classified for agricultural
purposes as of or after 15 June 1988, cannot be converted to non-agricultural use without the
prior approval of DAR.
Land use may be also limited by zoning ordinances enacted by local government units. Once
enacted, land use may be restricted in accordance with a comprehensive land use plan
approved by the relevant local government unit. Lands may be classified under zoning
ordinances as commercial, industrial, residential or agricultural. While a procedure for
change of allowed land use is available, this process may be lengthy and cumbersome.
Special Economic Zone
The Philippine Economic Zone Authority (PEZA) is a government corporation that operates,
administers and manages designated special economic zones (Ecozones) around the
country. PEZA registered enterprises locating in an Ecozone are entitled to fiscal and non-
fiscal incentives such as income tax holidays and duty free importation of equipment,
machinery and raw materials. Information technology (IT) enterprises offering IT services
(such as call centers and business process outsourcing using electronic commerce) are
entitled to fiscal and non-fiscal incentives if they are PEZA-registered locators in a PEZA-
registered IT Park, IT Building, or Ecozone. RLC actively seeks PEZA registration of its
buildings, as this provides significant benefits to its tenants. As of 2016, the Pioneer mixed-
use complex is in a PEZA Ecozone, the Robinsons Equitable Tower and Robinsons Summit
Center are PEZA-registered buildings. A number of malls are also PEZA-registered.
United Industrial Corporation Limited
In May 1999, the Company, through a subsidiary, acquired a 23.0% stake in a Singapore
listed company, United Industrial Corporation Limited (UIC) which is one of the largest
property developers in Singapore owning various office buildings that are located in prime
locations in Singapore and China. As of December 31, 2016, the Company’s indirect interest
in the shares of UIC increased to 37.0%. Other than the Company, the only significant
stockholder in UIC is the United Overseas Bank Group of Singapore.

-20-
c) AIR TRANSPORTATION
Business Development
Cebu Air, Inc. (CEB) was incorporated on August 26, 1988 and was granted a 40-year
legislative franchise to operate international and domestic air transport services in 1991. It
commenced its scheduled passenger operations in 1996 with its first domestic flight from
Manila to Cebu. In 1997, it was granted the status as an official Philippine carrier to operate
international services by the Office of the President of the Philippines. International
operations began in 2001 with flights from Manila to Hong Kong.
With the liberalization of the airline industry in 1995, JG Summit acquired 49.0% of CEB’s
outstanding capital stock to undertake domestic and international flights to and from major
cities in the Philippines and around the world. In September 2001, the Company, through a
subsidiary, acquired the remaining 51.0% of CEB’s capital stock, thus making it a wholly
owned subsidiary as of year-end 2001. In May 2006, CEB was acquired by CP Air Holdings
Inc. (CP Air) through a deed of assignment by the Company, which resulted in the 100%
ownership by CP Air of CEB. CP Air is a wholly owned subsidiary of the Company. On
October 26, 2010, CEB’s common stock was listed with the PSE. As of December 31, 2016,
JG Summit has 67.2% effective ownership in CEB.
CEB operates under the trade name “Cebu Pacific Air” and is the leading low-cost carrier in the Philippines. It pioneered the “low fare, great value” strategy in the local aviation industry by providing scheduled air travel services targeted to passengers who are willing to forego extras for fares that are typically lower than those offered by traditional full-service airlines while offering reliable services and providing passengers with a fun travel experience. In 2005, CEB adopted the low cost carrier (LCC) business model. The core element of the LCC strategy is to offer affordable air services to passengers. This is achieved by having: high-load, high-frequency flights; high aircraft utilization; a young and simple fleet composition; and low distribution costs. On March 20, 2014, CEB acquired 100% ownership of Tiger Airways Philippines (TAP), including 40% stake in Roar Aviation II Pte. Ltd. (Roar II), a wholly owned subsidiary of Tiger Airways Holdings Limited (TAH). On April 27, 2015, with the approval of the Securities and Exchange Commission (SEC), TAP was rebranded and now operates as CEBGO, Inc.
As of December 31, 2016, CEB operates an extensive route network serving 59 domestic
routes and 43 international routes with a total of 2,820 scheduled weekly flights. It operates
from seven hubs, including the Ninoy Aquino International Airport (NAIA) Terminal 3 and
Terminal 4 both located in Pasay City, Metro Manila; Mactan-Cebu International Airport
located in Lapu-Lapu City, part of Metropolitan Cebu; Diosdado Macapagal International
Airport (DMIA) located in Clark, Pampanga; Davao International Airport located in Davao
City, Davao del Sur; Ilo-ilo International Airport located in Ilo-ilo City, regional center of the
western Visayas region; and Kalibo International Airport in Kalibo, Aklan.
As of December 31, 2016, CEB operates a fleet of 57 aircraft which comprises of 4 Airbus
A319, 36 Airbus A320, 8 ATR 72-500, 2 ATR 72-600 and 7 Airbus A330 aircraft. It operates
its Airbus aircraft on both domestic and international routes and operates the ATR 72-500
and ATR 72-600 aircraft on domestic routes, including destinations with runway limitations.
The average aircraft age of CEB’s fleet is approximately 4.91 years as of December 31,
2016.

-21-
Aside from passenger service, CEB also provides airport-to-airport cargo services on its domestic and international routes. In addition, it offers ancillary services such as cancellation and rebooking options, in-flight merchandising such as sale of duty-free products on international flights, baggage and travel-related products and services. The percentage contributions to CEB’s revenues of its principal business activities are as follows:
For the years ended December 31
2016 2015 2014
Passenger Services 75.3% 75.5% 77.3% Cargo Services 5.8% 6.2% 6.1% Ancillary Services 18.9% 18.3% 16.6%
100.0% 100.0% 100.0%
On May 16, 2016, CEB and seven other market champions in Asia Pacific, announced the formation of the world’s first, pan-regional low cost carrier alliance, the Value Alliance. CEB, together with Jeju Air (Korea), Nok Air (Thailand), NokScoot (Thailand), Scoot (Singapore), Tigerair Singapore, Tigerair Australia and Vanilla Air (Japan) will deliver greater value, connectivity and choice for travel throughout Southeast Asia, North Asia and Australia, as the airlines bring their extensive networks together. The Value Alliance airlines collectively fly to more than 160 destinations from 17 hubs in the region. On February 23, 2015 and May 12, 2016, CEB signed a forward sale agreement with a subsidiary of Allegiant Travel Company (collectively known as “Allegiant”), covering CEB’s sale of 10 Airbus A319 aircraft. The delivery of the aircraft to Allegiant is scheduled to start on various dates in 2015 until 2018. Aside from this, there are no material reclassifications, merger, consolidation, or purchase or sale of a significant amount of assets not in the ordinary course of business that was made in the past three years. CEB has not been subjected to any bankruptcy, receivership or similar proceeding in the said period.
Distribution Methods of Products or Services CEB has three principal distribution channels: the internet; direct sales through booking sales offices, call centers and government/corporate client accounts; and third-party sales outlets. Internet In January 2006, CEB introduced its internet booking system. Through www.cebupacificair.com, passengers can book flights and purchase services online. The system also provides passengers with real time access to CEB’s flight schedules and fare options. CEBGO, Inc.’s flights can be booked through the Cebu Pacific website and its other booking channels starting in March 2014. As part of the strategic alliance between CEB and TAH, the two carriers entered into an interline agreement with the first interline flights made available for sale in TAH’s website starting July 2014. Interline services were made available in Cebu Pacific’s website in September 2014. With this, guests of both airlines now have the ability to cross-book flights on a single itinerary and enjoy seamless connections with an easy one-stop ticketing for connecting flights and baggage check-in. In December 2014, CEB also launched its official mobile application which allows guests to book flights on-the-go through their mobile devices.

-22-
CEB’s participation in the Value Alliance with other low-cost carriers in the region will increase its distribution reach by enabling its customers to view, select and book the best-available airfares on flights from any of the airlines in a single transaction, directly from each partner’s website. This is made possible through the groundbreaking technology developed by Air Black Box (ABB). ABB allows guests to enjoy the full suite of ancillary choices they have come to appreciate from low cost carriers across all partner airline sectors in a single itinerary.
Booking Offices and Call Centers As of December 31, 2016, CEB has a network of 9 booking offices located throughout the Philippines and 2 regional booking offices, one in Hong Kong and another in Seoul, South Korea. It directly operates these booking offices, which also handle customer service issues, such as customer requests for change of itinerary. In addition, it operates two in-house call centers, one in Manila and the other in Cebu. It also uses a third-party call center outsourcing service to help accommodate heavy call traffic. Its employees who work as reservation agents are also trained to handle customer service inquiries and to convert inbound calls into sales. Purchases made through call centers can be settled through various modes, such as credit cards, payment centers and authorized agents.
Government/Corporate Client Accounts As of December 31, 2016, CEB has government and corporate accounts for passenger sales. It provides these accounts with direct access to its reservation system and seat inventory as well as credit lines and certain incentives. Further, clients may choose to settle their accounts by post-transaction remittance or by using pre-enrolled credit cards.
Third Party Sales Outlets As of December 31, 2016, CEB had a network of distributors in the Philippines selling its domestic and international air services within an agreed territory or geographical coverage. Each distributor maintains and grows its own client base and can impose on their clients a service or transaction fee. Typically, a distributor’s client base would include agents, travel agents or end customers. It also has a network of foreign general sales agents, wholesalers, and preferred sales agents who market, sell and distribute its air services in other countries.
Customers
CEB’s business is not dependent upon a single customer or a few customers that a loss of
anyone of which would have a material adverse effect on CEB. Competition The Philippine aviation authorities deregulated the airline industry in 1995 eliminating certain restrictions on domestic routes and frequencies which resulted in fewer regulatory barriers to entry into the Philippine domestic aviation market. On the international market, although the Philippines currently operates under a bilateral framework, whereby foreign carriers are granted landing rights in the Philippines on the basis of reciprocity as set forth in the relevant bilateral agreements between the Philippine government and foreign nations, in March 2011, the Philippine government issued EO 29 which authorizes the Civil Aeronautics Board (CAB) and the Philippine Air Panels to pursue more aggressively the international civil aviation liberalization policy to boost the country’s competitiveness as a tourism destination and investment location. Currently, CEB faces intense competition on both its domestic and international routes. The level and intensity of competition varies from route to route based on a number of factors.

-23-
Principally, it competes with other airlines that service the routes it flies. However, on certain domestic routes, CEB also considers alternative modes of transportation, particularly sea and land transport, to be competitors for its services. Substitutes to its services also include video conferencing and other modes of communication.
CEB’s competitors in the Philippines are Philippine Airlines (“PAL”), a full-service Philippine flag carrier; PAL Express (formerly Airphil Express) a low-cost domestic operator and which code shares with PAL on certain domestic routes and leases certain aircraft from PAL; and Philippines Air Asia (a merger between former Air Asia Philippines and Zest Air). Most of the Group’s domestic and international destinations are also serviced by these airlines. According to latest CAB data as of the second quarter of 2016, the Group is the leading domestic airline in the Philippines by passengers carried, with a market share of 58.5%. CEB is the leading regional low-cost airline offering services to more destinations and serving more routes with a higher frequency between the Philippines and other ASEAN countries than any other airline in the Philippines. Currently, it competes with the following LCC’s and full-service airlines in its international operations: AirAsia, Jetstar Airways, PAL, Cathay Pacific, Singapore Airlines, Thai Airways, among others. Publicly-Announced New Product or Service CEB continues to analyze its route network. It can opt to increase frequencies on existing routes or add new routes/destinations. It can also opt to eliminate unprofitable routes and redeploy capacity.
CEB plans to expand its fleet over the course of the next three years by additional 35 aircraft (before any returns and sale of aircraft) by the end of 2019. The additional aircraft will support CEB’s plans to increase frequency on current routes and to add new city pairs and destinations. CEB further boosts its domestic network with the introduction of new routes in the Eastern and Western Visayas namely Cebu to Ormoc, Roxas and Calbayog in November 2016 and through increasing frequencies on existing routes such as Manila to Zamboanga, Roxas, Busuanga, Butuan and Cauayan, Cebu to Kalibo, Camiguin and Ozamiz. On December 12, 2016, CEB announced to further build its presence in Mindoro, Marinduque, Romblon, Palawan (MIMAROPA) and Bicol regions by launching daily flights between Manila and Masbate and four times weekly flights between Manila and Tablas using the newly-acquired ATR 72-600 starting February 15, 2017. Cargo services will also be made available in these areas, contributing to growth of more than 2,000 accounts currently held by CEB. New international routes were also launched like direct flights between Kalibo and Incheon in October 2016 and Manila to Guam, the airline’s first US destination, last March 2016. Aside from adding frequencies on some international routes such as Manila to Hongkong and Doha, CEB also upgraded selected flights between Manila and Taipei, Narita and Hongkong from Airbus A320 to the larger A330 aircraft to accommodate additional passenger traffic. On November 7, 2016, CEB opened its regional office in Seoul, Korea as part of its regional promotion and expansion. Ticket sales, reservations, cargo services and customer support can now be availed through the Korea Organic Office. Further, CEB has entered into a purchase agreement with Airbus S.A.S covering the purchase of 2 A330-300 aircraft. The first one was delivered last December 2016 while the second is due to arrive in 2017. CEB also has a firm order for 16 ATR 72-600 with options to acquire an additional ten ATR 72-600. The new ATR 72-600 will be equipped with the high density Armonia cabin, the widest cabin in the turboprop market. It will be fitted with 78 slim-line seats and wider overhead bins with 30% more stowage space for greater comfort for passengers. Two out of the 16 ATR 72-600 aircraft were received in 2016 while the rest are scheduled for delivery in 2017 to 2020. CEB also has an existing order for 30 Airbus A321NEO (New Engine Option) aircraft with options for a further ten Airbus A321NEO.

-24-
Airbus A321NEO will be the first of its type to operate in the Philippines, being a larger and longer-haul version of the familiar Airbus A320. These 220-seater aircraft will have a much longer range which will enable CEB to serve cities in Australia, India and Northern Japan, places the A320 cannot reach. This order for A321NEO aircraft will be delivered between 2017 and 2021.
Raw Materials Fuel is a major cost component for airlines. CEB’s fuel requirements are classified by location and sourced from various suppliers.
CEB’s fuel suppliers at its international stations include Shell-Singapore, Shell-Hongkong, Shell-Dubai, Shell-Narita, SK Corp-Korea, Chevron-Sydney, Kuwait Aviation and World Fuel-Riyadh among others. It also purchases fuel from local suppliers like Petron, Chevron Manila and Shell Manila. CEB purchases fuel stocks on a per parcel basis, in such quantities as are sufficient to meet its monthly operational requirements. Most of its contracts with fuel suppliers are on a yearly basis and may be renewed for subsequent one-year periods.
Patents, Trademarks, Licenses, Franchises, Concessions and Royalty Agreements
Trademarks
Trademark registrations with the Intellectual Property Office of the Philippines (IPOPhil) prior
to the effective date of Republic Act No. 8293, or the current Intellectual Property Code of the
Philippines, are valid for 20 years from the date of issue of the certificate of registration.
Meanwhile, trademark registrations covered by Republic Act No. 8293 are valid for ten years
from the date of the certificate of registration. Regardless of whether the trademark
registration is for 20 years or ten years, the same may be renewed for subsequent ten-year
terms.
CEB holds the following valid and subsisting trademark registrations:
CEBU PACIFIC, the Cebu Pacific feather-like device, CEBU PACIFIC AIR, CEBU
PACIFIC AIR.COM;
The CEB Mascot;
Various trademarks for CEB’s branding campaigns such as WHY EVERYONE
FLIES, WHY EVERYJUAN FLIES, and the logos used for such purposes;
CEBGO and the Cebgo logo;
A trademark for the strategic alliance entered into by the Parent Company and TAH;
and
GETGO and the GetGo logo for its lifestyle rewards program
On June 1, 2015, CEB rolled out its new logo which features shades of the Philippines’ land,
sea, sky and sun. This new branding also symbolizes the airline's growth and evolution from
a low-cost pioneer to its larger operations today. The new logo and new branding have been
registered as trademarks of CEB.
Meanwhile, CEB has 26 trademarks registered with the Intellectual Property Office of China
and three (3) trademarks with the Intellectual Property Office of Singapore.
CEB has also incorporated the business names “Cebu Pacific” and “Cebu Pacific Air” with its
Articles of Incorporation, as required by Memorandum Circular No. 21-2013 issued by the
Securities and Exchange Commission (SEC). Registering a business name with the SEC
precludes another entity engaged in the same or similar business from using the same
business name as one that has been registered.

-25-
Licenses/Permits CEB operates its business in highly regulated environment. The business depends upon the permits and licenses issued by the government authorities or agencies for its operations which include the following:
Legislative Franchise to Operate a Public Utility
Certificate of Public Convenience and Necessity
Letter of Authority
Air Operator Certificate
Certificate of Registration
Certificate of Airworthiness
CEB also has to seek approval from the relevant airport authorities to secure airport slots for its operations. Franchise In 1991, pursuant to Republic Act No. 7151, CEB was granted a franchise to operate air transportation services, both domestic and international. In accordance with CEB’s franchise, this extends up to year 2031: a) CEB is subject to franchise tax of five percent of the gross revenue derived from air
transportation operations. For revenue earned from activities other than air transportation, CEB is subject to corporate income tax and to real property tax.
b) In the event that any competing individual, partnership or corporation received and enjoyed tax privileges and other favorable terms which tended to place CEB at any disadvantage, then such privileges shall have been deemed by the fact itself of CEB’s tax privileges and shall operate equally in favor of CEB.
In December 2008, pursuant to Republic Act No. 9517, CEBGO, Inc. (formerly TAP), CEB’s wholly owned subsidiary, was granted a franchise to establish, operate and maintain domestic and international air transport services with Clark Field, Pampanga as its base. This franchise shall be for a term of twenty five (25) years. Government Approval of Principal Products or Services CEB operates its business in highly regulated environment. The business depends upon the permits and licenses issued by the government authorities or agencies for its operations which include the following:
Legislative Franchise to Operate a Public Utility
Certificate of Public Convenience and Necessity
Letter of Authority
Air Operator Certificate
Certificate of Registration
Certificate of Airworthiness
CEB also has to seek approval from the relevant airport authorities to secure airport slots for its operations. Effects of Existing or Probable Government Regulations on the Business
Civil Aeronautics Administration and Civil Aviation Authority of the Philippines (CAAP)
Policy-making for the Philippine civil aviation industry started with RA 776, known as the Civil Aeronautics Act of the Philippines (the “Act”), passed in 1952. The Act established the

-26-
policies and laws governing the economic and technical regulation of civil aeronautics in the country. It established the guidelines for the operation of two regulatory organizations, CAB for the regulation of the economic activities of airline industry participants and the Air Transportation Office, which was later transformed into the CAAP, created pursuant to RA 9497, otherwise known as the Civil Aviation Authority Act of 2008.
The CAB is authorized to regulate the economic aspects of air transportation, to issue general rules and regulations to carry out the provisions of RA 776, and to approve or disapprove the conditions of carriage or tariff which an airline desires to adopt. It has general supervision and regulation over air carriers, general sales agents, cargo sales agents, and airfreight forwarders, as well as their property, property rights, equipment, facilities and franchises.
The CAAP, a government agency under the supervision of the Department of Transportation and Communications (DOTC) for purposes of policy coordination, regulates the technical and operational aspects of air transportation in the Philippines, ensuring safe, economic and efficient air travel. In particular, it establishes the rules and regulations for the inspection and registrations of all aircraft and facilities owned and operated in the Philippines, determines the charges and/or rates pertinent to the operation of public air utility facilities and services, and coordinates with the relevant government agencies in relation to airport security. Moreover, CAAP is likewise tasked to operate and maintain domestic airports, air navigation and other similar facilities in compliance with the International Civil Aviation Organization (ICAO), the specialized agency of the United Nations whose mandate is to ensure the safe, efficient and orderly evolution of international civil aviation.
CEB complies with and adheres to existing government regulations. Aviation Safety Ranking and Regulations In early January 2008, the Federal Aviation Administration (FAA) of the United States (US) downgraded the aviation safety ranking of the Philippines to Category 2 from the previous Category 1 rating. The FAA assesses the civil aviation authorities of all countries with air carriers that operate to the U.S. to determine whether or not foreign civil aviation authorities are meeting the safety standards set by the ICAO. The lower Category 2 rating means a country either lacks laws or regulations necessary to oversee airlines in accordance with minimum international standards, or its civil aviation authority is deficient in one or more areas, such as technical expertise, trained personnel, record-keeping or inspection procedures. Further, it means Philippine carriers can continue flying to the US but only under heightened FAA surveillance or limitations. In addition, the Philippines was included in the “Significant Safety Concerns” posting by the ICAO as a result of unaddressed safety concern highlighted in the recent ICAO audit. As a result of this unaddressed safety concern, Air Safety Committee (ASC) of the European Union banned all Philippine commercial air carriers from operating flights to and from Europe. The ASC based its decision on the absence of sufficient oversight by the CAAP. In February 2013, the ICAO has lifted the significant safety concerns on the ability of CAAP to meet global aviation standards. The ICAO SSC Validation Committee reviewed the corrective actions, evidence and documents submitted by the Philippines to address the concerns and determined that the corrective actions taken have successfully addressed and resolved the audit findings. On April 10, 2014, the ASC of the European Union lifted its ban on CEB after its evaluation of the airline’s capacity and commitment to comply with relevant aviation safety regulations. On the same date, the US FAA also announced that the Philippines has complied with

-27-
international safety standards set by the ICAO and has been granted a Category 1 rating. The upgrade to Category 1status is based on a March 2014 FAA review of the CAAP. With this, Philippine air carriers can now add flights and services to the US. In September and December 2014, CEB received CAAP’s approval for extended range operations in the form of a certification for Extended Diversion Time Operations (EDTO) of up to 90 and 120 minutes, respectively. EDTO refers to a set of rules introduced by the ICAO for airlines operating twin-engine aircraft on routes beyond 60 minutes flying time from the nearest airport. This certification allows CEB to serve new long haul markets and operate more direct routes between airports resulting to more fuel savings and reduced flight times. Although CEB does not currently operate flights to the US and Europe, these developments open the opportunity to establish new routes to other countries in these continents.
Executive Order (EO) 28 and 29 In March 2011, the Philippine Government issued EO 28 which provides for the reconstitution and reorganization of the existing Single Negotiating Panel into the Philippine Air Negotiating Panel (PANP) and Philippine Air Consultation Panel (PACP) (collectively, the Philippine Air Panels). The PANP shall be responsible for the initial negotiations leading to the conclusion of the relevant Air Services Agreements (ASAs) while the PACP shall be responsible for the succeeding negotiations of such ASAs or similar arrangements.
Also in March 2011, the government issued EO 29 which authorizes the CAB and the Philippine Air Panels to pursue more aggressively the international civil aviation liberalization policy to boost the country’s competitiveness as a tourism destination and investment location. Among others, EO 29 provides the following:
In the negotiation of the ASAs, the Philippine Air Panels may offer and promote third, fourth and fifth freedom rights to the country’s airports other than the NAIA without restriction as to frequency, capacity and type of aircraft, and other arrangements that will serve the national interest as may be determined by the CAB; and
Notwithstanding the provisions of the relevant ASAs, the CAB may grant any foreign air carriers increases in frequencies and/or capacities in the country’s airports other than the NAIA, subject to conditions required by existing laws, rules and regulations. All grants of frequencies and/or capacities which shall be subject to the approval of the President shall operate as a waiver by the Philippines of the restrictions on frequencies and capacities under the relevant ASAs.
The issuance of the foregoing EOs may significantly increase competition. ASEAN Open Skies Agreement In February 2016, the Philippine government ratified the ASEAN Open Skies agreement which allows designated carriers of ASEAN countries to operate unlimited flights between capitals, leading to better connectivity and more competitive fares and services. Subject to regulatory approvals, this liberalized and equitable air services agreement further allows carriers to upgrade its ASEAN flights to wide-bodied aircraft and increase capacity without the need for air talks thus allowing airlines to focus on expanding its operations, stimulating passenger traffic, and improving customer experience rather than spending valuable resources on negotiating for additional air rights.

-28-
Air Passenger Bill of Rights
The Air Passenger Bill of Rights (the “Bill”), which was formed under a joint administrative order of the DOTC, the CAB and the DTI, was signed and published by the Government on December 11, 2012 and came into effect on December 21, 2012. The Bill sets the guidelines on several airline practices such as overbooking, rebooking, ticket refunds, cancellations, delayed flights, lost luggage and misleading advertisement on fares. Republic Act No. 10378 - Common Carriers Tax (CCT) Act Republic Act No. 10378, otherwise known as the Common Carriers Tax Act, was signed into law on March 7, 2013. This act recognizes the principle of reciprocity as basis for the grant of income tax exceptions to international carriers and rationalizes other taxes imposed thereon by amending sections 28(A)(3)(a), 109, 108 and 236 of the National Internal Revenue Code, as amended.
Among the relevant provisions of the act follows:
a.) An international carrier doing business in the Philippines shall pay a tax of two and
one-half percent (2 1/2%) on its Gross Philippine Billings, provided, that international carriers doing business in the Philippines may avail of a preferential rate or exemption from the tax herein imposed on their gross revenue derived from the carriage of persons and their excess baggage on the basis of an applicable tax treaty or international agreement to which the Philippines is a signatory or on the basis of reciprocity such that an international carrier, whose home country grants income tax exemption to Philippine carriers, shall likewise be exempt from the tax imposed under this provision;
b.) International air carriers doing business in the Philippines on their gross receipts derived from transport of cargo from the Philippines to another country shall pay a tax of three percent (3% of their quarterly gross receipts;
c.) VAT exemption on the transport of passengers by international carriers.
While the removal of CCT takes away the primary constraint on foreign carrier’s capacity growth and places the Philippines on an almost level playing field with that of other countries, this may still be a positive news for the industry as a whole, as it may drive tourism into the Philippines. With CEB’s dominant network, it can benefit from the government’s utmost support for tourism.
Research and Development
CEB incurred minimal amounts for research and development activities, which do not amount
to a significant percentage of revenues.
Costs and Effects of Compliance with Environmental Laws
The operations of CEB are subject to various laws enacted for the protection of the
environment. CEB has complied with the following applicable environmental laws and
regulations:
Presidential Decree No. 1586 (Establishing an Environmental Impact Assessment
System) which directs every person, partnership or corporation to obtain an
Environmental Compliance Certificate (ECC) before undertaking or operating a
project declared as environmentally critical by the President of the Philippines. Petro-
chemical industries, including refineries and fuel depots, are considered
environmentally critical projects for which an ECC is required. CEB has obtained
ECC’s for the fuel depots it operates and maintains for the storage and distribution of
aviation fuel for its aircraft.
-29-
RA 8749 (The Implementing Rules and Regulations of the Philippines Clean Air Act
of 1999) requires operators of aviation fuel storage tanks, which are considered as a
possible source of air pollution, to obtain a Permit to Operate from the applicable
regional office of the Environmental Management Bureau (EMB). CEB’s aviation fuel
storage tanks are subject to and are compliant with this requirement.
RA 9275 (Implementing Rules and Regulations of the Philippines Clean Water Act of
2004) requires owners or operators of facilities that discharge regulated effluents to
secure from the Laguna Lake Development Authority (LLDA) (Luzon area) and/or the
applicable regional office of the EMB (Visayas and Mindanao areas) a Discharge
Permit, which is the legal authorization granted by the DENR for the discharge of
waste water. CEB’s operations generate waste water and effluents for the disposal
of which a Discharge Permit was obtained from the LLDA and the EMB of Region 7
which enables it to discharge and dispose of liquid waste or water effluent generated
in the course of its operations at specifically designated areas. CEB also contracted
the services of government-licensed and accredited third parties to transport, handle
and dispose its waste materials.
On an annual basis, CEB spends approximately P=55,000 in connection with its
compliance with applicable environmental laws. Compliance with the foregoing laws
does not have a material effect to CEB’s capital expenditures, earnings and
competitive position.
d) PETROCHEMICALS
Business Development
JG Summit Petrochemical Corporation (JGSPC) was incorporated in the Philippines on
February 24, 1994 and is 100% owned by the Company.
Its primary purpose is to engage in, operate, conduct, maintain, manage and carry on the
business of manufacturing, dealing and marketing of polyethylene (PE) and polypropylene
(PP) and related petrochemical products or by-products, in all their forms, varieties and
stages of production and preparation, or of any article or commodity consisting of, or partly
consisting of petrochemicals. The plant is the Philippines’ first integrated PE and PP complex
and is located at Barangay Simlong, Batangas City.
JGSPC completed its capacity expansion and rehabilitation projects in March 2014, which
increased its annual polymer production capacity to 320,000 megatons (MT) for PE and
190,000 MT for PP from its initial production capacity of 175,000 MT for PE and 180,000 MT
for PP.
Principal Products or Services
JGSPC manufactures PE and PP. JGSCPC’s principal product lines include High Density
Polyethylene (HDPE) grades for film, blow molding, monofilament, pipe and injection molding
applications. Linear Low Density Polyethylene (LLDPE) grades for film and injection molding
applications and PP homopolymer grades for yarn, film, injection molding and thermoforming
applications and random copolymer PP grades for blow molding and injection molding
applications.

-30-
The percentage contribution to JGSPC’s revenues for the three years ended December 31,
2016, 2015 and 2014 by each of its principal product categories is as follows:
For the years ended December 31
2016 2015 2014
Polyethylene 64.3% 63.8% 40.1% Polypropylene 35.7% 36.2% 59.9%
100.0% 100.0% 100.0%
JGSPC products are sold under the EVALENE brand name and are manufactured under
strict compliance with a Quality Management System based on ISO 9002 certified standards.
Distribution, Sales and Marketing
JGSPC sells directly to small, medium and large plastic converters in the Philippines through
its in-house sales group. Product distribution to the domestic market is handled directly by
JGSPC in coordination with third party trucking services. JGSPC also sells PE and PP for
export to international markets, either direct to resin end users or through reputable trading
companies.
JGSPC was in technical shutdown from October 2012 to February 2014. The shutdown was
in line with the full implementation of its Polymer Plant Capacity Expansion and Rehabilitation
Projects. On November 1, 2014, JGSPC declared commercial production and completion of
its Expansion and Rehabilitation projects.
Competition To be highly competitive, JGSPC is committed to produce consistently good quality products using world-class technology and by employing highly competent plastics processing personnel. Continuous research and development is conducted in-house by the Product Innovations and Customer Solutions Department, with the assistance of polymer technology licensors Univation and WR Grace.
JGSPC is the largest polymer resins producer and the only local manufacturer that can
produce both PE and PP in an integrated complex. The two other companies that produce
polyolefins produce either PE or PP only. These are NPC Alliance Corporation (NPCAC),
whose production capacity is 250,000 MT per annum for PE, and Philippine Polypropylene
Inc. (PPI), whose production capacity is 160,000 MT per annum for PP. Manufacturing sites
of both competitors are located in Bataan province, north of Manila. The balance for the local
polyolefins demand is supplied by imported material brought in either directly by local plastic
products manufacturers or by international and local traders. Imported PE and PP resin
goods are currently JGSPC’s primary competition.
JGSPC through its Marketing Department also is able to develop specialty PE and PP grades for specific niche markets, products for which may be difficult to source via the import market.
Raw Materials/Suppliers
The principal raw materials used by JGSPC in the production of its polyolefin products are
polymer-grade propylene and ethylene, commonly known as olefins, which are mainly
derived from naphtha produced in the oil refining process. Prior to the completion of JG
Summit Olefins Corporation (JGSOC)’s Naphtha Cracker Plant, JGSPC purchased olefins
from international sources though suppliers which include Japanese trading companies
Marubeni and Mitsui & Co. Ltd.
-31-
Since November 2014, JGSOC now directly supplies JGSPC with previously imported raw
materials ethylene and propylene. Per design, the olefins output capacity of JGSOC matches
the feedstock volume requirements of JGSPC.
Customers
JGSPC aims to supply the majority of manufacturers of plastic-based products in the
Philippines. It also sells its products to internal parties which include the packaging division
of URC, and to external parties comprised of more than 300 local manufacturers. Loss of
any one customer would not have a materially adverse effect on JGSPC. JGSPC also
exports PE and PP worldwide.
Related Party Transactions
JGSPC, in its regular conduct of business, has engaged in transactions with the Company
and its affiliates. These transactions principally consist of sales, advances to and from these
affiliated companies.
Regulatory Overview
The Philippine Government through the DTI’s Board of Investments (BOI) implements
policies which directly affect the various manufacturing industries including the petrochemical
industry. Under the Philippine Investment Priorities Plan, the BOI has the power to grant
fiscal incentives to manufacturers establishing new plants or undertaking rehabilitation or
expansion programs. Through several dialogues held with the BOI, JGSPC has emphasized
the importance of fully developing the petrochemical industry to help with the sustainable
development of the Philippine economy. The BOI has granted JGSPC’s capacity expansion
project generous fiscal incentives such as tax holidays and duty free importation of capital
equipment, as well as tax credits on locally purchased equipment.
Costs and Effects of Compliance with Environmental Laws
JGSPC takes pride in consistently undertaking projects to help preserve the environment.
The safety of employees and the community is foremost and is never compromised. JGSPC
complies with all applicable laws on the environment and is committed to be environmentally
responsible by having an effective environmental management system based on the
requirements of ISO 14001:2004 (EMS). Compliance with such laws has not had, and in
JGSPC’s opinion, is not expected to have a material effect upon JGSPC’s capital
expenditures, earnings or competitive position.
e) OLEFINS
JG SUMMIT OLEFINS CORPORATION (JGSOC) was incorporated in the Philippines on April 22, 2008. JGSOC is wholly owned by the Company and is setup to operate the country’s first Naphtha Cracker Plant. The naphtha cracker is a back integration for the existing PE and PP plants of JGSPC. The cracking facility was constructed adjacent to the existing PE and PP Plants of JGSPC. Commercial operations commenced on November 1, 2014. Principal Products or Services The technology selected for the naphtha cracking facility of JGSOC is licensed by CB&I Lummus (formerly ABB Lummus Global), an experienced licensor and worldwide supplier of ethylene technology with around 40% of worldwide capacity currently licensed. The cracker is the first of its kind in the Philippines.

-32-
The plant has the capacity to produce on a per annum basis around 320,000 MT of ethylene, 190,000 MT of propylene, 216,000 MT of pyrolysis gas and 110,000 MT of mixed C4.
Customers JGSOC sells its primary products ethylene and propylene directly to JGSPC, while other products pyrolysis gasoline and mixed C4 are exported to international markets. Raw Materials/Suppliers The feedstock naphtha is purchased from international sources. JGSOC also imported LPG in November 2015 which was used as cracker feedstock simultaneous with naphtha in November and December 2015 productions. Future importations of LPG and its use as cracker feedstock are performed when economically feasible. Registration with the Board of Investments (BOI) JGSOC is registered with the BOI under the Omnibus Investments Code of 1987 (E.O. 226) on December 15, 2010 as a new producer of ethylene, propylene, pyrolysis gasoline and other by-products produced by the Naphtha Cracker Project on a Pioneer status. Under its certificate of registration, JGSOC shall be entitled to certain tax and nontax incentives such as: (a) income tax holiday (ITH) for 6 years from actual start of commercial operations; only income generated from the registered activity shall be entitled to ITH incentives; additional deduction from taxable income of 50% of wages corresponding to the increment of direct labor; (c) employment of foreign nationals; (d) tax credit for taxes and duties on raw materials and supplies and semi-manufactured products used on its export products and forming part thereof, among others; (e) simplification of customs procedures for the importation of equipment, spare parts, raw materials and supplies; (f) access to Customs Bonded Manufacturing Warehouse (CBMW); (g) exemption from wharfage dues, export taxes, duties, imposts and fees on export products; and (h) importation of consigned equipment.
f) BANKING SERVICES
Robinsons Bank Corporation (RBC / the Bank), a commercial bank, is the surviving entity
between the merger of Robinsons Savings Bank and Robinsons Bank Corporation (formerly
known as The Royal Bank of Scotland (Phils.)) as approved by the Bangko Sentral ng
Pilipinas (BSP) in December 2010 and by the SEC in May 2011. 60% of the common stocks
are owned by JG Capital Services Corporation (JGCSC), a wholly-owned subsidiary of JG
Summit, while Robinsons Holdings Inc. (RRHI) owns the remaining 40%.
Robinsons Savings Bank started its operations in November 1997, and was a wholly-owned
subsidiary of JGSCS at that time. In the second quarter of 2010, JGCSC and RRHI then
jointly acquired 100% of the shares of The Royal Bank of Scotland (Phils.).
RBC continues to look for attractive mergers and acquisitions to fast track its goal to become
a significant player in the banking industry in the next five years. In December 2012, RBC
acquired Legazpi Savings Bank (LSB), making it a wholly owned subsidiary of the Bank.
With this venture, RBC intends to utilize the capacity and branch network of LSB as its
vehicle to engage in countryside banking and microfinance lending.
Principal Products or Services
As of December 31, 2016, RBC (on a Parent/Solo basis) has a network of 123 branches; 66
of which are strategically located in Metro Manila and 57 others are situated in Luzon,
Visayas and Mindanao. Moreover, 41 of its branches are located inside malls, mostly in
Robinsons Malls, that are easily accessible and available 6 to 7 days a week. RBC also has
213 ATMs, which are part of the Bancnet consortium, all of which are within reach and

-33-
available 24 hours a day 7 days a week. RBC also has 1 Micro-Banking Office (MBO)
situated in economic processing zone; while its subsidiary, LSB, has 11 branches in the Bicol
Region and has 2 Micro-Banking Offices (MBOs) situated in Bicol Region and Calabarzon
Having a proven track record in the banking industry and as JG Summit Group’s major
financial service arm, RBC continuously strives to carry on its vision of leading the country to
global-competitiveness through quality and innovative banking products and services. It
provides a broad range of traditional banking services such as savings, current and time
deposits, treasury and trust products, and foreign currency-denominated deposits. It also
offers commercial loans, consumer loans such as housing, car and personal loans,
motorcycle loans, micro financing, and other products or services such as cash management,
trade financing and remittance, among others. And with the license upgrade, RBC intends to
offer a wider range of products and services that are permissible to a commercial bank.
RBC aims to be among the top big banks in the country and continues to be a strategic
player in the industry. RBC prides itself with a business portfolio of market leaders, a solid
financial position, and a formidable management team which steers the Bank ahead of
changing times and through the challenges that come along with it. Thus, RBC is positioned
not only to be more responsive in meeting the banking requirements of its retail customers
and business partners, but also to fully serve the general banking public.
Strong Investor Base
RBC is part of the JG Summit Holdings conglomerate. It maintains good patronage of the
concessionaires, contractors and suppliers of the JG Group of Companies; exhibiting strong
deposit and loan acquisitions. The Bank being owned by JGSCS and RRHI, RBC is in the
company of leading and established corporations in the country today.
Regulatory Overview
The earnings of banks are affected not only by general economic conditions, but also by the
policies of various governmental and regulatory authorities in the country and abroad. The
establishment and operation of banking institution in the Philippines is governed by the
General Banking Act. The BSP acting through the Monetary Board, exercises overall
supervision of, and regulates the industry.
g) CORE INVESTMENTS
On March 29, 2011, the Company executed a sale and purchase agreement with PLDT under which PLDT has agreed to purchase all the rights, title and interest in the assets of Digitel. The acquisition was completed on October 26, 2011 following the issuance by the SEC of its confirmation of the valuation of the enterprise assets and the approval by National Telecommunications Commission of the transfer of 51.6% interest in Digitel. In November 2011, the Company subsequently sold 5.81 million and 4.56 million PLDT shares to an associate company of First Pacific Company Limited and NTT Docomo, Inc., respectively for approximately US$600 million. The Company is represented in PLDT’s board of directors with one board seat. The transaction triggered a mandatory tender offer for the acquisition of the remaining 48.5% of Digitel shares held by the public. PLDT launched a tender offer for such shares that ended January 16, 2012. As of December 31, 2016, the Company has an 8.0% shareholding in PLDT, one of the largest and most diversified telecommunications provider in the Philippines, which provides a wide range of telecommunications services in the country through its extensive fibre optic backbone and wireless, fixed line, broadband and satellite networks. PLDT’s business comprises three divisions: wireless, fixed line and BPO.

-34-
On December 11, 2013, the Company completed the purchase of a 27.1% stake in Manila
Electric Company (Meralco) for P=71.9 billion, which was funded by a combination of debt and
equity capital. Meralco is the largest electricity distributor in the country, which provides
electricity to over 5 million consumers in 34 cities and 77 municipalities.
On June 30, 2016, the Company completed the purchase of a 30.0% stake in Global
Business Power Corporation (GBPC) for P=11.82 billion. GBPC is one of the leading
independent power producers in the Visayas region and Mindoro island with a combined
gross maximum capacity of 704 MW comprising 696.5 MW of power supplied to the Visayas
grid and 7.5 MW of power supplied within Mindoro island.
h) SUPPLEMENTARY BUSINESSES
The Company has an interest in insurance brokering and securities investments and
business process outsourcing. Competition
Many of the Group’s activities are carried on in highly competitive industries. Given the
Group’s diversity, the Group competes with different companies domestically and
internationally, depending on the product, service or geographic area. While the Group is
one of the largest conglomerates in the Philippines, its subsidiaries compete in different
sectors against a number of companies with greater manufacturing, financial, research and
development and market resources than the Group.
The following table sets out the Group’s principal competitors in each of the principal industry
segments in which it operates:
Industry Segment Principal Competitors
Branded Consumer Foods, Agro-
Industrial and Commodity Food
Products
Liwayway Manufacturing Corp., Columbia Foods
International, Republic Biscuit Corporation, Suncrest
Foods Inc., Del Monte Phil. Inc., Monde Nissin
Corporation, Nestle Philippines Inc., San Miguel Pure
Foods Company, Inc., Kraft Foods Inc., Procter &
Gamble, Effem Foods/Mars Inc., Lotte Group, Perfetti
Van Melle Group, Mayora Inda PT, , Apollo Food, Frito-
Lay, Nestle S.A., Cadbury Schweppes PLC, Kraft
Foods International, San Miguel Corp. (B-Meg and
Integra), UNAHCO (Sarimanok, Thunderbird and
GMP), Aboitiz Inc. (Pilmico), Cargil Purina Phils. Inc.,
CJ and Sun Jun of Korea, New Hope of China, Pfizer,
Inc., UNAHCO (Univet), Merial Limited, San Miguel
Corp (Monterey), Foremost Farms Inc., Bounty Farms
Inc., Brookdale Farms, and Heritage Vet Corp.
Real Estate and Hotels SM Prime Holdings, Inc., ALI, Ayala Land Premier
Rockwell, Century Properties, Alveo Land, Megaworld,
Filinvest, Ortigas & Co., Avida Land, SMDC, DMCI
Homes, Vista Land, Red Planet, Fave Hotels of
Indonesia, Microtel by Wyndham, Islands Stay Hotels,
Park Inn by Radisson, Novotel, Seda Hotels by Ayala,
and Remington Hotel, Marco Polo, Citadines, Accor,
Exchange Regency and Oakwood
-35-
Industry Segment Principal Competitors
Air Transportation PAL, PAL Express, Philippines Air Asia for Domestic
flights; AirAsia, Jetstar Airways, PAL, Cathay Pacific,
Singapore Airlines and Thai Airways, among others for
International flights
Banking and Financial Services Citibank, Bank of Commerce, MayBank, PBCom
Petrochemicals Imports
Publicly-Announced New Product or Service
Other than those discussed above under the air transportation segment, the Group has no
publicly-announced new product or service as of the date of the report.
Patents, Trademarks, Licenses, Franchises Concessions, Royalty Agreements
The Group owns a substantial number of trademarks registered with the Intellectual Property
Office of the Philippines (IPOPhil). Trademark registrations with the IPOPhil prior to the
effective date of Republic Act No. 8293, or the current Intellectual Property Code of the
Philippines, are valid for 20 years from the date of issue of the certificate of registration.
Meanwhile, trademark registrations covered by Republic Act No. 8293 are valid for ten years
from the date of the certificate of registration. Regardless of whether the trademark
registration is for 20 years or ten years, the same may be renewed for subsequent ten-year
terms.
The Group also has various licenses and franchises issued by the government to enable
them to operate its diverse businesses including food, real estate, banking and financial
services, telecommunications, air transportation and power generation.
Effect of Existing or Probable Governmental Regulations on the Business
The Company operates the majority of its businesses, including food, real estate, banking
and financial services, telecommunications, air transportation and power generation activities,
in a highly regulated environment. Many of these businesses depend upon licenses or
franchises issued by the government authorities or agencies for their operations. These
businesses would be materially adversely affected by the suspension or revocation of these
licenses or franchises, which in turn may have a material adverse effect upon the Company.
In addition, the introduction or inconsistent application of, or changes in regulations may from
time to time materially affect the Company’s operations.
Cost and Effects of Compliance with Environmental Laws
The operations of the Company are subject to various laws enacted for the protection of the
environment. The Company believes that it has complied with all applicable Philippine
environmental laws and regulations, an example of which is the installation of waste and
industrial water treatments in its various facilities. Compliance with such laws has not had,
and in the Company’s opinion, is not expected to have, a material effect upon the Company’s
capital expenditures, earnings or competitive position.

-36-
Employees and Labor
The number of full-time employees employed by the Company and its operating subsidiaries
as of December 31, 2016 is shown in the following table:
Company
No. of
Employees
Branded Consumer Foods, Agro-industrial, &
Commodity Food Products
12,902
Property Development and Hotel Management 2,069
Airlines 4,123
Petrochemicals 761
Finance 1,608
Supplementary Businesses 14
21,477
The Company’s management believes that good labor relations generally exist throughout
the operating companies. For most of the operating companies, collective bargaining
agreements exist between the relevant representative unions for the employees and the
relevant operating companies. The collective bargaining agreements generally cover a five-
year term with a right to renegotiate the economic terms of the agreement after three years,
and contain provisions for annual salary increment, health and insurance benefits and closed-
shop arrangements. The management believes that those collective bargaining agreements,
which are soon to expire or which have expired, will, as a result of existing good labor
relations, be successfully renewed or renegotiated.
Risks
The major business risks facing the Group are as follows:
a. Competition
Many of the Group’s activities are in highly competitive industries. The Group faces
competition in all segments of its businesses both in the Philippine market and in
international markets. The Group’s ability to compete effectively will require continuous
efforts in sales and marketing of our existing products, development of new products and
cost rationalization. There can be no assurance that the Group’s sales volume and
market share will not be adversely affected by negative consumer reaction to higher
prices as a result of price reduction or promotional sales undertaken by its competitors.
b. Financial Market
The Group has a foreign exchange exposure primarily associated with fluctuations in the
value of the Philippine Peso against the U.S. dollar and other foreign currencies. The
Group’s revenues are predominantly denominated in Pesos, while certain expenses,
including fixed debt obligations, are denominated in foreign currencies. Prudent fund
management is employed to minimize effects of fluctuations in interest and currency
rates.
c. Raw Materials
The Group’s production operations are dependent in obtaining adequate supply of raw
materials on a timely basis. In addition, its profitability depends in part on the prices of
raw materials since a portion of the Group’s raw material requirements is imported

-37-
including packaging materials. To mitigate these risks, alternative sources of raw
materials are used in operations.
d. Cost and Availability of Fuel
The cost and availability of fuel are subject to many economic and political factors and events occurring throughout the world, the most important of which are not within the Group’s control. Fuel prices have been subject to high volatility, fluctuating substantially over the past several years. Any increase in the cost of fuel or any decline in the availability of adequate supplies of fuel could have a material adverse effect on the Group’s airline operations and profitability. The airline business implements various fuel management strategies to manage the risk of rising fuel prices including hedging.
e. Key Executives
The Company’s key executives play an integral part in the latter’s success. The
experience, knowledge, business relationships and expertise of these executives could
be difficult to replace and may result in a decrease in the Company’s operating
proficiency and financial performance should any of them decide to leave the Company.
f. Philippine Regulations
The Group operates a material part of its businesses in a highly regulated environment.
Many of these businesses depend upon licenses and franchises issued by government
authorities or agencies for their operation. These businesses would be materially
adversely affected by the suspension or revocation of these licenses or franchises.
The Group is also subject to numerous environmental laws and regulations relating to the
protection of the environment and human health and safety, among others. Many of
these environmental laws and regulations are becoming increasingly stringent and
compliance to such is becoming increasingly complex and costly.
Working Capital
The working capital requirement of each subsidiary varies depending on the industry it is
engaged in and is financed by operations and short-term loans from banks.
Item 2. Properties
JG Summit and its Subsidiaries conduct businesses throughout the Philippines, but primarily
in and around Metro Manila (where it is based) and in the regions of Visayas and Mindanao.
Substantially, all facilities are owned by the Company and are in good condition.
URC operates manufacturing/farm facilities located in the following:
Location (Number of facilities)
Type of Facility
Owned/Rented
Condition
Pasig City (5) Branded consumer food plants, feedmills and flourmill
Owned Good
Libis, Quezon City (1) Branded consumer food plant Owned Good
Canlubang, Laguna (1) Branded consumer food plant Owned Good
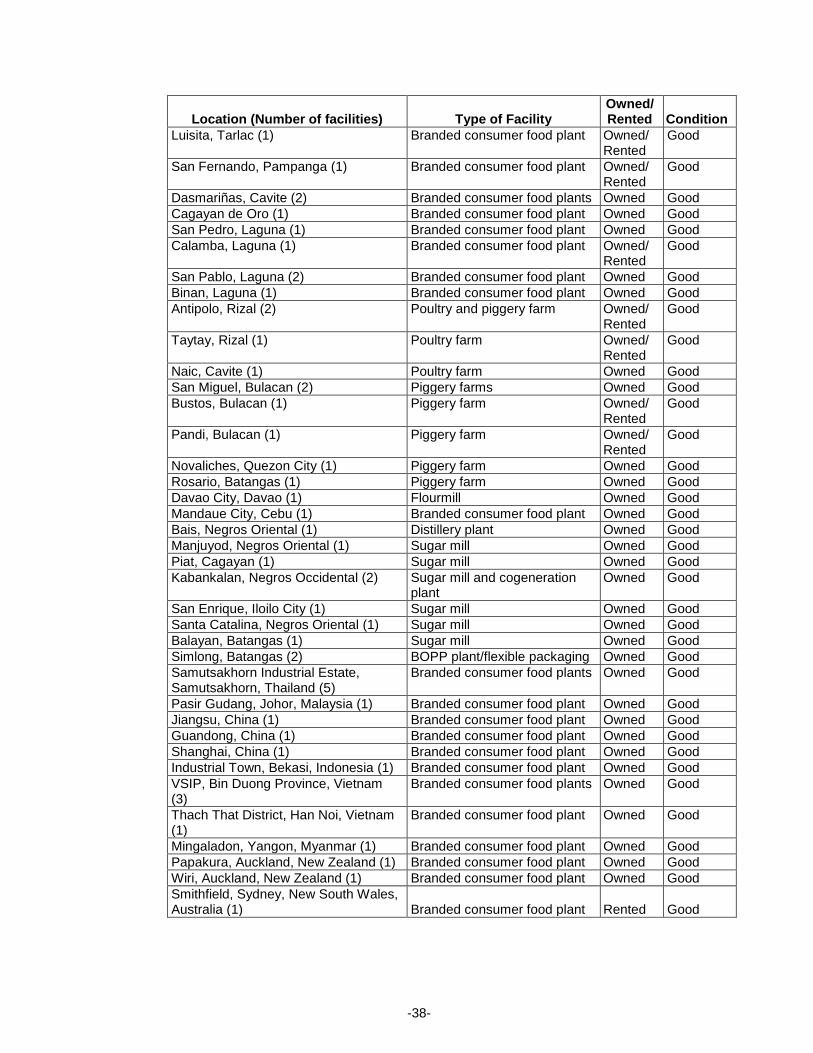
-38-
Location (Number of facilities)
Type of Facility
Owned/Rented
Condition
Luisita, Tarlac (1) Branded consumer food plant Owned/Rented
Good
San Fernando, Pampanga (1) Branded consumer food plant Owned/Rented
Good
Dasmariñas, Cavite (2) Branded consumer food plants Owned Good
Cagayan de Oro (1) Branded consumer food plant Owned Good
San Pedro, Laguna (1) Branded consumer food plant Owned Good
Calamba, Laguna (1) Branded consumer food plant Owned/Rented
Good
San Pablo, Laguna (2) Branded consumer food plant Owned Good
Binan, Laguna (1) Branded consumer food plant Owned Good
Antipolo, Rizal (2) Poultry and piggery farm Owned/Rented
Good
Taytay, Rizal (1) Poultry farm Owned/Rented
Good
Naic, Cavite (1) Poultry farm Owned Good
San Miguel, Bulacan (2) Piggery farms Owned Good
Bustos, Bulacan (1) Piggery farm Owned/Rented
Good
Pandi, Bulacan (1) Piggery farm Owned/Rented
Good
Novaliches, Quezon City (1) Piggery farm Owned Good
Rosario, Batangas (1) Piggery farm Owned Good
Davao City, Davao (1) Flourmill Owned Good
Mandaue City, Cebu (1) Branded consumer food plant Owned Good
Bais, Negros Oriental (1) Distillery plant Owned Good
Manjuyod, Negros Oriental (1) Sugar mill Owned Good
Piat, Cagayan (1) Sugar mill Owned Good
Kabankalan, Negros Occidental (2) Sugar mill and cogeneration plant
Owned Good
San Enrique, Iloilo City (1) Sugar mill Owned Good
Santa Catalina, Negros Oriental (1) Sugar mill Owned Good
Balayan, Batangas (1) Sugar mill Owned Good
Simlong, Batangas (2) BOPP plant/flexible packaging Owned Good
Samutsakhorn Industrial Estate, Samutsakhorn, Thailand (5)
Branded consumer food plants Owned Good
Pasir Gudang, Johor, Malaysia (1) Branded consumer food plant Owned Good
Jiangsu, China (1) Branded consumer food plant Owned Good
Guandong, China (1) Branded consumer food plant Owned Good
Shanghai, China (1) Branded consumer food plant Owned Good
Industrial Town, Bekasi, Indonesia (1) Branded consumer food plant Owned Good
VSIP, Bin Duong Province, Vietnam (3)
Branded consumer food plants Owned Good
Thach That District, Han Noi, Vietnam (1)
Branded consumer food plant Owned Good
Mingaladon, Yangon, Myanmar (1) Branded consumer food plant Owned Good
Papakura, Auckland, New Zealand (1) Branded consumer food plant Owned Good
Wiri, Auckland, New Zealand (1) Branded consumer food plant Owned Good
Smithfield, Sydney, New South Wales, Australia (1) Branded consumer food plant Rented Good

-39-
Location (Number of facilities)
Type of Facility Owned/Rented
Condition
Blacktown, Sydney, New South Wales, Australia (1) Branded consumer food plant Rented Good
URC intends to continuously expand the production and distribution of the branded consumer
food products internationally through the addition of manufacturing facilities located in
geographically desirable areas, especially in the ASEAN countries, the realignment of the
production to take advantage of markets that are more efficient for production and sourcing of
raw materials, and increased focus and support for exports to other markets from the
manufacturing facilities. It also intends to enter into alliances with local raw material suppliers
and distributors.
Annual lease payments for rented properties amounted to P=147 million in 2016. Lease
contracts are renewable annually. Land in Taytay, Rizal where farm’s facilities are located, is
owned by an affiliate and is rent-free.
RLC has invested in a number of properties located across the Philippines for existing and
future development projects. All of these properties are fully owned by RLC and none of
which are subject of any mortgage, lien or any form of encumbrance. RLC also enters into
joint venture arrangements with land owners in order to optimize their capital resources. Not
only does this encourage raw land development for future projects but it also provides them
with exclusive development and marketing rights.
The following are locations of RLC’s properties:
a) Land
Location Use Status
Metro Manila
Manila Mixed-use (mall/residential/hotel) No encumbrances Quezon City Residential/ Mixed-use
(mall/residential/hotel) No encumbrances
Pasay City Residential No encumbrances Mandaluyong City Mixed-use (mall/hotel/residential) No encumbrances Makati City Office Building No encumbrances Pasig City Residential/Mall/Mixed-use
(mall/hotel/residential) No encumbrances
Parañaque City Residential No encumbrances Muntinlupa City Mixed-use (mall/residential) No encumbrances Las Piñas City Mall No encumbrances Taguig City Residential No encumbrances Malabon City Mall No encumbrances
Metro Manila area Land bank No encumbrances Luzon
La Union Residential No encumbrances Pangasinan Mall No encumbrances Bulacan Mall No encumbrances
Nueva Ecija Mall No encumbrances
Pampanga Mall No encumbrances Tarlac Mall No encumbrances

-40-
Luzon
Batangas Mall/Residential No encumbrances Cavite Mall/Residential/Mixed-use
(mall/hotel/residential) No encumbrances
Laguna Mall No encumbrances Palawan Mixed-use (mall/hotel/residential) No encumbrances Rizal Residential/Mall No encumbrances Isabela Mall No encumbrances Luzon area Land bank No encumbrances Visayas
Iloilo Mixed-use (mall/hotel) No encumbrances
Bacolod City Mall No encumbrances Cebu Mixed-use (mall/hotel/residential) No encumbrances Negros Oriental Mixed-use (mall/hotel) No encumbrances Leyte Mall No encumbrances Roxas City Mall No encumbrances Visayas area Land bank No encumbrances
Mindanao
Agusan Del Norte Mall No encumbrances Cagayan De Oro City Residential No encumbrances Davao Mall/Hotel No encumbrances South Cotabato Mall/Residential No encumbrances Butuan City Mall No encumbrances Mindanao area Land bank No encumbrances
b) Building and Improvements
Location Use Status
Metro Manila
Manila Mixed-use (mall/hotel/residential) No encumbrances Quezon City Mixed-use (mall/hotel/residential) No encumbrances Mandaluyong City Mixed-use (mall/hotel/residential) No encumbrances Makati City Office Building No encumbrances
Pasig City Mixed-use (mall/hotel/residential) No encumbrances Malabon City Mall No encumbrances
Las Pinas City Mall No encumbrances
Muntinlupa City Residential No encumbrances
Luzon
Ilocos Norte Mixed-use (mall/office) No encumbrances Bulacan Mall No encumbrances Nueva Ecija Mall No encumbrances
Pampanga Mall No encumbrances Tarlac Mall No encumbrances Batangas Mall No encumbrances Cavite Mall/Mixed-use
(mall/hotel/residential)
No encumbrances
Laguna Mall No encumbrances Palawan Mixed-use (mall/hotel/residential) No encumbrances
Rizal Mall/Residential No encumbrances Pangasinan Mall No encumbrances Isabela Mall No encumbrances

-41-
Visayas Iloilo City Mixed-use (mall/hotel) No encumbrances Bacolod City Mall No encumbrances Cebu Mixed-use
(mall/hotel/office/residential)
No encumbrances
Negros Oriental Mall No encumbrances Leyte Mall No encumbrances Roxas City Mall No encumbrances
Mindanao Cagayan De Oro City Mall No encumbrances Davao City Mall No encumbrances South Cotabato Mall No encumbrances Agusan Del Norte Mall No encumbrances
RLC owns all the land properties upon which all of its existing commercial centers are located
except for the following: (i) Robinsons Place Iloilo, (ii) Robinsons Cagayan De Oro, (iii)
Robinsons Cainta, (iv) Robinsons Pulilan, and (v) Robinsons Place Jaro. These five land
properties are leased at prevailing market rates. The leases for the Iloilo and Cagayan de
Oro properties are for 50 years each and commenced in October 2001 and December 2002,
respectively. The leases for the Cainta and Pulilan properties are for 25 years and
commenced in December 2003 and January 2008, respectively. Renewal options for Cainta
and Pulilan are available to RLC. The lease for the Jaro, Iloilo property is for 30 years and
commenced in March 2015. Total rent expense amounted to P=203.42 million in 2016,
P=203.94 million in 2015 and P=153.0 million in 2014.
CEB does not own any land. However, it owns an office building which serves as its
corporate headquarters and training center located at the Domestic Road, Barangay 191,
Zone 20, Pasay City. The land on which said office building stands is leased from the Manila
International Airport Authority (MIAA). CEB also leases its hangar, aircraft parking and other
operational space from MIAA
JGSPC’s PP and PE complex and JGSOC’s naphtha cracker plant are both located in Barangay. Simlong, Batangas City.
Item 3. Legal Proceedings
Certain consolidated subsidiaries are defendants to lawsuits or claims filed by third parties
which have pending decisions by the courts or are under negotiation, the outcomes of which
are not presently determinable. In the opinion of management, the eventual liability under
these lawsuits or claims, if any, will not have a material effect on the Company’s consolidated
financial position. Refer to Note 43 of the Consolidated Financial Statements attached to this
report for a detailed description.
Item 4. Submission of Matters to a Vote of Security Holders
There were no matters submitted to a vote of security holders during the fourth quarter of the
year covered by this report.

-42-
PART II - OPERATIONAL AND FINANCIAL INFORMATION
Item 5. Market for Registrant's Common Equity and Related Stockholder Matters
Principal Market or Markets where the Registrant’s Common Equity is Traded
The common stock of the Company is listed on the Philippine Stock Exchange. Sales prices
of the common stock follow:
High Low
2016
First Quarter P=82.00 P=56.90
Second Quarter 95.00 77.80
Third Quarter 86.90 72.40
Fourth Quarter 79.80 65.55
2015
First Quarter P=72.50 P=62.10
Second Quarter 74.85 65.00
Third Quarter 74.00 64.95
Fourth Quarter 75.00 67.80
2014
First Quarter P=51.00 P=37.40
Second Quarter 52.55 46.60
Third Quarter 59.50 50.00
Fourth Quarter 66.60 54.70
The stock price of the Company’s shares as of March 28, 2017 is P=82.90.
Cash Dividends per Share
On June 9, 2016, the Company declared a regular cash dividend of P=0.25 per common share
from the Unrestricted Retained Earnings as of December 31, 1997 to all stockholders of
record as of June 29, 2016 and paid on July 25, 2016.
On June 10, 2015, the Company declared a regular cash dividend of P=0.22 per common
share from the Unrestricted Retained Earnings as of December 31, 1997 to all stockholders
of record as of June 25, 2015 and paid on July 21, 2015.
On June 26, 2014, the Company declared a regular cash dividend of P=0.20 per common
share from the Unrestricted Retained Earnings as of December 31, 1997 to all stockholders
of record as of July 17, 2014 and paid on August 12, 2014.
Stock Dividends Declared
No stock dividend was declared in 2016, 2015 and 2014.
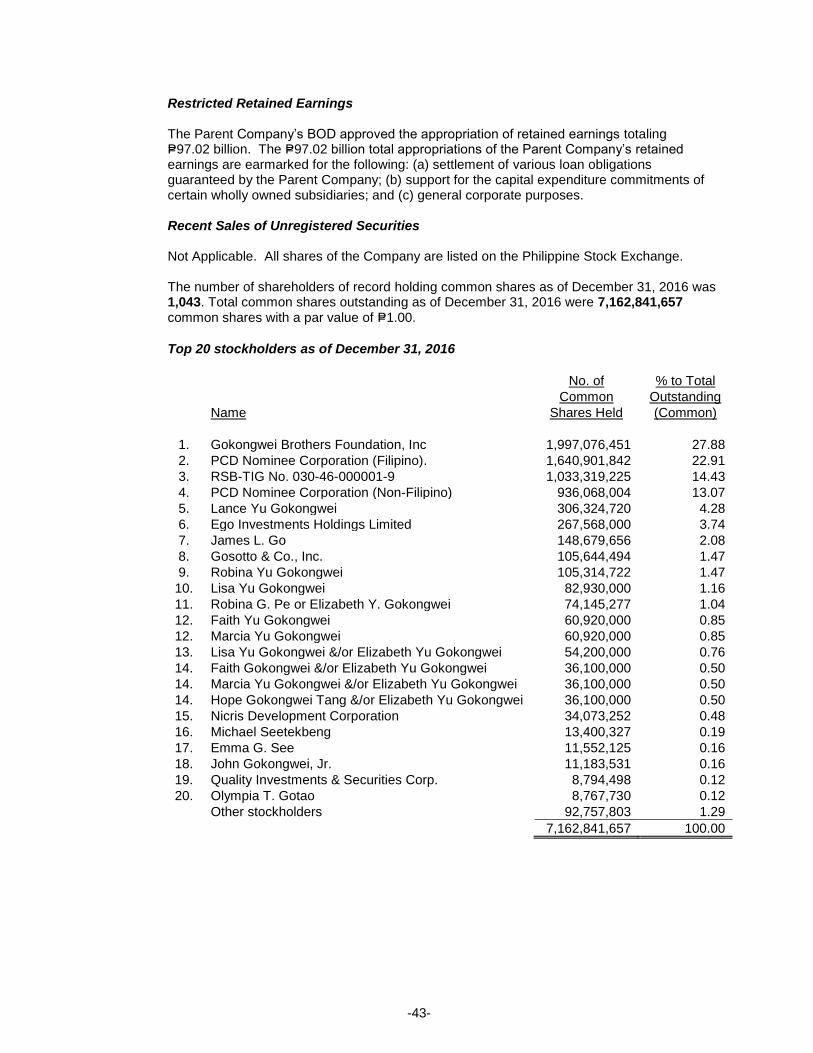
-43-
Restricted Retained Earnings
The Parent Company’s BOD approved the appropriation of retained earnings totaling P=97.02 billion. The P=97.02 billion total appropriations of the Parent Company’s retained earnings are earmarked for the following: (a) settlement of various loan obligations guaranteed by the Parent Company; (b) support for the capital expenditure commitments of certain wholly owned subsidiaries; and (c) general corporate purposes. Recent Sales of Unregistered Securities Not Applicable. All shares of the Company are listed on the Philippine Stock Exchange. The number of shareholders of record holding common shares as of December 31, 2016 was 1,043. Total common shares outstanding as of December 31, 2016 were 7,162,841,657 common shares with a par value of P=1.00.
Top 20 stockholders as of December 31, 2016
Name
No. of
Common
Shares Held
% to Total
Outstanding
(Common)
1. Gokongwei Brothers Foundation, Inc 1,997,076,451 27.88
2. PCD Nominee Corporation (Filipino). 1,640,901,842 22.91
3. RSB-TIG No. 030-46-000001-9 1,033,319,225 14.43
4. PCD Nominee Corporation (Non-Filipino) 936,068,004 13.07
5. Lance Yu Gokongwei 306,324,720 4.28
6. Ego Investments Holdings Limited 267,568,000 3.74
7. James L. Go 148,679,656 2.08
8. Gosotto & Co., Inc. 105,644,494 1.47
9. Robina Yu Gokongwei 105,314,722 1.47
10. Lisa Yu Gokongwei 82,930,000 1.16
11. Robina G. Pe or Elizabeth Y. Gokongwei 74,145,277 1.04
12. Faith Yu Gokongwei 60,920,000 0.85
12. Marcia Yu Gokongwei 60,920,000 0.85
13. Lisa Yu Gokongwei &/or Elizabeth Yu Gokongwei 54,200,000 0.76
14. Faith Gokongwei &/or Elizabeth Yu Gokongwei 36,100,000 0.50
14. Marcia Yu Gokongwei &/or Elizabeth Yu Gokongwei 36,100,000 0.50
14. Hope Gokongwei Tang &/or Elizabeth Yu Gokongwei 36,100,000 0.50
15. Nicris Development Corporation 34,073,252 0.48
16. Michael Seetekbeng 13,400,327 0.19
17. Emma G. See 11,552,125 0.16
18. John Gokongwei, Jr. 11,183,531 0.16
19. Quality Investments & Securities Corp. 8,794,498 0.12
20. Olympia T. Gotao 8,767,730 0.12
Other stockholders 92,757,803 1.29
7,162,841,657 100.00

-44-
Item 6. Management's Discussion and Analysis or Plan of Operation.
The following discussion and analysis should be read in conjunction with the accompanying
consolidated financial statements and notes thereto as of and for the year ended
December 31, 2016, 2015 and 2014, which form part of this Report. The consolidated
financial statements and notes thereto have been prepared in accordance with the Philippine
Financial Reporting Standards (PFRS).
Management’s Discussion of Results of Operations is presented in two parts: Consolidated
Operations and Segment Operations.
Alignment of Accounting Period In previous years, the Group consolidated the financial statements of their fiscal year end subsidiaries using their September 30 fiscal year end financial statements as allowed under PFRS 10. In accordance with PFRS 10, management exercised judgement in determining whether adjustments should be made in the consolidated financial statements of the Group pertaining to the effects of significant transactions or events of the fiscal subsidiaries that occur between September 30 and the date of the Parent Company’s financial statements.
Starting 2014, management of the Group deemed that it is now practicable to prepare
consolidated financial statements incorporating the financial statements of the Group’s fiscal
yearend subsidiaries as of the same date as the Parent Company’s financial statements
which is December 31.
In 2016, the request for change in accounting period of the Group’s fiscal yearend
subsidiaries (URC and RLC) to calendar year (January 1 to December 31) was approved by
the Securities and Exchange Commission and Bureau of Internal Revenue to be
implemented effective January 1, 2017.
RESULTS OF OPERATIONS
2016 vs. 2015 I. Consolidated Operations
JG Summit’s Core Net Income increased 7% for the Year Ended 2016 JG Summit Holdings, Inc. posted a 6.9% increase in our consolidated core net income (excluding non-operating and nonrecurring items), earning a total of P=29.97 billion in 2016 compared to P=28.05 billion in 2015. The increase in core net income is due to the double-digit income growth in our airline and petrochemicals businesses, offset by the income decline in our branded consumer foods business and dividends received during the year. The Group’s consolidated net income from equity holders of the parent amounted to P=10.92 billion in 2016 from P=22.61 billion last year mainly due to the recording of impairment losses totaling P=16.71 billion primarily from the decline in market value of the Group’s investment in PLDT where the Group has 8.0% stake. In accordance with the current Philippine Accounting Standard (PAS) 39, Financial Instruments: Recognition and Measurement, if a decline in fair value of an AFS equity investment is significant or prolong, the impairment is recognized one-time in net income rather than in equity. However, in 2018, upon effectivity of International Financial Reporting Standard (IFRS) 9, which will replace PAS 39, the Group’s consolidated net income for the year ended 2016 will be restated with the market valuation losses on PLDT investment charged directly back to equity. Excluding

-45-
the effect of the said impairment loss, the Group’s consolidated net income from equity holders of the parent amounted to P=27.63 billion in 2016, a 22.2% increase from P=22.61 billion last year. Consolidated EBITDA reached P=69.27 billion in 2016 from P=63.79 billion in 2015. Consolidated revenues grew 4.9% from P=229.27 billion in 2015 to P=240.50 billion in 2016 due to the performance of the following core subsidiaries:
CEB’s total revenues went up by 9.6% from P=56.50 billion in 2015 to P=61.90 billion in 2016 mainly due to 4.1% growth in passenger volume and 4.9% increase in average fares.
JG Petrochemicals Group revenues increased by 8.6% from P=26.78 billion in 2015 to P=29.07 billion in 2016 due to higher sales volume.
RLC’s total revenues also increased by 12.1% from P=20.30 billion in 2015 to P=22.75 billion in 2016 due to higher rental income and real estate sales.
URC’s total revenues slightly increased from P=112.00 billion in 2015 to P=112.61 billion in 2016 due to the revenue growth in the sugar, feeds and renewables businesses, offset by the decline in sales of branded consumer foods group.
The banking revenue increased 14.9% from P=2.97 billion in 2015 to P=3.41 billion this year due to increase in interest income recognized from finance receivables and trading gains.
Revenues from our core investments, however, declined this year as dividend income received by the Group dropped 28.7% from P=2.85 billion last year to P=2.03 billion this year mainly due to lower dividend income declared by PLDT from P=152 per share in 2015 to P=106 per share in 2016. Equity in net earnings of associates, primarily from investments in UIC and Meralco, increased from P=7.31 billion in 2015 to P=8.18 billion in 2016. On June 28, 2016, the Parent Company purchased 30% stake in Global Business Power Corporation (GBPC) so a corresponding equity earnings take-up was recorded for the six months ended December 31, 2016. The Group’s operating expenses increased by 13.0% from P=39.06 billion last year to P=44.14 billion this year due to higher selling, general and administrative expenses in the food and airline business units. As a result, Operating Income or EBIT went up 6.0% from P=49.35 billion in 2015 to P=52.27 billion in 2016. The Group’s net interest carry (interest expense less interest income) increased by 14.3% to P=6.30 billion this year from last year’s P=5.51 billion due to higher level of short-term and long-term borrowings. Market valuation loss on financial assets at FVPL amounted to P=57.68 million in 2016 from P=336.99 million in 2015 due to lower decline in market values of equity investments. Market valuation gains on derivative financial instruments this year, primarily from CEB, amounted to P=1.73 billion from last year’s P=2.35 billion loss due to the improvement of forward prices of fuel for 2016 and 2017, as compared to forward fuel prices as of end of 2015. Market valuation loss on impaired available-for-sale investments pertains to the impairment loss recognized due to the significant drop in the market price of PLDT shares from an average acquisition cost of P=2,331 per share to P=1,365 per share as of end of 2016.

-46-
The Group recognized a net foreign exchange loss of P=2.64 billion from P=4.14 billion reported last year mainly due to the combined effects of appreciation of URC international subsidiaries’ local currencies against US dollar, particularly IDR and NZD, and depreciation of Philippine Peso against US Dollar.
Other income (expense) - net account, which represents miscellaneous income and
expenses, netted a loss of P=487.96 million from last year’s gain of P=151.22 million mainly due
to the loss on sale of CEB’s aircraft during the year.
Provision for income tax increased by 21.1% to P=5.44 billion in 2016 from P=4.49 billion in
2015 mainly due to higher deferred tax liability, net of lower taxable income, of the food
business.
II. Segment Operations
Foods generated a consolidated sale of goods and services of P=112.61 billion for the year ended December 31, 2016, a slight growth over last year. Sale of goods and services performance by business segment follows: (1) URC’s branded consumer foods (BCF) segment, excluding packaging division, decreased 0.9%, to P=92.14 billion in 2016 from P=92.96 billion registered in 2015. BCF domestic operations posted a 1.2% increase in net sales from P=58.46 billion in 2015 to P=59.19 billion in 2016 which was mainly driven by RTD beverages with double-digit growths. Sales was muted in 2016 as an aftermath of the hiccups in its supply chain operations. In addition, major categories like coffee experienced intense price war and aggressive marketing from its key competitors while the snack foods category was flattish due to the aggressive low-priced players affecting corn chips and pelletized snacks. BCF international sales decreased by 4.5% to P=32.95 billion in 2016 against P=34.50 billion in 2015. In constant U.S. dollar (US$) term, sales declined by 6.7% to US$694 million in 2016 against last year due to regulatory issues encountered in Vietnam despite the growth from Indonesia, Thailand and Malaysia and sales contribution from Australia. Indonesia was up by 23.1% driven by the growth in modern trade and sustained sales momentum from favorable results in all categories. Malaysia grew by 7.7% on the back of positive performances from chocolates and wafers while Thailand increased by 7.6% as consumer confidence has started to recover in the country. Total Griffins results were also weaker than expected given the drag of the Australia business due to loss in private label contracts. Sale of goods and services in URC’s packaging division went down by 4.7% to P=1.10 billion in 2016 from P=1.15 billion recorded in 2015 due to lower sales volume. (2) Agro-Industrial segment (AIG) amounted to P=9.20 billion in 2016, a 2.6% increase from P=8.97 billion recorded in 2015. Feeds business grew by 16.4% due to increase in sales volume as a result of aggressive sales and marketing strategies while farms business declined by 10.6% due to lower average selling price of live hogs. (3) Sale of goods and services in commodity foods segment amounted to P=10.18 billion in 2016, up by 14.0% from P=8.93 billion reported in 2015. Sugar business grew by 37.5% due to incremental sales from the recently acquired Balayan sugar mill and higher prices of raw and refined sugar while renewables increased by 17.7%. Flour business declined by 5.6% despite higher volume due to lower average selling price. URC’s cost of sales consists primarily of raw and packaging materials costs, manufacturing costs and direct labor costs. Cost of sales increased by 1.5% to P=76.40 billion in 2016 from P=75.29 billion recorded in 2015 due to increase in sales volume. URC’s gross profit for 2016 amounted to P=36.21 billion from P=36.72 billion reported in 2015. Gross profit margin decreased by 63 basis points from 32.8% in 2015 to 32.2% in 2016. Selling and distribution costs, and general and administrative expenses rose by 9.8% to P=20.45 billion in 2016 from P=18.62 billion registered in 2015. This increase resulted primarily
-47-
from the following factors: (a) 6.5% increase in compensation and benefits to P=4.28 billion in 2016 from P=4.01 billion in 2015 due to increase in headcount and annual salary adjustments; (b) 7.1% increase in advertising and promotion costs to P=6.89 billion in 2016 from P=6.43 billion in 2015 due to promotion programs with key accounts and wholesalers, and new product launches; (c) 12.0% increase in freight and delivery charges to P=5.49 billion in 2016 from P=4.90 billion in 2015 due to increase in trucking and shipping costs as a result of increased volume; (d) 33.0% increase in rent expense to P=811.89 million in 2016 from P=610.43 million in 2015 as a result of business expansion and acquisitions; and (e) 52.3% increase in depreciation expense to P=572.23 million in 2016 from P=375.78 million in 2015 as a result of business expansion and acquisitions. Market valuation gain on financial instruments at fair value through profit or loss amounted to P=107.38 million in 2016 from P=541.83 million in 2015 due to fair value changes of derivative instruments and lower decline in market values of equity investments. URC’s finance revenue consists of interest income from investments in financial instruments, money market placements, savings and dollar deposits and dividend income from investment in equity securities. Finance revenue decreased to P=182.34 million in 2016 from P=286.81 million in 2015 due to decline in level of financial assets. URC’s finance costs which consist mainly of interest expense decreased by 31.5%, to P=927.12 million in 2016 from P=1.35 billion recorded in 2015 due to lower level of financial debt resulting from prepayment of a long-term debt. Net foreign exchange gain amounted to P=1.31 billion in 2016 from P=44.74 million reported in 2015 due to the combined effects of appreciation of international subsidiaries’ local currencies against US dollar, particularly IDR and NZD, and depreciation of Philippine peso against US dollar. Impairment losses increased to P=185.07 million in 2016 from P=109.50 million in 2015 due to higher inventory write-offs resulting from issues encountered in Vietnam. Equity in net losses of joint ventures amounted to P=166.72 million in 2016 from P=248.43 million in 2015 due to lower losses of Danone Universal Robina Beverages, Inc. (DURBI). Other income (expenses) - net consists of gain (loss) on sale of fixed assets, amortization of bond issue costs, rental income, and miscellaneous income and expenses. Other income - net decreased to P=220.10 million in 2016 from P=287.32 million in 2015 due to higher insurance claims and gain from scrap sales last year. URC recognized provision for income tax of P=3.22 billion in 2016, a 9.5% decrease from P=3.55 billion in 2015 due to lower taxable income. URC’s core earnings before tax (operating profit after equity earnings, net finance costs and other expenses - net) for 2016 amounted to P=14.94 billion, a decline of 12.5% from P=17.08 billion recorded in 2015. Net income attributable to equity holders of the parent decreased by 7.1% to P=12.87 billion in 2016 from P=13.86 billion in 2015 as a result of the factors discussed above. URC reported an EBITDA (operating income plus depreciation and amortization) of P=21.40 billion for 2016, 7.2% lower than P=23.06 billion posted in 2015.
-48-
Real estate and hotels exhibited a strong top-line performance of 12.1% to P=22.75 billion for the year ended December 31, 2016 from P=20.30 billion same period last year.
The Commercial Centers Division generated 45% of total RLC’s revenues in 2016 amounting
to P=10.14 billion. Its revenue growth of 8.0% from P=9.39 billion in the preceding year was
attributed to the same mall rental revenue growth of approximately 6%; full-year contribution
of lifestyle centers opened in 2015, and lease revenues from the three new malls and two
mall expansions in 2016; tempered by the flattish growth in amusement revenues by 2.2%
due to less blockbuster films released during the period despite of additional cinemas opened
during the year. The lifestyle centers completed in 2016 are Robinsons Place Tagum in
Davao, Robinsons General Trias in Cavite and Robinsons Place Jaro in Iloilo, while
Robinsons Place Ilocos and Robinsons Place Tacloban were expanded, which together
added approximately 11% or 167,000 sqm of retail space.
The Office Buildings Division posted the fastest revenue trajectory among all business
segments by 23.6% to P=3.00 billion from P=2.43 billion over the same period last year. This
was mainly due to escalation of rents and full-year contribution of Cyberscape Alpha,
Cyberscape Beta and Tera Tower. The division’s share of the total RLC revenues expanded
to 13%. In 2016, two new office developments were completed within RLC’s mixed-use
properties, Robinsons Place Ilocos and Galleria Cebu Complex, boosting total net leasable
area to 325,000sqm, while achieving virtually full occupancy in existing offices. RLC remains
to be one of the leading office space providers in the country.
The Hotels and Resorts Division yielded 8% of total RLC revenues in 2016 at P=1.81 billion
from P=1.80 billion in 2015. Revenue growth was flat mainly as a result of lower than
expected occupancy rates of international branded hotels, Crowne Plaza and Holiday Inn,
due to accounts affected by the traffic condition in the area, compensated by the growth of
Summit Hotel and Go Hotels brands. The chain-wide occupancy rate across all of 15 hotel
properties under the multi-branded hotel portfolio stood at 68% in 2016. In addition, Roxaco-
Vanguard Hotels Corporation, a franchisee of Go Hotels, officially opened in September 2016
the Go Hotels Manila Airport Road, the first of five Go Hotels slated to open in Metro Manila
under the franchise.
Realized revenues from the Residential Division surged by 17.1% year on year to
P=7.84 billion as higher level full equity sales were recognized in 2016 compared to 2015
accompanied by improvement in completion.
Other real estate costs and expenses and general and administrative expenses grew at a slower pace than revenues by 10.9% to P=6.60 billion from P=5.95 billion last year. The opening of new malls, offices and hotels in 2016 resulted to higher salaries and wages. Sales commissions and allowances increased as more projects were turned over in 2016; while advertising and promotions expense grew mainly due to new project launches. EBITDA which was up by 8.5% to P=12.05 billion grew faster than EBIT which jumped by 4.7% to P=8.28 billion, mainly due to higher depreciation expense. Depreciation expense increased by 17.8% to P=3.77 billion in 2016 from P=3.20 billion last year due to the completion of new large format malls, several new offices and hotels. RLC’s investment portfolio consisting of the malls, offices and hotels business accounted for 85% of total EBITDA; while the balance of 15% came from development portfolio composed of four residential brands.

-49-
Interest expense amounting to P=796.14 million arising from higher level of borrowings, and finance charges of P=147.97 million arising from prepayment of long-term loans to avail of interest cost savings were tempered by an extraordinary gain amounting to P=208.71 million from insurance claims on business interruption from previous events. As a result, the Net Income Attributable to Equity Holders ended at P=5.75 billion in 2016 from P=5.95 billion same period last year.
Air transportation generated gross revenues of P=61.90 billion for the year ended
December 31, 2016, 9.6% higher than the P=56.50 billion revenues earned last year mainly
attributed to the increase in passenger revenues by 9.2% to P=46.59 billion for the year ended
December 31, 2016 from P=42.68 billion registered in 2015. This increase was primarily due
to the 4.1% growth in passenger volume to 19.1 million from last year’s 18.4 million resulted
from the increase in CEB’s fleet from 55 aircraft as of December 31, 2015 to 57 aircraft as of
December 31, 2016 and the overall improvement in seat load factor from 82.6% to 86.0%.
The increase in average fares by 4.9% to P=2,436 in 2016 from P=2,323 in 2015 also
contributed to the increase in revenues. Cargo revenues grew 3.0% to P=3.56 billion for the
year ended December 31, 2016 from P=3.46 billion in the same period last year following the
increase in the cargo prices in 2016. Ancillary revenues went up by 13.4% to P=11.74 billion
for the year ended December 31, 2016 from P=10.36 billion posted last year consequent to the
4.1% increase in passenger traffic and 8.9% increase in ancillary revenue per passenger.
Improved online bookings, together with a wider range of ancillary revenue products and
services, also contributed to the increase.
Operating expenses for the year ended December 31, 2016 increased by 6.1% to
P=49.65 billion from P=46.80 billion last year attributable to higher aircraft maintenance and
advertising and promotions costs, partially offset by the drop in fuel costs due to the decline
in global jet fuel prices. Flying operations expenses decreased by 5.8% to P=19.69 billion for
the year ended December 31, 2016 from P=20.92 billion incurred in 2015 primarily attributable
to the 10.4% decline in aviation fuel expenses to P=15.82 billion in 2016 from P=17.66 billion in
2015 consequent to the significant drop in jet fuel prices, partially offset by the weakening of
the Philippine peso against the U.S. dollar. Aircraft and traffic servicing expenses increased
by 12.5% to P=6.58 billion for the year ended December 31, 2016 from P=5.85 billion registered
in 2015 driven by the increase in the number of international flights by 6.1% in 2016 for which
airport and ground handling charges were generally higher compared to domestic flights.
International flights increased due to added frequencies on existing routes and the launch of
new services to Fukuoka, Japan in December 2015 and Guam, the airline’s first US
destination, last March 2016. Depreciation and amortization expenses grew by 17.4% to
P=6.00 billion for the year ended December 31, 2016 from P=5.11 billion for the year ended
December 31, 2015 consequent to the arrival of three Airbus A320 aircraft and two ATR 72-
600 aircraft during the year. Repairs and Maintenance expenses went up by 24.6% to
P=6.53 billion for the year ended December 31, 2016 from P=5.24 billion posted last year driven
by the increase in provisions for return cost to P=1.12 billion in 2016 from P=863.96 million in
2015 and the increase in CEB’s fleet from 55 to 57 aircraft as well as direct costs from repairs
incurred for older aircraft, in particular, the remaining A319 fleet, the ATR fleet, and the early
deliveries of A320 aircraft.
As a result, CEB finished with an operating income (EBIT) of P=12.25 billion in 2016, a 26.3%
increase from P=9.70 billion in 2015. EBITDAR amounted to P=23.62 billion, a 19.9% increase
from P=19.70 billion last year.

-50-
CEB recognized higher interest income for the year from P=83.01 million last year to
P=113.67 million this year due to the increase in the balance of cash in bank and short-term
placements year on year and higher interest rates in short term placements.
CEB incurred a hedging gain of P=1.59 billion for the year ended December 31, 2016, an
increase of 154.2% from hedging loss of P=2.93 billion incurred last year due to the
improvement of forward prices of fuel for 2016 and 2017, as compared to forward fuel prices
as of end of 2015. Net foreign exchange losses of P=2.28 billion for the year ended December
31, 2016 resulted from the weakening of the Philippine Peso against the U.S. dollar. CEB’s
major exposure to foreign exchange rate fluctuations is in respect to U.S. dollar denominated
long-term debt incurred in connection with aircraft acquisitions.
Equity in net income of joint venture increased by 403.4% to P=178.31 million for the year
ended December 31, 2016 attributable to the net income from current operations earned by
the joint ventures in 2016.
Interest expense increased by 9.0% to P=1.17 billion for the year ended December 31, 2016
from P=1.07 billion in 2015 due to the additional loans availed to finance the acquisition of
additional aircrafts delivered in 2016.
In 2016, CEB sold and delivered four Airbus A319 aircraft to a subsidiary of Allegiant Travel
Company which resulted to a loss of P=962.61 million. In 2015, CEB sold and delivered two
Airbus A319 aircraft to Allegiant and incurred a loss of P=80.27 million.
As a result of the foregoing, net income for the year ended December 31, 2016 increased by
122.3% to P=9.75 billion from P=4.39 billion last year.
Petrochemicals (consist of JGSPC and JGSOC) combined gross revenues reached P=29.07 billion in 2016 as compared to last year’s P=26.78 billion due to higher sales volume from 0.96 million MT in 2015 to 1.15 million MT in 2016. On the other hand, costs and expenses slightly decreased from P=24.55 billion in 2015 to P=24.15 billion in 2016 mainly due to lower naphtha cost. Interest expense also reached P=136.90 million for the year ended December 31, 2016 from last year’s P=84.78 million due to higher level of trust receipts and short-term notes payable to fund operating activities during the year. Net foreign exchange loss of P=272.38 million was recorded in 2016 from last year’s P=307.03 million. All these factors contributed to the net income of P=5.13 billion in 2016 from P=3.16 billion in 2015, an improvement of 62.4% boosted mainly by higher capacity utilization that matched better market demand.
Banking Services, generated banking revenue of P=3.41 billion in 2016, a 14.9% increase
from last year’s P=2.97 billion brought about by higher interest income and trading gains for
the year. Cost and expenses also increased by 10.2% as the bank continued its expansion,
net of the decrease in provision for impairment losses on receivables from P=244.70 million in
2015 to P=138.97 million in 2016. As a result, net income for the year ended December 31,
2016 amounted to P=256.65 million, a 140.6% increase from last year’s P=106.67 million.
Equity in net earnings of associate companies and joint ventures amounted to
P=8.18 billion for the year ended December 31, 2016, an 11.8% increase from last year’s
P=7.31 billion primarily attributable to the 11.3% increase in equity earnings from United
Industrial Corporation Limited (UICL) from P=2.51 billion last year to P=2.79 billion this year,
and the equity earnings take-up from Global Business Power amounting to P=356.43 million
for six months since its acquisition in June 2016. Equity income from Meralco slightly
increased by 0.4% to P=4.98 billion. United Industrial Corporation, Limited recorded a
-51-
5.6% growth in its net income from operations from S$236.28 million in 2015 to S$249.42
million in 2016. The increase in net income is mainly due to higher residential properties
sales and progressive revenue recognition for UIC's residential projects, particularly from V
on Shenton and Alex Residences, partially offset by the lower contribution from Thomson
Three and Archipelago joint venture residential projects. Since the Group’s policy for the
valuation of property, plant and equipment is the cost basis method, the equity income taken
up by the Group represents the adjusted amounts after reversal of the effect in the income
statement of the revaluation of the said assets.
2015 vs. 2014 I. Consolidated Operations JG Summit Holdings, Inc. posted a 38.1% increase in our consolidated core net income (excluding non-recurring items), earning a total of P=28.05 billion in 2015 compared to P=20.30 billion in 2014. The increase in core net income is due to the double-digit income growth in our core operating businesses such as branded consumer foods, property development but more particularly in our airline business, Cebu Air, which benefited significantly from the substantial reduction in fuel prices and in our Petrochemicals group, where business has expanded significantly since resumption of its operations in November 2014. The Group’s consolidated net income from equity holders of the parent amounted to P=22.61 billion in 2015, a 23.9% increase from P=18.25 billion last year. The increase is lower compared to the growth of core net income because of foreign exchange losses caused by the depreciation of Philippine Peso vs. U.S. Dollar by more than P=2.00 by year-end 2015, as well as mark-to-market losses mainly from Cebu Air’s fuel hedging losses in 2015. Consolidated EBITDA reached P=63.79 billion, a 29.6% increase compared to last year. Consolidated revenues grew 24.1% from P=184.81 billion in 2014 to P=229.27 billion in 2015 due to the strong performance of the following core subsidiaries:
URC’s total revenues increased by 15.9% from P=96.65 billion in 2014 to P=112.00 billion in 2015 mainly due to 16.3% growth of the branded consumer foods, both domestic and international, including sales contribution from Griffin’s NZ which was consolidated starting mid-November of 2014.
RLC’s total revenues posted a 16.4% growth from P=17.43 billion in 2014 to P=20.30 billion in 2015 brought about by the additional revenue contribution of the nine new malls, three office buildings (Cyberscape Alpha, Cyberscape Beta and Tera Tower), and 4 new hotels (Go Hotel Iloilo, Go Hotel Ortigas, Go Hotel Butuan and Summit Hotel Magnolia).
CEB’s total revenues went up by 8.7% from P=52.00 billion in 2014 to P=56.50 billion in 2015 mainly due to 8.9% growth in passenger volume and 9.8% increase in ancillary revenue per passenger, partially offset by the decrease in average fares of 2.5%.
JG Petrochem group-wide revenues increased substantially from P=3.23 billion in 2014 to P=26.78 billion in 2015 as they resumed commercial operations in November 2014.
The banking revenue increased 9.3% from P=2.72 billion in 2014 to P=2.97 billion this year due to inrease in interest income recognized from finance receivables.
Revenue from other supplementary businesses recorded 21.0% increase due to higher commission income and outsource revenue for the year.

-52-
Revenues from our core investments, however, declined this year as dividend income received by the Group dropped 43.9% from P=5.07 billion last year to P=2.85 billion this year mainly due to P=1.70 billion dividend income received from Jobstreet in 2014 with no equivalent in 2015 and lower dividend income declared by PLDT from P=185 per share in 2014 to P=152 per share in 2015. Consolidated cost of sales and services increased by 22.5% from P=115.01 billion last year to P=140.86 billion this year, lower than the revenue growth mainly due to decline in aviation fuel expenses incurred by our airline business, consequent to the significant drop in jet fuel prices, despite increase in the number of flights flown in 2015. The Group’s operating expenses increased by 20.8% from P=32.33 billion last year to P=39.06 billion this year due to higher selling, general and administrative expenses in the food and airline business units. As a result, Operating Income or EBIT went up 31.7% from P=37.48 billion in 2014 to P=49.35 billion in 2015. The Group’s net interest carry (interest expense less interest income) increased by 23.1% to P=5.51 billion this year from last year’s P=4.48 billion because of the increase in long-term debt during the year relative to the acquisition of Griffin’s NZ business by URC in late 2014. Market valuation loss on financial assets at FVPL amounted to P=336.99 million in 2015 from P=1.27 billion in 2014 mainly due to the P=1.46 billion mark-to-market loss on Jobstreet shares recognized in 2014. The Group recognized a net foreign exchange loss of P=4.14 billion from P=358.83 million reported last year due to the depreciation of the Philippine Peso and other ASEAN regional currencies against the U.S. Dollar.
Other income (expense) - net account, which represents miscellaneous income and
expenses, netted a gain of P=151.22 million from last year’s P=1.22 billion attributable mainly to
the recognition of P=1.45 billion one-time gain on sale of Jobstreet in 2014.
Provision for income tax increased by 0.9% to P=4.49 billion in 2015 from P=4.45 billion in 2014
due to higher taxable income for the year, net of increase in deferred tax asset recognized.
II. Segment Operations
Foods generated a consolidated sale of goods and services of P=112.00 billion for the year ended December 31, 2015, 15.9% sales growth over last year’s P=96.65 billion. Sale of goods and services performance by business segment follows: (1) URC’s branded consumer foods (BCF) segment, excluding packaging division, increased 16.3%, to P=92.96 billion in 2015 from P=79.90 billion registered in 2014. BCF domestic operations posted a 7.3% increase in net sales from P=54.49 billion in 2014 to P=58.46 billion in 2015. RTD tea continues to grow strongly with additional capacities while noodles continue to gain traction with Nissin Cup noodles. Sales growth was muted mainly due to aggressive competition across all categories, mostly coffee and snacks. BCF international sales increased by 35.8% to P=34.50 billion in 2015 against P=25.41 billion in 2014. In U.S. dollar (US$) term, sales registered an increase of 32.5% from US$571 million in 2014 to US$758 million in 2015. Top-line growth came from Vietnam, Indonesia and Thailand with sales contribution from New Zealand. Vietnam continued to grow on the back of robust sales of Rong Do, energy drink brand and C2, which remains to be the number one brand in the RTD tea category in the market. Indonesia posted double digit growth with its number one potato chips brand,

-53-
Piattos, hitting all-time high sales and successful launch of another snack brand, Chiz King.Sales growth in Thailand was driven by core brands as it continues to be the market leader in biscuits and wafers. The Group started consolidating Griffin’s sales into URC International starting mid-November 2014 upon closing of the acquisition. Sale of goods and services in URC’s packaging division slightly went down to P=1.15 billion in 2015 from P=1.19 billion recorded in 2014 due to decline in volume. (2) Agro-Industrial segment (AIG) amounted to P=8.97 billion in 2015, an increase from P=8.41 billion recorded in 2014. Feeds business increased by 21.2% due to higher sales volume as a result of effective sales strategy while farms business declined by 4.4% due to lower selling price and volume. (3) Sale of goods and services in commodity foods segment amounted to P=8.93 billion in 2015, up by 25.0% from P=7.15 billion reported in 2014. Growth came from sales contribution of the renewable energy businesses, distillery and cogeneration, which amounted to P=1.58 billion. Sugar business also reported a 6.9% sales growth due to higher sales volume while flour business remained flat. URC’s cost of sales consists primarily of raw and packaging materials costs, manufacturing costs and direct labor costs. Cost of sales went up by 13.8%, to P=75.29 billion in 2015 from P=66.17 billion recorded in 2014 due to increase in sales volume. URC’s gross profit for 2015 amounted to P=36.72 billion from P=30.49 billion reported in 2014. URC’s gross profit as a percentage of net sales increased by 120 basis points from 31.5% in 2014 to 32.7% in 2015. Selling and distribution costs, and general and administrative expenses rose by 21.8% to P=18.62 billion in 2015 from P=15.28 billion registered in 2014. This increase resulted primarily from the following factors: (a) 33.2% increase in compensation and benefits to P=4.01 billion in 2015 from P=3.01 billion in 2014 due to annual salary adjustments including the effect of consolidating Griffin’s accounts starting mid-November 2014; (b) 13.4% increase in advertising and promotion costs to P=6.43 billion in 2015 from P=5.67 billion in 2014 due to promotion programs with key accounts and wholesalers, and new product launches; (c) 11.5% increase in freight and delivery charges to P=4.90 billion in 2015 from P=4.40 billion in 2014 due to increase in trucking and shipping costs as a result of increased volume; (d) 244.4% increase in rent expense to P=610 million in 2015 from P=177 million in 2014 as a result of consolidating Griffin’s accounts; and (e) 84.8% increase in contracted services to P=453 million in 2015 from P=245 million in 2014 as a result of consolidating Griffin’s accounts. Market valuation gain on financial instruments at fair value through profit or loss of P=542 million was reported in 2015 against the P=6 million market valuation loss in 2014 due to fair value changes from derivative instruments, net of decline in market values of equity investments. URC’s finance revenue consists of interest income from investments in financial instruments, money market placements, savings and dollar deposits and dividend income from investment in equity securities. Finance revenue increased to P=287 million in 2015 from P=235 million in 2014 due to increased level of financial assets and higher dividend income received. URC’s finance costs consist mainly of interest expense which increased by 291.1%, to P=1.35 billion in 2015 from P=346 million recorded in 2014 due to significant increase in level of financial debt in the last quarter of 2014 to finance the acquisition of NZSFHL. Impairment losses decreased to P=110 million in 2015 from P=123 million in 2014 due to lower impairment losses on receivables. Net foreign exchange gain amounted to P=45 million in 2015 from P=75 million net foreign exchange loss reported in 2014 due to the combined effects of appreciation of international

-54-
subsidiaries’ local currencies vis-à-vis U.S. dollar, and depreciation of Philippine peso vis-à-vis U.S. dollar. Equity in net losses of joint ventures increased to P=248 million in 2015 from P=75 million in 2014 due to losses of Danone Universal Robina Beverages, Inc. (DURBI) and Calbee-Universal Robina Corporation (CURC), which are still in pre-operating stages. Other income (expenses) - net consists of gain (loss) on sale of fixed assets, amortization of bond issue costs, rental income, and miscellaneous income and expenses. Other income-net increased to P=287 million in 2015 from P=72 million other expense - net in 2014 due to claims from truckers, income from sale of poultry farm and insurance claims from losses resulting from typhoons. URC recognized provision for income tax of P=3.55 billion in 2015, a 31.9% increase from P=2.69 billion in 2014 due to higher taxable income, net of increase in recognized deferred tax asset. URC’s core earnings before tax (operating profit after equity earnings, net finance costs and other expenses - net) for 2015 amounted to P=17.08 billion, an increase of 14.3% from P=14.94 billion recorded in 2014. Net income attributable to equity holders of the parent increased by 16.0% to P=13.86 billion in 2015 from P=11.95 billion in 2014 as a result of the factors discussed above. URC reported an EBITDA (operating income plus depreciation and amortization) of P=23.06 billion for 2015, 18.7% higher than P=19.43 billion posted in 2014.
Real estate and hotels generated total gross revenues of P=20.30 billion for calendar year
2015, an increase of 16.4% from P=17.43 billion total gross revenues for calendar year 2014.
EBIT (Operating income) grew 24.3% to P=7.92 billion while EBITDA (Operating income plus
depreciation) posted a 20.5% growth to P=11.13 billion. Net income stood at P=5.95 billion, up
by 24.7% compared to last year.
The Commercial Centers Division posted a 12.6% revenue growth to P=9.40 billion in 2015
from P=8.35 billion last year. This was driven by the steady same mall rental revenue growth
of 7% as well as the contribution of the newly opened malls in 2015 and 2014 namely,
Robinsons Place Antipolo, Robinsons Place Las Pinas, Robinsons Place Antique, Robinsons
Novaliches expansion and Robinsons Galleria Cebu.
The Residential Division realized revenues stood at P=6.70 billion in 2015 versus P=5.88 billion
last year, an increase of 14.0%.
The Office Buildings Division revenues grew by 47.3% to P=2.42 billion in 2015 from
P=1.65 billion last year. RLC’s newest office building, Tera Tower, as well as Cyberscape
Alpha and Cyberscape Beta contributed to the strong growth of the division being 100%
leased out as of December 31, 2015.
The Hotels Division registered gross revenues of P=1.80 billion for the year, posting a 13.8%
increase compared to last year with contribution from Summit Hotel Magnolia and Go Hotels
Butuan which it opened in 2015.
Real estate cost and expenses went up by 12.1% to P=8.05 billion from P=7.19 billion last year.
The opening of new malls raised the level of depreciation expense of Commercial Centers by

-55-
11.3% while opening of new office buildings increased depreciation expense of the Office
Buildings Division by 14.0%. Furthermore, cinema expense rose by 23.8% due to higher
level of cinema operations which in turn resulted to higher cinema revenues. Hotel expenses
rose by 11.7% due substantially to higher level of cost of food and beverage, salaries and
wages and contracted services among others, which were all due to higher level of
operations brought about by the newly opened Summit Magnolia Hotel and Go Hotels
branches.
Interest income increased to P=40.63 million from P=14.25 million last year due to higher
average balance of cash and cash equivalents during the calendar year 2015.
General and administrative expenses went up by 11.7% due to higher salaries, advertising
and promotions and insurance expense, among others.
Air transportation generated gross revenues of P=56.50 billion for the year ended
December 31, 2015, 8.7% higher than the P=52.0 billion revenues earned last year mainly
attributed to the increase in passenger revenues by 6.2% to P=42.68 billion for the year ended
December 31, 2015 from P=40.19 billion registered in 2014. This increase was primarily due
to the 8.9% growth in passenger volume to 18.4 million from last year’s 16.9 million driven by
the increased number of flights in 2015. Number of flights went up by 7.6% year on year as
CEB added more aircraft to its fleet, particularly, its acquisition of wide-body Airbus A330
aircraft with a configuration of more than 400 all-economy class seats. The number of
aircraft increased from 52 aircraft as of December 31, 2014 to 55 aircraft as of December 31,
2015. The decrease in average fares by 2.5% to P=2,323 in 2015 from P=2,382 in 2014
partially offset the increase in revenues. Cargo revenues grew 10.0% to P=3.46 billion for the
year ended December 31, 2015 from P=3.15 billion in the same period last year following the
increase in the volume of cargo transported in 2015. Ancillary revenues went up by 19.6% to
P=10.36 billion for the year ended December 31, 2015 from P=8.67 billion posted last year
consequent to the 8.9% increase in passenger traffic and 9.8% increase in ancillary revenue
per passenger. Improved online bookings, together with a wider range of ancillary revenue
products and services, also contributed to the increase.
Operating expenses for the year ended December 31, 2015 slightly dropped by 2.2% to
P=46.80 billion from P=47.84 billion last year as a result of substantial reduction in fuel costs
due to the sharp decline in global jet fuel prices. The drop in fuel costs, however, was offset
by the increase in majority of CEB’s operating expenses driven by its expanded long haul
operations, growth in seat capacity from the acquisition of new aircraft and the weakening of
the Philippine peso against the U.S. dollar. Flying operations expenses decreased by 20.0%
to P=20.92 billion for the year ended December 31, 2015 from P=26.15 billion incurred in 2014
primarily attributable to the 23.9% decline in aviation fuel expenses amounting to
P=17.66 billion in 2015 from P=23.21 billion in 2014 consequent to the significant drop in jet fuel
prices, partially offset by the weakening of the Philippine peso against the U.S. dollar.
Aircraft and traffic servicing expenses increased by 21.7% to P=5.85 billion for the year ended
December 31, 2015 from P=4.81 billion registered in 2014 as a result of the overall increase in
the number of flights flown in 2015. Higher expenses were particularly attributable to more
international flights operated for which airport and ground handling charges were generally
higher compared to domestic flights. International flights increased by 6.0% year on year
with the launch of new destinations namely Doha, Qatar and Fukuoka, Japan, introduction of
new routes like Cebu to Taipei and Davao to Singapore and increased frequencies of existing
routes. Depreciation and amortization expenses increased 19.4% to P=5.11 billion for the year
ended December 31, 2015 from P=4.28 billion for the year ended December 31, 2014
consequent to the arrival of four Airbus A320 aircraft during the year. Repairs and

-56-
Maintenance expenses went up by 18.2% to P=5.24 billion for the year ended December 31,
2015 from P=4.43 billion posted last year driven by the overall increase in the number of flights
and the acquisition of four Airbus A320 aircraft and the delivery of one Airbus A330 aircraft in
2015. Aircraft and engine lease expenses went up by 14.9% to P=4.03 billion for the year
ended December 31, 2015 from P=3.50 billion charged in 2014 due to the delivery of one
Airbus A330 aircraft under operating lease in 2015.
CEB recognized higher interest income for the year from P=79.93 million last year to
P=83.01 million this year due to the increase in the balance of cash in bank and short-term
placements year on year and higher interest rates.
CEB incurred a hedging loss of P=2.93 billion for the year ended December 31, 2015, an
increase of 26.7% from hedging loss of P=2.31 billion earned last year as a result of lower
mark-to-market valuation on fuel hedging positions consequent to the material decline in fuel
prices in 2015. Net foreign exchange losses of P=2.21 billion for the year ended December
31, 2015 resulted from the weakening of the Philippine Peso against the U.S. dollar.
Equity in net income of joint venture dropped 63.2% to P=35.42 million for the year ended
December 31, 2015, primarily due to the net loss from current operations incurred by
Philippine Academy for Aviation Training, Inc. (PAAT) and SIA Engineering (Philippines)
Corporation (SIAEP) in 2015.
As a result of the foregoing, net income for the year ended December 31, 2015 increased by
414.0% to P=4.39 billion from P=853.50 million last year.
Petrochemicals (consist of JGSPC and JGSOC) combined gross revenues reached P=26.78 billion in 2015 as compared to last year’s P=3.23 billion as JGSPC resumed its commercial operations after the completion of its polymer plant expansion and rehabilitation projects and the commencement of JGSOC’s commercial operations in November 2014 resulting to increase in polymer volumes sold by JGSPC and increase in volume of exported olefins of JGSOC. Costs and expenses consequently increased from P=4.50 billion in 2014 to P=24.55 billion in 2015. Interest expense also reached P=84.78 million for the year ended December 31, 2015 from last year’s P=23.24 million following the increase in trust receipts and availment of short-term notes payable to fund operating activities during the year for both Petrochem and Olefins. A net foreign exchange loss of P=307.0 million was recorded in 2015 from P=45.84 million last year due to the weakening of Philippine peso against U.S. dollar. All these factors contributed to the net income of P=3.16 billion in 2015 versus the net loss of P=759.45 million in 2014, an improvement of 516.5%.
Banking Services, generated banking revenue of P=2.97 billion in 2015, a 9.3% increase
from last year’s P=2.72 billion. This increase was brought about by higher interest and
commission income for the year, net of lower trading gains in 2015. However, cost and
expenses also increased, higher than the revenue growth as the bank continued its
expansion. All these factors contributed to lower net earnings of P=106.67 million for the year
ended December 31, 2015, a 27.4% decline from last year’s P=146.91 million.
Equity in net earnings of associate companies and joint ventures amounted to
P=7.31 billion for the year ended December 31, 2015, a slight increase from last year’s
P=7.25 billion mainly attributable to the 6.1% increase in equity earnings from Meralco from
P=4.68 billion last year to P=4.96 billion this year, partially offset by the higher losses on equity
investments in CURC and DURBI. Equity income from UIC remained flat at P=2.51 billion.
United Industrial Corporation, Limited recorded a 6.1% growth in its net income from
operations from S$222.79 million in 2014 to S$236.28 million in 2015. The increase in net

-57-
income is mainly due to higher trading property sales with progressive sales recognition on
percentage of completion basis for UIC’s residential projects and increased share of
Singapore Land's net profit partially offset by lower contribution from the Archipelago joint
venture residential project. Since the Group’s policy for the valuation of property, plant and
equipment is the cost basis method, the equity income taken up by the Group represents the
adjusted amounts after reversal of the effect in the income statement of the revaluation of the
said assets.
Other Supplementary Business, Summit Internet Investments recognized net loss of
P=59.14 million in 2015, a significant decrease from last year’s net income of P=1.75 billion
mainly due to P=1.70 billion dividend income received from Jobstreet Malaysia in 2014.
2014 vs. 2013 I. Consolidated Operations JG Summit Holdings Inc.’s posted a consolidated net income from equity holders of the parent of P=18.25 billion for the year ended December 31, 2014, a 75% increase from P=10.43 billion last year. Increase is due mainly to the following: full-year recognition of equity earnings from our investment in Meralco, higher dividends received from our investments in PLDT and Jobstreet Malaysia, lower foreign exchange loss recognized for the year, and sustained income growth from our core subsidiaries. Consolidated EBITDA reached P=49.23 billion, a 38.9% increase compared to last year. Core net income after taxes increased 48.7% from P=13.65 billion in 2013 to P=20.30 billion in 2014.
Consolidated revenues grew 22.9% from P=150.35 billion to P=184.81 billion this year due to the strong performance of all subsidiaries, except for the banking business.
URC’s revenue grew 15.6% from P=83.60 billion in 2013 to P=96.65 billion in 2014 due to the strong performance of the branded consumer foods both domestic and international, which registered an 18.4% growth. The agro-industrial segment recorded a 12.9% increase because of higher sales price of hogs and better prices and higher sales volume of gamefowl feeds.
CEB’s 26.8% increase in gross revenues from P=41.0 billion in 2013 to P=52.0 billion in 2014 is brought about by 17.5% growth in passenger volume and higher cargo and ancillary revenues.
Real estate and hotel revenues posted a 5.4% growth from P=16.54 billion to P=17.43 billion due to higher rental revenues.
JG Petrochem’s revenue significantly increased to P=3.23 billion in December 2014 from P=542.55 million for the same period in 2013 since it has resumed its commercial operations in November 2014. JG Olefins also commenced commercial operations in November 2014.
Revenue from other supplementary businesses recorded 27.0% increase due to higher commission income and outsource revenue for the period.
The banking revenue slightly dropped 1.2% from P=2.75 billion in 2013 to P=2.72 billion this year due to lower trading gain and commission income for the period. Equity in net earnings of associates and joint ventures posted a 217.4% increase from P=2.28 billion in 2013 to P=7.25 billion in 2014 mainly due to full-year recognition of equity earnings from Meralco in 2014. The Company completed the purchase of a 27.1% stake in

-58-
Meralco in December 2013. Dividend income posted a 55.8% growth from P=3.26 billion for the year ended December 31, 2013 to P=5.07 billion in 2014 mainly due to dividend received from PLDT and Jobstreet Malaysia during the period. Consolidated cost of sales and services increased by 16.4% from P=98.83 billion last year to P=115.0 billion, relatively lower than the revenue growth due to: (1) lower input costs of the food business, (2) aviation fuel expenses incurred by our airline business increased only 18.9% despite the higher volume of fuel consumed from increased number of flights and launch of long haul flights due to lower average fuel rate in 2014, (3) a 6.6% drop in the bank’s interest expense due to lower average interest rates. The Group’s operating expenses increased by 23.8% from P=26.12 billion last year to P=32.33 billion this year due to higher selling, general and administrative expenses in the airline and food business units. As a result, Operating Income or EBIT went up 47.5% from P=25.40 billion to P=37.48 billion. The Group’s financing costs and other charges net of interest income, increased by 91.3% to P=4.48 billion from last year’s P=2.34 billion because of increase in debt to partly finance the Group’s capital expenditures and major investments during the year. Market valuation loss recognized from our financial assets and derivative instruments in 2014 amounted to P=3.59 billion, a complete turn-around from a mark-to-market gain last year of P=77.32 million. This is attributable mainly to the fuel hedging loss amounting to P=2.31 billion booked by our airline business and the significant drop in share price of our equity securities. The Group recognized net foreign exchange loss of P=358.83 million from P=3.73 billion reported last year as the Philippine peso slowly recovered during the period.
Other income (expense) - net account, which represents miscellaneous income and
expenses, netted a gain of P=1.22 billion, a 229.9% increase compared to last year’s
P=369.77 million attributable mainly to the gain realized from the sale of our equity interest in
Jobstreet in 2014.
Provision for income tax increased by 46.3% due to recognition of net provision for deferred
taxes of P=800.27 million in 2014 compared to a net benefit from deferred tax amounting to
P=296.18 million in 2013 resulting from the recognition of deferred tax assets on foreign
exchange losses last year.
II. Segment Operations
Foods generated a consolidated sale of goods and services of P=96.65 billion for the year ended December 31, 2014, 15.6% sales growth over last year’s P=83.61 billion. Sale of goods and services performance by business segment follows: (1) URC’s branded consumer foods (BCF) segment, excluding packaging division, increased 18.4%, to P=79.90 billion in 2014 from P=67.51 billion registered in 2013. BCF domestic operations posted a 21.2% increase in net sales from P=44.96 billion in 2013 to P=54.49 billion in 2014. All segments managed to post growth with beverage business driving the Philippine operations led by powdered beverage segments, mainly from coffee and complemented by the RTD. Snack foods business also grew with categories such as snacks, biscuits and chocolates outpacing market growth. BCF international sales increased by 12.7% to P=25.41 billion in 2014 against P=22.55 billion in 2013. In U.S. dollar (US$) term, sales registered an increase of 7.6% from US$531 million in 2013 to US$571 million in 2014. Vietnam and Thailand, our two biggest contributors, accounted for 71.2% of total international sales. Vietnam sales grew despite weak consumer spending, as beverage, biscuits and candies all posted growth. Vietnam was also able to
-59-
defend its market share in RTD tea from new entrants with its own C2 Oolong product offering. Thailand grew its sales despite increases in inflation and political instability. Growth was driven by improving sales of key biscuit and wafer brands due to promotions and sampling activities, including the strategy of launching 2-baht cookies to address budget-constrained consumers. Sale of goods and services in URC’s packaging division slightly went up to P=1.19 billion in 2014 from P=1.07 billion recorded in 2013 due to increase in sales volume and average selling prices. (2) Agro-Industrial segment (AIG) amounted to P=8.41 billion in 2014, an increase from P=7.45 billion recorded in 2013. Farm business grew due to better prices, growing hog carcass segment and increasing sales activities to hotel and restaurant institutions while feed business grew due to better prices and increase in volume supported by strong sales performance of gamefowl feeds. (3) Sale of goods and services in commodity foods segment amounted to P=7.15 billion in 2014, down by 5.7% from P=7.58 billion reported in 2013. Sugar business sales went down by 15.6% due to lower volumes despite increase in prices due to decline in refined sugar production while flour business managed to grow by 3.0% due to higher volumes. URC’s cost of sales consists primarily of raw and packaging materials costs, manufacturing costs and direct labor costs. Cost of sales went up by 11.6%, to P=66.17 billion in 2014 from P=59.26 billion recorded in 2013 due to increase in sales volume. URC’s gross profit for 2014 amounted to P=30.49 billion from P=24.35 billion reported in 2013. URC’s gross profit as a percentage of net sales increased by 240 basis points to 31.5% in 2014 from 29.1% in 2013 due to lower input costs. Selling and distribution costs, and general and administrative expenses rose by 16.8% to P=15.28 billion in 2014 from P=13.09 billion registered in 2013. This increase resulted primarily from the following factors: (a) 13.6% increase in advertising and promotion costs to P=5.67 billion in 2014 from P=4.99 billion in 2013 to support new product launches and expand sales of existing products; (b)17.9% increase in freight and delivery charges to P=4.40 billion in 2014 from P=3.73 billion in 2013 due to increase in trucking and shipping costs associated with increased volume and port congestion issues; and (c) 12.7% increase in compensation and benefits to P=3.01 billion in 2014 from P=2.67 billion in 2013 due to annual salary adjustments and increase in pension expenses. URC reported lower market valuation loss on financial instruments at fair value through profit or loss of P=6 million in 2014 from P=242 million market valuation gain in 2013 due to decline in level of financial assets as a result of disposal of all bond investments and significant portion of equity investments during 2013. URC’s finance revenue consists of interest income from investments in financial instruments, money market placements, savings and dollar deposits and dividend income from investment in equity securities. Finance revenue decreased by 13.6% to P=235 million in 2014 from P=272 million in 2013 due to lower level of money market placements and lower dividend income received. URC’s finance costs consist mainly of interest expense which increased by 106.0%, to P=346 million in 2014 from P=168 million recorded in 2013 due to increase in level of financial debt resulting from availments of long-term debt to finance the acquisition of NZSFHL. Impairment losses increased to P=123 million in 2014 from P=29 million in 2013 due to recognition of higher impairment losses on inventories and receivables. Net foreign exchange loss amounted to P=75 million in 2014 from P=166 million net foreign exchange gain reported in 2013 due to effect of currency translation adjustments on foreign currency-denominated transactions.
-60-
Equity in net loss of joint ventures amounted to P=75 million in 2014 from equity in net income of P=23 million in 2013 due to pre-operating expenses of newly established joint ventures, Calbee-URC Inc. and Danone Universal Robina Beverages, Inc. Gain on sale of investments decreased from gain of P=717 million in 2013 to nil in 2014. Gain on sale in 2013 resulted from the disposal of all bond investments and significant portion of equity investments. Other income (expenses) - net consists of gain (loss) on sale of fixed assets, amortization of bond issue costs, rental income, and miscellaneous income and expenses. Other expenses - net decreased from P=36 million in 2013 to P=72 million in 2014 mainly due to losses incurred from weather disturbances last year. URC recognized provision for income tax of P=2.69 billion in 2014, a 54.5% increase from P=1.74 billion in 2013 due to higher taxable income, recognition of deferred tax liability on increase in market value of hogs and reversal of deferred tax asset on realized foreign exchange loss. URC’s core earnings before tax (operating profit after equity earnings, net finance costs and other expenses - net) for 2014 amounted to P=14.94 billion, an increase of 23.8% from P=12.08 billion recorded for 2013. Net income attributable to equity holders of the parent increased by 12.4% to P=11.95 billion in 2014 from P=10.63 billion in 2013 due to higher operating income, net of lower market valuation gain from financial assets at FVPL and gain on sale of investments, and higher net finance cost and net foreign exchange loss. URC reported an EBITDA (operating income plus depreciation and amortization) of P=19.12 billion for 2014, 29.1% higher than P=14.96 billion posted in 2013. Real estate and hotels generated total gross revenues of P=17.43 billion for calendar year 2014, an increase of 5.3% from P=16.55 billion total gross revenues for calendar year 2012. EBIT (Operating income) grew 2.7% to P=6.38 billion while EBITDA (Operating income plus depreciation) posted a 5.9% growth to P=9.24 billion. Net income stood at P=4.78 billion, up by 2.8% compared to last year.
The Commercial Centers Division accounted for P=8.35 billion of the real estate revenues for
the year versus P=7.57 billion last year or a 10.3% increase. The newly opened malls namely,
Robinsons Santiago, Robinsons Roxas, Robinsons Antipolo and Robinsons Las Pinas
contributed to the increase in revenues. In addition, Robinsons Magnolia, Robinsons
Palawan and Robinsons Iloilo contributed to the growth while most provincial malls also
posted decent growth in rental revenues.
The Residential Division realized revenues stood at P=5.88 billion for the year versus
P=6.04 billion last year.
The Office Buildings Division revenues grew by 14.6% to P=1.65 billion from P=1.44 billion over
the same period last year. This increase in lease income was due to new office buildings
Cyberscape Alpha and Cyberscape Beta.
The Hotels Division, a major contributor of RLC’s recurring revenues, registered gross
revenues of P=1.58 billion, as against last year’s P=1.50 billion. The 5.3% increase in hotel
revenues was principally due to its newest Go Hotel branches in Iloilo, Ortigas Center,
Butuan City and newest Summit Hotel Magnolia.
-61-
Real estate cost and expenses went up by 3.8% to P=7.19 billion from P=6.92 billion last year.
The opening of new malls raised the level of depreciation expense of Commercial Centers by
14.2% while opening of new buildings increased depreciation expense of the Office Buildings
Division by 22.8%. Furthermore, cinema expenses rose by 24% due to higher level of
cinema operations which in turn resulted to higher cinema revenues. Hotel expenses rose by
3.0% due substantially to higher level of cost of food and beverage, salaries and wages and
contracted services among others, which were all due to higher level of operations brought
about by the newly opened Go Hotels branches and Summit Magnolia Hotel.
Interest income decreased to P=14.3 million from P=61.9 million last year due to lower average
balance of cash and cash equivalents during the calendar year 2014.
General and administrative expenses went up by 19.2% due to higher salaries, advertising
and promotions and insurance expense, among others.
Air transportation generated gross revenues of P=52.0 billion for the year ended
December 31, 2014, 26.8% higher than the P=41.0 billion revenues earned last year mainly
attributed to the increase in passenger revenues by 26.9% to P=40.19 billion for the year
ended December 31, 2014 from P=31.66 billion registered in 2013. This increase is primarily
due to the 17.5% growth in passenger volume to 16.9 million from 14.4 million driven by the
increased number of flights in 2014. Number of flights went up by 6.9% as CEB adds more
aircraft to its fleet, particularly, its acquisition of wide-body Airbus A330 aircraft with a
configuration of more than 400 all-economy class seats. The number of aircraft increased
from 48 aircraft as of December 31, 2013 to 52 aircraft as of December 31, 2014, which
includes 3 brand new Airbus A330 aircraft delivered this year. Increase in average fares by
8.0% to P=2,382 in 2014 from P=2,206 in 2013 also contributed to the improvement of
revenues. Cargo revenues grew 20.6% to P=3.15 billion for the year ended December 31,
2014 from P=2.61 billion for the year ended December 31, 2013 following the increase in the
volume of cargo transported in 2014. Ancillary revenues went up by 28.7% to P=8.67 billion
for the year ended December 31, 2014 from P=6.73 billion posted last year consequent to the
17.5% increase in passenger traffic and 9.5% increase in ancillary revenue per passenger.
CEB began unbundling ancillary products and services in 2011 and significant improvements
in ancillary revenues were noted since then. Improved online bookings, together with a wider
range of ancillary revenue product and services, also contributed to the increase.
Operating expenses for the year ended December 31, 2014 grew 23.9% to P=47.84 billion
from P=38.60 billion last year as a result of its expanded long haul operations and overall
growth in seat capacity from the acquisition of new aircraft. Flying operations expenses
moved up by 20.4% to P=26.15 billion for the year ended December 31, 2014 from
P=21.72 billion charged in 2013. Aviation fuel expenses grew by 18.9% to P=23.21 billion from
P=19.52 billion for the year ended December 31, 2013 consequent to the higher volume of fuel
consumed as a result of the increased number of flights year on year and increased block
hours from the launch of long haul flights to Dubai in October 2013, to Kuwait and Sydney in
September 2014 and to Riyadh and Dammam in October 2014. The weakening of the
Philippine peso against the U.S. dollar also contributed to the increase. Rise in aviation fuel
expenses, however, was partially offset by the reduction in aviation fuel prices as referenced
by the decrease in the average published fuel MOPS price of U.S. $112.48 per barrel in the
twelve months ended December 31, 2014 from U.S. $122.97 average per barrel in the same
period last year. Aircraft and traffic servicing expenses increased by 33.6% to P=4.81 billion for
the year ended December 31, 2014 from P=3.60 billion registered in 2013 as a result of the
overall increase in the number of flights flown in 2014. Higher expenses were particularly
attributable to more international flights operated for which airport and ground handling

-62-
charges were generally higher compared to domestic flights. International flights increased
by 7.6% year on year which is partly attributable to the expansion of long haul operations to
Kuwait, Sydney, Riyadh and Dammam in 2014 as well as new short haul flights to Tokyo
(Narita) and Nagoya which commenced on March 2014. Depreciation and amortization
expenses increased 23.7% to P=4.28 billion for the year ended December 31, 2014 from
P=3.46 billion for the year ended December 31, 2013. Depreciation and amortization expenses
increased consequent to the arrival of five Airbus A320 aircraft during the year. Repairs and
Maintenance expenses went up by P=606.46 million or 15.9% to P=4.43 billion for the year
ended December 31, 2014 from P=3.83 billion posted last year. Increase was driven by the
overall increase in the number of flights coupled with the weakening of the Philippine peso
against the U.S. dollar and the acquisition of five Airbus A320 aircraft and the delivery of the
three Airbus A330 aircraft in 2014. Aircraft and engine lease expenses went up by 50.9% to
P=3.50 billion for the year ended December 31, 2014 from P=2.32 billion charged in 2013 due
to the delivery of three Airbus A330 aircraft under operating lease in 2014.
CEB recognized lower interest income for the period from P=219.62 million last year to
P=79.93 million this year due to the decrease in the balance of cash in bank and short-term
placements year on year and lower interest rates.
CEB incurred a hedging loss of P=2.31 billion for the year ended December 31, 2014
compared to a hedging gain of P=290.33 million earned in the same period last year mainly
due to losses on fuel hedging positions consequent to the decrease in fuel prices in 2014
partially offset by foreign exchange hedging gains. Net foreign exchange losses of
P=127.47 million for the year ended December 31, 2014 resulted from the weakening of the
Philippine Peso against the U.S. dollar.
Equity in net income of joint venture dropped 19.3% to P=96.33 million for the year ended
December 31, 2014, primarily due to the net loss from current operations incurred by SIA
Engineering (Philippines) Corporation (SIAEP) in 2014. As a result of the foregoing, net
income for the year ended December 31, 2014 increased by 66.7% to P=853.50 million from
P=511.95 million last year.
Petrochemicals gross revenues reached P=3.23 billion in 2014, this already includes revenues from the Olefins operations, compared to last year’s P=542.55 million as commercial operations resumed after completing its plant expansion and rehabilitation in March 2014. JGSOC started commercial operations in November 2014. Costs and expenses consequently increased from P=1.44 billion in 2013 to P=4.50 billion in 2014. Interest expense also grew 161.4% to P=23.24 million in 2014 from P=8.89 million in 2013 due to higher level of trust receipts for both Petrochem and Olefins. A net foreign exchange loss of P=45.84 million was recorded in calendar 2014 from a net foreign exchange gain P=106.30 million for the same period last year. All these factors contributed to a higher net loss in calendar year 2014 from P=622.63 million last year to P=759.45 million this year.
Banking Services, generated net earnings of P=146.91 million for the year ended
December 31, 2014, a 67.5% decline from last year’s net income of P=452.34 million mainly
due to decrease in banking revenues. Revenues dropped 1.2% from P=2.75 billion last year
to P=2.72 billion this year due to lower trading gain and commission income. Interest expenses
decreased as well to P=515.36 million from P=558.11 million due to lower interest rates for the
period.
Equity in net earnings of associate companies and joint ventures amounted to
P=7.25 billion for the year ended December 31, 2014, a significant increase from last year’s

-63-
P=2.28 billion. The increase is mainly due to take up of equity earnings from Meralco, net of
depreciation and amortization related to PPA valuation, amounting to P=4.68 billion in 2014.
Equity income from UIC increased 45.4% from P=1.72 billion last year to P=2.50 billion in 2014.
United Industrial Corporation, Limited recorded a 33.3% growth in its net income from
operations S$167.18 million in 2013 to S$222.79 million in 2014. The increase in net income
is mainly due to higher revenues from the hotel operations, higher contribution from the
Archipelago and Thompson Three joint venture residential projects with progressive
recognition of development profits on percentage of completion basis and increased share of
Singapore Land's operating profit as a result of UIC's increased interest in Singapore Land to
99.6% during the period. Since the Group’s policy for the valuation of property, plant and
equipment is the cost basis method, the equity income taken up by the Group represents the
adjusted amounts after reversal of the effect in the income statement of the revaluation of the
said assets.
Other Supplementary Business, Summit Internet recognized net income of P=1.75 billion in
2014 a significant increase from last year’s P=71.80 million mainly from dividend income
received from Jobstreet Malaysia amounting to P=1.70 billion.
FINANCIAL RESOURCES AND LIQUIDITY
2016 vs 2015
Cash and cash equivalents slightly decreased to P=43.41 billion as of December 31, 2016,
from P=45.27 billion as of December 31, 2015. Cash provided by operating activities
amounted to P=54.07 billion. As of December 31, 2016, net cash used in investing activities
amounted to P=67.86 billion mainly for the Group’s capital expenditure program and
acquisition of investment in Global Business Power Corporation. The Group’s net cash
provided by financing activities amounted to P=11.93 billion mainly due to additional short-term
loans availed by JG Parent and URC, net of various settlements made on the Group’s long-
term loans during the year. Our financial assets, including those held at fair value through
profit and loss (excluding derivative assets), available for sale investments and held to
maturity amounted to P=56.85 billion, a 12.1% decrease from P=64.67 billion as of December
31, 2015 due to lower market valuation during the year.
Derivative assets, including noncurrent portion decreased from P=617.93 million as of
December 31, 2015 to P=505.76 million as of December 31, 2016 due to the foreign currency
forwards of the food business which was settled in April 2016, net of CEB’s market valuation
gain on its fuel derivative contracts.
Receivables, including noncurrent portion increased by 30.7% from P=53.36 billion as of
December 31, 2015 to P=69.72 billion as of December 31, 2016 mainly due to the significant
increase in finance receivables of the banking business.
Inventories increased 6.6% from P=46.65 billion as of December 31, 2015 to P=49.70 billion as
of December 31, 2016 due to higher level of raw materials, spare parts and finished goods of
the food business.
Investment in associates and joint ventures increased 11.5% from P=114.78 billion as of
December 31, 2015 to P=127.95 billion as of December 31, 2016 mainly due to acquisition of
30% stake in Global Business Power Corporation in June 2016.

-64-
Investment properties increased 12.1% from P=67.26 billion as of December 31, 2015 to
P=75.42 billion as of December 31, 2016 due to land acquisitions and ongoing constructions of
the real estate business.
Property, plant and equipment increased 9.9% from P=159.84 billion to P=175.66 billion due to
the several plant expansion projects and business acquisitions of our branded consumer
foods and acquisition of three Airbus A320 aircraft, two ATR 72-600 aircraft and one A330
aircraft by our airline business, net of four Airbus A319 aircraft sold during the period.
Biological assets, including noncurrent portion, decreased 11.2% due to decline in headcount
and market prices of hogs.
Goodwill significantly increased to P=32.02 billion as of December 31, 2016 from P=15.52 billion
as of December 31, 2015 resulting from the URC acquisition of Consolidated Snacks Pty Ltd
(CSPL) (which owns the brand ‘Snack Brands Australia’) in September 2016.
Intangible assets increased by 56.8% to P=14.16 billion as of December 31, 2016 from
P=9.03 billion as of December 31, 2015 mainly due to additional trademark recognized from
the acquisition of Snack Brands Australia by URC.
Other noncurrent assets went up by 24.6% from P=5.23 billion as of December 31, 2015 to
P=6.52 billion as of December 31, 2016 due to increase in bills payments received by the
banking business and advances to suppliers and contractors for mall and office buildings
constructions.
Consolidated total assets reached P=666.31 billion as of end of December 2016.
Accounts payable and accrued expenses increased by 33.9% from P=71.94 billion as of
December 31, 2015 to P=96.30 billion as of December 31, 2016 due to higher level of deposit
liabilities of our banking business and trade payables of our food and real estate business
units.
Short term debt increased 77.4% to P=61.88 billion as of December 31, 2016 from
P=34.88 billion as of December 31, 2015 due to additional short term loans availed by JG
Parent, RLC and an offshore subsidiary.
Derivative liabilities, including noncurrent portion, decreased from P=2.44 billion in 2015 to
P=5.95 million due to improved mark-to-market valuation of CEB’s fuel derivative contracts
resulting to a net derivative asset position as of December 31, 2016.
Income tax payable decreased 28.8% mainly due to lower level of tax payable of the food
and real estate business units.
Other current liabilities increased 13.1% to P=12.90 billion as of December 31, 2016 mainly
due to higher unearned transportation revenue on sale of passenger travel services by the
airline business.
Long-term debt, including current portion, declined 4.4% from P=166.48 billion as of December
31, 2015 to P=159.19 billion as of December 31, 2016 due to settlement of a total of
P=12.40 billion and US$250 million term loans of the JG Parent and an offshore subsidiary,
respectively, offset by the additional term loans availed by URC, CEB and RLC in 2016.

-65-
Deferred tax liabilities amounted to P=7.05 billion as of December 31, 2016, a 37.6% increase
from P=5.13 billion as of December 31, 2015 mainly due to higher deferred tax liability
recognized by the food business.
Other noncurrent liabilities increased 5.5% to P=13.21 billion as of December 31, 2016 from
P=12.52 billion as of December 31, 2015 primarily due to provision for asset retirement
obligation of the airline business.
Stockholders’ equity, excluding minority interest, stood at P=239.52 billion as of December 31, 2016 from P=223.39 billion last year.
Book value per share amounted to P=33.43 as of December 31, 2016 from P=31.18 as of
December 31, 2015.
2015 vs 2014
Cash and cash equivalents increased to P=45.27 billion as of December 31, 2015, from
P=37.47 billion as of December 31, 2014. Cash provided by operating activities amounted to
P=34.23 billion. As of December 31, 2015, net cash used in investing activities amounted to
P=33.33 billion mainly for the Group’s capital expenditure program. The Group’s cash
provided by financing activities amounted to P=6.90 billion particularly from the P=12 billion
bond issuance of RLC during the year and the P=8.74 billion proceeds from the issuance of
new shares of the Parent Company offset by the net settlement of the Group’s short term
loans and prepayment of P=5.60 billion term loan of the Parent Company. Financial assets at
fair value through profit or loss (excluding derivative assets) amounted to P=14.29 billion as of
December 31, 2015.
Receivables, including noncurrent portion increased by 21.9% from P=43.77 billion as of December 31, 2014 to P=53.63 billion as of December 31, 2015 due to significant increase in finance receivables of the banking business. Higher level of installment contracts receivables of the real estate business and trade receivables of the food and petrochemicals businesses, consequent to the commencement of JGSOC’s full operations in 2015, also contributed to the growth.
Inventories increased by 16.2% from P=40.13 billion as of December 31, 2014 to
P=46.65 billion as of December 31, 2015 mainly due to the land rights acquired by the real
estate business in Chengdu, China.
Available-for-sale investments, including noncurrent portion, dropped by 23.24% from
P=62.05 billion as of December 31, 2014 to P=47.63 billion as of December 31, 2015 due to the
significant drop in the market price of PLDT shares from P=2,906 per share in 2014 to
P=2,060 per share in 2015
Derivative assets, including noncurrent portion increased 229.7% from P=154.61 million as of
December 31, 2014 to P=617.93 million as of December 31, 2015 due to P=578.14 million
market valuation gain recognized from the foreign currency forwards of our food business,
offset by the P=88.8 million market valuation loss on interest rate swap transaction of an
offshore company.
Held-to-maturity investments increased by 55.5% from P=1.77 billion as of December 31, 2014
to P=2.75 billion as of December 31, 2015 due to additional investments made by the banking
business during the year.

-66-
Investment properties increased 18.0% from P=56.98 billion as of December 31, 2014 to
P=67.26 billion as of December 31, 2015 due to acquisition of several land properties by the
real estate business both for residential and commercial development. The completion of
construction of Cyberscape Alpha, Cyberscape Beta, Tera Tower, Go Hotel Ortigas, Go Hotel
Butuan, Summit Hotel Magnolia and ongoing constructions at Bonifacio Summit Center and
Go Hotel Davao also contributed to the increase. Aside from these, there are ongoing
constructions for the following malls: Robinsons Tagum, Cavite and Iloilo.
Property, plant and equipment increased 8.4% from P=147.49 billion to P=159.84 billion mainly
due to acquisition of four Airbus A320 aircraft by our airline business and the completion of
construction of the naphtha cracking facility and petrochemical’s plant rehabilitation.
Biological assets, including noncurrent portion, decreased 9.0% due to decline in headcount
and volume, net of increase in market value of hogs.
Other noncurrent assets increased 48.9% from P=3.51 billion as of December 31, 2014 to
P=5.23 billion as of December 31, 2015 mainly due to recognition of deferred tax assets during
the year by the airline, petrochemicals and food businesses.
Consolidated total assets reached P=596.33 billion as of end of December 2015.
Accounts payable and accrued expenses increased by 6.7% from P=67.40 billion as of
December 31, 2014 to P=71.94 billion as of December 31, 2015 mainly due to the recognition
by the real estate business of P=3.30 billion unpaid portion of the land use rights acquired in
2015.
Short term debt dropped 21.2% to P=34.88 billion as of December 31, 2015 from
P=44.29 billion as of December 31, 2014 mainly due to settlement of Parent Company’s short
term loans and a portion of Petrochemical’s trust receipts, net of the additional loans availed
by the real estate and petrochemicals businesses during the year.
Derivative liabilities, including noncurrent portion, totaling P=2.44 billion is mainly from fuel
hedging of the airline business. Increase of 7.6% from last year’s P=2.27 billion is mainly due
to settlement of certain fuel derivative contracts with counterparties, net of market valuation
loss recognized in 2015.
Income tax payable increased 81.9% due to higher level of tax payable of the food and real
estate businesses.
Other current liabilities increased 19.1% to P=11.41 billion as of December 31, 2015 mainly
due to higher level of deposits from leases of newly opened malls and higher deposits from
real estate buyers. Higher unearned transportation revenue of the airline business also
contributed to the increase.
Long-term debt, including current portion, increased 5.7% from P=157.55 billion as of
December 31, 2014 to P=166.48 billion as of December 31, 2015 due to bond issuance of
RLC during the period, partially offset by prepayment of P=5.60 billion term loan of the Parent
Company.
Other noncurrent liabilities increased 36.4% to P=12.52 billion as of December 31, 2015 due to
higher level of deposit liabilities by the banking business.

-67-
Stockholders’ equity, excluding minority interest, stood at P=223.39 billion as of December 31,
2015 from P=207.62 billion last year.
2014 vs 2013
Cash and cash equivalents decreased to P=37.47 billion as of December 31, 2014 from
P=38.63 billion as of December 31, 2013. Cash provided by operating activities amounted to
P=13.65 billion. As of December 31, 2014, net cash used in investing activities amounted to
P=70.27 billion mainly related to the acquisition of NZSFHL, the holding company of Griffin’s
Food Limited and capital expenditure program amounting to P=37.98 billion. The Group’s
cash from financing activities amounted to P=55.46 billion particularly from the
P=30.00 billion bond issuance of the Parent Company, URC’s loan availment of P=25.46 billion
to finance their acquisition of NZSFHL and availment of trust receipts of Petrochem and
Olefins for their operations, which commenced in latter part of 2014. Our financial assets,
including those held at fair value through profit and loss and available for sale investments
amounted to P=64.54 billion because of acquisitions during the period offset by lower market
valuation during the year.
Derivative assets, including noncurrent portion decreased 54.3% from P=338.31 million to
P=154.61 million due to market valuation loss recognized from interest rate swap transaction
of an offshore company. Aside from this, last year’s balance include a derivative asset from
fuel hedging of our airline business.
Receivables, including noncurrent portion increased 23.6% from P=35.40 billion as of December 31, 2013 to P=43.77 billion in 2014 due to higher level of trade receivables including that of Olefins, which started commercial operations in the last quarter of 2014. Installment contracts receivable of the real estate business and finance receivables of the bank also increased.
Inventories rose 63.7% from P=24.52 billion as of December 31, 2013 to P=40.13 billion as of
December 31, 2014 mainly due to higher level of raw materials, finished goods and work in
process from the foods, petrochemical and olefins businesses in 2014. In addition to this,
higher subdivision land and condominium and residential units for sale of real estate business
also contributed to the increase.
Other current assets increased 63.1% to P=12.30 billion in December 31, 2014 from
P=7.54 billion in 2013 due to reclassification of input tax of Olefins from noncurrent to current
during the year since it started commercial operations.
Investment properties rose 6.6% from P=53.45 billion as of December 31, 2013 to
P=56.98 billion as of December 31, 2014 due to acquisition of several land properties both for
residential and commercial development. The completion of construction of Robinsons
Santiago, Robinsons Roxas, Robinsons Antipolo and Robinsons Las Pinas during the
calendar year and ongoing mall constructions at Robinsons Maxilom contributed to the
increase.
Property, plant and equipment increased 20.6% from P=122.28 billion to P=147.49 billion due to
the several plant expansion projects of our branded consumer foods, completion of
construction of the naphtha cracking facility and petrochemical’s plant rehabilitation and
acquisition of five Airbus A320 aircraft.

-68-
Biological assets, including noncurrent portion, grew 15.9% due to increase in population and
market value of hogs.
Goodwill significantly increased to P=15.52 billion as of December 31, 2014 from only
P=1.04 billion in 2013 mainly from the acquisition of NZSFHL (holding company of Griffin's
Food Ltd) and Tiger Airways during the period.
Intangible assets increased from P=1.35 billion as of December 31, 2013 to P=9.06 billion as of
December 31, 2014 due to trademarks and product formulation recognized by URC from its
acquisition of NZSFHL.
Other noncurrent assets decreased 49.5% from P=6.96 billion in 2013 to P=3.51 billion in 2014
due to reclassification of input tax from JG Olefins naphtha cracker plant to current portion as
it started commercial operations during the year.
Consolidated total assets reached P=559.30 billion as of end of December 2014.
Accounts payable and accrued expenses decreased from P=91.48 billion as of December 31,
2013 to P=67.40 billion as of December 31, 2014 mainly from settlement of payable to San
Miguel related to purchase of Meralco shares.
Short term debt grew 25.5% to P=44.29 billion as of December 31, 2014 from P=35.29 billion in
2013 due to availment of RLC of short term loans and higher level of trust receipts of
petrochemical and olefins businesses.
Derivative liabilities, including noncurrent portion, totaling P=2.27 billion is mainly from fuel
hedging of our airline business.
Income tax payable increased 21.7% due to higher level of tax payable of the food business.
Other current liabilities increased 23.3% from P=7.77 billion in 2013 to P=9.58 billion this year
due to higher unearned revenue of our airline business brought about by the increase in the
sale of passenger travel services.
Long-term debt, including current portion, increased 76.5% from P=89.28 billion as of
December 31, 2013 to P=157.55 billion as of December 31, 2014 due to issuance of Parent
Company of P=30B retail bond and availment of P=9B term loan. There’s also availment of NZ
loans by URC to finance the acquisition of NZSFHL.
Deferred tax liabilities rose to P=5.12 billion as of December 31, 2014 from P=1.72 billion in
2013 due to the recognition of deferred tax liability of NZSFHL plus deferred tax related to the
fair valuation of acquired assets from the purchase of Tiger Airways. Other noncurrent liabilities decreased 11.1% to P=9.18 billion as of December 31, 2014 mainly due to payments made for aircraft restorations during the year applied against asset retirement obligation (ARO) of the airline segment. Lower level of pension liability also contributed to the decrease. Stockholders’ equity, excluding minority interest, stood at P=207.62 billion as of December 31, 2014 from P=186.18 billion last year.

-69-
KEY FINANCIAL INDICATORS
The Company sets certain performance measures to gauge its operating performance
periodically and to assess its overall state of corporate health. Listed below are the major
performance measures, which the Company has identified as reliable performance indicators.
Analyses are employed by comparisons and measurements on a consolidated basis based
on the financial data as of and for the year ended December 31, 2016, 2015 and 2014.
Key Financial Indicators 2016 2015 2014
Revenues P=240.50 Billion P=229.27 Billion P=184.81 Billion
EBIT P=52.27 Billion P=49.35 Billion P=37.48 Billion
EBITDA P=69.27 Billion P=63.79 Billion P=49.23 Billion
Core net income after taxes P=29.97 Billion P=28.05 Billion P=20.30 Billion
Net income attributable to equity
holders of the Parent Company P=10.92 Billion P=22.61 Billion P=18.25 Billion
Liquidity Ratio:
Current ratio 1.01 1.11 1.10
Solvency ratios:
Gearing ratio 0.71 0.71 0.78
Net debt to equity ratio 0.55 0.52 0.59
Asset-to-equity ratio 2.13 2.08 2.14
Interest rate coverage ratio 9.28 9.27 8.45
Profitability ratio:
Operating margin 0.22 0.22 0.20
Book value per share P=33.43 P=31.18 P=29.58
The manner in which the Company calculates the above key performance indicators is as
follows:
Key Financial Indicators
Revenues = Total of sales and services, income from banking
business, dividend income and equity in net earnings
EBIT = Operating income
EBITDA = Operating income add back depreciation and amortization
expense
Core net income after
taxes
= Net income attributable to equity holders of Parent
Company as adjusted for the net effect of gains/losses on
foreign exchange, market valuations and other
nonrecurring items.
Current ratio = Total current assets over current liabilities
Gearing ratio = Total Financial Debt over Total Equity
Net debt to equity ratio = Total Financial Debt less Cash including Financial Assets
at FVPL and AFS investments (excluding RBC Cash,
Financial assets at FVPL and AFS investments) over Total
Equity
Asset-to-equity ratio = Total Assets over Total Equity
Interest rate coverage ratio = EBITDA over Interest Expense
Operating Margin = Operating Income over Revenue
Book value per share = Stockholders’ Equity (Equity attributable to parent
excluding preferred capital stock) over outstanding
number of common shares

-70-
Current assets amounted to P=182.11 billion while current liabilities reached P=180.91 billion,
for a current ratio of 1.01:1. Total financial debt amounted to P=221.07 billion in 2016, higher
than last year’s P=201.37 billion. The Company’s indebtedness remains manageable with a
gearing ratio of 0.71:1, well within the financial covenant of 2.0:1. Net debt stood at
P=173.53 billion, bringing our net debt to equity ratio to 0.55:1.
The Company, in the normal course of business, makes various commitments and has certain
contingent liabilities that are not reflected in the accompanying consolidated financial
statements. The commitments and contingent liabilities include various guarantees,
commitments to extend credit, standby letters of credit for the purchase of equipment, tax
assessments and bank guarantees through its subsidiary bank. The Company does not
anticipate any material losses as a result of these transactions.
DISCLOSURE OF EFFECTS OF PESO DEPRECIATION AND OTHER CURRENT EVENTS
Refer to Management Discussion and Analysis on pages 44-68 of this report and Note 4 to
the Consolidated Financial Statements.
Item 7. Financial Statements
The Consolidated Financial Statements and schedules listed in the accompanying Index to
Consolidated Financial Statements and Supplementary Schedules (page 84) are filed as part
of this report.
Item 8. Information on Independent Accountant and other Related Matters
A. External Audit Fees and Services
Audit and Audit - Related Fees
The following table sets out the aggregate fees billed to the Company for each of the last
three (3) years for professional services rendered by SyCip Gorres Velayo & Co.,
2016 2015 2014
Audit and Audit-Related Fees
Fees for services that are
normally provided by the
external auditor in connection
with statutory and regulatory
filings or engagements
P=3,528,793
P=2,716,318
P=2,915,215
Professional Fees for due
diligence review for bond
offering None None None
Tax Fees None None None
All Other Fees None None None
Total P=3,528,793 P=2,716,318 P=2,915,215
No other service was provided by external auditors to the Company for the calendar years
2016, 2015 and 2014.

-71-
The audit committee’s approval policies and procedures for the services rendered by
the external auditors
The Corporate Governance Manual of the Company provides that the audit committee shall,
among others:
1. Evaluate all significant issues reported by the external auditors relating to the
adequacy, efficiency and effectiveness of policies, controls, processes and activities
of the Company.
2. Ensure that other non-audit work provided by the external auditors is not in conflict
with their functions as external auditors.
3. Ensure the compliance of the Company with acceptable auditing and accounting
standards and regulations.
B. Changes in and Disagreements With Accountants on Accounting and Financial
Disclosure
NONE.
PART III - CONTROL AND COMPENSATION INFORMATION
Item 9. Directors and Executive Officers of the Registrant
DIRECTORS AND EXECUTIVE OFFICERS OF THE REGISTRANT
The names and ages of the directors, members of the advisory board and executive officers
of the Company are as follows:
1. DIRECTORS
Name Age Position Citizenship
John L. Gokongwei, Jr. 90 Director, Chairman Emeritus Filipino
James L. Go 77 Director, Chairman and Chief
Executive Officer
Filipino
Lance Y. Gokongwei 50 Director, President and Chief
Operating Officer
Filipino
Lily G. Ngochua 85 Director Filipino
Patrick Henry C. Go 46 Director Filipino
Johnson Robert G. Go, Jr. 51 Director Filipino
Robina Y. Gokongwei-Pe 55 Director Filipino
Ricardo J. Romulo 83 Director Filipino
Cornelio T. Peralta 83 Director (Independent) Filipino
Jose T. Pardo 77 Director (Independent) Filipino
Renato T. De Guzman 66 Director (Independent) Filipino

-72-
2. MEMBERS OF ADVISORY BOARD
Name Age Position Citizenship
Washington Z. SyCip 95 Member of Advisory Board Filipino
Aloysius B. Colayco 66 Member of Advisory Board Filipino
Jimmy T. Tang 81 Member of Advisory Board Filipino
3. EXECUTIVE OFFICERS
Name Age Position Citizenship
Constante T. Santos 68 Senior Vice President Filipino
Bach Johann M. Sebastian 55 Senior Vice President Filipino
Nicasio L. Lim 60 Senior Vice President Filipino
Renato N. Salud 53 Senior Vice President Filipino
Maria Celia H. Fernandez-
Estavillo
45 Senior Vice President and
General Counsel
Filipino
Aldrich T. Javellana 43 Vice President and Treasurer Filipino
Michele F. Abellanosa 46 Vice President Filipino
Rosalinda F. Rivera 46 Corporate Secretary Filipino
Chona R. Ferrer 59 Deputy Treasurer Filipino
Arlene S. Denzon 49 Compliance Officer Filipino
All of the above directors, members of the advisory board and officers have served their
respective offices since June 9, 2016, except for Atty. Maria Celia H. Fernandez- Estavillo
who was appointed on February 15, 2017 as Senior Vice President and General Counsel
effective March 1, 2017.
Messrs. Cornelio T. Peralta, Jose T. Pardo and Renato T. De Guzman are the “Independent
Directors” of the Company as defined under SRC Rule 38.1.
The directors of the Company are elected at the annual stockholders’ meeting to hold office
until the next succeeding annual meeting and until their respective successors have been
elected and qualified.
Officers and members of the advisory board are appointed or elected annually by the Board
of Directors. Appointed or elected officers and advisory board members are to hold office until
a successor shall have been elected, appointed or shall have qualified.
A brief description of the directors, advisory board members and executive officers’ business
experience and other directorships held in other reporting companies are provided as follows:
Directors
1. John L. Gokongwei, Jr., 90, is the founder and Chairman Emeritus of JG Summit
Holdings, Inc. (JGSHI). He is a member of the Board of Directors of JGSHI and certain
of its subsidiaries. He also continues to be a member of the Executive Committee of
JGSHI and is Chairman Emeritus of certain of its subsidiaries. He is currently the
Chairman of the Gokongwei Brothers Foundation, Inc., Deputy Chairman and Director of
United Industrial Corporation Limited and a director of Cebu Air, Inc., Robinsons Retail
Holdings, Inc. and Oriental Petroleum and Minerals Corporation. He was elected a
director of Manila Electric Company on March 31, 2014. He is also a non-executive
director of A. Soriano Corporation. Mr. Gokongwei received a Masters degree in

-73-
Business Administration from the De La Salle University and attended the Advanced
Management Program at Harvard Business School.
2. James L. Go, 77, is the Chairman and Chief Executive Officer of JGSHI and Oriental
Petroleum and Minerals Corporation. He is the Chairman of Universal Robina
Corporation, Robinsons Land Corporation, JG Summit Petrochemical Corporation and
JG Summit Olefins Corporation. He is the Vice Chairman of Robinsons Retail Holdings,
Inc. and a director of Cebu Air, Inc., Marina Center Holdings, Private Limited, United
Industrial Corporation Limited, and Hotel Marina City Private Limited. He is also the
President and Trustee of the Gokongwei Brothers Foundation, Inc. He has been a
director of the Philippine Long Distance Telephone Company (PLDT) since November 3,
2011. He is a member of the Technology Strategy Committee and Advisor of the Audit
Committee of the Board of Directors of PLDT. He was elected a director of Manila
Electric Company on December 16, 2013. Mr. Go received his Bachelor of Science
Degree and Master of Science Degree in Chemical Engineering from Massachusetts
Institute of Technology, USA. 3. Lance Y. Gokongwei, 50, is the President and Chief Operating Officer of JGSHI. He is
the Chairman and Chief Executive Officer of Robinsons Retail Holdings, Inc. He is also the President and Chief Executive Officer of Universal Robina Corporation, and Cebu Air, Inc. He is the Vice Chairman and Chief Executive Officer of Robinsons Land Corporation. He is the Chief Executive Officer of JG Summit Petrochemical Corporation and JG Summit Olefins Corporation. He is the Chairman of Robinsons Bank Corporation, a director of Oriental Petroleum and Minerals Corporation and United Industrial Corporation Limited. He is a director and Vice Chairman of Manila Electric Company. He is a trustee and secretary of the Gokongwei Brothers Foundation, Inc. He received a Bachelor of Science degree in Finance and a Bachelor of Science degree in Applied Science from the University of Pennsylvania.
4. Lily G. Ngochua, 85, has been a director of JGSHI since its formation in 1990. She is responsible for overseeing the Company’s hotel and agro-industrial business in Cebu. She also supervises the purchasing and treasury departments of the URC Biscuit and Noodle Plants in Cebu and handles the treasury functions of the retail and mall business in Cebu. She received a Bachelor of Arts degree from Maryknoll College in Quezon City in 1957.
5. Johnson Robert G. Go, Jr., 51, has been a director of JGSHI since August 18, 2005. He
is currently a director of Universal Robina Corporation, Robinsons Land Corporation, and Robinsons Bank Corporation. He is also a trustee of the Gokongwei Brothers Foundation, Inc. He received a Bachelor of Arts degree in Interdisciplinary Studies (Liberal Arts) from the Ateneo de Manila University. He is a nephew of Mr. John L. Gokongwei, Jr.
6. Patrick Henry C. Go, 46, has been a director of JGSHI since 2000. He is currently a
director and Vice President of Universal Robina Corporation and is the President and
Chief Operating Officer of JG Summit Petrochemical Corporation and JG Summit Olefins
Corporation. He is also the Senior Managing Director of the URC Packaging (BOPP)
Division and the Flexible Packaging Division. In addition, he is a director of Robinsons
Land Corporation and Robinsons Bank Corporation. He is a trustee and treasurer of the
Gokongwei Brothers Foundation, Inc. He received a Bachelor of Science degree in
Management from the Ateneo De Manila University and attended the General Manager
Program at Harvard Business School. Mr. Patrick Henry C. Go is a nephew of Mr. John
L. Gokongwei, Jr.

-74-
7. Robina Y. Gokongwei-Pe, 55, has been a director of JGSHI since April 15, 2009. She
is also a director of Robinsons Land Corporation, Cebu Air, Inc., and Robinsons Bank
Corporation. She is currently the President and Chief Operating Officer of Robinsons
Retail Holdings, Inc. consisting of Robinsons Supermarket, Robinsons Department Store,
Handyman, True Value, Robinsons Builders, Robinsons Specialty Stores, Robinsons
Appliances, Toys R Us, Daiso Japan, Ministop and South Star Drug. She is a Trustee of
the Gokongwei Brothers Foundation, Inc. and the Immaculate Conception Academy
Scholarship Fund. She was also a member of the University of the Philippines
Centennial Commission and was a former Trustee of the Ramon Magsaysay Awards
Foundation. She obtained her Bachelor of Arts degree in Journalism from the New York
University. She is a daughter of Mr. John L. Gokongwei, Jr. 8. Ricardo J. Romulo, 83, has been a director of JGSHI since July 26, 2000. He is a
Senior Partner of Romulo Mabanta Buenaventura Sayoc & De Los Angeles. He is the Chairman of Cebu Air, Inc., FPG Insurance Co., Inc., InterPhil Laboratories, Inc., Sime Darby Pilipinas, Inc. and Towers Watson Philippines, Inc. He is a director of BASF Philippines, Inc., Honda Philippines, Inc., Johnson & Johnson (Phils.), Inc., Maersk-Filipinas, Inc., MCC Transport Philippines, Inc., Mercantile Ocean Maritime Co. (Filipinas), Inc., Damco Philippines, Inc. and Zuellig Pharma Corporation. He received his Bachelor of Laws degree from Georgetown University and Doctor of Laws degree from Harvard Law School.
9. Cornelio T. Peralta, 83, has been an independent director of JGSHI since July 26, 2000.
He is a director of the Securities Clearing Corporation of the Philippines, University of the
East, UERM Medical Center, Inc., Makati Commercial Estate Association, Inc., and Wan
Hai Lines, Inc. He was formerly the Chairman, CEO and President of Kimberly Clark
Philippines, Inc. (1971-1998), former President of P.T. Kimsari Paper Indonesia (1985-
1998), and former Chairman & CEO of University of the East (1982-1984). He finished
his Bachelor of Arts degree, cum laude, and Bachelor of Laws degrees from the
University of the Philippines and took up Advanced Management Program at Harvard
Graduate School of Business.
10. Jose T. Pardo, 77, has been an independent director of JGSHI since August 6, 2003.
He is presently the Chairman of the Philippine Stock Exchange, Securities Clearing
Corporation of the Philippines, Philippine Savings Bank, Bank of Commerce, and
Philippine Seven Corporation. He is also a director of the National Grid Corporation of
the Philippines, ZNN Radio Veritas, Araneta Hotels, Inc., Monte Oro Grid Resources
Corporation, and League One Finance and Leasing Corporation. He also held positions
in government as former Secretary of the Department of Finance and former Secretary of
the Department of Trade and Industry. He obtained his Bachelor of Science degree in
Commerce, Major in Accounting and his Masters Degree in Business Administration from
the De La Salle University in Manila.
11. Renato T. de Guzman, 66, has been an independent director of JGSHI since April 28,
2015. He was appointed Chairman of the Board of Trustees of the Government Service
Insurance System in July 2015 under the previous administration and served as such
until December 2016. He is presently a Senior Adviser of the Bank of Singapore, Director
of Maybank Philippines, Inc. and Chairman of Nueva Ecija Good Samaritan Health
System, Inc. He was formerly the Chief Executive Officer of the Bank of Singapore
(January 2010-January 2015), and ING Asia Private Bank (May 2000-January 2010),
Country Manager Philippines of ING Barings (1990-2000), and Deputy Branch Manager
of BNP Philippines (1980-2000). He holds a Bachelor of Science in Management

-75-
Engineering from the Ateneo de Manila University, Masters Degree in Business
Administration with Distinction at the Katholieke Universiteit Leuven, Belgium and a
Masters in Management from McGill University, Canada.
Members of Advisory Board
1. Washington Z. Sycip, 95, has been a member of the advisory board of JGSHI since
2001 and is the founder of The SGV Group, a firm of auditors and management consultants. He is also Chairman Emeritus of the Board of Trustees and Board of Governors of the Asian Institute of Management, member of the Board of Overseers, Columbia University’s Graduate School of Business, Honorary Life Trustee, Asia Society New York, and member of the International Advisory Board of the Council on Foreign Relations (1995-2010) and Counselor of the Conference Board. Among his awards are the Management Man of the Year given by the Management Association of the Philippines, Ramon Magsaysay Award for International Understanding, Officer’s Cross of the Order of Merit given by the Federal Republic of Germany, Officer First Class of the Royal Order of the Polar Star awarded by H.M. the King of Sweden, Star of the Order of Merit conferred by the Republic of Austria, Philippine Legion of Honor, degree of Commander conferred by the Philippine Government, the Order of Lakandula, the Rank of Grand Cross conferred by Philippine President Benigno S. Aquino III.
2. Aloysius B. Colayco, 66, has been a member of the advisory board of JGSHI since August 2001 and is presently the Country Chairman for the Jardine Matheson Group in the Philippines. He is also Managing Director of Argosy Partners, a private equity firm. He is the Chairman of Colliers Philippines and a director of Maybank Philippines. Previously, Mr. Colayco was President of AIG Investment Corporation in New York, the AIG subsidiary responsible for managing the Group's investment portfolios outside the US (primarily Europe, Asia, Latin America, the Middle East and Africa).
3. Jimmy Tang, 81, has been a member of the advisory board of JGSHI since 2012. He is
the President and Chairman of the Board of the Avesco Group of Companies. He is currently an Honorary President of the Federation of Filipino-Chinese Chambers of Commerce and Industry, Inc. (FFCCCII), and was FFCCCII President for two terms from 1993 to 1997. In addition, he is presently an Honorary Adviser of the Federation of Electrical & Electronics Suppliers & Manufacturers of the Philippines, Inc. (PESA) and PESA Foundation. He was the ninth President of PESA and the first Chairman of the PESA Foundation, which he served for seven years. He obtained his Bachelor of Science degree in Electrical Engineering from the Mapua Institute of Technology which conferred him the “Top Outstanding Mapuan for Entrepreneurship” award in 1987.
Executive Officers
1. Constante T. Santos, 68, is the Senior Vice President in charge of Conglomerate Tax
Advisory Services and Tax Administration Department. He has been Senior Vice President - Corporate Controller of JGSHI since 1998. Prior to joining the Company, he practiced public accounting with SGV & Co. in the Philippines and Ernst & Whinney in the United States. He is a member of the Philippine Institute of Certified Public Accountants. Mr. Santos obtained his Bachelor of Science degree in Business Administration from the University of the East and attended the Management Development Program at the Asian Institute of Management.
2. Bach Johann M. Sebastian, 55, has been Senior Vice President - Chief Strategist of
JGSHI since June 28, 2007. He is also Senior Vice President - Chief Strategist of Robinsons Retail Holdings, Inc., Universal Robina Corporation and Robinsons Land

-76-
Corporation. Prior to joining JGSHI in 2002, he was Senior Vice President and Chief Corporate Strategist at PSI Technologies and RFM Corporation. He was also Chief Economist, Director of Policy and Planning Group at the Department of Trade and Industry. He received a Bachelor of Arts degree in Economics from the University of the Philippines and his Masters in Business Management degree from the Asian Institute of Management.
3. Nicasio L. Lim, 60, is Senior Vice President of the Corporate Resources Group (CRG) of
JGSHI. He is a top human resource (HR) executive with almost 40 years of experience in human resources both here and abroad, 21 of those years in San Miguel Corporation (SMC), 5 in Kraft Foods International (KFI) and now with JGSHI. CRG integrates three units – Corporate Human Resources, Corporate Outsourcing Group and Corporate Safety and Security Department. Prior to this, he was Senior Vice President, Corporate Human Resources starting March 2008 and used to be the Human Resources Director of Universal Robina Corporation (URC) starting May 2004, where he managed HR functions for the whole URC group comprising of several businesses: Branded Consumer Foods, Agro-Industrial, Flour, Sugar, Packaging and CFC Flexible. He retired from SMC in 1999 as the Vice President for HR & Communications of the Beer Division. It was in his stint in SMC when he had his first crack at going international through his assignment as Vice President for Human Resources of San Miguel Brewing International based in Hong Kong in 1997. After SMC, he joined KFI in 2000 as Human Resources Director for Southeast Asia. He was able to forge a very strong HR organization which took care of managing the needed HR imperatives of KFI across 16 countries. He was conferred the People Manager of the Year Award, the highest award an HR practitioner can receive in his lifetime given by the People Management Association of the Philippines (PMAP) in 2007. He was a member of the PMAP Board of Directors from 2003 to 2004. In his capacity as Director, he headed the Committees on International Affairs and Industrial Relations. Moreover, he is among the esteemed HR professionals in the country who was bestowed the title Diplomate in People Management by PMAP. He graduated with a Bachelor’s Degree in Business Administration at the De La Salle University and finished Human Resource Executive Program at the University of Michigan-USA.
4. Renato N. Salud, 53, was appointed Senior Vice President - Corporate Affairs of JGSHI
on March 2016. Prior to joining JGSHI, he was the Corporate Relations Director, Asia for Diageo Asia Pacific based in Singapore. In this role, he had oversight on a number of Asian countries in the areas of regulation, communications and corporate social responsibility. He has extensive experience in working with governments in formulating best practice policy recommendations. He started his career as Legislative Liaison Officer for the Department of National Defense and speechwriter for Defense Secretary Fidel Ramos. In 1992, when Fidel Ramos became President of the Philippines, he continued to serve him at the Office of the Press Secretary until 1998. He moved into the private sector with Pfizer Philippines where he was Corporate Affairs Director for two years. From 2000 to 2006, he then joined Philip Morris, starting as Philip Morris Philippines Corporate Affairs Director before moving to Hong Kong to take on the role of Director for Communications for Asia Pacific. He later became Regional Corporate Affairs Director for Eastern Europe, Africa and Middle East based in Switzerland and by the time he left Philip Morris to join Diageo in 2006, he held the position of Regional Corporate Affairs Director for the European Union. He has degrees in business and law both from Ateneo de Manila University. He also obtained his Master’s Degree in Public Administration at Harvard’s John F. Kennedy School of Government.
5. Maria Celia H. Fernandez-Estavillo, 45, was appointed as Senior Vice President and
General Counsel of JGSHI on February 15, 2017 and assumed her functions on March 1, 2017. Prior to her appointment in JGSHI, Atty. Fernandez-Estavillo was the head of the
-77-
Legal and Regulatory Affairs Group, Corporate Secretary and member of the Board of Directors of Rizal Commercial Banking Corporation. She was Assistant Vice President of Global Business Development of ABS-CBN. She also held positions in government as Head of the Presidential Management Staff, Assistant Secretary at the Department of Agriculture and Chief of Staff of Senator Edgardo J. Angara. She began her legal career in ACCRA. She graduated from the University of the Philippines with a Bachelor of Science degree in Business Economics (Summa Cum Laude) and a Bachelor of Laws degree (Cum Laude). She completed her Master of Laws (LLM) in Corporate Law (Cum Laude) from New York University School of Law. She received the highest score in the Philippine Bar examinations of 1997.
6. Aldrich T. Javellana, 43, has been Vice President and Treasurer of JGSHI since
January 2, 2012. Prior to joining JGSHI in 2003, he worked in Corporate Finance with CLSA Exchange Capital. He graduated from De La Salle University with a degree in BS Accountancy and is a Certified Public Accountant.
7. Michele F. Abellanosa, 46, is Vice President for Corporate Controllership of JGSHI.
She concurrently heads the accounting groups of JGSHI, Express Holdings, Inc., JG Summit Capital Services Corporation, Unicon Insurance Brokers Corporation and Gokongwei Brothers Foundation, Inc. Prior to joining JGSHI, she practiced public accounting with SGV & Co. She received her Bachelor of Science degree in Commerce, Major in Accounting, from the University of Santo Tomas and is a Certified Public Accountant.
8. Rosalinda F. Rivera, 46, was appointed as Corporate Secretary of JGSHI on August 6,
2003 and has been Assistant Corporate Secretary since May 2002. She is also the Corporate Secretary of Robinsons Land Corporation, Universal Robina Corporation, Cebu Air, Inc., Robinsons Retail Holdings, Inc. and JG Summit Petrochemical Corporation. Prior to joining the Company, she was a Senior Associate in Puno and Puno Law Offices. She received a degree of Juris Doctor from the Ateneo de Manila University School of Law and a Masters of Law in International Banking from the Boston University School of Law.
9. Chona R. Ferrer, 59, has been Deputy Treasurer of JGSHI since January 2, 2012. She is also a First Vice President of Universal Robina Corporation. Prior to joining JGSHI in 1983, she was Assistant Treasurer of Guevent Industrial Development Corporation. She received a Bachelor of Science degree in Business Administration from the University of the Philippines.
10. Arlene S. Denzon, 49, is Compliance Officer and Vice President of the Corporate
Governance and Management Systems of JGSHI. She is also the Compliance Officer of Universal Robina Corporation and Robinsons Land Corporation. Prior to rejoining JGSHI in February 2013, she was the Senior Vice President in charge of the Enterprise-wide Risk Management Group of Digitel Mobile Philippines, Inc. (DMPI, more popularly known as Sun Cellular) until December, 2012. Ms. Denzon started her career in the Gokongwei Group in 1991 and performed various roles including Accounting Manager of JGSHI until 1997, Assistant Vice President - Special Assistant to the Chairman until 2001, Vice President – Treasurer and Acting Chief Financial Officer of URC International until 2003 before she was seconded to DMPI in 2004. Prior to JGSHI, Ms. Denzon had three years working experience as external auditor in Sycip, Gorres, Velayo & Co. She was a Certified Public Accountant Board topnotcher and obtained her Bachelor of Accountancy degree, Magna Cum Laude, from the Polytechnic University of the Philippines.

-78-
SIGNIFICANT EMPLOYEE
There are no persons who are not executive officers of the Company who are expected to
make a significant contribution to the business.
INVOLVEMENT IN CERTAIN LEGAL PROCEEDINGS WHICH OCCURRED DURING THE
PAST FIVE YEARS.
None.
FAMILY RELATIONSHIPS
1. Mr. James L. Go is the brother of Mr. John L. Gokongwei, Jr.
2. Ms. Lily G. Ngochua is the sister of Mr. John L. Gokongwei, Jr.
3. Mr. Lance Y. Gokongwei is the son of Mr. John L. Gokongwei, Jr.
4. Mr. Patrick Henry C. Go is the nephew of Mr. John L. Gokongwei, Jr.
5. Mr. Johnson Robert G. Go, Jr. is the nephew of Mr. John L. Gokongwei, Jr.
6. Ms. Robina Y. Gokongwei-Pe is the daughter of Mr. John L. Gokongwei, Jr.
Item 10. Executive Compensation
The aggregate compensation of executive officers and directors of the Company for the last 2
years and projected for the ensuing year (2017) are as follows:
ACTUAL
2016 2015
Salary Bonus Others Total Total
CEO and Four
(4) most highly
compensated
Executive officer
P=136,831,377
P=3,200,000
P=786,750
P=140,818,127
P=134,870,996
All directors and
executive officers
as a group
unnamed
P=202,885,446
P=5,975,000
P=1,266,750
P=210,127,196
P=195,344,932
PROJECTED 2017
Salary Bonus Others Total
CEO and Four (4) most
highly compensated
Executive officer
P=144,204,250
P=3,200,000
P=786,750
P=148,191,000
All directors and
executive officers as a
group unnamed
P=216,557,346
P=5,975,000
P=1,266,750
P=223,799,096
The following are the five (5) highest compensated directors and executive officers of the
Company: 1. Chairman Emeritus - Mr. John L. Gokongwei, Jr.; 2. Director, Chairman and
CEO - Mr. James L. Go; 3. Director, President and COO - Mr. Lance Y. Gokongwei; 4.
Director - Mr. Patrick Henry C. Go; and 5. Director - Ms. Robina Y. Gokongwei-Pe.

-79-
Standard Arrangements
Other than payment of reasonable per diem, there are no standard arrangements pursuant to
which directors of the Company are compensated, or are to be compensated, directly or
indirectly, for any services rendered provided as a director for the last completed year and the
ensuing year.
Other Arrangements
There are no other arrangements pursuant to which any director of the Company was
compensated, or is to be compensated, directly or indirectly, during the Company’s last
completed year, and the ensuing year, for any service provided as a director.
Terms and Conditions of any Employment Contract or any Compensatory Plan or
Arrangement between the Company and the Executive Officers.
None.
Outstanding Warrants or Options Held by the Company’s CEO, the Executive Officers and
Directors.
None.
Item 11. Security Ownership of Certain Record and Beneficial Owners and Management
As of December 31, 2016, the Company is not aware of anyone who beneficially owns in
excess of 5% of the Company’s common stock except as set forth in the table below:
(1) SECURITY OWNERSHIP OF CERTAIN RECORD AND BENEFICIAL OWNERS
Title of
class
Names and addresses of
record owners and
relationship with the
Corporation
Names of beneficial
owner and
relationship with
record owner
Citizenship No. of shares
held
% to total
outstanding
Common Gokongwei Brothers
Foundation, Inc.
43/F Robinsons-Equitable
Tower ADB Ave. cor.
Poveda St. Ortigas Center,
Pasig City (stockholder)
Same as record
owner (see note 1)
Filipino 1,997,076,451 27.88%
Common PCD Nominee Corporation
(Filipino)
37/F Tower I, The
Enterprise Center, 6766
Ayala Ave. cor. Paseo de
Roxas, Makati City
(stockholder)
PCD Participants
and their clients
(see note 2)
Filipino 1,640,901,842
(see note 3)
22.91%
Common RSB-TIG No. 030-46-
000001-9
17/F Galleria Corporate
Center Edsa cor. Ortigas
Trustee’s
designated officers
(see note 4)
Filipino 1,033,319,225 14.43%

-80-
Ave., Quezon City
(stockholder)
Common PCD Nominee Corporation
(Non-Filipino)
37/F Tower I, The
Enterprise Center, 6766
Ayala Ave. Cor. Paseo de
Roxas, Makati City
(stockholder)
PCD Participants
and their clients
(see note 2)
Non-
Filipino
936,068,004 13.07%
Notes:
1. Gokongwei Brothers Foundation, Inc. (the “Foundation”) is a non-stock, non-profit corporation organized by the irrevocable donation by the
incorporators, who are also Trustees of the Foundation, of shares of JG Summit Holdings, Inc. Under the Articles of Incorporation and By-Laws of
the Foundation, except for salaries of employees and honoraria of consultants and similar expenses for actual services rendered to the Foundation
or its projects, no part of the corpus or its income and increments shall benefit or be used for the private gain of any member, trustee, officer or any
juridical or natural person whatsoever. The Chairman of the Board of Trustees shall exercise exclusive power and authority to represent and vote
for any shares of stock owned by the Foundation in other corporate entities. The incumbent Chairman of the Board of Trustees of the Foundation is
Mr. John L. Gokongwei, Jr.
2. PCD Nominee Corporation is the registered owner of the shares in the books of the Corporation’s transfer agent. PCD Nominee Corporation is a
corporation wholly owned by the Philippine Depository and Trust Corporation, Inc. (formerly the Philippine Central Depository) (“PDTC”), whose
sole purpose is to act as nominee and legal title holder of all shares of stock lodged in the PDTC. PDTC is a private corporation organized to
establish a central depository in the Philippines and introduce scripless or book-entry trading in the Philippines. Under the current system of the
PDTC, only participants (brokers and custodians) are recognized by PDTC as the beneficial owners of the lodged shares. Each beneficial owner of
shares through his participant is the beneficial owner to the extent of the number of shares held by such participant in the records of the PCD
Nominee.
3. Out of the PCD Nominee Corporation (Filipino) account, “BPI Securities Corporation.” hold for various trust accounts the following shares of the
Corporation as of December 31, 2016:
No. of shares held % to total outstanding
BPI Securities Corporation 505,973,315 7.06%
The securities are voted by the trustee’s designated officers who are not known to the Corporation.
4. Robinsons Bank - Trust & Investment Group (RSB-TIG) is the trustee of this trust account. The shares are voted by the trustee’s designated
officers.
(2) SECURITY OWNERSHIP OF MANAGEMENT
Title of
class Names of beneficial owner Position
Amount and
nature of
beneficial
ownership
Citizenship % to total
outstanding
A. Named Executive Officers 1 Common 1. John L. Gokongwei, Jr. Director, Chairman
Emeritus
58,007,718(D) Filipino 0.81%
Common 2. James L. Go Director, Chairman
and Chief
Executive Officer
148,679,656(D) Filipino 2.08%
Common 3. Lance Y. Gokongwei Director, President
and Chief
Operating Officer
541,838,575(D) Filipino 7.56%
Common 4. Patrick Henry C. Go Director 93,500(D) Filipino * Common 5. Robina Y. Gokongwei-Pe Director 179,460,000(D) Filipino 2.51%
928,079,449 12.96%

-81-
B. Other Directors and Executive Officers Common 6. Lily G. Ngochua Director 388,018(D) Filipino * Common 7. Johnson Robert G. Go, Jr. Director 1(D) Filipino * Common 8. Ricardo J. Romulo Director 1(D) Filipino * Common 9. Cornelio T. Peralta Director
(Independent)
11,000(D) Filipino *
Common 10. Jose T. Pardo Director
(Independent)
1(D) Filipino *
Common 11. Renato T. De Guzman Director
(Independent)
1(D) Filipino *
Common 12. Maria Celia H.
Fernandez-Estavillo
Senior Vice
President and
General Counsel
5000(D) Filipino *
Common 13. Michelle F. Abellanosa Vice-President 6,000(D) Filipino *
410,022 *
928,489,471 12.96%
Notes:
D - Direct
1. As defined under Part IV (B)(1)(b) of Annex “C” of SRC Rule 12, the “named executive officers” to be listed refer to the Chief Executive Officer and
those that are the four (4) most highly compensated executive officers as of December 31, 2015.
* less than 0.01%.
The other Executive Officers of the Company have no beneficial ownership over any shares
of the Company as of December 31, 2016, namely:
1. Constante T. Santos - Senior Vice President
2. Bach Johann M. Sebastian - Senior Vice President
3. Nicasio L. Lim - Senior Vice President
4. Renato N. Salud - Senior Vice President
5. Aldrich T. Javellana - Vice President and Treasurer
6. Rosalinda F. Rivera - Corporate Secretary
7. Chona R. Ferrer - Deputy Treasurer
8. Arlene S. Denzon - Compliance Officer
(3) VOTING TRUST HOLDERS OF 5% OR MORE
As of December 31, 2016, there are no persons holding more than 5% of a class under a
voting trust or similar agreement.
(4) CHANGES IN CONTROL
None
Item 12. Certain Relationships and Related Transactions
See Note 40 (Related Party Transactions Disclosures) of the Notes to Consolidated Financial
Statements filed as part of this Form 17-A.

-82-
The Company and its subsidiaries and affiliates, in their regular conduct of business, have
engaged in transactions with each other and with other affiliated companies, consisting
principally of sales and purchases at market prices and advances made and obtained.
PART IV – CORPORATE GOVERNANCE
Item 13. Corporate Governance
The Group adheres to the principles and practices of good corporate governance, as embodied in its Corporate Governance Manual, Code of Ethics and related SEC Circulars. Continuous improvement and monitoring of governance and management policies have been undertaken to ensure that the Group observes good governance and management practices. This is to assure the shareholders that the Group conducts its business with the highest level of integrity, transparency and accountability. The Group likewise consistently strives to raise its financial reporting standards by adopting and implementing prescribed Philippine Financial Reporting Standards (PFRSs).
PART V - EXHIBITS AND SCHEDULES
Item 14. Exhibits and Reports on SEC Form 17-C
(a) Exhibits - See accompanying Index to Exhibits (page 83)
The other exhibits, as indicated in the Index to Exhibits are either not applicable to the
Company or require no answer.
(b) Reports on SEC Form 17-C (Current Report)
Following is a list of disclosures filed by JGSHI under SEC Form 17-C for the six month
period from July 1, 2016 to December 31, 2016:
Date of Disclosure Subject Matter
July 4, 2016 Acquisition of shares of Global Business Power Corporation.
August 15, 2016 Disclosure Statement “JG Summit’s Net Income Increased 30.6% for the First Half of 2016”.
September 29, 2016 Clarification of news report “SMC, Ayala to compete for NAIA project”.
November 2, 2016 Press Release “JG Summit’s P30 Billion Bonds Keep Highest Rating”.
November 15, 2016 Disclosure Statement “JG Summit’s Net Income increased 44.4% for the Nine Months of 2016”.


JG SUMMIT HOLDINGS, INC. AND SUBSIDIARIES
INDEX TO CONSOLIDATED FINANCIAL STATEMENTS AND
SUPPLEMENTARY SCHEDULES
CONSOLIDATED COMPANY FINANCIAL STATEMENTS
Statement of Management’s Responsibility for Financial Statements..................................... 85
Report of Independent Auditors............................................................................................... 87
Consolidated Statements of Financial Position as of December 31, 2016 and 2015............... 95
Consolidated Statements of Comprehensive Income for the Years Ended
December 31, 2016, 2015 and 2014............................................................................ 97
Consolidated Statements of Changes in Equity for the Years Ended
December 31, 2016, 2015 and 2014............................................................................ 99
Consolidated Statements of Cash Flows for the Years Ended
December 31, 2016, 2015 and 2014............................................................................ 101
Notes to Consolidated Financial Statements............................................................................. 103
SUPPLEMENTARY SCHEDULES
Report of Independent Auditors on Supplementary Schedules................................................. 285
Part I
I. Reconciliation of Retained Earnings Available for Dividend Declaration
(Part 1, 4C; Annex 68-C)................................................................................................... 286
II. Schedule of all the effective standards and interpretations (Part 1, 4J).............................. 287
III. Map of the relationships of the companies within the group (Part 1, 4H).......................... 292
Part II - Supplementary Schedules Required by Annex 68-E
A. Financial Assets................................................................................................................. 302
B. Amounts Receivable from Directors, Officers, Employees, Related Parties
and Principal Stockholders (Other than Related Parties)................................................... 303
C. Amounts Receivable from Related Parties which are Eliminated During
the Consolidation of Financial Statements........................................................................ 304
D. Intangible Assets - Other Assets........................................................................................ 305
E. Long-term Debt................................................................................................................. 306
F. Indebtedness to Related Parties (Long-Term Loans from Related Companies)................ 307
G. Guarantees of Securities of Other Issuers.......................................................................... 308
H. Capital Stock...................................................................................................................... 309
OTHER SCHEDULE
Financial Soundness Indicator.................................................................................................... 310


*SGVFS023363*
INDEPENDENT AUDITOR’S REPORT
The Stockholders and the Board of DirectorsJG Summit Holdings, Inc.
Report on the Consolidated Financial Statements
Opinion
We have audited the accompanying consolidated financial statements of JG Summit Holdings, Inc. and itssubsidiaries (the Group), which comprise the consolidated statements of financial position as atDecember 31, 2016 and 2015, and the consolidated statements of comprehensive income, consolidatedstatements of changes in equity and consolidated statements of cash flows for each of the three years inthe period ended December 31, 2016, and notes to the consolidated financial statements, including asummary of significant accounting policies.
In our opinion, the accompanying consolidated financial statements present fairly, in all material respects,the consolidated financial position of the Group as at December 31, 2016 and 2015, and its consolidatedfinancial performance and its consolidated cash flows for each of the three years in the period endedDecember 31, 2016 in accordance with Philippine Financial Reporting Standards (PFRSs).
Basis for Opinion
We conducted our audits in accordance with Philippine Standards on Auditing (PSAs). Ourresponsibilities under those standards are further described in the Auditor’s Responsibilities for the Auditof the Consolidated Financial Statements section of our report. We are independent of the Group inaccordance with the Code of Ethics for Professional Accountants in the Philippines (Code of Ethics)together with the ethical requirements that are relevant to our audit of the consolidated financialstatements in the Philippines, and we have fulfilled our other ethical responsibilities in accordance withthese requirements and the Code of Ethics. We believe that the audit evidence we have obtained issufficient and appropriate to provide a basis for our opinion.
Key Audit Matters
Key audit matters are those matters that, in our professional judgment, were of most significance in ouraudit of the consolidated financial statements of the current period. These matters were addressed in thecontext of our audit of the consolidated financial statements as a whole, and in forming our opinionthereon, and we do not provide a separate opinion on these matters. For each matter below, ourdescription of how our audit addressed the matter is provided in that context.
SyCip Gorres Velayo & Co.6760 Ayala Avenue1226 Makati CityPhilippines
Tel: (632) 891 0307Fax: (632) 819 0872ey.com/ph
BOA/PRC Reg. No. 0001, December 14, 2015, valid until December 31, 2018SEC Accreditation No. 0012-FR-4 (Group A), November 10, 2015, valid until November 9, 2018
A member firm of Ernst & Young Global Limited

- 2 -
*SGVFS023363*A member firm of Ernst & Young Global Limited
We have fulfilled the responsibilities described in the Auditor’s Responsibilities for the Audit of theConsolidated Financial Statements section of our report, including in relation to these matters.Accordingly, our audit included the performance of procedures designed to respond to our assessment ofthe risks of material misstatement of the consolidated financial statements. The results of our auditprocedures, including the procedures performed to address the matters below, provide the basis for ouraudit opinion on the accompanying consolidated financial statements.
Accounting for Acquisition of Subsidiaries and an AssociateAs disclosed in Notes 14 and 44 to the consolidated financial statements, the Group acquired ownershipinterests in subsidiaries and an associate. The Group recognized the related assets, including goodwilland intangible assets, and liabilities for its acquired subsidiaries and determined the notional goodwill forits acquired associate based on purchase price allocations performed by external valuation specialists. Weconsidered the accounting for these acquisitions to be a key audit matter because it required significantmanagement judgment in identifying intangible assets and significant management estimates indetermining the fair values of acquired assets and liabilities, particularly intangible assets and property,plant and equipment.
Audit responseWe reviewed the purchase agreements covering the acquisitions and the purchase price allocations doneby the Group. We assessed the competence, capabilities and objectivity of the external valuationspecialists who prepared the valuations by considering their qualifications, experience and reportingresponsibilities. We involved our internal specialists in evaluating the methodologies and assumptionsused to determine the fair value of intangible assets and property, plant and equipment. We reviewed theidentification of the subsidiaries’ and the associate’s underlying assets and liabilities, specifically theintangible assets based on our understanding of these entities’ businesses and management’s rationale forthe acquisitions. We tested the main assumptions used to determine the fair value of intangible assetssuch as sales forecast, royalty rates and growth rates by comparing with historical trends and relevantexternal information. We reviewed the discount rates used to value the intangible assets by assessingwhether the underlying parameters used represent current market assumptions of risks specific to the assetbeing valued. We reviewed the comparable properties used by management’s external appraisers to valuethe property, plant and equipment and assessed whether the adjustments made to arrive at the concludedvalue properly considered differences in characteristics such as location, size and shape. We reviewed thecost information and current prices used to value the property, plant and equipment by comparing withrelevant external data. The disclosures in relation to the significant assumptions in the valuation ofintangible assets and property, plant and equipment are included in Note 3 to the consolidated financialstatements.
Recoverability of Goodwill and Intangible AssetsAs discussed in Notes 18, 19 and 44, to the consolidated financial statements, the Group has acquiredseveral businesses engaged in different products and services, across different markets. Assetsrecognized from these strategic acquisitions include Goodwill of P=32.0 billion and Intangible assets ofP=14.2 billion that include trademarks and brands of P=9.4 billion and product formulation of P=0.4 billionthat have indefinite useful lives. Under PFRS, the Group is required to test goodwill and intangible assetswith indefinite useful life for impairment at least on an annual basis. The recoverable amount for eachcash-generating unit (CGU) has been calculated based on value-in-use. These recoverable amounts usediscounted future cash flows in which management makes estimates over certain key inputs, such as salesforecast, growth rates and discount rates. Due to the high level of judgement and estimation involved,and the significance of the carrying amounts, we considered the recoverability of goodwill and intangibleassets a key audit matter.

- 3 -
*SGVFS023363*A member firm of Ernst & Young Global Limited
Audit responseWe obtained an understanding of the Group’s impairment assessment process and related controls. Weinvolved our internal specialists in evaluating the assumptions and methodologies used, in particular thoserelating to discount rates and growth rates. We reviewed the cash flow projections and other key inputssuch as growth rate estimates and discount rates, by comparing to externally available industry, economicand financial data and the Group’s own historical data and performance.
We also reviewed the Group’s disclosures in respect of impairment testing and the sensitivity of theoutcome of the impairment assessment to changes in key assumptions.
Revenue RecognitionThe Group derives part of its core income from real estate sales and air transportation services.
RLC Group applies the percentage of completion (POC) method in determining real estate revenue andcosts. The POC is based on the proportion of cost incurred to date over total estimated cost of the realestate project. The cost of sales is determined on the basis of the total estimated costs applied with thePOC of the project. The RLC Group’s real estate revenue and costs accounts for 9% of total consolidatedrevenue and 8% of the total consolidated cost of sales of the Group, respectively. The estimation of thetotal cost of the real estate project requires technical inputs by project development engineers. Inaddition, the RLC Group requires a certain percentage of buyer’s payments of the total selling price to becollected (buyer’s equity) as one of the criteria in order to initiate revenue recognition. The buyer’scommitment on the sale is ascertained by RLC Group based on the the significance of the buyer’s equity.The assessment of the stage of completion and the level of buyer’s equity involves significantmanagement judgement as disclosed in Note 3 to the financial statements.
CAI Group recognizes passenger service revenue when the service has been rendered to the passengersaccording to flight schedule. The amount of passenger tickets for which the related transportation servicehas not yet been rendered at the end of the reporting period, is recorded as unearned passenger servicerevenue in the consolidated statement of financial position. Baggage fees are non-refundable fees whichare recognized upon receipt. Other ancillary fees are recognized when transactions are carried out.
We considered the recognition of passenger service revenue, baggage fees and other ancillary fees as akey audit matter because of the significance of these accounts to the consolidated financial statements andthe high volume of transactions being processed and captured from various distribution channels andlocations. The CAI Group’s air transportation revenue accounts for 27% of total consolidated revenue.In addition, the determination of the earned and unearned passenger service revenue is highly dependenton the CAI Group’s information technology (IT) systems. The disclosures in relation to the revenuerecognition are included in Note 2 to the consolidated financial statements.
Audit responseIn testing the real estate revenue recognition, we obtained an understanding of the RLC Group’sprocesses for determining the POC, including the cost accumulation process, determination and updatingof total estimated costs and performed tests of the relevant controls over these processes. We assessed thecompetence, capabilities and objectivity of the project development engineers by reference to theirqualifications, experience and reporting responsibilities. For selected projects, we traced costsaccumulated to the supporting documents such as purchase order, billings and invoices of contractors.We visited selected project sites and made relevant inquiries with project development engineers. Weperformed test computation of the percentage of completion calculation of management. For selectedprojects, we obtained the approved total estimated costs including revisions and the supporting details
- 4 -
*SGVFS023363*A member firm of Ernst & Young Global Limited
such as capital fulfillment plan, capital expenditure requests and related Executive Committee approvals.We likewise performed inquiries with the project development engineers for the revisions. We evaluatedmanagement’s basis of the buyer’s equity by comparing this to the historical analysis of sales collectionsfrom buyers with accumulated payments above the collection threshold. We traced the analysis tosupporting documents such as Contract to Sell (CTS), Collection report and Buyer’s ledger.
In testing the air transportation services revenue, we involved our internal specialists to assist us inunderstanding and testing the controls over the CAI Group’s IT systems and passenger revenuerecognition process. This includes testing the controls over the capture and recording of revenuetransactions, authorization of rate changes and the input of these information to the revenue system, andmapping of bookings from unearned to earned passenger service revenue when passengers are lifted. Weassessed the information produced by the CAI Group’s IT systems and tested the reports generated bythese systems that are used to defer or recognize passenger service revenue. On a sample basis, we testedthe timing of the recording of the transactions near the reporting period. Also, on a sample basis, wetested journal entries related to these accounts through inspection of underlying source documentation.
Accounting for Investment in an AssociateThe Group has effective ownership of 27.12% in Manila Electric Company (Meralco) as of December 31,2016. This investment is accounted for using the equity method. The application of the equity method ofaccounting to this investment is a key audit matter because Meralco contributed P4.98 billion or 22% tothe consolidated net income of the Group in 2016, and accounted for 11% of the consolidated total assetsof the Group as of December 31, 2016.
The Group’s share in Meralco’s net income is significantly affected by Meralco’s revenues from the saleof electricity which arise from its service contracts with a large number of customers that are classified aseither commercial, industrial or residential, located within Meralco’s franchise area. The revenuerecognized depends on (a) the complete capture of electric consumption based on the meter readings overthe franchise area taken on various dates; (b) the propriety of rates computed and applied across customerclasses; and (c) the reliability of the IT systems involved in processing the billing transactions.
Meralco is also involved in certain proceedings for which Meralco has recognized provisions for probablecosts and/or expense and/or has disclosed relevant information about such contingencies. This matter isimportant to our audit because the assessment of the potential outcome or liability involves significantmanagement judgment and estimation of its impact could have a material effect on the Group’s share inMeralco’s net income.
The Group’s share in Meralco’s other comprehensive income is significantly affected by Meralco’sdefined benefit retirement plan for all regular employees. We consider this as a key audit matter becausethe valuation of the benefits obligation involves a significant level of management judgment. Thevaluation also requires the assistance of an actuary whose calculations involve the use of certainassumptions, such as future salary increases, discount rates, mortality rates, and employee turnover ratesthat could have significant impact on the calculation of the benefits expense and liability.
Audit responseFor Meralco, we obtained an understanding and evaluated the design of, as well as tested the controlsover, the customer master file maintenance, accumulation and processing of meter data, and interface ofdata from the billing system to the financial reporting system. In addition, we performed a testrecalculation of the bill amounts using the ERC-approved rates and formulae, as well as actual costsincurred, and compared them with the amounts reflected in the billing statements. We involved our
- 5 -
*SGVFS023363*A member firm of Ernst & Young Global Limited
internal specialist in understanding the IT processes and in understanding and testing the IT generalcontrols over the IT systems supporting the revenue recognition process.
We also examined the bases of management’s assessment of the possible outcomes and the relatedestimates of the probable costs and/or expenses that are recognized and/or disclosed in Meralco’sconsolidated financial statements. In addition, we evaluated the input data supporting the assumptionsused, such as tariffs, tax rates, historical experience, regulatory rulings and other developments, againstMeralco’s internal and external data and performed recalculations and inspection of relevant supportingdocuments. We also reviewed the disclosures on provisions and contingencies in the Meralco’sconsolidated financial statements.
We obtained an understanding of Meralco’s defined benefit retirement plans as well as the processesincluded in estimating the amounts of the related asset, liability and expense. We involved an internalspecialist to assist us with our review of the scope, bases of assumptions, methodology and results of thework of Meralco’s actuary, whose professional qualifications and objectivity were also evaluated. Wecompared the key inputs used, such as future salary increases, discount rates, mortality rates, andemployee turnover rates against Meralco’s internal data and external references. We also inquired aboutthe basis of the salary rate increase and compared it against Meralco’s forecasted salary rate increase.
We obtained the relevant financial information of Meralco and recomputed the Group’s share in the totalcomprehensive income of Meralco for the year ended December 31, 2016.
Reasonableness of Estimated Useful Lives of AircraftThe CAI Group annually estimates the useful lives of its aircraft based on the period over which theassets are expected to be available for use. The CAI Group considers changes to economic conditions,demand, competition and technology advancement when reassessing the estimated useful lives of itsaircraft. We considered this area as a key audit matter given the material balances of these assets and thesignificant judgment required in estimating these assets’ useful lives which impacts the carrying valuesand depreciation charges for these assets. The disclosures on estimated useful lives are included in Notes2 and 3 to the consolidated financial statements.
Audit responseWe obtained an understanding of the CAI Group’s process and controls over estimation of the useful livesof aircraft. We also considered the developments in the airline industry and compared the estimateduseful lives used by the CAI Group with other comparable airline companies.
Other Information
Management is responsible for the other information. The other information comprises the informationincluded in the SEC Form 20 IS (Definitive Information Statement), SEC Form 17 A and Annual Reportfor the year ended December 31, 2016, but does not include the consolidated financial statements and ourauditor’s report thereon. The SEC Form 20 IS (Definitive Information Statement), SEC Form 17 A andAnnual Report for the year ended December 31, 2016 are expected to be made available to us after thedate of this auditor’s report.

- 6 -
*SGVFS023363*A member firm of Ernst & Young Global Limited
Our opinion on the consolidated financial statements does not cover the other information and we will notexpress any form of assurance conclusion thereon.
In connection with our audits of the consolidated financial statements, our responsibility is to read theother information identified above when it becomes available and, in doing so, consider whether the otherinformation is materially inconsistent with the consolidated financial statements or our knowledgeobtained in the audits, or otherwise appears to be materially misstated.
Responsibilities of Management and Those Charged with Governance for the ConsolidatedFinancial Statements
Management is responsible for the preparation and fair presentation of the consolidated financialstatements in accordance with PFRSs, and for such internal control as management determines isnecessary to enable the preparation of consolidated financial statements that are free from materialmisstatement, whether due to fraud or error.
In preparing the consolidated financial statements, management is responsible for assessing the Group’sability to continue as a going concern, disclosing, as applicable, matters related to going concern andusing the going concern basis of accounting unless management either intends to liquidate the Group or tocease operations, or has no realistic alternative but to do so.
Those charged with governance are responsible for overseeing the Group’s financial reporting process.
Auditor’s Responsibilities for the Audit of the Consolidated Financial Statements
Our objectives are to obtain reasonable assurance about whether the consolidated financial statements as awhole are free from material misstatement, whether due to fraud or error, and to issue an auditor’s reportthat includes our opinion. Reasonable assurance is a high level of assurance, but is not a guarantee that anaudit conducted in accordance with PSAs will always detect a material misstatement when it exists.Misstatements can arise from fraud or error and are considered material if, individually or in theaggregate, they could reasonably be expected to influence the economic decisions of users taken on thebasis of these consolidated financial statements.
As part of an audit in accordance with PSAs, we exercise professional judgment and maintainprofessional skepticism throughout the audit. We also:
∂ Identify and assess the risks of material misstatement of the consolidated financial statements,whether due to fraud or error, design and perform audit procedures responsive to those risks, andobtain audit evidence that is sufficient and appropriate to provide a basis for our opinion. The risk ofnot detecting a material misstatement resulting from fraud is higher than for one resulting from error,as fraud may involve collusion, forgery, intentional omissions, misrepresentations, or the override ofinternal control.
∂ Obtain an understanding of internal control relevant to the audit in order to design audit proceduresthat are appropriate in the circumstances, but not for the purpose of expressing an opinion on theeffectiveness of the Group’s internal control.

- 7 -
*SGVFS023363*A member firm of Ernst & Young Global Limited
∂ Evaluate the appropriateness of accounting policies used and the reasonableness of accountingestimates and related disclosures made by management.
∂ Conclude on the appropriateness of management’s use of the going concern basis of accounting and,based on the audit evidence obtained, whether a material uncertainty exists related to events orconditions that may cast significant doubt on the Group’s ability to continue as a going concern. Ifwe conclude that a material uncertainty exists, we are required to draw attention in our auditor’sreport to the related disclosures in the consolidated financial statements or, if such disclosures areinadequate, to modify our opinion. Our conclusions are based on the audit evidence obtained up tothe date of our auditor’s report. However, future events or conditions may cause the Group to ceaseto continue as a going concern.
∂ Evaluate the overall presentation, structure and content of the consolidated financial statements,including the disclosures, and whether the consolidated financial statements represent the underlyingtransactions and events in a manner that achieves fair presentation.
∂ Obtain sufficient appropriate audit evidence regarding the financial information of the entities orbusiness activities within the Group to express an opinion on the consolidated financial statements.We are responsible for the direction, supervision and performance of the audit. We remain solelyresponsible for our audit opinion.
We communicate with those charged with governance regarding, among other matters, the planned scopeand timing of the audit and significant audit findings, including any significant deficiencies in internalcontrol that we identify during our audit.
We also provide those charged with governance with a statement that we have complied with relevantethical requirements regarding independence, and to communicate with them all relationships and othermatters that may reasonably be thought to bear on our independence, and where applicable, relatedsafeguards.
From the matters communicated with those charged with governance, we determine those matters thatwere of most significance in the audit of the consolidated financial statements of the current period andare therefore the key audit matters. We describe these matters in our auditor’s report unless law orregulation precludes public disclosure about the matter or when, in extremely rare circumstances, wedetermine that a matter should not be communicated in our report because the adverse consequences ofdoing so would reasonably be expected to outweigh the public interest benefits of such communication.

- 8 -
*SGVFS023363*A member firm of Ernst & Young Global Limited
The engagement partner on the audit resulting in this independent auditor’s report is Aris C. Malantic.
SYCIP GORRES VELAYO & CO.
Aris C. MalanticPartnerCPA Certificate No. 90190SEC Accreditation No. 0326-AR-3 (Group A), May 1, 2015, valid until April 30, 2018Tax Identification No. 152-884-691BIR Accreditation No. 08-001998-54-2015, February 27, 2015, valid until February 26, 2018PTR No. 5908720, January 3, 2017, Makati City
March 30, 2017
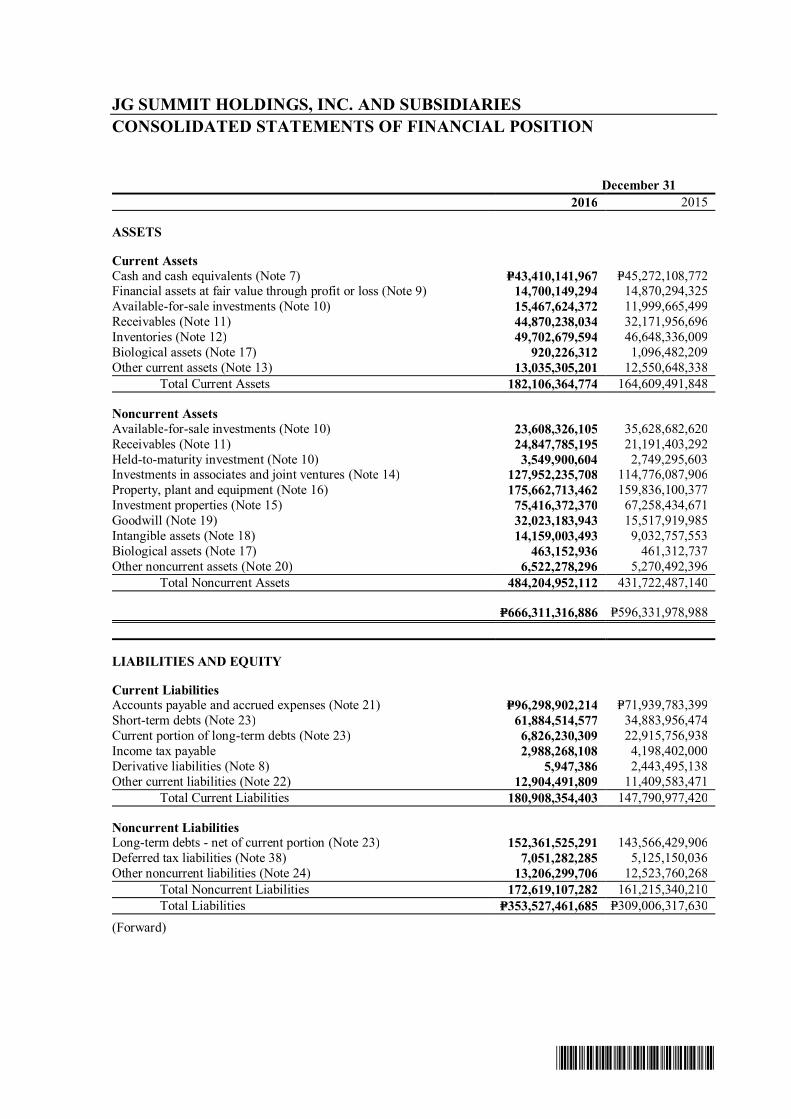
*SGVFS023363*
JG SUMMIT HOLDINGS, INC. AND SUBSIDIARIESCONSOLIDATED STATEMENTS OF FINANCIAL POSITION
December 312016 2015
ASSETS
Current AssetsCash and cash equivalents (Note 7) P=43,410,141,967 P=45,272,108,772Financial assets at fair value through profit or loss (Note 9) 14,700,149,294 14,870,294,325Available-for-sale investments (Note 10) 15,467,624,372 11,999,665,499Receivables (Note 11) 44,870,238,034 32,171,956,696Inventories (Note 12) 49,702,679,594 46,648,336,009Biological assets (Note 17) 920,226,312 1,096,482,209Other current assets (Note 13) 13,035,305,201 12,550,648,338
Total Current Assets 182,106,364,774 164,609,491,848
Noncurrent AssetsAvailable-for-sale investments (Note 10) 23,608,326,105 35,628,682,620Receivables (Note 11) 24,847,785,195 21,191,403,292Held-to-maturity investment (Note 10) 3,549,900,604 2,749,295,603Investments in associates and joint ventures (Note 14) 127,952,235,708 114,776,087,906Property, plant and equipment (Note 16) 175,662,713,462 159,836,100,377Investment properties (Note 15) 75,416,372,370 67,258,434,671Goodwill (Note 19) 32,023,183,943 15,517,919,985Intangible assets (Note 18) 14,159,003,493 9,032,757,553Biological assets (Note 17) 463,152,936 461,312,737Other noncurrent assets (Note 20) 6,522,278,296 5,270,492,396
Total Noncurrent Assets 484,204,952,112 431,722,487,140
P=666,311,316,886 P=596,331,978,988
LIABILITIES AND EQUITY
Current LiabilitiesAccounts payable and accrued expenses (Note 21) P=96,298,902,214 P=71,939,783,399Short-term debts (Note 23) 61,884,514,577 34,883,956,474Current portion of long-term debts (Note 23) 6,826,230,309 22,915,756,938Income tax payable 2,988,268,108 4,198,402,000Derivative liabilities (Note 8) 5,947,386 2,443,495,138Other current liabilities (Note 22) 12,904,491,809 11,409,583,471
Total Current Liabilities 180,908,354,403 147,790,977,420
Noncurrent LiabilitiesLong-term debts - net of current portion (Note 23) 152,361,525,291 143,566,429,906Deferred tax liabilities (Note 38) 7,051,282,285 5,125,150,036Other noncurrent liabilities (Note 24) 13,206,299,706 12,523,760,268
Total Noncurrent Liabilities 172,619,107,282 161,215,340,210Total Liabilities P=353,527,461,685 P=309,006,317,630
(Forward)

*SGVFS023363*
- 2 -
December 312016 2015
EquityEquity attributable to equity holders of the Parent Company:
Paid-up capital (Note 25) P=30,755,866,814 P=30,755,866,814Retained earnings (Note 25) 180,369,415,195 171,252,146,684Equity reserve (Note 25) 29,638,831,336 27,575,017,926Other comprehensive losses (Note 36) (1,248,591,500) (6,192,501,831)
239,515,521,845 223,390,529,593Non-controlling interests (Note 25) 73,268,333,356 63,935,131,765
Total Equity 312,783,855,201 287,325,661,358
P=666,311,316,886 P=596,331,978,988
See accompanying Notes to Consolidated Financial Statements.

*SGVFS023363*
JG SUMMIT HOLDINGS, INC. AND SUBSIDIARIESCONSOLIDATED STATEMENTS OF COMPREHENSIVE INCOME
Years Ended December 312016 2015 2014
REVENUESale of goods and services: Foods P=112,611,969,799 P=112,004,706,553 P=96,653,414,632
Air transportation 61,899,278,892 56,501,654,516 52,000,018,310Petrochemicals 29,070,077,332 26,780,296,575 3,226,178,660Real estate and hotels (Notes 11 and 15) 22,750,417,221 20,298,039,549 17,432,805,294Banking (Note 26) 3,412,187,119 2,968,940,306 2,717,195,606
Equity in net earnings of associates and jointventures (Note 14) 8,176,526,116 7,311,563,176 7,247,680,555
Dividend income (Note 28) 2,031,580,194 2,848,193,719 5,073,575,341Supplementary businesses 551,082,564 558,258,619 461,461,847
240,503,119,237 229,271,653,013 184,812,330,245
COST OF SALES AND SERVICESCost of sales (Note 30) 98,124,103,023 97,621,663,241 69,530,185,316Cost of services (Note 30) 45,970,133,223 43,241,983,101 45,476,429,584
144,094,236,246 140,863,646,342 115,006,614,900
GROSS INCOME 96,408,882,991 88,408,006,671 69,805,715,345
OTHER OPERATING EXPENSESGeneral and administrative expenses (Note 31) 43,498,208,309 38,677,396,939 31,753,964,780Impairment losses and others (Note 34) 640,717,050 378,065,854 576,706,999
44,138,925,359 39,055,462,793 32,330,671,779
OPERATING INCOME 52,269,957,632 49,352,543,878 37,475,043,566
OTHER INCOME (LOSSES)Market valuation losses on impaired available-for-sale
investments (Note 10) (16,713,629,844) − −Financing costs and other charges (Note 35) (7,461,996,870) (6,879,818,419) (5,824,349,891)Foreign exchange losses (2,638,787,064) (4,136,883,267) (358,828,037)Market valuation gains (losses) on derivative financial
instruments - net (Note 8) 1,734,360,262 (2,353,076,578) (2,318,346,454)Finance income (Note 27) 1,161,245,053 1,367,392,486 1,347,723,538Market valuation losses on financial assets at fair value
through profit or loss - net (Note 9) (57,676,177) (336,987,727) (1,267,046,070)Others (Note 29) (487,955,842) 151,214,790 1,219,853,247
INCOME BEFORE INCOME TAX 27,805,517,150 37,164,385,163 30,274,049,899
PROVISION FOR INCOME TAX (Note 38) 5,437,906,633 4,488,982,473 4,449,245,289
NET INCOME 22,367,610,517 32,675,402,690 25,824,804,610
(Forward)

*SGVFS023363*
- 2 -
Years Ended December 312016 2015 2014
OTHER COMPREHENSIVE INCOME (LOSS),NET OF TAX (Note 36)
Items that may be reclassified subsequentlyto profit or loss:Net gains (losses) on available-for-sale investments (Note 10) P=4,377,880,289 (P=14,932,125,338) P=4,381,664,494Cumulative translation adjustments (121,183,868) 1,771,511,627 45,527,477Share in net unrealized losses on available-for-sale investments of an associate (Notes 10 and 14) (104,703,835) (1,730,644) (1,326,352)Net losses from cash flow hedges (Note 8) (18,062,625) (91,909,256) (42,581,991)
Items that will not be reclassified to profit or loss:Remeasurements of the net defined benefit liability (Note 37) 52,474,724 (123,037,866) 193,076,661Share in remeasurements of the net defined benefit liability of associates (Note 14) 524,522,485 − −
4,710,927,170 (13,377,291,477) 4,576,360,289
TOTAL COMPREHENSIVE INCOME P=27,078,537,687 P=19,298,111,213 P=30,401,164,899
NET INCOME ATTRIBUTABLE TOEquity holders of the Parent Company P=10,917,978,925 P=22,610,016,306 P=18,245,149,790Non-controlling interests (Note 25) 11,449,631,592 10,065,386,384 7,579,654,820
P=22,367,610,517 P=32,675,402,690 P=25,824,804,610
TOTAL COMPREHENSIVE INCOME ATTRIBUTABLE TOEquity holders of the Parent Company P=15,861,889,256 P=8,589,518,427 P=22,611,782,184Non-controlling interests (Note 25) 11,216,648,431 10,708,592,786 7,789,382,715
P=27,078,537,687 P=19,298,111,213 P=30,401,164,899
Earnings Per Share Attributable to Equity Holdersof the Parent Company (Note 39)
Basic/diluted earnings per share P=1.52 P=3.16 P=2.60
See accompanying Notes to Consolidated Financial Statements.

*SGVFS023363*
JG SUMMIT HOLDINGS, INC. AND SUBSIDIARIESCONSOLIDATED STATEMENTS OF CHANGES IN EQUITY
For the Years Ended December 31, 2016, 2015 and 2014ATTRIBUTABLE TO EQUITY HOLDERS OF THE PARENT COMPANY
Paid-up Capital (Note 25) Retained Earnings (Note 25) Other Comprehensive Income (Note 36)
CapitalStock
AdditionalPaid-inCapital
TotalPaid-upCapital
UnrestrictedRetainedEarnings
RestrictedRetainedEarnings
TotalRetainedEarnings
EquityReserve(Note 25)
CumulativeTranslation
Adjustments(Note 25)
Net UnrealizedGains on
Available-for-Sale
Investments(Note 10)
Net UnrealizedLosses on Cash
Flow Hedge(Note 8)
Remeasurementsof the Net Defined
Benefit Liability(Note 37)
TotalOther
ComprehensiveIncome (Loss) Total
NON-CONTROLLING
INTERESTS(Note 25)
TOTALEQUITY
Balance at January 1, 2016 P=7,202,841,657 P=23,553,025,157 P=30,755,866,814 P=67,567,817,285 P=103,684,329,399 P=171,252,146,684 P=27,575,017,926 (P=702,845,286) (P=4,984,560,896) P=37,358,957 (P=542,454,606) (P=6,192,501,831) P=223,390,529,593 P=63,935,131,765 P=287,325,661,358Total comprehensive income − − − 10,917,978,925 − 10,917,978,925 − 29,518,399 4,388,336,217 (26,697,367) 552,753,082 4,943,910,331 15,861,889,256 11,216,648,431 27,078,537,687Appropriation of retained earnings − − − (10,400,000,000) 10,400,000,000 − − − − − − − − − −Cash dividends (Note 25) − − − (1,800,710,414) − (1,800,710,414) − − − − − − (1,800,710,414) (4,175,979,077) (5,976,689,491)Reissuance of a subsidiary’s treasury
shares − − − − − − 2,063,813,410 − − − − − 2,063,813,410 2,292,532,237 4,356,345,647
Balance at December 31, 2016 P=7,202,841,657 P=23,553,025,157 P=30,755,866,814 P=66,285,085,796 P=114,084,329,399 P=180,369,415,195 P=29,638,831,336 (P=673,326,887) (P=596,224,679) P=10,661,590 P=10,298,476 (P=1,248,591,500) P=239,515,521,845 P=73,268,333,356 P=312,783,855,201
Balance at January 1, 2015 P=7,057,191,657 P=14,958,145,993 P=22,015,337,650 P=52,166,426,144 P=98,060,329,399 P=150,226,755,543 P=27,546,248,095 (P=1,708,290,084) P=9,855,437,008 P=127,905,653 (P=447,056,529) P=7,827,996,048 P=207,616,337,336 P=53,994,117,270 P=261,610,454,606Total comprehensive income − − − 22,610,016,306 − 22,610,016,306 − 1,005,444,798 (14,839,997,904) (90,546,696) (95,398,077) (14,020,497,879) 8,589,518,427 10,708,592,786 19,298,111,213Reversal of appropriation − − − 41,376,000,000 (41,376,000,000) − − − − − − − − − −Appropriation of retained earnings − − − (47,000,000,000) 47,000,000,000 − − − − − − − − − −Cash dividends (Note 25) − − − (1,584,625,165) − (1,584,625,165) 28,769,831 − − − − − (1,555,855,334) (3,922,800,371) (5,478,655,705)Deposit for future subscription by non-
controlling in a subsidiary − − − − − − − − − − − − − 3,155,222,080 3,155,222,080Issuance of new shares through top-up
transaction 145,650,000 8,594,879,164 8,740,529,164 − − − − − − − − − 8,740,529,164 − 8,740,529,164
Balance at December 31, 2015 P=7,202,841,657 P=23,553,025,157 P=30,755,866,814 P=67,567,817,285 P=103,684,329,399 P=171,252,146,684 P=27,575,017,926 (P=702,845,286) (P=4,984,560,896) P=37,358,957 (P=542,454,606) (P=6,192,501,831) P=223,390,529,593 P=63,935,131,765 P=287,325,661,358See accompanying Notes to Consolidated Financial Statements.

*SGVFS023363*
- 2 -
For the Years Ended December 31, 2016, 2015 and 2014ATTRIBUTABLE TO EQUITY HOLDERS OF THE PARENT COMPANY
Paid-up Capital (Note 25) Retained Earnings (Note 25) Other Comprehensive Income (Note 36)
CapitalStock
AdditionalPaid-inCapital
TotalPaid-upCapital
UnrestrictedRetainedEarnings
RestrictedRetainedEarnings
TotalRetainedEarnings
EquityReserve(Note 25)
CumulativeTranslation
Adjustments(Note 25)
Net UnrealizedGains on
Available-for-Sale
Investments(Note 10)
Net UnrealizedLosses on Cash
Flow Hedge(Note 8)
Remeasurementsof the Net Defined
Benefit Liability(Note 37)
TotalOther
ComprehensiveIncome (Loss) Total
NON-CONTROLLING
INTERESTS(Note 25)
TOTALEQUITY
Balance at January 1, 2014 P=7,057,191,657 P=14,958,145,993 P=22,015,337,650 P=74,332,714,685 P=59,060,329,399 P=133,393,044,084 P=27,306,459,166 (P=1,735,149,871) P=5,617,663,796 P=171,850,204 (P=593,000,475) P=3,461,363,654 P=186,176,204,554 P=49,690,842,347 P=235,867,046,901Total comprehensive income − − − 18,245,149,790 − 18,245,149,790 − 26,859,787 4,237,773,212 (43,944,551) 145,943,946 4,366,632,394 22,611,782,184 7,789,382,715 30,401,164,899Appropriation of retained earnings − − − (39,000,000,000) 39,000,000,000 − − − − − − − − − −Cash dividends (Note 25) − − − (1,411,438,331) − (1,411,438,331) − − − − − − (1,411,438,331) (3,752,970,864) (5,164,409,195)Sale of equity share in a subsidiary
(Note 25) − − − − − − 239,788,929 − − − − − 239,788,929 266,863,072 506,652,001Balance at December 31, 2014 P=7,057,191,657 P=14,958,145,993 P=22,015,337,650 P=52,166,426,144 P=98,060,329,399 P=150,226,755,543 P=27,546,248,095 (P=1,708,290,084) P=9,855,437,008 P=127,905,653 (P=447,056,529) P=7,827,996,048 P=207,616,337,336 P=53,994,117,270 P=261,610,454,606

*SGVFS023363*
JG SUMMIT HOLDINGS, INC. AND SUBSIDIARIESCONSOLIDATED STATEMENTS OF CASH FLOWS
Years Ended December 312016 2015 2014
CASH FLOWS FROM OPERATING ACTIVITIESIncome before income tax P=27,805,517,150 P=37,164,385,163 P=30,274,049,899Adjustments for:
Depreciation and amortization (Notes 15,16, 18 and 46) 17,001,769,646 14,439,766,645 11,759,608,063
Market valuation loss on impairedAFS investments (Note 10) 16,713,629,844 − −
Equity in net earnings of associates and jointventures (Note 14) (8,176,526,116) (7,311,563,176) (7,247,680,555)
Interest expense (Note 35) 7,298,442,812 6,682,291,317 5,713,260,142Unrealized foreign exchange losses 2,638,787,064 4,136,883,267 358,828,037Dividend income (Note 28) (2,031,580,194) (2,848,193,719) (5,073,575,341)Market valuation losses (gains) losses on derivative
financial instruments - net (Note 8) (1,734,360,262) 2,353,076,578 2,318,346,454Interest income (Note 27) (1,161,245,053) (1,367,392,486) (1,347,723,538)Provision for impairment losses (Note 34) 465,267,131 273,862,988 472,410,245Loss on sale and retirement of property, plant and
equipment and investment properties (Note 16) 354,454,270 19,535,061 9,818,199Inventory obsolescence and market decline (Note 34) 175,449,919 104,202,866 104,296,754Loss (gain) arising from changes in fair value
less estimated costs to sell of swine stocks (Note 17) 95,596,818 56,958,991 (257,939,646)Market valuation losses on financial assets at fair value
through profit or loss (Note 9) 57,676,177 336,987,727 1,267,046,070Loss on sale of available-for-sale investments
(Note 29) (452,510) (898,183) (17,431)Operating income before changes in working
capital accounts 59,502,426,696 54,039,903,039 38,350,727,352Changes in operating assets and liabilities:
Decrease (increase) in the amounts of:Receivables (13,115,882,483) (9,251,528,725) (6,404,735,713)Inventories (2,691,296,655) (3,250,107,168) (12,461,010,274)Other current assets (2,049,042,735) (252,800,726) (2,474,583,582)Financial assets at fair value through profit or loss 795,718,122 756,867,119 (869,167,368)Derivative assets (598,570,188) (1,734,020,356) (461,446,820)Biological assets 78,818,880 96,258,718 22,826,546
Increase in the amounts of:Accounts payable and accrued expenses 22,756,800,392 1,087,455,571 2,722,368,665Unearned revenue 1,169,998,030 598,009,957 1,034,827,504Other current liabilities 324,910,308 1,234,297,685 775,830,092
Net cash generated from operations 66,173,880,367 43,324,335,114 20,235,636,402Interest paid (7,220,832,524) (6,502,237,413) (5,117,793,186)Income taxes paid (5,946,033,406) (3,884,619,696) (2,721,618,132)Interest received 1,064,803,275 1,289,340,637 1,253,297,811Net cash provided by operating activities 54,071,817,712 34,226,818,642 13,649,522,895
(Forward)

*SGVFS023363*
- 2 -
Years Ended December 312016 2015 2014
CASH FLOWS FROM INVESTING ACTIVITIESAcquisitions of:
Property, plant and equipment (Notes 16 and 46) (P=29,440,474,778) (P=25,776,311,061)(P=29,952,370,352)Subsidiaries, net of cash acquired (Note 44) (21,159,258,285) − (7,318,018,302)Available-for-sale investments (Note 10) (15,080,087,313) (6,941,384,431) (3,117,499,789)Investments in associates and joint ventures (Note 14) (12,152,533,446) (129,000,000) (31,944,758,295)Investment properties (Notes 15 and 46) (11,088,963,635) (13,252,323,663) (8,026,565,946)Assets that qualified as a business (Note 44) (1,600,000,000) − −Held-to-maturity investments (Note 10) (800,605,001) (980,692,134) (1,693,603,469)Intangible assets (Note 18) (599,648,596) (44,928,168) (2,200,000)
Dividends received on investments in associates and jointventures (Note 14) 7,807,440,452 4,803,897,297 3,912,840,136
Dividends received (Note 28) 2,031,580,194 2,848,193,719 5,073,575,341Decrease (increase) in the amounts of other noncurrent
assets (Note 20) (625,863,649) (1,643,557,430) 485,408,173Return of investment from an associate (Note 14) − 5,000,000 45,000,000Proceeds from sale of:
Available-for-sale investments 11,600,295,195 6,695,561,770 2,232,595,649Property, plant and equipment (Note 16) 3,214,497,371 1,082,315,799 39,097,309Investment property 33,610,500 − −
Net cash used in investing activities (67,860,010,991) (33,333,228,302) (70,266,499,545)
CASH FLOWS FROM FINANCING ACTIVITIESProceeds from issuance of:
Short-term debts 91,462,362,171 67,004,746,707 61,850,234,052Long-term debts 38,600,364,183 18,466,895,200 75,131,100,310
Proceeds from reissuance of a subsidiary's treasury shares,net of transaction costs (Note 25) 4,356,345,647 − −
Dividends paid to non-controlling interests (Note 25) (4,175,979,077) (3,922,800,371) (3,752,970,864)Increase (decrease) in other noncurrent liabilities (Note 24) 318,729,350 4,034,036,837 (152,634,504)Settlements of:
Short-term debts (65,536,414,360) (76,793,118,937) (52,903,152,436)Long-term debts (Note 23) (51,298,471,026) (12,197,009,305) (23,808,407,948)
Dividends paid on:Common shares (Note 25) (1,790,710,414) (1,575,825,165) (1,403,438,331)Preferred shares (Note 25) (10,000,000) (8,800,000) (8,000,000)
Proceeds from issuance of new shares and reissuance oftreasury shares through top-up placement transaction(Note 25) − 8,740,529,164 −
Cash received from non-controlling interest for issuance ofshares by a subsidiary − 3,155,222,080 −
Net proceeds from partial disposal of interest in asubsidiary (Note 25) − − 506,652,001
Net cash provided by financing activities 11,926,226,474 6,903,876,210 55,459,382,280
NET INCREASE (DECREASE) IN CASHAND CASH EQUIVALENTS (1,861,966,805) 7,797,466,550 (1,157,594,370)
CASH AND CASH EQUIVALENTS ATBEGINNING OF YEAR 45,272,108,772 37,474,642,222 38,632,236,592
CASH AND CASH EQUIVALENTS ATEND OF YEAR (Note 7) P=43,410,141,967 P=45,272,108,772 P=37,474,642,222
See accompanying Notes to Consolidated Financial Statements.
*SGVFS023363*
JG SUMMIT HOLDINGS, INC. AND SUBSIDIARIESNOTES TO CONSOLIDATED FINANCIAL STATEMENTS
1. Corporate Information
JG Summit Holdings, Inc. (the Parent Company) was incorporated in the Philippines onNovember 23, 1990. On May 8, 2014, the Board of Directors (BOD) of the Parent Companyapproved its amendment of Article Third of the Amended Articles of Incorporation to change theprincipal office address of the Parent Company from “Metro Manila, Philippines” to “43rd Floor,Robinsons-Equitable Tower, ADB Avenue corner Poveda Road, Pasig City” in accordance withSecurity and Exchange Commission Memorandum Circular No.6, Series of 2014.
The Parent Company, a holding company, is the ultimate parent of the JG Summit Group (theGroup). The Group has business interests in branded consumer foods, agro-industrial andcommodity food products, real property development, hotels, banking and financial services,telecommunications, petrochemicals, air transportation and power distribution.
The Group conducts business throughout the Philippines, but primarily in and around MetroManila where it is based. The Group also has branded food businesses in the People’s Republic ofChina, in the Association of Southeast Asian Nations region, New Zealand and Australia and aninterest in a property development business in Singapore.
The principal activities of the Group are further described in Note 6, Segment Information, to theconsolidated financial statements.
2. Summary of Significant Accounting Policies
Basis of PreparationThe accompanying consolidated financial statements of the Group have been prepared on ahistorical cost basis, except for financial assets at fair value through profit or loss (FVPL),available-for-sale (AFS) investments and derivative financial instruments that are measured at fairvalue, and certain biological assets and agricultural produce that are measured at fair value lessestimated costs to sell.
The consolidated financial statements of the Group are presented in Philippine peso (P=), thefunctional currency of the Parent Company. All values are rounded to the nearest peso exceptwhen otherwise stated.
Except for certain foreign subsidiaries of the Parent Company and for certain consolidated foreignsubsidiaries within Universal Robina Corporation (URC) and Subsidiaries (URC Group) whichare disclosed below, the functional currency of other consolidated foreign subsidiaries is US dollar(USD).
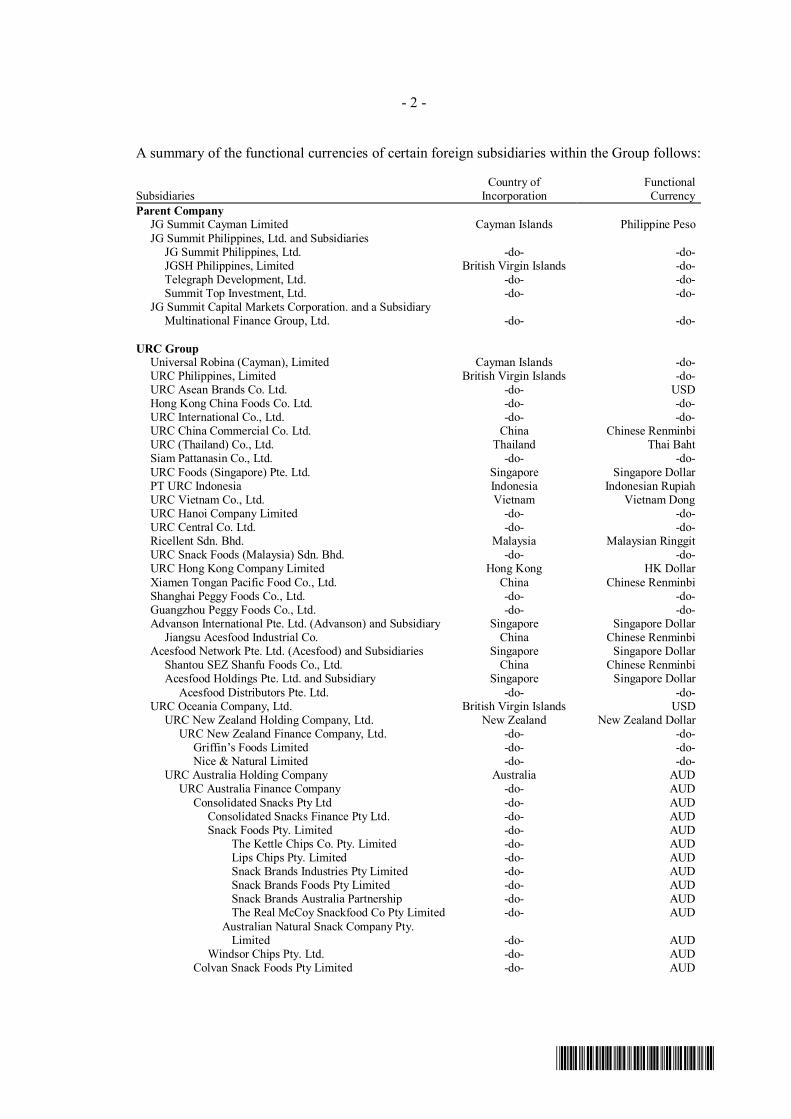
- 2 -
*SGVFS023363*
A summary of the functional currencies of certain foreign subsidiaries within the Group follows:
SubsidiariesCountry of
IncorporationFunctional
CurrencyParent Company JG Summit Cayman Limited Cayman Islands Philippine Peso
JG Summit Philippines, Ltd. and Subsidiaries JG Summit Philippines, Ltd. -do- -do- JGSH Philippines, Limited British Virgin Islands -do- Telegraph Development, Ltd. -do- -do- Summit Top Investment, Ltd. -do- -do-
JG Summit Capital Markets Corporation. and a Subsidiary Multinational Finance Group, Ltd. -do- -do-
URC Group Universal Robina (Cayman), Limited Cayman Islands -do- URC Philippines, Limited British Virgin Islands -do- URC Asean Brands Co. Ltd. -do- USD Hong Kong China Foods Co. Ltd. -do- -do- URC International Co., Ltd. -do- -do- URC China Commercial Co. Ltd. China Chinese Renminbi URC (Thailand) Co., Ltd. Thailand Thai Baht Siam Pattanasin Co., Ltd. -do- -do- URC Foods (Singapore) Pte. Ltd. Singapore Singapore Dollar PT URC Indonesia Indonesia Indonesian Rupiah URC Vietnam Co., Ltd. Vietnam Vietnam Dong
URC Hanoi Company Limited -do- -do-URC Central Co. Ltd. -do- -do-
Ricellent Sdn. Bhd. Malaysia Malaysian Ringgit URC Snack Foods (Malaysia) Sdn. Bhd. -do- -do- URC Hong Kong Company Limited Hong Kong HK Dollar Xiamen Tongan Pacific Food Co., Ltd. China Chinese Renminbi Shanghai Peggy Foods Co., Ltd. -do- -do- Guangzhou Peggy Foods Co., Ltd. -do- -do- Advanson International Pte. Ltd. (Advanson) and Subsidiary Singapore Singapore Dollar Jiangsu Acesfood Industrial Co. China Chinese Renminbi Acesfood Network Pte. Ltd. (Acesfood) and Subsidiaries Singapore Singapore Dollar Shantou SEZ Shanfu Foods Co., Ltd. China Chinese Renminbi Acesfood Holdings Pte. Ltd. and Subsidiary Singapore Singapore Dollar Acesfood Distributors Pte. Ltd. -do- -do- URC Oceania Company, Ltd. British Virgin Islands USD URC New Zealand Holding Company, Ltd. New Zealand New Zealand Dollar URC New Zealand Finance Company, Ltd. -do- -do- Griffin’s Foods Limited -do- -do- Nice & Natural Limited -do- -do- URC Australia Holding Company Australia AUD URC Australia Finance Company -do- AUD Consolidated Snacks Pty Ltd -do- AUD Consolidated Snacks Finance Pty Ltd. -do- AUD Snack Foods Pty. Limited -do- AUD The Kettle Chips Co. Pty. Limited -do- AUD Lips Chips Pty. Limited -do- AUD Snack Brands Industries Pty Limited -do- AUD Snack Brands Foods Pty Limited -do- AUD Snack Brands Australia Partnership -do- AUD The Real McCoy Snackfood Co Pty Limited -do- AUD Australian Natural Snack Company Pty.
Limited -do- AUD Windsor Chips Pty. Ltd. -do- AUD Colvan Snack Foods Pty Limited -do- AUD

- 3 -
*SGVFS023363*
SubsidiariesCountry of
IncorporationFunctional
CurrencyRLC Group Robinsons (Cayman) Limited Cayman Islands USD
RLC Resources Ltd British Virgin Islands USD Land Century Holdings, Ltd. Hong Kong HKD World Century Enterprise Ltd. Hong Kong HKD First Capital Development, Ltd Hong Kong HKD Chengdu Xin Yao Real Estate Development, Co.
LtdChina
RMB
Statement of ComplianceThe consolidated financial statements of the Group have been prepared in compliance withPhilippine Financial Reporting Standards (PFRS).

- 4 -
*SGVFS023363*
Basis of ConsolidationThe consolidated financial statements include the financial statements of the Parent Company and the following wholly and majority owned subsidiaries:
Country ofEffective Percentage
of OwnershipSubsidiaries Incorporation Principal place of business 2016 2015FoodUniversal Robina Corporation (URC) and Subsidiaries Philippines* 110 E. Rodriguez Avenue, Bagumbayan, Quezon City, Philippines 55.25 55.83
CFC Clubhouse Property, Inc. (CCPI). -do- CFC Bldg., E. Rodriguez Jr. Ave., Bagong Ilog, Pasig City 55.25 55.83CFC Corporation -do- -do- 55.25 55.83Bio-Resource Power Generation Corporation -do- Manjuyod, Negros Oriental 55.25 55.83Nissin-URC -do- CFC Bldg., E. Rodriguez Jr. Ave., Bagong Ilog, Pasig City 28.17** 28.47**URC Philippines, Limited (URCPL) British
Virgin IslandsOffshore Incorporations Limited, P.O. Box 957 Offshore Incorporations Centre, Road Town, Tortola, BritishVirgin Islands 55.25 55.83
URC International Co. Ltd. (URCICL) andSubsidiaries
-do- -do-55.25 55.83
Universal Robina (Cayman), Ltd. (URCL) Cayman Islands Maples and Calder, P.O. Box 309, Ugland House, South Church Street, Grand Cayman, Cayman Islands,British West Indies 55.25 55.83
URC China Commercial Co., Ltd. China 318 Shangcheng Road, Room 1417 Lian You Bldg., Pudong, Shanghai, China 55.25 55.83Air TransportationCP Air Holdings, Inc. (CPAHI) and Subsidiaries Philippines 2nd Floor, Doña Juanita Marquez Lim Building, Osmeña Boulevard, Cebu City 100.00 100.00
Cebu Air, Inc. (CAI) and Subsidiaries -do- -do- 67.23 67.23Real Estate and HotelsRobinsons Land Corporation (RLC) and Subsidiaries Philippines 43rd Floor, Robinsons Equitable Tower, ADB Avenue, Ortigas Center, Pasig City 60.97 60.97
Robinson’s Inn, Inc. -do- -do- 60.97 60.97Robinsons Realty and Management Corporation -do- 43rd Floor, Robinsons Equitable Tower, ADB Avenue, Ortigas Center, Pasig City 60.97 60.97Robinsons (Cayman) Limited Cayman Islands Maples and Calder, P.O. Box 309, Ugland House, South Church Street, Grand Cayman, Cayman Islands 60.97 60.97Robinsons Properties Marketing and Management
CorporationPhilippines 43rd Floor, Robinsons Equitable Tower, ADB Avenue, Artigas Center, Pasig City
60.97 60.97Manhattan Buildings and Management Corp -do- 43rd Floor, Robinsons Equitable Tower, ADB Avenue, Artigas Center, Pasig City 60.97 60.97
Altus Angeles, Inc. -do- McArthur Highway, Balisage, Angeles City, Pampanga 31.09** 31.09**Altus San Nicolas Corporation -do- Bogy. 1 San Francisco, San Nicolas, I locos Norte 60.97 60.97Go Hotels Davao, Inc. -do- Lanang, Davao City 31.09** 31.09**Lingkod Pinoy Bus Liner, Inc. -do- 48.78 48.78RLC Resources Ltd British Virgin Islands British Virgin Islands 60.97 60.97
(Forward)

-5 -
*SGVFS023363*
Country ofEffective Percentage
of OwnershipSubsidiaries Incorporation Principal place of business 2016 2015
Land Century Holdings, Ltd. Hong Kong 60.97 60.97World Century Enterprise Ltd. Hong Kong 60.97 60.97Kingdom Pacific Ltd. (Kingdom Pacific) Hong Kong − 60.97Crown Harbour Holdings Ltd. (Crown
Harbour)Hong Kong
− 60.97First Capital Development, Ltd Hong Kong 60.97 60.97 Chengdu Xin Yao Real Estate Development
Co. Ltd.China
60.97 60.97PetrochemicalsJG Summit Petrochemical Corporation (JGSPC) Philippines Ground Floor, Cybergate Tower 1, EDSA corner, Pioneer Street, Mandaluyong City 100.00 100.00JG Summit Olefins Corporation (JGSOC) -do- 43rd Floor, Robinsons Equitable Tower, ADB Avenue, Ortigas Center, Pasig City 100.00 100.00BankingRobinsons Bank Corporation (RBC) and a Subsidiary -do- 17th floor, Galleria Corporate Center EDSA corner Ortigas Avenue, Quezon City 60.00 60.00
Legazpi Savings Bank, Inc. (LSB) -do- Rizal Street, Barangay Sagpon, Albay, Legazpi City 60.00 60.00Supplementary BusinessesExpress Holdings, Inc. (EHI) and a Subsidiary -do- 29th Floor, Galleria Corporate Center, EDSA, Quezon City 100.00 100.00
Summit Forex Brokers Corporation -do- 41st Floor, Robinsons-Equitable Tower, ADB Avenue, Corner Poveda Road, Pasig City 100.00 100.00JG Summit Capital Services Corp. (JGSCSC)
and Subsidiaries-do- 40th Floor, Robinsons-Equitable Tower, ADB Avenue corner Poveda Road, Ortigas Center, Pasig City
100.00 100.00JG Summit Capital Markets Corporation (JGSMC) -do- -do- 100.00 100.00Summit Point Services Ltd. -do- -do- 100.00 100.00Summit Internet Investments, Inc. -do- -do- 100.00 100.00
JG Summit Cayman, Ltd. (JGSCL) Cayman Islands Maples and Calder, P.O. Box 309, Ugland House, South Church Street, Grand Cayman, Cayman Islands 100.00 100.00JG Summit Philippines Ltd. (JGSPL) and Subsidiaries -do- -do- 100.00 100.00
JGSH Philippines, Limited BritishVirgin Islands
Offshore Incorporations Limited, P.O. Box 957 Offshore Incorporations Centre, Road Town, Tortola, BritishVirgin Islands 100.00 100.00
Multinational Finance Group, Ltd. -do- -do- 100.00 100.00Telegraph Development, Ltd. -do- -do- 100.00 100.00Summit Top Investment, Ltd. -do- -do- 100.00 100.00
JG Summit Limited (JGSL) -do- -do- − −Unicon Insurance Brokers Corporation (UIBC) Philippines CFC Bldg., E. Rodriguez Avenue, Bagong Ilog, Pasig City 100.00 100.00Batangas Agro-Industrial Development
Corporation (BAID) and Subsidiaries-do- 5th Floor Citibank Center, Makati
100.00 100.00Fruits of the East, Inc. -do- Citibank Center, Paseo de Roxas, Makati 100.00 100.00Hometel Integrated Management Corporation -do- -do- 100.00 100.00King Leader Philippines, Inc. -do- 5th Floor Citibank Center, Makati 100.00 100.00
(Forward)

-6 -
*SGVFS023363*
Country ofEffective Percentage
of OwnershipSubsidiaries Incorporation Principal place of business 2016 2015
Samar Commodities Trading and IndustrialCorporation
-do- -do-100.00 100.00
Tropical Aqua Resources -do- -do- 100.00 100.00United Philippines Oil Trading, Inc. -do- -do- 100.00 100.00
* Certain subsidiaries are located in other countries, such as China, Malaysia, Singapore, Thailand, Vietnam, etc.** These are majority-owned subsidiaries of the Parent Company’s directly-owned subsidiaries.

- 7 -
*SGVFS023363*
The Group controls an investee if and only if the Group has:
∂ Power over the investee (i.e., existing rights that give it the current ability to direct therelevant activities of the investee);
∂ Exposure, or rights, to variable returns from its involvement with the investee; and∂ The ability to use its power over the investee to affect its returns.
When the Group has less than a majority of the voting or similar rights of an investee, the Groupconsiders all relevant facts and circumstances in assessing whether it has power over an investee,including:
∂ The contractual arrangement with the other vote holders of the investee;∂ Rights arising from other contractual arrangements; and∂ The Group’s voting rights and potential voting rights.
The Group re-assesses whether or not it controls an investee if facts and circumstances indicatethat there are changes to one or more of the three elements of control. Consolidation of asubsidiary begins when the Group obtains control over the subsidiary and ceases when the Grouploses control of the subsidiary. Assets, liabilities, income and expenses of a subsidiary acquired ordisposed of during the year are included in the statement of comprehensive income from the datethe Group gains control until the date the Group ceases to control the subsidiary.
PFRS 10, prescribes guidance on the consolidation of SPE. Under PFRS 10, special purposeentities (SPE) should be consolidated when the substance of the relationship between the companyand the SPE indicates that the SPE is controlled by the company. Control over an entity may existwhen one entity is exposed, or has the rights to variable returns from its involvement with the SPEand has the ability to affect those returns through its power over the SPE. In accordance withPFRS 10, the Group’s consolidated financial statements include the accounts of SPEs namely:Surigao Leasing Limited (SLL), Cebu Aircraft Leasing Limited (CALL), IBON Leasing Limited(ILL), Boracay Leasing Limited (BLL), Sharp Aircraft Leasing Limited (SALL), Vector AircraftLeasing Limited (VALL), Panatag One Aircraft Leasing Limited (POALL), Panatag Two AircraftLeasing Limited (PTALL), Panatag Three Aircraft Leasing Limited (PTHALL), Summit AAircraft Leasing Limited (SAALL), Summit B Aircraft Leasing Limited (SBALL), and Summit CAircraft Leasing Limited (SCALL). SLL, CALL, ILL, BLL, SALL, VALL, POALL, PTALL,and PTHALL are SPEs in which the Group does not have equity interest. SLL, CALL, ILL, BLL,SALL, VALL, POALL, PTALL, PTHALL, SAALL, SBALL, and SCALL acquired the passengeraircrafts for lease to CAI under finance lease arrangements and funded the acquisitions throughlong-term debt.
Where necessary, adjustments are made to the financial statements of subsidiaries to bring theaccounting policies used in line with those used by the Group.
All intragroup transactions, balances, income and expenses are eliminated in the consolidation.
Non-controlling interests in the net assets of consolidated subsidiaries are identified separatelyfrom the Group’s equity therein. The interest of non-controlling shareholders may be initiallymeasured at fair value or at the non-controlling interest’s proportionate share of the acquiree’sidentifiable net assets. The choice of measurement basis is made on an acquisition-by-acquisitionbasis. Subsequent to acquisition, non-controlling interests consist of the amount attributed to suchinterests at initial recognition and the non-controlling interest’s share of changes in equity sincethe date of the combination.

-8 -
*SGVFS023363*
Changes in the Group’s interest in a subsidiary that do not result in a loss of control are accountedfor as equity transactions. Any difference between the amount by which the non-controllinginterests are adjusted and the fair value of the consideration paid or received is recognized directlyin equity and attributed to the Group.
If the Group loses control over a subsidiary, it:
∂ derecognizes the assets (including goodwill) and liabilities of the subsidiary;∂ derecognizes the carrying amount of any non-controlling interest;∂ derecognizes the related other comprehensive income recorded in equity and recycles the
same to profit or loss or retained earnings;∂ recognizes the fair value of the consideration received;∂ recognizes the fair value of any investment retained; and∂ recognizes any surplus or deficit in profit or loss in the consolidated statement of
comprehensive income.
Alignment of accounting periodsFollowing are the fiscal yearend subsidiaries within the Group:
Subsidiaries Fiscal YearFoodURC and Subsidiaries September 30Real Estate and HotelsRLC and Subsidiaries -do-
Management exercised judgment in determining whether adjustments should be made in theconsolidated financial statements of the Group pertaining to the effects of significant transactionsor events of the fiscal subsidiaries that occur between September 30 and the date of the ParentCompany’s financial statements.
Accordingly, the above-mentioned subsidiaries are consolidated using coterminous financialstatements (i.e., the subsidiary changed the end of its reporting period for purposes of theconsolidated financial statements).
Business CombinationsBusiness combinations are accounted for using the acquisition method. The cost of an acquisitionis measured at the aggregate of the fair values, at the date of exchange, of assets given, liabilitiesincurred or assumed, and equity instruments issued by the Group in exchange for control of theacquiree. Acquisition-related costs are recognized in profit or loss in the consolidated statement ofcomprehensive income as incurred.
Where appropriate, the cost of acquisition includes any asset or liability resulting from acontingent consideration arrangement, measured at its acquisition-date fair value. Subsequentchanges in such fair values are adjusted against the cost of acquisition where they qualify asmeasurement period adjustments. All other subsequent changes in the fair value of contingentconsideration classified as an asset or liability are accounted for in accordance with relevantPFRS. Changes in the fair value of contingent consideration classified as equity are notrecognized.
If the initial accounting for a business combination is incomplete by the end of the reportingperiod in which the combination occurs, the Group reports provisional amounts for the items for

-9 -
*SGVFS023363*
the accounting is incomplete. Those provisional amounts are adjusted during the measurementperiod, or additional assets or liabilities are recognized, to reflect new information obtained aboutfacts and circumstances that existed as of the acquisition date that if known, would have effectedthe amounts recognized as of that date. The measurement period is the period from the date ofacquisition to the date the Group receives complete information about facts and circumstances thatexisted as of the acquisition date and is subject to a maximum period of one year.
If the business combination is achieved in stages, the Group’s previously-held interests in theacquired entity are remeasured to fair value at the acquisition date (the date the Group attainscontrol) and the resulting gain or loss, if any, is recognized in profit or loss in the consolidatedstatement of comprehensive income. Amounts arising from interests in the acquiree prior to theacquisition date that have previously been recognized in other comprehensive income arereclassified to profit or loss in the consolidated statement of comprehensive income, where suchtreatment would be appropriate if that interest were disposed of.
GoodwillGoodwill arising on the acquisition of a subsidiary is recognized as an asset at the date the controlis acquired (the acquisition date). Goodwill is measured as the excess of the sum of theconsideration transferred, the amount of any non-controlling interest in the acquiree and the fairvalue of the acquirer’s previously-held interest, if any, in the entity over the net fair value of theidentifiable net assets recognized.
If after reassessment, the Group’s interest in the net fair value of the acquiree’s identifiable netassets exceeds the sum of consideration transferred, the amount of any non-controlling interest inthe acquiree and the fair value of the acquirer’s previously-held equity interest, if any, the excessis recognized immediately in profit or loss in the consolidated statement of comprehensive incomeas a bargain purchase gain.
Goodwill is not amortized, but is reviewed for impairment at least annually. Any impairment lossis recognized immediately in profit or loss and is not subsequently reversed.
On disposal of a subsidiary, the attributable amount of goodwill is included in the determination ofthe profit or loss on disposal.
Changes in Accounting Policies and DisclosuresThe Company applied for the first time certain pronouncements, which are effective for annualperiods beginning on or after January 1, 2016. Adoption of these pronouncements did not have asignificant impact on the Group’s financial position or performance unless otherwise indicated.
Amendments to PFRS 10, Consolidated Financial Statements, PFRS 12, Disclosure of Interests inOther Entities, and PAS 28, Investments in Associates and Joint Ventures, Investment Entities:Applying the Consolidation ExceptionThese amendments clarify that the exemption in PFRS 10 from presenting consolidated financialstatements applies to a parent entity that is a subsidiary of an investment entity that measures all ofits subsidiaries at fair value. They also clarify that only a subsidiary of an investment entity that isnot an investment entity itself and that provides support services to the investment entity parent isconsolidated. The amendments also allow an investor (that is not an investment entity and has aninvestment entity associate or joint venture) to retain the fair value measurement applied by theinvestment entity associate or joint venture to its interests in subsidiaries when applying the equitymethod.
-10 -
*SGVFS023363*
These amendments are not applicable to the Group since it does not have investment entityassociates or joint ventures.
Amendments to PFRS 11, Joint Arrangements, Accounting for Acquisitions of Interests in JointOperationsThe amendments to PFRS 11 require a joint operator that is accounting for the acquisition of aninterest in a joint operation, in which the activity of the joint operation constitutes a business (asdefined by PFRS 3), to apply the relevant PFRS 3 principles for business combinationsaccounting. The amendments also clarify that a previously held interest in a joint operation is notremeasured on the acquisition of an additional interest in the same joint operation while jointcontrol is retained. In addition, a scope exclusion has been added to PFRS 11 to specify that theamendments do not apply when the parties sharing joint control, including the reporting entity, areunder common control of the same ultimate controlling party.
The amendments apply to both the acquisition of the initial interest in a joint operation and theacquisition of any additional interests in the same joint operation.
These amendments do not have any impact on the Group as there has been no interest acquired ina joint operation during the period.
PFRS 14, Regulatory Deferral AccountsPFRS 14 is an optional standard that allows an entity, whose activities are subject to rate-regulation, to continue applying most of its existing accounting policies for regulatory deferralaccount balances upon its first-time adoption of PFRS. Entities that adopt PFRS 14 must presentthe regulatory deferral accounts as separate line items on the statement of financial position andpresent movements in these account balances as separate line items in the statement of income andother comprehensive income. The standard requires disclosures on the nature of, and risksassociated with, the entity’s rate-regulation and the effects of that rate-regulation on its financialstatements.
Since the Company is an existing PFRS preparer, this standard would not apply.
Amendments to PAS 1, Presentation of Financial Statements, Disclosure InitiativeThe amendments are intended to assist entities in applying judgment when meeting thepresentation and disclosure requirements in PFRS. They clarify the following:
∂ That entities shall not reduce the understandability of their financial statements by eitherobscuring material information with immaterial information; or aggregating material itemsthat have different natures or functions
∂ That specific line items in the statement of income and other comprehensive income and thestatement of financial position may be disaggregated
∂ That entities have flexibility as to the order in which they present the notes to financialstatements
∂ That the share of other comprehensive income of associates and joint ventures accounted forusing the equity method must be presented in aggregate as a single line item, and classifiedbetween those items that will or will not be subsequently reclassified to profit or loss.
These amendments do not have any impact to the Group.

-11 -
*SGVFS023363*
Amendments to PAS 16, Property, Plant and Equipment and PAS 38, Intangible Assets,Clarification of Acceptable Methods of Depreciation and AmortizationThe amendments clarify the principle in PAS 16 and PAS 38 that revenue reflects a pattern ofeconomic benefits that are generated from operating a business (of which the asset is part) ratherthan the economic benefits that are consumed through use of the asset. As a result, a revenue-based method cannot be used to depreciate property, plant and equipment and may only be used invery limited circumstances to amortize intangible assets.
These amendments are applied prospectively and do not have any impact to the Group, given thatthe Group has not used a revenue-based method to depreciate or amortize its property, plant andequipment and intangible assets.
Amendments to PAS 16 and PAS 41, Agriculture: Bearer PlantsThe amendments change the accounting requirements for biological assets that meet the definitionof bearer plants. Under the amendments, biological assets that meet the definition of bearer plantswill no longer be within the scope of PAS 41. Instead, PAS 16 will apply. After initial recognition,bearer plants will be measured under PAS 16 at accumulated cost (before maturity) and usingeither the cost model or revaluation model (after maturity). The amendments also require thatproduce that grows on bearer plants will remain in the scope of PAS 41 measured at fair value lesscosts to sell. For government grants related to bearer plants, PAS 20, Accounting for GovernmentGrants and Disclosure of Government Assistance, will apply.
The amendments are applied retrospectively and do not have any impact on the Group as theGroup does not have any bearer plants.
Amendments to PAS 27, Separate Financial Statements, Equity Method in Separate FinancialStatementsThe amendments allow entities to use the equity method to account for investments insubsidiaries, joint ventures and associates in their separate financial statements. Entities alreadyapplying PFRS and electing to change to the equity method in its separate financial statements willhave to apply that change retrospectively.
The Group opt to apply the cost method in its separate financial statements to account forinvestments in subsidiaries, joint ventures and associates.
Annual Improvements to PFRSs (2012 - 2014 Cycle)The Annual Improvements to PFRS (2012-2014 cycle) are effective for annual periods beginningon or after January 1, 2016 and are not expected to have a material impact on the Company, unlessotherwise stated. They include:
Amendment to PFRS 5, Non-current Assets Held for Sale and Discontinued Operations, Changesin Methods of DisposalThe amendment is applied prospectively and clarifies that changing from a disposal through saleto a disposal through distribution to owners and vice-versa should not be considered to be a newplan of disposal, rather it is a continuation of the original plan. There is, therefore, no interruptionof the application of the requirements in PFRS 5. The amendment also clarifies that changing thedisposal method does not change the date of classification. These amendments do not have anyimpact to the Group.
Amendment to PFRS 7, Financial Instruments: Disclosures, Servicing ContractsPFRS 7 requires an entity to provide disclosures for any continuing involvement in a transferredasset that is derecognized in its entirety. The amendment clarifies that a servicing contract that

-12 -
*SGVFS023363*
includes a fee can constitute continuing involvement in a financial asset. An entity must assess thenature of the fee and arrangement against the guidance for continuing involvement in PFRS 7 inorder to assess whether the disclosures are required. The amendment is to be applied such that theassessment of which servicing contracts constitute continuing involvement will need to be doneretrospectively. However, comparative disclosures are not required to be provided for any periodbeginning before the annual period in which the entity first applies the amendments. Theseamendments do not have any impact to the Group.
Amendment to PFRS 7, Applicability of the Amendments to PFRS 7 to Condensed InterimFinancial StatementsThis amendment is applied retrospectively and clarifies that the disclosures on offsetting offinancial assets and financial liabilities are not required in the condensed interim financial reportunless they provide a significant update to the information reported in the most recent annualreport. These amendments do not have any impact to the Group.
Amendment to PAS 19, Employee Benefits, Discount Rate: Regional Market IssueThis amendment is applied prospectively and clarifies that market depth of high quality corporatebonds is assessed based on the currency in which the obligation is denominated, rather than thecountry where the obligation is located. When there is no deep market for high quality corporatebonds in that currency, government bond rates must be used. These amendments do not have anyimpact to the Group.
Amendment to PAS 34, Interim Financial Reporting, Disclosure of Information ‘Elsewhere in theInterim Financial Report’The amendment is applied retrospectively and clarifies that the required interim disclosures musteither be in the interim financial statements or incorporated by cross-reference between the interimfinancial statements and wherever they are included within the greater interim financial report(e.g., in the management commentary or risk report). These amendments do not have any impactto the Group.
Significant Accounting Policies
Fair Value MeasurementFor measurement and disclosure purposes, the Group determines the fair value of an asset orliability at initial measurement or at each statement of financial position date. Fair value is theprice that would be received to sell an asset or paid to transfer a liability in an orderly transactionbetween market participants at the measurement date. The fair value measurement is based on thepresumption that the transaction to sell the asset or transfer the liability takes place either:
∂ In the principal market for the asset or liability, or∂ In the absence of a principal market, in the most advantageous market for the asset or liability
The principal or the most advantageous market must be accessible to by the Group.
The fair value of an asset or a liability is measured using the assumptions that market participantswould use when pricing the asset or liability, assuming that market participants act in theireconomic best interest.
A fair value measurement of a non-financial asset takes into account a market participant’s abilityto generate economic benefits by using the asset in its highest and best use or by selling it toanother market participant that would use the asset in its highest and best use.

-13 -
*SGVFS023363*
The Group uses valuation techniques that are appropriate in the circumstances and for whichsufficient data are available to measure fair value, maximizing the use of relevant observableinputs and minimizing the use of unobservable inputs.
Foreign Currency TranslationThe Group’s consolidated financial statements are presented in Philippine peso, which is also theParent Company’s functional currency. Each entity in the Group determines its own functionalcurrency and items included in the consolidated financial statements of each entity are measuredusing that functional currency.
Transactions and balancesTransactions in foreign currencies are initially recorded by the Group’s entities in their respectivefunctional currencies at the foreign exchange rates prevailing at the dates of the transactions.
Monetary assets and liabilities denominated in foreign currencies are translated using the closingforeign exchange rate prevailing at the reporting date. All differences are charged to profit or lossin the consolidated statement of comprehensive income.
Nonmonetary items that are measured in terms of historical cost in a foreign currency aretranslated using the exchange rate as at the dates of initial transactions. Nonmonetary itemsmeasured at fair value in a foreign currency are translated using the exchange rates at the datewhen the fair value was determined.
Group companiesAs of reporting date, the assets and liabilities of foreign subsidiaries, with functional currenciesother than the functional currency of the Parent Company, are translated into the presentationcurrency of the Group using the closing foreign exchange rate prevailing at the reporting date, andtheir respective income and expenses are translated at the monthly weighted average exchangerates for the year. The exchange differences arising on the translation are recognized in othercomprehensive income. On disposal of a foreign operation, the component of othercomprehensive income relating to that particular foreign operation shall be recognized in profit orloss.
Cash and Cash EquivalentsCash represents cash on hand and in banks. Cash equivalents are short-term, highly liquidinvestments that are readily convertible to known amounts of cash with original maturities of threemonths or less from the dates of placement, and that are subject to an insignificant risk of changesin value.
Recognition of Financial InstrumentsDate of recognitionFinancial instruments within the scope of PAS 39 are recognized in the consolidated statement offinancial position when the Group becomes a party to the contractual provisions of the instrument.Purchases or sales of financial assets that require delivery of assets within the time frameestablished by regulation or convention in the marketplace are recognized on the settlement date.Derivatives are recognized on a trade date basis.
Initial recognition of financial instrumentsFinancial instruments are recognized initially at fair value. Except for financial instrumentsdesignated as at FVPL, the initial measurement of financial assets includes transaction costs. TheGroup classifies its financial assets into the following categories: financial assets at FVPL, held-to-maturity (HTM) investments, AFS investments, loans and receivables, or as derivatives

-14 -
*SGVFS023363*
designated as a hedging instrument, in an effective hedge. The Group classifies its financialliabilities into financial liabilities at FVPL and other financial liabilities.
The classification depends on the purpose for which the investments were acquired and whetherthey are quoted in an active market. Management determines the classification of its investmentsat initial recognition and, where allowed and appropriate, re-evaluates such designation at everyreporting date.
‘Day 1’ differenceWhere the transaction price in a non-active market is different from the fair value based on otherobservable current market transactions in the same instrument or based on a valuation techniquewhose variables include only data from an observable market, the Group recognizes the differencebetween the transaction price and fair value (a ‘Day 1’ difference) in profit or loss unless itqualifies for recognition as some other type of asset. In cases where variables used are made ofdata which is not observable, the difference between the transaction price and model value is onlyrecognized in the profit of loss when the inputs become observable or when the instrument isderecognized. For each transaction, the Group determines the appropriate method of recognizingthe ‘Day 1’ difference amount.
Financial assets and financial liabilities at FVPLFinancial assets and financial liabilities at FVPL include financial assets and financial liabilitiesheld for trading purposes, derivative financial instruments or those designated upon initialrecognition at FVPL.
Financial assets and liabilities are classified as held for trading if they are acquired for the purposeof selling and repurchasing in the near term.
Derivatives are also classified under financial assets or liabilities at FVPL, unless they aredesignated as hedging instruments in an effective hedge.
Financial assets or liabilities may be designated by management on initial recognition as at FVPLwhen any of the following criteria are met:
∂ the designation eliminates or significantly reduces the inconsistent treatment that wouldotherwise arise from measuring the assets or liabilities or recognizing gains or losses on themon a different basis;
∂ the assets and liabilities are part of a group of financial assets, financial liabilities or bothwhich are managed and their performance are evaluated on a fair value basis, in accordancewith a documented risk management or investment strategy; orthe financial instrument contains an embedded derivative, unless the embedded derivativedoes not significantly modify the cash flows or it is clear, with little or no analysis, that itwould not be separately recorded.
Financial assets and financial liabilities at FVPL are recorded in the consolidated statement offinancial position at fair value. Changes in fair value are reflected in profit or loss under ‘Marketvaluation gain (loss) on financial assets at FVPL.’ Interest earned or incurred is recorded ininterest income or expense, respectively, while dividend income is recorded in other operatingincome according to the terms of the contract, or when the right to receive payment has beenestablished.

-15 -
*SGVFS023363*
Derivatives classified as FVPLThe Parent Company and certain subsidiaries are counterparties to derivative contracts, such asinterest rate swaps, currency forwards, cross currency swaps, currency options and commodityswaps and options. These derivatives are entered into as a means of reducing or managing theirrespective foreign exchange and interest rate exposures, as well as for trading purposes. Suchderivative financial instruments (including bifurcated embedded derivatives) are initially recordedat fair value on the date at which the derivative contract is entered into or bifurcated and aresubsequently remeasured at fair value. Any gains or losses arising from changes in fair values ofderivatives (except those accounted for as accounting hedges) are taken directly in profit or as‘Market valuation gain (loss) on derivative financial instruments.’ Derivatives are carried asassets when the fair value is positive and as liabilities when the fair value is negative.
The fair values of the Group’s derivative instruments are calculated by using certain standardvaluation methodologies and quotes obtained from third parties.
Derivatives designated as accounting hedgesFor the purpose of hedge accounting, hedges are classified primarily as either: (a) a hedge of thefair value of an asset, liability or a firm commitment (fair value hedge); (b) a hedge of theexposure to variability in cash flows attributable to an asset or liability or a forecasted transaction(cash flow hedge); or (c) a hedge of a net investment in a foreign operation (net investmenthedge). Hedge accounting is applied to derivatives designated as hedging instruments in a fairvalue, cash flow or net investment hedge provided certain criteria are met.
Hedge accountingAt the inception of a hedging relationship, the Group formally designates and documents thehedge relationship to which the Group wishes to apply hedge accounting and risk managementobjective and its strategy for undertaking the hedge. The documentation includes identification ofthe hedging instrument, the hedged item or transaction, the nature of the risk being hedged andhow the entity will assess the hedging instrument’s effectiveness in offsetting the exposure tochanges in the hedged item’s fair value or cash flows attributable to the hedged risk. Such hedgesare expected to be highly effective in achieving offsetting changes in fair value or cash flows andare assessed on an ongoing basis that they actually have been highly effective throughout thefinancial reporting periods for which they were designated.
Cash flow hedgeCash flow hedges are hedges of the exposure to variability in cash flows that are attributable to aparticular risk associated with a recognized asset, liability or a highly probable forecast transactionand could affect the profit or loss. The effective portion of changes in the fair value of derivativesthat are designated and qualified as cash flow hedges is recognized as ‘Net gains (losses) on cashflow hedges’ in other comprehensive income. Any gain or loss in fair value relating to anineffective portion is recognized immediately in profit or loss.
Amounts accumulated in other comprehensive income are recycled to profit or loss in the periodsin which the hedged item will affect profit or loss.
When a hedging instrument expires or is sold, or when a hedge no longer meets the criteria forhedge accounting, any cumulative gain or loss recognized in other comprehensive income iseventually recycled in profit or loss.

-16 -
*SGVFS023363*
Hedge effectiveness testingTo qualify for hedge accounting, the Group is required that at the inception of the hedge andthroughout its life, each hedge must be expected to be highly effective (prospective effectiveness),and demonstrate actual effectiveness (retrospective effectiveness) on an ongoing basis.
The documentation of each hedging relationship sets out how the effectiveness of the hedge isassessed. The method that the Group adopts for assessing hedge effectiveness will depend on itsrisk management strategy.
For prospective effectiveness, the hedging instrument must be expected to be highly effective inoffsetting changes in fair value or cash flows attributable to the hedged risk during the period forwhich the hedge is designated. The Group applies the dollar-offset method using hypotheticalderivatives in performing hedge effectiveness testing. For actual effectiveness to be achieved, thechanges in fair value or cash flows must offset each other in the range of 80 to 125 percent. Anyhedge ineffectiveness is recognized in profit or loss.
Embedded derivativesEmbedded derivatives are bifurcated from their host contracts, when the following conditions aremet: (a) the entire hybrid contracts (composed of both the host contract and the embeddedderivative) are not accounted for as financial assets at FVPL; (b) when their economic risks andcharacteristics are not closely related to those of their respective host contracts; and (c) a separateinstrument with the same terms as the embedded derivative would meet the definition of aderivative.
The Group assesses whether embedded derivatives are required to be separated from the hostcontracts when the Group first becomes a party to the contract. Reassessment of embeddedderivatives is only done when there are changes in the contract that significantly modifies thecontractual cash flows that would otherwise be required.
Current versus noncurrent classificationDerivative instruments that are not designated as effective hedging instruments are classified ascurrent or noncurrent or separated into a current and noncurrent portion based on an assessment ofthe facts and circumstances (i.e., the underlying contracted cash flows).
∂ Where the Group will hold a derivative as an economic hedge (and does not apply hedgeaccounting) for a period beyond 12 months after the reporting date, the derivative is classifiedas noncurrent (or separated into current and noncurrent portions) consistent with theclassification of the underlying item.
∂ Embedded derivatives that are not closely related to the host contract are classified consistentwith the cashflows of the host contract.
∂ Derivative instruments that are designated as, and are effective hedging instruments, areclassified consistently with the classification of the underlying hedged item. The derivativeinstrument is separated into a current portion and a noncurrent portion only if a reliableallocation can be made.
HTM investmentsHTM investments are quoted nonderivative financial assets with fixed or determinable paymentsand fixed maturities which the Group’s management has the positive intention and ability to holdto maturity. Where the Group sells other than an insignificant amount of HTM investments beforetheir maturity, the entire category would be tainted and reclassified as AFS investments. Oncetainted, the Group is not permitted to classify any of its financial assets as HTM investments forthe next two fiscal years after the year of reclassification.

-17 -
*SGVFS023363*
After initial measurement, these investments are subsequently measured at amortized cost usingthe effective interest method, less any impairment in value. Amortized cost is calculated by takinginto account any discount or premium on acquisition and fees that are an integral part of theeffective interest rate (EIR). Gains and losses are recognized in profit or loss when the HTMinvestments are derecognized and impaired, as well as through the amortization process. Theeffects of restatement of foreign currency-denominated HTM investments are recognized in profitor loss.
Loans and receivablesLoans and receivables are nonderivative financial assets with fixed or determinable payments andfixed maturities that are not quoted in an active market. They are not entered into with theintention of immediate or short-term resale and are not classified or designated as AFSinvestments or financial assets at FVPL. After initial measurement, loans and receivables aresubsequently carried at amortized cost using the effective interest method, less any allowance forimpairment. Amortized cost is calculated by taking into account any discount or premium onacquisition and includes fees that are an integral part of the EIR and transaction costs. Theamortization is included under ‘Interest income’ in profit or loss in the consolidated statement ofcomprehensive income. Gains and losses are recognized in profit or loss in the consolidatedstatement of comprehensive income when the loans and receivables are derecognized or impaired,as well as through the amortization process. Loans and receivables are classified as current assetsif maturity is within 12 months from the reporting date. Otherwise, these are classified asnoncurrent assets.
AFS investmentsAFS investments are those nonderivative investments which are designated as such or do notqualify to be classified as designated financial assets at FVPL, HTM investments or loans andreceivables. They are purchased and held indefinitely, and may be sold in response to liquidityrequirements or changes in market conditions.
After initial measurement, AFS investments are subsequently measured at fair value. Theeffective yield component of AFS debt securities, as well as the impact of restatement on foreigncurrency-denominated AFS debt securities, is reported in profit or loss. The unrealized gains andlosses arising from the fair valuation of AFS investments are excluded, net of tax, from profit orloss in the consolidated statement of comprehensive income and are reported under ‘Netunrealized gain (loss) on available-for-sale investments’ under other comprehensive income in theconsolidated statement of comprehensive income.
When the security is disposed of, the cumulative gain or loss previously recognized in othercomprehensive income is recognized in profit or loss in the consolidated statement ofcomprehensive income. Interest earned on holding AFS investments are reported as interestincome using the effective interest method. Where the Group holds more than one investment inthe same security, these are deemed to be disposed of on a first-in, first-out basis. Dividendsearned on holding AFS investments are recognized in profit or loss in the consolidated statementof comprehensive income when the right to receive payment has been established.
The losses arising from impairment of such investments are recognized under ‘Impairment lossesand others’ in the consolidated statement of comprehensive income.
Other financial liabilitiesIssued financial instruments or their components, which are not designated as at FVPL, areclassified as other financial liabilities where the substance of the contractual arrangement resultsin the Group having an obligation either to deliver cash or another financial asset to the holder, or
-18 -
*SGVFS023363*
to satisfy the obligation other than by exchange of a fixed amount of cash or another financialasset for a fixed number of own equity shares. The components of issued financial instrumentsthat contain both liability and equity elements are accounted for separately, with the equitycomponent being assigned with the residual amount, after deducting from the instrument as awhole the amount separately determined as the fair value of the liability component on the date ofissue.
After initial measurement, other financial liabilities are subsequently measured at amortized costusing the effective interest method. Amortized cost is calculated by taking into account anydiscount or premium on the issue and fees and debt issue costs that are an integral part of the EIR.Any effects of restatement of foreign currency-denominated liabilities are recognized in profit orloss.
This accounting policy applies primarily to the Group’s short-term and long-term debt, accountspayable and accrued expenses and other obligations that meet the above definition (other thanliabilities covered by other accounting standards, such as income tax payable and pensionliabilities).
Debt Issuance CostDebt issuance costs are amortized using the effective interest method and unamortized debtissuance costs are included in the measurement of the carrying value of the related loan in theconsolidated statement of financial position. When a loan is repaid, the related unamortized debtissuance costs at the date of repayment are charged against profit or loss.
Customers’ DepositsDeposits from lesseesDeposits from lessees are measured initially at fair value. After initial recognition, customers’deposits are subsequently measured at amortized cost using the effective interest method.
The difference between the cash received and its fair value is deferred (included in ‘Other currentor noncurrent liabilities’ in the consolidated statement of financial position) and amortized usingthe straight-line method.
Deposits from real estate buyersDeposits from real estate buyers represent mainly reservation fees and advance payments. Thesedeposits will be recognized as revenue in the consolidated statement of comprehensive income asthe related obligations are fulfilled to the real estate buyers. The deposits are recorded as‘Deposits from real estate buyers’ and reported under the ‘Other current or noncurrent liabilities’account in the consolidated statement of financial position.
Reclassification of Financial AssetsA financial asset is reclassified out of the financial assets at FVPL category when the followingconditions are met:
∂ the financial asset is no longer held for the purpose of selling or repurchasing it in the nearterm; and
∂ there is a rare circumstance.
The Group evaluates its AFS investments whether the ability and intention to sell them in the nearterm is still appropriate. When the Group is unable to trade these financial assets due to inactivemarkets and management’s intention to do so significantly changes in the foreseeable future, theGroup may elect to reclassify these financial assets in rare circumstances. Reclassification to
-19 -
*SGVFS023363*
loans and receivables is permitted when the financial assets meet the definition of loans andreceivables and the Group has the ability and intention to hold these assets for the foreseeablefuture or until maturity. Reclassification to the HTM category is permitted only when the entityhas the ability and intention to hold the financial asset to maturity.
For a financial asset reclassified out of the AFS category, any previous gain or loss on that assetthat has been recognized in equity is amortized to profit or loss over the remaining life of theinvestment using the effective interest method. Any difference between the new amortized costand the expected cash flows is also amortized over the remaining life of the asset using theeffective interest method. If the asset is subsequently determined to be impaired, then the amountrecorded in equity is reclassified to profit or loss.
Classification of Financial Instruments Between Debt and EquityA financial instrument is classified as debt, if it provides for a contractual obligation to:
∂ deliver cash or another financial asset to another entity; or∂ exchange financial assets or financial liabilities with another entity under conditions that are
potentially unfavorable to the Group; or∂ satisfy the obligation other than by exchange of a fixed amount of cash or another financial
asset for a fixed number of own equity shares.
If the Group does not have an unconditional right to avoid delivering cash or another financialasset to settle its contractual obligation, the obligation meets the definition of a financial liability.
The components of issued financial instruments that contain both liability and equity elements areaccounted for separately, with the equity component being assigned the residual amount, afterdeducting from the instrument as a whole the amount separately determined as the fair value of theliability component on the date of issue.
Impairment of Financial AssetsThe Group assesses at each reporting date whether there is objective evidence that a financial assetor group of financial assets is impaired. A financial asset or a group of financial assets is deemedto be impaired, if and only if, there is objective evidence of impairment as a result of one or moreevents that has occurred after the initial recognition of the asset (an incurred ‘loss event’) and thatloss event (or events) has an impact on the estimated future cash flows of the financial asset or thegroup of financial assets that can be reliably estimated. Evidence of impairment may includeindications that the borrower or a group of borrowers is experiencing significant financialdifficulty, default or delinquency in interest or principal payments, the probability that they willenter bankruptcy or other financial reorganization, and where observable data indicate that there isa measurable decrease in the estimated future cash flows, such as changes in arrears or economicconditions that correlate with defaults.
Financial assets carried at amortized costThe Group first assesses whether objective evidence of impairment exists individually forfinancial assets that are individually significant, and collectively for financial assets that are notindividually significant. If there is objective evidence that an impairment loss on a financial assetcarried at amortized cost (i.e., receivables or HTM investments) has been incurred, the amount ofthe loss is measured as the difference between the asset’s carrying amount and the present value ofestimated future cash flows discounted at the asset’s original EIR. The carrying amount of theasset is reduced through the use of an allowance account. The loss is recognized in theconsolidated statement of comprehensive income as ‘Impairment losses and others’. The asset,

-20 -
*SGVFS023363*
together with the associated allowance account, is written-off when there is no realistic prospect offuture recovery.
If it is determined that no objective evidence of impairment exists for an individually assessedfinancial asset, the asset is included in a group of financial assets with similar credit riskcharacteristics and that group of financial assets is collectively assessed for impairment. Thosecharacteristics are relevant to the estimation of future cash flows for groups of such assets bybeing indicative of the debtor’s ability to pay all amounts due according to the contractual terms ofthe assets being evaluated. Assets that are individually assessed for impairment and for which animpairment loss is or continues to be recognized are not included in a collective assessment ofimpairment.
If, in a subsequent period, the amount of the impairment loss decreases and the decrease can berelated objectively to an event occurring after the impairment was recognized, the previouslyrecognized impairment loss is reversed. Any subsequent reversal of an impairment loss isrecognized in profit or loss to the extent that the carrying amount of the asset does not exceed itsamortized cost at the reversal date.
The Group performs a regular review of the age and status of these accounts, designed to identifyaccounts with objective evidence of impairment and provide the appropriate allowance forimpairment loss.
The review is accomplished using a combination of specific and collective assessment approaches,with the impairment loss being determined for each risk grouping identified by the Group.
AFS investmentsThe Group assesses at each reporting date whether there is objective evidence that a financial assetor a group of financial assets is impaired.
In the case of equity investments classified as AFS investments, objective evidence would includea ‘significant’ or ‘prolonged’ decline in the fair value of the investments below its cost.‘Significant’ is to be evaluated against the original cost of the investment and ‘prolonged’ againstthe period in which the fair value has been below its original cost. The Group treats ‘significant’generally as 20% and ‘prolonged’ as greater than 12 months for quoted equity securities. Wherethere is evidence of impairment, the cumulative loss, which is measured as the difference betweenthe acquisition cost and the current fair value, less any impairment loss on that financial assetpreviously recognized in profit and loss, is removed from other comprehensive income andrecognized in profit or loss. Impairment losses on equity investments are not reversed throughprofit or loss in the consolidated statement of comprehensive income. Increases in fair value afterimpairment are recognized as part of other comprehensive income.
In the case of debt instruments classified as AFS investments, impairment is assessed based on thesame criteria as financial assets carried at amortized cost. Future interest income is based on thereduced carrying amount and is accrued based on the rate of interest used to discount future cashflows for the purpose of measuring the impairment loss. Such accrual is recorded as part of‘Interest income’ in profit or loss. If, in a subsequent year, the fair value of a debt instrumentincreases and the increase can be objectively related to an event occurring after the impairmentloss was recognized in profit or loss, the impairment loss is reversed through the profit or loss.

-21 -
*SGVFS023363*
Derecognition of Financial InstrumentsFinancial assetsA financial asset (or, where applicable a part of a financial asset or part of a group of financialassets) is derecognized when:
∂ the rights to receive cash flows from the asset have expired;∂ the Group retains the right to receive cash flows from the asset, but has assumed an obligation
to pay them in full without material delay to a third party under a “pass-through” arrangement;or
∂ the Group has transferred its rights to receive cash flows from the asset and either (a) hastransferred substantially all the risks and rewards of ownership and retained control of theasset, or (b) has neither transferred nor retained the risks and rewards of the asset but hastransferred the control of the asset.
Where the Group has transferred its rights to receive cash flows from an asset or has entered into apass-through arrangement, and has neither transferred nor retained substantially all the risks andrewards of the asset nor transferred control of the asset, the asset is recognized to the extent of theGroup’s continuing involvement in the asset. Continuing involvement that takes the form of aguarantee over the transferred asset is measured at the lower of original carrying amount of theasset and the maximum amount of consideration that the Group could be required to repay.
Financial liabilitiesA financial liability is derecognized when the obligation under the liability is discharged orcancelled or has expired. Where an existing financial liability is replaced by another from thesame lender on substantially different terms, or the terms of an existing liability are substantiallymodified, such an exchange or modification is treated as a derecognition of the original liabilityand the recognition of a new liability, and the difference in the respective carrying amounts isrecognized in profit or loss.
Offsetting Financial InstrumentsFinancial assets and financial liabilities are offset and the net amount reported in the consolidatedstatement of financial position if, and only if, there is a currently enforceable legal right to offsetthe recognized amounts and there is an intention to settle on a net basis, or to realize the asset andsettle the liability simultaneously. The Group assesses that it has a currently enforceable right ofoffset if the right is not contingent on a future event, and is legally enforceable in the normalcourse of business of default, and event of solvency or bankruptcy of the Group and all of thecounterparties.
InventoriesInventories, including work-in-process, are valued at the lower of cost and net realizable value(NRV). NRV is the estimated selling price in the ordinary course of business, less estimated costsof completion and the estimated costs necessary to make the sale. NRV for materials, spare partsand other supplies represents the related replacement costs. In determining the NRV, the Groupdeducts from cost 100.0% of the carrying value of slow-moving items and nonmoving items formore than one year.
When inventories are sold, the carrying amounts of those inventories are recognized under ‘Costof sales and services’ in profit or loss in the period when the related revenue is recognized.
The amount of any write-down of inventories to NRV is recognized in ‘Cost of sales and services’while all other losses on inventories shall be recognized under ‘Impairment losses and others’ inprofit or loss in the period the write-down or loss was incurred. The amount of reversal of any

-22 -
*SGVFS023363*
write-down of inventories, arising from an increase in the NRV, shall be recognized as a reductionto ‘Cost of sales and services’ in the period where the reversal was incurred.
Some inventories may be allocated to other asset accounts, for example, inventory used as acomponent of a self-constructed property, plant or equipment. Inventories allocated to anotherasset in this way are recognized as an expense during the useful life of that asset.
Costs incurred in bringing each product to its present location and conditions are accounted for asfollows:
Finished goods, work-in-process, raw materials and packaging materialsa. Petrochemicals
In 2015, JGSPC and JGSOC changed its inventory costing method for its raw materials, work-in-process and finished goods from weighted average costing method to FIFO costing method.Under the FIFO costing method, items that are purchased first or are produced first are soldfirst and items remaining at the end of the period are those most recently purchased orproduced. Cost of finished goods and work-in-process includes direct materials and labor anda proportion of manufacturing overhead costs based on actual goods processed and produced.The effect of the change in the accounting policy is not significant.
b. Branded consumer foods, agro-industrial and commodity food productsCost is determined using the weighted average method. Under the weighted average costingmethod, the cost of each item is determined from the weighted average of the cost of similaritems at the beginning of a period and the cost of similar items purchased or produced duringthe period. Cost of finished goods and work-in-process include direct materials and labor anda proportion of manufacturing overhead costs based on actual goods processed and produced,but excluding borrowing costs.
Subdivision land and condominium and residential units for saleSubdivision land, condominium and residential units for sale are carried at the lower of cost andNRV. Cost includes costs incurred for development and improvement of the properties andborrowing costs on loans directly attributable to the projects which were capitalized duringconstruction.
Factory supplies and spare partsCost is determined using the weighted average method.
Noncurrent Assets (Disposal Group) Held for SaleThe Group classifies noncurrent assets (disposal group) as held for sale when their carryingamount will be recovered principally through a sale transaction rather than through continuing use.For this to be the case, the asset must be available for immediate sale in its present condition,subject only to terms that are usual and customary for sales of such assets, and its sale must behighly probable.
For the sale to be highly probable, the appropriate level of management must be committed to aplan to sell the asset and an active program to locate a buyer and complete the plan must havebeen initiated. Furthermore, the asset must be actively marketed for sale at a price that isreasonable in relation to its current fair value. In addition, the sale should be expected to qualifyfor recognition as a completed sale within one year from the date of classification.
The related results of operations and cash flows of the disposal group that qualify as discontinuedoperations are separated from the results of those that would be recovered principally through

-23 -
*SGVFS023363*
continuing use, and the prior years’ profit or loss in the consolidated statement of comprehensiveincome and consolidated statement of cash flows are re-presented. Results of operations and cashflows of the disposal group that qualify as discontinued operations are presented in profit or loss inthe consolidated statement of comprehensive income and consolidated statement of cash flows asitems associated with discontinued operations.
In circumstances where certain events have extended the period to complete the sale of a disposalgroup beyond one year, the disposal group continues to be classified as held for sale if the delay iscaused by events or circumstances beyond the Group’s control and there is sufficient evidence thatthe Group remains committed to its plan to sell the disposal group. Otherwise, if the criteria forclassification of a disposal group as held for sale are no longer met, the Group ceases to classifythe disposal group as held for sale.
Initial and subsequent measurementImmediately before the initial classification of the noncurrent asset (or disposal group) as held forsale, the carrying amount of the asset (or all the assets and liabilities of the disposal group) shall bemeasured in accordance with applicable standards.
Noncurrent assets (disposal group) held for sale are measured at the lower of their carryingamount or fair value less costs to sell. Impairment losses are recognized for any initial orsubsequent write-down of the noncurrent assets (disposal group) held for sale to the extent thatthese have not been previously recognized at initial recognition. Reversals of impairment lossesfor any subsequent increases in fair value less cost to sell of the noncurrent assets (disposal group)held for sale are recognized as a gain, but not in excess of the cumulative impairment loss that hasbeen previously recognized. Liabilities directly related to noncurrent assets held for sale aremeasured at their expected settlement amounts.
Investments in Associates and Joint VenturesAssociates pertain to all entities over which the Group has significant influence. Significantinfluence is the power to participate in the financial and operating policy decisions of the investee,but is not control or joint control over those policies. In the consolidated financial statements,investment in associates is accounted for under the equity method of accounting.
The Group also has interests in joint ventures. A joint venture is a contractual arrangementwhereby two or more parties undertake an economic activity that is subject to joint control.
The Group’s investments in its associates and joint ventures are accounted for using the equitymethod of accounting. Under the equity method, the investments in associates and joint venturesare carried in the consolidated statement of financial position at cost plus post-acquisition changesin the Group’s share in the net assets of the associates and joint ventures. The consolidatedstatement of comprehensive income reflects the share of the results of operations of the associatesand joint ventures. Where there has been a change recognized in the investees’ othercomprehensive income, the Group recognizes its share of any changes and discloses this, whenapplicable, in the other comprehensive income. Profits and losses arising from transactionsbetween the Group and the associate are eliminated to the extent of the interest in the associatesand joint ventures.
The Group’s investments in certain associates and joint ventures include goodwill on acquisition,less any impairment in value. Goodwill relating to an associate or joint venture is included in thecarrying amount of the investment and is not amortized.

-24 -
*SGVFS023363*
Where necessary, adjustments are made to the financial statements of associates to bring theaccounting policies used in line with those used by the Group.
Upon loss of significant influence over the associate, the Group measures and recognizes anyretained investment at its fair value. Any difference between the carrying amount of the associateupon loss of significant influence and the fair value of the retained investment and proceeds fromdisposal is recognized in profit or loss.
Investment PropertiesInvestment properties consist of properties that are held to earn rentals or for capital appreciationor both, and those which are not occupied by entities in the Group. Investment properties, exceptfor land, are carried at cost less accumulated depreciation and impairment loss, if any. Land iscarried at cost less impairment loss, if any. Investment properties are measured initially at cost,including transaction costs. Transaction costs represent nonrefundable taxes such as capital gainstax and documentary stamp tax that are for the account of the Group. An investment propertyacquired through an exchange transaction is measured at the fair value of the asset acquired unlessthe fair value of such an asset cannot be measured, in which case the investment property acquiredis measured at the carrying amount of the asset given up. Foreclosed properties are classifiedunder investment properties upon: a) entry of judgment in case of judicial foreclosure;b) execution of the Sheriff’s Certificate of Sale in case of extra-judicial foreclosure; orc) notarization of the Deed of Dacion in case of dation in payment (dacion en pago).
The Group’s investment properties are depreciated using the straight-line method over theirestimated useful lives (EUL) as follows:
Land improvements 10 yearsBuildings and improvements 10 to 30 years
The depreciation and amortization method and useful life are reviewed periodically to ensure thatthe method and period of depreciation and amortization are consistent with the expected pattern ofeconomic benefits from items of investment properties.
Investment properties are derecognized when either they have been disposed of or when theinvestment properties are permanently withdrawn from use and no future economic benefit isexpected from their disposal. Any gains or losses on the retirement or disposal of investmentproperties are recognized in profit or loss in the consolidated statement of comprehensive incomein the year of retirement or disposal.
Transfers are made to investment property when, and only when, there is a change in use,evidenced by the end of owner occupation or commencement of an operating lease to anotherparty. Transfers are made from investment property when, and only when, there is a change inuse, evidenced by commencement of owner occupation or commencement of development with aview to sale.
For a transfer from investment property to owner-occupied property or to inventories, the deemedcost of the property for subsequent accounting is its fair value at the date of change in use. If theproperty occupied by the Group as an owner-occupied property becomes an investment property,the Group accounts for such property in accordance with the policy stated under ‘Property, plantand equipment’ up to the date of change in use.
Construction in-progress is stated at cost. This includes cost of construction and other direct costs.Borrowing costs that are directly attributable to the construction of investment properties are

-25 -
*SGVFS023363*
capitalized during the construction period. Construction in-progress is not depreciated until suchtime as the relevant assets are completed and put into operational use.
Property, Plant and EquipmentProperty, plant and equipment, except land which is stated at cost less any impairment in value,are carried at cost less accumulated depreciation, amortization and impairment loss, if any.
The initial cost of property, plant and equipment comprises its purchase price, including importduties, taxes and any directly attributable costs of bringing the asset to its working condition andlocation for its intended use. Cost also includes: (a) interest and other financing charges onborrowed funds used to finance the acquisition of property, plant and equipment to the extentincurred during the period of installation and construction; and (b) asset retirement obligation(ARO) relating to property, plant and equipment installed/constructed on leased properties orleased aircraft.
Subsequent replacement costs of parts of property, plant and equipment are capitalized when therecognition criteria are met. Significant refurbishments and improvements are capitalized when itcan be clearly demonstrated that the expenditures have resulted in an increase in future economicbenefits expected to be obtained from the use of an item of property, plant and equipment beyondthe originally assessed standard of performance. Costs of repairs and maintenance are charged asexpense when incurred.
Foreign exchange differentials arising from the acquisition of property, plant and equipment arecharged against profit or loss in the consolidated statement of comprehensive income and are nolonger capitalized.
Depreciation and amortization of property, plant and equipment commences once the property,plant and equipment are available for use, and are computed using the straight-line method overthe EUL of the assets, regardless of utilization.
The EUL of property, plant and equipment of the Group follow:
EULLand and improvements 10 to 40 yearsBuildings and improvements 10 to 50 yearsMachinery and equipment 4 to 50 yearsLeasehold improvements 15 yearsPassenger aircraft 15 yearsOther flight equipment 5 yearsTransportation, furnishing and other equipment 3 to 5 years
Leasehold improvements are amortized over the shorter of their EULs or the corresponding leaseterms.
The assets’ residual values, useful lives and methods of depreciation and amortization arereviewed periodically to ensure that the method and period of depreciation and amortization areconsistent with the expected pattern of economic benefits from items of property, plant andequipment. Any change in the expected residual values, useful lives and methods of depreciationare adjusted prospectively from the time the change was determined necessary.
Construction in-progress is stated at cost. This includes cost of construction and other direct costs.Borrowing costs that are directly attributable to the construction of property, plant and equipment

-26 -
*SGVFS023363*
are capitalized during the construction period. Construction in-progress is not depreciated untilsuch time as the relevant assets are completed and put into operational use. Assets underconstruction are reclassified to a specific category of property, plant and equipment when theconstruction and other related activities necessary to prepare the properties for their intended useare completed and the properties are available for use.
Major spare parts and stand-by equipment items that the Group expects to use over more than oneperiod and can be used only in connection with an item of property, plant and equipment areaccounted for as property, plant and equipment. Depreciation and amortization on these majorspare parts and stand-by equipment commence once these have become available for use(i.e., when it is in the location and condition necessary for it to be capable of operating in themanner intended by the Group).
An item of property, plant and equipment is derecognized upon disposal or when no futureeconomic benefits are expected to arise from the continued use of the asset. Any gain or lossarising on derecognition of the asset (calculated as the difference between the net disposalproceeds and the carrying amount of the item) is included in profit or loss in the consolidatedstatement of comprehensive income, in the year the item is derecognized.
AROThe Group is contractually required under various lease contracts to restore certain leased aircraftto its original condition and to bear the cost of restoration at the end of the contract period. Thecontractual obligation includes regular aircraft maintenance, overhaul and restoration of the leasedaircraft to its original condition. The event that gives rise to the obligation is the actual flyinghours of the asset as used, as the usage determines the timing and nature of the entity completesthe overhaul and restoration. Regular aircraft maintenance is accounted for as expense whenincurred, while overhaul and restoration are accounted on an accrual basis.
If there is a commitment related to maintenance of aircraft held under operating leasearrangements, a provision is made during the lease term for the lease return obligations specifiedwithin those lease agreements. The provision is made based on historical experience,manufacturers’ advice and if relevant, contractual obligations, to determine the present value ofthe estimated future major airframe inspections cost and engine overhauls.
Advance payment for materials for the restoration of the aircraft is initially recorded under‘Advances to supplier’ account in the consolidated statement of financial position. This isrecouped when the expenses for restoration of aircraft have been incurred.
The Group regularly assesses the provision for ARO and adjusts the related liability.
Borrowing CostsInterest and other finance costs incurred during the construction period on borrowings used tofinance property development are capitalized to the appropriate asset accounts. Capitalization ofborrowing costs commences when the activities to prepare the asset are in progress, andexpenditures and borrowing costs are being incurred. The capitalization of these borrowing costsceases when substantially all the activities necessary to prepare the asset for sale or its intendeduse are complete. If the carrying amount of the asset exceeds its recoverable amount, animpairment loss is recorded. Capitalized borrowing cost is based on the applicable weightedaverage borrowing rate for general borrowings. For specific borrowings, all borrowing costs areeligible for capitalization.
Borrowing costs which do not qualify for capitalization are expensed as incurred.

-27 -
*SGVFS023363*
Interest expense on loans is recognized using the effective interest method over the term of theloans.
Biological AssetsThe biological assets of the Group are divided into two major categories with sub-categories asfollows:
Swine livestock - Breeders (livestock bearer)- Sucklings (breeders’ offspring)- Weanlings (comes from sucklings intended to be breeders or to be sold as
fatteners)- Fatteners/finishers (comes from weanlings unfit to become breeders;
intended for the production of meat)Poultry livestock - Breeders (livestock bearer)
- Chicks (breeders’ offspring intended to be sold as breeders)
Agricultural produce is the harvested product of the Group’s biological assets. A harvest occurswhen agricultural produce is either detached from the bearer biological asset or when a biologicalasset’s life processes cease. A gain or loss arising on initial recognition of agricultural produce atfair value less estimated costs to sell is recognized in the consolidated statement of income in theperiod in which it arises. The agricultural produce in swine livestock is the suckling thattransforms into weanling then into fatteners/finishers, while the agricultural produce in poultrylivestock is the hatched chick and table eggs.
Agricultural produce is the harvested product of the Group’s biological assets. A harvest occurswhen agricultural produce is either detached from the bearer biological asset or when thebiological asset’s life processes cease. A gain or loss arising on initial recognition of agriculturalproduce at fair value less costs to sell shall be included in profit or loss in the consolidatedstatement of comprehensive income in the period in which it arises. The agricultural produce inswine livestock is the suckling that transforms into weanling then into fatteners/finishers, whilethe agricultural produce in poultry livestock is the hatched chick and table eggs.
Biological assets carried at fair values less estimated costs to sellBiological assets are measured at their fair values less costs to sell. The fair values are determinedbased on current market prices of livestock of similar age, breed and genetic merit. Costs to sellinclude commissions to brokers and dealers, nonrefundable transfer taxes and duties. Costs to sellexclude transport and other costs necessary to get the biological assets to the market. The cost of abiological asset comprises its purchase price and any costs attributable in bringing the biologicalasset to its location and conditions intended by management.
GoodwillGoodwill acquired in a business combination from the acquisition date is allocated to each of theGroup’s cash-generating units, or groups of cash-generating units that are expected to benefit fromthe synergies of the combination, irrespective of whether other assets or liabilities of the Group areassigned to those units or groups of units.
Each unit or group of units to which the goodwill is allocated:
∂ represents the lowest level within the Group at which the goodwill is monitored for internalmanagement purposes; and
∂ is not larger than a segment based on the Group’s operating segments as determined inaccordance with PFRS 8, Operating Segments.

-28 -
*SGVFS023363*
Following initial recognition, goodwill is measured at cost, less any accumulated impairment loss.Goodwill is reviewed for impairment annually or more frequently, if events or changes incircumstances indicate that the carrying value may be impaired (see Impairment of NonfinancialAssets).
Where goodwill forms part of a cash-generating unit and part of the operation within that unit isdisposed of, the goodwill associated with the operation disposed of is included in the carryingamount of the operation when determining the gain or loss on disposal of the operation. Goodwilldisposed of in this circumstance is measured based on the relative values of the operation disposedof and the portion of the cash-generating unit retained.
Bank LicensesBank licenses arise from the acquisition of branches of a local bank by the Group and commercialbank license. The Group’s bank licenses have indefinite useful lives and are subject to annualindividual impairment testing.
Intangible AssetsIntangible assets (other than goodwill) acquired separately are measured on initial recognition atcost. The cost of intangible assets acquired in a business combination is its fair value as at theacquisition date. Following initial recognition, intangible assets are measured at cost less anyaccumulated amortization and impairment loss, if any.
The EUL of intangible assets are assessed to be either finite or indefinite.
The useful lives of intangible assets with finite lives are assessed at the individual asset level.Intangible assets with finite lives are amortized on a straight-line basis over their useful lives.
The period and the method of amortization of an intangible asset with a finite useful life arereviewed at least at each reporting date. Changes in the EUL or the expected pattern ofconsumption of future economic benefits embodied in the asset is accounted for by changing theamortization period or method, as appropriate, and are treated as changes in accounting estimates.The amortization expense on intangible assets with finite useful lives is recognized under ‘Cost ofsales and services’ and ‘General and administrative expenses’ in profit or loss in the consolidatedstatement of comprehensive income in the expense category consistent with the function of theintangible asset. Intangible assets with finite lives are assessed for impairment, whenever there isan indication that the intangible assets may be impaired.
Intangible assets with indefinite useful lives are tested for impairment annually either individuallyor at the cash-generating unit level (see further discussion under Impairment of NonfinancialAssets). Such intangibles are not amortized. The intangible asset with an indefinite useful life isreviewed annually to determine whether indefinite life assessment continues to be supportable. Ifthe indefinite useful life is no longer appropriate, the change in the useful life assessment fromindefinite to finite is made on a prospective basis.
Costs incurred to acquire computer software (which are not an integral part of its relatedhardware) and costs to bring it to its intended use are capitalized as intangible assets. Costsdirectly associated with the development of identifiable computer software that generate expectedfuture benefits to the Group are also recognized as intangible assets. All other costs of developingand maintaining computer software programs are recognized as expense when incurred.
A gain or loss arising from derecognition of an intangible asset is measured as the differencebetween the net disposal proceeds and the carrying amount of the intangible asset and is

-29 -
*SGVFS023363*
recognized in profit or loss in the consolidated statement of comprehensive income when the assetis derecognized.
A summary of the policies applied to the Group’s intangible assets follows:
TechnologyLicenses Licenses
ProductFormulation and
Brands Software CostsLand Use
RightsCustomer
Relationship TrademarksEUL Finite (12 to
13.75 years)Indefinite Indefinite Finite (5 years) Finite (40 years
for commercialand 70 years for
residential)
Finite(35 years)
Finite (4 years) Indefinite
Amortization method used
Amortized on astraight-line
basis over theEUL of the
license
Noamortization
No amortization Amortized on astraight-line
basis over theEUL of the
software cost
Straight lineamortization
Straight lineamortization
Amortized on astraight-line
basis over theEUL of thetrademark
Noamortization
Internallygenerated or acquired
Acquired Acquired Acquired Acquired Acquired Acquired Acquired Acquired
Impairment of Nonfinancial AssetsThis accounting policy applies primarily to the Group’s ‘Investments in associates and jointventures’, ‘Investment properties’, ‘Property, plant and equipment’, ‘Biological assets at cost’ ,‘Intangible assets’ , ‘Goodwill’ and ‘Deferred subscriber acquisition and retention costs’.
Except for goodwill and intangible assets with indefinite lives which are tested for impairmentannually, the Group assesses at each reporting date whether there is an indication that itsnonfinancial assets may be impaired. When an indicator of impairment exists or when an annualimpairment testing for an asset is required, the Group makes a formal estimate of recoverableamount. Recoverable amount is the higher of an asset’s (or cash-generating unit’s) fair value lesscosts to sell and its value in use, and is determined for an individual asset, unless the asset does notgenerate cash inflows that are largely independent of those from other assets or groups of assets, inwhich case the recoverable amount is assessed as part of the cash-generating unit to which itbelongs. Where the carrying amount of an asset (or cash-generating unit) exceeds its recoverableamount, the asset (or cash-generating unit) is considered impaired and is written-down to itsrecoverable amount. In assessing value in use, the estimated future cash flows are discounted totheir present value using a pre-tax discount rate that reflects current market assessments of thetime value of money and the risks specific to the asset (or cash-generating unit).
Impairment losses from continuing operations are recognized under ‘Impairment losses andothers’ in profit or loss.
The following criteria are also applied in assessing impairment of specific assets:
Property, plant and equipment, investment properties, intangible assets with definite useful livesand costsFor property, plant and equipment, investment properties, intangible assets with definite usefullives, an assessment is made at each reporting date as to whether there is any indication thatpreviously recognized impairment losses may no longer exist or may have decreased. If suchindication exists, the recoverable amount is estimated. A previously recognized impairment loss isreversed only if there has been a change in the estimates used to determine the asset’s recoverableamount since the last impairment loss was recognized. If that is the case, the carrying amount ofthe asset is increased to its recoverable amount. That increased amount cannot exceed thecarrying amount that would have been determined, net of depreciation, had no impairment lossbeen recognized for the asset in prior years. Such reversal is recognized in profit or loss in the

-30 -
*SGVFS023363*
consolidated statement of comprehensive income. After such a reversal, the depreciation expenseis adjusted in future years to allocate the asset’s revised carrying amount, less any residual value,on a systematic basis over its remaining useful life.
GoodwillGoodwill is reviewed for impairment, annually or more frequently, if events or changes incircumstances indicate that the carrying value may be impaired.
Impairment is determined by assessing the recoverable amount of the cash-generating unit(or group of cash-generating units) to which the goodwill relates. Where the recoverable amountof the cash-generating unit (or group of cash-generating units) is less than the carrying amount towhich goodwill has been allocated, an impairment loss is recognized. Impairment losses relatingto goodwill cannot be reversed in future periods.
The Group performs its impairment test of goodwill every reporting date.
Investments in associates and joint venturesAfter application of the equity method, the Group determines whether it is necessary to recognizean additional impairment loss on the Group’s investments in associates and joint ventures. If thisis the case, the Group calculates the amount of impairment as the difference between therecoverable amount of the associate or joint venture and its carrying value and recognizes theamount under ‘Impairment losses and others’ in profit or loss.
Intangible assets with indefinite useful livesIntangible assets with indefinite useful lives are tested for impairment annually as of year-endeither individually or at the cash-generating unit level, as appropriate.
EquityCommon and preferred stocks are classified as equity and are recorded at par. Proceeds in excessof par value are recorded as ‘Additional paid-in capital’ in the consolidated statement of changesin equity. Incremental costs directly attributable to the issue of new shares or options are shown inequity as a deduction, net of tax, from the proceeds.
Retained earnings represent the cumulative balance of periodic net income/loss, dividenddistributions, prior period adjustments and effect of changes in accounting policy and capitaladjustments.
Treasury SharesTreasury shares are recorded at cost and are presented as a deduction from equity. When theshares are retired, the capital stock account is reduced by its par value. The excess of cost over parvalue upon retirement is debited to the following accounts in the order given: (a) additional paid-incapital to the extent of the specific or average additional paid-in capital when the shares wereissued, and (b) retained earnings. No gain or loss is recognized in profit or on the purchase, sale,issue or cancellation of the Group’s own equity instruments.
Revenue and Cost RecognitionRevenue is recognized to the extent that it is probable that the economic benefits will flow to theGroup and the revenue can be reliably measured. Revenue is measured at the fair value of theconsideration received, excluding discounts, rebates and other sales taxes or duties. The ParentCompany assesses its revenue arrangements against specific criteria in order to determine if it isacting as principal or agent. The Parent Company has concluded that it is acting as principal in all

-31 -
*SGVFS023363*
of its revenue arrangements. The following specific recognition criteria must also be met beforerevenue is recognized:
Sale of goodsRevenue from sale of goods is recognized upon delivery, when the significant risks and rewards ofownership of the goods have passed to the buyer and the amount of revenue can be measuredreliably. Revenue is measured at the fair value of the consideration received or receivable, net ofany trade discounts, prompt payment discounts and volume rebates.
Rendering of tolling servicesRevenue derived from tolling activities, whereby raw sugar from traders and planters is convertedinto refined sugar, is recognized as revenue when the related services have been rendered.
Sale of air transportation servicesPassenger ticket and cargo waybill sales, excluding portion relating to awards under LifestyleRewards Program, are initially recorded under ‘Unearned revenue’ account in the consolidatedstatement of financial position until recognized as ‘Revenue’ in the consolidated statement ofcomprehensive income when carriage is provided or when the flight is uplifted.
Ancillary revenueRevenue from services incidental to the transportation of passengers, cargo, mail and merchandiseare recognized when transactions are carried out.
Real estate salesRevenue from sales of real estate and cost from completed projects is accounted for using the fullaccrual method. The percentage of completion is used to recognize income from sales of projectswhere the Group has material obligations under the sales contract to complete the project after theproperty is sold. Under this method, revenue is recognized as the related obligations are fulfilled,measured principally on the basis of the estimated completion by reference to the actual costsincurred to date over the estimated total costs of project.
If any of the criteria under the percentage of completion method is not met, the deposit method isapplied until all the conditions for recording a sale are met. Pending recognition of sale, cashreceived from buyers are presented under the ‘Deposits from real estate buyers’ which is shown aspart of the ’Other current or noncurrent liabilities’ in the consolidated statement of financialposition.
Revenue from hotel operationsRevenue from hotel operations is recognized when services are rendered. Revenue from banquetsand other special events are recognized when the events take place. Rental income on leased areasof the hotel is recognized on a straight-line basis over the lease term. Revenue from food andbeverage are recognized when these are served. Other income from transport, laundry, valet andother related hotel services are recognized when services are rendered.
Interest incomeFor all financial instruments measured at amortized cost and interest-bearing financial instrumentsclassified as AFS investments, interest income is recorded at the EIR, which is the rate that exactlydiscounts estimated future cash payments or receipts through the expected life of the financialinstrument or a shorter period, where appropriate, to the net carrying amount of the financial assetor financial liability.

-32 -
*SGVFS023363*
The calculation takes into account all contractual terms of the financial instrument (for example,prepayment options), includes any fees or incremental costs that are directly attributable to theinstrument and are an integral part of the EIR, but not future credit losses.
Once the recorded value of a financial asset or group of similar financial assets has been reduceddue to an impairment loss, interest income continues to be recognized using the original EIRapplied to the new carrying amount. The adjusted carrying amount is calculated based on theoriginal EIR. The change in carrying amount is recorded as interest income.
Unearned discount is recognized as income over the terms of the receivables using the effectiveinterest method and is shown as a deduction from loans.
Service fees and commission incomeThe Group earns fees and commission income from the diverse range of services it provides to itscustomers. Fees earned for the provision of services over a period of time are accrued over thatperiod. These fees include investment fund fees, custodian fees, fiduciary fees, portfolio fees,credit-related fees and other service and management fees. Fees on deposit-related accounts arerecognized only upon collection or accrued when there is reasonable degree of certainty as to itscollection.
Trading and securities gain (loss)This represent results arising from disposal of AFS investments and trading activities including allgains and losses from changes in fair value of financial assets at FVPL of the Group’s Bankingsegment.
Dividend incomeDividend income is recognized when the shareholder’s right to receive the payment is established.
Rent incomeThe Group leases certain commercial real estate properties to third parties under an operating leasearrangement. Rental income on leased properties is recognized on a straight-line basis over thelease term, or based on a certain percentage of the gross revenue of the tenants, as provided underthe terms of the lease contract. Contingent rents are recognized as revenue in the period in whichthey are earned.
Amusement incomeRevenue is recognized upon receipt of cash from the customer which coincides with the renderingof services.
Gain from sale of properties, investments and other assetsGain from sale of properties, investments and other assets is recognized upon completion of theearning process and the collectibility of the sales price is reasonably assured.
ProvisionsProvisions are recognized when: (a) the Group has a present obligation (legal or constructive) as aresult of a past event; (b) it is probable (i.e., more likely than not) that an outflow of resourcesembodying economic benefits will be required to settle the obligation; and (c) a reliable estimatecan be made of the amount of the obligation. Provisions are reviewed at each reporting date andadjusted to reflect the current best estimate. If the effect of the time value of money is material,provisions are determined by discounting the expected future cash flows at a pre-tax rate thatreflects current market assessments of the time value of money and, where appropriate, the risksspecific to the liability. Where discounting is used, the increase in the provision due to the

-33 -
*SGVFS023363*
passage of time is recognized as an interest expense under ‘Financing costs and other charges’account in the consolidated statement of comprehensive income. Where the Group expects aprovision to be reimbursed, the reimbursement is recognized as a separate asset but only when thereimbursement is probable.
ContingenciesContingent liabilities are not recognized in the consolidated financial statements but are disclosedin the notes to the consolidated financial statements unless the possibility of an outflow ofresources embodying economic benefits is remote. Contingent assets are not recognized in theconsolidated financial statements but are disclosed in the notes to the consolidated financialstatements when an inflow of economic benefits is probable.
Pension CostsThe net defined benefit liability or asset is the aggregate of the present value of the defined benefitobligation at the end of the reporting period reduced by the fair value of plan assets (if any),adjusted for any effect of limiting a net defined benefit asset to the asset ceiling. The asset ceilingis the present value of any economic benefits available in the form of refunds from the plan orreductions in future contributions to the plan.
The cost of providing benefits under the defined benefit plans is actuarially determined using theprojected unit credit method.
Defined benefit costs comprise the following:∂ Service cost∂ Net interest on the net defined benefit liability or asset∂ Remeasurements of net defined benefit liability or asset
Service costs which include current service costs, past service costs and gains or losses on non-routine settlements are recognized as expense in profit or loss. Past service costs are recognizedwhen plan amendment or curtailment occurs. These amounts are calculated periodically byindependent qualified actuaries.
Net interest on the net defined benefit liability or asset is the change during the period in the netdefined benefit liability or asset that arises from the passage of time which is determined byapplying the discount rate based on government bonds to the net defined benefit liability or asset.Net interest on the net defined benefit liability or asset is recognized as expense or income inprofit or loss.
Remeasurements comprising actuarial gains and losses, return on plan assets and any change inthe effect of the asset ceiling (excluding net interest on defined benefit liability) are recognizedimmediately in other comprehensive income in the period in which they arise. Remeasurementsare not reclassified to profit or loss in subsequent periods.
Plan assets are assets that are held by a long-term employee benefit fund or qualifying insurancepolicies. Plan assets are not available to the creditors of the Group, nor can they be paid directly tothe Group. Fair value of plan assets is based on market price information. When no market priceis available, the fair value of plan assets is estimated by discounting expected future cash flowsusing a discount rate that reflects both the risk associated with the plan assets and the maturity orexpected disposal date of those assets (or, if they have no maturity, the expected period until thesettlement of the related obligations). If the fair value of the plan assets is higher than the presentvalue of the defined benefit obligation, the measurement of the resulting defined benefit asset is

-34 -
*SGVFS023363*
limited to the present value of economic benefits available in the form of refunds from the plan orreductions in future contributions to the plan.
The Group’s right to be reimbursed of some or all of the expenditure required to settle a definedbenefit obligation is recognized as a separate asset at fair value when and only whenreimbursement is virtually certain.
Termination benefitTermination benefits are employee benefits provided in exchange for the termination of anemployee’s employment as a result of either an entity’s decision to terminate an employee’semployment before the normal retirement date or an employee’s decision to accept an offer ofbenefits in exchange for the termination of employment.
A liability and expense for a termination benefit is recognized at the earlier of when the entity canno longer withdraw the offer of those benefits and when the entity recognizes related restructuringcosts. Initial recognition and subsequent changes to termination benefits are measured inaccordance with the nature of the employee benefit, as either post-employment benefits, short-term employee benefits, or other long-term employee benefits.
Employee leave entitlementEmployee entitlements to annual leave are recognized as a liability when they are accrued to theemployees. The undiscounted liability for leave expected to be settled wholly before twelvemonths after the end of the annual reporting period is recognized for services rendered byemployees up to the end of the reporting period.
Income TaxesCurrent taxCurrent tax assets and liabilities for the current and prior periods are measured at the amountexpected to be recovered from or paid to the taxation authorities. The tax rates and tax laws usedto compute the amount are those that are enacted or substantively enacted as of reporting date.
Deferred taxDeferred tax is provided using the liability method on all temporary differences, with certainexceptions, at the reporting date between the tax bases of assets and liabilities and their carryingamounts for financial reporting purposes.
Deferred tax liabilities are recognized for all taxable temporary differences, except:
∂ Where the deferred tax liability arises from the initial recognition of goodwill or of an asset orliability in a transaction that is not a business combination and, at the time of the transaction,affects neither the accounting profit nor taxable profit or loss; and
∂ In respect of taxable temporary differences associated with investments in subsidiaries,associates and interests in joint ventures, where the timing of the reversal of the temporarydifferences can be controlled and it is probable that the temporary differences will not reversein the foreseeable future.
Deferred tax assets are recognized for all deductible temporary differences, carryforward benefitsof unused tax credits from unused minimum corporate income tax (MCIT) over the regularcorporate income tax (RCIT) and unused net operating loss carryover (NOLCO), to the extent thatit is probable that future taxable income will be available against which the deductible temporary

-35 -
*SGVFS023363*
differences, and the carryforward benefits of unused tax credits from excess MCIT and unusedNOLCO can be utilized, except:
∂ Where the deferred tax asset relating to the deductible temporary difference arises from theinitial recognition of an asset or liability in a transaction that is not a business combinationand, at the time of the transaction, affects neither the accounting profit nor future taxableprofit or loss; and
∂ In respect of deductible temporary differences associated with investments in subsidiaries,associates and interests in joint ventures, deferred tax assets are recognized only to the extentthat it is probable that the temporary differences will reverse in the foreseeable future andfuture taxable profit will be available against which the temporary differences can be utilized.
The carrying amounts of deferred tax assets are reviewed at each reporting date and reduced toextent that it is no longer probable that sufficient future taxable income will be available to allowall or part of the deferred tax assets to be utilized. Unrecognized deferred tax assets are reassessedat each reporting date, and are recognized to the extent that it has become probable that futuretaxable income will allow the deferred tax assets to be recognized.
Deferred tax assets and liabilities are measured at the tax rates that are expected to apply to theperiod when the asset is realized or the liability is settled, based on tax rates (and tax laws) thathave been enacted or substantively enacted as of reporting date.
Deferred tax relating to items recognized outside profit or loss is recognized outside profit or lossin the consolidated statement of comprehensive income. Deferred tax items are recognized incorrelation to the underlying transaction either in other comprehensive income or directly inequity.
Deferred tax assets and deferred tax liabilities are offset if a legally enforceable right exists to setoff current tax assets against current tax liabilities and the deferred taxes relate to the same taxableentity and the same taxation authority.
LeasesThe determination of whether an arrangement is, or contains a lease, is based on the substance ofthe arrangement at inception date, and requires an assessment of whether the fulfillment of thearrangement is dependent on the use of a specific asset or assets, and the arrangement conveys aright to use the asset.
A reassessment is made after inception of the lease only if one of the following applies:
a. there is a change in contractual terms, other than a renewal or extension of the arrangement;b. a renewal option is exercised or an extension granted, unless that term of the renewal or
extension was initially included in the lease term;c. there is a change in the determination of whether fulfillment is dependent on a specified
asset; ord. there is a substantial change to the asset.
Where a reassessment is made, lease accounting shall commence or cease from the date when thechange in circumstances gave rise to the reassessment for scenarios a, c or d above, and at the dateof renewal or extension period for scenario b.

-36 -
*SGVFS023363*
Group as a lesseeFinance leases, which transfer to the Group substantially all the risks and benefits incidental toownership of the leased item, are capitalized at the inception of the lease at the fair value of theleased property or, if lower, at the present value of the minimum lease payments and is included inthe consolidated statement of financial position under ‘Property, plant and equipment’ with thecorresponding liability to the lessor included under ‘Long-term debt’. Lease payments areapportioned between the finance charges and reduction of the lease liability so as to achieve aconstant rate of interest on the remaining balance of the liability. Finance charges are chargeddirectly to profit or loss in the consolidated statement of comprehensive income. Capitalizedleased assets are depreciated over the shorter of the EUL of the assets or the respective leaseterms, if there is no reasonable certainty that the Group will obtain ownership by the end of thelease term.
Leases where the lessor retains substantially all the risks and benefits of ownership of the asset areclassified as operating leases. Operating lease payments are recognized as an expense under ‘Costof sales and services’ and ‘General administrative expenses’ in profit or loss in the consolidatedstatement of comprehensive income on a straight-line basis over the lease term.
Group as a lessorLeases where the Group does not transfer substantially all the risks and benefits of ownership ofthe assets are classified as operating leases. Initial direct costs incurred in negotiating operatingleases are added to the carrying amount of the leased asset and recognized over the lease term onthe same basis as the rental income. Contingent rents are recognized as revenue in the period inwhich they are earned.
Earnings Per Share (EPS)Basic EPS is computed by dividing net income for the period attributable to the ordinary equityholders of the Parent Company by the weighted average number of common shares outstandingduring the year, adjusted for any subsequent stock dividends declared.
Diluted EPS amounts are calculated by dividing the net income attributable to ordinary equityholders of the Parent Company (after deducting interest of the preferred shares, if any) by theweighted average number of common shares outstanding during the year plus the weightedaverage number of common shares that would be issued on the conversion of all the dilutivepotential common shares into common shares.
Dividends on Common SharesDividends on common shares are recognized as a liability and deducted from equity whenapproved by the BOD of the Parent Company in the case of cash dividends, and the BOD andshareholders of the Parent Company in the case of stock dividends.
Segment ReportingThe Group’s operating segments are organized and managed separately according to the nature ofthe products and services provided, with each segment representing a strategic business unit thatoffers different products and serves different markets. Financial information on operatingsegments is presented in Note 6 to the consolidated financial statements.
Subsequent EventsAny post-year-end event up to the date of approval of the BOD of the consolidated financialstatements that provides additional information about the Group’s position at the reporting date(adjusting event) is reflected in the consolidated financial statements. Any post-year-end event
-37 -
*SGVFS023363*
that is not an adjusting event is disclosed in the notes to the consolidated financial statements,when material.
Standards Issued but not yet EffectiveStandards issued but not yet effective up to the date of the Group’s financial statements are listedbelow. The listing consists of standards and interpretations issued, which the Group reasonablyexpects to be applicable at a future date. The Group intends to adopt these standards when theybecome effective. Except as otherwise indicated, the Group does not expect the adoption of thesenew and amended PFRS and Philippine Interpretations to have significant impact on its financialstatements.
Effective beginning on or after January 1, 2017Amendment to PFRS 12, Clarification of the Scope of the Standard (Part of Annual Improvementsto PFRS 2014 - 2016 Cycle)The amendments clarify that the disclosure requirements in PFRS 12, other than those relating tosummarized financial information, apply to an entity’s interest in a subsidiary, a joint venture oran associate (or a portion of its interest in a joint venture or an associate) that is classified (orincluded in a disposal group that is classified) as held for sale. The amendments do not have anyimpact on the Group’s financial position and results of operation.
Amendments to PAS 7, Statement of Cash Flows, Disclosure InitiativeThe amendments to PAS 7 require an entity to provide disclosures that enable users of financialstatements to evaluate changes in liabilities arising from financing activities, including bothchanges arising from cash flows and non-cash changes (such as foreign exchange gains or losses).On initial application of the amendments, entities are not required to provide comparativeinformation for preceding periods. Early application of the amendments is permitted.
Application of amendments will result in additional disclosures in the 2017 financial statements ofthe Group.
Amendments to PAS 12, Income Taxes, Recognition of Deferred Tax Assets for Unrealized LossesThe amendments clarify that an entity needs to consider whether tax law restricts the sources oftaxable profits against which it may make deductions on the reversal of that deductible temporarydifference. Furthermore, the amendments provide guidance on how an entity should determinefuture taxable profits and explain the circumstances in which taxable profit may include therecovery of some assets for more than their carrying amount.
Entities are required to apply the amendments retrospectively. However, on initial application ofthe amendments, the change in the opening equity of the earliest comparative period may berecognized in opening retained earnings (or in another component of equity, as appropriate),without allocating the change between opening retained earnings and other components of equity.Entities applying this relief must disclose that fact. Early application of the amendments ispermitted.
These amendments are not expected to have any impact on the Group.
Effective beginning on or after January 1, 2018Amendments to PFRS 2, Share-based Payment, Classification and Measurement of Share-basedPayment TransactionsThe amendments to PFRS 2 address three main areas: the effects of vesting conditions on themeasurement of a cash-settled share-based payment transaction; the classification of a share-basedpayment transaction with net settlement features for withholding tax obligations; and the

-38 -
*SGVFS023363*
accounting where a modification to the terms and conditions of a share-based payment transactionchanges its classification from cash settled to equity settled.
On adoption, entities are required to apply the amendments without restating prior periods, butretrospective application is permitted if elected for all three amendments and if other criteria aremet. Early application of the amendments is permitted.
Amendments to PFRS 4, Insurance Contracts, Applying PFRS 9, Financial Instruments, withPFRS 4The amendments address concerns arising from implementing PFRS 9, the new financialinstruments standard before implementing the forthcoming insurance contracts standard. Theyallow entities to choose between the overlay approach and the deferral approach to deal with thetransitional challenges. The overlay approach gives all entities that issue insurance contracts theoption to recognize in other comprehensive income, rather than profit or loss, the volatility thatcould arise when PFRS 9 is applied before the new insurance contracts standard is issued. On theother hand, the deferral approach gives entities whose activities are predominantly connected withinsurance an optional temporary exemption from applying PFRS 9 until the earlier of applicationof the forthcoming insurance contracts standard or January 1, 2021.
The overlay approach and the deferral approach will only be available to an entity if it has notpreviously applied PFRS 9.
The amendments are not applicable to the Group since none of the entities within the Group haveactivities that are predominantly connected with insurance or issue insurance contracts.
PFRS 15, Revenue from Contracts with CustomersPFRS 15 establishes a new five-step model that will apply to revenue arising from contracts withcustomers. Under PFRS 15, revenue is recognized at an amount that reflects the consideration towhich an entity expects to be entitled in exchange for transferring goods or services to a customer.The principles in PFRS 15 provide a more structured approach to measuring and recognizingrevenue.
The new revenue standard is applicable to all entities and will supersede all current revenuerecognition requirements under PFRS. Either a full or modified retrospective application isrequired for annual periods beginning on or after January 1, 2018. The Group is currentlyassessing the impact of PFRS 15 and plans to adopt the new standard on the required effectivedate.
PFRS 9, Financial Instruments (2014 or final version)PFRS 9 reflects all phases of the financial instruments project and replaces PAS 39, FinancialInstruments: Recognition and Measurement, and all previous versions of PFRS 9. The standardintroduces new requirements for classification and measurement, impairment, and hedgeaccounting. PFRS 9 is effective for annual periods beginning on or after January 1, 2018, withearly application permitted. Retrospective application is required, but providing comparativeinformation is not compulsory. For hedge accounting, the requirements are generally appliedprospectively, with some limited exceptions.
The adoption of PFRS 9 will have an effect on the classification and measurement of the Group’sfinancial assets and impairment methodology for financial assets, but will have no impact on theclassification and measurement of the Group’s financial liabilities. The Group is currentlyassessing the impact of adopting this standard.

-39 -
*SGVFS023363*
Philippine Interpretation IFRIC-22, Foreign Currency Transactions and Advance ConsiderationThe interpretation clarifies that in determining the spot exchange rate to use on initial recognitionof the related asset, expense or income (or part of it) on the derecognition of a non-monetary assetor non-monetary liability relating to advance consideration, the date of the transaction is the dateon which an entity initially recognizes the nonmonetary asset or non-monetary liability arisingfrom the advance consideration. If there are multiple payments or receipts in advance, then theentity must determine a date of the transactions for each payment or receipt of advanceconsideration. The interpretation may be applied on a fully retrospective basis. Entities mayapply the interpretation prospectively to all assets, expenses and income in its scope that areinitially recognized on or after the beginning of the reporting period in which the entity firstapplies the interpretation or the beginning of a prior reporting period presented as comparativeinformation in the financial statements of the reporting period in which the entity first applies theinterpretation.
Amendments to PAS 28, Measuring an Associate or Joint Venture at Fair Value (Part of AnnualImprovements to PFRS 2014 - 2016 Cycle)The amendments clarify that an entity that is a venture capital organization, or other qualifyingentity, may elect, at initial recognition on an investment-by-investment basis, to measure itsinvestments in associates and joint ventures at fair value through profit or loss. They also clarifythat if an entity that is not itself an investment entity has an interest in an associate or joint venturethat is an investment entity, the entity may, when applying the equity method, elect to retain thefair value measurement applied by that investment entity associate or joint venture to theinvestment entity associate’s or joint venture’s interests in subsidiaries. This election is madeseparately for each investment entity associate or joint venture, at the later of the date on which (a)the investment entity associate or joint venture is initially recognized; (b) the associate or jointventure becomes an investment entity; and (c) the investment entity associate or joint venture firstbecomes a parent. The amendments should be applied retrospectively, with earlier applicationpermitted.
Amendments to PAS 40, Investment Property, Transfers of Investment PropertyThe amendments clarify when an entity should transfer property, including property underconstruction or development into, or out of investment property. The amendments state that achange in use occurs when the property meets, or ceases to meet, the definition of investmentproperty and there is evidence of the change in use. A mere change in management’s intentions forthe use of a property does not provide evidence of a change in use. The amendments should beapplied prospectively to changes in use that occur on or after the beginning of the annual reportingperiod in which the entity first applies the amendments. Retrospective application is onlypermitted if this is possible without the use of hindsight.
Amendments to PAS 40, Investment Property, Transfers of Investment PropertyThe amendments clarify when an entity should transfer property, including property underconstruction or development into, or out of investment property. The amendments state that achange in use occurs when the property meets, or ceases to meet, the definition of investmentproperty and there is evidence of the change in use. A mere change in management’s intentionsfor the use of a property does not provide evidence of a change in use. The amendments should beapplied prospectively to changes in use that occur on or after the beginning of the annual reportingperiod in which the entity first applies the amendments. Retrospective application is onlypermitted if this is possible without the use of hindsight.
Philippine Interpretation IFRIC-22, Foreign Currency Transactions and Advance ConsiderationThe interpretation clarifies that in determining the spot exchange rate to use on initial recognitionof the related asset, expense or income (or part of it) on the derecognition of a non-monetary asset

-40 -
*SGVFS023363*
or non-monetary liability relating to advance consideration, the date of the transaction is the dateon which an entity initially recognizes the nonmonetary asset or non-monetary liability arisingfrom the advance consideration. If there are multiple payments or receipts in advance, then theentity must determine a date of the transactions for each payment or receipt of advanceconsideration. The interpretation may be applied on a fully retrospective basis. Entities mayapply the interpretation prospectively to all assets, expenses and income in its scope that areinitially recognized on or after the beginning of the reporting period in which the entity firstapplies the interpretation or the beginning of a prior reporting period presented as comparativeinformation in the financial statements of the reporting period in which the entity first applies theinterpretation.
Effective beginning on or after January 1, 2019PFRS 16, LeasesUnder the new standard, lessees will no longer classify their leases as either operating or financeleases in accordance with PAS 17, Leases. Rather, lessees will apply the single-asset model.Under this model, lessees will recognize the assets and related liabilities for most leases on theirbalance sheets, and subsequently, will depreciate the lease assets and recognize interest on thelease liabilities in their profit or loss. Leases with a term of 12 months or less or for which theunderlying asset is of low value are exempted from these requirements. The accounting by lessorsis substantially unchanged as the new standard carries forward the principles of lessor accountingunder PAS 17. Lessors, however, will be required to disclose more information in their financialstatements, particularly on the risk exposure to residual value. Entities may early adopt PFRS 16but only if they have also adopted PFRS 15. When adopting PFRS 16, an entity is permitted touse either a full retrospective or a modified retrospective approach, with options to use certaintransition reliefs. The Group is currently assessing the impact of adopting PFRS 16.
Philippine Interpretation IFRIC-22, Foreign Currency Transactions and Advance ConsiderationThe interpretation clarifies that in determining the spot exchange rate to use on initial recognitionof the related asset, expense or income (or part of it) on the derecognition of a non-monetary assetor non-monetary liability relating to advance consideration, the date of the transaction is the dateon which an entity initially recognizes the nonmonetary asset or non-monetary liability arisingfrom the advance consideration. If there are multiple payments or receipts in advance, then theentity must determine a date of the transactions for each payment or receipt of advanceconsideration. The interpretation may be applied on a fully retrospective basis. Entities may applythe interpretation prospectively to all assets, expenses and income in its scope that are initiallyrecognized on or after the beginning of the reporting period in which the entity first applies theinterpretation or the beginning of a prior reporting period presented as comparative information inthe financial statements of the reporting period in which the entity first applies the interpretation.
Deferred effectivityAmendments to PFRS 10 and PAS 28, Sale or Contribution of Assets between an Investor and itsAssociate or Joint VentureThe amendments address the conflict between PFRS 10 and PAS 28 in dealing with the loss ofcontrol of a subsidiary that is sold or contributed to an associate or joint venture. The amendmentsclarify that a full gain or loss is recognized when a transfer to an associate or joint ventureinvolves a business as defined in PFRS 3, Business Combinations. Any gain or loss resulting fromthe sale or contribution of assets that does not constitute a business, however, is recognized only tothe extent of unrelated investors’ interests in the associate or joint venture.
On January 13, 2016, the Financial Reporting Standards Council postponed the original effectivedate of January 1, 2016 of the said amendments until the International Accounting StandardsBoard has completed its broader review of the research project on equity accounting that may
-41 -
*SGVFS023363*
result in the simplification of accounting for such transactions and of other aspects of accountingfor associates and joint ventures.
Philippine Interpretation IFRIC 15, Agreements for the Construction of Real EstateThis interpretation covers accounting for revenue and associated expenses by entities thatundertake the construction of real estate directly or through subcontractors. The SEC and theFinancial Reporting Standards Council (FRSC) have deferred the effectivity of this interpretation.
3. Significant Accounting Judgments and Estimates
The preparation of the consolidated financial statements in compliance with PFRS requires theGroup to make judgments and estimates that affect the reported amounts of assets, liabilities,income and expenses and disclosure of contingent assets and contingent liabilities. Future eventsmay occur which will cause the assumptions used in arriving at the estimates to change. Theeffects of any change in estimates are reflected in the consolidated financial statements, as theybecome reasonably determinable.
Judgments and estimates are continually evaluated and are based on historical experience andother factors, including expectations of future events that are believed to be reasonable under thecircumstances.
JudgmentsIn the process of applying the Group’s accounting policies, management has made the followingjudgments, apart from those involving estimations, which have the most significant effect on theamounts recognized in the consolidated financial statements:
a. Classification of financial instrumentsThe Group exercises judgment in classifying a financial instrument, or its component parts, oninitial recognition as either a financial asset, a financial liability or an equity instrument inaccordance with the substance of the contractual arrangement and the definitions of a financialasset, a financial liability or an equity instrument. The substance of a financial instrument,rather than its legal form, governs its classification in the consolidated statement of financialposition.
In addition, the Group classifies financial assets by evaluating, among others, whether theasset is quoted or not in an active market. Included in the evaluation on whether a financialasset is quoted in an active market is the determination on whether quoted prices are readilyand regularly available, and whether those prices represent actual and regularly occurringmarket transactions on an arm’s length basis.
b. Determination of fair values of financial instrumentsThe Group carries certain financial assets and liabilities at fair value, which requires extensiveuse of accounting estimates and judgment. While significant components of fair valuemeasurement were determined using verifiable objective evidence (i.e., foreign exchangerates, interest rates, volatility rates), the amount of changes in fair value would differ if theGroup utilized different valuation methodologies and assumptions. Any change in fair valueof these financial assets and liabilities would affect the consolidated statements ofcomprehensive income.
Where the fair values of certain financial assets and financial liabilities recorded in theconsolidated statements of financial position cannot be derived from active markets, they are

-42 -
*SGVFS023363*
determined using internal valuation techniques using generally accepted market valuationmodels. The inputs to these models are taken from observable markets where possible, butwhere this is not feasible, estimates are used in establishing fair values. The judgmentsinclude considerations of liquidity and model inputs such as correlation and volatility forlonger dated derivatives. Refer to Note 5 for the fair value measurements of financialinstruments.
c. Revenue from real estate salesSelecting an appropriate revenue recognition method for a particular real estate saletransaction requires certain judgment based on, among others:∂ buyer’s commitment on the sale which may be ascertained through the significance of the
buyer’s initial investment (buyer’s equity); and∂ stage of completion of the project determined using cost-to-cost method.
The Group has set a certain percentage of collection over the total selling price in determiningbuyer’s commitment on the sale. It is when the buyer’s investment is considered adequate tomeet the probability criteria that economic benefits will flow to the Group.
The related balances from real estate sales transactions follow:
2016 2015 2014Revenue P=6,952,804,308 P=6,378,365,315 P=5,650,781,444Cost and expenses 4,138,509,247 3,250,836,782 3,043,254,449
d. Classification of leasesOperating LeaseOperating lease commitments - Group as lesseeThe Group has entered into leases on premises it uses for its operations. The Group hasdetermined, based on evaluation of the terms and conditions of the lease agreements that thesignificant risk and rewards of ownership to these properties did not transfer to the Group. Indetermining this, the Group considers the following:
∂ the lease does not transfer the ownership of the asset to the lessee by the end of the leaseterm; and
∂ the related lease term do not approximate the EUL of the assets being leased.
Operating lease commitments - Group as lessorBased on the evaluation of the terms and conditions of the arrangements, the Group hasdetermined that it retains all significant risks and rewards of ownership to these properties. Indetermining this, the Group considers, the following:
∂ the leases do not provide for an option to purchase or transfer ownership of the property atthe end of the lease; and
∂ the related lease term do not approximate the EUL of the assets being leased.
Finance LeaseGroup as lessorThe Group has determined based on evaluation of terms and conditions of the leasearrangements (i.e., present value of minimum lease payments receivable amounts to at leastsubstantially all of the fair value of leased asset, lease term if for the major part of theeconomic useful life of the asset, and lessor’s losses associated with the cancellation are

-43 -
*SGVFS023363*
borned by the lessee) that it has transferred all significant risks and rewards of ownership ofthe peroperties it leases out on finance leases.
Group as lesseeThe Group has determined based on evaluation of terms and conditions of the leasearrangements (i.e., present value of minimum lease payments payable amounts to at leastsubstantially all of the fair value of leased asset, lease term if for the major part of theeconomic useful life of the asset, and lessor’s losses associated with the cancellation areborned by the lessee) that it has obtained all significant risks and rewards of ownership of theperoperties it leased on finance leases.
Refer to Note 42 for the disclosure on the Group’s leases.
e. Distinction between investment properties and owner-occupied propertiesThe Group determines whether a property qualifies as an investment property. In making itsjudgment, the Group considers whether the property is not occupied substantially for use by,or in operations of the Group, nor for sale in the ordinary course of business, but are heldprimarily to earn rental income and capital appreciation. Owner-occupied properties generatecash flows that are attributable not only to the property but also to the other assets used in theproduction or supply process.
Some properties comprise a portion that is held to earn rentals or for capital appreciation andanother portion that is held for use in the production or supply of goods or services or foradministrative purposes. If these portions cannot be sold separately, the property is accountedfor as an investment property, only if an insignificant portion is held for use in the productionor supply of goods or services or for administrative purposes. Judgment is applied indetermining whether ancillary services are so significant that a property does not qualify as aninvestment property. The Group considers each property separately in making its judgment.
f. Consolidation of SPEsThe Group periodically undertakes transactions that may involve obtaining the right to controlor significantly influence the operations of other companies. These transactions include thepurchase of aircraft and assumption of certain liabilities. Also included are transactionsinvolving SPEs and similar vehicles. In all such cases, management makes an assessment asto whether the Group has the right to control or significantly influence the SPE, and based onthis assessment, the SPE is consolidated as a subsidiary or an associated company. In makingthis assessment, management considers the underlying economic substance of the transactionand not only the contractual terms.
g. Determination of functional currencyPAS 21, The Effects of Changes in Foreign Exchange Rates, requires management to use itsjudgment to determine an entity’s functional currency such that it most faithfully representsthe economic effects of the underlying transactions, events and conditions that are relevant tothe entity. In making this judgment, each entity in the Group considers the following:
a. the currency that mainly influences sales prices for financial instruments and services (thiswill often be the currency in which sales prices for its financial instruments and servicesare denominated and settled);
b. the currency in which funds from financing activities are generated; andc. The currency in which receipts from operating activities are usually retained.

-44 -
*SGVFS023363*
In the case of an intermediate holding company or finance subsidiary, the principalconsideration of management is whether it is an extension of the Parent Company andperforming the functions of the Parent Company - i.e., whether its role is simply to hold theinvestment in, or provide finance to, the foreign operation on behalf of the Parent Company orwhether its functions are essentially an extension of a local operation (e.g., performing selling,payroll or similar activities for that operation) or indeed it is undertaking activities on its ownaccount. In the former case, the functional currency of the entity is the same with that of theParent Company; while in the latter case, the functional currency of the entity would beassessed separately.
h. Significant influence over an associate with less than 20.0% ownershipIn determining whether the Group has significant influence over an investee requiressignificant judgment. Generally, a shareholding of 20.0% to 50.0% of the voting rights of aninvestee is presumed to give the Group a significant influence.
There are instances that an investor exercises significant influence even if its ownership is lessthan 20.0%. The Group applies significant judgment in assessing whether it holds significantinfluence over an investee and considers the following: (a) representation on the board ofdirectors or equivalent governing body of the investee; (b) participation in policy-makingprocesses, including participation in decisions about dividends or other distributions;(c) material transactions between the investor and the investee; (d) interchange of managerialpersonnel; or (e) provision of essential technical information.
i. ContingenciesThe Group is currently involved in certain legal proceedings. The estimate of the probablecosts for the resolution of these claims has been developed in consultation with outsidecounsel handling the defense in these matters and is based upon an analysis of potentialresults. The Group currently does not believe these proceedings will have a material effect onthe Group’s consolidated financial position. It is possible, however, that future results ofoperations could be materially affected by changes in the estimates or in the effectiveness ofthe strategies relating to these proceedings (see Note 43).
EstimatesThe key assumptions concerning the future and other sources of estimation uncertainty at thereporting date that have a significant risk of causing a material adjustment to the carrying amountsof assets and liabilities within the next year are discussed below:
a. Revenue and cost recognitionThe Group’s revenue recognition policies require use of estimates and assumptions that mayaffect the reported amounts of revenue and costs.
∂ Sale of real estateThe Group’s revenue from real estate sales are recognized based on the percentage-of-completion and the completion rate is measured principally on the basis of the estimatedcompletion by reference to the actual costs incurred to date over the estimated total costsof the project.
The related balances from real estate transactions follow:
2016 2015 2014Revenue P=6,952,804,308 P=6,378,365,315 P=5,650,781,444Cost and expenses 4,138,509,247 3,250,836,782 3,043,254,449

-45 -
*SGVFS023363*
∂ Rendering of transportation servicesPassenger sales are recognized as revenue when the obligation of the Group to providetransportation service ceases, either: (a) when transportation services are already rendered;(b) carriage is provided or (c) when the flight is uplifted.
The balances of the Group’s ‘Unearned transportation revenue’ is disclosed in Note 22 tothe consolidated financial statements. Ticket sales that are not expected to be used fortransportation are recognized as revenue using estimates regarding the timing ofrecognition based on the terms and conditions of the tickets and historical trends.
b. Impairment of AFS investmentsAFS debt investmentsThe Group classifies certain financial assets as AFS debt investments and recognizesmovements in the fair value in other comprehensive income in the consolidated statement ofcomprehensive income. When the fair value declines, management makes assumptions aboutthe decline in value to determine whether it is an impairment loss that should be recognized inprofit or loss in the consolidated statement of comprehensive income.
In 2016, 2015 and 2014, the Group did not recognize impairment losses on its AFS debtinvestments.
The carrying value of the Group’s AFS debt investments is disclosed in Note 10 to theconsolidated financial statements.
AFS equity investmentsThe Group treats AFS equity investments as impaired, when there has been a significant orprolonged decline in the fair value below its cost or where other objective evidence ofimpairment exists. The determination of what is ‘significant’ or ‘prolonged’ requiresjudgment. The Group treats ‘significant’ generally as 20.0% or more and ‘prolonged’ asgreater than 12 months for quoted equity securities. In addition, the Group evaluates otherfactors, including the normal volatility in share price for quoted equities and the future cashflows and the discount factors for unquoted equities.
In 2016, the Group recognized impairment loss on its AFS equity instruments amounting toP=16.7 billion. In 2015 and 2014, the Group did not recognize impairment losses on its AFSequity investments.
The carrying value of the Group’s AFS equity investments is disclosed in Note 10 to theconsolidated financial statements.
c. Impairment of goodwill and intangible assetsThe Group performed its annual impairment test on its goodwill and other intangible assetswith indefinite useful lives as of reporting date. The recoverable amounts of the intangibleassets were determined based on value in use calculations using cash flow projections fromfinancial budgets approved by management covering a five-year period. The pre-tax discountrates applied to cash flow projections range from 9.05% to 10.00%. The followingassumptions were also used in computing value in use:
Growth rate estimates - growth rates include long-term and terminal growth rates that arebased on experiences and strategies developed for the various subsidiaries. The prospect forthe industry was also considered in estimating the growth rates.

-46 -
*SGVFS023363*
Discount rates - discount rates were estimated based on the industry weighted average cost ofcapital, which includes the cost of equity and debt after considering the gearing ratio.
Value-in-use is the most sensitive to changes in discount rate and growth rate.
As of December 31, 2016 and 2015, the balance of the Group’s goodwill and intangible assets,net of accumulated depreciation, amortization and impairment loss follow:
2016 2015Goodwill (Note 19) 32,023,183,943 15,517,919,985Intangible assets (Note 18) 14,159,003,493 9,032,757,553
d. Determination of the fair value of intangible assets and property, plant and equipmentacquired in a business combinationThe Group measures the identifiable assets and liabilities acquired in a business combinationat fair value at the date of acquisition.
The fair value of the intangible assets acquired in a business combination is determined basedon the net sales forecast attributable to the intangible assets, growth rate estimates and royaltyrates using comparable license agreements. Royalty rates are based on the estimated arm’slength royalty rate that would be paid for the use of the intangible assets. Growth rateestimate includes long-term growth rate and terminal growth rate applied to future cash flowsbeyond the projection period.
The fair value of property, plant and equipment acquired in a business combination isdetermined based on comparable properties after adjustments for various factors such aslocation, size and shape of the property. Cost information and current prices of comparableequipment are also utilized to determine the fair value of equipment.
The Group’s acquistions are discussed in Note 44 to the consolidated financial statements.
e. Estimation of allowance for impairment losses on receivablesThe Group maintains allowances for impairment losses on trade and other receivables at alevel considered adequate to provide for potential uncollectible receivables. The level of thisallowance is evaluated by management on the basis of factors that affect the collectibility ofthe accounts. These factors include, but are not limited to, the length of relationship with thecustomer, the customer’s payment behavior and known market factors. The Group reviewsthe age and status of the receivables, and identifies accounts that are to be provided withallowances on a continuous basis. The Group provides full allowance for trade and otherreceivables that it deems uncollectible.
The amount and timing of recorded expenses for any period would differ if the Group madedifferent judgments or utilized different estimates. An increase in the allowance forimpairment losses on receivables would increase recorded operating expenses and decreasecurrent assets.
Provisions for impairment losses on receivables, included in ‘Impairment losses and others’ inprofit or loss in the consolidated statements of comprehensive income are disclosed inNotes 11 and 34 to the consolidated financial statements.
The carrying value of the Group’s total receivables, net of allowance for impairment losses, isdisclosed in Note 11 to the consolidated financial statements.

-47 -
*SGVFS023363*
f. Determination of NRV of inventoriesThe Group, in determining the NRV, considers any adjustment necessary for obsolescencewhich is generally providing a 100.0% write down for nonmoving items for more than oneyear. The Group adjusts the cost of inventory to the recoverable value at a level consideredadequate to reflect any market decline in the value of the recorded inventories. The Groupreviews the classification of the inventories and generally provides adjustments forrecoverable values of new, actively sold and slow-moving inventories by reference toprevailing values of the same inventories in the market.
The amount and timing of recorded expenses for any period would differ if differentjudgments were made or different estimates were utilized. An increase in inventoryobsolescence and market decline would increase recorded operating expenses and decreasecurrent assets.
Inventory obsolescence and market decline included under ‘Impairment losses and others’ inprofit or loss in the consolidated statements of comprehensive income are disclosed inNotes 12 and 34 to the consolidated financial statements.
The carrying value of the Group’s inventories, net of inventory obsolescence and marketdecline, is disclosed in Note 12 to the consolidated financial statements.
g. Estimation of AROThe Group is contractually required under certain lease contracts to restore certain leasedpassenger aircraft to stipulated return condition and to bear the costs of restoration at the endof the contract period. These costs are accrued based on an internal estimate which includesestimates of certain redelivery costs at the end of the operating aircraft lease. The contractualobligation includes regular aircraft maintenance, overhaul and restoration of the leased aircraftto its original condition. Regular aircraft maintenance is accounted for as expense whenincurred, while overhaul and restoration are accounted on an accrual basis.
Assumptions used to compute ARO are reviewed and updated annually by the Group. Thecost of restoration is computed based on the Group’s average borrowing cost.
The amount and timing of recorded expenses for any period would differ if differentjudgments were made or different estimates were utilized. The recognition of ARO wouldincrease other noncurrent liabilities and repairs and maintenance expense.
The carrying values of the Group’s ARO (included under ‘Other noncurrent liabilities’ in theconsolidated statements of financial position) is disclosed in Note 24 to the consolidatedfinancial statements.
h. Estimation of useful lives of property, plant and equipment, investment properties, intangibleassets with finite life and biological assets at costThe Group estimates the useful lives of its depreciable property, plant and equipment,investment properties, intangible assets with finite life and biological assets at cost based onthe period over which the assets are expected to be available for use. The EUL of the saiddepreciable assets are reviewed at least annually and are updated, if expectations differ fromprevious estimates due to physical wear and tear and technical or commercial obsolescence onthe use of these assets. It is possible that future results of operations could be materiallyaffected by changes in these estimates brought about by changes in the factors mentionedabove. A reduction in the EUL of the depreciable property, plant and equipment, investment

-48 -
*SGVFS023363*
properties and intangible assets would increase depreciation and amortization expense anddecrease noncurrent assets.
The carrying balances of the Group’s depreciable assets are disclosed in notes 15, 16, 17 and18 to the consolidated financial statements.
i. Determination of fair values less estimated costs to sell of biological assetsThe fair values of biological assets are determined based on current market prices of livestockof similar age, breed and genetic merit. Costs to sell costs include commissions to brokers anddealers, nonrefundable transfer taxes and duties. Costs to sell exclude transportation and othercosts necessary to get the biological assets to the market. The fair values are reviewed andupdated, if expectations differ from previous estimates due to changes brought by bothphysical change and price changes in the market. It is possible that future results of operationscould be materially affected by changes in these estimates brought about by the changes infactors mentioned.
The Group recognized gains arising from changes in the fair market value of biological assets(included in ‘Cost of sales and services’ in profit or loss in the consolidated statements ofcomprehensive income) amounting to P=95.6 million, P=57.0 million and P=257.9 million in2016, 2015 and 2014, respectively (see Note 17).
The carrying value of the Group’s biological assets carried at fair values less estimated coststo sell is disclosed in Note 17 to the consolidated financial statements.
j. Estimation of pension and other benefits costsThe determination of the obligation and cost of pension and other employee benefits isdependent on the selection of certain assumptions used in calculating such amounts. Thoseassumptions include, among others, discount rates and salary increase rates (see Note 37).Actual results that differ from the Group’s assumptions are accumulated and amortized overfuture periods and therefore, generally affect the recognized expense and recorded obligationin such future periods.
The present value of the defined benefit obligation is determined by discounting the estimatedfuture cash outflows using interest rates of Philippine government bonds with terms consistentwith the expected employee benefit payout as of reporting date.
As of December 31, 2016 and 2015, the balance of the Group’s present value of definedbenefit obligations and other employee benefits is shown in Note 37 to the consolidatedfinancial statements.
k. Assessment of impairment on property, plant and equipment, investment properties,investments in associates and joint ventures, biological assets carried at cost, and otherintangible assetsThe Group assesses impairment on its property, plant and equipment, investment properties,investments in associates and joint ventures, biological assets carried at cost and goodwill andother intangible assets whenever events or changes in circumstances indicate that the carryingamount of an asset may not be recoverable. The factors that the Group considers importantwhich could trigger an impairment review include the following:
∂ Significant underperformance relative to expected historical or projected future operatingresults;

-49 -
*SGVFS023363*
∂ Significant changes in the manner of use of the acquired assets or the strategy for overallbusiness; and
∂ Significant negative industry or economic trends.
The Group determines an impairment loss whenever the carrying amount of an asset exceedsits recoverable amount, which is the higher of its fair value less costs to sell and its value inuse. The fair value less costs to sell calculation is based on available data from binding salestransactions in an arm’s length transaction of similar assets or observable market prices lessincremental costs for disposing of the asset. The value in use calculation is based on adiscounted cash flow model. The cash flows are derived from the budget for the next fiveyears and do not include restructuring activities that the Group is not yet committed to orsignificant future investments that will enhance the asset base of the cash-generating unitbeing tested. The recoverable amount is most sensitive to the discount rate used for thediscounted cash flow model as well as the expected future cash inflows and the growth rateused for extrapolation purposes.
In the case of goodwill and intangible assets with indefinite lives, at a minimum, such assetsare subject to an annual impairment test and more frequently whenever there is an indicationthat such asset may be impaired. This requires an estimation of the value in use of the cash-generating units to which the goodwill is allocated. Estimating the value in use requires theGroup to make an estimate of the expected future cash flows from the cash-generating unitand to choose a suitable discount rate in order to calculate the present value of those cashflows.
Provision for impairment losses on nonfinancial assets recognized in 2016, 2015 and 2014 isdisclosed in Note 34 to the consolidated financial statements. The net realizable value ofnonfinancial assets with impairment amounted to P=12.9 million in 2016 and 2015.
As of December 31, 2016 and 2015, the balance of the Group’s nonfinancial assets, net ofaccumulated depreciation, amortization and impairment loss follow:
2016 2015Property, plant and equipment (Note 16) P=175,662,713,462 P=159,836,100,377Investment properties (Note 15) 75,416,372,370 67,258,434,671Investments in associates and joint ventures (Note 14) 127,952,235,708 114,776,087,906Intangible assets (Note 18) 14,159,003,493 9,032,757,553
l. Recognition of deferred tax assetsThe Group reviews the carrying amounts of its deferred tax assets at each reporting date andreduces the deferred tax assets to the extent that it is no longer probable that sufficient taxableincome will be available to allow all or part of the deferred tax assets to be utilized. However,there is no assurance that the Group will generate sufficient taxable income to allow all or partof deferred tax assets to be utilized.
The Group’s recognized deferred tax assets are shown in Note 38.
The Group has certain subsidiaries which enjoy the benefits of an income tax holiday (ITH).As such, no deferred tax assets were set up on certain gross deductible temporary differencesthat are expected to reverse or expire within the ITH period (see Note 38).
The total amount of temporary differences, for which the Group did not recognize anydeferred tax assets are shown in Note 38.
-50 -
*SGVFS023363*
4. Financial Risk Management Objectives and Policies
The Group’s principal financial instruments, other than derivative financial instruments, comprisecash and cash equivalents, financial assets at FVPL, HTM investments, AFS investments, interest-bearing loans and borrowings and payables and other financial liabilities. The main purpose ofthese financial instruments is to finance the Group’s operations and related capital expenditures.The Group has various other financial assets and financial liabilities, such as trade receivables andpayables which arise directly from its operations. Also, the Parent Company and certainsubsidiaries are counterparties to derivative contracts, such as interest rate swaps, currencyforwards, cross currency swaps, currency options and commodity swaps and options. Thesederivatives are entered into as a means of reducing or managing their respective foreign exchangeand interest rate exposures.
The BODs of the Parent Company and its subsidiaries review and approve the policies formanaging each of these risks which are summarized below, together with the related riskmanagement structure.
Risk Management StructureThe BOD of the Parent Company and the respective BODs of each subsidiary are ultimatelyresponsible for the oversight of the Group’s risk management processes that involve identifying,measuring, analyzing, monitoring and controlling risks.
The risk management framework encompasses environmental scanning, the identification andassessment of business risks, development of risk management strategies, design andimplementation of risk management capabilities and appropriate responses, monitoring risks andrisk management performance, and identification of areas and opportunities for improvement inthe risk management process.
Each BOD has created the board-level Audit Committee (AC) to spearhead the managing andmonitoring of risks.
ACThe AC shall assist the Group’s BOD in its fiduciary responsibility for the over-all effectivenessof risk management systems and the internal audit functions of the Group. Furthermore, it is alsothe AC’s purpose to lead in the general evaluation and to provide assistance in the continuousimprovements of risk management, control and governance processes.
The AC also aims to ensure that:
a. financial reports comply with established internal policies and procedures, pertinentaccounting and audit standards and other regulatory requirements;
b. risks are properly identified, evaluated and managed, specifically in the areas of managingcredit, market, liquidity, operational, legal and other risks, and crisis management;
c. audit activities of internal auditors are done based on plan, and deviations are explainedthrough the performance of direct interface functions with the internal auditors; and
d. the Group’s BOD is properly assisted in the development of policies that would enhance therisk management and control systems.

-51 -
*SGVFS023363*
Enterprise Risk Management Group (ERMG)The ERMG was created to be primarily responsible for the execution of the enterprise riskmanagement framework. The ERMG’s main concerns include:
a. recommendation of risk policies, strategies, principles, framework and limits;b. management of fundamental risk issues and monitoring of relevant risk decisions;c. support to management in implementing the risk policies and strategies; andd. development of a risk awareness program.
Corporate Governance Compliance OfficerCompliance with the principles of good corporate governance is one of the objectives of theGroup’s BOD. To assist the Group’s BOD in achieving this purpose, the Group’s BOD hasdesignated a Compliance Officer who shall be responsible for monitoring the actual compliance ofthe Group with the provisions and requirements of good corporate governance, identifying andmonitoring control compliance risks, determining violations, and recommending penalties for suchinfringements for further review and approval of the Group’s BOD, among others.
Day-to-day risk management functionsAt the business unit or company level, the day-to-day risk management functions are handled byfour different groups, namely:
1. Risk-taking Personnel. This group includes line personnel who initiate and are directlyaccountable for all risks taken.
2. Risk Control and Compliance. This group includes middle management personnel whoperform the day-to-day compliance check to approved risk policies and risk mitigationdecisions.
3. Support. This group includes back office personnel who support the line personnel.4. Risk Management. This group pertains to the business unit’s Management Committee which
makes risk-mitigating decisions within the enterprise-wide risk management framework.
Enterprise Resource Management (ERM) FrameworkThe Parent Company’s BOD is also responsible for establishing and maintaining a sound riskmanagement framework and is accountable for risks taken by the Parent Company. The ParentCompany’s BOD also shares the responsibility with the ERMG in promoting the risk awarenessprogram enterprise-wide.
The ERM framework revolves around the following eight interrelated risk managementapproaches:
1. Internal Environmental Scanning. It involves the review of the overall prevailing risk profileof the business unit to determine how risks are viewed and addressed by management. This ispresented during the strategic planning, annual budgeting and mid-year performance reviewsof the Group.
2. Objective Setting. The Group’s BOD mandates the business unit’s management to set theoverall annual targets through strategic planning activities, in order to ensure that managementhas a process in place to set objectives which are aligned with the Group’s goals.
3. Event Identification. It identifies both internal and external events affecting the Group’s settargets, distinguishing between risks and opportunities.

-52 -
*SGVFS023363*
4. Risk Assessment. The identified risks are analyzed relative to the probability and severity ofpotential loss which serves as a basis for determining how the risks should be managed. Therisks are further assessed as to which risks are controllable and uncontrollable, risks thatrequire management’s attention, and risks which may materially weaken the Group’s earningsand capital.
5. Risk Response. The Group’s BOD, through the oversight role of the ERMG, approves thebusiness unit’s responses to mitigate risks, either to avoid, self-insure, reduce, transfer or sharerisk.
6. Control Activities. Policies and procedures are established and approved by the Group’s BODand implemented to ensure that the risk responses are effectively carried out enterprise-wide.
7. Information and Communication. Relevant risk management information are identified,captured and communicated in form and substance that enable all personnel to perform theirrisk management roles.
8. Monitoring. The ERMG, Internal Audit Group, Compliance Office and Business AssessmentTeam constantly monitor the management of risks through risk limits, audit reviews,compliance checks, revalidation of risk strategies and performance reviews.
Risk management support groupsThe Group’s BOD created the following departments within the Group to support the riskmanagement activities of the Parent Company and the other business units:
1. Corporate Security and Safety Board (CSSB). Under the supervision of ERMG, the CSSBadministers enterprise-wide policies affecting physical security of assets exposed to variousforms of risks.
2. Corporate Supplier Accreditation Team (CORPSAT). Under the supervision of ERMG, theCORPSAT administers enterprise-wide procurement policies to ensure availability of suppliesand services of high quality and standards to all business units.
3. Corporate Management Services (CMS). The CMS is responsible for the formulation ofenterprise-wide policies and procedures.
4. Corporate Planning (CORPLAN). The CORPLAN is responsible for the administration ofstrategic planning, budgeting and performance review processes of business units.
5. Corporate Insurance Department (CID). The CID is responsible for the administration of theinsurance program of business units concerning property, public liability, businessinterruption, money and fidelity, and employer compensation insurances, as well as, in theprocurement of performance bonds.
Risk Management PoliciesThe main risks arising from the use of financial instruments are credit risk, liquidity risk andmarket risk, such as foreign currency risk, commodity price risk, equity price risk and interest raterisk. The Group’s policies for managing the aforementioned risks are summarized below.
Credit riskCredit risk is the risk that one party to a financial instrument will fail to discharge an obligationand cause the other party to incur a financial loss. The Group transacts only with recognized,

-53 -
*SGVFS023363*
creditworthy third parties. It is the Group’s policy that all customers who wish to trade on creditterms are subject to credit verification procedures. In addition, receivable balances are monitoredon an ongoing basis with the result that the Group’s exposure to bad debts is not significant.
The Group continuously provides credit notification and implements various credit actions,depending on assessed risks, to minimize credit exposure. Receivable balances of trade customersare being monitored on a regular basis and appropriate credit treatments are executed for overdueaccounts. Likewise, other receivable balances are also being monitored and subjected toappropriate actions to manage credit risk.
With respect to credit risk arising from other financial assets of the Group, which comprise cashand cash equivalents, financial assets at FVPL, AFS investments and certain derivativeinvestments, the Group’s exposure to credit risk arises from default of the counterparty with amaximum exposure equal to the carrying amount of these instruments.
The Group has a counterparty credit risk management policy which allocates investment limitsbased on counterparty credit ratings and credit risk profile.
a. Credit risk exposure
The Group’s maximum exposure to on-balance sheet credit risk is equal to the carrying valueof its financial assets except for the following accounts:
2016
GrossMaximumExposure
Fair Value ofCollateral or
CreditEnhancement
Financial Effectof Collateral or
CreditEnhancement
NetExposure
Loans and receivables:Trade receivables P=96,000,000 P=96,352,096 P=96,000,000 P=−Finance receivables:
Commercial 8,472,128,175 3,249,062,324 2,966,644,526 5,505,483,649Real estate 5,352,677,002 9,248,284,662 5,001,508,450 351,168,552Consumption 1,685,810,649 1,838,552,078 1,448,140,640 237,670,009
Other receivables 46,124,679 82,823,176 45,417,018 707,661Total credit risk exposure P=15,652,740,505 P=14,515,074,336 P=9,557,710,634 P=6,095,029,871
2015
GrossMaximumExposure
Fair Value ofCollateral or
CreditEnhancement
Financial Effectof Collateral or
CreditEnhancement
NetExposure
Loans and receivables:Trade receivables P=97,000,000 P=97,863,514 P=97,000,000 P=–Finance receivables:
Commercial 2,271,354,509 5,255,889,462 2,070,859,508 200,495,001Real estate 3,839,904,090 9,376,012,565 3,761,589,109 78,314,981Consumption 1,152,388,712 2,571,248,000 1,119,781,029 32,607,683
Other receivables 64,869,319 132,430,461 44,694,008 20,175,311Total credit risk exposure P=7,425,516,630 P=17,433,444,002 P=7,093,923,654 P=331,592,976
Collateral and other credit enhancementsThe Group holds collateral in the form of cash bonds, real estate and chattel mortgages andgovernment securities. The amount and type of collateral required depends on an assessmentof credit risk. Guidelines are implemented regarding the acceptability of types of collateraland valuation parameters. It is the Group’s policy to dispose of repossessed properties in anorderly fashion. In general, the proceeds are used to reduce or repay the outstanding claim,and are not occupied for business use.

-54 -
*SGVFS023363*
b. Risk concentrations of the maximum exposure to credit risk
Concentrations arise when a number of counterparties are engaged in similar businessactivities or activities in the same geographic region or have similar economic features thatwould cause their ability to meet contractual obligations to be similarly affected by changes ineconomic, political or other conditions. Concentrations indicate the relative sensitivity of theGroup’s performance to developments affecting a particular industry or geographical location.Such credit risk concentrations, if not properly managed, may cause significant losses thatcould threaten the Group's financial strength and undermine public confidence.
The Group’s policies and procedures include specific guidelines to focus on maintaining adiversified portfolio. In order to avoid excessive concentrations of risks, identifiedconcentrations of credit risks are controlled and managed accordingly.
i. Concentration by geographical location
The Group’s credit risk exposures as of December 31, 2016 and 2015, before taking intoaccount any collateral held or other credit enhancements, is categorized by geographiclocation as follows:
Philippines
Asia(excluding
Philippines)UnitedStates Europe Others* Total
Cash and cash equivalents** P=33,884,142,540 P=5,477,281,545 P=– P=574,147,908 P=1,359,455,924 P=41,295,027,917Financial assets at FVPL: Held-for-trading: Debt securities: Private 1,966,086,674 3,102,456,348 1,653,094,284 2,763,707,992 233,835,032 9,719,180,330 Government 993,779,175 728,964,356 – – – 1,722,743,531 Derivatives 1,421,644 – 477,534,717 – – 478,956,361
2,961,287,493 3,831,420,704 2,130,629,001 2,763,707,992 233,835,032 11,920,880,222 Equity securities: Quoted 1,197,749,259 593,735,747 386,673,362 497,983,083 103,123,892 2,779,265,343 Unquoted – 3,729 – – – 3,729
1,197,749,259 593,739,476 386,673,362 497,983,083 103,123,892 2,779,269,0724,159,036,752 4,425,160,180 2,517,302,363 3,261,691,075 336,958,924 14,700,149,294
Derivative assets: Designated as
accounting hedges – – – – 26,800,472 26,800,472– – – – 26,800,472 26,800,472
AFS investments: Debt securities: Government 8,967,256,990 613,087,660 – – − 9,580,344,650 Private 3,239,185,098 770,593,654 190,637,289 32,641,180 – 4,233,057,221
12,206,442,088 1,383,681,314 190,637,289 32,641,180 – 13,813,401,871 Equity securities: Quoted 24,115,751,655 – – 1,122,503,580 – 25,238,255,235 Unquoted 24,293,371 – – − – 24,293,371
24,140,045,026 – – 1,122,503,580 – 25,262,548,60636,346,487,114 1,383,681,314 190,637,289 1,155,144,760 39,075,950,477
Held-to-maturity investment 3,549,900,604 − − − − 3,549,900,604Receivables: Finance receivables 38,004,283,010 − − − − 38,004,283,010 Trade receivables 17,704,004,196 5,550,455,681 36,206,256 116,719,375 2,833,847,588 26,241,233,096 Due from related parties 423,027,570 994,483,279 − − − 1,417,510,849 Interest receivable 615,462,849 69,116,950 34,360,710 35,010,319 3,242,406 757,193,234 Other receivables*** 1,229,144,374 226,281,008 − − 94,766 1,455,520,148
57,975,921,999 6,840,336,918 70,566,966 151,729,694 2,837,184,760 67,875,740,337Refundable security deposits
(included under ‘Othercurrent’ and ‘Othernoncurrent assets’ in theconsolidated statements offinancial position) 691,891,925 − − 29,182,000 − 721,073,925
P=136,607,380,934 P=18,126,459,957 P=2,778,506,618 P=5,171,895,437 P=4,560,400,080 P=167,244,643,026* Others include South American countries (i.e., Argentina and Mexico), New Zealand and Australia** Excludes cash on hand amounting to P=2,115,114,050*** Other receivables includes TCCs of Petrochem amounting to P=1,844,979,482

-55 -
*SGVFS023363*
December 31, 2015
Philippines
Asia(excluding
Philippines)UnitedStates Europe Others* Total
Cash and cash equivalents** P=37,045,154,127 P=5,707,692,836 P=– P=20,476,012 P=422,075,875 P=43,195,398,850Financial assets at FVPL: Held-for-trading: Debt securities: Private 2,486,977,530 3,026,156,174 1,010,892,519 2,884,736,893 643,843,581 10,052,606,697 Government 978,541,742 657,811,461 – – – 1,636,353,203 Derivatives – – – – 580,568,726 580,568,726
3,465,519,272 3,683,967,635 1,010,892,519 2,884,736,893 1,224,412,307 12,269,528,626 Equity securities: Quoted 394,576,663 824,029,552 396,964,921 908,383,850 76,807,183 2,600,762,169 Unquoted – 3,530 – – – 3,530
394,576,663 824,033,082 396,964,921 908,383,850 76,807,183 2,600,765,6993,860,095,935 4,508,000,717 1,407,857,440 3,793,120,743 1,301,219,490 14,870,294,325
Derivative assets: Designated as
accounting hedges – – 37,358,957 – – 37,358,957– – 37,358,957 – – 37,358,957
AFS investments: Debt securities: Government 7,503,850,020 613,087,660 – – – 8,116,937,680 Private 1,372,469,761 790,579,133 316,000,700 32,363,162 30,589,019 2,542,001,775
8,876,319,781 1,403,666,793 316,000,700 32,363,162 30,589,019 10,658,939,455 Equity securities: Quoted 35,880,618,093 – – 1,064,497,200 – 36,945,115,293 Unquoted 24,293,371 – – – – 24,293,371
35,904,911,464 – – 1,064,497,200 – 36,969,408,66444,781,231,245 1,403,666,793 316,000,700 1,096,860,362 30,589,019 47,628,348,119
Held-to-maturity investment 2,749,295,603 – – – – 2,749,295,603Receivables: Finance receivables 26,818,867,137 – – – – 26,818,867,137 Trade receivables 16,587,747,555 5,251,045,118 26,892,939 261,645,706 1,369,137,251 23,496,468,569 Due from related parties 1,222,026,008 27,179,536 – – – 1,249,205,544 Interest receivable 519,322,779 63,684,588 27,435,809 40,028,009 10,280,271 660,751,456 Other receivables*** 816,047,296 91,299,929 – – 36,354,219 943,701,444
45,964,010,775 5,433,209,171 54,328,748 301,673,715 1,415,771,741 53,168,994,150Refundable security deposits
(included under ‘Othercurrent’ and ‘Othernoncurrent assets’ in theconsolidated statements offinancial position) 568,195,948 – – 27,135,401 – 595,331,349
Other Current Assets 506,117,342 311,109,747 – – – 817,227,089P=135,474,100,975 P=17,363,679,264 P=1,815,545,845 P=5,239,266,233 P=3,169,656,125 P=163,062,248,442
* Others include South American countries (i.e., Argentina and Mexico) and New Zealand** Excludes cash on hand amounting to P=2,076,709,922*** Other receivables includes TCCs of Petrochem amounting to P=194,365,838

- 56 -
*SGVFS023363*
ii. Concentration by industry
The tables below show the industry sector analysis of the Group’s financial assets as of December 31, 2016 and 2015, before taking into account any collateral held or other creditenhancements.
2016
Manufacturing
Real Estate,Renting and
Related BusinessActivities
Wholesaleand
Retail TradeFinancial
Intermediaries
Transportation,Storage and
Communication
Agricultural,Hunting and
ForestryElectricity,
Gas and Water ConstructionPublic
Administration Others* TotalCash and cash equivalents** P=– P=– P=– P=28,518,198,281 P=– P=– P=– P=− P=10,911,443,456 P=1,865,386,180 P=41,295,027,917Financial assets at FVPL: Held-for-trading: Debt securities: Private 230,595,095 237,373,756 4,608,010,227 497,867,118 1,356,461,199 − − 2,788,872,935 9,719,180,330 Government – – – – – – – − 1,722,743,531 − 1,722,743,531 Derivatives – – – 37,182,456 441,773,905 – – − − − 478,956,361
230,595,095 237,373,756 – 4,645,192,683 939,641,023 – 1,356,461,199 − 1,722,743,531 2,788,872,935 11,920,880,222 Equity securities: Quoted 933,711,240 125,707,649 − 460,590,596 205,508,686 − 213,232,868 − − 840,514,304 2,779,265,343 Unquoted − − − − − − − − − 3,729 3,729
933,711,240 125,707,649 – 460,590,596 205,508,686 – 213,232,868 − − 840,518,033 2,779,269,0721,164,306,335 363,081,405 – 5,105,783,279 1,145,149,709 − 1,569,694,067 − 1,722,743,531 3,629,390,968 14,700,149,294
Derivative financial assets: Designated as an accounting hedge 26,800,472 – – – – – – – 26,800,472
26,800,472 – – – – – – – 26,800,472AFS investments: Debt securities: Government − − − − − − − − 9,580,344,650 − 9,580,344,650 Private 124,893,768 514,130,501 − 2,557,994,028 281,791,732 − 219,845,841 − − 534,401,351 4,233,057,221
124,893,768 514,130,501 – 2,557,994,028 281,791,732 – 219,845,841 9,580,344,650 534,401,351 13,813,401,871 Equity securities: Quoted 11,789,500 139,262,742 23,611,337,005 – – 1,475,865,988 25,238,255,235 Unquoted 7,500,000 – – 5,000,100 11,793,271 24,293,371
11,789,500 – – 146,762,742 23,611,337,005 – – 5,000,100 1,487,659,259 25,262,548,606136,683,268 514,130,501 – 2,704,756,770 23,893,128,737 – 219,845,841 9,585,344,750 2,022,060,610 39,075,950,477
(Forward)

- 57 -
*SGVFS023363*
2016
Manufacturing
Real Estate,Renting and
Related BusinessActivities
Wholesaleand
Retail TradeFinancial
Intermediaries
Transportation,Storage and
Communication
Agricultural,Hunting and
ForestryElectricity,
Gas and Water ConstructionPublic
Administration Others* TotalHeld-to-maturity investment P=596,663,277 P=1,175,000,000 P=− P=350,000,000 P=12,259,994 P=− P=500,000,000 P=− P=520,491,564 P=395,485,769 P=3,549,900,604Receivables: Finance receivables 2,621,318,748 6,845,627,000 5,659,342,197 3,771,234,014 1,574,588,756 414,632,980 1,845,511,776 417,171,049 14,854,856,490 38,004,283,010 Trade receivables 14,902,927,891 9,199,994,574 1,883,241,285 − 255,069,346 26,241,233,096 Due from related parties 425,609,743 25,878,290 261,459,147 520,193,596 124,204,940 60,165,133 1,417,510,849 Interest receivable 49,138,702 54,598,520 18,613,328 151,064,462 18,280,538 6,955,837 21,436,336 1,521,050 70,439,375 365,145,086 757,193,234 Other receivables*** 743,840,012 311,897,933 1,320,370 128,588,214 269,873,619 1,455,520,148
18,742,835,096 16,437,996,317 5,940,735,042 4,442,492,072 3,728,903,733 421,588,817 1,866,948,112 418,692,099 70,439,375 15,805,109,674 67,875,740,337Refundable security deposits (included under ‘Other current’ and ‘Other noncurrent assets’ in the consolidated statements of financial
position) 9,484,999 625,621,082 – – 29,207,200 – – – – 56,760,644 721,073,925P=20,676,773,447 P=19,115,829,305 P=5,940,735,042 P=41,121,230,402 P=28,808,649,373 P=421,588,817 P=4,156,488,020 418,692,099 22,810,462,676 P=23,774,193,845 P=167,244,643,026
*** Others include consumer, community, social and personal services, education, mining and quarrying, and health and social work sectors.** Excludes cash on hand amounting to P=2,076,709,922*** Other receivables includes TCCs of Petrochem amounting to P=194,365,838

- 58 -
*SGVFS023363*
2015
Manufacturing
Real Estate,Renting and
Related BusinessActivities
Wholesaleand
Retail TradeFinancial
Intermediaries
Transportation,Storage and
Communication
Agricultural,Hunting and
ForestryElectricity,
Gas and Water Others* TotalCash and cash equivalents** P=– P=– P=– P=33,908,657,858 P=– P=– P=– 9,286,740,992 P=43,195,398,850Financial assets at FVPL: Held-for-trading: Debt securities: Private 70,285,051 67,990,876 – 5,439,922,258 251,509,535 – 1,040,523,807 3,182,375,170 10,052,606,697 Government – – – – – – – 1,636,353,203 1,636,353,203 Derivatives – – – – – – – 580,568,726 580,568,726
70,285,051 67,990,876 – 5,439,922,258 251,509,535 – 1,040,523,807 5,399,297,099 12,269,528,626 Equity securities: Quoted 159,495,576 110,510,048 – 1,163,906,733 198,980,468 – 156,942,995 810,926,349 2,600,762,169 Unquoted – – – – – – – 3,530 3,530
159,495,576 110,510,048 – 1,163,906,733 198,980,468 – 156,942,995 810,929,879 2,600,765,699229,780,627 178,500,924 – 6,603,828,991 450,490,003 1,197,466,802 6,210,226,978 14,870,294,325
Derivative financial assets: Designated as accounting
hedges – – – 37,358,957 – – – – 37,358,957– – – 37,358,957 – – – – 37,358,957
AFS investments: Debt securities: Government – – – 129,273,820 – – – 7,987,663,860 8,116,937,680 Private 124,893,768 514,130,501 – 685,616,160 329,807,050 – 214,217,585 673,336,711 2,542,001,775
124,893,768 514,130,501 – 814,889,980 329,807,050 – 214,217,585 8,661,000,571 10,658,939,455 Equity securities: Quoted 11,789,500 – – 148,085,818 35,633,083,520 – – 1,152,156,455 36,945,115,293 Unquoted – – – 7,500,000 – – – 16,793,371 24,293,371
11,789,500 – – 155,585,818 35,633,083,520 – – 1,168,949,826 36,969,408,664136,683,268 514,130,501 – 970,475,798 35,962,890,570 – 214,217,585 9,829,950,397 47,628,348,119
(Forward)

- 59 -
*SGVFS023363*
2015
Manufacturing
Real Estate,Renting and
Related BusinessActivities
Wholesaleand
Retail TradeFinancial
Intermediaries
Transportation,Storage and
Communication
Agricultural,Hunting and
ForestryElectricity,
Gas and Water Others* TotalHeld-to-maturity investment P=596,663,277 P=1,175,000,000 P=– P=350,000,000 P=12,259,994 P=– P=500,000,000 115,372,332 P=2,749,295,603Receivables: Finance receivables 2,621,318,748 6,845,627,000 5,659,342,197 3,771,234,014 1,574,588,756 414,632,980 1,845,511,776 4,086,611,666 26,818,867,137 Trade receivables 12,724,773,628 9,049,282,951 – – 1,568,306,241 81,867,809 – 72,237,940 23,496,468,569 Due from related parties 337,136,434 37,286,281 49,037,998 518,345,282 125,557,660 – – 181,841,889 1,249,205,544 Interest receivable 11,381,828 52,927,069 18,613,328 182,692,825 15,445,021 6,955,837 28,457,894 344,277,654 660,751,456 Other receivables*** 311,956,412 164,668,856 – – 71,736,247 – – 395,339,929 943,701,444
16,006,567,050 16,149,792,157 5,726,993,523 4,472,272,121 3,355,633,925 503,456,626 1,873,969,670 5,080,309,078 53,168,994,150Refundable security deposits
(included under ‘Other current’and ‘Other noncurrent assets’ inthe consolidated statements offinancial position) – 518,760,019 – – 27,160,601 – – 49,410,729 595,331,349
Other current assets 653,658,448 – – – – – – 163,568,641 817,227,089P=17,623,352,670 P=18,536,183,601 P=5,726,993,523 P=46,342,593,725 P=39,808,435,093 P=503,456,626 P=3,785,654,057 P=30,735,579,147 P=163,062,248,442
*** Others include consumer, community, social and personal services, education, mining and quarrying, and health and social work sectors.*** Excludes cash on hand amounting to P=2,076,709,922.*** Other receivables includes TCCs of Petrochem amounting to P=194,365,838

- 60 -
*SGVFS023363*
c. Credit quality per class of financial assets
The table below shows the credit quality by class of financial assets gross of allowance forimpairment losses:
2016Neither Past Due Nor Individually Impaired Past Due
HighGrade
StandardGrade
SubstandardGrade Unrated
or IndividuallyImpaired
IndividuallyImpaired Total
Cash and cash equivalents* P=36,698,814,718 P=4,596,213,199 P=− P=− P=− P=− P=41,295,027,917Financial assets at FVPL: Held-for-trading: Debt securities: Private 9,719,180,330 − − − − − 9,719,180,330 Government 1,721,514,777 1,228,754 − − − − 1,722,743,531 Derivatives 443,195,549 − − − − − 443,195,549
11,883,890,656 1,228,754 − − − − 11,885,119,410 Equity securities: Quoted 2,779,265,343 − − − − − 2,779,265,343 Unquoted 3,729 − − − − − 3,729
2,779,269,072 − − − − − 2,779,269,07214,663,159,728 1,228,754 − − − − 14,664,388,482
Derivative financialassets notdesignated asaccounting hedges 62,561,284 − − − − − 62,561,284
62,561,284 − − − − − 62,561,284AFS investments: Debt securities: Government 1,386,357,676 8,193,986,974 − − − − 9,580,344,650 Private 993,872,123 3,239,185,098 − − − − 4,233,057,221
2,380,229,799 11,433,172,072 − − − − 13,813,401,871 Equity securities: Quoted 41,830,000 305,772,373 − − − 24,890,652,862 25,238,255,235 Unquoted 687,671 − − 23,605,700 − − 24,293,371
42,517,671 305,772,373 − 23,605,700 − 24,890,652,862 25,262,548,6062,422,747,470 11,738,944,445 − 23,605,700 − 24,890,652,862 39,075,950,477
Held to maturityinvestments − 3,549,900,604 − − − − 3,549,900,604
Receivables: Finance receivables 20,052,769,348 14,364,952,634 1,084,858,269 1,577,862,161 736,954,006 1,111,107,383 38,928,503,801 Trade receivables 19,780,687,108 1,204,453,697 515,514,728 4,748,363,615 552,361,283 26,801,380,431 Due from related parties 1,417,510,849 1,417,510,849 Interest receivable 264,396,170 304,687,337 2,840,190 183,423,687 1,845,850 757,193,234 Other receivables** 340,930,474 129,996,248 59,237,100 907,519,329 206,534,551 1,644,217,702
41,856,293,949 16,004,089,916 1,662,450,287 1,577,862,161 6,576,260,637 1,871,849,067 69,548,806,017Refundable security
deposits (includedunder ‘Other current’and ‘Othernoncurrent assets’ in theconsolidated statementsof financial position) 653,391,683 67,682,242 − − − − 721,073,925
Other Current Assets 586,700,532 336,026,879 − − − − 922,727,411P=96,943,669,364 P=36,294,086,039 P=1,662,450,287 P=1,601,467,861 P=6,576,260,637 P=26,762,501,929 P=169,840,436,117
* Excludes cash on hand amounting to P=2,076,709,922** Other receivables includes TCCs of Petrochem amounting to P=194,365,838
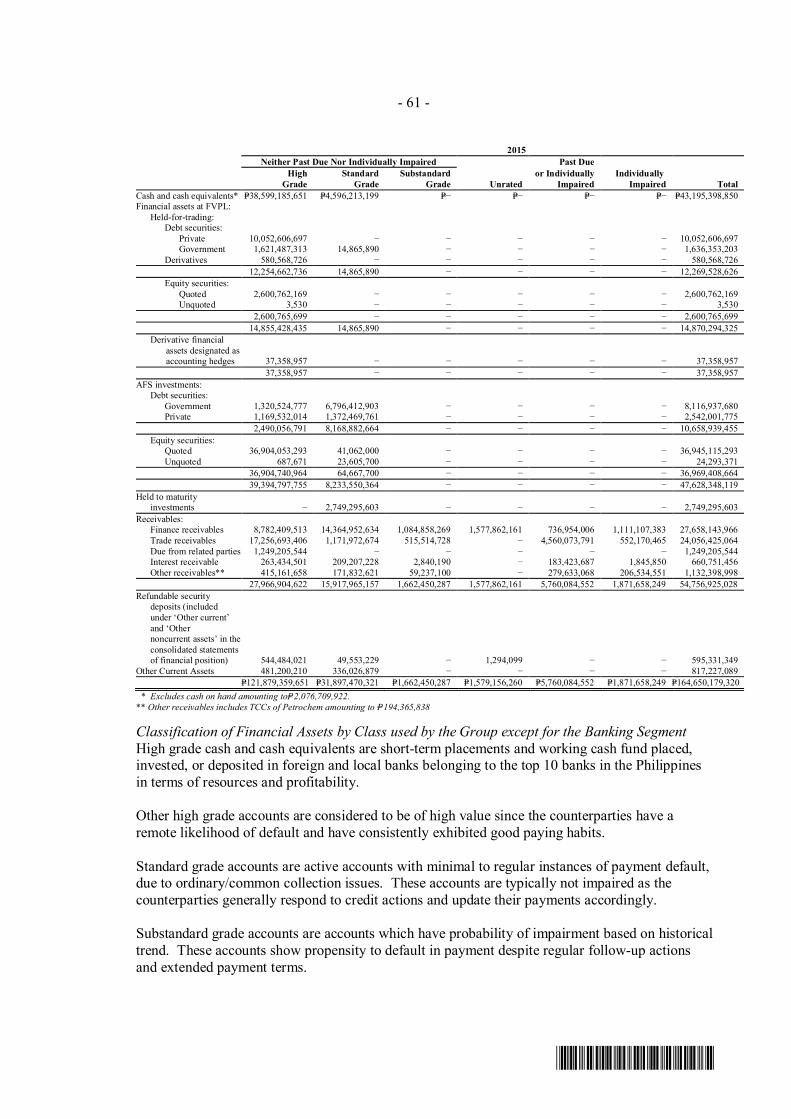
- 61 -
*SGVFS023363*
2015Neither Past Due Nor Individually Impaired Past Due
HighGrade
StandardGrade
SubstandardGrade Unrated
or IndividuallyImpaired
IndividuallyImpaired Total
Cash and cash equivalents* P=38,599,185,651 P=4,596,213,199 P=− P=− P=− P=− P=43,195,398,850Financial assets at FVPL: Held-for-trading: Debt securities: Private 10,052,606,697 − − − − − 10,052,606,697 Government 1,621,487,313 14,865,890 − − − − 1,636,353,203 Derivatives 580,568,726 − − − − − 580,568,726
12,254,662,736 14,865,890 − − − − 12,269,528,626 Equity securities: Quoted 2,600,762,169 − − − − − 2,600,762,169 Unquoted 3,530 − − − − − 3,530
2,600,765,699 − − − − − 2,600,765,69914,855,428,435 14,865,890 − − − − 14,870,294,325
Derivative financialassets designated asaccounting hedges 37,358,957 − − − − − 37,358,957
37,358,957 − − − − − 37,358,957AFS investments: Debt securities: Government 1,320,524,777 6,796,412,903 − − − − 8,116,937,680 Private 1,169,532,014 1,372,469,761 − − − − 2,542,001,775
2,490,056,791 8,168,882,664 − − − − 10,658,939,455 Equity securities: Quoted 36,904,053,293 41,062,000 − − − − 36,945,115,293 Unquoted 687,671 23,605,700 − − − − 24,293,371
36,904,740,964 64,667,700 − − − − 36,969,408,66439,394,797,755 8,233,550,364 − − − − 47,628,348,119
Held to maturityinvestments − 2,749,295,603 − − − − 2,749,295,603
Receivables: Finance receivables 8,782,409,513 14,364,952,634 1,084,858,269 1,577,862,161 736,954,006 1,111,107,383 27,658,143,966 Trade receivables 17,256,693,406 1,171,972,674 515,514,728 − 4,560,073,791 552,170,465 24,056,425,064 Due from related parties 1,249,205,544 − − − − − 1,249,205,544 Interest receivable 263,434,501 209,207,228 2,840,190 − 183,423,687 1,845,850 660,751,456 Other receivables** 415,161,658 171,832,621 59,237,100 − 279,633,068 206,534,551 1,132,398,998
27,966,904,622 15,917,965,157 1,662,450,287 1,577,862,161 5,760,084,552 1,871,658,249 54,756,925,028Refundable security
deposits (includedunder ‘Other current’and ‘Othernoncurrent assets’ in theconsolidated statementsof financial position) 544,484,021 49,553,229 − 1,294,099 − − 595,331,349
Other Current Assets 481,200,210 336,026,879 − − − − 817,227,089P=121,879,359,651 P=31,897,470,321 P=1,662,450,287 P=1,579,156,260 P=5,760,084,552 P=1,871,658,249 P=164,650,179,320
** Excludes cash on hand amounting toP=2,076,709,922.** Other receivables includes TCCs of Petrochem amounting to P=194,365,838
Classification of Financial Assets by Class used by the Group except for the Banking SegmentHigh grade cash and cash equivalents are short-term placements and working cash fund placed,invested, or deposited in foreign and local banks belonging to the top 10 banks in the Philippinesin terms of resources and profitability.
Other high grade accounts are considered to be of high value since the counterparties have aremote likelihood of default and have consistently exhibited good paying habits.
Standard grade accounts are active accounts with minimal to regular instances of payment default,due to ordinary/common collection issues. These accounts are typically not impaired as thecounterparties generally respond to credit actions and update their payments accordingly.
Substandard grade accounts are accounts which have probability of impairment based on historicaltrend. These accounts show propensity to default in payment despite regular follow-up actionsand extended payment terms.

- 62 -
*SGVFS023363*
Classification of Financial Assets by Class used by the Banking SegmentFor loans and receivables from customers, the Banking Segment’s internal credit rating systemwas approved in 2007 and improved in 2011 in accordance with the Bangko Sentral ng Pilipinas(BSP) requirement, to cover corporate credit exposures, which is defined by the BSP as exposuresto companies with assets of more than P=15.0 million.
The Banking Segment’s internal credit risk rating is as follows:
Grades Categories DescriptionHigh grade
Risk rating 1 Excellent Lowest probability of default; exceptionallystrong capacity for financial commitments;highly unlikely to be adversely affected byforeseeable events.
Risk rating 2 Super Prime Very low probability of default; very strongcapacity for payment of financial commitments;less vulnerable to foreseeable events.
Risk rating 3 Prime Low probability of default; strong capacity forpayment of financial commitments; may be morevulnerable to adverse business/economicconditions.
Risk rating 4 Very Good Moderately low probability of default; more thanadequate capacity for payment of financialcommitments; but adverse business/economicconditions are more likely to impair this capacity
Risk rating 5 Good More pronounced probability of default;business or financial flexibility exists whichsupports the servicing of financial commitments;vulnerable to adverse business/economicchanges
StandardRisk rating 6 Satisfactory Material probability of default is present, but a
margin of safety remains; financial commitmentsare currently being met although the capacity forcontinued payment is vulnerable to deteriorationin the business/economic condition.
Risk rating 7 Average Greater probability of default which is reflectedin the volatility of earnings and overallperformance; repayment source is presentlyadequate; however, prolonged unfavorableeconomic period would create deteriorationbeyond acceptable levels.
(Forward)

- 63 -
*SGVFS023363*
Grades Categories DescriptionStandard
Risk rating 8 Fair Sufficiently pronounced probability of default,although borrowers should still be able towithstand normal business cycles; any prolongedunfavorable economic/market conditions wouldcreate an immediate deterioration of cash flowbeyond acceptable levels.
Sub-standard gradeRisk rating 9 Marginal Elevated level of probability of default, with
limited margin; repayment source is adequate tomarginal.
Risk rating 10 Watch list Unfavorable industry or company specific riskfactors represent a concern, financial strengthmay be marginal; will find it difficult to copewith significant downturn.
Risk rating 11 Special mention Loans have potential weaknesses that deserveclose attention; borrower has reached a pointwhere there is a real risk that the borrower’sability to pay the interest and repay the principaltimely could be jeopardized due to evidence ofweakness in the borrower’s financial condition.
Risk rating 12 Substandard Substantial and unreasonable degree of risk tothe institution because of unfavorable record orunsatisfactory characteristics; with well-definedweaknesses that jeopardize their liquidation e.g.negative cash flow, case of fraud.
ImpairedRisk rating 13 Doubtful Weaknesses similar to “Substandard”, but with
added characteristics that make liquidationhighly improbable.
Risk rating 14 Loss Uncollectible or worthless.
The Banking Segment’s internal credit risk rating system intends to provide a structure todefine the corporate credit portfolio, and consists of an initial rating for the borrower risk lateradjusted for the facility risk. Inputs include an assessment of management, credit experience,financial condition, industry outlook, documentation, security and term.
Aging analysis of receivables by class
The aging analysis of the Group’s receivables as of December 31, 2016 and 2015 follow:
2016Past Due But Not Impaired
Neither Past DueNor Impaired
Less than30 Days
30 to 60Days
61 to 90Days
Over 90Days
Past Due andImpaired Total
Finance receivables P=37,080,442,412 10,331,805 18,843,201 37,785,278 669,993,722 1,111,107,383 P=38,928,503,801Trade receivables 21,107,554,503 1,472,782,710 505,194,071 574,437,631 2,589,050,233 552,361,283 26,801,380,431Due from related
parties 1,417,510,849 − − − − − 1,417,510,849Interest receivable 536,785,981 1,100,643 2,261,626 3,302,164 211,896,970 1,845,850 757,193,234Others 1,164,052,693 14,326,702 (17,123,787) 23,153,997 253,273,546 206,534,551 1,644,217,702
P=61,306,346,438 P=1,498,541,860 P=509,175,111 P=638,679,070 P=3,724,214,471 P=1,871,849,067 P=69,548,806,017

- 64 -
*SGVFS023363*
2015Past Due But Not Impaired
Neither Past DueNor Impaired
Less than30 Days
30 to 60Days
61 to 90Days
Over 90Days
Past Due andImpaired Total
Finance receivables P=25,810,082,577 P=10,331,805 P=18,843,201 P=37,785,278 P=669,993,722 P=1,111,107,383 P=27,658,143,966Trade receivables 18,944,180,808 913,868,122 496,234,508 132,157,485 3,017,813,676 552,170,465 24,056,425,064Due from related
parties 1,249,205,544 – – – – – 1,249,205,544Interest receivable 475,481,919 540,717 2,261,626 3,302,164 177,319,180 1,845,850 660,751,456Others 646,231,379 26,285,734 (17,884,815) 15,851,639 255,380,510 206,534,551 1,132,398,998
P=47,125,182,227 P=951,026,378 P=499,454,520 P=189,096,566 P=4,120,507,088 P=1,871,658,249 P=54,756,925,028
Liquidity riskLiquidity risk is the risk of not being able to meet funding obligations such as the repayment ofliabilities or payment of asset purchases as they fall due. The Group’s liquidity managementinvolves maintaining funding capacity to finance capital expenditures and service maturing debts,and to accommodate any fluctuations in asset and liability levels due to changes in the Group’sbusiness operations or unanticipated events created by customer behavior or capital marketconditions. The Group maintains a level of cash and cash equivalents deemed sufficient to financeits operations. As part of its liquidity risk management, the Group regularly evaluates its projectedand actual cash flows. It also continuously assesses conditions in the financial markets foropportunities to pursue fund-raising activities. Fund-raising activities may include obtaining bankloans and capital market issues both onshore and offshore.
The tables below summarize the maturity profile of the Group’s financial assets and liabilitiesbased on the applicable undiscounted contractual payments as of December 31, 2016 and 2015:
2016
On DemandUp to 3Months
3 to 12Months
1 to 5Years
More Than5 Years Total
Financial AssetsCash and cash equivalents P=19,983,211,322 P=21,269,568,309 P=2,224,970,000 P=– P=– P=43,477,749,631Financial assets at FVPL: Held-for-trading: Debt securities: Private – − 9,719,180,330 − – 9,719,180,330 Government 1,228,754 − 1,721,514,777 − – 1,722,743,531 Derivatives – − 443,195,549 35,760,812 – 478,956,361
1,228,754 − 11,883,890,656 35,760,812 − 11,920,880,222 Equity securities: Quoted 1,197,749,259 − 1,581,516,084 – – 2,779,265,343 Unquoted − − 3,729 – – 3,729
1,197,749,259 – 1,581,519,813 – – 2,779,269,0721,198,978,013 − 13,465,410,469 − – 14,664,388,482
Derivative financial assets designatedas accounting hedges – – 26,800,472 − – 62,561,284
AFS investments: Debt securities: Government – 31,631,237 9,548,713,413 – – 9,580,344,650 Private – 128,949,103 4,104,108,118 – – 4,233,057,221
– 160,580,340 13,652,821,531 – – 13,813,401,871 Equity securities: Quoted 41,830,000 305,772,373 1,282,326,757 23,608,326,105 – 25,238,255,235 Unquoted − 23,605,700 687,671 − – 24,293,371
41,830,000 329,378,073 1,283,014,428 23,608,326,105 – 25,262,548,60641,830,000 489,958,413 14,935,835,959 23,608,326,105 – 39,075,950,477
Held to maturity investments – 57,006,693 − 1,077,759,585 2,743,443,378 3,878,209,656Receivables: Trade receivables 4,021,645,112 18,825,052,506 1,190,477,613 2,270,869,372 528,385,047 26,836,429,650 Finance receivables 648,028,853 6,105,462,562 3,553,042,371 13,835,045,477 22,421,302,199 46,562,881,462 Due from related parties 1,315,333,252 3,464,762 98,712,835 − – 1,417,510,849 Interest receivable 153,379,197 252,184,026 351,630,011 − – 757,193,234 Other receivables 692,972,269 832,605,996 118,639,437 − – 1,644,217,702
6,831,358,683 26,018,769,852 5,312,502,267 16,105,914,849 22,949,687,246 77,218,232,897Refundable security deposits 7,240,035 16,106,444 10,598,643 299,571,580 388,358,803 721,875,505Other Current Assets − − − – – −
P=28,062,618,053 P=47,851,409,711 P=35,976,117,810 P=41,091,572,119 P=26,081,489,427 P=179,098,967,932

- 65 -
*SGVFS023363*
2016
On DemandUp to 3Months
4 to 12Months
1 to 5Years
More Than5 Years Total
Financial LiabilitiesAccounts payable and accrued expenses
(including noncurrent portion bookedunder ‘Other noncurrent liabilities’ inthe consolidated statement of financialposition but excluding ‘Depositliabilities’ and ‘Due to relatedparties’) P=16,103,568,618 P=17,425,567,745 P=8,751,203,461 P=544,320,629 P=1,911,686,040 P=44,736,346,493
Short-term debt – 30,826,688,773 31,468,105,354 – 62,294,794,127Redeemable preferred shares 1,700,000 – – – – 1,700,000Deposit liabilities (included under
‘Accounts payable and accruedexpenses’ and ‘Other noncurrentliabilities’ in the consolidatedstatements of financial position) 31,668,994,253 15,349,040,957 9,428,793,502 4,817,729,266 3,908,763 61,268,466,741
Due to related parties (included under‘Accounts payable and accruedexpense’ and ‘Other noncurrentliabilities’ in the consolidatedstatement of financial position) 136,118,258 – – – – 136,118,258
Deposits from lessees (included under‘Other current liabilities’ and ‘Othernoncurrent liabilities’ in theconsolidated statement of financialposition) 525,132,237 248,624,698 997,198,681 1,476,918,169 785,584,181 4,033,457,966
Long-term debt (including current portion) – 1,276,164,221 3,661,742,495 93,118,218,594 94,045,704,321 192,101,829,631Derivative liabilities – – 5,947,386 – – 5,947,386
P=48,435,513,366 P=65,126,086,394 P=54,312,990,879 P=99,957,186,658 P=96,746,883,305 P=364,578,660,602
2015
On DemandUp to 3Months
3 to 12Months
1 to 5Years
More Than5 Years Total
Financial AssetsCash and cash equivalents P=33,181,079,748 P=11,516,633,546 P=614,834,322 P=– P=– P=45,312,547,616Financial assets at FVPL: Held-for-trading: Debt securities: Private – – 10,052,606,697 – – 10,052,606,697 Government – 14,865,890 1,621,487,313 – – 1,636,353,203 Derivatives – – – 580,568,726 – 580,568,726
– 14,865,890 11,674,094,010 580,568,726 – 12,269,528,626 Equity securities: Quoted 394,576,663 – 2,206,185,506 – – 2,600,762,169 Unquoted – – 3,530 – – 3,530
394,576,663 – 2,206,189,036 – – 2,600,765,699394,576,663 14,865,890 13,880,283,046 580,568,726 – 14,289,725,599
Derivative financial assets designated as accounting hedges – – – 37,358,957 – 37,358,957
AFS investments: Debt securities: Government – 31,631,237 8,085,306,443 – – 8,116,937,680 Private – 128,949,103 2,413,052,672 – – 2,542,001,775
– 160,580,340 10,498,359,115 – – 10,658,939,455 Equity securities: Quoted 40,880,000 41,062,000 1,234,490,673 35,628,682,620 – 36,945,115,293 Unquoted – 23,605,700 687,671 – – 24,293,371
40,880,000 64,667,700 1,235,178,344 35,628,682,620 – 36,969,408,66440,880,000 225,248,040 11,733,537,459 35,628,682,620 – 47,628,348,119
Held to maturity investments – 57,006,693 – 1,077,759,585 2,743,443,378 3,878,209,656Receivables: Trade receivables 8,600,930,132 10,186,985,363 1,968,655,236 1,489,389,996 1,810,464,337 24,056,425,064 Finance receivables 648,028,853 6,105,462,562 3,553,042,371 9,835,045,477 15,421,302,199 35,562,881,462 Due from related parties 1,249,205,544 – – – – 1,249,205,544 Interest receivable 118,818,602 285,782,952 256,149,902 – – 660,751,456 Other receivables 480,387,175 551,126,576 100,885,247 – – 1,132,398,998
11,097,370,306 17,129,357,453 5,878,732,756 11,324,435,473 17,231,766,536 62,661,662,524Refundable security deposits 5,484,127 14,025,444 3,173,133 287,736,690 285,563,450 595,982,844Other Current Assets 274,892,605 387,565,925 154,768,559 – – 817,227,089
P=44,994,283,449 P=29,344,702,991 P=32,265,329,275 P=48,936,542,051 P=20,260,773,364 P=175,801,631,130

- 66 -
*SGVFS023363*
2015
On DemandUp to 3Months
3 to 12Months
1 to 5Years
More Than5 Years Total
Financial LiabilitiesAccounts payable and accrued expenses
(including noncurrent portion bookedunder ‘Other noncurrent liabilities’ inthe consolidated statement of financialposition but excluding ‘Depositliabilities’ and ‘Due to relatedparties’) P=14,053,657,183 P=13,182,961,986 P=8,151,046,331 P=1,447,221,372 P=1,103,510,196 P=37,938,397,068
Short-term debt – 30,859,848,999 4,078,607,519 – – 34,938,456,518Redeemable preferred shares 1,700,000 – – – – 1,700,000Deposit liabilities (included under
‘Accounts payable and accruedexpenses’ and ‘Other noncurrentliabilities’ in the consolidatedstatements of financial position) 31,668,994,253 5,349,040,957 2,428,793,502 4,817,729,266 3,908,763 44,268,466,741
Due to related parties (included under‘Accounts payable and accruedexpense’ and ‘Other noncurrentliabilities’ in the consolidatedstatement of financial position) 283,572,118 – – – – 283,572,118
Deposits from lessees (included under‘Other current liabilities’ and ‘Othernoncurrent liabilities’ in theconsolidated statement of financialposition) 1,144,211,329 307,044,232 604,440,113 1,536,410,133 791,989,484 4,384,095,291
Long-term debt (including current portion) – 12,852,664,217 18,486,447,790 109,886,221,413 66,971,174,770 208,196,508,190Derivative liabilities – – – 1,671,213,914 772,281,224 2,443,495,138
P=47,152,134,883 P=62,551,560,391 P=33,749,335,255 P=119,358,796,098 P=69,642,864,437 P=332,454,691,064
The table below summarizes the undiscounted and discounted amounts of the Group’s derivativeassets which will mature within 1 to 5 years:
2016 2015Undiscounted Discounted Undiscounted Discounted
Receive (Asset)* P=271,942,783 P=270,862,277 P=263,472,770 P=259,632,248Pay (Liability)** (145,326,380) (144,678,581) (224,837,974) (222,273,291)
P=126,616,403 P=126,183,696 P=38,634,796 P=37,358,957* Gross carrying amount before offsetting** Gross amount offset in accordance with the offsetting criteria*** Net amount presented in the statement of financial position
The Group has currently enforceable legal right to offset the recognized amounts of derivativeassets and there is an intention to settle on a net basis, or to realize the asset and settle the liabilitysimultaneously.
Market riskMarket risk is the risk of loss to future earnings, to fair value or future cash flows of a financialinstrument as a result of changes in its price, in turn caused by changes in interest rates, foreigncurrency exchange rates, equity prices and other market factors.
The following discussion covers the market risks of the Group except for its Banking Segment:
Foreign currency riskForeign currency risk arises on financial instruments that are denominated in a foreign currencyother than the functional currency in which they are measured. The Group makes use ofderivative financial instruments, such as currency swaps, to hedge foreign currency exposure(Note 8).
The Group has transactional currency exposures. Such exposures arise from sales and purchasesin currencies other than the entities’ functional currency. As of December 31, 2016, 2015 and2014, approximately 32.0%, 33.6% and 27.5%, respectively, of the Group’s total sales aredenominated in currencies other than the functional currency. In addition, approximately 50.1%and 47.6% of total debt are denominated in US Dollar as of December 31, 2016 and 2015,respectively. The Group’s capital expenditures are likewise substantially denominated inUS Dollar.

- 67 -
*SGVFS023363*
The tables below summarize the Group’s exposure to foreign currency risk as ofDecember 31, 2016 and 2015:
2016US Dollar Other Currencies* Total
AssetsCash and cash equivalents P=11,997,049,530 P=5,656,460,603 P=17,653,510,133Financial assets at FVPL 13,463,988,825 − 13,463,988,825AFS investments 3,945,928,928 − 3,945,928,928Receivables 4,773,353,726 6,938,950,885 11,712,304,611Derivative assets 35,760,812 26,800,472 62,561,284Other noncurrent assets 29,250,904 − 29,250,904
34,245,332,725 12,622,211,960 46,867,544,685LiabilitiesAccounts payable and accrued expenses 16,197,543,846 11,145,748,284 27,343,292,130Short-term debt 28,841,311,035 1,431,890,655 30,273,201,690Long-term debt (including current portion) 69,020,188,041 31,366,592,785 100,386,780,826Other noncurrent liabilities 224,413,504 − 224,413,504
114,283,456,426 43,944,231,724 158,227,688,150Net Foreign Currency-Denominated Liabilities (P=80,038,123,701) (P=31,322,019,764) (P=111,360,143,465)*Other currencies include Hong Kong Dollar, Singaporean Dollar, Thai Baht, Chinese Yuan, Indonesian Rupiah,Vietnam Dong, Malaysian Ringgit, Korean Won, New Taiwan Dollar, Japanese Yen, Australian Dollar, New Zealand Dollar and Euro
2015US Dollar Other Currencies* Total
AssetsCash and cash equivalents P=13,115,207,657 P=3,000,327,842 P=16,115,535,499Financial assets at FVPL 13,880,283,045 − 13,880,283,045AFS investments 3,554,553,991 − 3,554,553,991Receivables 4,210,926,098 2,111,509,660 6,322,435,758Derivative assets 126,183,696 − 126,183,696Other noncurrent assets 27,200,276 − 27,200,276
34,914,354,763 5,111,837,502 40,026,192,265LiabilitiesAccounts payable and accrued expenses 5,968,985,704 389,216,001 6,358,201,705Short-term debt 20,820,856,094 1,198,769,780 22,019,625,874Derivative liability 2,443,495,138 − 2,443,495,138Long-term debt (including current portion) 78,961,600,132 23,535,491,713 102,497,091,845Other noncurrent liabilities 224,413,504 − 224,413,504
108,419,350,572 25,123,477,494 133,542,828,066Net Foreign Currency-Denominated Liabilities (P=73,504,995,809) (P=20,011,639,992) (P=93,516,635,801)*Other currencies include Hong Kong Dollar, Singaporean Dollar, Thai Baht, Chinese Yuan, Indonesian Rupiah,
Vietnam Dong, Malaysian Ringgit, Korean Won, New Taiwan Dollar, Japanese Yen, Australian Dollar, New Zealand Dollar and Euro
The exchange rates used to convert the Group’s US dollar-denominated assets and liabilities intoPhilippine peso as of December 31, 2016 and 2015 follow:
2016 2015US dollar-Philippine peso exchange rate P=49.72 to
US$1.00P=47.06 toUS$1.00
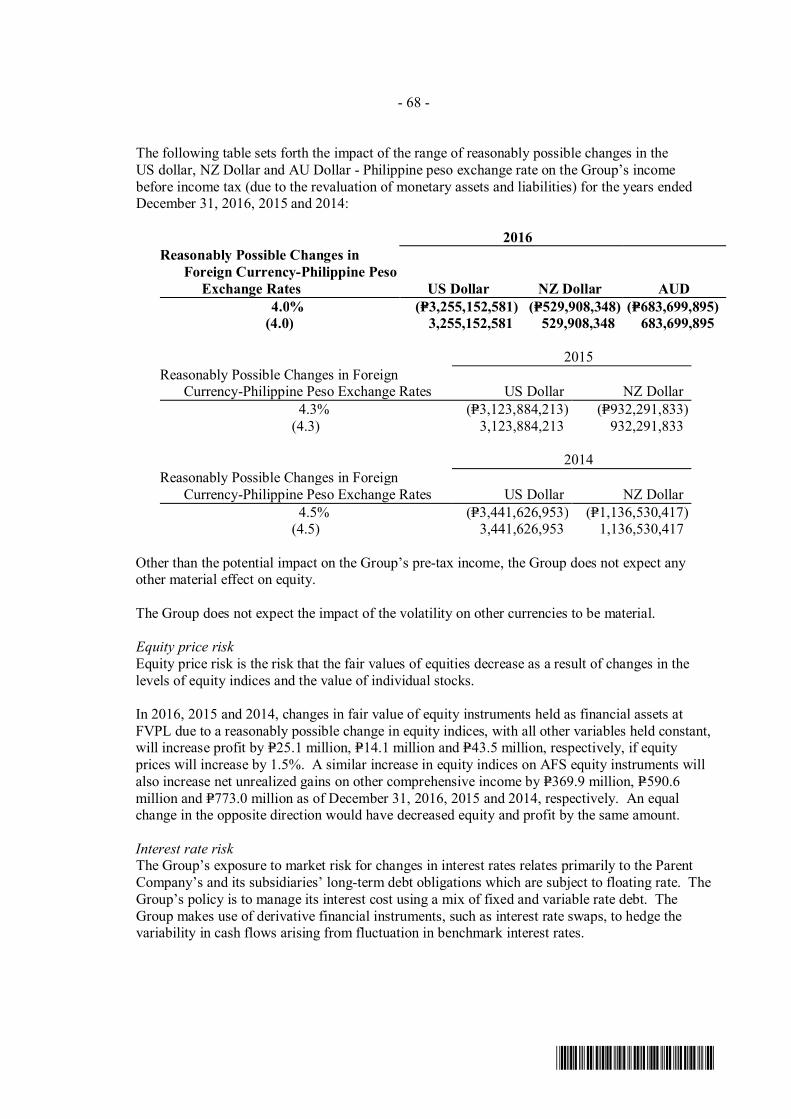
- 68 -
*SGVFS023363*
The following table sets forth the impact of the range of reasonably possible changes in theUS dollar, NZ Dollar and AU Dollar - Philippine peso exchange rate on the Group’s incomebefore income tax (due to the revaluation of monetary assets and liabilities) for the years endedDecember 31, 2016, 2015 and 2014:
2016Reasonably Possible Changes in
Foreign Currency-Philippine PesoExchange Rates US Dollar NZ Dollar AUD
4.0% (P=3,255,152,581) (P=529,908,348) (P=683,699,895)(4.0) 3,255,152,581 529,908,348 683,699,895
2015Reasonably Possible Changes in Foreign Currency-Philippine Peso Exchange Rates US Dollar NZ Dollar
4.3% (P=3,123,884,213) (P=932,291,833)(4.3) 3,123,884,213 932,291,833
2014Reasonably Possible Changes in Foreign Currency-Philippine Peso Exchange Rates US Dollar NZ Dollar
4.5% (P=3,441,626,953) (P=1,136,530,417)(4.5) 3,441,626,953 1,136,530,417
Other than the potential impact on the Group’s pre-tax income, the Group does not expect anyother material effect on equity.
The Group does not expect the impact of the volatility on other currencies to be material.
Equity price riskEquity price risk is the risk that the fair values of equities decrease as a result of changes in thelevels of equity indices and the value of individual stocks.
In 2016, 2015 and 2014, changes in fair value of equity instruments held as financial assets atFVPL due to a reasonably possible change in equity indices, with all other variables held constant,will increase profit by P=25.1 million, P=14.1 million and P=43.5 million, respectively, if equityprices will increase by 1.5%. A similar increase in equity indices on AFS equity instruments willalso increase net unrealized gains on other comprehensive income by P=369.9 million, P=590.6million and P=773.0 million as of December 31, 2016, 2015 and 2014, respectively. An equalchange in the opposite direction would have decreased equity and profit by the same amount.
Interest rate riskThe Group’s exposure to market risk for changes in interest rates relates primarily to the ParentCompany’s and its subsidiaries’ long-term debt obligations which are subject to floating rate. TheGroup’s policy is to manage its interest cost using a mix of fixed and variable rate debt. TheGroup makes use of derivative financial instruments, such as interest rate swaps, to hedge thevariability in cash flows arising from fluctuation in benchmark interest rates.

- 69 -
*SGVFS023363*
The following tables show information about the Group’s long-term debt presented by maturity profile:
2016
<1 year >1-<2 years >2-<3 years >3-<4 years >4-<5 years >5 years
Total(In ForeignCurrency)
Total(in Philippine
Peso)Debt
Issuance Costs
Carrying Value(in Philippine
Peso) Fair ValueLong-term debt Foreign currencies:
Floating rate US Dollar loans US$61,059,188 US$60,350,674 US$60,534,350 US$60,401,871 US$61,338,081 US$190,739,033 US$494,423,197 P=24,582,721,362 P=– P=24,582,721,362 P=24,830,050,134
Interest rate (London InterbankOffered Rate (LIBOR) plus margin)
New Zealand Dollar loans NZ$– NZ$– NZ$420,000,000 NZ$– NZ$– NZ$– NZ$420,000,000 14,466,505,197 154,827,284 14,311,677,913 12,765,477,192 Interest rate (NZ BKBM+1.60%) Australian Dollar loans
Interest rate (BBSY BID+1.25%) AUD– AUD– AUD– AUD– AUD484,224,000 AUD– AUD484,224,000 17,344,295,962 289,381,090 17,054,914,872 14,228,578,841P=56,393,522,521 P=444,208,374 P=55,949,314,147 P=51,824,106,167
2015
<1 year >1-<2 years >2-<3 years >3-<4 years >4-<5 years >5 years
Total(In ForeignCurrency)
Total(in Philippine
Peso)Debt
Issuance Costs
Carrying Value(in Philippine
Peso) Fair ValueLong-term debt Foreign currencies:
Floating rate US Dollar loans US$48,779,407 US$49,398,533 US$300,097,378 US$50,353,368 US$49,746,867 US$194,353,299 US$692,728,852 P=32,599,819,758 P=106,129,789 P=32,493,689,969 P=32,809,022,370
Interest rate (London InterbankOffered Rate (LIBOR) plus margin)
New Zealand Dollar loans Interest rate (NZ BKBM+1.60%) NZ$322,319,095 NZ$– NZ$– NZ$420,000,000 NZ$– NZ$– NZ$742,319,095 23,870,085,537 334,593,824 23,535,491,713 20,085,055,088 Local currencies:
Floating rate Philippine Peso loans Interest rate (PDST-R1 +0.75%) P=7,500,000,000 – – – – – – 7,500,000,000 17,947,325 7,482,052,675 7,482,052,675
P=63,969,905,295 P=458,670,938 P=63,511,234,357 P=60,376,130,133
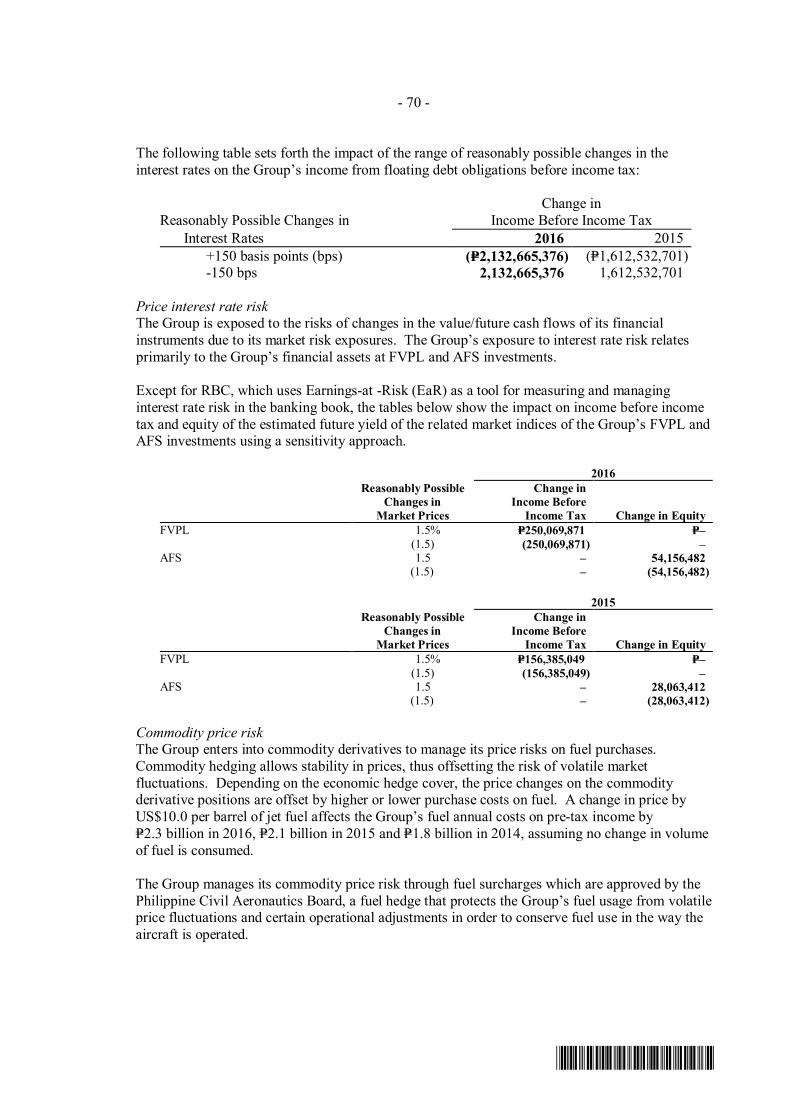
- 70 -
*SGVFS023363*
The following table sets forth the impact of the range of reasonably possible changes in theinterest rates on the Group’s income from floating debt obligations before income tax:
Reasonably Possible Changes inChange in
Income Before Income TaxInterest Rates 2016 2015
+150 basis points (bps) (P=2,132,665,376) (P=1,612,532,701)-150 bps 2,132,665,376 1,612,532,701
Price interest rate riskThe Group is exposed to the risks of changes in the value/future cash flows of its financialinstruments due to its market risk exposures. The Group’s exposure to interest rate risk relatesprimarily to the Group’s financial assets at FVPL and AFS investments.
Except for RBC, which uses Earnings-at -Risk (EaR) as a tool for measuring and managinginterest rate risk in the banking book, the tables below show the impact on income before incometax and equity of the estimated future yield of the related market indices of the Group’s FVPL andAFS investments using a sensitivity approach.
2016Reasonably Possible
Changes inMarket Prices
Change inIncome Before
Income Tax Change in EquityFVPL 1.5% P=250,069,871 P=–
(1.5) (250,069,871) –AFS 1.5 – 54,156,482
(1.5) – (54,156,482)
2015Reasonably Possible
Changes inMarket Prices
Change inIncome Before
Income Tax Change in EquityFVPL 1.5% P=156,385,049 P=–
(1.5) (156,385,049) –AFS 1.5 – 28,063,412
(1.5) – (28,063,412)
Commodity price riskThe Group enters into commodity derivatives to manage its price risks on fuel purchases.Commodity hedging allows stability in prices, thus offsetting the risk of volatile marketfluctuations. Depending on the economic hedge cover, the price changes on the commodityderivative positions are offset by higher or lower purchase costs on fuel. A change in price byUS$10.0 per barrel of jet fuel affects the Group’s fuel annual costs on pre-tax income byP=2.3 billion in 2016, P=2.1 billion in 2015 and P=1.8 billion in 2014, assuming no change in volumeof fuel is consumed.
The Group manages its commodity price risk through fuel surcharges which are approved by thePhilippine Civil Aeronautics Board, a fuel hedge that protects the Group’s fuel usage from volatileprice fluctuations and certain operational adjustments in order to conserve fuel use in the way theaircraft is operated.
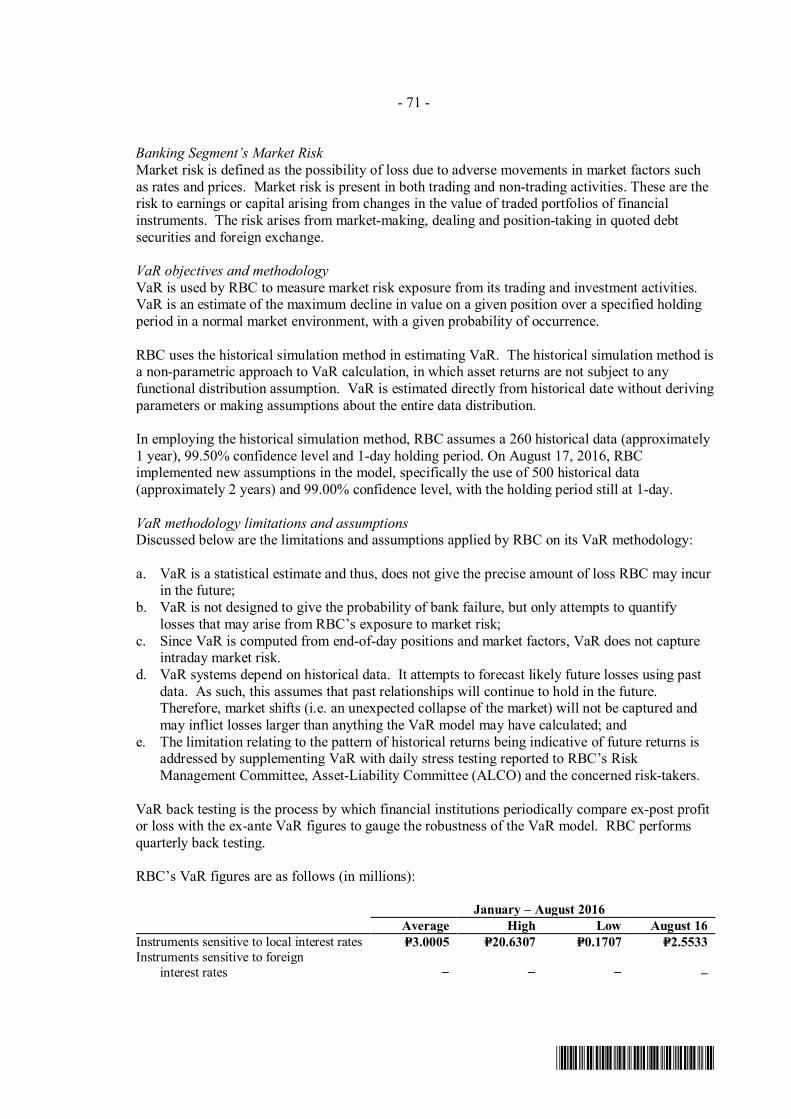
- 71 -
*SGVFS023363*
Banking Segment’s Market RiskMarket risk is defined as the possibility of loss due to adverse movements in market factors suchas rates and prices. Market risk is present in both trading and non-trading activities. These are therisk to earnings or capital arising from changes in the value of traded portfolios of financialinstruments. The risk arises from market-making, dealing and position-taking in quoted debtsecurities and foreign exchange.
VaR objectives and methodologyVaR is used by RBC to measure market risk exposure from its trading and investment activities.VaR is an estimate of the maximum decline in value on a given position over a specified holdingperiod in a normal market environment, with a given probability of occurrence.
RBC uses the historical simulation method in estimating VaR. The historical simulation method isa non-parametric approach to VaR calculation, in which asset returns are not subject to anyfunctional distribution assumption. VaR is estimated directly from historical date without derivingparameters or making assumptions about the entire data distribution.
In employing the historical simulation method, RBC assumes a 260 historical data (approximately1 year), 99.50% confidence level and 1-day holding period. On August 17, 2016, RBCimplemented new assumptions in the model, specifically the use of 500 historical data(approximately 2 years) and 99.00% confidence level, with the holding period still at 1-day.
VaR methodology limitations and assumptionsDiscussed below are the limitations and assumptions applied by RBC on its VaR methodology:
a. VaR is a statistical estimate and thus, does not give the precise amount of loss RBC may incurin the future;
b. VaR is not designed to give the probability of bank failure, but only attempts to quantifylosses that may arise from RBC’s exposure to market risk;
c. Since VaR is computed from end-of-day positions and market factors, VaR does not captureintraday market risk.
d. VaR systems depend on historical data. It attempts to forecast likely future losses using pastdata. As such, this assumes that past relationships will continue to hold in the future.Therefore, market shifts (i.e. an unexpected collapse of the market) will not be captured andmay inflict losses larger than anything the VaR model may have calculated; and
e. The limitation relating to the pattern of historical returns being indicative of future returns isaddressed by supplementing VaR with daily stress testing reported to RBC’s RiskManagement Committee, Asset-Liability Committee (ALCO) and the concerned risk-takers.
VaR back testing is the process by which financial institutions periodically compare ex-post profitor loss with the ex-ante VaR figures to gauge the robustness of the VaR model. RBC performsquarterly back testing.
RBC’s VaR figures are as follows (in millions):
January – August 2016Average High Low August 16
Instruments sensitive to local interest rates P=3.0005 P=20.6307 P=0.1707 P=2.5533Instruments sensitive to foreign interest rates − − − –

- 72 -
*SGVFS023363*
August - December 2016*Average High Low December 31
Instruments sensitive to local interest rates P=4.2745 P=7.8317 P=0.0222 P=0.0225Instruments sensitive to foreign interest rates 0.0002 0.0158 − –*based on new VaR assumptions
2015Average High Low December 31
Instruments sensitive to local interest rates P=42.38 P=104.57 P=0.17 P=0.17Instruments sensitive to foreign interest rates 0.0029 0.0792 0.0047 –
2014Average High Low December 31
Instruments sensitive to local interest rates P=60.01 P=91.14 P=32.63 P=55.22Instruments sensitive to foreign interest rates 5.39 8.5 1.62 2.80
Interest rate riskInterest rate risk arises from the possibility that changes in interest rates will affect future cashflows or the fair values of financial instruments.
RBC’s ALCO surveys the interest rate environment, adjusts the interest rates for the ParentCompany’s loans and deposits, assesses investment opportunities and reviews the structure ofassets and liabilities. RBC uses Earnings-at-Risk as a tool for measuring and managing interestrate risk in the banking book.
Earnings-at-Risk objectives and methodologyEarnings-at-Risk is a statistical measure of the likely impact of changes in interest rates to theRBC’s net interest income (NII). To do this, repricing gaps (difference between interest rate-sensitive assets and liabilities) are classified according to time to repricing and multiplied withapplicable historical interest rate volatility, Although available contractual repricing dates aregenerally used for putting instruments into time bands, contractual maturity dates (e.g., for fixedrate instruments) or expected liquidation periods often based on historical data are usedalternatively. The repricing gap per time band is computed by getting the difference between theinflows and outflows within the time band. A positive repricing gap implies that RBC’s netinterest income could decline if interest rates decrease upon repricing. A negative repricing gapimplies that RBC’s net interest income could decline if interest rates increase upon repricing.Although such gaps are a normal part of the business, a significant change may bring significantinterest rate risk. To help control interest rate risk arising from repricing gaps, maximum repricinggap and EaR/NII targets are set for time bands up to one year. EaR is prepared and reported to theRisk Management Committee quarterly.
RBC’s EaR figures are as follows (in PHP millions):
2016Average High Low December 31
Instruments sensitive to local interest rates P=71.65 P=154.18 P=1.08 P=121.35Instruments sensitive to foreign interest rates 0.04 0.09 0.01 0.09
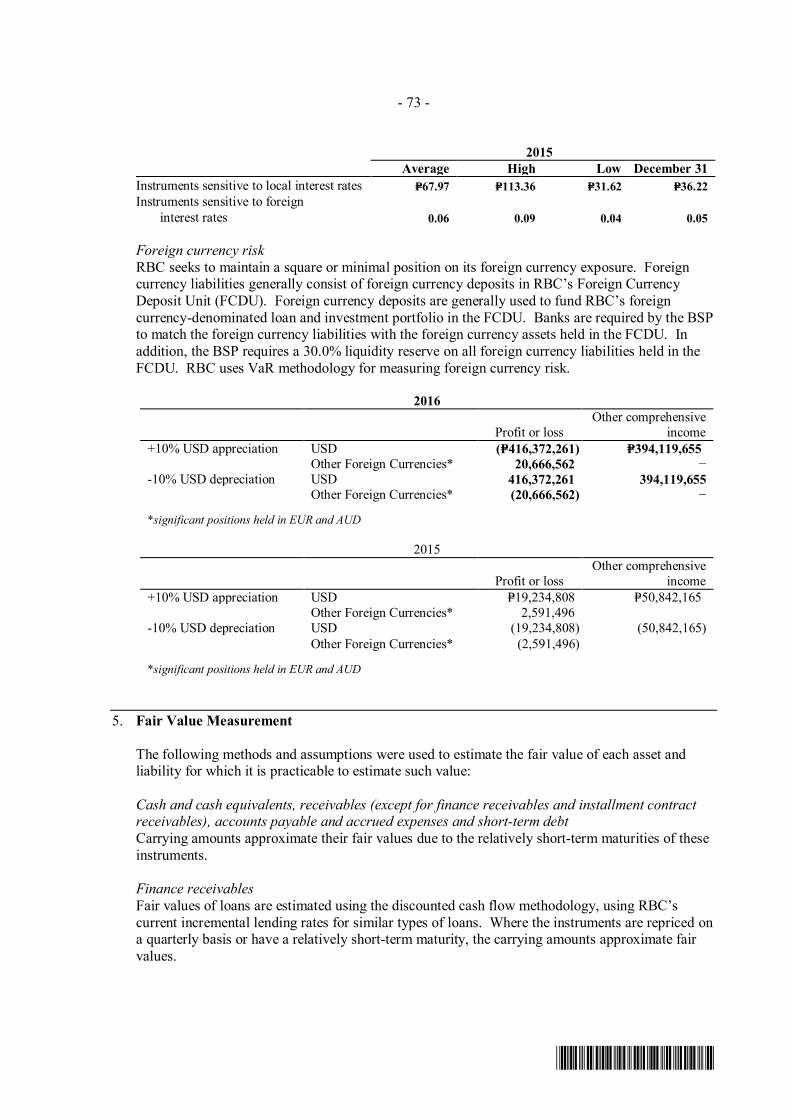
- 73 -
*SGVFS023363*
2015Average High Low December 31
Instruments sensitive to local interest rates P=67.97 P=113.36 P=31.62 P=36.22Instruments sensitive to foreign interest rates 0.06 0.09 0.04 0.05
Foreign currency riskRBC seeks to maintain a square or minimal position on its foreign currency exposure. Foreigncurrency liabilities generally consist of foreign currency deposits in RBC’s Foreign CurrencyDeposit Unit (FCDU). Foreign currency deposits are generally used to fund RBC’s foreigncurrency-denominated loan and investment portfolio in the FCDU. Banks are required by the BSPto match the foreign currency liabilities with the foreign currency assets held in the FCDU. Inaddition, the BSP requires a 30.0% liquidity reserve on all foreign currency liabilities held in theFCDU. RBC uses VaR methodology for measuring foreign currency risk.
2016
Profit or lossOther comprehensive
income+10% USD appreciation USD (P=416,372,261) P=394,119,655
Other Foreign Currencies* 20,666,562 −-10% USD depreciation USD 416,372,261 394,119,655
Other Foreign Currencies* (20,666,562) −
*significant positions held in EUR and AUD
2015
Profit or lossOther comprehensive
income+10% USD appreciation USD P=19,234,808 P=50,842,165
Other Foreign Currencies* 2,591,496-10% USD depreciation USD (19,234,808) (50,842,165)
Other Foreign Currencies* (2,591,496)
*significant positions held in EUR and AUD
5. Fair Value Measurement
The following methods and assumptions were used to estimate the fair value of each asset andliability for which it is practicable to estimate such value:
Cash and cash equivalents, receivables (except for finance receivables and installment contractreceivables), accounts payable and accrued expenses and short-term debtCarrying amounts approximate their fair values due to the relatively short-term maturities of theseinstruments.
Finance receivablesFair values of loans are estimated using the discounted cash flow methodology, using RBC’scurrent incremental lending rates for similar types of loans. Where the instruments are repriced ona quarterly basis or have a relatively short-term maturity, the carrying amounts approximate fairvalues.

- 74 -
*SGVFS023363*
Installment contract receivablesFair values of installment contract receivables are based on the discounted value of future cashflows using the applicable rates for similar types of receivables. The discount rates used rangefrom 2.3% to 5.8% in 2016 and 1.7% to 5.6% in 2015.
Debt securitiesFair values of debt securities are generally based on quoted market prices.
Quoted equity securitiesFair values are based on quoted prices published in markets.
Unquoted equity securitiesFair values could not be reliably determined due to the unpredictable nature of future cash flowsand the lack of suitable methods of arriving at a reliable fair value. These are carried at cost.
Amounts due from and due to related partiesCarrying amounts of due from and due to related parties which are collectible/payable on demandapproximate their fair values. Due from related parties are unsecured and have no foreseeableterms of repayments.
Noninterest-bearing refundable security depositsThe fair values are determined as the present value of estimated future cash flows using prevailingmarket rates.
Biological assetsBiological assets are measured at their fair values less costs to sell. The fair values of Level 2biological assets are determined based on current market prices of livestock of similar age, breedand genetic merit while Level 3 are determined based on cost plus reasonable profit margin orreplacement cost as applicable. Costs to sell include commissions to brokers and dealers,nonrefundable transfer taxes and duties. Costs to sell exclude transport and other costs necessaryto get the biological assets to the market.
The Group has determined that the highest and best use of the sucklings and weanlings is finisherswhile for other biological assets is their current use.
Derivative financial instrumentsThe fair values of the interest rate swaps and commodity swaps and options are determined basedon the quotes obtained from counterparties. The fair values of forward exchange derivatives arecalculated by reference to the prevailing interest differential and spot exchange rate as of valuationdate, taking into account the remaining term-to-maturity of the forwards. The fair values of crosscurrency swaps are based on the discounted cash flow swap valuation model of a third partyprovider.
Investment propertiesThe carrying amount of the investment properties approximates its fair value as of reporting date.Fair value of investment properties are based on market data (or direct sales comparison)approach. This approach relies on the comparison of recent sale transactions or offerings ofsimilar properties which have occurred and/or offered with close proximity to the subject property.
The fair values of the Group’s investment properties have been determined by appaisers, includingindependent external appraisers, in the basis of the recent sales of similar properties in the same

- 75 -
*SGVFS023363*
areas as the investment properties and taking into account the economic conditions prevailing atthe time of the valuations are made.
The Group has determined that the highest and best use of the property used for the land andbuilding is its current use.
Deposit liabilitiesFair values are estimated using the discounted cash flow methodology using RBC’s currentincremental borrowing rates for similar borrowings with maturities consistent with thoseremaining for the liabilities being valued.
Customers’ depositsThe fair value of customers’ deposits is based on the discounted value of future cash flows usingthe applicable rates for similar types of loans and receivables as of reporting date. The discountrates used range from 3.0% to 4.0% in 2016 and 2015.
Long-term debtThe fair value of long-term debt is based on the discounted value of future cash flows (interestsand principal) using the applicable rates for similar types of loans. The discount rates used rangefrom 2% to 6% in 2016 and 2015.
Fair Value Hierarchy Assets and LiabilitiesAssets and liabilities carried at fair value are those whose fair values are required to be disclosed.
(a) Level 1: quoted (unadjusted) prices in an active market for identical assets or liabilities;(b) Level 2: other techniques for which all inputs which have a significant effect on the recorded
fair value are observable, either directly or indirectly; and(c) Level 3: techniques which use inputs which have a significant effect on the recorded fair
value that are not based on observable market data.
The following table shows the Group’s assets and liabilities carried at fair value:
December 31, 2016Carrying Value Level 1 Level 2 Level 3 Total Fair value
Assets measured at fair valueFinancial assets at FVPL: Held-for-trading: Debt securities: Private P=9,719,180,330 P=9,719,180,330 P=– P=– P=9,719,180,330 Government 1,722,743,531 – 1,722,743,531 – 1,722,743,531
11,441,923,861 9,719,180,330 1,722,743,531 − 11,441,923,861 Equity securities: Quoted 2,779,265,343 2,779,265,343 – – 2,779,265,343
14,221,189,204 12,498,445,673 – – 14,221,189,204 Derivatives financial assets not designated as accounting hedges 478,956,361 478,956,361 –
–
478,956,361 Derivative financial assets designated as accounting hedges 26,800,472 26,800,472 –
–
26,800,472505,756,833 13,004,202,506 − – 505,756,833
AFS investments: Debt securities: Government 9,580,344,650 – 9,580,344,650 – 9,580,344,650 Private 4,233,057,221 4,233,057,221 – – 4,233,057,221
13,813,401,871 4,233,057,221 9,580,344,650 – 13,813,401,871 Equity securities: Quoted 25,238,255,235 25,238,255,235 – – 25,238,255,235
39,051,657,106 29,471,312,456 9,580,344,650 – 39,051,657,106Held-to-maturity investment 3,549,900,604 2,877,873,255 724,431,818 – 3,602,305,073Biological assets 1,383,379,248 – 140,714,789 1,242,664,459 1,383,379,248

- 76 -
*SGVFS023363*
December 31, 2016Carrying Value Level 1 Level 2 Level 3 Total Fair value
Assets for which fair values are disclosedReceivables: Trade receivables P=26,241,233,096 P=– P=– P=25,926,164,694 P=25,926,164,694 Finance receivables 38,004,283,010 – – 39,430,369,944 39,430,369,944 Other receivables 1,455,520,148 – – 1,450,445,746 1,450,445,746Refundable deposits 721,073,925 – – 726,140,884 726,140,884Investment properties 75,416,372,370 – – 175,063,056,484 175,063,056,484
P=200,550,365,544 P=54,973,960,635 P=10,338,987,122 P=243,838,842,211 P=301,360,465,216
Deposit liabilities P=57,364,495,943 P=– P=– P=57,467,829,433 P=57,467,829,433Derivative liabilities 5,947,386 – 5,947,386 – 5,947,386Customer's deposits 4,033,457,966 – – 3,055,829,774 3,055,829,774Long-term debt 159,187,755,600 – – 161,155,374,885 161,155,374,885
P=220,591,656,895 P=– P=5,947,386 P=221,679,034,092 P=221,684,981,478
December 31, 2015Carrying Value Level 1 Level 2 Level 3 Total Fair value
Assets measured at fair valueFinancial assets at FVPL: Held-for-trading: Debt securities: Private P=10,052,606,697 P=10,052,606,697 P=– P=– P=10,052,606,697 Government 1,636,353,203 – 1,636,353,203 – 1,636,353,203
11,688,959,900 10,052,606,697 1,636,353,203 − 11,688,959,900 Equity securities: Quoted 2,600,762,169 2,600,762,169 – – 2,600,762,169
14,289,722,069 12,653,368,866 1,636,353,203 − 14,289,722,069 Derivatives financial assets not designated as accounting hedges 580,568,726 − 580,568,726 − 580,568,726 Derivative financial assets designated as accounting hedges 37,358,957 – 37,358,957 – 37,358,957
617,927,683 – 617,927,683 – 617,927,683AFS investments: Debt securities: Government 8,116,937,680 – 8,116,937,680 – 8,116,937,680 Private 2,542,001,775 2,542,001,775 – – 2,542,001,775
P=10,658,939,455 P=2,542,001,775 P=8,116,937,680 P=– P=10,658,939,455 Equity securities: Quoted 36,945,115,293 36,945,115,293 – – 36,945,115,293
47,604,054,748 39,487,117,068 8,116,937,680 – 47,604,054,748Held-to-maturity investment 2,749,295,603 2,801,700,071 – – 2,801,700,071Biological assets 1,557,794,946 – 495,309,319 1,062,485,627 1,557,794,946
Assets for which fair values are disclosedReceivables: Trade receivables 23,496,468,569 – – 23,229,065,816 23,229,065,816 Finance receivables 26,818,867,137 – – 28,861,041,171 28,861,041,171 Other receivables 1,138,067,282 – – 1,138,067,282 1,138,067,282Refundable deposits 595,331,349 – – 594,672,001 594,672,001Investment properties 67,258,434,671 – – 174,844,220,446 174,844,220,446
P=186,125,964,057 P=54,942,186,005 P=11,929,013,512 P=228,667,066,716 P=295,538,266,233
Deposit liabilities 39,919,049,820 – – 43,169,181,584 43,169,181,584Derivative liabilities 2,443,495,138 – 2,443,495,138 2,443,495,138Customer's deposits 4,384,095,291 – – 4,135,372,297 4,135,372,297Long-term debt 166,482,186,844 – – 175,070,394,309 175,070,394,309
P=213,228,827,093 P=– P=2,443,495,138 P=222,374,948,190 P=224,818,443,328
In 2016 and 2015, there were no transfers between Level 1 and Level 2 fair value measurements.Non-financial asset determined under Level 3 includes investment properties. No transfersbetween any levels of the fair value hierarchy took place in the equivalent comparative period.There were also no changes in the purpose of any financial asset that subsequently resulted in adifferent classification of that asset.
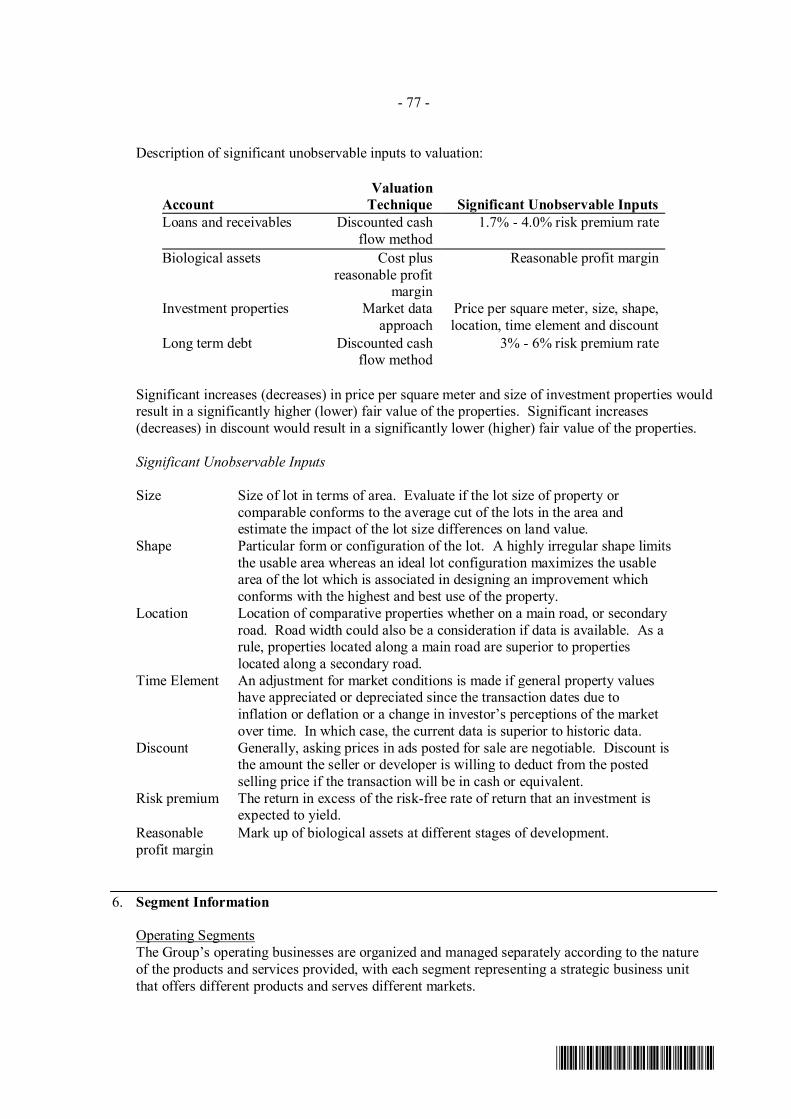
- 77 -
*SGVFS023363*
Description of significant unobservable inputs to valuation:
AccountValuation
Technique Significant Unobservable InputsLoans and receivables Discounted cash
flow method1.7% - 4.0% risk premium rate
Biological assets Cost plusreasonable profit
margin
Reasonable profit margin
Investment properties Market dataapproach
Price per square meter, size, shape,location, time element and discount
Long term debt Discounted cashflow method
3% - 6% risk premium rate
Significant increases (decreases) in price per square meter and size of investment properties wouldresult in a significantly higher (lower) fair value of the properties. Significant increases(decreases) in discount would result in a significantly lower (higher) fair value of the properties.
Significant Unobservable Inputs
Size Size of lot in terms of area. Evaluate if the lot size of property orcomparable conforms to the average cut of the lots in the area andestimate the impact of the lot size differences on land value.
Shape Particular form or configuration of the lot. A highly irregular shape limitsthe usable area whereas an ideal lot configuration maximizes the usablearea of the lot which is associated in designing an improvement whichconforms with the highest and best use of the property.
Location Location of comparative properties whether on a main road, or secondaryroad. Road width could also be a consideration if data is available. As arule, properties located along a main road are superior to propertieslocated along a secondary road.
Time Element An adjustment for market conditions is made if general property valueshave appreciated or depreciated since the transaction dates due toinflation or deflation or a change in investor’s perceptions of the marketover time. In which case, the current data is superior to historic data.
Discount Generally, asking prices in ads posted for sale are negotiable. Discount isthe amount the seller or developer is willing to deduct from the postedselling price if the transaction will be in cash or equivalent.
Risk premium The return in excess of the risk-free rate of return that an investment isexpected to yield.
Reasonableprofit margin
Mark up of biological assets at different stages of development.
6. Segment Information
Operating SegmentsThe Group’s operating businesses are organized and managed separately according to the natureof the products and services provided, with each segment representing a strategic business unitthat offers different products and serves different markets.

- 78 -
*SGVFS023363*
The industry segments where the Group operates are as follows:
∂ Foods, agro-industrial and commodities businesses - manufacturing of snack foods, granulatedcoffee and pre-mixed coffee, chocolates, candies, biscuits, instant noodles, ice cream andfrozen novelties, pasta and tomato-based products and canned beans; raising of hog, chickenand manufacturing and distribution of animal feeds, corn products and vegetable oil and thesynthesis of veterinary compound; and sugar milling and refining and flour milling.
∂ Air transportation - air transport services, both domestic and international, for passengers andcargoes.
∂ Real estate and hotels - ownership, development, leasing and management of shopping mallsand retail developments; ownership and operation of prime hotels in major Philippine cities;development, sale and leasing of office condominium space in office buildings and mixed usedevelopments including high rise residential condominiums; and development of land intoresidential subdivisions and sale of subdivision lots and residential houses and the provision ofcustomer financing for sales.
∂ Petrochemicals - manufacturer of polyethylene (PE) and polypropylene (PP), polymer gradeethylene, polymer grade propylene, partially hydrogenated pyrolysis gasoline and pyrolysisfuel oil.
∂ Banking - commercial banking operations, including deposit-taking, lending, foreignexchange dealing and fund transfers or remittance servicing.
∂ Other supplementary businesses - asset management, insurance brokering, foreign exchangeand securities dealing. Beginning 2012, other supplementary businesses include dividendincome from PLDT. Beginning 2013, other supplementary businesses also include equity inthe net earnings of Meralco (see Note 14).
No operating segments have been aggregated to form the above reportable operating businesssegments.
The Group does not have a single external major customer (which represents 10.0% of Group’srevenues).
Management monitors the operating results of each segment. The measure presented to managesegment performance is the segment operating income (loss). Segment operating income (loss) isbased on the same accounting policies as the consolidated operating income (loss) except thatintersegment revenues are eliminated only at the consolidation level. Group financing (includingfinance cost and other charges), finance income, market valuation gains(losses) on financial assetsat FVPL and derivatives, foreign exchange gains (losses), other operating income, general andadministrative expenses, impairment losses and others and income taxes are managed on a groupbasis and are not allocated to operating segments. Transfer pricing between operating segmentsare on arm’s length basis in a manner similar to transactions with third parties.
The Executive Committee (Excom) is actively involved in planning, approving, reviewing, andassessing the performance of each of the Group’s segments. The Excom oversees Group’sdecision making process. The Excom’s functions are supported by the heads of each of theoperating segments, which provide essential input and advice in the decision-making process. TheExcom is the Group’s chief operating decision maker.

- 79 -
*SGVFS023363*
The following tables present the financial information of each of the operating segments inaccordance with PFRS except for ‘Core earnings’, EBIT’ and EBITDA’ as of and for the yearsended December 31, 2016, 2015 and 2014. Core earnings pertain to income before income taxexcluding market valuation gains (losses) on financial assets at FVPL, market valuation gains onderivative financial instruments and foreign exchange gains (losses).

- 80 -
*SGVFS023363*
The Group’s operating segment information follows:
December 31, 2016Foods,
Agro-Industrialand Commodities
AirTransportation
Real Estateand Hotels Petrochemicals Banking
OtherSupplementary
Businesses
Adjustmentsand
EliminationsTOTAL
OPERATIONSRevenueSale of goods and services: External customers P=112,611,969,799 P=61,899,278,892 P=22,750,417,221 P=29,070,077,332 P=3,412,187,119 P=551,082,564 P=− P=230,295,012,927 Intersegment revenue − − 37,495,297 889,958,295 − − (927,453,592) −
112,611,969,799 61,899,278,892 22,787,912,518 29,960,035,627 3,412,187,119 551,082,564 (927,453,592) 230,295,012,927Dividend income (Note 28) 12,813,084 − − − 6,917,794 2,013,048,726 (1,199,410) 2,031,580,194
Equity in net earnings of associates and joint ventures (Note 14) (166,719,320) 178,308,843 2,790,366,394 − − 5,376,658,316 (2,088,117) 8,176,526,116Total revenue 112,458,063,563 62,077,587,735 25,578,278,912 29,960,035,627 3,419,104,913 7,940,789,606 (930,741,119) 240,503,119,237Cost of sales and services (Note 30) 76,403,953,654 34,262,194,205 11,011,098,421 22,753,221,449 696,840,597 (1,033,072,080) 144,094,236,246Gross income P=36,054,109,909 P=27,815,393,530 P=14,567,180,491 P=7,206,814,178 P=2,722,264,316 P=7,940,789,606 P=102,330,961 P=96,408,882,991
General and administrative expenses (Note 31) 43,498,208,309Impairment losses and others (Note 34) 640,717,050Operating income 52,269,957,632Financing cost and other charges (Note 35) (7,461,996,870)Finance income (Note 27) 1,161,245,053Other operating income (Note 29) (487,955,842)Core earnings 45,481,249,973Market valuation gain on financial assets (15,036,945,759)Foreign exchange gains (2,638,787,064)Income before income tax 27,805,517,150Provision for income tax (Note 38) 5,437,906,633Net income P=22,367,610,517Net income attributable to equity holders of the Parent
Company P=7,172,181,138 P=6,558,182,350 P=6,294,414,833 P=5,125,794,521 P=153,989,567 (P=14,320,812,966) (P=65,770,518) P=10,917,978,925
EBIT P=15,420,543,171 P=12,429,507,028 P=8,276,963,246 P=5,813,705,056 P=384,998,860 P=9,944,240,271 P=– P=52,269,957,632Depreciation and amortization (Notes 15, 16, 18 and 33) 5,549,349,133 5,998,695,417 3,774,153,608 1,318,457,917 290,172,266 70,941,305 – 17,001,769,646EBITDA P=20,969,892,304 P=18,428,202,445 P=12,051,116,854 P=7,132,162,973 P=675,171,126 P=10,015,181,576 P=– P=69,271,727,278
Other informationNon-cash expenses other than depreciation and amortization
(Note 34): Impairment losses on receivables (Note 11) P=10,144,972 P=– P= 4,673 P=– P=138,969,094 P=300,000,000 P=– P=449,118,739 Inventory obsolescence and market decline (Note 12) 175,449,919 – – – – – – 175,449,919 Impairment losses on other assets – – – – 16,148,392 – – 16,148,392
P=185,594,891 P=– P=4,673 P=– P=155,117,486 P=300,000,000 P=– P=640,717,050

- 81 -
*SGVFS023363*
December 31, 2015
Foods,Agro-Industrial
and CommoditiesAir
TransportationReal Estateand Hotels Petrochemicals Banking
OtherSupplementary
Businesses
Adjustmentsand
EliminationsTOTAL
OPERATIONSRevenueSale of goods and services: External customers P=112,004,706,553 P=56,501,654,516 P=20,298,039,549 P=26,780,296,575 P=2,968,940,306 P=558,258,619 P=− P=219,111,896,118 Intersegment revenue − − 32,563,971 964,757,683 − − (997,321,654) −
112,004,706,553 56,501,654,516 20,330,603,520 27,745,054,258 2,968,940,306 558,258,619 (997,321,654) 219,111,896,118
Dividend income (Note 28) 22,806,476 − − − 249,758 2,826,279,780 (1,142,295) 2,848,193,719
Equity in net earnings of associates and joint ventures (Note 14) (248,426,814) 35,418,498 2,507,485,422 − − 5,015,199,674 1,886,396 7,311,563,176
Total revenue 111,779,086,215 56,537,073,014 22,838,088,942 27,745,054,258 2,969,190,064 8,399,738,073 (996,577,553) 229,271,653,013Cost of sales and services (Note 30) 75,285,872,510 33,251,909,025 9,374,307,866 23,439,025,606 615,766,210 − (1,103,234,875) 140,863,646,342
Gross income P=36,493,213,705 P=23,285,163,989 P=13,463,781,076 P=4,306,028,652 P=2,353,423,854 P=8,399,738,073 P=106,657,322 P=88,408,006,671
General and administrative expenses (Note 31) 38,677,396,939Impairment losses and others (Note 34) 378,065,854
Operating income 49,352,543,878Financing cost and other charges (Note 35) (6,879,818,419)Finance income (Note 27) 1,367,392,486Other operating income (Note 29) 151,214,790
Core earnings 43,991,332,735Market valuation gain on financial assets (2,690,064,305)Foreign exchange gains (4,136,883,267)
Income before income tax 37,164,385,163Provision for income tax (Note 38) 4,488,982,473
Net income P=32,675,402,690
Net income attributable to equity holders of the ParentCompany P=7,738,310,512 P=2,949,733,870 P=6,137,260,108 P=3,155,702,482 P=64,002,113 P=2,663,457,053 (P=98,449,832) P=22,610,016,306
EBIT P=17,767,941,555 P=9,735,639,303 P=7,923,848,911 P=3,191,887,809 P=239,896,904 P=10,493,329,396 P=– P=49,352,543,878Depreciation and amortization (Notes 15, 16, 18 and 33) 4,846,359,146 5,111,543,725 3,203,353,347 1,016,593,005 219,954,653 41,962,769 – 14,439,766,645
EBITDA P=22,614,300,701 P=14,847,183,028 P=11,127,202,258 P=4,208,480,814 P=459,851,557 P=10,535,292,165 P=– P=63,792,310,523
(Forward)

- 82 -
*SGVFS023363*
December 31, 2015
Foods,Agro-Industrial
and CommoditiesAir
TransportationReal Estateand Hotels Petrochemicals Banking
OtherSupplementary
Businesses
Adjustmentsand
EliminationsTOTAL
OPERATIONS
Other information
Non-cash expenses other than depreciation and amortization(Note 34):
Impairment losses on receivables (Note 11) P=5,300,692 P=– P=1,629,711 P=– P=244,696,803 P=– P=7,786,052 P=259,413,258 Inventory obsolescence and market decline (Note 12) 104,202,866 – – – – – – 104,202,866 Impairment losses on other assets – – – – 14,449,730 – − 14,449,730
P=109,503,558 P=– P=1,629,711 P= P=259,146,533 P=– P=7,786,052 P=378,065,854

- 83 -
*SGVFS023363*
December 31, 2014
Foods,Agro-Industrial
and CommoditiesAir
TransportationReal Estateand Hotels Petrochemicals Banking
OtherSupplementary
Businesses
Adjustmentsand
EliminationsTOTAL
OPERATIONS
RevenueSale of goods and services: External customers P=96,653,414,632 P=52,000,018,310 P=17,432,805,294 P=3,226,178,660 P=2,717,195,606 P=461,461,847 P=− P=172,491,074,349 Intersegment revenue − − 22,217,906 574,809,040 − − (597,026,946) −
96,653,414,632 52,000,018,310 17,455,023,200 3,800,987,700 2,717,195,606 461,461,847 (597,026,946) 172,491,074,349Dividend income (Note 28) 5,074,717,636 (1,142,295) 5,073,575,341
Equity in net earnings of associates and joint ventures (Note 14) (75,114,916) 96,326,091 2,501,304,200 − − 4,737,351,905 (12,186,725) 7,247,680,555
Total revenue 96,578,299,716 52,096,344,401 19,956,327,400 3,800,987,700 2,717,195,606 10,273,531,388 (610,355,966) 184,812,330,245Cost of sales and services (Note 30) 66,167,992,138 36,548,411,792 8,368,197,079 4,072,426,320 559,820,713 − (710,233,142) 115,006,614,900
Gross income P=30,410,307,578 P=15,547,932,609 P=11,588,130,321 (P=271,438,620) P=2,157,374,893 P=10,273,531,388 P=99,877,176 P=69,805,715,345
General and administrative expenses (Note 31) 31,753,964,780Impairment losses and others (Note 34) 576,706,999
Operating income 37,475,043,566Financing cost and other charges (Note 35) (5,824,349,891)Finance income (Note 27) 1,347,723,538Other operating income (Note 29) 1,219,853,247
Core earnings 34,218,270,460Market valuation gain on financial assets (3,585,392,524)Foreign exchange gains (358,828,037)
Income before income tax 30,274,049,899Provision for income tax (Note 38) 4,449,245,289
Net income P=25,824,804,610
Net income (loss) attributable to equity holders of the ParentCompany P=6,668,221,276 P=573,838,894 P=5,412,565,199 (P=759,447,057) P=88,147,232 P=6,309,365,918 (P=47,541,672) P=18,245,149,790
EBIT P=15,004,073,172 P=4,253,663,081 P=6,378,368,489 (P=700,609,070) P=229,722,452 P=12,309,825,442 P=− P=37,475,043,566Depreciation and amortization (Notes 15, 16, 18 and 33) 4,111,226,959 4,281,525,018 2,860,204,571 299,638,813 168,412,070 38,600,632 − 11,759,608,063EBITDA P=19,115,300,131 P=8,535,188,099 P=9,238,573,060 (P=400,970,257) P=398,134,522 P=12,348,426,074 P=− P=49,234,651,629
(Forward)

- 84 -
*SGVFS023363*
December 31, 2014
Foods,Agro-Industrial
and CommoditiesAir
TransportationReal Estateand Hotels Petrochemicals Banking
OtherSupplementary
Businesses
Adjustmentsand
EliminationsTOTAL
OPERATIONS
Other information
Non-cash expenses other than depreciation and amortization(Note 34):
Impairment losses on receivables (Note 11) P=13,183,792 P=16,316,779 P=− P=− P=285,735,444 P=− P=− P=315,236,015 Inventory obsolescence and market decline (Note 12) 104,296,754 − − − − − − 104,296,754 Intangibles / Goodwill 5,212,591 − − − − − − 5,212,591 Impairment losses on other assets − − − − 151,961,639 − − 151,961,639
P=122,693,137 P=16,316,779 P=− P=− P=437,697,083 P=− P=− P=576,706,999

- 85 -
*SGVFS023363*
Other information on the Group’s operating segments follow:December 31, 2016
Foods,Agro-Industrial
and CommoditiesAir
TransportationReal Estateand Hotels Petrochemicals Banking
OtherSupplementary
BusinessesAdjustments
and Eliminations Consolidated
Investments in associates and joint ventures (Note 14) P=301,582,060 P=805,801,372 P=42,613,725,137 P=− P=− P=84,231,127,139 P=− P=127,952,235,708
Segment assets P=142,669,975,956 P=100,665,363,677 P=123,330,412,832 P=63,016,837,736 P=77,854,969,207 P=215,598,681,564 (P=56,824,924,086) P=666,311,316,886
Short-term debt (Note 23) P=5,985,992,111 P=− P=16,010,000,000 P=6,982,613,256 P=− P=32,905,909,210 P=− P=61,884,514,577
Long-term debt (Note 23) P=31,366,592,785 P=42,810,437,630 P=23,361,477,678 P=− P=− P=61,649,247,507 P=− P=159,187,755,600
Segment liabilities P=63,777,329,559 P=67,079,106,744 P=60,598,091,112 P=14,891,419,804 P=65,875,566,403 P=126,120,587,307 (P=44,814,639,244) P=353,527,461,685
Capital expenditures (Notes 15 and 16) P=7,657,219,437 P=19,126,054,236 P=12,731,165,668 P=1,973,324,669 P=317,506,229 P=47,758,548 P=− P=41,853,028,787
December 31, 2015Foods,
Agro-Industrialand Commodities
AirTransportation
Real Estateand Hotels Petrochemicals Banking
OtherSupplementary
BusinessesAdjustments
and Eliminations ConsolidatedInvestments in associates and joint ventures (Note 14) P=377,551,375 P=525,623,987 P=39,823,358,743 P=− P=− P=74,049,553,801 P=− P=114,776,087,906
Segment assets P=117,636,749,631 P=85,312,423,204 P=111,711,513,673 P=60,513,281,404 P=57,917,156,532 228,114,024,290 (P=64,873,169,746) P=596,331,978,988
Short-term debt (Note 23) P=5,277,377,299 P=− P=9,264,330,600 P=11,444,378,840 P=− P=8,897,869,735 P=− P=34,883,956,474
Long-term debt (Note 23) P=23,535,491,713 P=36,588,985,492 P=21,840,457,665 P=− P=− P=84,517,251,974 P=− P=166,482,186,844
Segment liabilities P=48,817,735,721 P=60,289,945,007 P=53,266,770,642 P=17,449,925,835 P=45,939,887,788 P=124,465,736,317 (P=41,223,683,680) P=309,006,317,630
Capital expenditures (Notes 15 and 16) P=7,251,505,242 P=13,047,934,091 P=14,003,122,388 P=4,402,650,161 P=312,837,720 P=10,585,122 P=− P=39,028,634,724
December 31, 2014Foods,
Agro-Industrialand Commodities
AirTransportation
Real Estateand Hotels Petrochemicals Banking
OtherSupplementary
BusinessesAdjustments
and Eliminations Consolidated
Investments in associates and joint ventures (Note 14) P=513,978,184 P=591,339,486 P=37,315,873,321 P=− P=− P=73,688,495,163 P=− P=112,109,686,154
Segment assets P=107,431,696,843 P=76,534,793,845 P=88,421,498,821 P=55,270,578,697 P=49,487,848,012 P=265,626,167,163 (P=83,467,907,348) P=559,304,676,033
Short-term debt (Note 23) P=5,179,398,035 P=− P=8,442,250,000 P=8,410,622,664 P=− P=22,254,462,838 P=− P=44,286,733,537
Long-term debt (Note 23) P=25,455,440,899 P=33,849,662,665 P=9,926,669,718 P=− P=− P=88,322,962,276 P=− P=157,554,735,558
Segment liabilities P=47,683,734,944 P=54,939,817,674 P=34,464,784,066 P=13,498,749,783 P=43,712,025,871 P=149,387,289,349 (P=45,992,180,260) P=297,694,221,427
Capital expenditures (Notes 15 and 16) P=6,848,707,745 P=13,316,719,856 P=8,702,464,516 P=8,825,595,421 P=232,360,883 P=53,087,877 P=− P=37,978,936,298

- 86 -
*SGVFS023363*
Reconciliation of Income Before Income Tax to EBITDA and Core Earnings
2016 2015 2014Income before income tax P=27,805,517,150 P=37,164,385,163 P=30,274,049,899Finance income (1,161,245,053) (1,367,392,486) (1,347,723,538)Financing cost and other charges 7,461,996,870 6,879,818,419 5,824,349,891Other operating income 487,955,842 (151,214,790) (1,219,853,247)Market valuation losses (gains) on
financial assets at FVPL andderivative financial instruments 15,036,945,759 2,690,064,305 3,585,392,524
Foreign exchange losses 2,638,787,064 4,136,883,267 358,828,037EBIT 52,269,957,632 49,352,543,878 37,475,043,566Depreciation and amortization 17,001,769,646 14,439,766,645 11,759,608,063EBITDA P=69,271,727,278 P=63,792,310,523 P=49,234,651,629
Income before income tax P=27,805,517,150 P=37,164,385,163 P=30,274,049,899Market valuation losses (gains) on
financial assets at FVPL andderivative financial instruments 15,036,945,759 2,690,064,305 3,585,392,524
Foreign exchange losses 2,638,787,064 4,136,883,267 358,828,037Core earnings P=45,481,249,973 P=43,991,332,735 P=34,218,270,460

- 87 -
*SGVFS023363*
The table below presents the consolidated statement of financial position of the Group broken down between industrial and banking components:
December 31, 2016 December 31, 2015Industrial* Banks* Consolidated Industrial* Banks* Consolidated
ASSETSCurrent AssetsCash and cash equivalents P=23,288,706,821 P=20,121,435,146 P=43,410,141,967 P=28,668,161,993 P=16,603,946,779 P=45,272,108,772Financial assets at fair value through profit and loss 14,697,498,896 2,650,398 14,700,149,294 14,855,428,435 14,865,890 14,870,294,325Available-for-sale investments 3,705,074,227 11,762,550,145 15,467,624,372 3,766,115,135 8,233,550,364 11,999,665,499Receivables - net 28,085,322,312 16,784,915,722 44,870,238,034 22,526,670,979 9,645,285,717 32,171,956,696Inventories - net 49,702,679,594 − 49,702,679,594 46,648,336,009 − 46,648,336,009Biological assets - net 920,226,312 − 920,226,312 1,096,482,209 − 1,096,482,209Other current assets 12,911,848,176 123,457,025 13,008,504,729 12,464,919,198 85,729,140 12,550,648,338Total current assets 133,311,356,338 48,795,008,436 182,106,364,774 130,026,113,958 34,583,377,890 164,609,491,848
Noncurrent AssetsAvailable-for-sale investments 23,608,326,105 − 23,608,326,105 35,628,682,620 35,628,682,620Receivables - noncurrent 2,799,254,419 22,048,530,776 24,847,785,195 3,299,854,333 17,891,548,959 21,191,403,292Held-to-maturity investments − 3,549,900,604 3,549,900,604 − 2,749,295,603 2,749,295,603Investments in associates and JVs - net 127,952,235,708 − 127,952,235,708 114,776,087,906 − 114,776,087,906Investments properties - net 75,124,309,829 292,062,541 75,416,372,370 67,068,706,676 189,727,995 67,258,434,671Property, plant and equipment - net 175,159,768,712 502,944,750 175,662,713,462 158,998,623,530 837,476,847 159,836,100,377Biological assets - bearer 463,152,936 − 463,152,936 461,312,737 − 461,312,737Goodwill – net 31,778,856,937 244,327,006 32,023,183,943 15,273,592,979 244,327,006 15,517,919,985Intangibles – net 12,797,827,284 1,361,176,209 14,159,003,493 8,040,084,297 992,673,256 9,032,757,553Other noncurrents assets 5,461,259,411 1,061,018,885 6,522,278,296 4,841,763,420 428,728,976 5,270,492,396Total Noncurrent Assets 455,144,991,341 29,059,960,771 484,204,952,112 408,388,708,498 23,333,778,642 431,722,487,140
P=588,456,347,679 P=77,854,969,207 P=666,311,316,886 P=538,414,822,456 P=57,917,156,532 P=596,331,978,988*Balances are after elimination of intercompany balances between industrial and banking components
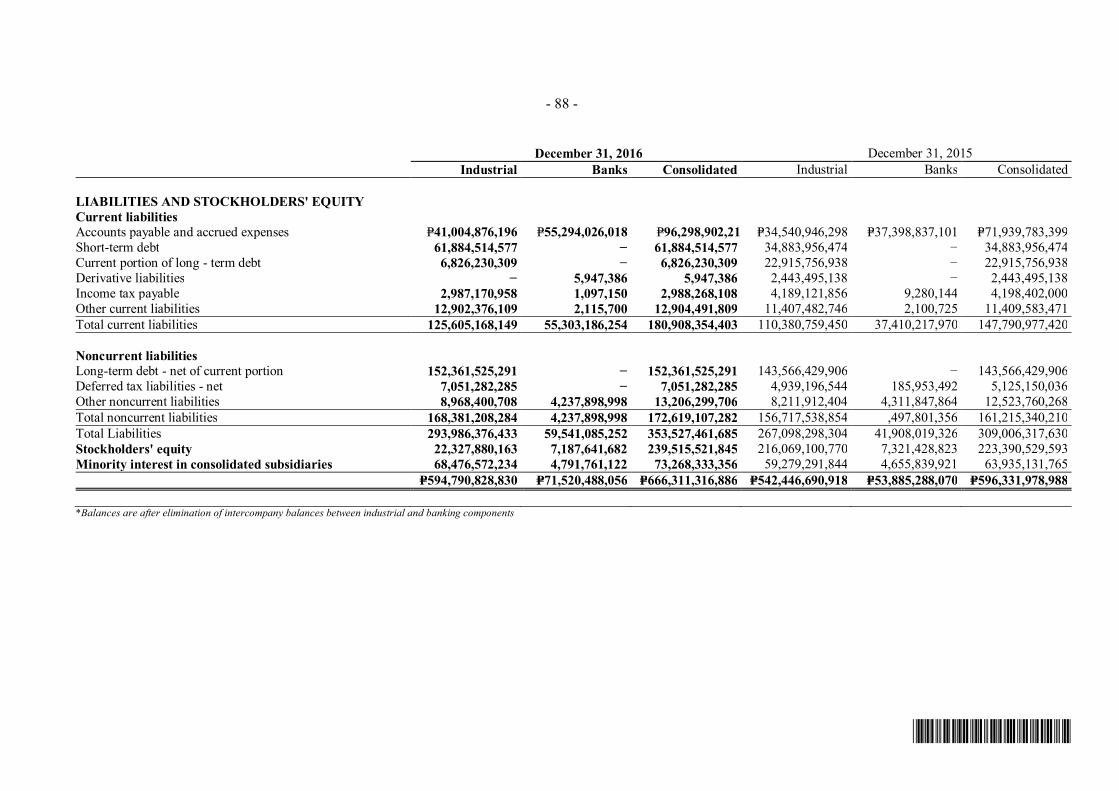
- 88 -
*SGVFS023363*
December 31, 2016 December 31, 2015Industrial Banks Consolidated Industrial Banks Consolidated
LIABILITIES AND STOCKHOLDERS' EQUITYCurrent liabilitiesAccounts payable and accrued expenses P=41,004,876,196 P=55,294,026,018 P=96,298,902,214 P=34,540,946,298 P=37,398,837,101 P=71,939,783,399Short-term debt 61,884,514,577 − 61,884,514,577 34,883,956,474 − 34,883,956,474Current portion of long - term debt 6,826,230,309 − 6,826,230,309 22,915,756,938 − 22,915,756,938Derivative liabilities − 5,947,386 5,947,386 2,443,495,138 − 2,443,495,138Income tax payable 2,987,170,958 1,097,150 2,988,268,108 4,189,121,856 9,280,144 4,198,402,000Other current liabilities 12,902,376,109 2,115,700 12,904,491,809 11,407,482,746 2,100,725 11,409,583,471Total current liabilities 125,605,168,149 55,303,186,254 180,908,354,403 110,380,759,450 37,410,217,970 147,790,977,420
Noncurrent liabilitiesLong-term debt - net of current portion 152,361,525,291 − 152,361,525,291 143,566,429,906 − 143,566,429,906Deferred tax liabilities - net 7,051,282,285 − 7,051,282,285 4,939,196,544 185,953,492 5,125,150,036Other noncurrent liabilities 8,968,400,708 4,237,898,998 13,206,299,706 8,211,912,404 4,311,847,864 12,523,760,268Total noncurrent liabilities 168,381,208,284 4,237,898,998 172,619,107,282 156,717,538,854 ,497,801,356 161,215,340,210Total Liabilities 293,986,376,433 59,541,085,252 353,527,461,685 267,098,298,304 41,908,019,326 309,006,317,630Stockholders' equity 22,327,880,163 7,187,641,682 239,515,521,845 216,069,100,770 7,321,428,823 223,390,529,593Minority interest in consolidated subsidiaries 68,476,572,234 4,791,761,122 73,268,333,356 59,279,291,844 4,655,839,921 63,935,131,765
P=594,790,828,830 P=71,520,488,056 P=666,311,316,886 P=542,446,690,918 P=53,885,288,070 P=596,331,978,988
*Balances are after elimination of intercompany balances between industrial and banking components
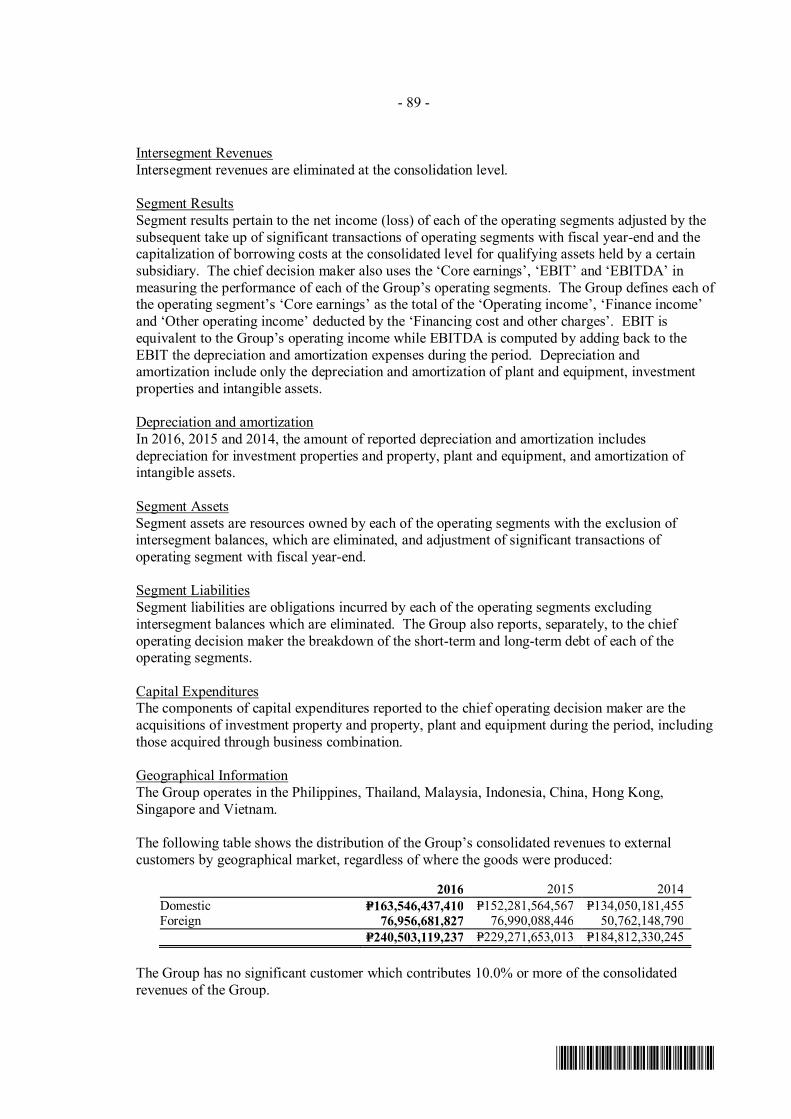
- 89 -
*SGVFS023363*
Intersegment RevenuesIntersegment revenues are eliminated at the consolidation level.
Segment ResultsSegment results pertain to the net income (loss) of each of the operating segments adjusted by thesubsequent take up of significant transactions of operating segments with fiscal year-end and thecapitalization of borrowing costs at the consolidated level for qualifying assets held by a certainsubsidiary. The chief decision maker also uses the ‘Core earnings’, ‘EBIT’ and ‘EBITDA’ inmeasuring the performance of each of the Group’s operating segments. The Group defines each ofthe operating segment’s ‘Core earnings’ as the total of the ‘Operating income’, ‘Finance income’and ‘Other operating income’ deducted by the ‘Financing cost and other charges’. EBIT isequivalent to the Group’s operating income while EBITDA is computed by adding back to theEBIT the depreciation and amortization expenses during the period. Depreciation andamortization include only the depreciation and amortization of plant and equipment, investmentproperties and intangible assets.
Depreciation and amortizationIn 2016, 2015 and 2014, the amount of reported depreciation and amortization includesdepreciation for investment properties and property, plant and equipment, and amortization ofintangible assets.
Segment AssetsSegment assets are resources owned by each of the operating segments with the exclusion ofintersegment balances, which are eliminated, and adjustment of significant transactions ofoperating segment with fiscal year-end.
Segment LiabilitiesSegment liabilities are obligations incurred by each of the operating segments excludingintersegment balances which are eliminated. The Group also reports, separately, to the chiefoperating decision maker the breakdown of the short-term and long-term debt of each of theoperating segments.
Capital ExpendituresThe components of capital expenditures reported to the chief operating decision maker are theacquisitions of investment property and property, plant and equipment during the period, includingthose acquired through business combination.
Geographical InformationThe Group operates in the Philippines, Thailand, Malaysia, Indonesia, China, Hong Kong,Singapore and Vietnam.
The following table shows the distribution of the Group’s consolidated revenues to externalcustomers by geographical market, regardless of where the goods were produced:
2016 2015 2014Domestic P=163,546,437,410 P=152,281,564,567 P=134,050,181,455Foreign 76,956,681,827 76,990,088,446 50,762,148,790
P=240,503,119,237 P=229,271,653,013 P=184,812,330,245
The Group has no significant customer which contributes 10.0% or more of the consolidatedrevenues of the Group.

- 90 -
*SGVFS023363*
The table below shows the Group’s carrying amounts of noncurrent assets per geographic locationexcluding noncurrent financial assets, deferred tax assets and pension assets:
2016 2015Domestic P=312,019,819,454 P=300,212,987,024Foreign 116,887,705,059 79,491,293,403
P=428,907,524,513 P=379,704,280,427
7. Cash and Cash Equivalents
This account consists of:
2016 2015Cash on hand P=2,115,114,050 P=2,076,709,922Cash in banks 24,507,650,528 18,456,304,537Cash equivalents 16,787,377,389 24,739,094,313
P=43,410,141,967 P=45,272,108,772
Cash in banks earns interest at the respective bank deposit rates. Cash equivalents representmoney market placements made for varying periods depending on the immediate cashrequirements of the Group, and earn annual interest ranging from 0.10% to 4.25%, from 0.10% to3.0%, and from 0.5% to 4.63% in 2016, 2015 and 2014, respectively.
8. Derivative Financial Instruments
The tables below show the fair value of the Group’s outstanding derivative financial instruments,reported as assets or liabilities, together with their notional amounts as of December 31, 2016 and2015. The notional amount is the basis upon which changes in the value of derivatives aremeasured.
December 31, 2016Notional Amounts (in Millions)
US DollarNew Zealand
DollarDerivative
AssetsDerivativeLiabilities
Derivatives Not Designated asAccounting Hedges
Freestanding:Commodity swaps* P=441,773,905 P=–Interest rate swaps USD 250.0 35,760,812 –Foreign currency swap USD 71.0 1,421,644 5,947,386
P=478,956,361 P=5,947,386
Derivatives Designated as Accounting Hedges (Note 13)Currency options NZ$28.2 P=26,800,472 P=–
P=26,800,472 –
Presented in the consolidatedstatements of financial position as:
Current P=478,956,361 P=5,947,386Noncurrent – –*Notional quantity amounted to 3,285,000 US barrels as of December 31, 2016

- 91 -
*SGVFS023363*
December 31, 2015
Notional Amounts (in Millions)
US DollarNew Zealand
DollarDerivative
AssetsDerivativeLiabilities
Derivatives Not Designated asAccounting Hedges
Freestanding:Foreign currency forwards (Note 9) NZD 322.3 P=580,568,726 P=–Commodity swaps* – 2,443,495,138
P=580,568,726 P=2,443,495,138
Derivatives Designated as AccountingHedges (Note 13)Interest rate swaps USD 250.0 P=37,358,957 P=–
P=37,358,957 –
Presented in the consolidated statementsof financial position as:
Current P=580,568,726 P=2,443,495,138Noncurrent 37,358,957 –*Notional quantity amounted to 2,220,000 US barrels as of December 31, 2015
Derivatives not designated as accounting hedgesThe Group’s derivatives not designated as accounting hedges include transactions to take positionsfor risk management purposes.
∂ Commodity derivativesCAI enters into fuel derivatives to manage its exposure to fuel price fluctuations. Such fuelderivatives are not designated as accounting hedges. The gains or losses on these instrumentsare accounted for directly as a charge against or credit to profit or loss. As ofDecember 31, 2016 and 2015, CAI has outstanding fuel hedging transactions. The notionalquantity is the amount of the derivatives’ underlying asset or liability, reference rate or indexand is the basis upon which changes in the value of derivatives are measured. The swaps canbe exercised at various calculation dates with specified quantities on each calculation date.The swaps have various maturity dates through December 31, 2018.
In 2016 and 2015, CAI recognized net changes in fair value of derivatives amounting toP=1.6 billion gain and P=2.9 billion loss, respectively under ‘Market valuation gains (losses) onderivative financial instruments’ account in the consolidated statements of comprehensiveincome.
As of December 31, 2014, URC has outstanding sugar hedging transactions with notionalquantity of 4,225 mT as part of the net assets acquired from the acquisition of NZSFHL. Asof December 31, 2014, the negative fair values of the commodity options amounted toNZD 0.3 million (liability) or P=10.5 million. In 2015, URC recognized gain amounting toP=5.99 million upon settlement of the commodity option.
∂ Interest rate swapThis pertains to the derivative of JGSPL that is dedesignated as a cash flow hedge andreclassified to ‘Financial asset at fair value through profit or loss’. As of December 31, 2016,the positive fair value of the interest rate swap amounted to P=35.8 million.

- 92 -
*SGVFS023363*
∂ Foreign currency forwardsURC entered into foreign currency hedging arrangements with various counterparties tomanage its exposure to foreign currency fluctuations. Such derivatives are not designated asaccounting hedges. The gains or losses on these instruments are accounted for directly as acharge against or credit to profit or loss. In 2014, URC pre-terminated all foreign currencyderivative contracts, and recognized a realized gain of P109.8 million.
In 2015, URC entered into a foreign currency forwards arrangement with notional amount ofNZ$322.3 million and recognized change in fair value of the instrument amounting toP=578.1 million during the year. On April 6, 2016, URC settled the foreign currency forwardwith carrying value of NZ$22.1 million (P=694.7 million). The Group recognized total mark-to-market gains of NZ$27.2 million (P=847.0 million).
In 2015, CAI pre-terminated all foreign currency derivative contracts, where the Grouprecognized realized gain of P=14.6 million. In 2016, CAI entered into foreign currency forwardcontracts which were pre-terminated in the same year, where the Group recognized realizedgain of P=6.7 million. The realized gain is recognized in ‘Market gains (losses) on derivativefinancial instruments – net’ account under the consolidated statements of comprehensiveincome.
Derivatives designated as accounting hedgesAs part of its asset and liability management, the Group uses derivatives, particularly interest rateswaps and currency options, as cash flow hedges in order to reduce its exposure to market risksthat is achieved by hedging portfolios of floating rate financial instruments.
The accounting treatment explained in Note 2 to the consolidated financial statements, HedgeAccounting, varies according to the nature of the hedged item and compliance with the hedgecriteria. Hedges entered into by the Group which provide economic hedges but do not meet thehedge accounting criteria are included under derivatives not designated as accounting hedges.
∂ Interest rate swapsOn December 18, 2012, the JGSPL entered into an interest rate swap transaction with anotional amount of US$250.0 million effective January 16, 2013. The swap is intended tohedge the interest rate exposure due to the movements in the benchmark LIBOR on theUS$ 250.0 million JGSPL 5-year Guaranteed Notes (see Note 23). Under the swaptransaction, JGSPL would pay a fixed rate quarterly on the 16th of April, July, October andJanuary in each year commencing on April 16, 2013, up to and including the termination date,January 16, 2018, subject to adjustment in accordance with the Modified Following BusinessDay Convention. The quarterly interest payments are guaranteed by the Parent Company. Asof December 31, 2015, the positive fair value of the interest rate swap amounted toP=37.4 million with an outstanding notional amount of US$250 million.
In October 2016, JGSPL prepaid the notes and dedesignated the interest rate swap as acashflow hedge of the related notes. Accordingly, the changes in the fair value of the interestrate swap accumulated in other comprehensive income amounting to P=34.2 million is recycledto profit or loss.
∂ Currency OptionThe Group’s currency options have a total notional amount of NZ$28.2 million with positivefair value amounting to NZ$778.1 thousand (P=26.8 million) as of December 31, 2016. Theswap is intended to hedge the foreign currency denominated future purchases and cashoutflows of the Company.

- 93 -
*SGVFS023363*
Hedge Effectiveness ResultsAs of December 31, 2016, the positive fair value of the currency options amounted toNZ$778.1 thousand (P=26.8 million) with notional amount of NZ$28.2 million. As ofDecember 31, 2015, the positive fair value of the interest rate swap amounted to P=37.4 million,respectively, with an outstanding notional amount of US$250 million. The hedge is assessed to beeffective as the critical terms of the hedging instrument match the terms of the hedged item.
Fair value changes in derivatives
Fair value changes of derivatives designated as accounting hedgesThe net movements in fair value of the Group’s derivative financial instruments designated asaccounting hedges follow:
2016 2015Beginning balance P=37,358,957 P=154,607,326Net changes shown in other comprehensive
income (Note 36):Net changes in fair value of derivatives taken to
other comprehensive income P=16,103,892 (P=91,909,256)Fair value of dedesignated derivative recycled to
profit or loss (34,166,517) –(18,062,625) (91,909,256)
Fair value of settled instruments 7,504,140 (25,339,113)(10,558,485) (117,248,369)P=26,800,472 P=37,358,957
Net changes in fair value of derivatives taken to other comprehensive income are recorded under‘Net gains (losses) from cash flow hedges’ in the consolidated statement of comprehensiveincome.
Fair value changes of derivatives not designated as accounting hedgesThe net movements in fair value of the Group’s derivative financial instruments not designated asaccounting hedges follow:
2016 2015Balance at beginning of year:
Derivative assets P=580,568,726 P=–Derivative liabilities (2,443,495,138) (2,271,027,283)
(1,862,926,412) (2,271,027,283)Net gains (losses) from changes in fair value of
derivatives taken to profit or loss 1,734,360,262 (2,353,076,578)Fair value of settled instruments 601,575,125 2,761,177,449
P=473,008,975 P=1,862,926,412Balance at end of year:
Derivative assets P=478,956,361 580,568,726
Derivative liabilities P=5,947,386 P=2,443,495,138
The net changes in fair value of derivatives taken to profit or loss are included under ‘Marketvaluation gains (losses) – net on derivative financial instruments’ in the consolidated statements ofcomprehensive income.

- 94 -
*SGVFS023363*
9. Financial Assets at Fair Value through Profit or Loss
These investments that are held for trading consist of:
2016 2015Debt securities:
Private P=9,719,180,330 P=10,052,606,697Government 1,722,743,531 1,636,353,203
11,441,923,861 11,688,959,900Equity securities:
Quoted 2,779,265,343 2,600,762,169Unquoted 3,729 3,530
2,779,269,072 2,600,765,699Derivatives (Note 8) 478,956,361 580,568,726
P=14,700,149,294 P=14,870,294,325
In 2016, 2015 and 2014, the Group recognized net market valuation losses on financial assets atFVPL (excluding derivatives) amounting to P=57.7 million, P=0.3 billion and P=1.3 billion,respectively included in under ‘Market valuation losses on financial assets at fair value throughprofit or loss’ in the consolidated statements of comprehensive income.
Interest income on financial assets at FVPL consists of (see Note 27):
2016 2015 2014Debt securities:
Private P=528,821,679 P=583,323,027 P=617,684,404Government 110,301,242 142,739,992 150,577,258
P=639,122,921 P=726,063,019 P=768,261,662
10. Available-for-Sale and Held-to-Maturity Investments
Available-for-Sale InvestmentsThis account consists of investments in:
2016 2015Debt securities:
Government P=9,580,344,650 P=8,116,937,680Private 4,233,057,221 2,542,001,775
13,813,401,871 10,658,939,455Equity securities:
Quoted 25,238,255,235 36,945,115,293Unquoted 24,293,371 24,293,371
25,262,548,606 36,969,408,664
P=39,075,950,477 P=47,628,348,119

- 95 -
*SGVFS023363*
Breakdown of AFS investments as shown in the consolidated statements of financial positionfollows:
2016 2015Current portion P=15,467,624,372 P=11,999,665,499Noncurrent portion 23,608,326,105 35,628,682,620
P=39,075,950,477 P=47,628,348,119
The Group has classified its remaining 17.2 million PLDT shares representing 8.0% ownershipinterest as AFS investments which have a carrying value of P=23.6 million and P=35.6 billion as ofDecember 31, 2016 and 2015, respectively.
In 2016, the Group recognized impairment losses on its AFS investments amounting toP=16.7 billion. In 2015 and 2014, the Group did not recognize any impairment in value of its AFSinvestments.
Interest income on AFS debt securities follows (see Note 27):
2016 2015 2014Debt securities:
Government P=331,913,646 P=330,565,210 P=256,314,160Private 200,960,934 169,913,035 233,158,043
P=532,874,580 P=500,478,245 P=489,472,203
The movements in net unrealized gains on AFS investments follow:
2016
Parent CompanyNon-controlling
Interests TotalBalance at beginning of year (P=4,984,560,896) (P=4,142,032) (P=4,988,702,928)Net changes shown in other comprehensive
income (Note 36): Fair value changes during the period on AFS
investments of the Parent Company and itssubsidiaries (12,220,137,282) (115,159,763) (12,335,297,045)
Realized loss (gain) on sale of AFS investments(Note 29) (452,510) − (452,510)
Reclassification of unrealized loss to profit orloss due to impairment 16,713,629,844 − 16,713,629,844
4,493,040,052 (115,159,763) 4,377,880,289 Share in net changes in fair value of AFS
investments of an associate (Notes 14 and36) (104,703,835) − (104,703,785)
Balance at end of year (P=596,224,679) (P=119,301,795) (P=715,526,424)

- 96 -
*SGVFS023363*
2015
Parent CompanyNon-controlling
Interests TotalBalance at beginning of year P=9,855,437,008 P=89,716,046 P=9,945,153,054Net changes shown in other comprehensive
income (Note 36): Fair value changes during the period on AFS
investments of the Parent Company and itssubsidiaries (14,837,369,077) (93,858,078) (14,931,227,155)
Realized gain on sale of AFS investments(Note 29) (898,183) − (898,183)
(14,838,267,260) (93,858,078) (14,932,125,338) Share in net changes in fair value of AFS
investments of an associate (Notes 14 and36) (1,730,644) − (1,730,644)
Balance at end of year (P=4,984,560,896) (P=4,142,032) (P=4,988,702,928)
2014
Parent CompanyNon-controlling
Interests TotalBalance at beginning of year P=5,617,663,796 (P=52,848,884) P=5,564,814,912Net changes shown in other comprehensive
income (Note 36): Fair value changes during the period on AFS
investments of the Parent Company and itssubsidiaries 4,239,116,995 142,564,930 4,381,681,925
Realized gain on sale of AFS investments(Note 29) (17,431) − (17,431)
4,239,099,564 142,564,930 4,381,664,494 Share in net changes in fair value of AFS
investments of an associate (Notes 14 and36) (1,326,352) − (1,326,352)
Balance at end of year P=9,855,437,008 P=89,716,046 P=9,945,153,054
Held-to-Maturity InvestmentAs of December 31, 2016 and 2015, the HTM investment of the Group consists of investments inprivate debt securities and government securities with interest rate range of 4.70% to 6.15% in2016 and 4.51% to 6.15% in 2015 and 1.10% to 3.53% in 2016 and 2.52% to 2.63% in 2015,respectively, which will mature on various dates from 2017 to 2026.
11. Receivables
This account consists of:
2016 2015Finance receivables P=38,928,503,801 P=27,658,143,966Trade receivables 26,798,683,841 24,056,425,064Due from related parties (Note 40) 1,417,510,849 1,249,205,544Interest receivable 757,193,234 660,751,456Other receivables 3,518,999,345 1,356,566,997
71,420,891,070 54,981,093,027Less allowance for impairment losses 1,702,867,841 1,617,733,039
P=69,718,023,229 P=53,363,359,988

- 97 -
*SGVFS023363*
Total receivables shown in the consolidated statements of financial position follow:
2016 2015Current portion P=44,870,238,034 P=32,171,956,696Noncurrent portion 24,847,785,195 21,191,403,292
P=69,718,023,229 P=53,363,359,988
Noncurrent receivables consist of:
2016 2015Trade receivables P=2,799,254,419 P=3,299,854,333Finance receivables 22,048,530,776 17,891,548,959
P=24,847,785,195 P=21,191,403,292
Finance ReceivablesBreakdown of finance receivables, which represent receivables from customers of RBC and itssubsidiary, follows:
2016 2015Receivables from customers:
Commercial P=27,873,689,220 P=19,545,752,654Consumption 4,938,320,453 3,627,590,391Real estate 5,762,119,652 3,880,334,171Microfinance 207,619,847 −Domestic bills purchased 139,455,175 606,548,470Customer liabilities under acceptances 38,298,006 6,544,461
38,959,502,353 27,666,770,147Less unearned interest and discounts 30,998,552 8,626,181
P=38,928,503,801 P=27,658,143,966
Interest income on finance receivables, unquoted debt securities and sales contract receivableincluded under ‘Banking revenue’ and ‘Finance income’ in profit or loss in the consolidatedstatements of comprehensive income, consists of (see Notes 26 and 27):
2016 2015 2014Receivables from customers:
Commercial P=1,025,633,504 P=933,286,107 P=826,332,493Consumption 944,289,657 716,822,261 765,778,798Real estate 314,683,992 376,084,516 239,803,462Domestic bills purchased 37,002,187 25,068,740 478,965
Sales contract receivable 12,526,920 7,628,865 8,074,849Unquoted debt securities − − 14,987,550
P=2,334,136,260 P=2,058,890,489 P=1,855,456,117
Restructured receivables which do not meet the requirements to be treated as performingreceivables are considered as nonperforming loans. Restructured receivables as ofDecember 31, 2016 and 2015 amounted to P=248.3 million and P=257.3 million, respectively.

- 98 -
*SGVFS023363*
Trade ReceivablesIncluded in trade receivables are installment contract receivables of the real estate segment of theGroup amounting to P=7.5 billion and P=8.1 billion as of December 31, 2016 and 2015. These arecollectible in monthly installments over a period of between one year to five years and earn annualinterest ranging from 12.0% to 21.0% computed on the diminishing balance of the principal. Thetitle of the real estate property, which is the subject of the installment contract receivable duebeyond 12 months, passes to the buyer once the receivable is fully paid. Revenue from real estateand hotels includes interest income earned from installment contract receivables amounting toP=308.0 million, P=541.0 million and P=499.0 million in 2016, 2015 and 2014 and is recorded underthe ‘Sale of goods and services’ of real estate segment on the consolidated statements ofcomprehensive income.
Other trade receivables are noninterest-bearing and generally have 30 to 90-day terms.
OthersOther receivables include claims receivables and other non-trade receivables. As ofDecember 31, 2016 and 2015, claims receivables amounted to P=2.0 billion and P=339.6 million,respectively.
Allowance for Impairment Losses on ReceivablesChanges in the allowance for impairment losses on receivables follow:
December 31, 2016Individual Assessment Collective Assessment
TradeReceivables
FinanceReceivables
OtherReceivables
TradeReceivables
FinanceReceivables Total
Balance at beginning of year P=527,395,204 P=547,805,633 P=218,499,715 P=32,561,291 P=291,471,196 P=1,617,733,039Provision for impairment losses (Note 34) 10,045,564 68,344,598 300,104,081 − 70,624,496 449,118,739Accounts written-off (24,774,563) (4,985,000) (300,104,081) − − (329,863,644)Unrealized foreign exchange gains 14,919,839 − − − − 14,919,839Reclassification − (156,636,125) − − 107,595,993 (49,040,132)Balance at end of year P=527,586,044 P=454,529,106 P=218,499,715 P=32,561,291 P=469,691,685 P=1,702,867,841
December 31, 2015Individual Assessment Collective Assessment
TradeReceivables
FinanceReceivables
OtherReceivables
TradeReceivables
FinanceReceivables Total
Balance at beginning of year P=510,448,890 P=337,648,405 P=218,531,619 P=32,561,291 P=273,494,149 P=1,372,684,354Provision for impairment losses (Note 34) 9,836,250 200,651,378 4,880,205 − 44,045,425 259,413,258Accounts written-off (2,468,457) (3,763,535) (4,912,109) − (114,871,185) (126,015,286)Unrealized foreign exchange gains 9,578,521 − − − − 9,578,521Reclassification − 13,269,385 − − 88,802,807 102,072,192Balance at end of year P=527,395,204 P=547,805,633 P=218,499,715 P=32,561,291 P=291,471,196 P=1,617,733,039
Provision for impairment losses on receivables for the year ended December 31, 2016, 2015 and2014 amounted to P=149.1 million, P=259.4 million and P=315.2 million, respectively.

- 99 -
*SGVFS023363*
12. Inventories
This account consists of inventories held as follows:
2016 2015At cost:
Raw materials P=6,432,978,463 P=4,996,991,960Finished goods 6,545,414,718 5,661,803,409
Total 12,978,393,181 10,658,795,369At NRV:
Subdivision land, condominium andresidential units for sale 25,643,036,168 25,999,400,711
Spare parts, packaging materials andother supplies 7,582,920,709 5,825,352,442
Work-in-process 1,050,961,612 913,860,273By-products 768,079 4,519,029
34,277,686,568 32,743,132,455Materials in-transit 2,446,599,845 3,246,408,185
P=49,702,679,594 P=46,648,336,009
Summary of the movements in real estate inventory follows:
2016 2015Balance at beginning of year P=25,999,400,711 P=15,624,283,409Acquisition of land use rights – 10,458,421,808Construction and development costs incurred 3,782,144,704 3,804,263,363Costs of real estate sales (Note 30) (4,138,509,247) (3,250,836,782)Transfers from (to) investment properties and
property and equipment (Notes 15 and 16) – (636,731,087)Balance at end of year P=25,643,036,168 P=25,999,400,711
The amount recognized as ‘Land use rights’ amounting to P=10.5 billion represents the total of thecontract price and transaction costs. On September 18, 2015, RLC paid the Chinese Governmenta bid deposit amounting to P=1.4 billion to join the bidding for the purchase of land rights locatedin Chengdu Province, China. On October 20, 2015, the Contract for Assignment of the Rights tothe Use of State-Owned Land was awarded to RLC. In May 2016, the Masterplan had beencompleted which was submitted for approval to the Chinese government in the same month. Thepresentation of the ‘Land use rights’ in the consolidated financial statements was reclassified fromintangible assets to inventories to conform with the presentation in the 2016 financial statementsas laid out in the masterplan. The estimated time of approval from Chinese government will be infirst quarter of 2017, and the project will take around 5 years to be completed.
Under the Contract, the Group is entitled to transfer, lease, mortgage all or part of the state-ownedconstruction land use right to a third party. Upon receipt of the Certificate of State-owned LandUse Right Assignment, the land title will be subdivided into Individual Property Titles which willbe issued to unit owners one year after completion of the development and turn-over of the units tothe buyers. When all or part of the state-owned construction land use right is transferred, throughsale of commercial units and high-rise condominium units to buyers, the rights and obligationsspecified in the Contract and in the land registration documents shall be transferred accordingly tothe buyer. The use term will be the remaining years as of the date of transfer based on the originaluse term specified in the Contract.

- 100 -
*SGVFS023363*
Borrowing cost capitalized amounted to P=376.0 million and P=66.0 million in 2016 and 2015,respectively. The capitalization rate used to determine the amount of borrowing costs eligible forcapitalization in 2016 and 2015 is 4.45% and 4.54%, respectively. This amount was included inthe construction and development costs incurred.
Under the terms of agreements covering liabilities under trust receipts amounting to P=2.95 billionand P=4.1 billion as of December 31, 2016 and 2015, respectively, inventories of equivalentamount with the liabilities under trust receipts have been released to the Group in trust for thecreditor banks (see Note 23). The Group is accountable to the banks for the value of the trusteedinventories or their sales proceeds.Inventory written down as expense (included under ‘Cost of sales and services’ in profit or loss inthe consolidated statements of comprehensive income) amounted to P=726.0 million,P=598.3 million and P=400.9 million in 2016, 2015 and 2014respectively.
The Group recognized inventory obsolescence and market decline included under ‘Impairmentlosses and others’ amounting to P=175.4 million, P=104.2 million and P=104.3 million in 2016, 2015and 2014, respectively (see Note 34).
As of December 31, 2016 and 2015, the Group does not have inventories that were pledged ascollaterals.
13. Other Current Assets
This account consists of:
2016 2015Input value-added tax (VAT) P=4,650,668,245 P=5,195,225,539Advances to suppliers 4,413,834,474 3,632,188,592Advances to lot owners and joint operations 1,636,442,295 567,811,119Prepaid expenses 1,377,863,336 1,129,348,503Restricted cash 81,436,823 129,602,038Derivative asset under hedge accounting (Note 8) 26,800,472 –Utility deposits 7,261,546 5,484,127Deposit to counterparties 5,516,245 1,124,551,325Others 835,481,765 766,437,095
P=13,035,305,201 P=12,550,648,338
Input VATAs of December 31, 2016 and 2015, the gross amount of output VAT deducted from input VATamounted to P=12.7 billion and P=11.6 billion, respectively. The Group believes that the amount ofinput VAT is fully realizable in the future.
Advances to SuppliersAdvances to suppliers include advance payments for the acquisition of raw materials, spare parts,packaging materials and other supplies. Also included in the account are advances made forservice maintenance. These are applied against progress billings which occur within one yearfrom the date the advances arose.

- 101 -
*SGVFS023363*
Advances to Lot Owners and Joint OperationsAdvances to lot owners consist of advance payments to land owners which will be applied againstthe acquisition cost of the real properties that will be acquired. The application is expected to bewithin twelve (12) months after the reporting date. This also includes deposit to various jointoperations partners representing share in an ongoing real estate development which will beliquidated at the end of the joint venture agreement. This deposit will be realized through RLC’sshare in the completed units or share in the sales proceeds of the units, depending on theagreement with the other party.
Prepaid ExpensesThis account consists of prepayments on the following:
2016 2015Rent P=457,778,072 P=440,772,920Insurance 251,561,735 226,134,810Taxes 138,088,511 16,619,494Office supplies 116,000,530 110,498,524Others 414,434,488 335,322,755
P=1,377,863,336 P=1,129,348,503
Deposit to CounterpartiesDeposit to counterparties pertains to collateral deposits provided to counterparties for fuel hedgingtransactions.
Restricted cashRLC and EHI has restricted cash - escrow which pertains to cash placed in escrow fundsearmarked for the acquisition of parcels of land, pursuant to the memorandum of agreement(MOA) with various sellers. Said amount shall be released to the sellers upon fulfillment ofcertain conditions set forth in MOA.
OthersIncluded under ‘Others’ account are creditable withholding taxes amounting to P=821.5 million andP=606.0 million as of December 31, 2016 and 2015, respectively.
14. Investments in Associates and Joint Ventures
Details of this account follow:
2016 2015Acquisition cost:
Balance at beginning of year P=94,487,165,622 P=93,853,195,466Additional investments 12,682,408,823 638,970,156Return of investment from an associate − (5,000,000)Balance at end of year 107,169,574,445 94,487,165,622
Accumulated equity in net earnings:Balance at beginning of year 20,452,778,905 18,455,083,182Equity in net earnings 8,176,526,116 7,311,563,176Dividends received (8,337,315,829) (5,313,867,453)Balance at end of year 20,291,989,192 20,452,778,905
(Forward)
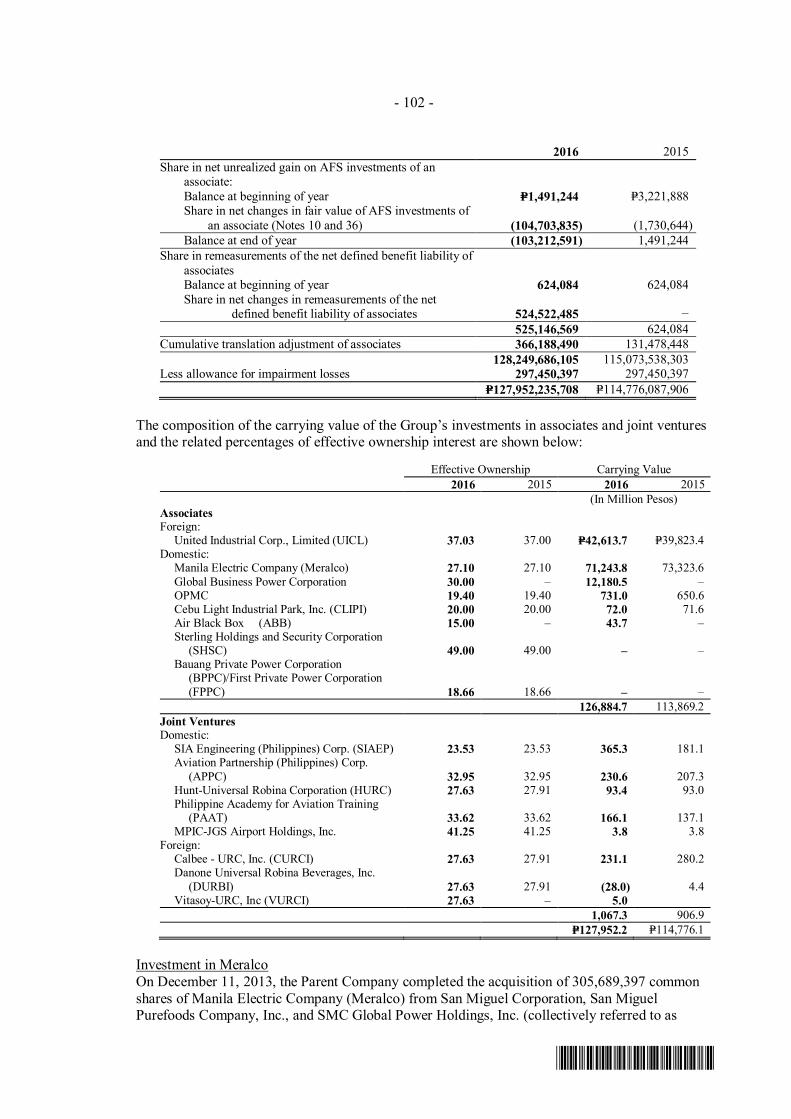
- 102 -
*SGVFS023363*
2016 2015Share in net unrealized gain on AFS investments of an
associate:Balance at beginning of year P=1,491,244 P=3,221,888Share in net changes in fair value of AFS investments of an associate (Notes 10 and 36) (104,703,835) (1,730,644)Balance at end of year (103,212,591) 1,491,244
Share in remeasurements of the net defined benefit liability ofassociatesBalance at beginning of year 624,084 624,084Share in net changes in remeasurements of the net
defined benefit liability of associates 524,522,485 −525,146,569 624,084
Cumulative translation adjustment of associates 366,188,490 131,478,448128,249,686,105 115,073,538,303
Less allowance for impairment losses 297,450,397 297,450,397P=127,952,235,708 P=114,776,087,906
The composition of the carrying value of the Group’s investments in associates and joint venturesand the related percentages of effective ownership interest are shown below:
Effective Ownership Carrying Value2016 2015 2016 2015
(In Million Pesos)AssociatesForeign: United Industrial Corp., Limited (UICL) 37.03 37.00 P=42,613.7 P=39,823.4Domestic: Manila Electric Company (Meralco) 27.10 27.10 71,243.8 73,323.6 Global Business Power Corporation 30.00 – 12,180.5 – OPMC 19.40 19.40 731.0 650.6 Cebu Light Industrial Park, Inc. (CLIPI) 20.00 20.00 72.0 71.6 Air Black Box (ABB) 15.00 – 43.7 – Sterling Holdings and Security Corporation
(SHSC) 49.00 49.00 – – Bauang Private Power Corporation
(BPPC)/First Private Power Corporation(FPPC) 18.66 18.66 – –
126,884.7 113,869.2Joint VenturesDomestic: SIA Engineering (Philippines) Corp. (SIAEP) 23.53 23.53 365.3 181.1 Aviation Partnership (Philippines) Corp.
(APPC) 32.95 32.95 230.6 207.3 Hunt-Universal Robina Corporation (HURC) 27.63 27.91 93.4 93.0 Philippine Academy for Aviation Training
(PAAT) 33.62 33.62 166.1 137.1 MPIC-JGS Airport Holdings, Inc. 41.25 41.25 3.8 3.8Foreign: Calbee - URC, Inc. (CURCI) 27.63 27.91 231.1 280.2 Danone Universal Robina Beverages, Inc.
(DURBI) 27.63 27.91 (28.0) 4.4 Vitasoy-URC, Inc (VURCI) 27.63 – 5.0
1,067.3 906.9P=127,952.2 P=114,776.1
Investment in MeralcoOn December 11, 2013, the Parent Company completed the acquisition of 305,689,397 commonshares of Manila Electric Company (Meralco) from San Miguel Corporation, San MiguelPurefoods Company, Inc., and SMC Global Power Holdings, Inc. (collectively referred to as

- 103 -
*SGVFS023363*
“Sellers”) for a total cost of P=71.9 billion. The shares acquired represented 27.1% of Meralco’stotal outstanding common shares.
Investment in GBPCOn June 30, 2016, the Parent Company acquired 577,206,289 common shares of Global BusinessPower Corporation (GBPC) from Meralco Powergen Corporation (153,921,676 shares) and GTCapital Holdings, Inc (423,284,613 shares) for a total cost of P=11.8 billion. The acquisitionrepresents 30.0% of GBPC’s total outstanding common shares.
In 2016, the Parent Company engaged the services of a third party valuer to perform a purchaseprice allocation of the Parent Company’s investment in GBPC among the identifiable assets andliabilities based on fair values. Based on the provisional purchase price allocation, the differenceof P=4.2 billion between the Parent Company’s share in the carrying values of GBPC’s specificidentifiable assets and liabilities and total cost of the Parent Company’s investment was allocatedto the Parent Company’s share in the difference between the fair value and carrying value ofGBPC’s specific and identifiable assets and liabilities as follows: P=2.8 billion for intangible assets;P=442.3 million for property, plant and equipment; P=4.2 million for long term receivables;P=333.3 million for long term debt and the remaining balance of P=1.3 billion for goodwill.
Investment in UICLUICL follows the fair value model in measuring investment properties while the Group followsthe cost model in measuring investment properties. The financial information of UICL belowrepresents the adjusted amounts after reversal of the effect of revaluation and depreciation on thesaid assets.
In 2016 and 2015, the Group elected to receive 5,670,381 and 4,711,042 ordinary shares,respectively, under the UIC Scrip Dividend Scheme in lieu of cash dividend at the issue price ofS$2.75 per share and S$3.28 per share, respectively.
Investment in OPMCThe Group accounts for its investment in OPMC as an associate although the Group holds lessthan 20.0% of the issued share capital, as the Group has the ability to exercise significant influenceover the investment, due to the Group’s voting power (both through its equity holding and itsrepresentation in key decision-making committees) and the nature of the commercial relationshipswith OPMC.
Fair value of investments in listed associates
As of December 31, 2016 and 2015, the Group’s investments in the following listed investeecompanies have fair values of:
Exchange Listed 2016 2015UICL Singapore Exchange Limited P=50,043,570,192 P=49,684,672,893OPMC Philippine Stock Exchange 426,890,219 388,082,017Meralco Philippine Stock Exchange 81,007,690,205 97,820,607,040
As of December 31, 2016 and 2015, the breakdown of the total fair market value of the Group’sinvestment in OPMC follows:
2016 2015Class A Common Stock P=99,115,847 P=90,105,315Class B Common Stock 327,774,372 297,976,702
P=426,890,219 P=388,082,017
- 104 -
*SGVFS023363*
The fair value is based on the quoted price prevailing as of the reporting date.
Investment in CLIPIThe Group accounts for its investments in CLIPI as an associate as it owns 20.0% of the issuedshare capital of CLIPI. In 2015 and 2014, CLIPI returned EHI’s deposit for future stocksubscription amounting to P=5.0 million and P=45.0 million, respectively. As ofDecember 31, 2016 and 2015, the Group has deposit for future stock subscription in CLIPIamounting to P=10.0 million. These represents 20.0% of CLIPI’s proposed increase in authorizedcapital stock.
Investment in Jobstreet.com Philippines, Inc. (JSP)On February 19, 2014, Jobstreet.com Pte Ltd. (JSS) (“the Purchaser”) entered into a conditionalshare sale agreement with the Group. The agreement provides for JSS’ acquisition of 5,645,600ordinary shares of JobStreet.com Philippines Inc. (JSP) representing the remaining 40.0% of thetotal issued and paid-up share capital of JSP for a consideration of MYR120.5 million orP1.6 billion payable entirely via issuance of 49,400,000 share of Jobstreet Corporation Berhad(JCB) at an issue price of MYR2.44 per share.
As a result of the transaction, the Group obtained 6.99% of JCB’s outstanding common stock.The Group recognized its investment in JCB shares at its fair value of P=1.6 billion and classified itas a financial asset at fair value through profit or loss. The Group recognized the differencebetween the fair value of the JCB shares and the carrying value of the JSP shares amounting toP=1.6 billion as ‘Other income’ in the 2014 consolidated statement of comprehensive income (seeNote 9). On December 7, 2016, the Group sold its investment in JCB shares.
Investment in SHSCThe investment in SHSC is fully provided with allowance amounting to P=113.4 million as ofDecember 31, 2016 and 2015.
Investment in Air Black BoxIn May 2016, CAI entered into Value Alliance Agreement with other low cost carriers (LCCs),namely, Scoot Pte. Ltd, Nok Airlines Public Company Limited, CEBGO, and Vanilla Air Inc.The alliance aims to increase passenger traffic by creating interline partnerships and partiesinvolved have agreed to create joint sales and support operations to expand services and productsavailable to passengers. This is achieved through LCCs’ investment in Air Black Box (ABB).
In November 2016, CAI acquired shares of stock in ABB amounting to P=43.7 million. ABB is anentity incorporated in Singapore in 2016 to manage the ABB settlement system, which facilitatesthe settlement of sales proceeds between the issuing and carrying airlines, and of the transactionfee due to ABB. The investment in ABB is accounted under equity method.
The investment gave CAI a 15% shareholding proportion to ABB which is classified as aninvestment in an associate and is accounted for at equity method as the Group has the ability toexercise significant influence over the investment because of its representation in the board ofdirectors of ABB. However, since ABB is still non-operational as of December 31 2016, theinvestment is recognized at cost and is subject to any remeasurement within the measurementperiod.
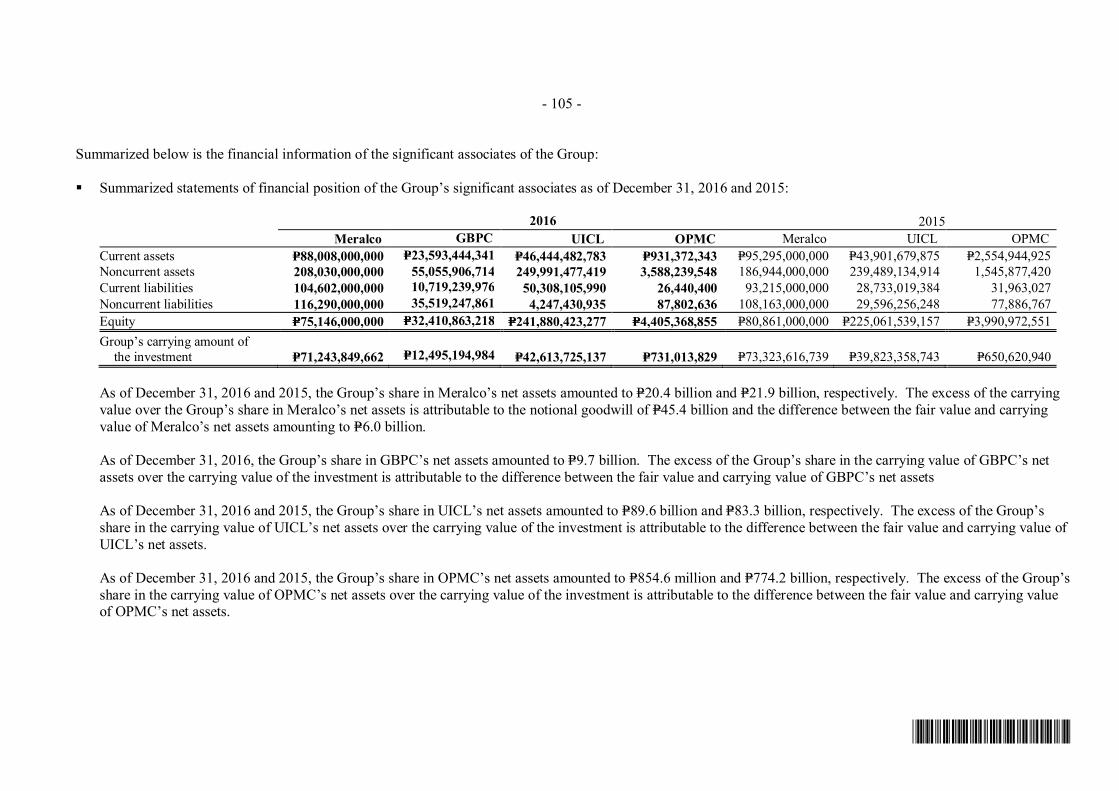
- 105 -
*SGVFS023363*
Summarized below is the financial information of the significant associates of the Group:
ƒ Summarized statements of financial position of the Group’s significant associates as of December 31, 2016 and 2015:
2016 2015Meralco GBPC UICL OPMC Meralco UICL OPMC
Current assets P=88,008,000,000 P=23,593,444,341 P=46,444,482,783 P=931,372,343 P=95,295,000,000 P=43,901,679,875 P=2,554,944,925Noncurrent assets 208,030,000,000 55,055,906,714 249,991,477,419 3,588,239,548 186,944,000,000 239,489,134,914 1,545,877,420Current liabilities 104,602,000,000 10,719,239,976 50,308,105,990 26,440,400 93,215,000,000 28,733,019,384 31,963,027Noncurrent liabilities 116,290,000,000 35,519,247,861 4,247,430,935 87,802,636 108,163,000,000 29,596,256,248 77,886,767Equity P=75,146,000,000 P=32,410,863,218 P=241,880,423,277 P=4,405,368,855 P=80,861,000,000 P=225,061,539,157 P=3,990,972,551Group’s carrying amount of the investment P=71,243,849,662 P=12,495,194,984 P=42,613,725,137 P=731,013,829 P=73,323,616,739 P=39,823,358,743 P=650,620,940
As of December 31, 2016 and 2015, the Group’s share in Meralco’s net assets amounted to P=20.4 billion and P=21.9 billion, respectively. The excess of the carryingvalue over the Group’s share in Meralco’s net assets is attributable to the notional goodwill of P=45.4 billion and the difference between the fair value and carryingvalue of Meralco’s net assets amounting to P=6.0 billion.
As of December 31, 2016, the Group’s share in GBPC’s net assets amounted to P=9.7 billion. The excess of the Group’s share in the carrying value of GBPC’s netassets over the carrying value of the investment is attributable to the difference between the fair value and carrying value of GBPC’s net assets
As of December 31, 2016 and 2015, the Group’s share in UICL’s net assets amounted to P=89.6 billion and P=83.3 billion, respectively. The excess of the Group’sshare in the carrying value of UICL’s net assets over the carrying value of the investment is attributable to the difference between the fair value and carrying value ofUICL’s net assets.
As of December 31, 2016 and 2015, the Group’s share in OPMC’s net assets amounted to P=854.6 million and P=774.2 billion, respectively. The excess of the Group’sshare in the carrying value of OPMC’s net assets over the carrying value of the investment is attributable to the difference between the fair value and carrying valueof OPMC’s net assets.

- 106 -
*SGVFS023363*
ƒ Summarized statements of comprehensive income of the Group’s significant associates for the period ended December 31, 2016, 2015 and 2014:
2016 2015Meralco GBPC UICL OPMC Meralco UICL OPMC
Revenue P=261,186,000,000 P=9,026,093,325 P=35,839,290,575 P=656,345,619 P=261,110,000,000 P=27,842,938,298 P=676,701,906Expenses 233,151,000,000 5,863,240,155 25,237,685,045 288,951,142 235,018,000,000 18,301,964,391 348,246,035Finance costs 1,343,000,000 1,008,892,704 316,620,895 – 1,216,000,000 416,876,275 –Profit before tax 26,692,000,000 2,153,960,466 10,284,984,635 367,394,477 24,876,000,000 9,124,097,632 328,455,871Income tax expense 7,352,000,000 26,610,580 1,704,881,742 – 5,687,000,000 1,300,987,718 1,199,154Profit for the year (continuing operations) P=19,340,000,000 P=2,127,349,886 P=8,580,102,893 P=367,394,477 P=19,189,000,000 P=7,823,109,914 P=327,256,717Total comprehensive income for the year (continuing operations) P=22,573,000,000 P=2,127,349,886 P=8,167,401,797 P=367,394,477 P=18,384,000,000 P=8,020,572,396 P=327,256,717Group’s share of profit for the year P=4,980,696,000 P=356,430,766 P=2,790,366,394 P=37,617,071 P=4,959,558,000 P=2,507,485,422 P=39,363,870
2014Meralco UICL OPMC
Revenue P=268,149,000,000 P=25,262,486,374 P=1,001,498,860Expenses 240,242,000,000 15,765,760,859 817,734,049Finance costs 1,439,000,000 273,962,540 –Profit before tax 26,468,000,000 9,222,762,975 183,764,811Income tax expense 8,337,000,000 1,414,672,882 –Profit for the year (continuing
operations) P=18,131,000,000 P=7,808,090,093 P=183,764,811Total comprehensive income for the year
(continuing operations) P=17,940,000,000 P=201,138,822 P=183,764,811Group’s share of profit for the year P=4,676,363,000 P=2,501,304,200 P=23,463,645

- 107 -
*SGVFS023363*
Investment in Joint VenturesAPPC and SIAEPAPPC and SIAEP jointly controlled entities which were established for the purpose of providingline and light maintenance services to foreign and local airlines, utilizing the facilities and servicesat airports in the Philippines, as well as aircraft maintenance and repair organizations.
APPC was incorporated on May 24, 2005 and started commercial operations on July 1, 2005 whileSIAEP was incorporated on July 27, 2008 and started commercial operations on August 17, 2009,respectively.
PAATInvestment in PAAT pertains to the Group’s 60.0% investment in shares of the joint venture.However, the joint venture agreement between the Group and CAE International HoldingsLimited (CAE) states that the Group is entitled to 50.0% share on the net income/loss of PAAT.As such, the Group recognizes equivalent 50.0% share in net income and net assets of the jointventure.
CAI entered into a joint venture agreement with CAE on December 13, 2011. PAAT was createdto address the Group’s training requirements and to pursue business opportunities for training thirdparties in the commercial fixed wing aviation industry, including other local and internationalairline companies. On December 19, 2011, the Parent Company paid P=33.8 million representing25% payment for the 135,000,000 Class A subscribed shares at P=1.0 par value. PAAT wasformally incorporated on January 27, 2012 and started commercial operations in December 2012.
As of December 31, 2016 and 2015, CAI’s investment in PAAT amounted to P=166.1 million andP=137.1 million.
HURCURC has an equity interest in HURC, a domestic joint venture which is a jointly controlled entity.HURC manufactures and distributes food products under the “Hunt’s” brand name, which is underexclusive license to HURC in the Philippines.
CURCIOn January 17, 2014, URC entered into a joint venture agreement with Calbee, Inc., a corporationduly organized in Japan to form CURCI, a corporation duly incorporated and organized in thePhilippines to manufacture and distribute food products under the “Calbee Jack ‘n Jill” brandname, which is under exclusive license to CURCI in the Philippines. URC contributed cash toCURCI upon its incorporation in 2014 amounting to P=327.0 million representing its 50% interestin the joint venture.
DURBIOn May 23, 2014, URC entered into a joint venture agreement with Danone Asia Holdings, Pte.Ltd., a corporation duly organized in the Republic of Singapore to form DURBI, a corporationduly incorporated and organized in the Philippines to manufacture and distribute food productsunder the “B’lue” brand name, which is under exclusive license to DURBI in the Philippines.URC contributed cash to DURBI upon its incorporation in 2014 amounting to P=180.8 millionrepresenting its 50% interest in the joint venture. In 2015, URC contributed an additionalP=129.0 million cash to DURBI and maintained its 50% ownership.
VURCIOn October 4, 2016, URC entered into a joint venture agreement with Vita International HoldingsLimited, a corporation duly organized in Hong Kong to form VURCI, a corporation duly

- 108 -
*SGVFS023363*
incorporated and organized in the Philippines to manufacture and distribute food products underthe “Vitasoy” brand name, which is under exclusive license to VURCI in the Philippines.

- 109 -
*SGVFS023363*
Summarized financial information in respect of the Group’s material joint venture is set out below. The summarized financial information below represents amountsshown in the joint ventures financial statements prepared in accordance with PFRS.
ƒ Summarized statements of financial position of material joint ventures as of December 31, 2016 and 2015:
2016APPC HURC SIAEP PAAT CURCI DURBI
Current assets P=795,460,819 P=438,300,049 P=698,461,242 P=286,174,849 P=493,257,685 P=407,899,346Noncurrent assets 155,159,767 357,790 1,664,971,439 804,157,578 160,325,333 15,417,496Current liabilities 479,957,656 251,834,046 384,081,485 78,688,833 191,319,343 477,373,247Noncurrent liabilities – – 935,588,667 679,361,939 – 1,866,944Equity P=470,662,930 P=186,823,793 P=1,043,762,529 P=332,281,655 P=462,263,675 (P=55,923,349)Group’s carrying amount of the investment P=230,629,736 P=93,411,897 P=365,316,886 P=166,140,827 P=231,131,838 (P=27,961,675)
2015APPC HURC SIAEP PAAT CURCI DURBI
Current assets P=650,452,860 P=392,198,725 P=483,125,816 P=266,000,656 P=637,997,706 P=159,520,497Noncurrent assets 261,601,217 645,733 1,569,590,695 757,860,538 181,014,610 13,571,208Current liabilities 388,851,643 206,586,359 604,693,999 30,994,557 258,649,076 164,398,327Noncurrent liabilities 100,040,852 – 930,473,644 718,601,220 – –Equity P=423,161,582 P=186,258,099 P=517,548,868 P=274,265,417 P=560,363,240 P=8,693,378Group’s carrying amount of the investment P=207,349,175 P=93,023,066 P=181,142,104 P=137,132,708 P=280,181,620 P=4,346,689
As of December 31, 2016, the Group’s share in APPC’s net assets amounted to P=155.1 million. The excess of the carrying value over the Group’s share in APPC’snet assets is only attributable to the difference between the fair value and carrying value of APPC’s’s net assets.
As of December 31, 2016, the Group’s share in HURC’s net assets amounted to P=12.4 million. The excess of the Group’s share in the carrying value of HURC’s netassets over the carrying value of the investment is attributable to the difference between the fair value and carrying value of HURC’s net assets
As of December 31, 2016, the Group’s share in SIAEP’s net assets amounted to P=245.6 million. The excess of the Group’s share in the carrying value of SIAEP’snet assets over the carrying value of the investment is attributable to the difference between the fair value and carrying value of SIAEP’s net assets.

- 110 -
*SGVFS023363*
As of December 31, 2016, the Group’s share in PAAT’s net assets amounted to P=111.7 million. The excess of the Group’s share in the carrying value of PAAT’s netassets over the carrying value of the investment is attributable to the difference between the fair value and carrying value of PAAT’s net assets.
As of December 31, 2016, the Group’s share in CURCI’s net assets amounted to P=127.7 million. The excess of the Group’s share in the carrying value of CURCI’snet assets over the carrying value of the investment is attributable to the difference between the fair value and carrying value of CURCI’s net assets.
As of December 31, 2016, the Group’s share in DURBI’s net assets amounted to (P=15.5 million). The excess of the Group’s share in the carrying value of DURBI’snet assets over the carrying value of the investment is attributable to the difference between the fair value and carrying value of DURBI’s net assets.
ƒ Summarized statements of comprehensive income of material joint ventures as of December 31, 2016, 2015 and 2014:
2016APPC HURC SIAEP PAAT CURCI DURBI
Revenue P=987,094,549 P=707,220,646 P=969,132,649 P=305,467,453 P=205,599,743 P=619,676,101Expenses 653,807,786 659,159,088 937,444,460 193,942,399 309,928,028 898,391,495Other income (expenses) 62,291,042 4,576,603 (18,573,663) (46,126,617) 7,785,901 7,348,323Profit before tax 395,577,805 52,638,161 13,114,526 65,398,437 (96,542,384) (271,367,071)Income tax expense 96,535,066 16,860,509 5,200,863 7,382,199 1,557,180 (250,343)Profit for the year (continuing operations) P=299,042,739 P=35,777,652 P=7,913,663 P=58,016,238 (P=98,099,564) (P=271,116,728)Total comprehensive income for the year
(continuing operations) P=299,042,739 P=35,777,652 P=7,913,663 P=58,016,238 (P=98,099,564) (P=271,116,728)Group’s share of profit for the year P=146,530,942 P=17,888,826 P=2,769,782 P=29,008,119 (P=49,049,782) (P=135,558,364)

- 111 -
*SGVFS023363*
2015APPC HURC SIAEP PAAT CURCI DURBI
Revenue P=905,813,968 P=675,900,267 P=387,432,455 P=157,878,689 P=224,284,468 P=247,464,071Expenses (603,475,105) (646,322,054) (562,632,105) (149,404,852) (315,042,526) (683,137,854)Other income (expenses) 8,283,751 – (9,236,769) (40,522,812) – –Profit before tax 310,622,613 29,578,213 (184,436,419) (32,048,975) (90,758,058) (435,673,783)Income tax expense 72,602,620 – 45,652 1,236,173 – –Profit for the year (continuing operations) P=238,019,994 P=29,578,213 (P=184,482,071) (P=33,285,148) (P=90,758,058) (P=435,673,783)Total comprehensive income for the year
(continuing operations) P=238,019,994 P=29,578,213 (P=184,482,071) (P=33,285,148) (P=90,758,058) (P=435,673,783)
Group’s share of profit for the year P=116,629,797 P=14,789,107 (P=64,568,725) (P=16,642,574) (P=45,379,029) (P=217,836,892)
2014APPC HURC SIAEP PAAT CURCI DURBI
Revenue P=831,652,059 P=688,873,834 P=749,982,173 P=227,958,105 P=4,149,588 P=–Expenses (537,954,937) (661,092,127) (847,033,722) (164,004,339) (7,028,290) 175,132,837Other income (expenses) 22,550,458 – (79,043) (16,239,773) – –Profit before tax 316,247,580 27,781,707 (97,130,592) 47,713,993 (2,878,702) 175,132,837Income tax expense 94,657,252 – 2,142,521 2,729,153 – –Profit for the year (continuing operations) P=221,590,328 P=27,781,707 (P=99,273,113) P=44,984,840 (P=2,878,702) P=175,132,837Total comprehensive income for the year
(continuing operations) P=221,590,328 P=27,781,707 (P=99,273,113) P=44,984,840 (P=2,878,702) P=175,132,837Group’s share of profit for the year P=108,579,261 P=13,890,854 (P=34,745,590) P=22,492,420 (P=1,439,351) (P=87,566,419)
As of December 31, 2016 and 2015, the Group has no unrecognized share of losses, share on commitments and contingencies of its associates and joint ventures.

- 112 -
*SGVFS023363*
Investment in SubsidiariesAs of December 31, 2016 and 2015, the Parent Company has the following percentage ownershipof shares in its wholly-owned and partially-owned subsidiaries as follows:
Effective Percentage of Ownership
Name of SubsidiariesCountry of
IncorporationDecember 31,
2016December 31,
2015Food
Universal Robina Corporation and Subsidiaries Philippines 55.25 55.83Air Transportation
CP Air Holdings, Inc. and Subsidiaries -do- 100.00 100.00Cebu Air, Inc. (CAI) and Subsidiaries -do- 67.23 67.23Pacific Virgin Islands Holdings, Co., Ltd. British Virgin Islands - 100.00
Real Estate and HotelsRobinsons Land Corporation and Subsidiaries Philippines 60.97 60.97
PetrochemicalsJG Summit Petrochemical Corporation (JGSPC) -do- 100.00 100.00JG Summit Olefins Corporation -do- 100.00 100.00
BankingRobinsons Bank Corporation -do- 60.00 60.00
Supplementary BusinessesExpress Holdings, Inc. and Subsidiaries -do- 100.00 100.00Summit Forex Brokers Corporation -do- 100.00 100.00JG Summit Capital Services Corp. and Subsidiaries -do- 100.00 100.00JG Summit Capital Markets Corp. -do- 100.00 100.00Summit Point Services, Ltd. -do- 100.00 100.00Summit Internet Investments, Inc. -do- 100.00 100.00JG Summit Cayman, Ltd. (JGSCL) Cayman Islands 100.00 100.00JG Summit Philippines, Ltd. And Subsidiaries -do- 100.00 100.00JG Summit Holdings Philippines, Ltd. British Virgin Islands 100.00 100.00Multinational Finance Group, Ltd. -do- 100.00 100.00Telegraph Development, Ltd. -do- 100.00 100.00Summit Top Investment, Ltd. -do- 100.00 100.00JG Summit Limited (JGSL) -do- 100.00 100.00Batangas Agro-Industrial Development Corporation(BAID and Subsidiaries.) Philippines 100.00 100.00Fruits of the East, Inc. -do- 100.00 100.00Hometel Integrated Management Corporation -do- 100.00 100.00King Leader Philippines, Inc. -do- 100.00 100.00Samar Commodities Trading and IndustrialCorporation -do- 100.00 100.00Tropical Aqua Resources -do- 100.00 100.00United Philippines Oil Trading, Inc. -do- 100.00 100.00Unicon Insurance Brokers Corporation -do- 100.00 100.00

- 113 -
*SGVFS023363*
Financial information of subsidiaries that have material non-controlling interest is provided below:
ƒ Portion of equity interest held by non-controlling interest
Name of Subsidiary
Country ofIncorporationand Operation
December 31,2016
December 31, 2015
Universal Robina Corporation (URC) Philippines 55.25 44.17Robinsons Land Corporation (RLC) Philippines 39.03 39.03CP Air Holdings, Inc. (CPAIR) Philippines 32.77 32.77JG Summit Capital Services Corp
(JGSCSC) Philippines 40.00 40.00
ƒ Accumulated balances of material non-controlling interest:
Name of Subsidiary 2016 2015URC P=34,800,613,250 P=30,031,472,075RLC 24,656,704,510 22,894,940,314CPAIR 10,978,040,752 8,176,598,156JGSCSC 4,656,693,545 4,655,839,921
ƒ Profit allocated to material non-controlling interest:
Name of Subsidiary 2016 2015URC P=5,910,692,782 P=6,262,072,222RLC 2,240,325,255 2,323,166,528CPAIR 3,195,953,844 1,437,479,559JGSCSC 102,659,711 42,668,075
The summarized financial information of subsidiaries with material non-controlling interest areprovided below. This information is based on amounts before inter-company eliminations.
ƒ Summarized statement of financial position as at December 31, 2016:
URC RLC CPAIR JGCSCCurrent assets P=51,812,773,909 P=39,635,922,449 P=15,151,909,742 P=53,427,977,127Noncurrent assets 90,857,202,047 83,694,490,383 85,513,453,935 25,460,415,467Current liabilities 27,794,826,668 29,096,687,075 28,274,482,126 61,900,871,242Noncurrent liabilities 35,982,502,891 31,490,105,325 38,804,624,618 4,250,204,954
ƒ Summarized statement of financial position as at December 31, 2015:
URC RLC CPAIR JGCSCCurrent assets P=52,288,892,897 P=26,720,299,724 P=10,109,554,138 P=38,411,189,325Noncurrent assets 65,347,856,734 84,991,213,949 75,202,869,065 20,562,607,241Current liabilities 22,425,451,917 23,445,654,722 27,009,193,481 41,750,585,985Noncurrent liabilities 26,392,283,804 29,809,817,208 33,280,751,525 4,507,744,827

- 114 -
*SGVFS023363*
ƒ Summarized statements of income for 2016:
URC RLC CPAIR JGSCSCRevenue P=112,458,063,518 P=22,875,513,363 P=59,909,327,246 P=3,830,510,373Profit for the year from continuing
operations 13,082,873,919 5,744,373,694 9,745,687,660 298,777,409Total comprehensive income 13,232,239,647 5,613,769,735 9,753,535,488 6,929,890Dividends paid to non-controlling interests 3,203,718,761 575,177,717 397,082,599 –
ƒ Summarized statements of income for 2015:
URC RLC CPAIR JGSCSCRevenue P=111,779,086,215 P=20,371,237,379 P=54,414,821,819 P=3,259,453,923Profit for the year from continuing
operations 14,005,436,425 5,952,941,214 4,387,213,429 (50,126,756)Total comprehensive income 15,749,452,489 5,950,166,519 4,325,308,518 (316,052,601)Dividends paid to non-controlling interests 3,049,810,705 575,177,717 297,811,949 –
ƒ Summarized statements of income for 2014:
URC RLC CPAIR JGSCSCRevenue P=96,578,299,716 P=19,934,109,494 P=52,048,803,041 P=6,353,588,532Profit for the year from continuing
operations 12,046,848,848 5,102,090,807 853,488,558 1,869,779,943Total comprehensive income 12,042,917,351 5,107,102,236 1,063,170,544 1,869,779,943Dividends paid to non-controlling interests 2,979,251,848 575,177,717 198,541,299 –
15. Investment Properties
Movements in this account follow:
2016Land and LandImprovements
Buildings andImprovements
ConstructionIn-Progress Total
CostBalance at beginning of year P=28,900,492,180 P=55,614,107,941 P=5,191,790,071 P= 89,706,390,192Additions 1,405,006,727 3,583,300,768 6,100,656,140 11,088,963,635Retirements/disposals (26,328,645) – – (26,328,645)Transfers/other adjustments 85,311,921 6,706,071,389 (6,574,584,491) 216,798,819Balance at end of year 30,364,482,183 65,903,480,098 4,717,861,720 100,985,824,001Accumulated Depreciation
and AmortizationBalance at beginning of year 218,253,576 22,227,011,026 – 22,445,264,602Depreciation and amortization 64,213,326 3,083,925,983 – 3,148,139,309Transfers/other adjustments (115,012,295) 60,641,099 – (54,371,196)Balance at end of year 167,454,607 25,371,578,108 – 25,539,032,715Allowance for Impairment LossesBalance at beginning of year 2,690,919 – – 2,690,919Provision for impairment losses 16,148,392 – – 16,148,392Transfers/other adjustments 11,579,605 – – 11,579,605Balance at end of year 30,418,916 – – 30,418,916
Net Book Value at End of Year P=30,166,608,660 P=40,531,901,990 P=4,717,861,720 P=75,416,372,370

- 115 -
*SGVFS023363*
2015Land and LandImprovements
Buildings andImprovements
ConstructionIn-Progress Total
CostBalance at beginning of year P=22,502,834,694 P=48,955,300,245 P=5,280,983,095 P=76,739,118,034Additions 5,200,269,085 845,380,358 7,206,674,220 13,252,323,663Transfers/other adjustments 1,197,388,401 5,813,427,338 (7,295,867,244) (285,051,505)Balance at end of year 28,900,492,180 55,614,107,941 5,191,790,071 89,706,390,192Accumulated Depreciation
and AmortizationBalance at beginning of year 123,884,915 19,629,847,555 – 19,753,732,470Depreciation and amortization 19,632,112 2,665,960,316 – 2,685,592,428Transfers/other adjustments 74,736,549 (68,796,845) – 5,939,704Balance at end of year 218,253,576 22,227,011,026 – 22,445,264,602Allowance for Impairment LossesBalance at beginning and end of year 2,690,919 – – 2,690,919
Net Book Value at End of Year P=28,679,547,685 P=33,387,096,915 P=5,191,790,071 P=67,258,434,671
Investment properties consist mainly of land held for appreciation, and shopping malls orcommercial centers and office buildings that are held to earn rentals. Also included under thisaccount are the properties acquired by the Group’s banking segment through foreclosures. Mostof the Group’s properties are in prime locations across the Philippines.
Borrowing CostsBorrowing costs capitalized amounted to P=0.4 billion and P=0.9 billion in 2016 and 2015,respectively. These amounts were included in the consolidated statements of cash flows underadditions to investment properties. The capitalization rate used to determine the amount ofborrowing costs eligible for capitalization in 2016 and 2015 were 4.45% and 4.54%, respectively.
Rent Income from Investment PropertiesConsolidated rent income from investment properties included under ‘Real estate and hotelsrevenue’ in the consolidated statements of comprehensive income amounted to P=10.7 billion,P=9.6 billion and P=8.2 billion in 2016, 2015 and 2014, respectively.
Direct Operating ExpensesDirect operating expenses pertaining to rental operations (included under ‘Cost of sales andservices’ and ‘General and administrative expenses’ in the consolidated statements ofcomprehensive income) amounted to P=4.3 billion, P=3.5 billion and P=3.2 billion in 2016, 2015 and2014, respectively.
Depreciation and AmortizationThe breakdown of consolidated depreciation and amortization on investment properties follows:
2016 2015 2014Depreciation and amortization expense
included under:Cost of services (Note 30) P=3,087,950,727 P=2,668,560,740 P=2,419,249,565General and administrative expenses
(Note 31) 60,188,582 17,031,688 20,218,948P=3,148,139,309 P=2,685,592,428 P=2,439,468,513
CollateralsAs of December 31, 2016 and 2015, the Group has no investment properties that are pledged ascollateral.

- 116 -
*SGVFS023363*
16. Property, Plant and Equipment
The composition of and movements in this account follow:December 31, 2016
Land andImprovements
Buildings andImprovements
Machineryand Equipment
Transportation,Furnishing and
Other Equipment
Passenger Aircraftand Other Flight
EquipmentConstruction
In-progressEquipment
In-transit TotalCostBalance at beginning of year P=5,882,980,325 P=23,398,924,976 P=99,289,012,170 P=8,645,193,765 P=83,830,528,666 P=21,849,803,705 P=1,353,469,831 P=244,249,913,438Additions 156,437,164 1,770,345,824 3,745,359,329 1,083,931,526 10,430,364,773 11,228,547,868 1,025,488,294 29,440,474,778Additions from acquisition of a subsidiary
(Note 44) – 186,272,233 1,686,772,953 – – 498,424,492 – 2,371,469,678Acquisition of assets that qualified as a
business (Note 19) 304,217,000 197,496,500 473,847,117 348,029,757 – – – 1,323,590,374Disposals and other adjustments 422,108,178 1,299,112,541 9,849,814,759 (744,936,473) (3,462,505,968) (13,413,110,502) (584,608,006) (6,634,125,471)Balance at end of year 6,765,742,667 26,852,152,074 115,044,806,328 9,332,218,575 90,798,387,471 20,163,665,563 1,794,350,119 270,751,322,797Accumulated Depreciation and AmortizationBalance at beginning of year 680,309,593 9,774,490,469 45,520,983,527 5,342,607,888 23,077,705,111 – – 84,396,096,588Depreciation and amortization 176,680,352 1,338,565,895 5,479,811,045 948,119,530 5,762,601,231 – – 13,705,778,053Disposals, transfers and other adjustments 61,204,499 312,517,383 1,030,034,769 66,474,323 (4,501,212,753) – – (3,030,981,779)Balance at end of year 918,194,444 11,425,573,747 52,030,829,341 6,357,201,741 24,339,093,589 – – 95,070,892,862Allowance for impairment losses – – 17,716,473 – – – – 17,716,473Net Book Value at End of Year P=5,847,548,223 P=15,426,578,327 P=62,996,260,514 P=2,975,016,834 P=66,459,293,882 P=20,163,665,563 P=1,794,350,119 P=175,662,713,462
December 31, 2015
Land andImprovements
Buildings andImprovements
Machineryand Equipment
Transportation,Furnishing and
Other Equipment
Passenger Aircraftand Other Flight
EquipmentConstruction
In-progressEquipment
In-transit TotalCostBalance at beginning of year P=5,717,442,056 P=53,750,094,586 P=56,707,633,263 P=6,918,719,864 P=75,923,538,340 P=19,611,344,088 P=1,547,728,405 P=220,176,500,602Additions 98,547,960 1,214,088,020 5,834,280,413 866,484,613 9,366,255,774 8,399,929,559 478,758,646 26,258,344,985Disposals, transfers and other adjustments 66,990,309 (31,565,257,630) 36,747,098,494 859,989,288 (1,459,265,448) (6,161,469,942) (673,017,220) (2,184,932,149)Balance at end of year 5,882,980,325 23,398,924,976 99,289,012,170 8,645,193,765 83,830,528,666 21,849,803,705 1,353,469,831 244,249,913,438Accumulated Depreciation and AmortizationBalance at beginning of year 575,058,515 8,292,208,164 39,616,665,004 4,082,729,873 20,105,711,343 – – 72,672,372,899Depreciation and amortization 150,255,252 1,223,941,045 4,580,011,542 743,608,123 4,980,211,585 – – 11,678,027,547Disposals and other adjustments (45,004,174) 258,341,260 1,324,306,981 516,269,892 (2,008,217,817) – – 45,696,142Balance at end of year 680,309,593 9,774,490,469 45,520,983,527 5,342,607,888 23,077,705,111 – – 84,396,096,588Allowance for impairment losses – – 17,716,473 – – – – 17,716,473Net Book Value at End of Year P=5,202,670,732 P=13,624,434,507 P=53,750,312,170 P=3,302,585,877 P=60,752,823,555 P=21,849,803,705 P=1,353,469,831 P=159,836,100,377


- 118 -
*SGVFS023363*
Construction in-ProgressCAIConstruction in-progress represents the cost of aircraft and engine modifications in progress andbuildings and improvements and other ground property under construction. Construction in-progress is not depreciated until such time when the relevant assets are completed and availablefor use. As of December 31, 2016 and 2015, the Group’s capitalized pre-delivery payments asconstruction in-progress amounted to P=14.5 billion and P=10.4 billion, respectively.
JGSOCConstruction in-progress amounting to P=0.8 billion and P=6.8 billion as of December 31, 2016 and2015, respectively, represents the construction costs of the Naphtha Cracker Plant. The plant isintended for the production primarily of polymer grade ethylene, polymer grade propylene,partially hydrogenated pyrolysis gasoline and pyrolysis fuel oil.
JGSPCConstruction in progress amounting to P=1.2 billion and P=0.8 billion as of December 31, 2016 and2015, respectively, represents the expansion and rehabilitation of PE and PP plant.
RLCConstruction in progress amounting to P=4.7 billion and P=5.2 billion as of December 31, 2016 and2015, respectively, represents the cost of ongoing construction and development of malls andoffice buildings for lease.
Depreciation and AmortizationThe breakdown of consolidated depreciation and amortization on property, plant and equipmentfollows:
2016 2015 2014General and administrative expenses (Note 31) P=6,849,226,440 P=5,667,790,503 P=5,011,421,009Cost of sales (Note 30) 6,170,348,732 5,475,444,437 3,866,114,378Cost of services (Note 30) 686,202,881 534,792,607 440,955,006
P=13,705,778,053 P=11,678,027,547 P=9,318,490,393
Property, Plant and Equipment Pledged as Collateral
Passenger aircraft held as securing assets under various loansThe Group entered into various ECA loans and commercial loan facilities to finance the purchaseof its aircraft and engines. As of December 31, 2016, the Group has four Airbus A319 aircraft,seven Avion de Transport Regional (ATR) 72-500 turboprop aircraft, and ten Airbus A320 aircraftunder ECA loans, and nineteen Airbus A320 aircraft, two ATR72-600 turbo pop, one AirbusA330 and five engines under commercial loans.

- 119 -
*SGVFS023363*
Under the terms of the ECA loan and commercial loan facilities (Note 18), upon the event ofdefault, the outstanding amount of loan (including accrued interest) will be payable by CALL orILL or BLL or SLL or SALL or VALL or POALL or PTALL or PTHALL, or SAALL or SBALLor by the guarantors which are CPAHI and JGSHI. CPAHI and JGSHI are guarantors to loansentered into by CALL, ILL, BLI, SLL and SALL. Failure to pay the obligation will allow therespective lenders to foreclose the securing assets.
As of December 31, 2016 and 2015, the carrying amounts of the securing assets (included underthe ‘Property and equipment’ account) amounted to P=56.9 billion and P=53.0 billion, respectively.
Forward Sale AgreementOn February 23, 2015, CAI signed a forward sale agreement with a subsidiary of Allegiant TravelCompany (collectively known as “Allegiant”) covering CAI’s sale of six (6) Airbus A319 aircraft.The aircrafts are scheduled for delivery on various dates in 2015 until 2016.
In September and October 2015, CAI delivered the first two out of six Airbus A319 aircraft toAllegiant and recognized P=80.3 million loss on sale recorded under ‘Other expenses’ in theconsolidated statement of comprehensive income (see Note 29).
In 2016, CAI delivered the remaining four out of six airbus A319 aircraft to Allegiant andrecognized P=962.6 million loss on sale recorded under ‘Other expenses’ in the consolidatedstatements of comprehensive income (see Note 29).
In 2016, CAI signed another forward sale agreement with Allegiant covering the last remainingfour A319 aircraft. The aircraft are scheduled for delivery on various dates in 2017 and 2018.
Operating FleetAs of December 31, 2016 and 2015, the Group’s operating fleet follows:
2016 2015Owned (Note 23):
Airbus A319 4 8Airbus A320 29 26Airbus A330 1 -ATR 72-500 8 8ATR 72-600 2 -
Under operating lease (Note 42):Airbus A320 7 7Airbus A330 6 6
57 55
Loss on sale or retirement of property, plant and equipment amounted to P=354.5 million,P=19.5 million and P=9.8 million in 2016, 2015 and 2014, respectively.
As of December 31, 2016 and 2015, the gross amount of fully depreciated property and equipmentwhich are still in use by the Group amounted to P=2.4 billion and P=2.1 billion, respectively.

- 120 -
*SGVFS023363*
17. Biological Assets
Total biological assets shown in the consolidated statements of financial position follow:
2016 2015Current portion P=920,226,312 P=1,096,482,209Noncurrent portion 463,152,936 461,312,737
P=1,383,379,248 P=1,557,794,946
These biological assets consist of:
2016 2015Swine Commercial P=897,048,298 P=1,067,699,892 Breeder 411,356,528 409,205,103Poultry Commercial 23,178,014 28,782,317 Breeder 51,796,408 52,107,634
P=1,383,379,248 P=1,557,794,946
The rollforward analysis of this account follows:
2016 2015Balance at the beginning of the year P=1,557,794,946 P=1,711,012,655Additions 2,752,445,408 2,922,958,775Disposal (2,831,264,288) (3,019,217,493)Loss arising from changes in fair value less estimated costs to sell (95,596,818) (56,958,991)
P=1,383,379,248 P=1,557,794,946
As of December 31, 2016 and 2015, the Group has about 229,582 and 249,666 heads of swine,respectively, and about 443,635 and 427,679 heads of poultry, respectively.

- 121 -
*SGVFS023363*
18. Intangible Assets
The composition and movements in this account follow:
2016Technology
LicensesBank licenses and
othersSoftware
CostsTrademarks and
BrandsProduct
FormulationCustomer
Relationship TotalCostBalance at beginning
of year P=552,331,752 P=1,718,744,748 P=157,039,729 P=5,198,501,291 P=425,000,000 P=1,885,972,092 P=9,937,589,612Additions – 44,600,000 555,048,596 – – – 599,648,596Additions due to business
combination (Note 44) – – – 4,365,959,961 – 315,309,073 4,681,269,034Disposals/others – – 2,357,482 – – – 2,357,482Balance at end of year 552,331,752 1,763,344,748 714,445,807 9,564,461,252 425,000,000 2,201,281,165 15,220,864,724Accumulated
Amortizationand ImpairmentLosses
Balance at beginningof year 552,331,752 – 96,057,927 201,524,581 – 54,917,799 904,832,059
Amortization – – 91,433,676 – 56,418,608 147,852,284Disposals/reclassifications – – 1,992,382 7,184,506 9,176,888Balance at end of year 552,331,752 – 189,483,985 201,524,581 – 118,520,913 1,061,861,231Net Book Value at End
of Year P=– P=1,763,344,748 P=524,961,822 P=9,362,936,671 P=425,000,000 P=2,082,760,252 P=14,159,003,493
2015Technology
LicensesBank licenses and
othersSoftware
CostsTrademarks and
BrandsProduct
FormulationCustomer
Relationship TotalCostBalance at beginning
of year P=552,331,752 P=1,717,744,748 P=113,111,561 P=5,198,501,291 P=425,000,000 P=1,885,972,092 P=9,892,661,444Additions – 1,000,000 43,928,168 – – – 44,928,168Balance at end of year 552,331,752 1,718,744,748 157,039,729 5,198,501,291 425,000,000 1,885,972,092 9,937,589,612Accumulated
Amortizationand ImpairmentLosses
Balance at beginningof year 552,331,752 – 74,829,056 201,524,581 – – 828,685,389
Amortization – – 21,228,871 – – 54,917,799 76,146,670Balance at end of year 552,331,752 – 96,057,927 201,524,581 – 54,917,799 904,832,059Net Book Value at End
of Year P=– P=1,718,744,748 P=60,981,802 P=4,996,976,710 P=425,000,000 P=1,831,054,293 P=9,032,757,553
Technology LicensesTechnology licenses represent the cost of JGSPC’s technology and licensing agreements whichcover the construction, manufacture, use and sale of PE and PP lines. JGSPC’s technologylicenses were fully impaired in 2006.
Bank Licenses and OthersBank licenses pertain to RBC’s bank licenses amounting to P=911.2 million and P=866.6 million in2016 and 2015, respectively.
Bank licenses have been allocated to the cash-generating units (CGU)/branches for impairmenttesting.
The recoverable amount of the CGU has been determined based on value-in-use calculation usingcash flow projections from financial budgets approved by senior management covering a five-yearperiod.

- 122 -
*SGVFS023363*
Key assumptions in value-in-use calculation of CGUs follow:
∂ Balance sheet itemsDeposit levels are based on projected bank-wide plan, with varying growth of 5.0% to 20.0%depending on product type. Cash on hand is based on 3.0% of total deposits derived fromhistorical average. Loan levels are based on historical growth, assuming a linear trendfunction. Past due receivables and/or real and other properties required are a function of loanlevels, while other assets are a function of fund source levels. Reserve requirements include18.0% of peso deposits.
∂ Income statement itemsHistorical or average interest rates are used for loan interest income. For theoretical incomefrom branch funds, peso-denominated accounts are pegged on the average high cost rate whileforeign currency-denominated accounts use average interest derived from blended foreigncurrency-denominated funds. Other income is based on incremental growth ratios derivedfrom the market’s perceived response and assumed marketing efforts on the bank’s productsand services. Interest expense is computed using 0.3% for current and savings accounts, 4.8%for time deposits and special savings accounts, and 0.9% for foreign currency deposits.Operating expenses have 7% benchmark for increments.
∂ Net present value computationTerminal value is the growth rate based on the bank-wide average balance sheet spread, plusweighted average cost of capital. The discount rate is the weighted average cost of capitalderived using actual levels.
Bank licenses and others include other assets representing costs to establish brand and marketopportunities under the strategic alliance with Cebgo, Inc. amounting to P=852.2 milion(see note 44).
Trademarks, Product Formulation, Brands and Customer RelationshipsTrademarks were acquired by URC from Nestlé Waters Philippines, Inc. and Acesfood in 2008and 2007, respectively. Product formulation was acquired from General Milling Corporation in2008. Intangible assets acquired from NZSFHL in 2014 consist of brands of P=4.9 billion,customer relationships of P=1.9 billion and software costs of P=0.03 billion (see Note 44).
Brands acquired from NZSFHL pertain to the Griffin’s, Huntley and Palmers, Eta and Nice &Natural brands. Customer relationships acquired from NZSFHL pertain to NZFHL’s identifiedcustomers with a history and pattern of conducting relationships with NZSFHL through recordedinvoices and/or formalized term contracts.
URC performed its annual impairment test on its goodwill and other intangible assets withindefinite useful lives as of December 31, 2016. The recoverable amounts of goodwill and otherintangible assets were determined based on value in use calculations using cash flows projectionsfrom financial budgets approved by management covering a five-year period. The pre-taxdiscount rate applied to the cash flow is at 9.00%. The following assumptions were also used incomputing the value in use:
Growth rate estimates - growth rates include long-term and terminal growth rates that are based onexperiences and strategies developed for the various subsidiaries. The prospect for the industrywas also considered in estimating the growth rates.

- 123 -
*SGVFS023363*
Discount rates - discount rates were estimated based on industry weighted average cost of capital,which includes the cost of equity and debt after considering the gearing ratio.
Management believes that no reasonably possible changes in any of the above key assumptionswould cause the carrying values of goodwill and intangibles assets arising from the Group’sacquisitions to materially exceed their recoverable amounts.
19. Goodwill
Movements in the Group’s goodwill account follow:
2016 2015CostBalance at beginning of year P=15,771,272,280 P=15,771,272,280Additions due to business combinations (Note 44) 16,505,263,958 −Balance at end of year 32,276,536,238 15,771,272,280Accumulated Impairment LossesBalance at beginning and end of year 253,352,295 253,352,295Net Book Value at End of Year P=32,023,183,943 P=15,517,919,985
The Group’s goodwill pertains to: (a) the acquisition of LSB in December 2012, (b) theacquisition of Advanson in December 2007, (c) the acquisition of Acesfood in May 2007, (d) theexcess of the acquisition cost over the fair values of the net assets acquired by Hongkong ChinaFoods Co., Ltd. (HCFCL) and URC Asean Brands Co., Ltd. (UABCL) in 2000, (e) the acquisitionof Southern Negros Development Corporation (SONEDCO) in 1998, (f) the acquisition of Cebgo,Inc. (formerly Tiger Airways Philippines (TAP)) and NZSFHL in 2014, (g) acquisition of BalayanSugar Mill and (h) Snack Brands Australia in 2016.
Goodwill is not amortized and is non-deductible for tax purposes.
Acquisition of Snack Brands Australia/ Griffin’s Food LimitedGoodwill arising from the acquisition of CSPL and Griffin’s is mainly attributable to synergiesformed between URC and CSPL, and URC and NZSFHL, respectively.
Acquisition of CebgoGoodwill arising from the acquisition of Cebgo is attributable to the following:
Achievement of Economic ScaleUsing CAI’s network of suppliers and other partners to improve cost and efficiency of Cebgo,thus, improving Cebgo’s overall profit, given its existing market share.
Defensive StrategyAcquiring a competitor enables CAI to manage overcapacity in certain geographicalareas/markets.
The goodwill arising from the acquisitions of HCFCL, UABCL, Acesfood and Advanson wastranslated at the applicable year-end exchange rate.

- 124 -
*SGVFS023363*
20. Other Noncurrent Assets
This account consists of:
2016 2015Deferred tax assets (Note 38) P=2,070,533,318 P=2,330,888,155Advances to suppliers - net of current portion 941,864,046 455,658,690Security and miscellaneous deposits 847,186,323 746,173,273Utility deposits 616,948,137 511,864,493Advances to lot owners - net of current portion 190,078,577 190,078,577Derivative asset under hedge accounting (Note 8) − 37,358,957Others 1,855,667,895 998,470,251
P=6,522,278,296 P=5,270,492,396
Security DepositsSecurity deposits pertain to deposits provided to lessor for aircraft under operating lease.
Advances to SuppliersAdvances to suppliers include advances made for the purchase of various aircraft parts, servicemaintenance, machineries and equipment. The account also includes advances to suppliers for theplant expansion and renovations of URC’s plants located in Malaysia and Singapore.
Utility DepositsUtility deposits consist primarily of bid bonds and meter deposits.
Advances to Lot OwnersAdvances to lot owners consist of advance payments to land owners which will be applied againstthe acquisition cost of the real properties that will be acquired.
OthersOthers include deposit to joint venture, prepaid rent and repossessed chattels.
21. Accounts Payable and Accrued Expenses
This account consists of:
2016 2015Deposit liabilities P=53,176,102,052 P=35,645,024,911Trade payables 19,099,938,293 13,211,425,184Accrued expenses 16,180,422,862 14,946,192,270Airport and other related fees payable 2,434,975,392 1,709,712,693Output VAT 416,976,865 408,939,139Withholding taxes payable 289,365,215 214,581,731Dividends payable 248,503,402 14,149,049Due to related parties (Note 40) 136,118,258 283,572,118Other payables 4,316,499,875 5,506,186,304
P=96,298,902,214 P=71,939,783,399

- 125 -
*SGVFS023363*
Deposit LiabilitiesDeposit liabilities represent the savings, demand and time deposit liabilities of RBC and LSB. Ofthe total deposit liabilities of the RBC and LSB as of December 31, 2016 and 2015, 51.02% and42.82% respectively, are subject to periodic interest repricing. Remaining deposit liabilities of theRBC and LBC incur interest at annual fixed rates of 0.0% to 2.9% for both years.
Based on BSP Circular No. 753, non-FCDU deposit liabilities of RBC and LSB are subject torequired liquidity reserves equivalent to 18.00% and 6.00%, respectively. In compliance with thiscircular, government securities which are used as compliance with the liquidity reserverequirements shall continue to be eligible until they mature and cash in vault shall no longer beincluded as reserve. The required reserves shall be kept in the form of deposits maintained in theDemand Deposit Accounts (DDAs) with the BSP. Further, deposits maintained with the BSP incompliance with the reserve requirement shall no longer be paid interest.
As of December 31, 2016 and 2015, the liquidity and statutory reserves of RBC and LSBamounted to P=11.7 billion in 2016 and P=9.9 billion in 2015.
As of December 31, 2016 and 2015, RBC and LSB are in compliance with the regulations.
The details of ‘Interest expense’ on ‘Deposit liabilities’, which are included in the ‘Cost ofservices - Banking' in profit or loss in the consolidated statements of comprehensive income are asfollows (see Note 30):
2016 2015 2014Savings 327,306,744 P=287,391,613 P=254,029,523Time 319,618,028 274,848,318 258,935,202Demand 1,938,352 1,787,282 2,393,628
P=648,863,124 P=564,027,213 P=515,358,353
Trade PayablesTrade payables are noninterest-bearing and are normally settled on 30- to 60-day terms. Tradepayables arise mostly from purchases of inventories, which include raw materials and indirectmaterials (i.e., packaging materials) and supplies, for use in manufacturing and other operations.Trade payables also include importation charges related to raw materials purchases, as well asoccasional acquisitions of production equipment and spare parts. Obligations arising frompurchase of inventories necessary for the daily operations and maintenance of aircraft whichinclude aviation fuel, expendables and consumables, equipment and in-flight supplies are alsocharged to this account.
Accrued ExpensesThis account consists of accruals for the following:
2016 2015Advertising and promotions P=4,605,661,535 P=4,085,931,821Landing and take-off, navigational charges, and
other aircraft-related expenses 2,454,928,921 2,536,253,197Compensation and benefits 2,416,449,248 1,832,283,449Accrued interest payable 2,018,859,767 1,941,249,479Import bills payable 1,132,410,067 1,192,742,648Rental expense 1,003,369,623 614,077,148
(Forward)

- 126 -
*SGVFS023363*
2016 2015Contracted services P=970,430,471 P=691,326,791Freight and handling costs 493,055,041 475,093,791Taxes and licenses 489,361,168 922,815,110Utilities 284,420,702 282,919,951Insurance 99,427,394 107,148,715Royalties 11,125,092 10,004,658Other accrued expenses 200,923,833 254,345,512
P=16,180,422,862 P=14,946,192,270
Other accrued expenses include accruals for travel and transportation, repairs and maintenance andother professional services.
Airport and Other Related Fees PayableAirport and other related fees payable are amounts payable to the Philippine Tourism Authorityand Air Transportation Office Mactan-Cebu International Airport and Manila International AirportAuthority arising from aviation security, terminal fees and travel taxes.
Other PayablesAs of December 31, 2016 and 2015, ‘Other payables’ consist of, management bonus and non-tradepayables. As of December 31, 2015, ‘Other payables’ also include the unpaid portion of the totalpurchase price of the land use right amounting to P=3.3 billion (RMB 458 million) (see Note 18).
22. Other Current Liabilities
This account consists of:
2016 2015Unearned transportation revenue P=8,141,752,727 P=6,971,754,697Deposits from real estate buyers (Note 24) 1,838,572,591 1,641,009,277Deposit from lessees (Notes 24 and 42) 1,770,955,616 2,055,695,674Advances from agents and others 676,600,363 594,568,902Customer’s deposits 474,910,512 144,854,921Redeemable preference shares 1,700,000 1,700,000
P=12,904,491,809 P=11,409,583,471
Unearned Transportation RevenuePassenger ticket and cargo waybill sales are initially recorded under ‘Unearned transportationrevenue’ in the consolidated statements of financial position, until these are recognized under ‘Airtransportation revenue’ in profit or loss in the consolidated statements of comprehensive income,when the transportation service is rendered by the Group (or once tickets are flown).
Advances from Agents and OthersAdvances from agents and others represent cash bonds required from major sales and ticket officesor agents.
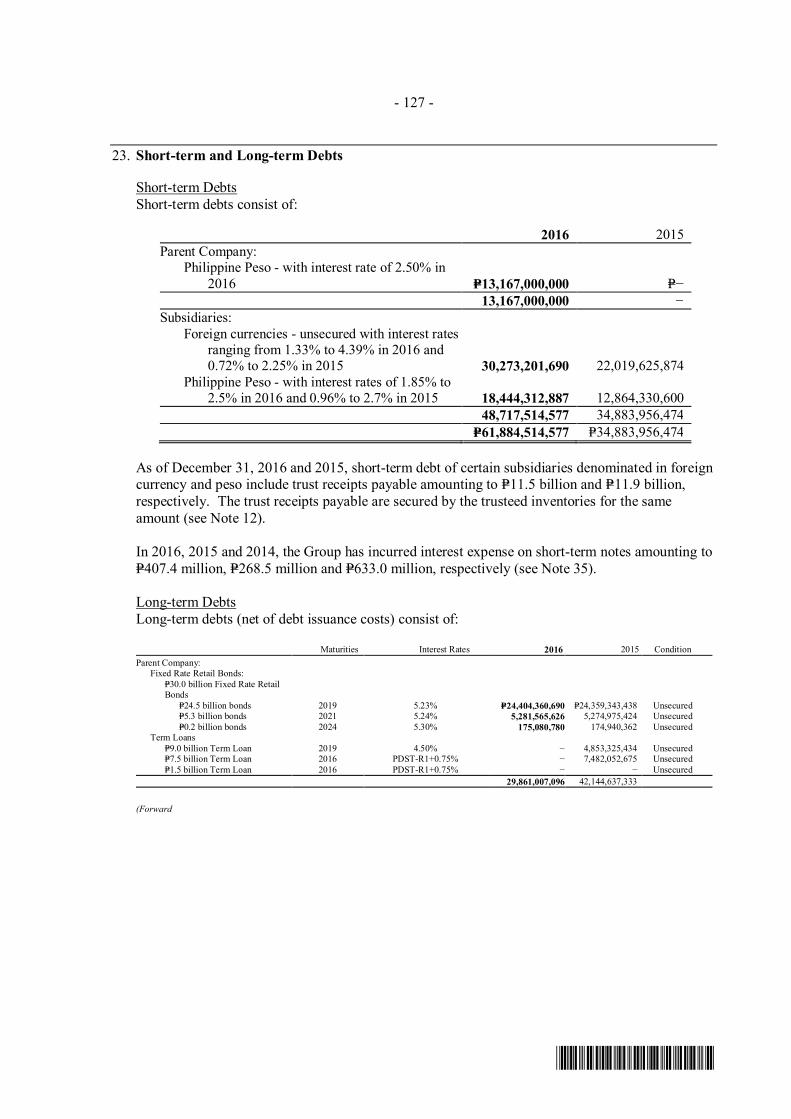
- 127 -
*SGVFS023363*
23. Short-term and Long-term Debts
Short-term DebtsShort-term debts consist of:
2016 2015Parent Company:
Philippine Peso - with interest rate of 2.50% in2016 P=13,167,000,000 P=−
13,167,000,000 −Subsidiaries:
Foreign currencies - unsecured with interest ratesranging from 1.33% to 4.39% in 2016 and0.72% to 2.25% in 2015 30,273,201,690 22,019,625,874
Philippine Peso - with interest rates of 1.85% to2.5% in 2016 and 0.96% to 2.7% in 2015 18,444,312,887 12,864,330,600
48,717,514,577 34,883,956,474P=61,884,514,577 P=34,883,956,474
As of December 31, 2016 and 2015, short-term debt of certain subsidiaries denominated in foreigncurrency and peso include trust receipts payable amounting to P=11.5 billion and P=11.9 billion,respectively. The trust receipts payable are secured by the trusteed inventories for the sameamount (see Note 12).
In 2016, 2015 and 2014, the Group has incurred interest expense on short-term notes amounting toP=407.4 million, P=268.5 million and P=633.0 million, respectively (see Note 35).
Long-term DebtsLong-term debts (net of debt issuance costs) consist of:
Maturities Interest Rates 2016 2015 ConditionParent Company: Fixed Rate Retail Bonds: P=30.0 billion Fixed Rate Retail
Bonds P=24.5 billion bonds 2019 5.23% P=24,404,360,690 P=24,359,343,438 Unsecured P=5.3 billion bonds 2021 5.24% 5,281,565,626 5,274,975,424 Unsecured P=0.2 billion bonds 2024 5.30% 175,080,780 174,940,362 Unsecured Term Loans P=9.0 billion Term Loan 2019 4.50% − 4,853,325,434 Unsecured P=7.5 billion Term Loan 2016 PDST-R1+0.75% − 7,482,052,675 Unsecured P=1.5 billion Term Loan 2016 PDST-R1+0.75% − − Unsecured
29,861,007,096 42,144,637,333
(Forward

- 128 -
*SGVFS023363*
Maturities Interest Rates 2016 2015 ConditionSubsidiaries: Foreign currencies: JGSPL US$750.0 million guaranteed notes 2023 4.375% P=31,788,240,411 P=30,713,744,430 Guaranteed
US$250.0 million guaranteed notes 2018 US$ LIBOR plus 2.2% margin − 11,658,870,211 Guaranteed CAI ECA loans (Note 16) 2024 Libor + 3bps 12,402,011,468 15,151,924,788 Secured Commercial loan from
foreign banks 2023 Libor + 1.15% to 1.25% 24,829,936,162 21,437,060,704 - do - URC US$420.0 million term loan 2019 NZ BKBM+1.60% 14,311,677,913 13,316,480,667 US$484.2 million term loan 2021 AU 3.04% (BBSY BID+1.25%) 17,054,914,872 US$322.3 million term loan 2019 NZ BKBM+1.60% − 10,219,011,046
100,386,780,826 102,497,091,846
Philippine Peso: RLC P=10.6 billion loan facility 2022 4.80% 10,560,505,235 10,546,768,904 - do - P=1.4 billion loan facility 2025 4.93% 1,354,882,882 1,353,502,066 - do - P=9.0 billion loan facility 2019 5.04% − 8,945,009,381 Unsecured P=1.0 billion loan facility 2019 5.04% − 995,177,314 Unsecured P=6.5 billion loan facility 2021 3.83% 6,469,690,891 − - do - P=5.0 billion loan facility 2023 3.89% 4,976,398,670 − - do - CAI Commercial loans 2026 Libor + 1.15% to 1.25% 5,578,490,000 −
28,939,967,678 21,840,457,665159,187,755,600 166,482,186,844
Less current portion 6,826,230,309 22,915,756,938P=152,361,525,291 P=143,566,429,906
The foreign exchange rate used to revalue the foreign currency borrowings was P=49.72 toUS$1.00 and P=47.06 to US$1.00 as of December 31, 2016 and 2015, respectively.
Long-term debt to foreign banks is shown net of unamortized debt issuance costs totalingP=634.6 million (US$16.4 million) and P=606.8 million (US$16.2 million) as of December 31, 2016and 2015, respectively. Unamortized debt issuance cost related to peso-denominated long-termdebt amounted to P=277.5 million and P=414.9 million as of December 31, 2016 and 2015,respectively.
Repayments of the long-term debt (gross of debt issuance costs) follow:
2016 2015Due in:
2016 P=− P=23,288,223,5612017 7,040,253,460 6,108,110,2962018 5,962,465,277 −
Thereafter 147,097,131,332 138,107,567,972P=160,099,850,069 P=167,503,901,829
The details of the Group’s long-term debt follow:
Subsidiaries’ Foreign Currency LoansJGSPL 4.375% Senior Unsecured Notes Due 2023On January 24, 2013, JGSHPL issued US$750.0 million, 4.375% senior unsecured notes due2023. The notes are unconditionally and irrevocably guaranteed by the Parent Company.
JGSPL 5-year Guaranteed NotesOn January 16, 2013, JGSHPL, a wholly owned subsidiary of JGSPL, issued US$250.0 million,US$ LIBOR plus 2.2% margin, 5-year guaranteed notes. The notes are unconditionally and

- 129 -
*SGVFS023363*
irrevocably guaranteed by the Parent Company. These notes are hedged items in a cash flowhedge. In October 2016, JGSHPL prepaid the notes under Clause 7.1 of the underlying TermLoan Facility Agreement. Total payment amounted to US$251.8 million (P=12.5 billion).
CAI Commercial Loan From Foreign BanksIn 2007, CAI entered into a commercial loan facility to partially finance the purchase of twoAirbus A320 aircraft, one CFM 565B4/P engine, two CFM 565B5/P engines and one QEC Kit.The security trustee of the commercial loan facility established ILL, which purchased the aircraftfrom the supplier and leases such aircraft to CAI pursuant to a: (a) 10-year finance leasearrangement for the aircraft, (b) six-year finance lease arrangement for the engines and (c) five-year finance lease arrangement for the QEC Kit. The quarterly rental payments of CAI correspondto the principal and interest payments made by ILL to the commercial lenders and are guaranteedby CAI. CAI has the option of purchasing the aircraft, the engines and the QEC Kit for a nominalamount at the end of such leases.
In 2012, CAI entered into a commercial loan facility to partially finance the purchase of fourAirbus A320 aircraft. The security trustee of the commercial loan facility established PTALL, aspecial purpose company, which purchased the aircraft from the supplier and leases such aircraftto CAI pursuant to ten-year finance lease arrangement for the aircraft. The semiannual rentalpayments of CAI correspond to the principal and interest payments made by PTALL to thecommercial lenders. CAI has the option to purchase the aircraft for a nominal amount at the endof such leases.
In 2013, CAI entered into a commercial loan facility to partially finance the purchase of twoAirbus A320 aircraft. The security trustee of the commercial loan facility established PTHALL, aspecial purpose company, which purchased the aircraft from the supplier and leases such aircraftto the CAI pursuant to ten-year finance lease arrangement for the aircraft. The quarterly rentalpayments of the CAI correspond to the principal and interest payments made by PTHALL to thecommercial lenders. The CAI has the option to purchase the aircraft for a nominal amount at theend of such leases.
In 2014, CAI entered into a commercial loan facility to partially finance the purchase of fiveAirbus A320 aircraft. The security trustee of the commercial loan facility established SAALL, aspecial purpose company, which purchased the aircraft from the supplier and leases such aircraftto the Parent Company pursuant to ten-year finance lease arrangement for the aircraft. Thequarterly rental payments of the CAI correspond to the principal and interest payments made bySAALL to the commercial lenders. CAI has the option to purchase the aircraft for a nominalamount at the end of such leases.
In 2015, CAI entered into a commercial loan facility to partially finance the purchase of fourAirbus A320 aircraft. The security trustee of the commercial loan facility established SBALL forthe first two A320 aircraft and SCALL for the additional two A320 aircraft, a special purposecompany, which purchased the aircraft from the supplier and leases such as aircraft to CAIpursuant to ten-year finance lease arrangement for the aircraft. The quarterly rental payments ofCAI correspond to the principal and interest payments made by SBALL and SCALL to thecommercial lenders. CAI has the option to purchase the aircraft for a nominal amount at the end ofsuch leases.
The terms of the CAI commercial loan from foreign banks follow:
∂ Term of 10 years starting from the delivery date of each Airbus A320 aircraft.∂ Term of six and five years for the engines and QEC Kit, respectively.

- 130 -
*SGVFS023363*
∂ Term of six years starting from the delivery date of each ATR 72-500 turboprop aircraft.∂ Annuity style principal repayments for the two Airbus A320 aircraft and six ATR 72-500
turboprop aircraft, and equal principal repayments for the engines and the QEC Kit. Principalrepayments shall be made on a quarterly and semi-annual basis for the two Airbus A320aircraft, engines and the QEC Kit and six ATR 72-500 turboprop aircraft, respectively.
∂ Interest on the commercial loan facility for the two Airbus A320 aircraft shall be 3-monthLIBOR plus margin. On February 29, 2009, the interest rates on the two Airbus A320 aircraft,engines and QEC Kit were fixed ranging from 4.11% to 5.67%.
∂ Interest on the commercial loan facility for the six ATR 72-500 turboprop aircraft shall be6-month LIBOR plus margin.
∂ The commercial loan facility provides for material breach as an event of default.∂ Upon default, the outstanding amount of loan will be payable, including interest accrued. The
lenders will foreclose on secured assets, namely the aircraft.
CAI’s ECA LoansIn 2005 and 2006, CAI entered into ECA-backed loan facilities to partially finance the purchase often Airbus A319 aircraft. The security trustee of the ECA loans established CALL, a specialpurpose company, which purchased the aircraft from the supplier and leases such aircraft to CAIpursuant to 12-year finance lease agreements. The quarterly rental payments made by CAI toCALL correspond to the principal and interest payments made by CALL to the ECA-backedlenders. The quarterly lease rentals to CALL are guaranteed by CPAHI and CAI. CAI has theoption of purchasing the aircraft for a nominal amount at the end of such leases.
In 2016 and 2015, CAI exercised the option to purchase four and two of the ten Airbus A319aircraft, respectively which were subsequently sold to a third party as part of a forward salearrangement (see Note 16). The purchase required the prepayment of the balance of the loanfacility attributed to the two Airbus A319 aircraft. The total amount of loans paid amounted toP=870.5 million and P=534.5 million in 2016 and 2015, respectively.
The terms of the ECA-backed facilities, which are the same for each of the ten Airbus A319aircraft, seven ATR 72-500 turboprop aircraft and ten Airbus A320 aircraft, follow:
∂ Term of 12 years starting from the delivery date of each Airbus A319 aircraft and AirbusA320, and ten years for each ATR 72-500 turboprop aircraft.
∂ Annuity style principal repayments for the first four Airbus A319 aircraft, eight ATR 72-500turboprop aircraft and seven Airbus A320 aircraft, and equal principal repayments for the lastsix Airbus A319 aircraft and last three Airbus A320 aircraft. Principal repayments shall bemade on a semi-annual basis for ATR 72-500 turboprop aircraft. Principal repayments shallbe made on a quarterly basis for Airbus A319 and A320 aircraft.
∂ Interest on loans from the ECA lenders are a mix of fixed and variable rates. Fixed annualinterest rates ranges from 2.00% to 6.00% and variable rates are based on US dollar LIBORplus margin.
∂ As provided under the ECA-backed facility, CALL, BLL, SLL, SALL, VALL and POALLcannot create or allow to exist any security interest, other than what is permitted by thetransaction documents or the ECA administrative parties. CALL, BLL, SLL, SALL, VALLand POALL must not allow impairment of first priority nature of the lenders’ securityinterests.
∂ The ECA-backed facilities also provide for the following events of default: (a) nonpayment ofthe loan principal or interest or any other amount payable on the due date, (b) breach ofnegative pledge, covenant on preservation of transaction documents, (c) misrepresentation, (d)commencement of insolvency proceedings against CALL or BLL or SLL or SALL or VALL

- 131 -
*SGVFS023363*
or POALL becomes insolvent, (e) failure to discharge any attachment or sequestration orderagainst CALL’s, BLL’s, SLL’s, SALL’s VALL’s and POALL’s assets, (f) entering into anundervalued transaction, obtaining preference or giving preference to any person, contrary tothe laws of the Cayman Islands, (g) sale of any aircraft under ECA financing prior todischarge date, (h) cessation of business, (i) revocation or repudiation by CALL or BLL orSLL or SALL or VALL or POALL, the Group, JGSHI or CPAHI of any transaction documentor security interest, and (j) occurrence of an event of default under the lease agreement withthe Parent Company.
∂ Upon default, the outstanding amount of the loan will be payable, including interest accrued.The ECA lenders will foreclose on the secured assets, namely the aircraft.
∂ An event of default under any ECA loan agreement will occur if an event of default asenumerated above occurs under any other ECA loan agreement.
The Group is not in breach of any terms on the ECA and commercial loans.
The total future minimum lease payments of the operating aircraft leases guaranteed by the ParentCompany amounted to P=31.9 billion and P=34.5 billion in 2016 and 2015, respectively.
URC NZ Finance Company Limited NZD420 Million Term Loan due 2019On November 13, 2014, URC New Zealand Holding Finance Company, Ltd. (URCNZH Fin Co)entered into a secured term loan facility agreement payable in five (5) years, amounting toNZD420M (P=13.5 billion), with various banks for payment of acquisition costs and refinancingcertain indebtedness of an acquired company, NZ Snack Foods Holdings Limited.The loanobtained bears a market rate plus a certain spread, payable quarterly, maturing onNovember 13, 2019.
URC Oceania Company Limited NZD322 Million Term Loan due 2019On November 13, 2014, URCNZH FinCo entered into a secured term loan facility agreementpayable in five (5) years, amounting to NZD322M (P=10.4 billion), with various banks for paymentof acquisition costs and to refinance certain indebtedness of an acquired company, NZ SnackFoods Holdings Limited. The loan obtained bears a market rate plus a certain spread, payablequarterly, maturing on November 13, 2019.
For the URC NZ Finco and URC Oceania loans, the Group is required to maintain consolidateddebt to equity ratio of not greater than 2.5 to 1.0.
On February 16, 2016, URC Oceania prepaid its 5-year term loan under Clause 7.1 of theunderlying Facility Agreement. Total payment amounted NZ$326.0 million (approximatelyP=10.2 billion), including interest.
URC Australia Finance Company Limited Term Loan US$484.2MOn September 30, 2016, URC AU FinCo entered into a secured syndicated term loan facilityagreement payable in five (5) years, amounting to AU$484.2 million (P=17.9 billion), with variousbanks for payment of acquisition costs and to refinance certain indebtedness of an acquiredcompany, CSPL. The loan obtained bears a market rate plus a certain spread, payable quarterly,maturing on September 30, 2021.
Parent Company P=30.0 Billion Fixed Rate Retail BondsOn February 28, 2014, the Parent Company issued a P=30.0 billion fixed rate retail bond. The bondwas issued in three series: (1) Five-year bond amounting to P=24.5 billion fixed at 5.2317% due2019; (2) Seven-year bond amounting to P=5.3 billion fixed at 5.2242% due 2021; and (3) Ten yearbond amounting to P=176.3 million fixed at 5.3% due 2024. Interest is calculated on a 30/360-day

- 132 -
*SGVFS023363*
count basis and is payable semi-annually starting August 27, 2014 and the 27th day of Februaryand August of each year thereafter. Net proceeds from the bond issuance were used to partiallyfinance its acquisition of Meralco shares and for general corporate purposes.
Parent Company P=7.5 Billion and P=1.5 Billion Term Loan FacilitiesOn December 10 and 11, 2014, the Parent Company entered into a P=7.5 billion and a P=1.5 billionterm loan facility, respectively. The loans bear a floating interest rate based on the applicablethree (3)-month PDST-R1 plus 0.75% spread. The interest is calculated based on the actualnumber of days lapsed over a 365-day calendar year count and are payable quarterly startingDecember 10, 2015 until December 10, 2016, the maturity of the loans.
On June 10, 2015, the Parent Company prepaid the P=1.5 billion loan facility. The interest ratebasis for the P=7.5 billion loan was also changed to the current SDA rates. The Parent Companydeemed the change as not a substantial modification of the previous loan terms.
On June 10, 2016, the Parent Company partially prepaid the P=2.0 billion of the P=7.5 billion termloan facility. The Company paid P=2.05 billion representing P=2.0 billion for principal andP=48.6 million for interest. On December 10, 2016, the Parent Company settled the remainingP=5.5 billion term loan facility. The Company paid P=5.5 billion representing P=5.5 billion forprincipal and P=36.1 million for interest.
Parent Company P=9.0 Billion Term Loan FacilityOn November 20, 2014, the Parent Company entered into a P=9.0 billion term loan facility. Theloan bears a fixed rate of 4.5% calculated based on the actual number of days lapsed over a365-day calendar year count and is payable quarterly starting November 20, 2014 untilNovember 20, 2019, the maturity of the loans.
On December 14, 2015, the Parent Company partially prepaid the P=4.1 billion term loan facility.Per Term Loan Facility Agreement between the Parent Company and BDO Unibank, Inc., theborrower may, subject to the penalty of one percent, prepay the loan in part or full together withaccrued interest thereof to prepayment date.
On May 20, 2016, the Parent Company prepaid the remaining balance of P=4.9 billion. TheCompany paid P=4.98 billion representing P=4.9 billion for principal, P=53.3 million for interest andP=24.5 million as prepayment fee. The related loss on the derecognition of the loan that waspartially prepaid was included under “Financing Cost and Other Charges” in the ConsolidatedStatement of Comprehensive Income.
RLC P=10.0 Billion Term Loan due in July 2019On July 8, 2014, RLC borrowed P=9.0 billion and P=1.0 billion under a Term Loan FacilityAgreement with BDO Unibank, Inc. and BDO Leasing and Finance, Inc., respectively.
The P=9.0 billion loan was released in two tranches amounting to P=5.0 billion and P=4.0 billion onJuly 14, 2014 and August 27, 2014, respectively. The interest rate is at 5.0438% per annum andshall be payable quarterly, computed on the basis of a year of 365 calendar days for the actualnumber of days elapsed.
The P=1.0 billion loan was released on July 14, 2014 with interest rate at 5.0438% per annum andshall be payable quarterly, computed on the basis of a year of 365 calendar days for the actualnumber of days elapsed.

- 133 -
*SGVFS023363*
The interest rate for both loans was fixed based on the applicable five (5) - year PDSTF plus 1%spread determined one (1) banking day prior to the initial borrowing and inclusive of grossreceipts tax, but subject to a floor rate of 4.5% per annum. The market rate at the date of inceptionis above the floor rate of 4.5% and management assessed that the interest rate floor is clearly andclosely related to the host contract and is not required to be separately valued.
RLC may, subject to the penalty of one percent (1%), prepay the loan in part or in full togetherwith accrued interest thereof to prepayment date. RLC has assessed that the embedded derivativerelated to this prepayment option is clearly and closely related to the host contract thus was notseparately valued. On October 17, 2016, the Group pre-terminated the outstanding balance of theloan amounting to P=10.0 billion and paid a prepayment charge amounting to P=100 million.
RLC P=10.6 Billion Term Loan due in February 2022On February 23, 2015, RLC issued P=10.6 billion bonds constituting direct, unconditional,unsubordinated, and unsecured obligation obligations of RLC and shall at all times rank pari-passuand without preference among themselves and among any present and future unsubordinated andunsecured obligations of RLC, except for any statutory preference or priority established underPhilippine law. The net proceeds of the issue shall be used by RLC to refinance existing debtobligations and to partially fund investment capital expenditures.
Interest on the bonds shall be calculated on a 30/360-day count basis and shall be paid semi-annually in arrears on February 23 and August 23 of each year at which the bonds are outstanding.Interest rate is 4.8000% per annum.
RLC P=1.4 Billion Term Loan due in February 2025On February 23, 2015, RLC issued P=1.4 billion bonds constituting direct, unconditional,unsubordinated, and unsecured obligation obligations of RLC and shall at all times rank pari-passuand without preference among themselves and among any present and future unsubordinated andunsecured obligations of RLC, except for any statutory preference or priority established underPhilippine law. The net proceeds of the issue shall be used by RLC to refinance existing debtobligations and to partially fund investment capital expenditures.
Interest on the bonds shall be calculated on a 30/360-day count basis and shall be paid semi-annually in arrears on February 23 and August 23 of each year at which the bonds are outstanding.Interest rate is 4.9344% per annum.
RLC P=6.5 Billion Term Loan due in July 2021On July 8, 2016, the Group borrowed P=6.5 billion under Term Loan Facility Agreements withBDO Unibank, Inc.
The loan was released on July 8, 2016 amounting to P=3.0 billion and on September 27, 2016amounting to P=3.5 billion with interest rate at 3.8327% per annum and shall be payable quarterly,computed on the basis of a year of 365 calendar days for the actual number of days elapsed.
RLC P=5.0 Billion Term Loan due in August 2023On August 10, 2016, the Group borrowed P=5.0 billion under Term Loan Facility Agreements withBank of the Philippine Islands. The P=5.0 billion loan was released on August 10, 2016 withinterest rate at 3.8900% per annum and shall be payable quarterly, computed on the basis of a 360-day year and on the actual number of days elapsed.
- 134 -
*SGVFS023363*
CAI P=5.6 billion Commercial Loan due in 2026In 2016, the Group entered into a Philippine peso commercial loan facility to partially finance theacquisition of two ATR 72-600 aircraft and one Airbus A330 aircraft.
The terms of the commercial loans follow:• Term of ten years starting from the delivery date of each aircraft.• Forty equal consecutive principal repayments made on a quarterly basis• Interests on loans are variable rates. Interest rates ranges from 2.00% to 3.00%.• The facilities provide that, upon event of default, the outstanding amount of loan will be
payable, including interest accrued. The lenders will foreclose mortgaged assets, namelythe aircraft
As of December 31, 2016, the total outstanding balance of Peso commercial loans amounted toP=5,578.5 million with current and non-current obligations amounting to P=557.8 million andP=5,020.6 million, respectively. Interest expense amounted to P=17.3 million.
In 2016, 2015 and 2014, total interest expense on long-term debt amounted to P=6.4 billion,P=6.1 billion and P=4.9 billion, respectively (see Note 35).
In 2016, 2015 and 2014, the Group recognized amortization of bond issue costs amounting toP=209.3 million, P=147.2 million and P=125.6 million, respectively (see Note 35).
Debt CovenantsCertain loan agreements contain provisions which, among others, require the maintenance ofspecified financial ratios at certain levels and impose negative covenants which, among others,prohibit a merger or consolidation with other entities, dissolution, liquidation or winding-up,except with any of its subsidiaries; and prohibit the purchase or redemption of any issued shares orreduction of registered and paid-up capital or distribution of assets resulting in capital baseimpairment.
For the Parent Company’s P=9.0 Billion and P=7.5 Billion Term Loan Facilities, the Group isrequired to maintain a financial ratio of Group’s total borrowings to Group’s shareholders' equitynot exceeding 2.0:1.0.
For the Parent Company’s P=30.0 Billion Fixed Rate Retail Bonds, the Group is required tomaintain the following financial ratios:∂ the Group’s current ratio of not less than 0.5:1.0;∂ the Group’s debt-to-equity ratio of not greater than 2.0:1.0
For the RLC’s P=5.0 Billion Retail Bonds due in July 2014 and P=5.0 Billion Retail Bonds due inAugust 2014, the Group is required to maintain a debt to equity ratio not exceeding 1.5:1 andinterest coverage ratio of not less than 1.5:1. These loans were not guaranteed by the ParentCompany.
For the RLC’s P=10.6 Billion Retail Bonds due in February 2022, P=1.4 Billion Retail Bonds due inFebruary 2025, P=10.0 Billion Term Loan due in July 2019, P=6.5 Billion Term Loan due in July2021 and P=5.0 Billion Term Loan due in August 2023 RLC is required to maintain a debt to equityratio not exceeding 2:1 as referenced from its consolidated financial statement as of its fiscalyearend September 30 and consolidated interim financial statements as of March 31. These loanswere not guaranteed by the Parent Company.

- 135 -
*SGVFS023363*
For the ECA loans, the Group is required to maintain the following financial ratios:∂ Consolidated EBITDA to consolidated interest payable ratio should not be less than 3:1 ratio;∂ Consolidated total borrowings to consolidated equity should not exceed 2:1 ratio; and∂ Consolidated current liabilities should not exceed consolidated current assets.
The agreements for the ECA loans also include conditions that has to be met prior to declaringCAI or the Parent Company in default or in breach of the related debt covenants, such as but notlimited to, written notice of default and lapse of the relevant grace period.
For JGSPL’s US$750.0 million Senior Unsecured Notes due in 2023, the guarantor shall procure:∂ Consolidated Current Assets to Consolidated Current Liabilities is not at any time less than
0.5:1.0; and∂ Consolidated Total Borrowings to Consolidated Stockholders' Equity does not at any time
exceed 2:1.
For JGSPL’s US$250.0 million loans due in 2017, the guarantor shall procure that the ratio ofConsolidated Total Borrowings to Consolidated Shareholders’ Equity does not at any time exceed2:1.
For the NZ and AU Term loans, these loans contain negative covenants which include, amongothers, maintenance of a debt to equity ratio of not greater than 2.5 to 1.0.
The Group has complied with all of its debt covenants as of December 31, 2016 and 2015.
24. Other Noncurrent Liabilities
This account consists of:
2016 2015Deposit liabilities - net of current portion P=4,188,393,891 P=4,274,024,909ARO 2,465,671,132 1,344,571,000Deposit from lessees - net of current portion
(Note 42) 2,262,502,350 2,328,399,617Accrued rent expense 1,577,720,784 1,445,148,519Pension liabilities (Note 37) 1,275,276,439 1,248,213,455Retention payable 550,535,803 628,405,572Deposits from real estate buyers - net of current
portion 296,427,485 594,206,310Accrued maintenance cost 140,379,499 224,413,504Others 449,392,323 436,377,382
P=13,206,299,706 P=12,523,760,268
Deposits from LesseesDeposits from lessees (including the current portion shown in Note 22) represent cash receivedfrom tenants representing three to six months’ rent which shall be refunded to tenants at the end ofthe lease term. These are initially recorded at fair value, which is obtained by discounting itsfuture cash flows using the applicable rates of similar types of instruments. The accretion expenseon these deposits recorded as part of cost of rental services on the discount amounted toP=63.9 million, P=78.3 million and P=58.5 million in 2015, 2014 and 2013, respectively (Note 30).The deposits from lessees were discounted using PDST-F rate plus 2.0% spread.

- 136 -
*SGVFS023363*
The unearned rental income (included under ‘Deposit from lessees’) amounted to P=281.0 millionand P=249.0 million as of December 31, 2016 and 2015, respectively. The rental income onamortization of unearned rental income amounted to P=67.0 million, P=63.0 million andP=77.0 million in 2016, 2015 and 2014, respectively.
Deposit LiabilitiesDeposit liabilities represent time deposit liabilities of RBC and LSB with maturities of beyond 12months from reporting date.
AROThe Group is legally required under certain lease contracts to restore certain leased passengeraircraft to stipulated return conditions and to bear the costs of restoration at the end of the contractperiod. These costs are accrued based on estimates made by CAI’s engineers, which includeestimates of certain redelivery costs at the end of the operating aircraft lease (see Note 3).
The rollforward analysis of the Group’s ARO follows:
2016 2015Balance at beginning of year P=1,344,571,000 P=586,069,196Provision for return cost 1,121,100,132 863,960,835Payment of restorations during the year – (105,459,031)Balance at end of year P=2,465,671,132 P=1,344,571,000
In 2016, 2015 and 2014, ARO expenses included as part of repairs and maintenance under ‘Costof Sales’ amounted to P=1,121.1 million, P=864.0 million and P=476.0 million, respectively. In 2014,the Group returned four (4) aircraft under its operating lease agreements.
Retention PayableRetention payable represents amounts withheld from payments to contractors as guaranty for anyclaims against them. These are noninterest-bearing and will be remitted to contractors at the endof the contracted work.
Deposits from Real Estate BuyersDeposits from real estate buyers (including the current portion shown in Note 22) represent cashreceived in advance from buyers which shall be applied against the total contract price of thesubdivision land, condominium and residential units that are for sale as soon as the contractualobligation of the real estate buyer has begun. The deposits from buyers which are expected to beapplied to the contract price within one year are classified as current (see Note 22).
Deposits from real estate buyers also include cash collections in excess of the installment contractreceivables recognized under the percentage-of-completion method.
Accrued Maintenance CostThis account pertains mostly to accrual of maintenance cost of aircraft based on the number offlying hours or cycles but will be settled beyond one year based on management’s assessment.

- 137 -
*SGVFS023363*
25. Equity
Details of the Parent Company’s authorized capital stock as of December 31, 2016 and 2015follow:
Par Value Shares AmountCommon shares P=1.00 12,850,800,000 P=12,850,800,000Preferred voting shares 0.01 4,000,000,000 40,000,000Preferred non-voting shares 1.00 2,000,000,000 2,000,000,000
18,850,800,000 P=14,890,800,000
The paid-up capital of the Group consists of the following:
Capital stock:Common shares - P=1 par value P=7,162,841,657Preferred voting shares - P=0.01 par value 40,000,000
7,202,841,657Additional paid-in capital 23,553,025,157Total paid-up capital P=30,755,866,814
The movements in the total number of common shares issued and outstanding shares as ofDecember 31, 2016 and 2015 follows:
2016 2015Shares Amount Shares Amount
Issued shares:Balance at beginning of year 7,162,841,657 P=7,162,841,657 7,017,191,657 P=7,017,191,657Issuance of shares – – 145,650,000 145,650,000
Total issued and outstanding 7,162,841,657 7,162,841,657 7,162,841,657 P=7,162,841,657
Issuance of Common Shares Through Top-Up PlacementOn January 21, 2015, shares of the Parent Company were sold via an accelerated overnight equityplacement at a price of P=61 per share through a top-up placement of 145,650,000 common sharesfrom a selling shareholder, raising a total of approximately P=8.8 billion, net of transaction cost ofP=144.1 million. The proceeds from the placement were used for general corporate purposes.
Issuance of Preferred Voting SharesOn July 26, 2011, the SEC approved the Parent Company’s increase in authorized capital stock.Subsequently, all of the 4.0 billion preferred voting shares were fully subscribed and paid for at itspar value of one centavo per share (total proceeds of P=40.0 million).
Preferred voting sharesThe preferred voting shares have, among others, the following rights, privileges and preferences:a. Entitled to vote on all matters involving the affairs of the Parent Company requiring the
approval of the stockholders. Each share shall have the same voting rights as a commonshare.
b. The shares shall be non-redeemable.c. Entitled to dividends at the rate of 1/100 of common shares, such dividends shall be payable
out of the surplus profits of the Parent Company so long as such shares are outstanding.d. In the event of liquidation, dissolution, receivership or winding up of affairs of the Parent
Company, holders shall be entitled to be paid in full at par, or ratably, in so far as the assets of

- 138 -
*SGVFS023363*
the Parent Company will permit, for each share held before any distribution is made to holdersof the commons shares.
Preferred non-voting sharesThe preferences, privileges and voting powers of the preferred non-voting shares shall be asfollows:a. May be issued by the BOD of the Parent Company for such amount (not less than par), in such
series, and purpose or purposes as shall be determined by the BOD of the Parent Company.b. The shares shall be non-convertible, non-voting, cumulative and non-participating.c. May be redeemable at the option of the Parent Company at any time, upon payment of their
aggregate par or issue value, plus all accrued and unpaid dividends, on such terms as the BODof the Parent Company may determine at the time of issuance. Shares so redeemed may bereissued by the Parent Company upon such terms and conditions as the BOD of the ParentCompany may determine.
d. The holders of shares will have preference over holders of common stock in the payment ofdividends and in the distribution of corporate assets in the event of dissolution, liquidation orwinding up of the Parent Company, whether voluntary or involuntary. In such an event, theholders of the shares shall be paid in full or ratably, insofar as the assets of the ParentCompany will permit, the par or issue value of each share held by them, as the BOD of theParent Company may determine upon their issuance, plus unpaid cumulated dividends up tothe current period, before any assets of the Parent Company shall be paid or distributed to theholders of the common shares.
e. The holders of shares shall be entitled to the payment of current as well as any accrued orunpaid dividends on the shares before any dividends can be paid to the holders of commonshares.
f. The holders of shares shall not be entitled to any other or further dividends beyond thatspecifically payable on the preferred non-voting shares.
g. The holders of shares shall not be entitled to vote (except in those cases specifically providedby law) or be voted for.
h. The holders of shares shall have no pre-emptive rights, options or any other similar rights tosubscribe or receive or purchase any or all issues or other disposition of common or otherpreferred shares of the Parent Company.
i. The shares shall be entitled to receive dividends at a rate or rates to be determined by theParent Company’s BOD upon their issuance.
Record of Registration of Securities with the SECSummarized below is the Parent Company’s track record of registration of securities under theSecurities Regulation Code.
Date ofoffering Type of offering
No. of sharesoffered Par value
Offerprice
Authorized numberof shares
Issued andoutstanding shares
June 30, 1993 Registration ofauthorized capitalstock
− P=1.00 P=− 12,850,800,000common shares
and 2,000,000,000preferred non-voting shares
−
June 30, 1993 Initial public offering(IPO)
1,428,175,000common shares
1.00 4.40 − 1,428,175,000common shares
June 30, 1994 Conversion ofconvertible bondsinto commonshares
428,175,000common shares
1.00 13.75 − 3,725,457 commonshares
July 3, 1998 Stock rights offering(1:2)
2,060,921,728common shares
1.00 2.00 − 2,060,921,728common shares

- 139 -
*SGVFS023363*
The table below provides information regarding the number of stockholders of the ParentCompany as of December 31, 2016, 2015 and 2014:
2016 2015 2014Common shares 1,043 1,054 1,089Preferred voting shares 1 1 1
Capital ManagementThe primary objective of the Group’s capital management is to ensure that it maintains healthycapital ratios in order to support its business and maximize shareholder value. The Groupmanages its capital structure and makes adjustments to these ratios in light of changes in economicconditions and the risk characteristics of its activities. In order to maintain or adjust the capitalstructure, the Group may adjust the amount of dividend payment to shareholders, return capitalstructure or issue capital securities. No changes have been made in the objective, policies andprocesses as they have been applied in previous years.
The Group monitors its use of capital structure using a debt-to-capital ratio which is gross debtdivided by total capital. The Group includes within gross debt all interest-bearing loans andborrowings and derivative liabilities, while capital represents total equity.
The Group’s computation of debt-to-capital ratio follows:
2016 2015(a) Gross debt
Short-term debt (Note 23) P=61,884,514,577 P=34,883,956,474Current portion of long-term debt (Note 23) 6,826,230,309 22,915,756,938Long-term debt, net of current portion
(Note 23) 152,361,525,291 143,566,429,906Derivative liabilities (Note 8) 5,947,386 2,443,495,138Redeemable preferred shares (Note 22) 1,700,000 1,700,000
P=221,079,917,563 P=203,811,338,456
(b) Capital P=312,783,855,201 P=287,325,661,358
(c) Debt-to-capital ratio (a/b) 0.71:1 0.71:1
The Group’s policy is to ensure that the debt-to-capital ratio would not exceed the 2.0:1.0 level.
Regulatory Qualifying CapitalUnder existing BSP regulations, the determination of RBC’s compliance with regulatoryrequirements and ratios is based on the amount of the Parent Company’s ‘unimpaired capital’(regulatory net worth) reported to the BSP, which is determined on the basis of regulatory policies.In addition, the risk-based capital ratio of a bank, expressed as a percentage of qualifying capital torisk-weighted assets, should not be less than 10.00% for both solo basis (head office and branches)and consolidated basis (parent company and subsidiaries engaged in financial allied undertakings).Qualifying capital and risk-weighted assets are computed based on BSP regulations.
The regulatory Gross Qualifying Capital of RBC consists of Tier 1 (core) and Tier 2(supplementary) capital. Tier 1 capital comprises share capital, retained earnings (includingcurrent year profit) and non-controlling interest less required deductions such as deferred tax andunsecured credit accommodations to DOSRI. Tier 2 capital includes unsecured subordinated note,revaluation reserves and general loan loss provision. Certain items are deducted from the

- 140 -
*SGVFS023363*
regulatory Gross Qualifying Capital, such as but not limited to equity investments inunconsolidated subsidiary banks and other financial allied undertakings, but excludinginvestments in debt capital instruments of unconsolidated subsidiary banks (for solo basis) andequity investments in subsidiary nonfinancial allied undertakings.
Risk-weighted assets are determined by assigning defined risk weights to statement of financialposition exposures and to the credit equivalent amounts of off-balance sheet exposures. Certainitems are deducted from risk-weighted assets, such as the excess of general loan loss provisionover the amount permitted to be included in Tier 2 capital. The risk weights vary from 0.00% to125.00% depending on the type of exposure, with the risk weights of off-balance sheet exposuresbeing subjected further to credit conversion factors. Following is a summary of risk weights andselected exposure types:
Risk weight Exposure/Asset type*0% Cash on hand; claims collateralized by securities issued by the non-government, BSP; loans
covered by the Trade and Investment Development Corporation of the Philippines; real estatemortgages covered by the Home Guarantee Corporation
20% COCI, claims guaranteed by Philippine incorporated banks/quasi-banks with the highest creditquality; claims guaranteed by foreign incorporated banks with the highest credit quality; loansto exporters to the extent guaranteed by Small Business Guarantee and Finance Corporation
50% Housing loans fully secured by first mortgage on residential property; Local Government Unit(LGU) bonds which are covered by Deed of Assignment of Internal Revenue allotment of theLGU and guaranteed by the LGU Guarantee Corporation
75% Direct loans of defined Small Medium Enterprise and microfinance loans portfolio;nonperforming housing loans fully secured by first mortgage
100% All other assets (e.g., real estate assets) excluding those deducted from capital (e.g., deferredtax)
125% All NPLs (except nonperforming housing loans fully secured by first mortgage) and allnonperforming debt securities
* Not all inclusive
With respect to off-balance sheet exposures, the exposure amount is multiplied by a creditconversion factor (CCF), ranging from 0.00% to 100.00%, to arrive at the credit equivalentamount, before the risk weight factor is multiplied to arrive at the risk-weighted exposure. Directcredit substitutes (e.g., guarantees) have a CCF of 100.00%, while items not involving credit riskhas a CCF of 0.00%.
In the case of derivatives, the credit equivalent amount (against which the risk weight factor ismultiplied to arrive at the risk-weighted exposure) is generally the sum of the current creditexposure or replacement cost (the positive fair value or zero if the fair value is negative or zero)and an estimate of the potential future credit exposure or add-on. The add-on ranges from 0.00%to 1.50% (interest rate-related) and from 1.00% to 7.50% (exchange rate-related), depending onthe residual maturity of the contract. For CLNs and similar instruments, the risk-weightedexposure is the higher of the exposure based on the risk weight of the issuer’s collateral or thereference entity or entities.
On January 15, 2013, the BSP issued Circular No. 781, Basel III Implementing Guidelines onMinimum Capital Requirements, which provides the implementing guidelines on the revised risk-based capital adequacy framework particularly on the minimum capital and disclosurerequirements for universal banks and commercial banks, as well as their subsidiary banks andquasi-banks, in accordance with the Basel III standards. The circular is effective onJanuary 1, 2014.
The Circular sets out a minimum Common Equity Tier 1 (CET1) ratio of 6.0% and Tier 1 capitalratio of 7.5%. It also introduces a capital conservation buffer of 2.5% comprised of CET1 capital.

- 141 -
*SGVFS023363*
The BSP’s existing requirement for Total CAR remains unchanged at 10% and these ratios shallbe maintained at all times.
Further, existing capital instruments as of December 31, 2010 which do not meet the eligibilitycriteria for capital instruments under the revised capital framework shall no longer be recognizedas capital upon the effectivity of Basel III. Capital instruments issued under BSP CircularNos.709 and 716 (the circulars amending the definition of qualifying capital particularly onHybrid Tier 1 and Lower Tier 2 capitals), starting January 1, 2011 and before the effectivity ofBSP Circular No. 781, shall be recognized as qualifying capital until December 31, 2015. Inaddition to changes in minimum capital requirements, this Circular also requires variousregulatory adjustments in the calculation of qualifying capital.
On June 27, 2014, the BSP issued Circular No. 839, REST Limit for Real Estate Exposures whichprovides the implementing guidelines on the prudential REST limit for universal, commercial, andthrift banks on their aggregate real estate exposures. The Circular sets out a minimum REST limitof 6.0% CET1 capital ratio and 10% risk-based capital adequacy ratio, on a solo and consolidatedbasis, under a prescribed write-off rate of 25% on the Group’s real estate exposure. These limitsshall be complied with at all times.
On October 29, 2014, the Bangko Sentral ng Pilipinas (BSP) issued amendments to CircularNo. 854, Minimum Capitalization of Banks. Based on the amendments, RBC as a commercialbank with more than 100 branches, is required to increase its capitalization to P=15.00 billion.
RBC has taken into consideration the impact of the foregoing requirements to ensure that theappropriate level and quality of capital are maintained on an ongoing basis.
The CAR of RBC as reported to the BSP as of December 31, 2016 and 2015 follows:
2016 2015Common Equity Tier 1 Capital P=10,270 P=5,024Additional Tier 1 Capital – 5,663Tier 1 capital 10,270 10,687Tier 2 capital 318 242Gross qualifying capital 10,588 10,929Less required deductions – –Total qualifying capital P=10,588 P=10,929Credit RWA P=38,931 P=28,044Market RWA 223 104Operational RWA 4,224 3,632Total RWA P=43,378 P=31,780Common Equity Tier 1 Ratio 1 23.68% 15.81%Additional Tier 1 Ratio 0.00% 17.82%Tier 1 capital ratio 23.68% 33.63%Tier 2 capital ratio 0.73% 0.76%Risk-based capital adequacy ratio 24.41% 34.39%
As of December 31, 2016 and 2015, RBC was in compliance with the required capital adequacyratio (CAR).
- 142 -
*SGVFS023363*
As part of its capital build-up program, RBC planned to convert its preferred to common shares toincrease its tier 1 ratio. The request of RBC for the conversion of its preferred to common shareswas subject to approval by the BSP. The request pertained to the "Endorsement/Certificate ofAuthority to Convert 157,883,715 Series "A" Preferred Shares and 209,604,710 Series "B"Preferred Shares into Common Shares and To File an Amendment to RBC's Articles ofIncorporation to Reflect the Conversion" under RBC's Letters to BSP dated March 21, 2013, May17, 2013, November 20, 2013 and December 9, 2013, which will result in the increase of RBC'sCommon Shares from 43,683,500 Common Shares to 411,171,925 Common shares.The foregoing plan will also result in the reduction of the Bank's Preferred "A" Shares from356,316,500 shares to 198,432,785 shares, while the Preferred "B" Shares will go down from210,000,000 shares to 395,290 shares.
Similarly, in 2014, RBC had a pending request with the BSP for "Certificate of Authority toclassify and register with the Securities and Exchange Commission (SEC) the Series "A" PreferredShares into non-cumulative, perpetual and convertible to common shares while the Series "B"Preferred Shares into non-cumulative, perpetual, non-redeemable and convertible to commonshares" (presumably the remaining shares after the aforementioned conversion) under the Bank'sLetter dated December 9, 2013 in order for such preferred shares to qualify as Additional Tier 1Capital under BSP Circular No. 781, series of 2013.
Once approved, CET1 Ratio will be 10.565 upon conversion of the aforementioned number ofPreferred "A" and "B" shares to Common Shares.
On January 28, 2015 and February 25, 2015, in relation to BSP Circular No. 854, the BOD ofRBC and the stockholders representing at least two-thirds (2/3) of the outstanding capital stock,respectively, approved the issuance of the remaining 46,070,226 unissued preferred shares (A andB) of RBC at P=10.00 par value in favor of the JGSCSC and Robinsons Retail Holdings, Inc.(RRHI) as follows:
Stockholder Types of SharesNo. of Shares
SubscribedPar
Value AmountJGSCSC Preferred A 27,404,962 P=10 P=274,049,620
Preferred B 237,174 10 2,371,740RRHI Preferred A 18,269,974 10 182,699,740
Preferred B 158,116 10 1,581,160Total 46,070,226 P=460,702,260
Furthermore, the BOD and stockholders of RBC also approved the following resolutions:∂ Conversion of all preferred shares of RBC, whether issued or unissued, particularly the
356,316,500 preferred shares A and the 210,000,000 preferred shares B, into common shares,and removal of all the other class of shares of RBC, except common shares.
∂ Increase in RBC’s authorized capital stock from P=6.10 billion to P=15.00 billion divided into1.50 billion common shares with a par value of P=10.00 each.
On March 15, 2015, JGSCSC acquired additional 27,404,962 preferred shares A and 237,174preferred shares B amounting to P=274.05 million and P=2.37 million, respectively.
On July 8, 2015, JGSCSC subscribed to an additional 292,905,882 common shares at P=10.00 pershare. JGSCSC paid the whole additional subscription amounting to P=2.93 billion on the samedate.

- 143 -
*SGVFS023363*
On July 9, 2015, RBC’s BOD approved the increase in authorized capital stock amounting toP=8.90 billion composed of 890.00 million common shares at 10.00 per share. Out of theP=8.90 billion increase, P=5.90 billion was paid-up and subscribed as follows:
StockholderNo. of SharesSubscribed Amount
JGSCSC 292,905,882 2,929,058,820RRHI 297,094,118 2,970,941,180Total 590,000,000 5,900,000,000
On November 15, 2015, the BSP also approved RBC’s capital build-up program as follows:1. Capital infusion from unissued shares up to the existing authorized capital stock of
P=6.10 billion.2. Capital infusion from the increase in authorized capital stock from P=6.10 billion to
P=15.00 billion of which P=12.00 billion is paid up.3. Internally generated capital based on RBC financial projections for the period 2015 to 2019.
On December 15, 2015, RBC filed its application for the increase in its authorized shares asapproved by the BOD and the BSP with the SEC.
As of December 31, 2016 and 2015, JGSCSC’s deposit for the additional subscription amountingto P=2.93 billion in RBC’s common shares is presented under ‘Investments in subsidiaries’ in theconsolidated statement of financial position.
On January 29, 2016, the SEC approved RBC’s application for the increase in authorized capitalstock from P=6.10 billion divided into P=43.68 million common shares, P=356.32 million preferredshares A and P=210.00 million preferred shares B of P=10.00 par value each, to P=12.00 billiondivided into 633.64 million common shares, 356.32 million preferred shares A and 210.00 millionpreferred shares B of P=10.00 par value each.
In 2016, RBC has issued 590.00 million common shares amounting to P=5.90 billion in exchangefor the deposits for future subscriptions.
In 2016, RBC removed all the other classes of shares, except common shares, and converted itsP=356.32 million preferred shares A and P=210.00 million preferred shares B to P=566.32 millioncommon shares with P=10.00 par value.
Retained EarningsAs of December 31, 2016 and 2015, the Group has a total retained earnings of P=180.4 billion andP=171.3 billion, respectively. Out of this, P=114.1 billion and P=103.7 billion were restricted as ofDecember 31, 2016 and 2015, respectively.
Details of the Group’s restricted retained earnings follow:
Parent CompanyIn April 2003, the Parent Company’s BOD approved the appropriation of retained earningsamounting to P=8.0 billion. On December 29, 2014, December 30, 2010 and December 28, 2009,the Parent Company’s BOD approved the additional appropriation of retained earnings amountingto P=39.0 billion, P=19.0 billion and P=15.0 billion, respectively.

- 144 -
*SGVFS023363*
On December 18, 2015, the BOD approved the reversal of the retained earnings it hasappropriated in 2014, 2010 and 2009 amounting to P=41.4 billion as the related projects to whichthe retained earnings were earmarked were completed already. The amount was originallyearmarked for the payment of outstanding obligations and capital expenditures of the Group.
On December 18, 2015, the BOD approved the appropriation of retained earnings amounting toP=47.0 billion.
On November 20, 2016, the BOD approved the appropriation of retained earnings amounting toP=10.4 billion.
As of December 31, 2016, the Parent Company’s restricted retained earnings amounted toP=97.0 billion. As of December 31, 2015, the Parent Company’s total restricted and unrestrictedretained earnings amounted to P=86.6 billion and P=8.7 billion, respectively.
As of December 31, 2016, the P=97.0 billion restricted retained earnings of the Parent Company isearmarked for the following: (a) settlement of a certain subsidiary’s loan obligations guaranteedby the Parent Company; (b) funding of capital expenditure commitments of certain wholly ownedsubsidiaries; (c) and general corporate purposes.
The details of the loan obligations follow:
Subsidiary Amount SettlementLoan ObligationsUS$ 3 or 6-month LIBOR plus 80bps or
12-month LIBOR plus 75 bpsJGSH Philippines, Limited US$250.0 million 1 year maturing in 2017
4.38% senior unsecured notes JGSH Philippines, Limited US$750.0 million 10 years maturing in 2023Retail Bonds Parent Company P=30.0 billion Maturing in 2019, 2021 and
2024
As part of its debt covenant, the Parent Company has to maintain certain financial ratios such as:(a) the Group’s current ratio of not lesser than 1.0:1.0; and (b) the Group’s debt-to-equity ratio ofnot greater than 2.0:1.0. A portion of the Parent Company’s retained earnings is restricted tomaintain these financial ratios.
URCIn 2003, URC's BOD approved the appropriation of retained earnings amounting to P=3.0 billionfor URC’s expansion plans.
In April 2011, as approved by the BOD, URC has appropriated retained earnings amounting toP=5.0 billion for URC’s expansion plans. On the same date, URC’s BOD also approved thereversal of the previously appropriated retained earnings amounting to P=3.0 billion.
URC’s expansion plans include investments and capital expenditures for existing and on-goingprojects. Out of the P=5.0 billion, around P=4.3 billion was allocated to branded consumer foodsgroup for Polyethylene terephthalate bottle projects and snack food facilities in the Philippines;expansion of chocolates, biscuits and wafer lines in Thailand and Malaysia; and expansion ofbeverage, biscuits, cake and candy lines in Vietnam, which were completed in the first half offiscal year 2013. The rest of the appropriation were used for farm expansion, handling facilities ofthe feeds division and maintenance capital expenditures of the commodity group in the first half offiscal year 2013.

- 145 -
*SGVFS023363*
On February 11, 2013, the BOD approved the reversal of the previously appropriated retainedearnings amounting to P=5.0 billion. On the same date, the BOD approved the appropriation ofretained earnings amounting to P=6.0 billion for the purposes of the URC’s plant expansion. OnSeptember 18, 2013, the BOD approved the reversal of the previously appropriated retainedearnings amounting to P=6.0 billion.
On September 18, 2015, as approved by the BOD, URC has appropriated retained earningsamounting to P=2.0 billion for the URC’s capital expenditure commitments to expand capacities inthe snack foods and beverage businesses across branded food operations which is expected to becompleted within the next two years.
On September 27, 2016, the BOD approved the reversal of the previously appropriated retainedearnings amounting to P=1.0 billion, which has been used to complete portions of the snack foodsand beverage business projects across branded foods group. On the same date, the BOD approvedthe additional appropriation of retained earnings amounting to P=2.0 billion for capital expenditurecommitments to expand capacities across branded consumer and commodity foods businesses,which are expected to be completed within the next two years.
RLCOn September 27, 2016, the BOD approved the reversal of the retained earnings it appropriated in2015 amounting to P=17.0 billion as the related projects to which the retained earnings wereearmarked were completed already. The amount was originally earmarked for the continuingcapital expenditures of RLC for subdivision land, condominium and residential units for sale,investment properties and property and equipment.
On the same date, the BOD also approved the appropriation of P=16.0 billion, out of theunappropriated retained earnings, to support the capital expenditure requirements of RLC forvarious projects approved by the Executive Committee during meetings held in September 2016.These projects and acquisitions are expected to be completed in various dates in 2017 to 2021.On September 10, 2015, the BOD approved the reversal of the retained earnings it hasappropriated in 2014 amounting to P=17.0 billion as the related projects to which the retainedearnings were earmarked were completed already. The amount was originally earmarked for thecontinuing capital expenditures of the RLC for subdivision land, condominium and residentialunits for sale, investment properties and property and equipment.
On the same date, the BOD also approved the appropriation of P=17.0 billion, out of theunappropriated retained earnings, to support the capital expenditure requirements of RLC forvarious projects approved by the Executive Committee during meetings held in September 2015.These projects and acquisitions are expected to be completed in various dates in 2016 to2018.
On September 18, 2014, the BOD approved the reversal of the retained earnings it hasappropriated in 2013 amounting to P=11.2 billion as the related projects to which the retainedearnings were earmarked were completed already. The amount was originally earmarked for thecontinuing capital expenditures of RLC for subdivision land, condominium and residentialunits for sale, investment properties and property and equipment.
On the same date, the BOD also approved the appropriation of P=17.0 billion, out of theunappropriated retained earnings, to support the capital expenditure requirements of RLC forvarious projects approved by the Executive Committee during meetings held in September 2014.These projects and acquisitions are expected to be completed in various dates in 2015 to 2017.

- 146 -
*SGVFS023363*
CAIOn November 10, 2016, December 3, 2015 and November 27, 2014, the CAI’s BOD appropriatedP=6.6 billion, P=1.0 billion and P=3.0 billion, respectively, from its unrestricted retained earnings asof December 31, 2016 for purposes of the CAI’s re-fleeting program. The appropriated amountwill be used for the settlement of pre-delivery payments and aircraft lease commitments. As ofDecember 31, 2016 and 2015, CAI has appropriated retained earnings totaling P=14.5 billion andP=7.9 billion, respectively.
RBCAs of December 31, 2013 and 2012, RBC’s surplus reserve amounted to P=133.7 million andP=112.2 million, respectively, which were appropriated for self-insurance and for its trustoperations.
In 2016 and 2015, RBC’s BOD approved to appropriate reserves for self-insurance amounting toP=3.60 million and for trust reserves amounting to P=0.93 million and P=2.62 million, respectively.
Accumulated equity in net earnings of the subsidiaries and associatesA portion of the Group’s retained earnings corresponding to the net earnings of the subsidiariesand accumulated equity in net earnings of the associates and joint ventures amounting toP=71.6 billion, P=58.8 billion and P=56.3 billion as of December 31, 2016, 2015 and 2014,respectively, is not available for dividend declaration. The accumulated equity in net earningsbecomes available for dividends upon receipt of cash dividends from the investees.
Cash DividendsParent CompanyDetails of the Parent Company’s dividend declarations on its common stock follow:
2016 2015 2014Date of declaration June 9, 2016 June 10, 2015 June 16, 2014Dividend per share P=0.25 P=0.22 P=0.20Total dividends P=1.8 billion P=1.6 billion P=1.4 billionDate of record June 29, 2016 June 25, 2015 July 17, 2014Date of payment July 25, 2016 July 21, 2015 August 12, 2014
Details of the Parent Company’s dividend declarations on its preferred stock follow:
2016 2015 2014Date of declaration June 9, 2016 June 10, 2015 June 16, 2014Dividend per share P=0.0025 P=0.0022 P=0.0020Total dividends P=10.0 million P=8.8 million P=8.0 millionDate of record June 29, 2016 June 25, 2015 July 17, 2014Date of payment July 25, 2016 July 21, 2015 August 12, 2014
The following tables summarize the dividends declared by significant subsidiaries of the ParentCompany:
- 147 -
*SGVFS023363*
URCDetails of URC’s dividend declarations follow:
2016 2015 2014Date of declaration February 9, 2016 February 6, 2015 February 4, 2014Dividend per share P=3.15 P=3.00 P=3.00Total dividends P=6.5 billion P=6.5 billion P=6.5 billionDate of record February 29, 2016 February 26, 2015 February 26, 2014Date of payment March 28, 2016 March 24, 2015 March 24, 2014
RLCDetails of RLC’s dividend declarations follow:
2016 2015 2014Date of declaration March 9, 2016 April 29, 2015 May 12, 2014Dividend per share P=0.36 P=0.36 P=0.36Total dividends P=1.5 million P=1.5 billion P=1.5 billionDate of record March 29, 2016 May 14, 2015 May 29, 2014Date of payment April 22, 2016 June 9, 2015 June 25, 2014
CAIDetails of CAI’s dividend declarations follow:
2016 2015 2014Date of declaration May 20, 2016 June 24, 2015 June 26, 2014Dividend per share - regular P=1.00 P=1.00 P=1.00Total dividends - regular P=606.0 million P=606.0 million P=606.0 millionDividend per share - special P=1.00 P=0.50 P=−Total dividends - special P=606.0 million P=303.0 million P=−Date of record June 9, 2016 July 16, 2015 July 16, 2014Date of payment July 5, 2016 August 11, 2015 August 11, 2014
Treasury SharesThe Group had 98.1 million outstanding treasury shares amounting to P=721.8 million as ofDecember 31, 2012. On November 25, 2013, the Parent Company sold all of its 98.1 milliontreasury shares, with total cost of P=721.8 million via an accelerated overnight equity placement ata price of P=40.0 per share.
Equity ReserveOn September 27, 2016, URC reissued 22.7 million common shares previously held as treasuryshares by way of block sale at a selling price of P=193.45 per share, with a total selling priceamounting to P=4.4 billion, net of transaction costs amounting to P=27.2 million. As a result of thesale, the equity interest of the Parent Company over URC changed from 55.83% to 55.25%. Theexcess of the total consideration received over the carrying value of the interest transferred to thenon-controlling interest is included under “Equity Reserve” in the 2016 consolidated statements ofchanges in equity.
In December 2014, URC entered into a share purchase agreement with Nissin to sell 14.0% of itsequity interest in NURC. As a result of the sale, the equity interest of URC changed from 65% to51%. The gain from the sale amounting to P=239.8 million is included under “Equity Reserve” inthe 2014 consolidated statements of changes in equity.

- 148 -
*SGVFS023363*
Non-controlling InterestsBelow is the rollforward of non-controlling interests:
2016 2015 2014Beginning balance P=63,935,131,765 P=53,994,117,270 P=49,690,842,347Total comprehensive income: Net income attributable to
non-controlling interests 11,449,631,592 10,065,386,384 7,579,654,820 Other comprehensive income
attributable to non-controlling interests:
Net gain (loss) on AFS investments (Note 10) (115,159,763) (93,858,078) 142,564,930
Cumulative translation adjustments (150,702,267) 766,066,829 18,667,690 Remeasurements due to defined
benefit liability (Note 37) 24,244,127 (27,639,789) 47,132,715 Gain (loss) on cashflow hedge 8,634,742 (1,362,560) 1,362,560
11,216,648,431 10,708,592,786 7,789,382,715Cash dividends paid to non-controlling interests (4,175,979,077) (3,922,800,371) (3,752,970,864)Deposit for future subscription of shares by non-
controlling interest in a subsidiary − 3,155,222,080 −Sale of shares of subsidiary − − 266,863,072Decrease in subsidiaries' treasury shares 2,292,532,237 −
P=73,268,333,356 P=63,935,131,765 P=53,994,117,270
Deposit for future subscription of shares by non-controlling interest in a subsidiary amounting toP=3.2 million pertain to the additional investment by Robinsons Retails Holding, Inc. in RBC.
26. Banking Revenue
This account consists of:
2016 2015 2014Interest income (Note 27) P=3,092,862,946 P=2,705,799,538 P=2,434,157,658Service fees and commission
income 174,216,102 176,209,592 154,140,838Trading and securities gains 145,108,071 86,931,176 128,897,110
P=3,412,187,119 P=2,968,940,306 P=2,717,195,606
27. Interest Income
This account consists of:
2016 2015 2014Interest income from:
Cash and cash equivalents P=574,695,922 P=677,762,510 P=562,010,223Finance receivables, unquoted
debt securities and salescontract receivable (Note 11) 2,334,136,260 2,058,890,489 1,855,456,117
Financial assets at FVPL(Note 9) 639,122,921 726,063,019 768,261,662
(Forward)

- 149 -
*SGVFS023363*
2016 2015 2014AFS debt securities (Note 10) P=532,874,580 P=500,478,245 P=489,472,203HTM investments 170,428,187 109,230,854 103,971,784Others 2,850,129 766,907 2,709,207
P=4,254,107,999 P=4,073,192,024 P=3,781,881,196
Interest income are included in the following accounts in the consolidated statements ofcomprehensive income as follows:
2016 2015 2014Banking revenue (Note 26) P=3,092,862,946 P=2,705,799,538 P=2,434,157,658Finance income 1,161,245,053 1,367,392,486 1,347,723,538
P=4,254,107,999 P=4,073,192,024 P=3,781,881,196
28. Dividend Income
As a holding company, the Parent Company receives dividends from its strategic investments incompanies that are neither consolidated nor equity-accounted in the group accounts.
This account includes dividends received from PLDT amounting to P=1.8 billion, P=2.6 billion andP=3.2 billion in 2016, 2015 and 2014, respectively, and from Jobstreet Corporation Berhadamounting to P=1.7 billion in 2014. Investment in PLDT is presented under AFS investments inthe consolidated statement of financial position.
29. Other Operating Income (Expenses)
This account consists of:
2016 2015 2014Loss on sale of aircraft (Note 16) (P=962,608,741) (P=80,267,191) P=–Gain on insurance claims 208,713,905 20,410,473 –Realized gain on sale of AFS
investments (Note 10) 452,510 898,183 17,431Others 265,486,484 210,173,325 1,219,835,816
(P=487,955,842) P=151,214,790 P=1,219,853,247
In 2016, CAI sold and delivered four Airbus A319 aircraft to a subsidiary of Allegiant TravelCompany (Allegiant) which resulted to a loss of P=962.609 million.
In 2014, others include gain on exchange of investment in an associate amounting to P=1.6 billion(see Note 14) and loss on escrow settlement following the post-closing review of the accounts ofDigitel amounting to P=400.0 million as part of the SPA entered into by the Parent Company andPLDT. Others also include rent income and gain (loss) on sale of PPE.

- 150 -
*SGVFS023363*
30. Cost of Sales and Services
This account consists of:
2016 2015 2013Raw materials used P=68,279,316,336 P=70,372,022,949 P=55,273,900,245Direct labor 4,913,509,312 4,430,994,387 2,584,738,663Overhead cost 25,688,718,034 20,439,793,971 16,914,550,399Total manufacturing cost 98,881,543,682 95,242,811,307 74,773,189,307Work-in-process (123,486,411) 1,091,582,056 (362,986,500)Cost of goods manufactured 98,758,057,271 96,334,393,363 74,410,202,807Finished goods (633,954,248) 1,287,269,878 (4,880,017,491)Cost of sales 98,124,103,023 97,621,663,241 69,530,185,316Cost of services 45,970,133,223 43,241,983,101 45,476,429,584
Cost of sales and services P=144,094,236,246 P=140,863,646,342 P=115,006,614,900
Overhead costs consist of:
2016 2015 2014Utilities and fuel P=12,173,979,725 P=8,433,616,204 P=8,022,086,207Depreciation and amortization
(Note 33) 6,170,348,732 5,475,444,437 3,866,114,378Repairs and maintenance 3,286,778,957 2,778,894,150 2,202,248,930Personnel (Note 32) 2,505,254,937 2,150,514,551 1,609,642,121Rental 722,979,186 900,526,771 806,764,061Handling and delivery charges 147,726,876 148,713,483 77,970,588Research and development 78,903,939 68,809,570 77,191,082Others 602,745,682 483,274,805 252,533,032
P=25,688,718,034 P=20,439,793,971 P=16,914,550,399
Cost of services is composed of:
2016 2015 2014Air transportation P=34,262,194,205 P=33,251,909,025 P=36,548,411,792Real estate 9,702,256,952 8,053,837,238 7,185,985,589Hotel operations 1,308,841,469 1,320,470,628 1,182,211,490Banking 696,840,597 615,766,210 559,820,713
P=45,970,133,223 P=43,241,983,101 P=45,476,429,584
Further breakdown of the ‘Cost of services’ account showing the nature of expenses follow:
2016 2015 2014Fuel and oil P=15,821,328,265 P=17,659,066,442 P=23,210,305,406Maintenance costs 5,878,097,172 4,550,586,937 3,856,318,673Personnel (Note 32) 4,935,226,272 4,192,828,456 3,605,293,170Cost of real estate sales (Note 12) 4,138,509,247 3,250,836,782 3,043,254,449Depreciation and amortization (Note 33) 3,774,153,608 3,203,353,347 2,860,204,571Landing and take-off 3,158,774,262 2,832,246,339 2,339,991,606Ground handling charges 2,105,087,686 1,887,062,871 1,518,884,645Reservation costs 1,522,455,857 1,266,652,869 1,149,515,280
(Forward)

- 151 -
*SGVFS023363*
2016 2015 2014Property operations and maintenance costs P=780,823,807 P=665,699,155 P=661,647,417Film rentals expense - amusement services 751,257,456 746,273,093 602,625,787Interest expense (Note 21) 648,863,124 564,027,213 515,358,353Contracted services 368,352,704 144,634,858 248,138,199Cost of food and beverage - hotel operations 346,871,025 239,910,716 186,558,215Interrupted/delayed trips expense 229,268,417 121,345,627 77,917,257Passenger liability insurance 215,957,012 320,065,462 320,144,303Passenger food and supplies 193,893,235 204,018,446 32,473,008Travel and transportation 140,327,683 80,970,363 65,179,291Pilot and crew meals 52,521,078 44,490,913 47,451,084Service charges and commission expense 47,919,379 51,738,997 44,462,360Customs, immigration and duties 30,562,641 147,512,446 145,281,800Others 829,883,293 1,068,661,769 945,424,710
P=45,970,133,223 P=43,241,983,101 P=45,476,429,584
31. General and Administrative Expenses
This account consists of:
2016 2015 2014Outside services P=8,766,844,452 P=7,816,265,383 P=5,804,491,300Advertising and promotions 8,658,542,014 7,942,500,312 6,928,900,886Depreciation and amortization
(Note 33) 7,057,267,306 5,760,968,861 5,033,289,114Personnel (Note 32) 6,531,533,067 5,502,889,794 4,267,493,609Aircraft and engine lease 4,253,724,294 4,024,599,732 3,503,484,521Rental 1,901,708,524 1,536,638,847 899,467,861Travel and transportation 1,183,698,971 1,028,625,335 987,851,912Taxes, licenses and fees 1,072,903,748 854,093,884 896,468,667Sales commission 738,284,393 951,090,219 668,273,801Utilities and supplies 645,701,612 586,457,081 497,505,507Insurance 511,265,268 588,958,297 589,551,456Repairs and maintenance 498,762,284 467,983,749 431,152,302Communication 277,733,808 240,500,923 190,154,952Entertainment, amusement and
recreation (Note 38) 198,317,165 129,884,589 141,406,495Others 1,201,921,403 1,245,939,933 914,472,397
P=43,498,208,309 P=38,677,396,939 P=31,753,964,780
OthersOther expenses include royalties, donation and contribution, and membership and subscriptiondues.
- 152 -
*SGVFS023363*
32. Personnel Expenses
This account consists of:
2016 2015 2014Salaries and wages P=11,443,919,120 P=9,678,699,199 P=7,665,497,840Other employee benefits 2,218,938,468 1,833,467,599 1,612,382,762Pension expense 309,156,688 334,066,003 300,883,221
P=13,972,014,276 P=11,846,232,801 P=9,578,763,823
The breakdown of personnel expenses follows:
2016 2015 2014Cost of sales and services (Note 30) P=7,440,481,209 P=6,343,343,007 P=5,214,935,291General and administrative expenses
(Note 31) 6,531,533,067 5,502,889,794 4,267,493,609Construction in progress – – 96,334,923
P=13,972,014,276 P=11,846,232,801 P=9,578,763,823
33. Depreciation and Amortization
The breakdown of depreciation and amortization on property, plant and equipment, investmentproperties, and intangible assets follows:
2016 2015 2014Cost of sales and services
(Notes 15, 16 and 30) P=9,944,502,340 P=8,678,797,784 P=6,726,318,949General and administrative expenses
(Notes 15, 16, and 18) 7,057,267,306 5,760,968,861 5,033,289,114P=17,001,769,646 P=14,439,766,645 P=11,759,608,063
34. Impairment Losses and Others
This account consists of:
2016 2015 2014Provision for impairment losses on:
Receivables (Note 11) P=449,118,739 P=259,413,258 P=315,236,015Other noncurrent assets 16,148,392 14,449,730 151,961,639Goodwill (Note 19) – – 5,212,591
Inventory obsolescence and marketdecline (Note 12) 175,449,919 104,202,866 104,296,754
P=640,717,050 P=378,065,854 P=576,706,999

- 153 -
*SGVFS023363*
35. Financing Costs and Other Charges
This account consists of:
2016 2015 2014Interest expense P=7,298,442,812 P=6,682,291,317 P=5,713,260,142Bank charges and others 163,554,058 197,527,102 111,089,749
P=7,461,996,870 P=6,879,818,419 P=5,824,349,891
Details of interest expense follow:
2016 2015 2014Long-term debt (Note 23) P=6,409,344,480 P=6,130,913,522 P=4,877,081,685Short-term debt (Note 23) 407,350,305 268,472,042 633,044,995Advances from affiliates – 32,054,925 29,451,784Others 272,481,139 103,652,014 48,055,728
7,089,175,924 6,535,092,503 5,587,634,192Amortization of debt issuance costs
(Note 23) 209,266,888 147,198,814 125,625,950P=7,298,442,812 P=6,682,291,317 P=5,713,260,142
36. Components of Other Comprehensive Income
Below is the composition of the Group’s ‘Other comprehensive income’:
2016
Parent CompanyNon-controlling
Interests TotalNet gains on AFS investments (Note 10): Net changes in fair value of AFS
investments of the Parent Companyand its subsidiaries:
Net changes in fair value during the period (P=12,220,137,282) (P=115,159,763) (P=12,335,297,045)
Reclassification adjustment included in profit or loss arising from disposal of AFS investments (452,510) − (452,510)
Reclassification of unrealized loss toprofit or loss due to impairment 16,713,629,844 − 16,713,629,844
4,493,040,052 (115,159,763) 4,377,880,289 Net changes in fair value of AFS
investments of an associate (104,703,835) − (104,703,835)4,388,336,217 (115,159,763) 4,273,176,454
Net changes in fair value of cash flowhedge (Note 8):
Net changes in fair value of derivativestaken to OCI (26,697,367) 8,634,742 (18,062,625)
4,361,638,850 (106,525,021) 4,255,113,829Cumulative translation adjustments 29,518,399 (150,702,267) (121,183,868)Remeasurements due to defined benefit
liability, net of tax (Note 37) Remeasurements of net DBL of
Parent and subsidiaries 28,230,597 24,244,127 52,474,724 Share in remeasurements of net
DBL of associates 524,522,485 − 524,522,485
P=4,943,910,331 (P=197,750,454) P=4,710,927,170
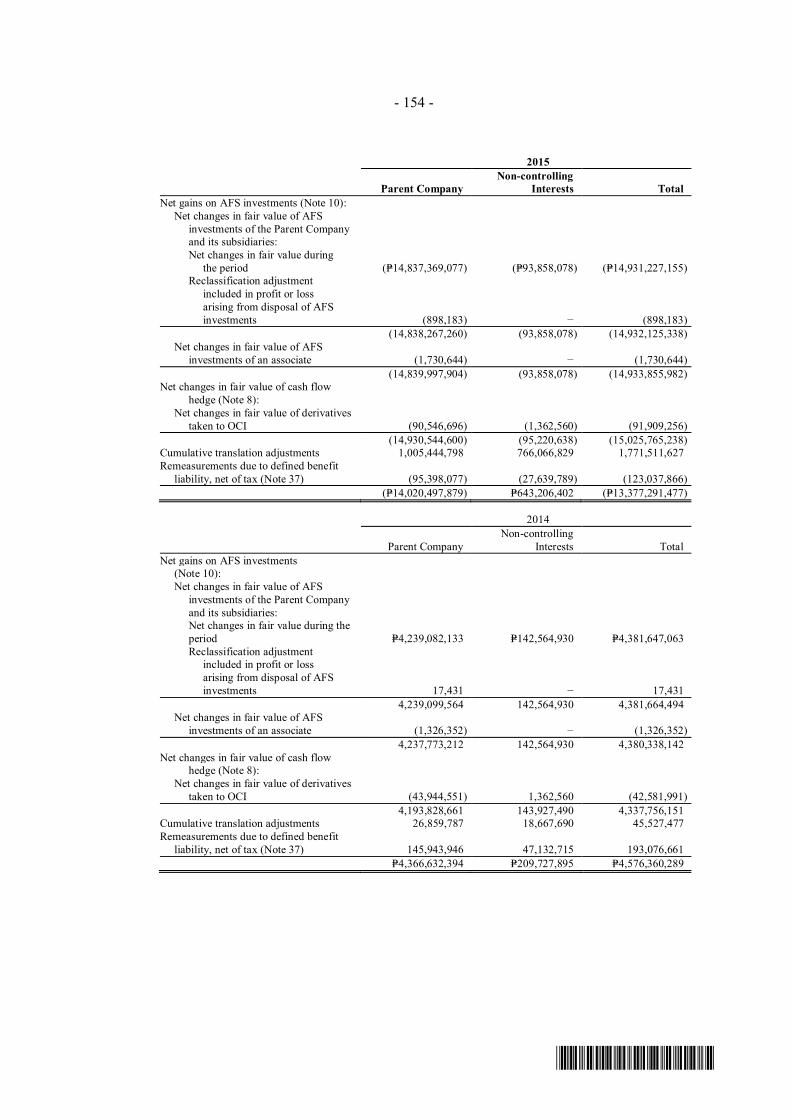
- 154 -
*SGVFS023363*
2015
Parent CompanyNon-controlling
Interests TotalNet gains on AFS investments (Note 10): Net changes in fair value of AFS
investments of the Parent Companyand its subsidiaries:
Net changes in fair value during the period (P=14,837,369,077) (P=93,858,078) (P=14,931,227,155)
Reclassification adjustment included in profit or loss arising from disposal of AFS investments (898,183) − (898,183)
(14,838,267,260) (93,858,078) (14,932,125,338) Net changes in fair value of AFS
investments of an associate (1,730,644) − (1,730,644)(14,839,997,904) (93,858,078) (14,933,855,982)
Net changes in fair value of cash flowhedge (Note 8):
Net changes in fair value of derivativestaken to OCI (90,546,696) (1,362,560) (91,909,256)
(14,930,544,600) (95,220,638) (15,025,765,238)Cumulative translation adjustments 1,005,444,798 766,066,829 1,771,511,627Remeasurements due to defined benefit
liability, net of tax (Note 37) (95,398,077) (27,639,789) (123,037,866)(P=14,020,497,879) P=643,206,402 (P=13,377,291,477)
2014
Parent CompanyNon-controlling
Interests TotalNet gains on AFS investments
(Note 10): Net changes in fair value of AFS
investments of the Parent Companyand its subsidiaries:
Net changes in fair value during theperiod P=4,239,082,133 P=142,564,930 P=4,381,647,063
Reclassification adjustment included in profit or loss arising from disposal of AFS investments 17,431 − 17,431
4,239,099,564 142,564,930 4,381,664,494 Net changes in fair value of AFS
investments of an associate (1,326,352) − (1,326,352)4,237,773,212 142,564,930 4,380,338,142
Net changes in fair value of cash flowhedge (Note 8):
Net changes in fair value of derivativestaken to OCI (43,944,551) 1,362,560 (42,581,991)
4,193,828,661 143,927,490 4,337,756,151Cumulative translation adjustments 26,859,787 18,667,690 45,527,477Remeasurements due to defined benefit
liability, net of tax (Note 37) 145,943,946 47,132,715 193,076,661P=4,366,632,394 P=209,727,895 P=4,576,360,289

- 155 -
*SGVFS023363*
The income tax effects relating to other comprehensive income are as follows:
2016Before tax Tax benefit Net of tax
Net gains on AFS investments of ParentCompany and its subsidiaries P=4,377,880,289 P=− 4,377,880,289
Cumulative translation adjustments (121,183,868) − (121,183,868)Net movement in cash flow hedge (18,062,625) − (18,062,625)Remeasurements due to defined
benefit liability 599,486,376 (22,489,167) 576,997,209Net changes in fair value of AFS
investments of an associate(Note 10) (104,703,835) − (104,703,835)
P=4,733,416,337 (P=22,489,167) P=4,710,927,170
2015Before tax Tax benefit Net of tax
Net gains on AFS investments of ParentCompany and its subsidiaries (P=14,932,125,338) P=− (P=14,932,125,338)
Cumulative translation adjustments 1,771,511,627 − 1,771,511,627Net movement in cash flow hedge (91,909,256) − (91,909,256)Remeasurements due to defined
benefit liability (175,768,380) 52,730,514 (123,037,866)Net changes in fair value of AFS
investments of an associate(Note 10) (1,730,644) − (1,730,644)
(P=13,430,021,991) P=52,730,514 (P=13,377,291,477)
2014Before tax Tax benefit Net of tax
Net gains on AFS investments of ParentCompany and its subsidiaries P=4,381,664,494 P=− P=4,381,664,494
Cumulative translation adjustments 45,527,477 − 45,527,477Net movement in cash flow hedge (42,581,991) − (42,581,991)Remeasurements due to defined
benefit liability 275,823,801 (82,747,140) 193,076,661Net changes in fair value of AFS
investments of an associate(Note 10) (1,326,352) − (1,326,352)
P=4,659,107,429 (P=82,747,140) P=4,576,360,289
37. Employee Benefits
Pension PlansThe Group has funded, noncontributory, defined benefit pension plans covering substantially all oftheir regular employees, except for JGSPC that has an unfunded, noncontributory defined benefitpension plan.
The pension funds are being administered and managed through JG Summit Multi-EmployerRetirement Plan (the “Plan”), with RBC as Trustee. The plans provide for retirement, separation,disability and death benefits to their members. The Group, however, reserves the right todiscontinue, suspend or change the rates and amounts of their contributions at any time on accountof business necessity or adverse economic conditions. The retirement plan has an ExecutiveRetirement Committee, that is mandated to approve the plan, trust agreement, investment plan,including any amendments or modifications thereto, and other activities of the Plan. Certain

- 156 -
*SGVFS023363*
members of the BOD of the Parent Company are represented in the Executive RetirementCommittee. Robinsons Bank Corporation manages the plan based on the mandate as defined inthe trust agreement.
The amounts recognized as pension liabilities included under ‘Other noncurrent liabilities’ in theconsolidated statements of financial position follow:
2016 2015Present value of defined benefit obligation P=4,098,485,361 P=3,821,647,448Fair value of plan assets 2,823,208,922 2,573,433,993Pension liabilities P=1,275,276,439 P=1,248,213,455
Changes in net defined benefit liability of funded funds in 2016 and 2015 follows:
2016Present value ofdefined benefit
obligationFair value of
plan assetsNet defined benefit
liability/(asset)Balance at beginning of year P=3,821,647,448 P=2,573,433,993 P=1,248,213,455Net benefit cost in consolidated statement of income: Current service cost 347,001,937 347,001,937 Net interest cost 190,476,269 127,824,448 62,651,821Subtotal 537,478,206 127,824,448 409,653,758Benefits paid (177,975,816) (147,111,611) (30,864,205)Remeasurements in other comprehensive
income: Return on plan assets − (42,335,053) 42,335,053
Actuarial changes arising from experience adjustments 82,718,416 − 82,718,416
Actuarial changes arising fromchanges in financial/
demographic assumptions (165,382,893) − (165,382,893)Subtotal (82,664,477) (42,335,053) (40,329,424)Contributions paid 311,397,145 (311,397,145)Balance at end of year P=4,098,485,361 P=2,823,208,922 P=1,275,276,439
2015Present value ofdefined benefit
obligationFair value of
plan assetsNet defined benefit
liability/(asset)Balance at beginning of year P=3,549,968,716 P=2,548,858,027 P=1,001,110,689Net benefit cost in consolidated statement of income: Current service cost 293,691,856 − 293,691,856 Net interest cost 170,531,705 124,189,605 46,342,100Subtotal 464,223,561 124,189,605 340,033,956Benefits paid (240,885,600) (184,477,518) (56,408,082)Remeasurements in other comprehensive
income: Return on plan assets − (87,942,196) 87,942,196
Actuarial changes arising from experience adjustments 34,082,027 − 34,082,027
Actuarial changes arising fromchanges in financial/
demographic assumptions 14,258,744 − 14,258,744Subtotal 48,340,771 (87,942,196) 136,282,967Contributions paid − 172,806,075 (172,806,075)Balance at end of year P=3,821,647,448 P=2,573,433,993 P=1,248,213,455
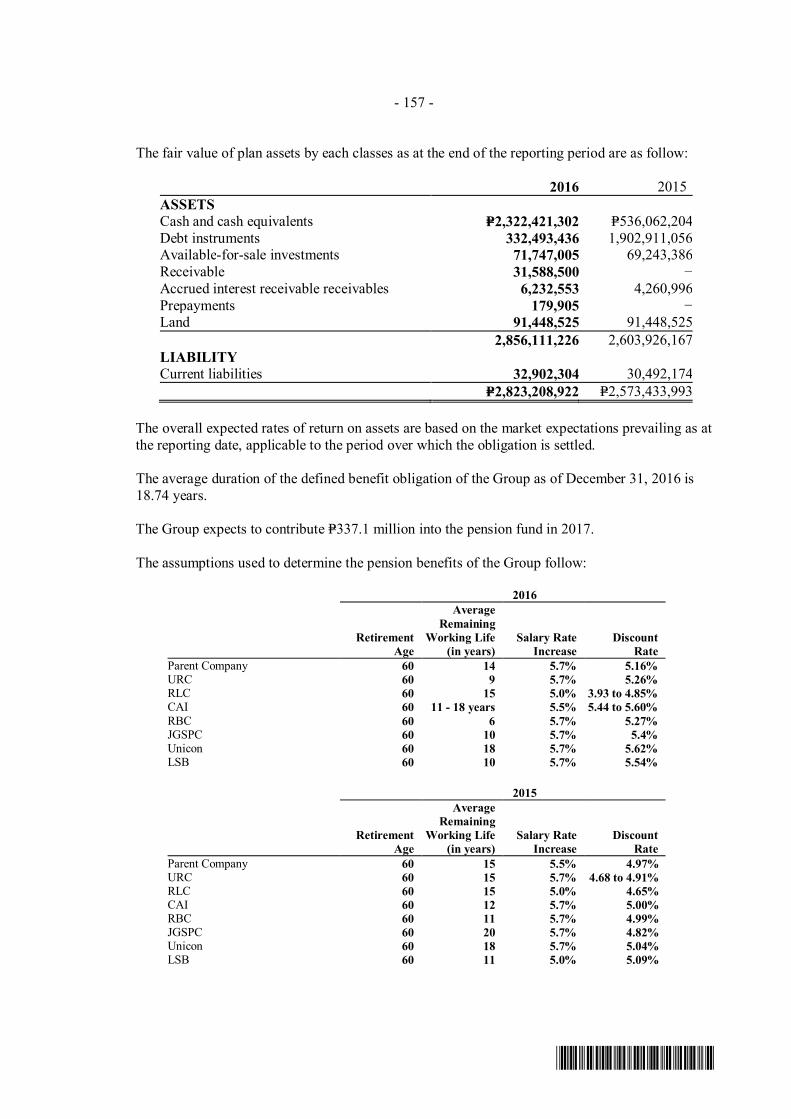
- 157 -
*SGVFS023363*
The fair value of plan assets by each classes as at the end of the reporting period are as follow:
2016 2015ASSETSCash and cash equivalents P=2,322,421,302 P=536,062,204Debt instruments 332,493,436 1,902,911,056Available-for-sale investments 71,747,005 69,243,386Receivable 31,588,500 −Accrued interest receivable receivables 6,232,553 4,260,996Prepayments 179,905 −Land 91,448,525 91,448,525
2,856,111,226 2,603,926,167LIABILITYCurrent liabilities 32,902,304 30,492,174
P=2,823,208,922 P=2,573,433,993
The overall expected rates of return on assets are based on the market expectations prevailing as atthe reporting date, applicable to the period over which the obligation is settled.
The average duration of the defined benefit obligation of the Group as of December 31, 2016 is18.74 years.
The Group expects to contribute P=337.1 million into the pension fund in 2017.
The assumptions used to determine the pension benefits of the Group follow:
2016
RetirementAge
AverageRemaining
Working Life(in years)
Salary RateIncrease
DiscountRate
Parent Company 60 14 5.7% 5.16%URC 60 9 5.7% 5.26%RLC 60 15 5.0% 3.93 to 4.85%CAI 60 11 - 18 years 5.5% 5.44 to 5.60%RBC 60 6 5.7% 5.27%JGSPC 60 10 5.7% 5.4%Unicon 60 18 5.7% 5.62%LSB 60 10 5.7% 5.54%
2015
RetirementAge
AverageRemaining
Working Life(in years)
Salary RateIncrease
DiscountRate
Parent Company 60 15 5.5% 4.97%URC 60 15 5.7% 4.68 to 4.91%RLC 60 15 5.0% 4.65%CAI 60 12 5.7% 5.00%RBC 60 11 5.7% 4.99%JGSPC 60 20 5.7% 4.82%Unicon 60 18 5.7% 5.04%LSB 60 11 5.0% 5.09%

- 158 -
*SGVFS023363*
2014
RetirementAge
AverageRemaining
Working Life(in years)
Salary RateIncrease
DiscountRate
Parent Company 60 9 5.5% 4.8%URC 60 15.8 5.5% 4.9% to 5.3%RLC 60 6 5.5% 4.9%CAI 60 12 5.5% 4.6%RBC 60 3 5.5% 4.6%JGSPC 60 4 5.5% 5.1%Unicon 60 4 5.5% 4.6%
The sensitivity analysis below has been determined based on reasonably possible changes of eachsignificant assumption on the retirement benefit obligation as of December 31, 2016 and 2015,assuming if all other assumptions were held constant:
2016
ParentCompany URC RLC CAI RBC LSB JGSPC Unicon
Discount rates+1.00% P=27,562,377 P=2,046,618,113 (P=41,523,152) P=876,336,520 P=116,194,738 P=3,936,763 P=148,770,921 P=4,352,050(-1.00%) 34,521,378 2,405,643,412 48,094,773 1,084,771,639 137,576,236 5,294,508 179,773,132 5,913,595Future salary
increases+1.00% 34,688,010 2,417,016,459 44,969,563 1,089,891,204 138,240,060 5,315,427 180,635,089 5,935,611(-1.00%) 27,366,842 2,033,571,105 (39,848,946) 870,361,689 115,434,562 3,909,854 147,785,389 4,322,236
2015Parent
Company URC RLC CAI RBC LSB JGSPC UniconDiscount rates+1.00% P=25,626,082 (P=147,811,641) (P=29,238,214) (P=636,565,188) P=108,265,697 P=2,468,738 (P=12,640,396) P=8,336,375(-1.00%) 32,717,299 171,527,023 33,636,983 833,003,746 135,616,094 3,331,185 15,032,054 9,926,521Future salary
increases+1.00% 32,361,096 161,737,838 32,053,384 827,032,128 136,142,511 3,345,002 14,285,044 9,971,527(-1.00%) 25,455,829 (142,534,297) (28,504,312) (568,368,766) 107,595,704 2,451,390 (12,285,579) 8,281,306
Shown below is the maturity analysis of the undiscounted benefit payments of the Group:
2016 2015Less than 1 year P=340,259,831 P=689,467,003More than 1 years to 5 years 1,233,837,108 1,157,480,253More than 5 years to 10 years 2,477,623,576 1,964,689,244More than 10 years to 15 years 3,057,851,827 3,188,896,196More than 15 years to 20 years 3,244,848,254 2,661,281,008More than 20 years 8,719,979,909 6,962,674,883
38. Income Taxes
Provision for income tax from continuing operations consists of:
2016 2015 2014Corporate P=4,598,138,288 P=5,631,658,297 P=3,627,997,751Final 137,761,179 143,694,114 20,975,761Deferred 702,007,166 (1,286,369,938) 800,271,777
P=5,437,906,633 P=4,488,982,473 P=4,449,245,289

- 159 -
*SGVFS023363*
The Group recognized benefit (provision) for income tax in ‘Other comprehensive income’ for‘Other comprehensive income items’ amounting to (P=22.5 million), P=52.7 million and(P=82.7 million) in 2016, 2015 and 2014, respectively (see Note 36).
Republic Act (RA) No. 9337Current tax regulations provide that the RCIT rate shall be 30.0% and interest expense allowed asa deductible expense is reduced by 33.0% of interest income subjected to final tax.
The NIRC of 1997 also provides for rules on the imposition of a 2.0% MCIT on the gross incomeas of the end of the taxable year beginning on the fourth taxable year immediately following thetaxable year in which the Company commenced its business operations. Any excess MCIT overthe RCIT can be carried forward on an annual basis and credited against the RCIT for the threeimmediately succeeding taxable years.
Starting July 1, 2008, the Optional Standard Deduction (OSD) equivalent to 40.0% of grossincome may be claimed as an alternative deduction in computing for the RCIT.
Entertainment, Amusement and Recreation (EAR) ExpensesCurrent tax regulations define expenses to be classified as EAR expenses and set a limit for theamount that is deductible for tax purposes. EAR expenses are limited to 0.5% of net sales forsellers of goods or properties or 1.0% of net revenue for sellers of services. For sellers of bothgoods or properties and services, an apportionment formula is used in determining the ceiling onsuch expenses. The Group recognized EAR expenses (included under ‘General and administrativeexpenses’ in profit or loss in the consolidated statements of comprehensive income) amounting toP=198.3 million, P=129.9 million and P=141.4 million in 2016, 2015 and 2014, respectively(see Note 31).
Compositions of the Group’s net deferred tax assets (included in the ‘Other noncurrent assets’ inthe consolidated statements of financial position) follow (see Note 20):
2016 2015Deferred tax assets on:
Unfunded pension liabilities of Foreign subsidiaries P=458,453,212 P=289,635,426Unrealized forex loss 1,408,847,720 1,071,895,759Allowance for impairment losses of receivables and property and equipment 312,572,463 256,190,548MCIT carryforward 350,196,959 225,186,903Net operating loss carry-over 1,588,489,361 1,768,050,781Others 1,239,713,633 1,593,937,660
Total 5,358,273,348 5,204,897,077Deferred tax liabilities on:
Unrealized profit on excess of market value over cost of hog markets (115,563,150) (144,242,195)Double depreciation (2,624,040,175) (2,512,429,449)Others (548,136,705) (217,337,278)
(3,287,740,030) (2,874,008,922)Net deferred tax asset P=2,070,533,318 P=2,330,888,155

- 160 -
*SGVFS023363*
Compositions of the Group’s net deferred tax liabilities reported in the consolidated statements offinancial position follow:
2016 2015Deferred tax assets on:
Unfunded pension benefits P=101,560,016 P=102,248,365Allowance for impairment losses on receivables and property, plant and equipment 14,302,980 14,113,908MCIT carryforward 2,709,020 1,111,424Unrealized foreign exchange loss – 11,295,346Others 688,558,648 680,941,803
Total 807,130,664 809,710,846Deferred tax liabilities on:
Intangibles (3,222,461,373) (1,794,893,453)Unamortized capitalized interest (1,691,225,616) (1,419,649,598)Accelerated depreciation (434,349,328) (331,421,689)Borrowing cost (71,832,394) (71,832,394)Excess of financial GP over taxable GP (1,320,956,069) –Others (1,117,588,169) (2,317,063,748)
(7,858,412,949) (5,934,860,882)Net deferred tax liability (P=7,051,282,285) (P=5,125,150,036)
The following are the temporary differences on which the Group did not recognize deferred taxassets:
2016 2015NOLCO P=2,239,424,709 P=6,218,650,888Allowance for impairment losses 1,613,720,165 3,756,674,974Unrealized loss on AFS 562,948,094 −Unrealized foreign exchange losses 100,702,598 182,395,730Excess MCIT over RCIT 82,770,619 36,421,286Net pension liability 41,076,082 112,664,073Depreciation of investment properties and
repossessed chattels 20,095,457 18,417,284Difference between cost and NRV of inventories 19,346,572 64,488,572Unearned income 15,594,527 9,044,108Unamortized contribution of past service costs 9,165,367 37,192,794Accrued rent 3,556,937 919,372
P=4,708,401,127 P=10,436,869,081
Under Section 11 of R. A. No. 7151 (CAI’s Congressional Franchise) and underSection 15 of R. A. No. 9517 (Cebgo, Inc.’s Congressional Franchise) known as the “ipso factoclause” and the “equality clause”, respectively, the CAI and Cebgo, Inc. are allowed to benefitfrom the tax privileges being enjoyed by competing airlines. CAI’s and Cebgo, Inc.’s majorcompetitor, by virtue of PD No. 1590, is enjoying tax exemptions which are likewise beingclaimed by the CAI and Cebgo, Inc., if applicable, including but not limited to the following:a.) To depreciate its assets to the extent of not more than twice as fast the normal rate of
depreciation; andb.) To carry over as a deduction from taxable income any net loss (NOLCO) incurred in any year
up to five years following the year of such loss.

- 161 -
*SGVFS023363*
Included in the Group’s NOLCO and MCIT are CAI’s NOLCO and MCIT as follows:
NOLCO
Year Incurred Amount Expired/Applied Balance Expiry Year2012 P=1,301,721,876 (P=1,301,721,876) P=– 20172013 956,965,884 (956,965,884) – 20182014 1,361,594,609 (333,410,350) 1,028,184,259 20192015 955,474,545 – 955,474,545 2020
P=4,575,756,914 (P=2,592,098,110) P=1,983,658,804
MCIT
Year Incurred Amount Expired/Applied Balance Expiry Year2013 P=45,518,668 (P=45,518,668) P=– 20162014 61,319,704 – 61,319,704 20172015 117,297,005 – 117,297,005 20182016 148,442,253 – 148,442,253 2019
P=372,577,630 (P=45,518,668) P=327,058,962
Included in the Group’s NOLCO and MCIT is Cebgo, Inc.’s NOLCO and MCIT as follows:
NOLCO
Year Incurred Amount Expired/Applied Balance Expiry Year2011 P=461,346,433 (P=461,346,433) P=– 20162012 1,305,854,856 (199,411,786) 1,106,443,070 20172013 853,571,166 – 853,571,166 20182014 685,506,938 – 685,506,938 2019
P=3,306,279,393 (P=660,758,219) P=2,645,521,174
MCIT
Year Incurred Amount Expired/Applied Balance Expiry Year2015 P=8,632,361 P=– P=8,632,361 20182016 14,152,299 – 14,154,315 2019
P=22,784,660 P=– P=22,786,676
CAI has outstanding registrations with the BOI as a new operator of air transport on a pioneer andnon-pioneer status under the Omnibus Investments Code of 1987 (Executive Order 226).
On the above registrations, the CAI can avail of bonus years in certain specified cases but theaggregate ITH availment (basic and bonus years) shall not exceed eight (8) years.
As of December 31, 2016 and 2015, CAI has complied with externally imposed capitalrequirements set by the BOI in order to avail of the ITH incentives for aircraft of registeredactivity.
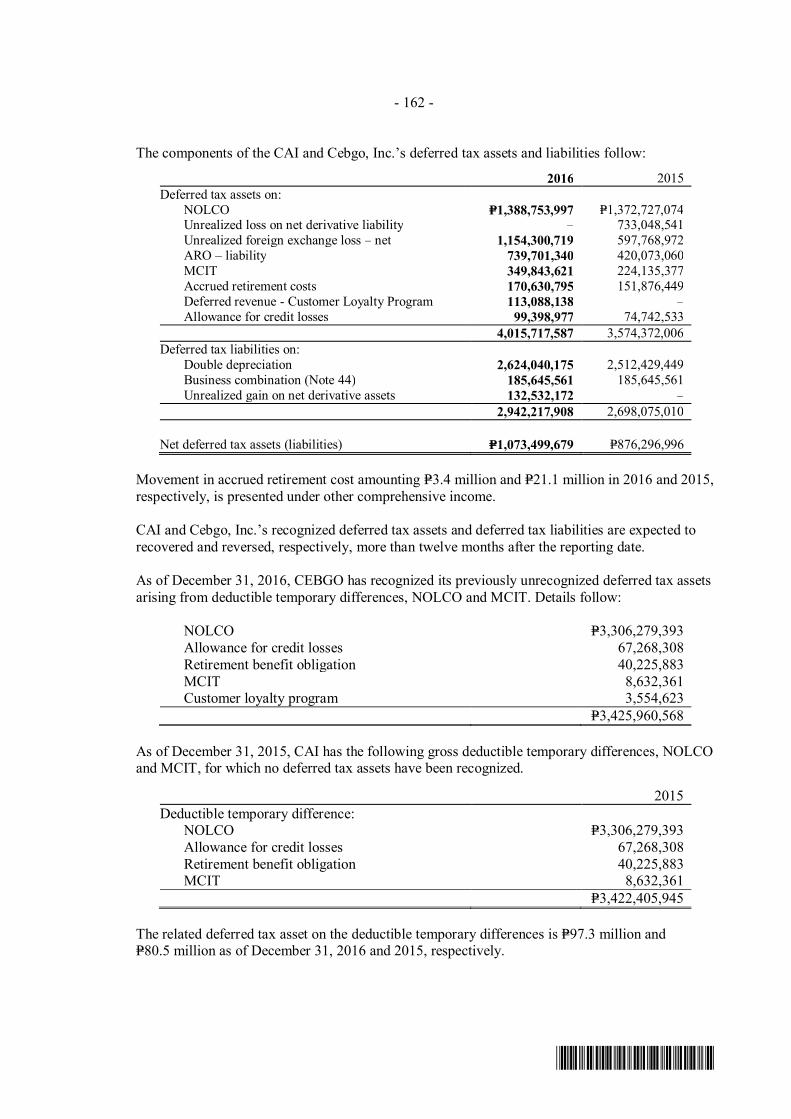
- 162 -
*SGVFS023363*
The components of the CAI and Cebgo, Inc.’s deferred tax assets and liabilities follow:
2016 2015Deferred tax assets on:
NOLCO P=1,388,753,997 P=1,372,727,074Unrealized loss on net derivative liability – 733,048,541Unrealized foreign exchange loss – net 1,154,300,719 597,768,972ARO – liability 739,701,340 420,073,060MCIT 349,843,621 224,135,377Accrued retirement costs 170,630,795 151,876,449Deferred revenue - Customer Loyalty Program 113,088,138 –Allowance for credit losses 99,398,977 74,742,533
4,015,717,587 3,574,372,006Deferred tax liabilities on:
Double depreciation 2,624,040,175 2,512,429,449Business combination (Note 44) 185,645,561 185,645,561Unrealized gain on net derivative assets 132,532,172 –
2,942,217,908 2,698,075,010
Net deferred tax assets (liabilities) P=1,073,499,679 P=876,296,996
Movement in accrued retirement cost amounting P=3.4 million and P=21.1 million in 2016 and 2015,respectively, is presented under other comprehensive income.
CAI and Cebgo, Inc.’s recognized deferred tax assets and deferred tax liabilities are expected torecovered and reversed, respectively, more than twelve months after the reporting date.
As of December 31, 2016, CEBGO has recognized its previously unrecognized deferred tax assetsarising from deductible temporary differences, NOLCO and MCIT. Details follow:
NOLCO P=3,306,279,393Allowance for credit losses 67,268,308Retirement benefit obligation 40,225,883MCIT 8,632,361Customer loyalty program 3,554,623
P=3,425,960,568
As of December 31, 2015, CAI has the following gross deductible temporary differences, NOLCOand MCIT, for which no deferred tax assets have been recognized.
2015Deductible temporary difference:
NOLCO P=3,306,279,393Allowance for credit losses 67,268,308Retirement benefit obligation 40,225,883MCIT 8,632,361
P=3,422,405,945
The related deferred tax asset on the deductible temporary differences is P=97.3 million andP=80.5 million as of December 31, 2016 and 2015, respectively.

- 163 -
*SGVFS023363*
Reconciliation between the Group’s statutory income tax rate and the effective income tax ratefollows:
2016 2015 2014Statutory income tax rate 30.00% 30.00% 30.00%Tax effects of:
Dividend income (2.19) (2.30) (5.03)Equity in net earnings of affiliates (8.82) (5.90) (7.18)Nontaxable income (3.27) (1.55) (3.38)Changes in unrecognized deferred tax assets 3.91 0.12 (0.45)Income subjected to lower tax rates (2.71) (1.41) (0.51)Board of Investments (BOI) tax credits
and others (15.37) (5.45) (0.67)Nondeductible expense 18.94 0.18 0.19Others (0.93) (1.61) 1.73
Effective income tax rate 19.56% 12.08% 14.70%
39. Earnings Per Share
Basic earnings per share is calculated by dividing the net income for the year attributable to equityholders of the Parent Company divided by the weighted average number of common sharesoutstanding during the year (adjusted for any stock dividends).
The following tables reflect the net income and share data used in the basic/dilutive EPScomputations:
Earnings per share attributable to equity holders of the Parent Company
2016 2015 2014Income attributable to equity holders of
the Parent Company P=10,917,978,925 P=22,610,016,306 P=18,245,149,790Less: Dividends on preferred shares
(Note 25) 10,000,000 8,800,000 8,000,000Income attributable to holders of
common shares of the ParentCompany P=10,907,978,925 P=22,601,216,306 P=18,237,149,790
Weighted average number ofcommon shares 7,162,841,657 7,162,841,657 7,017,191,657
Basic/diluted earnings per share P=1.52 P=3.16 P=2.60
There were no potential dilutive common shares in 2016, 2015 and 2014.
40. Related Party Transactions
Parties are considered to be related if one party has the ability, directly or indirectly, to control theother party or exercise significant influence over the other party in making financial and operatingdecisions or if they are subjected to common control or common significant influence. Relatedparties may be individuals or corporate entities. Transactions between related parties are based onterms similar to those offered to non-related parties and are generally settled in cash. Due fromand due to related parties are collectible/payable on demand.

- 164 -
*SGVFS023363*
In addition to the related party information disclosed elsewhere in the consolidated financial statements, the year-end balances in respect of related parties follow:
2016Outstanding Balance
Related Party Category/Transaction Amount/VolumeStatement of
Financial Position
Statement ofComprehensive
Income Terms ConditionsSubsidiaries:
Due from related parties Settlement of advances (P=300,376,218) P=894,987,005 P=− On demand; Non-interest bearing Unsecured;Not impaired
Rent receivable 4,117,582 27,901,283Rent income 178,757,461 − 178,757,461Other income 57,450,321 − 57,450,321Rent expense 34,715,145 − 34,715,145
Due to related parties Advances 444,690,266 14,228,263,539 −On demand; Non-interest bearing
Unsecured;Not impaired
Management fees 102,074,286 − 102,074,286Interest expense − − − Interest bearing
Cash in bank Deposits 105,014 139,700 − On demand UnsecuredCash equivalents Money market placements 313,700,837 313,700,837 − 2 to 41 days; Interest bearing
with interest rate ranging from1.50% to 2.04%
Unsecured
Interest income
446,201 − −
2 to 33 days; Interest bearingwith interest rate ranging from0.5% to 1.5%
Dividends Dividend receivable 52,857,500 208,255,465 − On demand UnsecuredDividend income 5,642,292,262 − 5,642,292,262
Associate:Due from related parties Advances 161,566 469,286 − On demand; Non-interest bearing Unsecured;
Not impairedDividend income 7,666,690,077 − 7,666,690,077Rent income 560,813 − 560,813Rent receivable (46,528) 160,258 −
(Forward)
Utilities expense 7,561,361 − 7,561,361

- 165 -
*SGVFS023363*
2016Outstanding Balance
Related Party Category/Transaction Amount/VolumeStatement of
Financial Position
Statement ofComprehensive
Income Terms ConditionsOther Related Parties:
Due from related parties Settlement of advances (P=1,531,274) P=424,468,802 P=− On demand; Non-interest bearing
Management feesRent income 33,160,257 − 33,160,257
Due to related parties Advances (477,995) P=1,420,177 − On demand; Non-interest bearingUnsecured;Not impaired
Rent receivable 9,749,802 29,594,431 −Director’s fees (included under ‘Management
and other professional fees’ account in theparent company statement ofcomprehensive income)
Expenses 8,440,000 − 8,440,000

- 166 -
*SGVFS023363*
2015Outstanding Balance
Related Party Category/Transaction Amount/VolumeStatement of
Financial Position
Statement ofComprehensive
Income Terms ConditionsSubsidiaries:
Due from related parties Settlement of advances (P=28,416,245) P=1,195,363,224 P=− On demand; Non-interest bearing Unsecured;Not impaired
Rent receivable (6,145,199) 23,783,701Rent income 159,195,209 − 159,195,209Other income 23,474,286 − 23,474,286Rent expense 32,563,971 − 32,563,971
Due to related parties Settlement of advances (4,307,976,057) 13,783,573,273 −On demand; Non-interest bearing
Unsecured;Not impaired
Management fees 108,000,000 − 108,000,000Interest expense 28,234,761 − 28,234,761 Interest bearing
Cash in bank Deposits 19,848 34,686 − On demand UnsecuredCash equivalents Money market placements
− − −
2 to 33 days; Interest bearingwith interest rate ranging from0.5% to 1.5%
Unsecured
Interest income
− − −
2 to 33 days; Interest bearingwith interest rate ranging from0.5% to 1.5%
Dividends Dividend receivable (2,006,918,210) 155,397,965 − On demand UnsecuredDividend income 5,244,375,593 − 5,244,375,593
Associate:Due from related parties Settlement of advances (877,248) 307,720 − On demand; Non-interest bearing Unsecured;
Not impairedDividend income 4,661,763,305 − 4,661,763,305Rent income 507,732 − 507,732Rent receivable 206,785 206,786Utilities expense 7,232,952 − 7,232,952
Other Related Parties:Due from related parties Advances 78,355,034 426,000,076 − On demand; Non-interest bearing
Management feesRent income 35,171,374 − 35,171,374
(Forward) Unsecured;

- 167 -
*SGVFS023363*
2015Outstanding Balance
Related Party Category/Transaction Amount/VolumeStatement of
Financial Position
Statement ofComprehensive
Income Terms Conditions
Due to related parties Advances (P=1,687,715,748) P=1,898,172 P=− On demand; Non-interest bearingNot impaired
Rent receivable 6,902,049 19,844,629Interest expense 426,697 − 426,697
Director’s fees (included under ‘Managementand other professional fees’ account in theparent company statement ofcomprehensive income)
Expenses 7,745,000 − 7,745,000
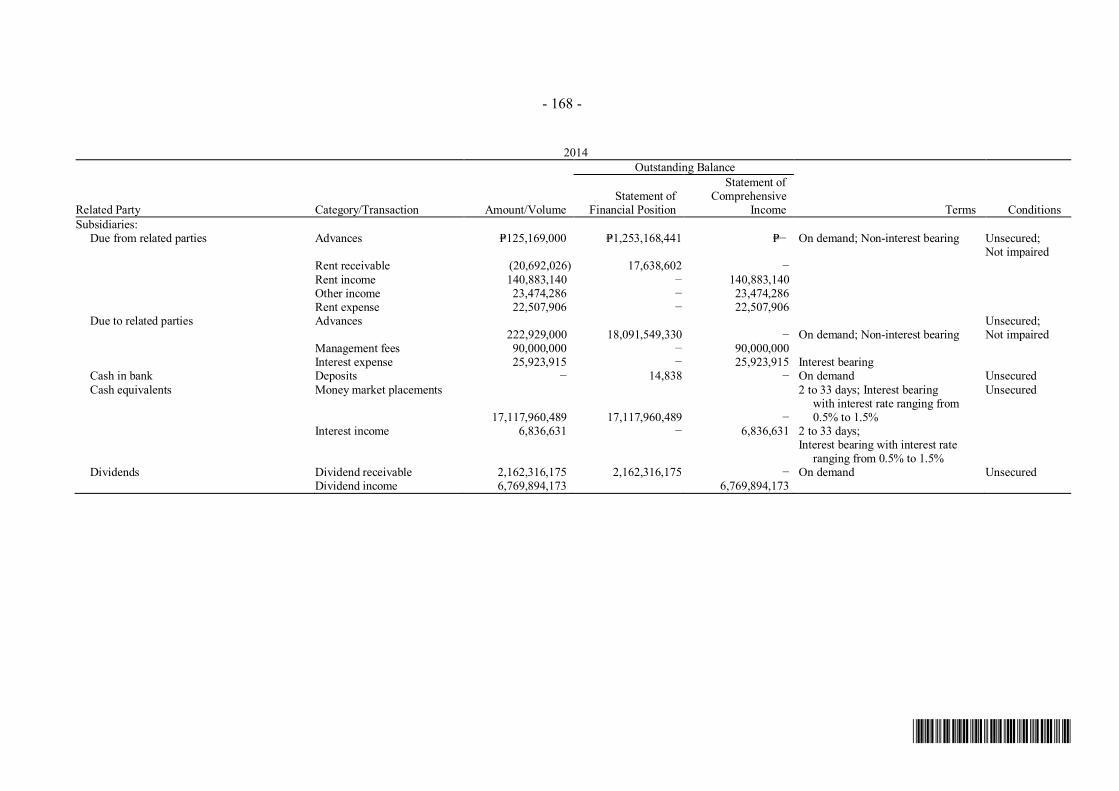
- 168 -
*SGVFS023363*
2014Outstanding Balance
Related Party Category/Transaction Amount/VolumeStatement of
Financial Position
Statement ofComprehensive
Income Terms ConditionsSubsidiaries:
Due from related parties Advances P=125,169,000 P=1,253,168,441 P=− On demand; Non-interest bearing Unsecured;Not impaired
Rent receivable (20,692,026) 17,638,602 −Rent income 140,883,140 − 140,883,140Other income 23,474,286 − 23,474,286Rent expense 22,507,906 − 22,507,906
Due to related parties Advances222,929,000 18,091,549,330 − On demand; Non-interest bearing
Unsecured;Not impaired
Management fees 90,000,000 − 90,000,000Interest expense 25,923,915 − 25,923,915 Interest bearing
Cash in bank Deposits − 14,838 − On demand UnsecuredCash equivalents Money market placements
17,117,960,489 17,117,960,489 −
2 to 33 days; Interest bearingwith interest rate ranging from0.5% to 1.5%
Unsecured
Interest income 6,836,631 − 6,836,631 2 to 33 days;Interest bearing with interest rate
ranging from 0.5% to 1.5%Dividends Dividend receivable 2,162,316,175 2,162,316,175 − On demand Unsecured
Dividend income 6,769,894,173 6,769,894,173

- 169 -
*SGVFS023363*
2014Outstanding Balance
Related Party Category/Transaction Amount/VolumeStatement of
Financial Position
Statement ofComprehensive
Income Terms ConditionsAssociate:
Due from related parties Advances P=− P=1,184,968 P=− On demand; Non-interest bearing Unsecured;Not impaired
Dividend income 3,778,320,947 − 3,778,320,947Rent income 138,472 − 138,472Utilities expense 4,069,306 − 4,069,306
Other Related Parties:Due from related parties Advances − 334,228,711 − On demand; Non-interest bearing
Management fees 14,195,768 − 14,195,768Rent income 33,162,761 − 33,162,761
Due to related parties Advances − 1,689,064,098 − On demand; Non-interest bearingUnsecured;Not impaired
Rent receivable (9,542,834) 12,942,580Interest expense 3,527,870 − 3,527,870
Director’s fees (included under ‘Managementand other professional fees’ account in theparent company statement ofcomprehensive income)
Expenses 4,845,000 − 4,845,000

- 170 -
*SGVFS023363*
The Parent Company has signed various financial guarantee agreements with third parties for theshort-term and long-term loans availed by its subsidiaries as discussed in Note 23 to theconsolidated financial statements. No fees are charged for these guarantee agreements. Being thecentralized treasury department within the Group, the Parent Company usually receives advancesfrom subsidiaries and in turn, makes advances to other subsidiaries.
Interest earned by the Parent Company on transactions with related parties amounted tonil in 2016 and 2015. Interest expense incurred amounted to nil in 2016, P=32.1 million in 2015and P=29.5 million in 2014.
Most of the aforementioned intercompany transactions between the Parent Company and itssubsidiaries are eliminated in the accompanying consolidated financial statements.
Transactions with the retirement planThe retirement fund of the Parent Company’s employees amounted to P=9.8 billion and P=9.5 billionas of December 31, 2016 and 2015, respectively. The fund is being managed by JG Summit Multi-Employer Retirement Plan (MERP), a corporation created for the purpose of managing the fundsof the Group, with RBC as the trustee.
2015Outstanding Balance
Category /Transaction
Amount /Volume
Statement ofFinancialPosition
Statement ofComprehensive
Income Terms ConditionsDue to retirement plan Advances (P=1,661,322,453) P=-− P=28,203,089 1 to 32 days;
Interest bearing withinterest rates rangingfrom 0.4% to 3.75%
Unsecured
The retirement plan under the MERP has an Executive Retirement Committee, that is mandated toapprove the plan, trust agreement, investment plan, including any amendments or modificationsthereto, and other activities of the plan. Certain members of the BOD of the Parent Company arerepresented in the Executive Retirement Committee. RBC manages the plan based on the mandateas defined in the trust agreement.
Compensation of key management personnelThere are no agreements between the Group and any of its directors and key officers providing forbenefits upon termination of employment, except for such benefits to which they may be entitledunder the Group’s pension plans.
The compensation of the Group’s key management personnel by benefit type follows:
2016 2015 2014Short-term employee benefits P=1,479,668,656 P=1,373,236,381 P=1,214,321,181Post-employment benefits 131,512,625 119,520,583 110,107,632
P=1,611,181,281 P=1,492,756,964 P=1,324,428,813

- 171 -
*SGVFS023363*
41. Registration with Government Authorities/Franchise
Certain operations of consolidated subsidiaries are registered with the BOI as preferred pioneerand non-pioneer activities, and are granted various authorizations from certain governmentauthorities. As registered enterprises, these consolidated subsidiaries are subject to somerequirements and are entitled to certain tax and non-tax incentives which are considered in thecomputation of the provision for income tax.
42. Leases
URCOperating Lease Commitments - Group as a LesseeThe URC Group land where certain of its facilities are located. The operating lease agreementsare for periods ranging from one to five years from the date of the contracts and are renewableunder certain terms and conditions. URC’s rentals incurred on these leases (included under‘Selling and distribution costs’ and ‘General and administrative expenses’ in the consolidatedstatements of comprehensive income) amounted to P=395.6 million, P=179.0 million and P=161.1million in 2016, 2015 and 2014, respectively.
Future minimum lease payments under noncancellable operating leases of the URC Group follow:
2016 2015 2014Within one year P=183,546,225 P=75,583,986 P=71,984,748After one year but not more than
five years 734,184,901 302,335,942 287,938,993Five years or more 520,915,202 − −
P=1,438,646,328 P=377,919,928 P=359,923,741
Operating Lease Commitments - Group as a LessorThe URC Group has entered into one-year renewable, noncancellable leases with various relatedparties covering certain land and buildings where office spaces are located.
Total rental income earned from investment properties (included under ‘Others’ in profit or loss inthe consolidated statements of comprehensive income) amounted to P=69.6 million, P=50.6 millionand P=57.2 million in 2016, 2015 and 2014, respectively. Direct operating expenses (includedunder ‘General and administrative expenses ‘in profit or loss in the consolidated statements ofcomprehensive income) arising from investment properties amounted to P=0.9 million in 2016,2015 and 2014.
Future minimum lease receivables under noncancellable operating leases of the URC Group thatare due within one year amounted to P=61.1 million, P=51.4 million and P=56.8 million in 2016, 2015and 2014, respectively.
Finance Lease Commitments - Group as a LesseeSome of the URC Group’s subsidiaries were granted land usage rights from private entities. Theland usage right represents the prepaid amount of land lease payments. The right is currentlybeing amortized by the URC Group on a straight-line basis over the term of the right ranging from30 to 50 years. The amortization on these leases (included under ‘General and administrativeexpenses’ in the consolidated statements of comprehensive income) amounted to P=34.1 million,P=22.5 million and P=23.3 million in 2016, 2015 and 2014, respectively.

- 172 -
*SGVFS023363*
RLCOperating Lease Commitments - Group as a LesseeThe RLC Group entered into long-term operating leases of land with lease terms ranging from25 to 50 years. These leases include clauses to enable escalation of rental charges on the agreeddates. Total rent expense (included under ‘General and administrative expenses’ in profit or lossin the consolidated statements of comprehensive income) amounted to P=203.4 million,P=203.9 million and P=153.0 million in 2016, 2015 and 2014, respectively.
Future minimum lease payments under noncancellable operating leases of RLC’s certain lesseesubsidiaries follow:
2016 2015 2014Within one year P=85,742,828 P=75,875,322 P=60,225,464After one year but not more than
five years 404,875,129 382,304,085 274,917,570Over five years 6,389,039,513 6,472,894,986 5,477,062,851
P=6,879,657,470 P=6,931,074,393 P=5,812,205,885
Operating Lease Commitments - Group as a LessorThe RLC Group has entered into commercial property leases on its investment property portfolio.These noncancellable leases have remaining lease terms of between one and ten years. All leasesinclude a clause to enable upward revision of the rental charge on an annual basis based onprevailing market conditions. The lease contracts also provide for the percentage rent, which is acertain percentage of actual monthly sales or minimum monthly gross sales, whichever is higher.Total rent income (included under ‘Real estate and hotels revenue’ in profit or loss in the consolidatedstatements of comprehensive income) amounted to P=10.7 billion, P=9.6 billion and P=8.2 billion in2016, 2015 and 2014, respectively. Total percentage rent recognized as income amounted toP=2.8 billion, P=2.5 billion and P=2.2 billion in 2016, 2015 and 2014, respectively.
Future minimum lease receivables under noncancellable operating leases of the RLC Groupfollow:
2016 2015 2014Within one year P=4,909,033,101 P=5,308,666,374 P=4,252,470,638After one year but not more than
five years 8,407,304,291 10,472,321,498 5,915,813,342Over five years 941,463,464 1,024,342,237 437,292,732
P=14,257,800,856 P=16,805,330,109 P=10,605,576,712
Finance Lease Commitments - Group as a LessorIn 2015, RLC has significantly entered into residential property leases on its residentialcondominium unit’s portfolio. These leases have lease period of five (5) to ten (10) years and thelessee is given the right to purchase the property anytime within the lease period that the lesseeany arrears in rental payment, condominium dues and other charges.

- 173 -
*SGVFS023363*
Future minimum lease payments under finance lease with the present value of future minimumlease payment as of December 31, 2016 follow:
2016
Minimum LeasePayments
Present Value ofMinimum Lease
PaymentsWithin one year 1,666,378,049 1,633,532,609After one year but not more than five years 753,609,549 683,817,209Over five years 8,495,591 7,107,586Total minimum lease payments 2,428,483,189 2,324,457,404
JGSPCOperating Lease Commitments – Company as a LesseeJGSPC has entered into contracts of lease for its Cybergate office and the shuttle bus thattransports its employees from Balagtas to Batangas plant with lease term of three years and oneyear, respectively. Rental expense charged to operations (included under ‘Cost of sales andservices’ and ‘General and administrative expenses’ in profit or loss in the consolidated statementsof comprehensive income) amounted to P=31.3 million, P=28.5 million and P=29.5 million in 2016,2015 and 2014, respectively.
Future minimum lease payments under the noncancellable lease of JGSPC’s office space follow:
2016 2015 2014Within one year P=16,523,039 P=11,090,677 P=9,386,226After one year but not more than
five years 30,628,459 29,388,722 12,633,062P=47,151,498 P=40,479,399 P=22,019,288
Operating Lease Commitments - Group as a LessorJGSPC has entered into commercial property leases. JGSPC has determined that it retains all thesignificant risks and rewards of ownership of these properties and accounts for them as operatingleases.
Future minimum rentals under noncancellable operating lease of JGSPC follow:
2016 2015Within one year P=158,615 P=107,729After one year but not more than five years 108,869 220,013
P=267,484 P=327,742
CAIOperating Aircraft Lease Commitments - Group as a LesseeCAI entered into operating lease agreements with certain leasing companies which cover thefollowing aircraft:

- 174 -
*SGVFS023363*
A320 aircraftThe following table summarizes the specific lease agreements on CAI’s Airbus A320 aircraft:
Date of LeaseAgreement Lessors
No. ofUnits Lease Term
April 2007 Inishcrean Leasing Limited (Inishcrean) 1 October 2019March 2008 GY Aviation Lease 0905 Co. Limited 2 January 2019March 2008 APTREE Aviation Trading 2 Co. Ltd 1 October 2019
Wells Fargo Bank Northwest National Assoc. 1 October 2019July 2011 SMBC Aviation Capital Limited 2 February 2018Note: The lease agreements were amended, when applicable, to effect the novation of lease rights by the original lessorsto new lessors as allowed under the lease agreements.
In 2007, CAI entered into operating lease agreement with Inishcrean for the lease of one AirbusA320, which was delivered in 2007, and with CIT Aerospace International for the lease of fourAirbus A320 aircraft, which were delivered in 2008. In 2015, CAI extended the lease agreementwith Inishcrean for another three years.
In March 2008, CAI entered into operating lease agreements for the lease of two Airbus A320aircraft, which were delivered in 2009, and two Airbus A320 aircraft which were received in 2012.In November 2010, CAI signed an amendment to the operating lease agreements, advancing thedelivery of the two Airbus A320 aircraft to 2011 from 2012. The leases with GY Aviation Lease0905 Co. Limited maturity date reflects an intended extension for another two years pursuant to aletter of intent (LOI) signed in the first quarter of 2016.
In July 2011, CAI entered into an operating lease agreement with RBS Aerospace Ltd. (RBS) forthe lease of two Airbus A320 aircraft, which were delivered in March 2012. The lease agreementwith RBS was amended to effect the novation of lease rights by the original lessors to new lessorsas allowed under the existing lease agreements.
Airbus A330 aircraftThe following table summarizes the specific lease agreements on CAI’s Airbus A330 aircraft:
Date of Lease Agreement Lessors No. of Units Lease TermFebruary 2012 CIT Aerospace International 4 12 years with pre-termination
optionJuly 2013 A330 MSN 1552 Limited and A330
MSN 1602 Limited*2 12 years with pre-termination
option*New lessors per Deed of Novation and Amendment signed on August 2014 and March 2015
On February 21, 2012, CAI entered into a lease agreement with CIT Aerospace International forfour Airbus A330-300 aircraft. The lease term of the aircraft is 12 years with an early pre-termination option.
On July 19, 2013, the Group entered into an aircraft operating lease agreements with IntrepidAviation for the lease of two Airbus A330-300 aircraft, which were delivered inSeptember 2014 and March 2015.
As of December 31, 2016, CAI has six (6) Airbus A330 aircraft under operating lease(Note 16), wherein one Airbus was delivered in 2015.

- 175 -
*SGVFS023363*
The first two A330 aircraft were delivered in June 2013 and September 2013. Three A330 aircraftwere delivered in February 2014, May 2014 and September 2014. One A330 aircraft wasdelivered in March 2015.
Future minimum lease payments under the above-indicated operating aircraft leases follow:
2016 2015 2014
US dollarPhilippine peso
equivalent US dollarPhilippine peso
equivalent US dollarPhilippine peso
equivalentWithin one year US$88,821,146 P=4,416,187,364 US$90,260,208 P=4,247,645,406 US$88,551,265 P=3,960,012,577After one year but not more
than five years 345,847,247 17,195,525,129 309,193,470 14,550,644,708 314,017,649 14,042,869,274Over five years 206,018,543 10,243,241,938 332,977,141 15,669,904,258 395,380,828 17,681,430,645
US$640,686,936 P=31,854,954,431 US$732,430,819 P=34,468,194,372 US$797,949,742 P=35,684,312,496
Lease expenses relating to aircraft leases (included in ‘General and administrative expenses’ inprofit or loss in the consolidated statements of comprehensive income) amounted to P=4.3 billion,P=4.0 billion and P=3.5 billion in 2016, 2015 and 2014, respectively (see Note 31).
Operating Non-Aircraft Lease Commitments - Group as a LesseeCAI has entered into various lease agreements for its hangar, office spaces, ticketing stations andcertain equipment. These leases have remaining lease terms ranging from one to ten years.Certain leases include a clause to enable upward revision of the annual rental charge ranging from5.0% to 10.0%.
Future minimum lease payments under these noncancellable operating leases of CAI follow:
2016 2015 2014Within one year P=167,226,528 P=135,299,739 P=127,970,825After one year but not more than
five years 710,187,772 564,977,120 539,700,300Over five years 3,477,917,440 2,433,712,858 2,065,948,495
P=4,355,331,740 P=3,133,989,717 P=2,733,619,620
Lease expenses relating to both cancellable and non-cancellable non-aircraft leases (allocatedunder different expense accounts in the consolidated statements of comprehensive income)amounted to P=625.8 million, P=488.6 million and P=337.1 million in 2016, 2015 and 2014,respectively.
RBC and LSBOperating Lease Commitments - Group as a LesseeRBC and LSB lease its head office and branch premises for periods ranging from one to ten years,renewable upon mutual agreement of both parties. Various lease contracts include escalationclauses, most of which bear annual rent increase ranging from 5.0% to 10.0%. Rent expenserecognized by RBC and LSB (included under ‘General and administrative expenses’ in profit orloss in the consolidated statements of comprehensive income) amounted to P=274.3 million,P=228.31 million and P=187.6 million in 2016, 2015 and 2014, respectively.

- 176 -
*SGVFS023363*
Future minimum lease payments under these noncancellable operating leases of RBC and LSBfollow:
2016 2015 2014Within one year P=252,450,190 P=212,898,691 P=155,319,477After one year but not more than
five years 496,308,714 476,759,239 406,835,950Over five years 7,789,314 34,966,519 45,394,754
P=756,548,218 P=724,624,449 P=607,550,181
43. Other Commitments and Contingent Liabilities
Parent CompanyOn May 4, 2012, the BOD of the Parent Company approved and authorized the Parent Companyto act as surety with respect to the credit accommodation of JGSOC from Banco de Oro Unibank,Inc. in the aggregate principal amount of P=1.0 billion, including the extensions, renewals ormodifications of such credit accommodation.
On February 4, 2014, the BOD of the Parent Company approved and authorized the ParentCompany to guarantee the loan/credit accommodation of JGSOC from Banco de Oro Unibank,Inc. in the aggregate principal amount of P=9.0 billion, including the extensions, renewals ormodifications of such loan/credit accommodation.
On May 8, 2014, the BOD of the Parent Company approved and authorized the Parent Companyto guarantee the loan/credit accommodation of JGSPC from Banco de Oro Unibank, Inc. in theaggregate principal amount of P=4.0 billion, including the extensions, renewals, or modifications ofsuch loan/credit accommodation.
RLCCapital CommitmentsRLC has contractual commitments and obligations for the construction and development ofinvestment properties and property and equipment items aggregating P=16.9 million, P=8.2 millionand P=11.6 million as of December 31, 2016, 2015 and 2014, respectively. Moreover, RLC hascontractual obligations amounting to P=1.2 million and P=1.3 million as of December 31, 2016 and2015, respectively, for the completion and delivery of real estate units that have been presold.
CAICapital Expenditure CommitmentsCAI's capital expenditure commitments relate principally to the acquisition of aircraft fleet,aggregating to P=114.3 billion and P=93.8 billion as of December 31, 2016 and 2015, respectively,which are payable over the following periods:
December 31, 2016 December 31, 2015
US DollarPhilippine Peso
Equivalent US DollarPhilippine Peso
EquivalentWithin one year US$483,178,223 P=24,023,621,236 US$294,434,836 P=13,856,103,384After one year but not more
than five years 1,886,172,565 93,780,499,949 1,698,714,532 79,941,505,899US$2,369,350,788 P=117,804,121,185 US$1,993,149,368 P=93,797,609,283

- 177 -
*SGVFS023363*
Aircraft and Spare Engine Purchase CommitmentsIn 2007, CAI entered into a purchase agreement with Airbus S.A.S covering the purchase of tenA320 aircraft and the right to purchase five option aircraft.
In 2009, CAI exercised its option to purchase the five additional aircraft. Further, an amendmentto the purchase agreement was executed, which provided CAI the right to purchase up to fiveadditional option aircraft.
In 2010, CAI exercised its option to purchase five additional option Airbus A320 aircraft andentered into a new commitment to purchase two Airbus A320 aircraft to be delivered between2011 and 2014. Six of these aircraft were delivered between September 2011 andDecember 2013.
On May 2011, CAI turned into firm orders its existing options for the seven Airbus A320 aircraftwhich are scheduled to be delivered in 2015 to 2016.
On August 2011, CAI entered in a new commitment to purchase firm orders of thirty new A321NEO Aircraft and ten addition option orders. These aircraft are scheduled to be delivered from2017 to 2021.
On June 28, 2012, CAI has entered into an agreement with United Technologies InternationalCorporation Pratt & Whitney Division to purchase new PurePower® PW1100G-JM engines for its30 firm and ten options A321 NEO aircraft to be delivered beginning 2017. The agreement alsoincludes an engine maintenance services program for a period of ten years from the date of entryinto service of each engine.
On October 20, 2015 CAI entered into a Sale and Purchase Contract with Avions TransportRegional G.I.E. to purchase 16 firm ATR 72-600 aircraft and up to 10 additional optionATR 72-600 aircraft. These aircraft are scheduled to be delivered from 2016 to 2020.
As of December 31, 2016, the Group will take delivery of 30 Airbus A321 NEO aircraft and 14ATR 72-600.
The above-indicated commitments relate to the Group’s re-fleeting and expansion programs.These agreements remained in effect as of December 31, 2016.
Service Maintenance CommitmentsOn June 21, 2012, CAI has entered into an agreement with Messier-Bugatti-Dowty (Safran group)to purchase wheels and brakes for its fleet of Airbus A319 and A320 aircraft. The contract coversthe current fleet, as well as future aircraft to be acquired.
On June 22, 2012, CAI has entered into service contract with Rolls-Royce Total Care ServicesLimited (Rolls-Royce) for service support for the engines of the A330 aircraft. Rolls-Royce willprovide long-term Total Care service support for the Trent 700 engines on up to eight A330aircraft. Contract term shall be from delivery of the first A330 until the redeliveey of the lastA330.
On July 12, 2012, the Company has entered into a maintenance service contract with SIAEngineering Co. Ltd. for the maintenance, repair and overhaul services of its A319 and A320aircraft. Specific services from SIAEC are Base Maintenance, Fleet Technical Management(FTM), Inventory Technical Management (ITM) and C&E for Line Maintenance Services for theA319 and A320.
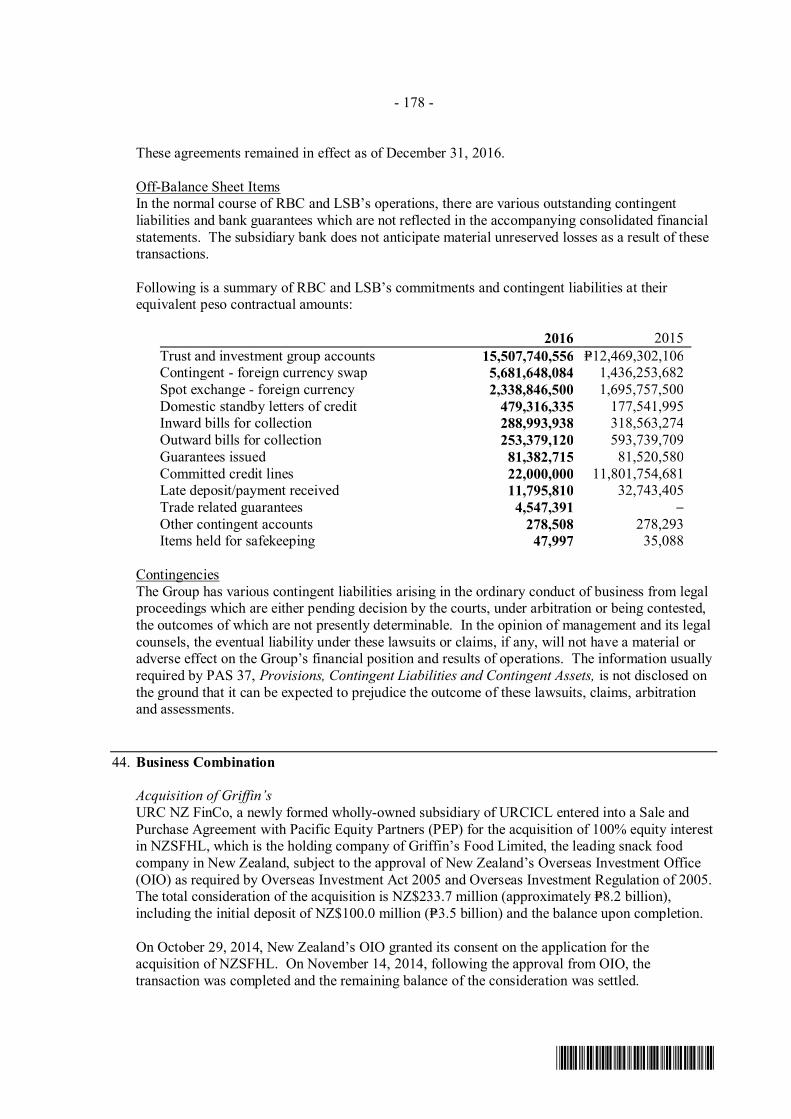
- 178 -
*SGVFS023363*
These agreements remained in effect as of December 31, 2016.
Off-Balance Sheet ItemsIn the normal course of RBC and LSB’s operations, there are various outstanding contingentliabilities and bank guarantees which are not reflected in the accompanying consolidated financialstatements. The subsidiary bank does not anticipate material unreserved losses as a result of thesetransactions.
Following is a summary of RBC and LSB’s commitments and contingent liabilities at theirequivalent peso contractual amounts:
2016 2015Trust and investment group accounts 15,507,740,556 P=12,469,302,106Contingent - foreign currency swap 5,681,648,084 1,436,253,682Spot exchange - foreign currency 2,338,846,500 1,695,757,500Domestic standby letters of credit 479,316,335 177,541,995Inward bills for collection 288,993,938 318,563,274Outward bills for collection 253,379,120 593,739,709Guarantees issued 81,382,715 81,520,580Committed credit lines 22,000,000 11,801,754,681Late deposit/payment received 11,795,810 32,743,405Trade related guarantees 4,547,391 −Other contingent accounts 278,508 278,293Items held for safekeeping 47,997 35,088
ContingenciesThe Group has various contingent liabilities arising in the ordinary conduct of business from legalproceedings which are either pending decision by the courts, under arbitration or being contested,the outcomes of which are not presently determinable. In the opinion of management and its legalcounsels, the eventual liability under these lawsuits or claims, if any, will not have a material oradverse effect on the Group’s financial position and results of operations. The information usuallyrequired by PAS 37, Provisions, Contingent Liabilities and Contingent Assets, is not disclosed onthe ground that it can be expected to prejudice the outcome of these lawsuits, claims, arbitrationand assessments.
44. Business Combination
Acquisition of Griffin’sURC NZ FinCo, a newly formed wholly-owned subsidiary of URCICL entered into a Sale andPurchase Agreement with Pacific Equity Partners (PEP) for the acquisition of 100% equity interestin NZSFHL, which is the holding company of Griffin’s Food Limited, the leading snack foodcompany in New Zealand, subject to the approval of New Zealand’s Overseas Investment Office(OIO) as required by Overseas Investment Act 2005 and Overseas Investment Regulation of 2005.The total consideration of the acquisition is NZ$233.7 million (approximately P=8.2 billion),including the initial deposit of NZ$100.0 million (P=3.5 billion) and the balance upon completion.
On October 29, 2014, New Zealand’s OIO granted its consent on the application for theacquisition of NZSFHL. On November 14, 2014, following the approval from OIO, thetransaction was completed and the remaining balance of the consideration was settled.

- 179 -
*SGVFS023363*
URC engaged a third party valuer to conduct the final purchase price allocation. In 2014, theaccounting for the business combination in the Group’s consolidated financial statements wasdetermined provisionally as URC has to finalize the information with respect to the recognition ofthe fair value of identifiable assets and liabilities and deferred income tax assets and liabilitiesarising from the acquisition.
In 2015, the fair values of the assets and liabilities of NZSFHL at the date of acquisition werefinalized as follow:
Purchase consideration transferred P=8,152,809,497Fair value of identifiable assets
Cash and cash equivalents P=1,066,628,343Trade receivables 2,022,403,012Inventories 1,500,415,759Property, plant and equipment 4,365,177,575Intangibles 6,865,982,527Total Assets 15,820,607,216
Fair value of identifiable liabilitiesTrade payables (2,889,821,951)Deferred tax liability (2,303,077,210)Income tax liability (1,020,200)External bank debt (16,387,274,619)Total Liabilities (21,581,193,980)
Total fair value of identifiable net liabilities (5,760,586,764)Goodwill P=13,913,396,261
Had the acquisition been made on January 1, 2014, total sales of the Group would have beenP=191.0 billion and net income attributable to equity holders of the Parent Company would havebeen P=21.7 billion in 2014.
Acquisition of Cebgo, Inc.As part of the strategic alliance between the CAI and Tiger Airways Holding Limited (TAH), onFebruary 10, 2014, the CAI signed a Sale and Purchase Agreement (SPA) to acquire 100.0% ofCebgo, Inc. Under the terms of the SPA, closing of the transaction is subject to the satisfaction orwaiver of each of the conditions contained in the SPA. On March 20, 2014, all the conditionsprecedent has been satisfactorily completed. The CAI has paid the purchase price covering thetransfer of shares from TAH. Consequently, CAI gained control of Cebgo on the same date. Thetotal consideration for the transaction amounted to P=265.1 million.
The fair values of the identifiable assets and liabilities of Cebgo, Inc. at the date of acquisitionfollow:
Fair Valuerecognized in
the acquisitionTotal cash, receivables and other assets P=1,234,084,305Total accounts payable, accrued expenses and
unearned income 1,535,756,691Net liabilities (301,672,386)Goodwill 566,781,533Acquisition cost at post-closing settlement date P=265,109,147

- 180 -
*SGVFS023363*
From the date of acquisition up to December 31, 2014, CAI’s share in Cebgo’s revenue and netloss amounted to P=2.8 billion and P=159.8 million, respectively. If the combination had taken placeat the beginning of the year in 2014, the CAI’s share in Cebgo’s total sales and net loss wouldhave been P=3.8 billion and P=1.4 billion, respectively.
In February 2015, CAI reached an agreement with ROAR II on the settlement of post-closingadjustments amounting to P=223.5 million pursuant to the SPA. Such amount was received by CAIin 2015 and is accounted for as an adjustment to the purchase price. Total purchase price afterclosing settlement date amounted to P=488.6 million.
Acquisition of Balayan Sugar MillOn February 4, 2016, URC entered into an Asset Purchase Agreement with Batangas Sugar Mill,Inc. (BSCI) for the acquisition of Balayan sugar mill for a total consideration of P=1.6 billion.URC engaged the services of a third party valuer to conduct the final purchase price allocation.
The fair values of the identifiable net assets at the date of acquisition follow:
Purchase consideration transferred P=1,600,000,000Fair value of identifiable net assets
Inventories 264,000,000Property, plant and equipment (Note 16) 1,323,590,374
Total fair value of identifiable net assets 1,587,590,374Goodwill P=12,409,626
From the date of acquisition, the Balayan sugar mill has contributed net sales of P=636.7 millionand net income of P=85.2 million to the Group. If the business combination had taken place at thebeginning of 2016, net sales and net income of the Group in 2016 would have been P=240.6 billionand P=22.4 billion, respectively.
Acquisition of Snack Brands AustraliaOn August 16, 2016, URC AU FinCo, a wholly-owned subsidiary of URCICL, entered into aShare Sale Agreement with Toccara Securities Pty Ltd and Hopkins Securities Pty Ltd for theacquisition of 100% equity interest in CSPL, which trades under the company name Snack BrandsAustralia (SBA), one of the leading snack food companies in Australia, subject to the approval ofthe Australian Foreign Investment Review Board (FIRB). The total consideration of theacquisition is approximately AU$584.5 million (P=21.6 billion).
On September 14, 2016, the Australian FIRB approved the acquisition of SBA. Following theapproval, the transaction was completed on September 30, 2016.
The Group engaged the services of a third party valuer to conduct the final purchase priceallocation.
The fair values of the identifiable assets and liabilities of CSPL at the date of acquisition follow:
Purchase consideration transferred P=21,579,202,907Fair value of identifiable assets
Cash P=419,944,622Receivables 1,608,193,555Inventories 369,121,737Other current assets 68,764,464
(Forward)

- 181 -
*SGVFS023363*
Property, plant and equipment (Note 16) P=2,371,469,678Intangibles (Note 18) 4,681,269,034Deferred tax assets 310,964,989Total Assets 9,829,728,079
Fair value of identifiable liabilitiesAccounts payable and other accrued liabilities 3,103,596,275Deferred tax liabilities 1,514,713,029Other noncurrent assets 125,070,200Total Liabilities 4,743,379,504Total fair value of identifiable net liabilities 5,086,348,575
Goodwill P=16,492,854,332
Goodwill arising from the acquisition of AU Group is allocated entirely to the operations of SnackBrands. None of the goodwill recognized is expected to be deductible for income tax purposes.From the date of acquisition, the AU Group has contributed net sales of P=2.6 billion and netincome of P=0.3 billion to the Group. If the business combination had taken place at the beginningof the year, net sales and net income of the Group in 2016 would have been P=248.3 billion andP=22.4 billion, respectively.
45. Subsequent Events
The following non-adjusting events happened subsequent to the respective reporting dates of theParent Company and its subsidiaries:
∂ On March 10, 2017, CAI entered into a novation agreement with DVB Bank SE SingaporeBranch, in order to amend the terms of the lease agreements for two (2) Airbus A320 aircraftheld under ILL.
∂ On February 2017, the Parent Company subscribed to 2,499,989 shares of MerbauCorporation (Merbau).
∂ In 2017, HTM investments of the Bank amounting to P=10.0 million matured. The remainingHTM amounting to P=300.0 million with maturity date on January 24, 2024 was disposed bythe Bank in 2017. The ‘gain and disposal of the HTM investments’ recorded under ‘Tradinggains or losses - HTM’ amounted to P=8.9 million. As a result of this transaction, the Bank istainted and thus, not allowed to classify any financial assets under HTM category untilDecember 31, 2019.
46. Supplemental Disclosures to Cash Flow Statements
In 2016, the total cash paid, net of cash received from the Group’s acquisition of subsidiariesamounted to P=21.2 billion (see Note 44).

- 182 -
*SGVFS023363*
In 2014, the total cash paid, net of cash received from the Group’s acquisition of subsidiariesamounted to P=7.3 billion (see Note 44). Details are as follows:
Acquisition of NZSFHL net of cash acquired of P=1.1 billion P=7,086,181,154Acquisition of Cebgo’s net of cash acquired of P=256.7 million 231,837,148Total cash paid for the acquisition of subsidiaries P=7,318,018,302
The principal noncash activities of the Group are as follows:
a. On December 31, 2015 the Group recognized a liability based on the schedule of pre-deliverypayments amounting to P=482.0 million. These incurred costs are recognized under the‘Property, Plant, and Equipment – Construction-in progress’ account. The liability was paidthe following year.
b. In 2014, CAI paid P=488.6 million for the acquisition of CEBGO. Cash flows used to acquireCEBGO, after the cash attributable to the business combination of P=256.7 million, amountedto P=231.8 million.
c. Movements in the cumulative translation adjustment amounted to (P=1.9 billion),P=1.7 billion and P=55.1 million in 2016, 2015 and 2014, respectively.
d. In 2016, 2015 and 2014, the Group foreclosed some assets, which are recorded under‘Investment properties’ in the consolidated statements of financial position, amounting toP=91.4 million, P=65.4 million and P=30.1 million, respectively.
e. In 2016, 2015 and 2014, the Group acquired additional investment in UICL through the scriptdividend schemed in lieu of cash dividends amounting to P=529.9 million, P=510.0 million andP=542.0 million respectively.
47. Approval for the Release of the Consolidated Financial Statements
The accompanying consolidated financial statements of the Group were approved and authorizedfor issue by the BOD on March 30, 2017.


- 286 -
JG SUMMIT HOLDINGS, INC.
SUPPLEMENTARY SCHEDULE OF RETAINED EARNINGS
AVAILABLE FOR DIVIDEND DECLARATION
AS OF DECEMBER 31, 2016
The table below presents the retained earnings available for dividend declaration as of
December 31, 2016:
Unappropriated Retained Earnings, beginning P=8,721,359,991
Net loss during the year (1,736,299,880)
Less: Market valuation gain on financial assets at FVPL (54,911,274)
Dividend declaration during the year (1,800,710,414)
Appropriations of retained earnings during the year (10,400,000,000)
Total Retained Earnings available for dividend declaration as of
December 31, 2016 (P=5,270,561,577)

- 287 -
JG SUMMIT HOLDINGS, INC. AND SUBSIDIARIES
SUPPLEMENTARY SCHEDULE OF ALL EFFECTIVE STANDARDS AND
INTERPRETATIONS
PHILIPPINE FINANCIAL REPORTING STANDARDS AND
INTERPRETATIONS
Effective as of December 31, 2016 Adopted
Not Adopted/Not
Early Adopted
Not
Applicable
Framework for the Preparation and Presentation of Financial
Statements
Conceptual Framework Phase A: Objectives and qualitative
characteristics
PFRSs Practice Statement Management Commentary
Philippine Financial Reporting Standards
PFRS 1
(Revised)
First-time Adoption of Philippine Financial Reporting
Standards
Amendments to PFRS 1: Additional Exemption for
First-time Adopters
Amendments to PFRS 1: Limited Exemption from
Comparative PFRS 7 Disclosures for First-time
Adopters
Amendments to PFRS 1: Severe Hyperinflation and
Removal of Fixed Date for First-time Adopters
Amendments to PFRS 1: Government Loans
Amendment to PFRS 1: Meaning of Effective PFRSs
PFRS 2 Share-based Payment
Amendments to PFRS 2: Vesting Conditions and
Cancellations
Amendments to PFRS 2: Group Cash-settled Share-
based Payment Transactions
Amendment to PFRS 2: Definition of Vesting
Condition
Amendments to PFRS 2: Classification and
Measurement of Share-based Payment Transactions*
PFRS 3
(Revised)
Business Combinations
Amendment to PFRS 3: Accounting for Contingent
Consideration in a Business Combination
Amendment to PFRS 3: Scope Exceptions for Joint
Arrangements
PFRS 4 Insurance Contracts
Amendments to PFRS 4: Financial Guarantee
Contracts
Amendments to PFRS 4: Applying PFRS 9, Financial
Instruments with PFRS 4, Insurance Contracts*
PFRS 5 Non-current Assets Held for Sale and Discontinued
operation
Amendment to PFRS 5: Changes in methods of
disposal
PFRS 6 Exploration for and Evaluation of Mineral Resources
PFRS 7 Financial Instruments: Disclosures
Amendments to PFRS 7: Transition
Amendments to and PFRS 7: Reclassification of
Financial Assets
Amendments to PFRS 7: Reclassification of Financial
Assets - Effective Date and Transition
Amendments to PFRS 7: Improving Disclosures about
Financial Instruments
Amendments to PFRS 7: Disclosures - Transfers of
Financial Assets
Amendments to PFRS 7: Disclosures - Offsetting
Financial Assets and Financial Liabilities
Amendments to PFRS 7: Mandatory Effective Date of
PFRS 9 and Transition Disclosures

- 288 -
PHILIPPINE FINANCIAL REPORTING STANDARDS AND
INTERPRETATIONS
Effective as of December 31, 2016 Adopted
Not Adopted/Not
Early Adopted
Not
Applicable
Amendments to PFRS 7: Additional hedge accounting
disclosures (and consequential amendments) resulting
from the introduction of the hedge accounting chapter
in PFRS 9
Not early adopted
(Effective
January 1, 2018)
Amendments to PFRS 7: Servicing Contracts and
Applicability of the Amendments to PFRS 7 to
Condensed Interim Financial Statements
PFRS 8 Operating Segments
Amendments to PFRS 8: Aggregation of Operating
Segments and Reconciliation of the Total of the
Reportable Segments’ Assets to the Entity’s Assets
PFRS 9 Financial Instruments: Classification and
Measurement of Financial Assets (2010)
Financial Instruments: Classification and
Measurement of Financial Liabilities (2010)
PFRS 9, Financial Instruments (2014) Not early adopted (Effective
January 1, 2018)
PFRS 10 Consolidated Financial Statements
Amendments to PFRS 10: Transition Guidance
Amendments to PFRS 10: Investment Entities
Amendments to PFRS 10: Sale or Contribution of
Assets Between an Investor and its Associate or Joint
Venture**
Amendments to PFRS 10: Investment Entities:
Applying the Consolidation Exception
PFRS 11 Joint Arrangements
Amendments to PFRS 11: Transition Guidance
Amendments to PFRS 11: Accounting for
Acquisitions of Interests in Joint Operations
PFRS 12 Disclosures of Interests in Other Entities
Amendments to PFRS 12: Transition Guidance
Amendments to PFRS 12: Investment Entities
Amendments to PFRS 12: Investment Entities
Applying the Consolidation Exception
PFRS 13 Fair Value Measurement
Amendment to PFRS 13: Short-term Receivables and
Payables
Amendment to PFRS 13: Portfolio Exception
PFRS 14 Regulatory Deferral Accounts
PFRS 15
Revenue from Contracts with Customers*
Not early adopted
(Effective
January 1, 2018)
Amendments to PFRS 15, Clarifications to PFRS 15*
Not early adopted
(Effective
January 1, 2018)
PFRS 16
Lease
Not early adopted
(Effective
January 1, 2019)
Philippine Accounting Standards
PAS 1
(Revised)
Presentation of Financial Statements
Amendments to PAS 1: Puttable Financial
Instruments and Obligations Arising on Liquidation
Amendments to PAS 1: Presentation of Items of Other
Comprehensive Income
Amendments to PAS 1 (Revised): Disclosure
Initiative
PAS 2 Inventories
PAS 7 Statement of Cash Flows
Amendments to PAS 7: Disclosure Initiative Not early adopted
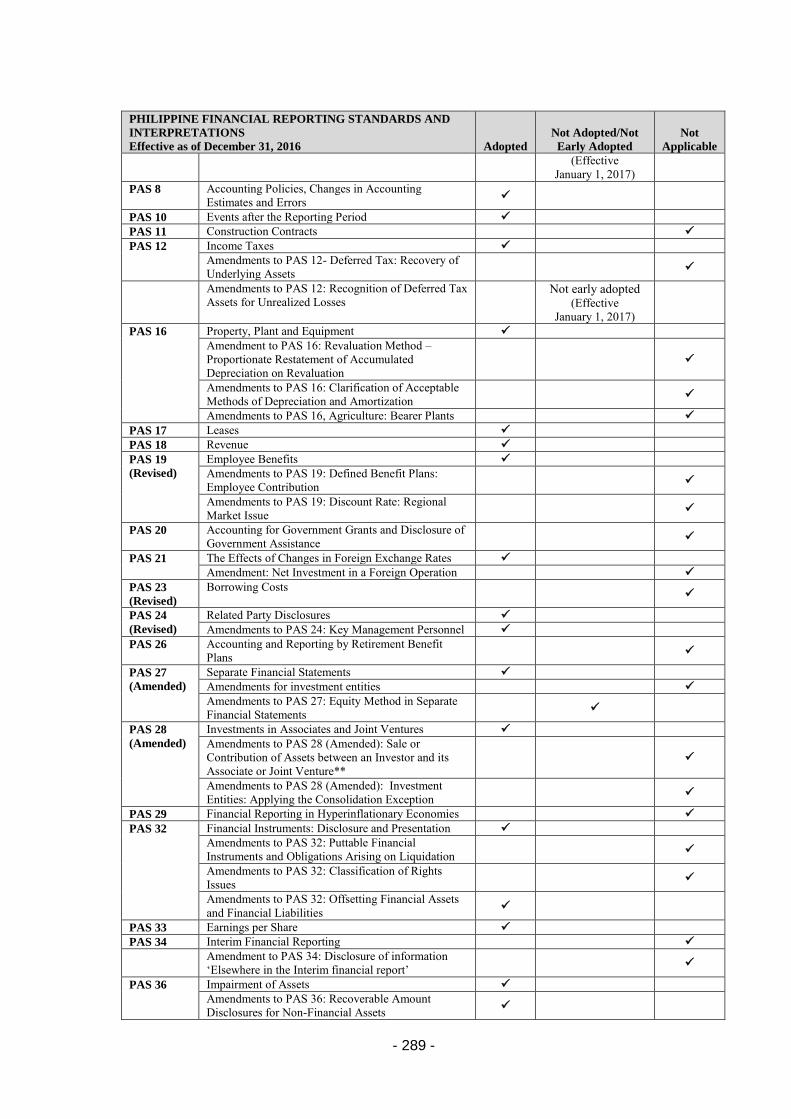
- 289 -
PHILIPPINE FINANCIAL REPORTING STANDARDS AND
INTERPRETATIONS
Effective as of December 31, 2016 Adopted
Not Adopted/Not
Early Adopted
Not
Applicable
(Effective
January 1, 2017)
PAS 8 Accounting Policies, Changes in Accounting
Estimates and Errors
PAS 10 Events after the Reporting Period
PAS 11 Construction Contracts
PAS 12 Income Taxes
Amendments to PAS 12- Deferred Tax: Recovery of
Underlying Assets
Amendments to PAS 12: Recognition of Deferred Tax
Assets for Unrealized Losses
Not early adopted (Effective
January 1, 2017)
PAS 16 Property, Plant and Equipment
Amendment to PAS 16: Revaluation Method –
Proportionate Restatement of Accumulated
Depreciation on Revaluation
Amendments to PAS 16: Clarification of Acceptable
Methods of Depreciation and Amortization
Amendments to PAS 16, Agriculture: Bearer Plants
PAS 17 Leases
PAS 18 Revenue
PAS 19
(Revised)
Employee Benefits
Amendments to PAS 19: Defined Benefit Plans:
Employee Contribution
Amendments to PAS 19: Discount Rate: Regional
Market Issue
PAS 20 Accounting for Government Grants and Disclosure of
Government Assistance
PAS 21 The Effects of Changes in Foreign Exchange Rates
Amendment: Net Investment in a Foreign Operation
PAS 23
(Revised)
Borrowing Costs
PAS 24
(Revised)
Related Party Disclosures
Amendments to PAS 24: Key Management Personnel
PAS 26 Accounting and Reporting by Retirement Benefit
Plans
PAS 27
(Amended)
Separate Financial Statements
Amendments for investment entities
Amendments to PAS 27: Equity Method in Separate
Financial Statements
PAS 28
(Amended)
Investments in Associates and Joint Ventures
Amendments to PAS 28 (Amended): Sale or
Contribution of Assets between an Investor and its
Associate or Joint Venture**
Amendments to PAS 28 (Amended): Investment
Entities: Applying the Consolidation Exception
PAS 29 Financial Reporting in Hyperinflationary Economies
PAS 32 Financial Instruments: Disclosure and Presentation
Amendments to PAS 32: Puttable Financial
Instruments and Obligations Arising on Liquidation
Amendments to PAS 32: Classification of Rights
Issues
Amendments to PAS 32: Offsetting Financial Assets
and Financial Liabilities
PAS 33 Earnings per Share
PAS 34 Interim Financial Reporting
Amendment to PAS 34: Disclosure of information
‘Elsewhere in the Interim financial report’
PAS 36 Impairment of Assets
Amendments to PAS 36: Recoverable Amount
Disclosures for Non-Financial Assets

- 290 -
PHILIPPINE FINANCIAL REPORTING STANDARDS AND
INTERPRETATIONS
Effective as of December 31, 2016 Adopted
Not Adopted/Not
Early Adopted
Not
Applicable
PAS 37 Provisions, Contingent Liabilities and Contingent
Assets
PAS 38 Intangible Assets
Amendments to PAS 38 : Revaluation Method –
Proportionate Restatement Of Accumulated
Amortization
Amendments to PAS 38: Clarification of Acceptable
Methods of Depreciation and Amortization
PAS 39 Financial Instruments: Recognition and Measurement
Amendments to PAS 39: Transition and Initial
Recognition of Financial Assets and Financial
Liabilities
Amendments to PAS 39: Cash Flow Hedge
Accounting of Forecast Intragroup Transactions
Amendments to PAS 39: The Fair Value Option
Amendments to PAS 39: Financial Guarantee
Contracts
Amendments to PAS 39: Reclassification of Financial
Assets
Amendments to PAS 39: Reclassification of Financial
Assets - Effective Date and Transition
Amendment to PAS 39: Embedded Derivatives
Amendment to PAS 39: Eligible Hedged Items
Amendment to PAS 39: Novation of Derivatives and
Continuation of Hedge Accounting
Amendments to PAS 39: Hedge Accounting
PAS 40 Investment Property
Amendments to PAS 40: Clarifying the
Interrelationship between PFRS 3 and PAS 40 when
Classifying Property as Investment Property or
Owner-Occupied Property
PAS 41 Agriculture
Amendments to PAS 41, Agriculture: Bearer Plants
Philippine Interpretations
IFRIC 1 Changes in Existing Decommissioning, Restoration
and Similar Liabilities
IFRIC 2 Members’ Share in Co-operative Entities and Similar
Instruments
IFRIC 4 Determining Whether an Arrangement Contains a
Lease
IFRIC 5 Rights to Interests arising from Decommissioning,
Restoration and Environmental Rehabilitation Funds
IFRIC 6 Liabilities arising from Participating in a Specific
Market - Waste Electrical and Electronic Equipment
IFRIC 7 Applying the Restatement Approach under PAS 29
Financial Reporting in Hyperinflationary Economies
IFRIC 9 Reassessment of Embedded Derivatives
Amendments to Philippine Interpretation IFRIC-9:
Embedded Derivatives
IFRIC 10 Interim Financial Reporting and Impairment
IFRIC 12 Service Concession Arrangements
IFRIC 13 Customer Loyalty Programmes
IFRIC 14 The Limit on a Defined Benefit Asset, Minimum
Funding Requirements and their Interaction
Amendments to Philippine Interpretations IFRIC - 14,
Prepayments of a Minimum Funding Requirement
IFRIC 16 Hedges of a net Investment in a Foreign Operation
IFRIC 17 Distributions of Non-cash Assets to Owners
IFRIC 18 Transfers of Assets from Customers
IFRIC 19 Extinguishing Financial Liabilities with Equity

- 291 -
PHILIPPINE FINANCIAL REPORTING STANDARDS AND
INTERPRETATIONS
Effective as of December 31, 2016 Adopted
Not Adopted/Not
Early Adopted
Not
Applicable
Instruments
IFRIC 20 Stripping Costs in the Production Phase of a Surface
Mine
IFRIC 21 Levies
SIC-7 Introduction of the Euro
SIC-10 Government Assistance - No Specific Relation to
Operating Activities
SIC-15 Operating Leases - Incentives
SIC-25 Income Taxes- Changes in the Tax Status of an Entity
or its Shareholders
SIC-27 Evaluating the Substance of Transactions Involving
the Legal Form of a Lease
SIC-29 Service Concession Arrangements: Disclosures
SIC-31 Revenue - Barter Transactions Involving Advertising
Services
SIC-32 Intangible Assets - Web Site Costs
* Subject to approval by the Board of Accountancy
** Original effective date of January 1, 2016 of the amendment was postponed by the FRSC on January 13, 2016,
until the IASB has completed its broader review of the research project on equity accounting.
Standards and Interpretations applicable to annual periods beginning on or after January 1, 2017 (where early
application is allowed) will be adopted by the Group as they become effective.
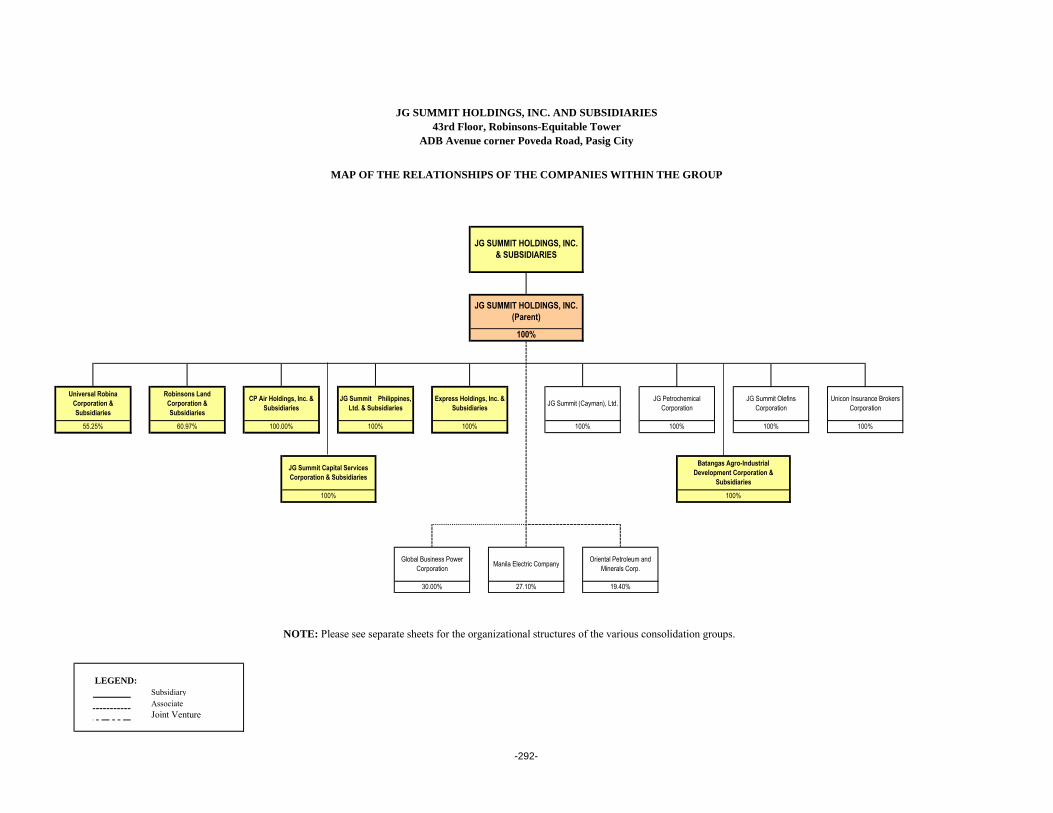
NOTE: Please see separate sheets for the organizational structures of the various consolidation groups.
LEGEND:
Subsidiary
Associate
Joint Venture
Express Holdings, Inc. &
Subsidiaries
100%
Universal Robina
Corporation &
Subsidiaries
55.25%
Robinsons Land
Corporation &
Subsidiaries
60.97%
JG Summit Philippines,
Ltd. & Subsidiaries
100%
Unicon Insurance Brokers
Corporation
100%
JG Summit Olefins
Corporation
100%
JG Petrochemical
CorporationJG Summit (Cayman), Ltd.
100%
CP Air Holdings, Inc. &
Subsidiaries
100.00%
30.00%
Manila Electric Company
27.10%
100%
Global Business Power
Corporation
Oriental Petroleum and
Minerals Corp.
JG Summit Capital Services
Corporation & Subsidiaries
100%
19.40%
Batangas Agro-Industrial
Development Corporation &
Subsidiaries
100%
100%
JG SUMMIT HOLDINGS, INC.
(Parent)
JG SUMMIT HOLDINGS, INC.
& SUBSIDIARIES
JG SUMMIT HOLDINGS, INC. AND SUBSIDIARIES
43rd Floor, Robinsons-Equitable Tower
ADB Avenue corner Poveda Road, Pasig City
MAP OF THE RELATIONSHIPS OF THE COMPANIES WITHIN THE GROUP
-292-

NOTE: Please see next sheet for the organizational structures of the URC Asean Brands and Acesfood Network consolidation groups.
LEGEND:
Subsidiary
Associate
Joint Venture
Hunt Universal
Robina CorporationCalbee-URC, Inc.
50% 50%
Danone Universal
Robina Beverages,
Inc.
50%
CFC
Corporation
100%
Universal Robina
Corporation (Parent)
100%
Vitasoy-URC, Inc.
50%
100%
Shanghai Peggy
Foods Co., Ltd.
100%
Xiamen Tongan
Pacific Foods Co.,
Ltd.
100%
URC Hong Kong
Co., Ltd
100%
Hong Kong China Foods (Parent)
Acesfood Network Pte Ltd.
& Subsidiaries
96.08%
URC Oceania Company
Ltd. and Subsidiaries
100.00%
Shantou Peggy Co.
Ltd.
100% 100%
URC China
Commercial Co.,
Ltd.
100%
Hong Kong - China Foods
Co., Ltd and Subsidiaries
CFC Clubhouse
Property, Inc.
100%
URC Philippines,
Ltd.
100%
Bio-Resource Power
Generation Corp. and a
Subsidiary
100%
Universal Robina Corporation
& Subsidiaries
55.25%
Universal Robina
(Cayman), Ltd.
100%
Advanson International
Pte. Ltd & Subsidiaries
Guangzhou Peggy
Foods Co., Ltd.
100%
Southern Negros
Development Corporation
94%
Nissin Universal
Robina Corporation
51%
URC International Co., Ltd
& Subsidiaries
100%
URC International Co., Ltd
(Parent)
100%
URC Asean Brands Co.,
Ltd. & Subsidiaries
Advanson
International Pte.
Ltd.
100%
Jiangsu Aces
100%
90% 100%
-293-

LEGEND:
Subsidiary
Associate
Joint Venture
100%
Acesfood Holdings
Pte Ltd.
100%
100%
Acesfood Network
Pte Ltd.
Shantou SEZ
Shanfu Foods Co.
Ltd.
100%
Acesfood Holdings
Pte Ltd
Acesfood
Distributors Pte Ltd.
Acesfood Network Pte Ltd &
Subsidiaries
100.00%
100%
53.49%100%
URC Asean Brands
Co., Ltd. (Parent)
100%
URC Vietnam Co.,
Ltd.
100%
URC Foods
(Singapore) Pte.
Ltd.
100%
PT URC Indonesia
100%91.52% 100%
URC Asean Brands Co., Ltd. &
Subsidiaries
100%
Ricellent Sdn. Bhd
URC Snack Foods
(Malaysia) Sdn.
Bhd.
100%
URC Myanmar Co.,
Ltd.
URC (Thailand)
Co., Ltd.
URC Central Co.,
Ltd.
100%
Siam Pattanasin
Co. LTd
49%
URC Hanoi Co.,
Ltd.
-294-
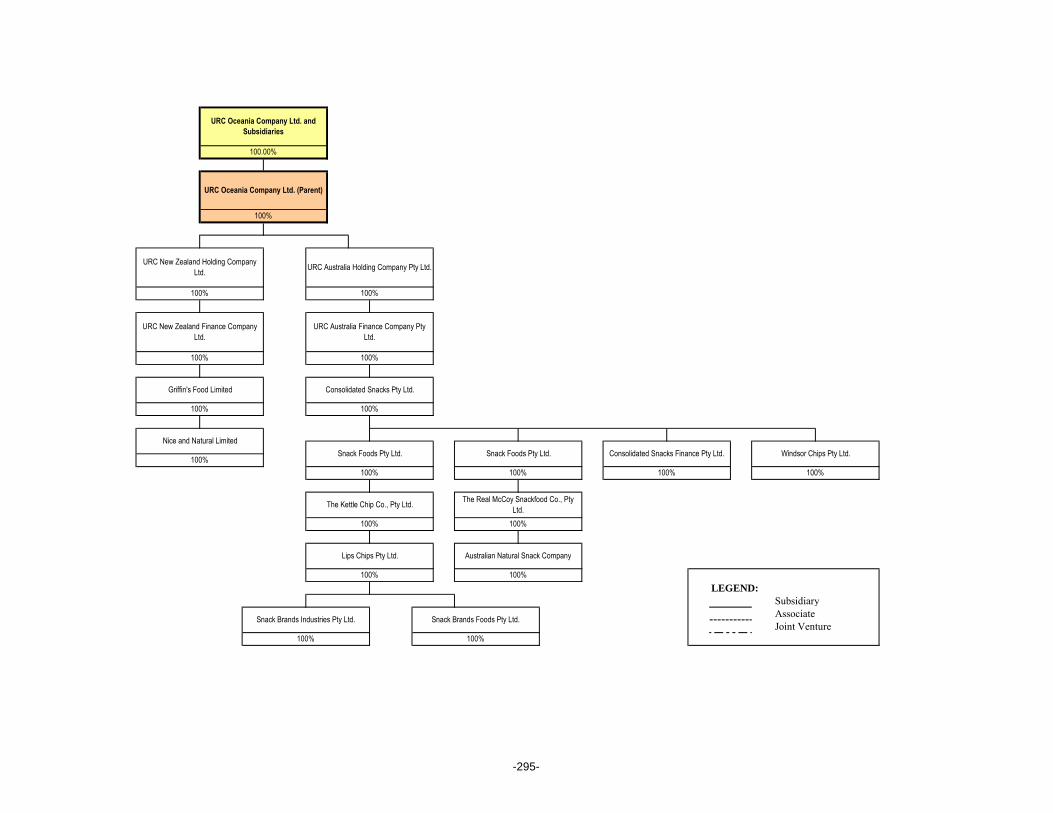
LEGEND:
Subsidiary
Associate
Joint Venture
The Real McCoy Snackfood Co., Pty
Ltd.
Snack Foods Pty Ltd.
100%
The Kettle Chip Co., Pty Ltd.
URC Oceania Company Ltd. and
Subsidiaries
100.00%
URC Oceania Company Ltd. (Parent)
100%
URC New Zealand Holding Company
Ltd.URC Australia Holding Company Pty Ltd.
100%
100%
Australian Natural Snack Company
100%
Snack Brands Foods Pty Ltd.
100%
Lips Chips Pty Ltd.
100%
Griffin's Food Limited Consolidated Snacks Pty Ltd.
Nice and Natural Limited
100%Windsor Chips Pty Ltd.
100%
Consolidated Snacks Finance Pty Ltd.
100%
Snack Foods Pty Ltd.
100%
100%
100%
URC New Zealand Finance Company
Ltd.
100%
URC Australia Finance Company Pty
Ltd.
100%
Snack Brands Industries Pty Ltd.
100%
100% 100%
-295-

LEGEND:
Subsidiary
Associate
Joint Venture
100%
100% 100% 100% 100% 100%
First Capital Development Limited
51% 51%
Robinsons Properties
Marketing and Management
Corp. (Parent)
Manhattan Building Management
Corporation
RLC Resources Limited
(Parent)Land Century Holdings Limited
World Century Enterprises
Limited
100% 100% 100% 100% 100% 100%
Robinsons Land Corporation
& Subsidiaries
60.97%
Robinsons Land
Corporation (Parent)
Robinsons Realty and
Management Corp.
Robinsons Properties Marketing
and Management Corp. (Group)
Altus San
Nicolas Corp.
Robinsons Inn,
Inc
Robinsons
(Cayman) Ltd
Lingkod Pinoy Bus
Liner, Inc.
80%
First Capital Development Limited
(Parent)
Chengdu Xin Yao Real Estate
Development, Co. Ltd.
100% 100%
RLC Resources Limited
(Group)
Altus Angeles,
Inc.
Go Hotels
Davao
100%
-296-

LEGEND:
Subsidiary
Associate
Joint Venture
100.00%
CP Air Holdings, Inc. &
Subsidiaries
Cebu Air, Inc.
67.23%
49%
Aviation Partnership
(Philippines) Corp.
35%
Philippine Academy for
Aviation Training, Inc.
60%
SIA Engineering
(Philippines), Corp.
Air Black Box Asia Pacific
Pte Ltd
15%
CEBGO, Inc.
100.00%
CP Air Holdings, Inc. (Parent)
100%
-297-
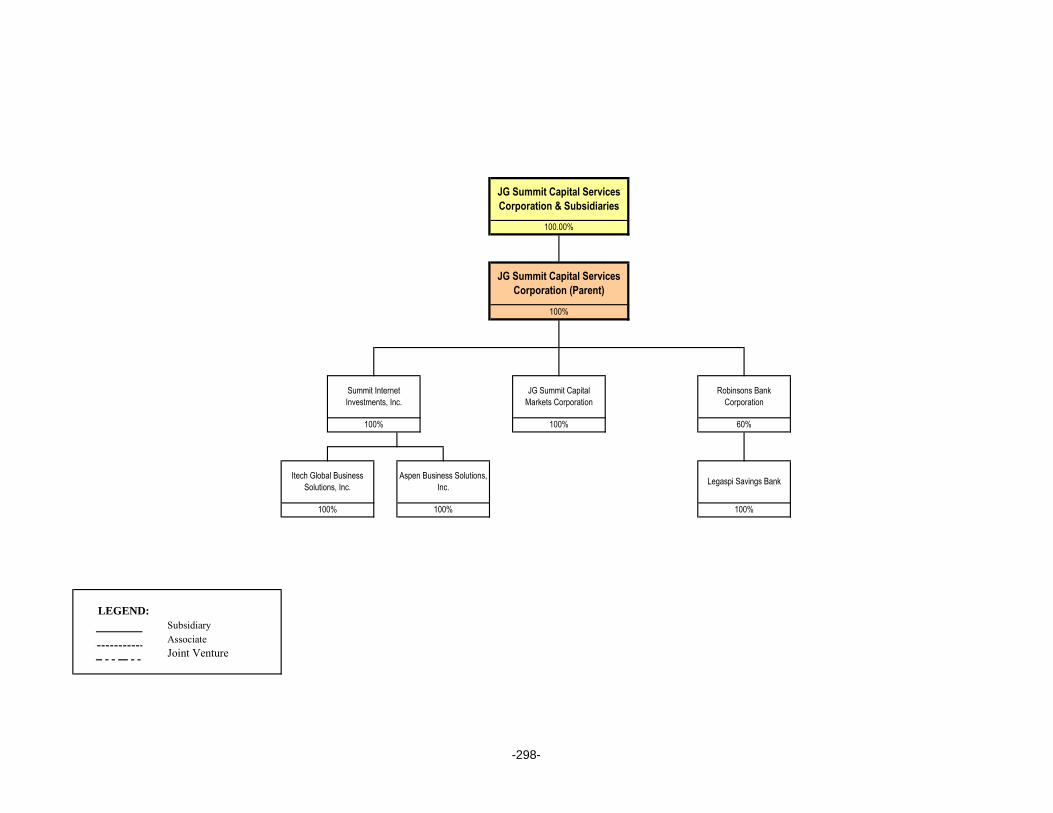
LEGEND:
Subsidiary
Associate
Joint Venture
100%
Summit Internet
Investments, Inc.
Robinsons Bank
Corporation
60%100%
JG Summit Capital Services
Corporation & Subsidiaries
100.00%
Legaspi Savings Bank
100%
JG Summit Capital Services
Corporation (Parent)
100%
JG Summit Capital
Markets Corporation
Itech Global Business
Solutions, Inc.
100%
Aspen Business Solutions,
Inc.
100%
-298-

LEGEND:
Subsidiary
Associate
Joint Venture
JG Summit Philippines, Ltd. &
Subsidiaries
100.00%
Summit Top Investments,
Ltd.
100%
JG Summit Philippines, Ltd.
(Parent)
100%
United Industrial
Corporation, Ltd.
37.03%
Telegraph Developments,
Ltd.
100%
JGSH Philippines, Ltd.
100%
-299-

LEGEND:
Subsidiary
Associate
Joint Venture
Cebu Light Industrial Park
20%
Express Holdings, Inc.
& Subsidiaries
100.00%
Express Holdings, Inc.
(Parent)
100%
-300-

LEGEND:
Subsidiary
Associate
Joint Venture
Batangas Agro-Industrial
Development Corporation
& Subsidiaries100%
Batangas Agro-Industrial
Development Corporation
(Parent)
100%
100% 100%
Tropical Aqua ResourcesUnited Philippines Oil
Trading Inc.Fruits of the East, Inc
Hometel Integrated
Management Corporation
King Leader Philippines,
Inc.
Samar Commodities
Trading and Industrial
Corporation
100% 100% 100% 100%
-301-

- 302 -
JG SUMMIT HOLDINGS, INC. AND SUBSIDIARIES
SCHEDULE A -FINANCIAL ASSETS
DECEMBER 31, 2016
Value Based on
Name of Issuing Entity and Amount Shown in Market Quotations Income Received and
Description of Each Issue the Balance Sheet/Notes at Balance Sheet Date Accrued
Financial Assets at Fair Value Through Profit or Loss Various/Private Bonds
P=9,719,180,330
P=9,719,180,330
P=528,821,679
Various/Government Bonds
1,722,743,531
1,722,743,531
110,301,242
Derivatives classified at FVPL (Fuel Hedge)
441,773,905
441,773,905
–
Derivatives classified at FVPL (Interest Rate Swap) 35,760,812 35,760,812
Derivatives classified at FVPL (Foreign Currency Swap) 1,421,644 1,421,644
Various Equity Quoted Securities
2,779,265,343
2,779,265,343
95,365,115
Various Equity Unquoted Securities
3,729
–
–
P=14,700,149,294
P=14,700,145,565
P=734,488,036
Available-for-Sale Investments Various/Private Bonds
P=4,233,057,221
P=4,233,057,221
P=200,960,934
Various/Government Bonds
9,580,344,650
9,580,344,650
331,913,646
Philippine Long Distance Telephone Corp.
23,608,326,105
23,608,326,105
1,833,320,456
Various Equity Quoted Securities
1,629,929,130
1,629,929,130
102,894,623
Various Equity Unquoted Securities
24,293,371
–
–
P=39,075,950,477
P=39,051,657,106
P=2,469,089,659
Held-to-Maturity Investments Private debt securities
P=3,549,900,604
P=3,549,900,604
P=170,428,187
P=57,326,000,375
P=57,301,703,275
P=3,374,005,882
- 303 -
JG SUMMIT HOLDINGS, INC. AND SUBSIDIARIES
SCHEDULE B - AMOUNTS RECEIVABLE FROM DIRECTORS, OFFICERS, EMPLOYEES, RELATED PARTIES
AND PRINCIPAL STOCKHOLDERS (OTHER THAN RELATED PARTIES)
DECEMBER 31, 2016
Balance Balance at End of Period
Name and Designation at Beginning
of Debtor of Period Additions Collections Write Offs Current Noncurrent Total
NONE TO REPORT

- 304 -
JG SUMMIT HOLDINGS, INC. AND SUBSIDIARIES
SCHEDULE C - AMOUNTS RECEIVABLE FROM RELATED PARTIES WHICH ARE ELIMINATED
DURING THE CONSOLIDATION OF FINANCIAL STATEMENTS
DECEMBER 31, 2016
Balance
Additions
Amounts Amounts Balance at End of Period
Name and Designation of Debtor
at Beginning of
Period
Collected
Written-Off
Current Non-current Total
Batangas Agro-Industrial Development
Corporation (Subsidiary) P=37,111,538 P=1,390,445 P=– P=– P=38,501,983 P=– P=38,501,983
Express Holdings, Inc. (Subsidiary) 181,276,321 33,253,000 (13,834,000) – 200,695,321 – 200,695,321
JG Summit Holdings, Inc. (Parent) 14,188,728,602 480,018,066 (440,483,127) – 14,228,263,541 – 14,228,263,541
JG Summit Petrochemical Corporation
(Subsidiary) – 52,338,887 (41,738,500) – 10,600,387 – 10,600,387
Robinsons Bank Corporation (Subsidiary) 3,675,620 24,883,267 (9,392,867) – 19,166,020 – 19,166,020
Robinsons Land Corporation
and Subsidiaries (Subsidiary) 79,797,638 10,259,040 (3,059,417) – 86,997,261 – 86,997,261
Summit Internet Investments, Inc.
and Subsidiaries (Subsidiary) 3,401,734 4,592,045 – – 7,993,779 – 7,993,779
Unicon Insurance Brokers Corporation
(Subsidiary) – 286,876,673 (250,703,958) 36,172,715 36,172,715
Universal Robina Corporation
and Subsidiaries (Subsidiary) 924,395,285 184,911,410 (492,219,916) – 617,086,779 – 617,086,779
P=15,418,386,738 P=1,078,522,833 (P=1,251,431,785) P=– P=15,245,477,786 P=– P=15,245,477,786

- 305 -
JG SUMMIT HOLDINGS, INC. AND SUBSIDIARIES
SCHEDULE D - INTANGIBLE ASSETS - OTHER ASSETS
DECEMBER 31, 2016
Description Beginning Additions Charged to Cost Charged to Other Changes Ending
Balance at Cost and Expenses Accounts Additions Balance
(Deductions)
Trademarks P=4,996,976,710 P=4,365,959,961 P=– P=– P=– P=9,362,936,671
Customer relationship 1,831,054,293 315,309,073 (56,418,608) (7,184,506) – 2,082,760,252
Bank and branch licenses 1,718,744,748 44,600,000 – – – 1,763,344,748
Software costs 60,981,802 555,048,596 (91,433,676) 365,100 – 524,961,822
Product formulation 425,000,000 – – – – 425,000,000
P=9,032,757,553 P=5,280,917,630 (P=147,852,284) (P=6,819,406) P=– P=14,159,003,493

- 306 -
JG SUMMIT HOLDINGS, INC. AND SUBSIDIARIES
SCHEDULE E - LONG-TERM DEBT
DECEMBER 31, 2016
Amount Shown under
Caption "Current Portion
of Long Term Debt" in
Related Balance Sheet
Amount Shown under
Caption
"Long-Term Debt" in
Related Balance Sheet
Remarks
Title of Issue and Amount Authorized
Type of Obligation by Indenture
Guaranteed Notes Due 2023 $750,000,000 (P=25,658,436) P=31,813,898,847
Fixed Rate Retail Bonds Due 2019, 2021 and 2024 – (54,601,874) 29,915,608,970
CAI - Export Credit Agency (ECA) Loan – 2,509,702,434 9,892,309,034
CAI - Commercial Loan – 4,530,551,026 25,877,875,136 See
RLC - Fixed Rate Retail Bonds Due 2025 – (14,384,343) 11,929,772,460 Notes
RLC - Term Loans Due 2021 and 2023 – (9,817,734) 11,455,907,295 Below
URC - Term Loans Due 2019 $420,000,000 (52,477,101) 14,364,155,014
URC - Term Loans Due 2021 $484,224,000 (57,083,663) 17,111,998,535
P=6,826,230,309 P=152,361,525,291
NOTES:
1) The terms, interest rate, collaterals and other relevant information are shown in the Notes to Consolidated Financial Statements. 2) The negative amounts represent debt issuance costs to be amortized the following year.

- 307 -
JG SUMMIT HOLDINGS, INC. AND SUBSIDIARIES
SCHEDULE F - INDEBTEDNESS TO RELATED PARTIES (LONG-TERM LOANS FROM RELATED COMPANIES)
DECEMBER 31, 2016
Name of Related Party Balance at Beginning of the Period Balance at End of the Period
NONE TO REPORT

- 308 -
JG SUMMIT HOLDINGS, INC. AND SUBSIDIARIES
SCHEDULE G - GUARANTEES OF SECURITIES OF OTHER ISSUERS
DECEMBER 31, 2016
Name of issuing entity of
securities guaranteed by the Title of issue of each class Total amount guaranteed Amount owned by person Nature of guarantee
Company for which this of securities guaranteed and outstanding for which this statement is filed
statement is filed
- NONE TO REPORT -

- 309 -
JG SUMMIT HOLDINGS, INC. AND SUBSIDIARIES
SCHEDULE H - CAPITAL STOCK
DECEMBER 31, 2016
Number of Shares Number of Shares Held by
Number of Number of Shares Issued Reserved for Options, Directors,
Title of Issue Shares and Outstanding Warrants, Conversion Officers and
Authorized
and Other Rights Affiliates Employees Others
Common Shares at P=1 par value 12,850,800,000 7,162,841,657 – 267,568,000 1,302,029,471 5,593,244,186
Preferred Voting Shares at P=0.01 par value 4,000,000,000 4,000,000,000 – – – 4,000,000,000
Preferred Non-voting Shares at P=1 par value 2,000,000,000 – – – – –

- 310 -
JG SUMMIT HOLDINGS, INC. AND SUBSIDIARIES SUPPLEMENTARY SCHEDULE OF FINANCIAL SOUNDNESS INDICATOR FOR THE YEARS ENDED DECEMBER 31, 2016 AND 2015 The following are the financial ratios that the Group monitors in measuring and analyzing its financial soundness:
Financial Ratios 2016 2015 Profitability Ratio Operating margin 22% 22% Liquidity Ratio Current ratio 1.01 1.04 Capital Structure Ratios Gearing ratio 0.71 0.71 Net debt to equity ratio 0.55 0.52 Asset to equity ratio 2.13 2.08 Interest rate coverage ratio 9.28 9.27