Embed Size (px)
Citation preview
© 2
001
McG
raw
-Hill
Co
mp
anie
s
245
Solving Equations andInequalities Graphically
4.4
4.4 OBJECTIVES
1. Solve linear equations graphically2. Solve linear inequalities graphically
In Chapter 2, we solved linear equations and inequalities. In this section, we will graphi-cally demonstrate solutions for similar statements. In using this section, note that eachgraphical demonstration is accompanied by the algebraic solution, which appears in themargin. The techniques of this section are not designed as an alternative to the algebra.They are rather an introduction to the idea of “viewing a solution.” This is a skill that willbe very useful as you continue to study mathematics.
In our first example, we will solve a simple linear equation. The graphical method mayseem cumbersome, but once you master it, you will find it quite helpful, particularly if youare a visual learner.
A Graphical Approach to Solving a Linear Equation
Graphically solve the following equation.
2x � 6 � 0
Step 1 Let each side of the equation represent a function of x.
f(x) � 2x � 6
g(x) � 0
Step 2 Graph the two functions on the same set of axes.
Step 3 Find the intersection of the two graphs. To do this, examine the two graphsclosely to see where they intersect. Identify the coordinates of that point. This intersectiondetermines the solution to the original equation.
g
y f
Example 1
NOTE Algebraically
2x � 6 � 0
2x � 6
x � 3
NOTE We ask the question,“when is the graph of f equalto the graph of g?” Specifically,for what values of x does thisoccur?
246 CHAPTER 4 GRAPHS OF LINEAR EQUATIONS AND FUNCTIONS
© 2
001
McG
raw
-Hill
Co
mp
anie
s
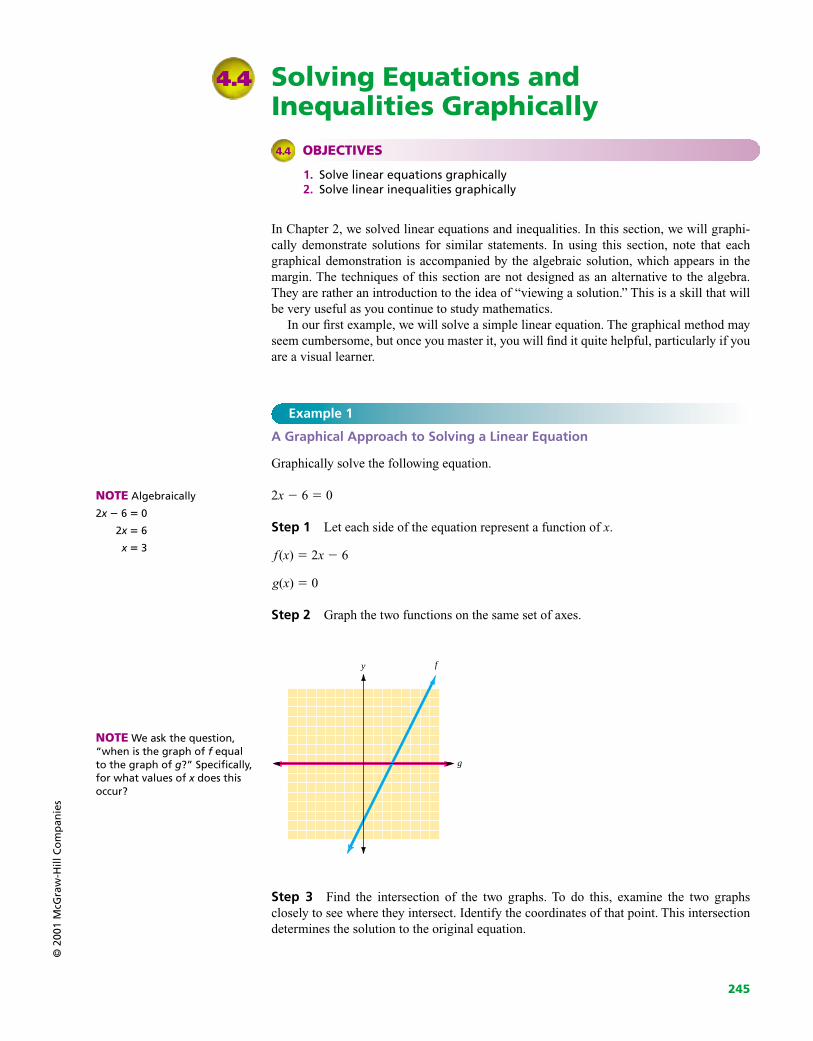
The two lines intersect on the x axis at the point (3, 0). We are looking for the x value at thepoint of intersection, which is 3.
g
y f
(3, 0)
C H E C K Y O U R S E L F 1
Graphically solve the following equation.
�3x � 6 � 0
The graph of the equation is often used to check the algebraic solution. This concept isillustrated in Example 2.
Example 2
Solving Linear Equations Algebraically and Graphically
Solve the linear equation algebraically, then graphically display the solution.
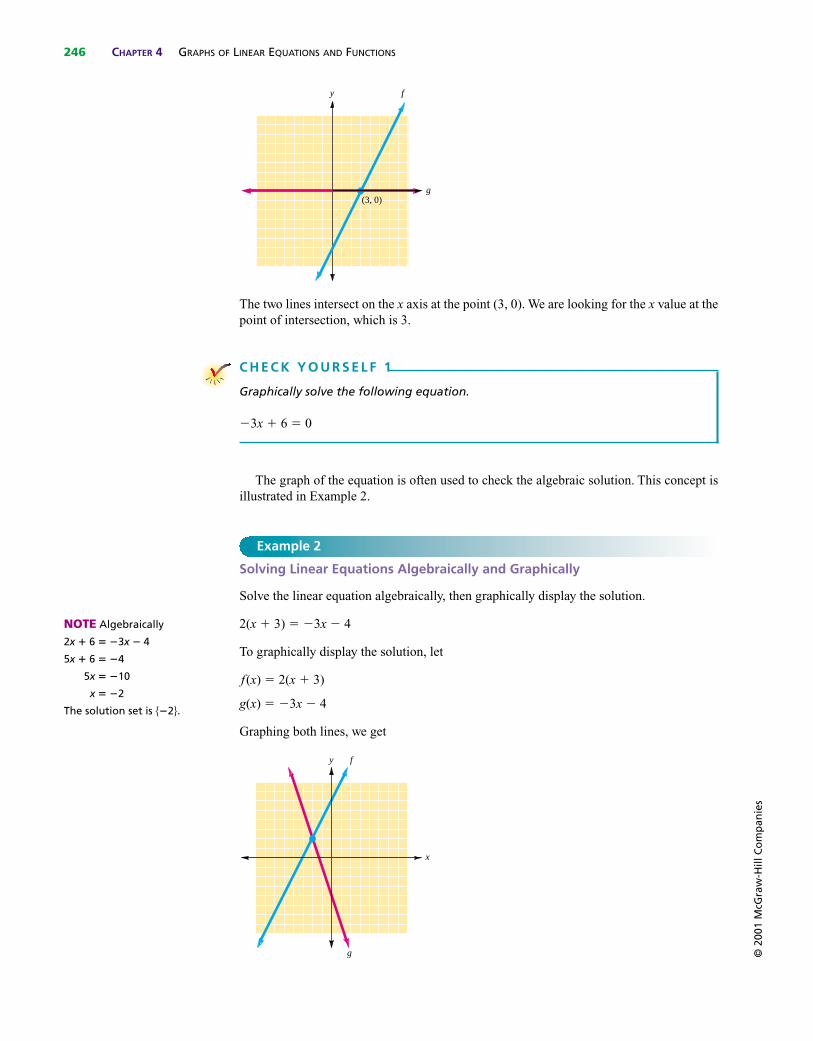
2(x � 3) � �3x � 4
To graphically display the solution, let
f(x) � 2(x � 3)
g(x) � �3x � 4
Graphing both lines, we get
g
f
x
y
NOTE Algebraically
2x � 6 � �3x � 4
5x � 6 � �4
5x � �10
x � �2
The solution set is ��2�.
SOLVING EQUATIONS AND INEQUALITIES GRAPHICALLY SECTION 4.4 247©
200
1 M
cGra
w-H
ill C
om
pan
ies
The point of intersection appears to be (�2, 2), which confirms that �2 is a reasonablesolution to the equation
2(x � 3) � �3x � 4
C H E C K Y O U R S E L F 2
First solve the linear equation algebraically, then graphically display the solution.
�3x � 4 � 2x � 1
The following algorithm summarizes our work in graphically solving an equation.
Step 1 Let each side of the equation represent a function of x.Step 2 Graph the two functions on the same set of axes.Step 3 Find the intersection of the two graphs. The x value at this intersection
represents the solution to the original equation.
Step by Step: Graphically Solving an Equation
We will now use the graphs of linear functions to determine the solutions of a linear in-equality.
Linear inequalities in one variable, x, are obtained from linear equations by replacing thesymbol for equality (�) with one of the inequality symbols (�, �, �, ).
The general form for a linear inequality in one variable is
x � a
in which the symbol � can be replaced with �, �, or . Examples of linear inequalities inone variable include
x �3 2x � 5 � 7 2x � 3 � 5x � 6
Recall that the solution set for an equation is the set of all values for the variable (orordered pair) that make the equation a true statement. Similarly, the solution set for an in-equality is the set of all values that make the inequality a true statement. Example 3 looksat the graphical approach to solving an inequality.
Example 3
Solving an Inequality Graphically
Solve the inequality graphically.
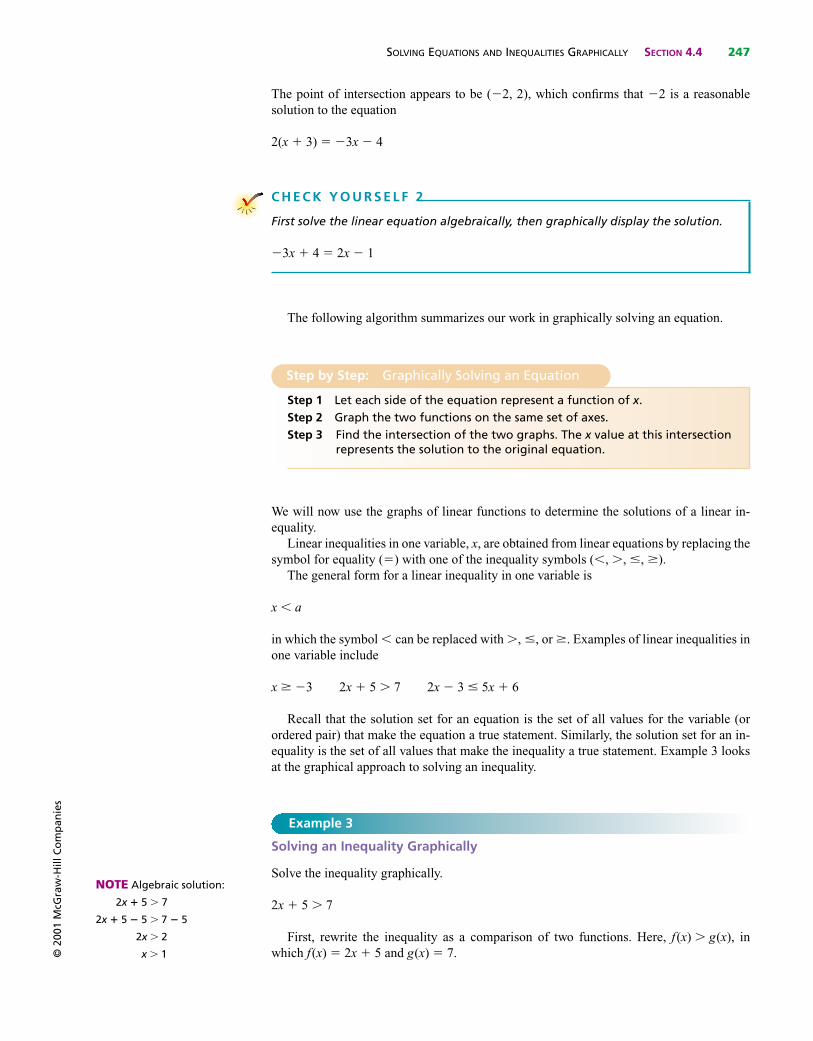
2x � 5 � 7
First, rewrite the inequality as a comparison of two functions. Here, f(x) � g(x), inwhich f(x) � 2x � 5 and g(x) � 7.
NOTE Algebraic solution:
2x � 5 � 7
2x � 5 � 5 � 7 � 5
2x � 2
x � 1
248 CHAPTER 4 GRAPHS OF LINEAR EQUATIONS AND FUNCTIONS
© 2
001
McG
raw
-Hill
Co
mp
anie
s
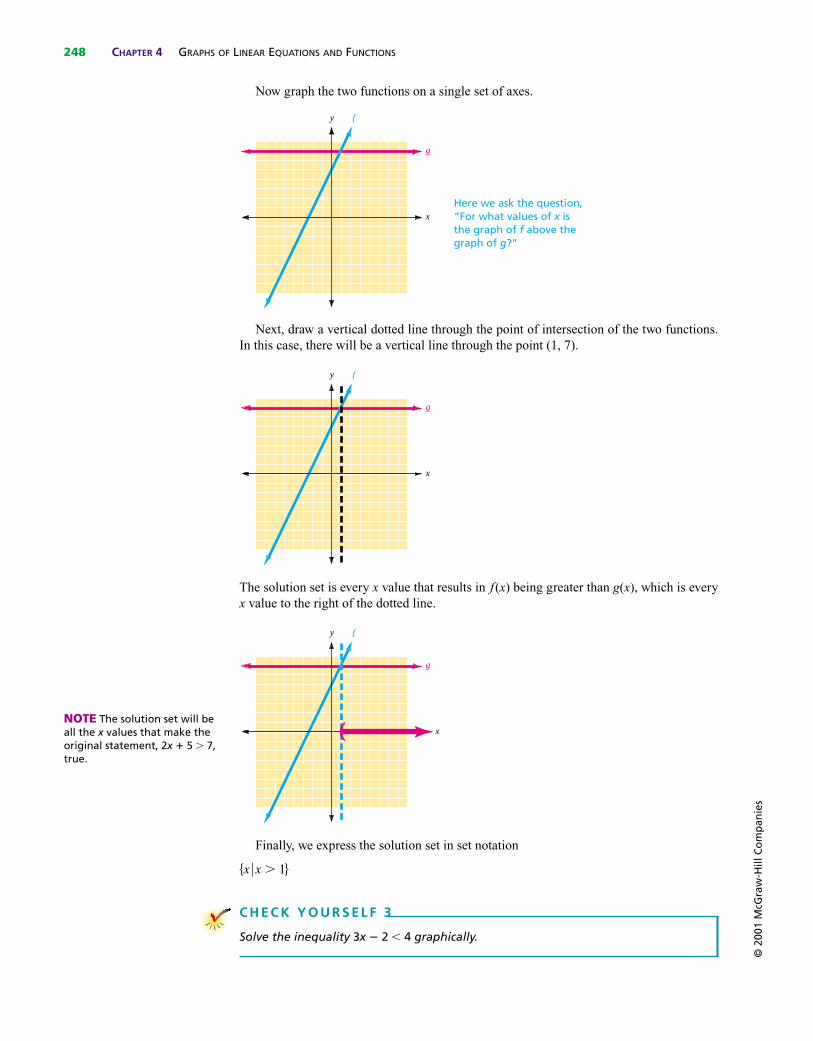
Now graph the two functions on a single set of axes.
Next, draw a vertical dotted line through the point of intersection of the two functions.In this case, there will be a vertical line through the point (1, 7).
The solution set is every x value that results in f(x) being greater than g(x), which is everyx value to the right of the dotted line.
Finally, we express the solution set in set notation
�x �x � 1�
y f
x
g
y f
x
g
y f
x
g
C H E C K Y O U R S E L F 3
Solve the inequality 3x � 2 � 4 graphically.
NOTE The solution set will beall the x values that make theoriginal statement, 2x � 5 � 7,true.
Here we ask the question, “For what values of x is the graph of f above the graph of g?”
SOLVING EQUATIONS AND INEQUALITIES GRAPHICALLY SECTION 4.4 249©
200
1 M
cGra
w-H
ill C
om
pan
ies
In Example 3, the function g(x) � 7 resulted in a horizontal line. In Example 4, we seethat the same method works when comparing any two functions.
Example 4
Solving an Inequality Graphically
Solve the inequality graphically.
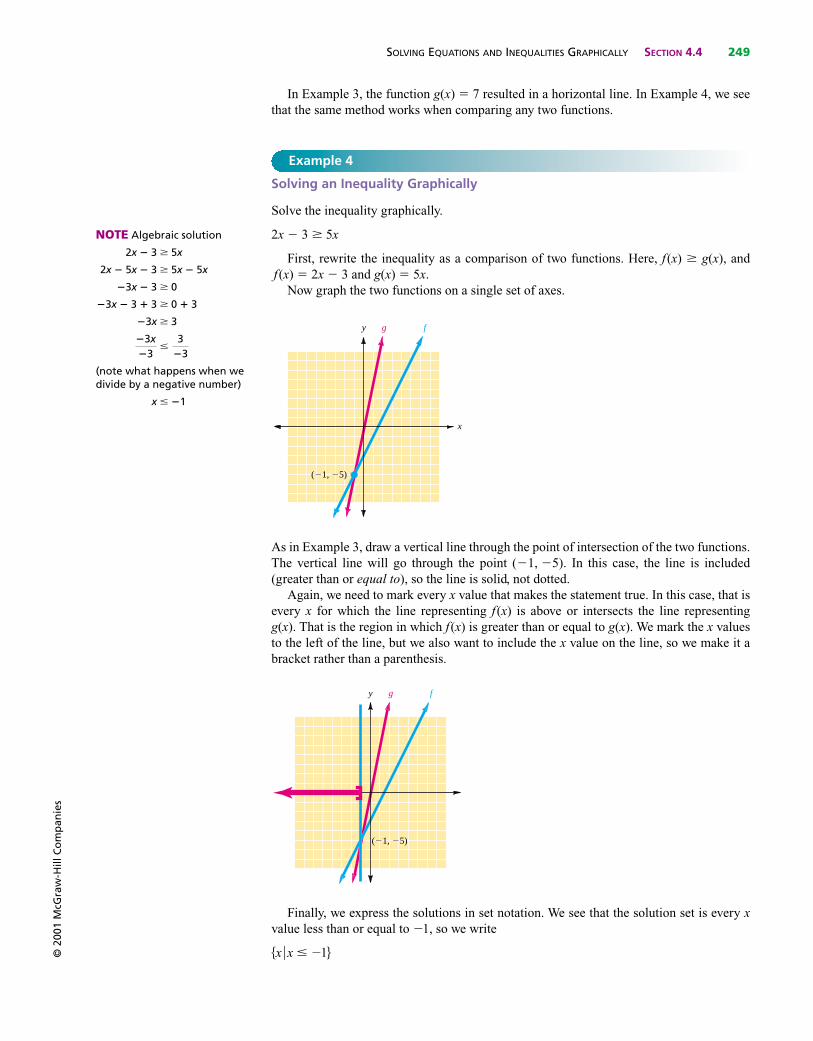
2x � 3 5x
First, rewrite the inequality as a comparison of two functions. Here, f(x) g(x), andf(x) � 2x � 3 and g(x) � 5x.
Now graph the two functions on a single set of axes.
As in Example 3, draw a vertical line through the point of intersection of the two functions.The vertical line will go through the point (�1, �5). In this case, the line is included(greater than or equal to), so the line is solid, not dotted.
Again, we need to mark every x value that makes the statement true. In this case, that isevery x for which the line representing f(x) is above or intersects the line representingg(x). That is the region in which f(x) is greater than or equal to g(x). We mark the x valuesto the left of the line, but we also want to include the x value on the line, so we make it abracket rather than a parenthesis.
Finally, we express the solutions in set notation. We see that the solution set is every xvalue less than or equal to �1, so we write
�x �x � �1�
(�1, �5)
y g f
x
(�1, �5)
y g f
x
NOTE Algebraic solution
2x � 3 5x
2x � 5x � 3 5x � 5x
�3x � 3 0
�3x � 3 � 3 0 � 3
�3x 3
(note what happens when wedivide by a negative number)
x � �1
�3x�3
�3
�3
250 CHAPTER 4 GRAPHS OF LINEAR EQUATIONS AND FUNCTIONS
© 2
001
McG
raw
-Hill
Co
mp
anie
s
The following algorithm summarizes our work in this section.
C H E C K Y O U R S E L F 4
Solve the inequality graphically.
3x � 2 �2x � 8
Step 1 Rewrite the inequality as a comparison of two functions.
f(x) � g(x) f(x) � g(x) f(x) � g(x) f(x) g(x)
Step 2 Graph the two functions on a single set of axes.Step 3 Draw a vertical line through the point of intersection of the two
graphs. Use a dotted line if equality is not included (� or �). Use asolid line if equality is included (� or ).
Step 4 Mark the x values that make the inequality a true statement.Step 5 Write the solutions in set notation.
Step by Step: Solving an Inequality in One Variable Graphically
The examples we have shown yielded intersections at x values that are integers. If the xvalue of the intersection is not an integer, it can be very difficult to read from a hand-drawngraph. If a graphing calculator is used, the trace feature can be used to get a very good ap-proximation of the intersection point.
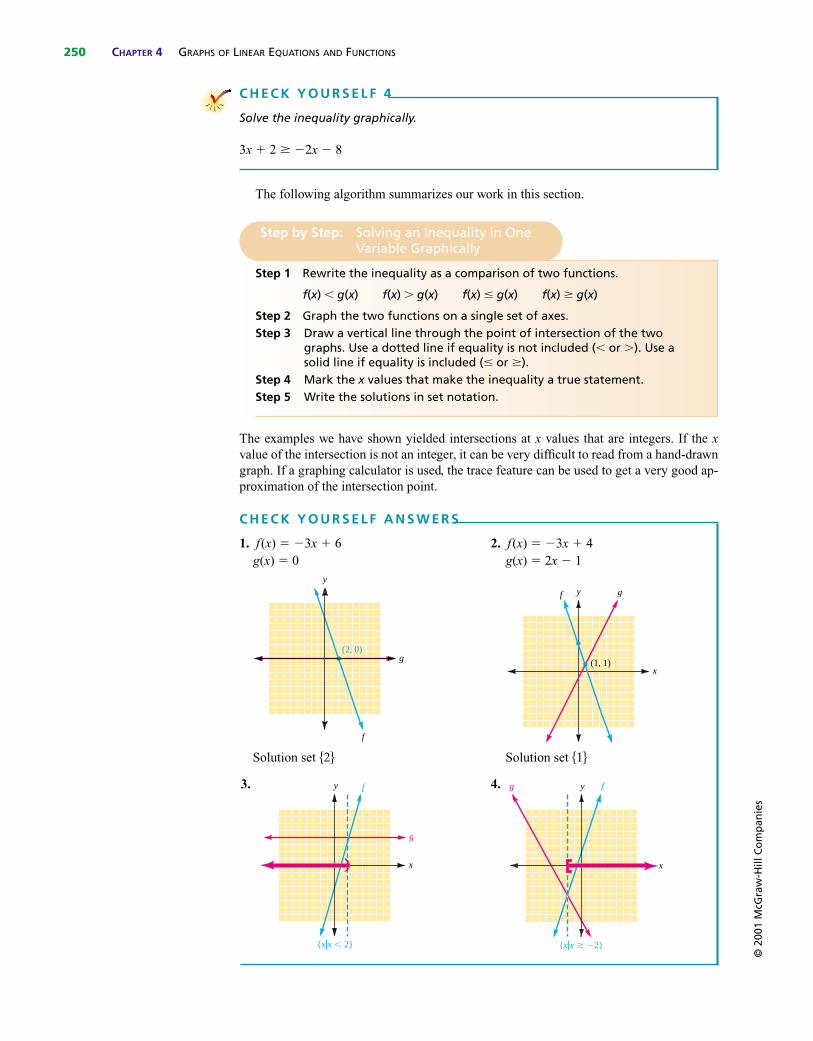
C H E C K Y O U R S E L F A N S W E R S
1. f(x) � �3x � 6 2. f(x) � �3x � 4g(x) � 0 g(x) � 2x � 1
Solution set �2� Solution set �1�
3. 4. y
x
g f
{x�x �2}
y
x
g
f
{x�x � 2}
y gf
x(1, 1)
y
g
f
(2, 0)
© 2
001
McG
raw
-Hill
Co
mp
anie
s
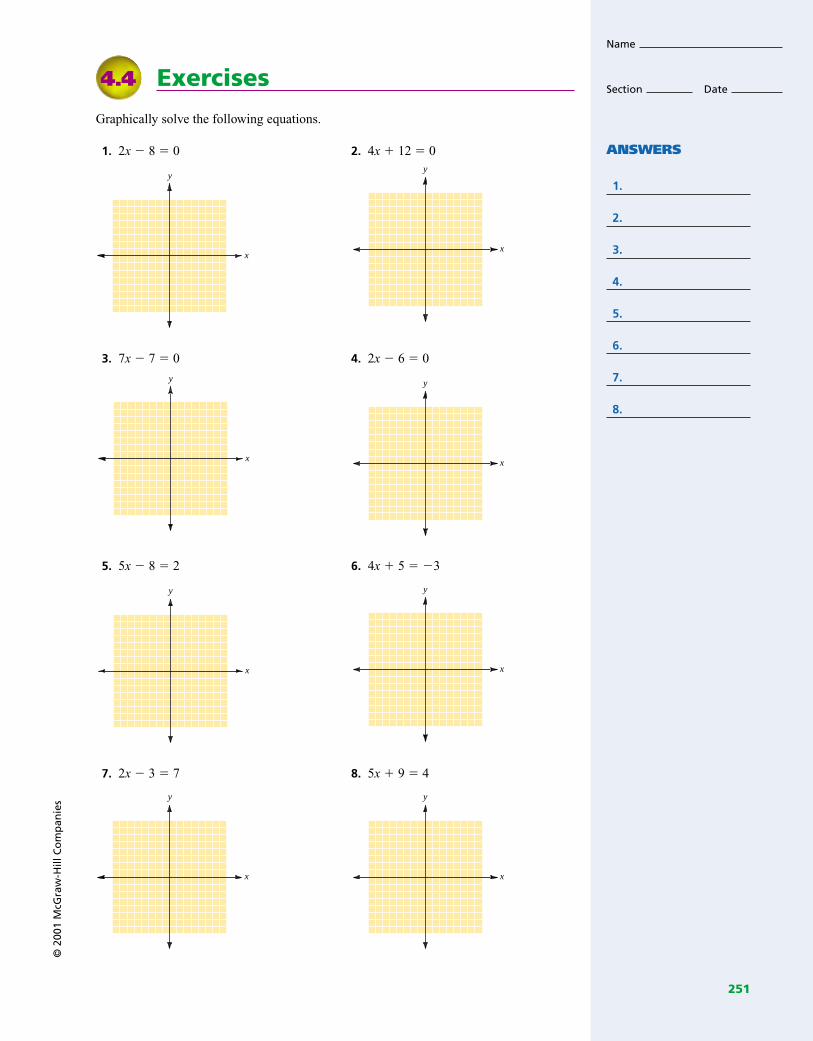
Exercises
Graphically solve the following equations.
1. 2x � 8 � 0 2. 4x � 12 � 0
3. 7x � 7 � 0 4. 2x � 6 � 0
5. 5x � 8 � 2 6. 4x � 5 � �3
7. 2x � 3 � 7 8. 5x � 9 � 4
y
x
y
x
y
x
y
x
y
x
y
x
y
x
y
x
4.4
Name
Section Date
ANSWERS
1.
2.
3.
4.
5.
6.
7.
8.
251
© 2
001
McG
raw
-Hill
Co
mp
anie
s
Solve the linear equations algebraically, then graphically display the solutions.
9. 3x � 2 � 2x � 1 10. 4x � 3 � �x � 2
11. 12. 2x � 3 � 3x � 2
13. 3(x � 1) � 4x � 5 14. 2(x � 1) � 5x � 7
15. 16. 2(2x � 1) � �2x � 10
y
x
y
x
7�1
5x �
1
7� � x � 1
y
x
y
x
y
x
y
x
7
5x � 3 � �
2
5x � 6
y
x
y
x
ANSWERS
9.
10.
11.
12.
13.
14.
15.
16.
252
In exercises 17 to 32, solve each inequality graphically.
17. 2x � 8 18. �x � 4
19. 20.
21. 6x 6 22. �3x � 6
23. 7x � 7 � �2x � 2 24. 7x � 2 � x � 4
y
x
y
x
y
x
y
x
y
x
y
x
�3x � 3
4� �3
x � 3
2� �1
y
x
y
x
© 2
001
McG
raw
-Hill
Co
mp
anie
sANSWERS
17.
18.
19.
20.
21.
22.
23.
24.
253
© 2
001
McG
raw
-Hill
Co
mp
anie
s
25. 2x � 7 � �3(x � 1) 26. 2(3x � 1) � 4(x � 1)
27. 6(1 � x) 2(3x � 5) 28. 2(x � 5) 2x � 1
29. 30. �4x � 12 � x � 8
31. 4x � 6 � 2x � 2(5x � 12) 32. 5x � 3 � 2(4 � x) � 7x
y
x
y
x
y
x
y
x
3x �4x � 5
3
y
x
y
x
y
x
y
x
ANSWERS
25.
26.
27.
28.
29.
30.
31.
32.
254
In exercises 33 to 38, solve the following applications.
33. Business. The cost to produce x units of wire is C(x) � 50x � 5000, and the revenuegenerated is R(x) � 60x. Find all values of x for which the product will at least breakeven.
34. Business. Find the values of x for which a product will at least break even if the costis C(x) � 85x � 900 and the revenue is given by R(x) � 105x.
35. Car Rental. Tom and Jean went to Salem, Massachusetts, for 1 week. They neededto rent a car, so they checked out two rental firms. Wheels, Inc. wanted $28 per daywith no mileage fee. Downtown Edsel wanted $98 per week and 14¢ per mile. Set upequations to express the rates of the two firms, and then decide when each dealshould be taken.
36. Mileage. A fuel company has a fleet of trucks. The annual operating cost per truck isC(x) � 0.58x � 7800, in which x is the number of miles traveled by a truck per year.What number of miles will yield an operating cost that is less than $25,000?
© 2
001
McG
raw
-Hill
Co
mp
anie
sANSWERS
33.
34.
35.
36.
255

© 2
001
McG
raw
-Hill
Co
mp
anie
s
37. Wedding. Eileen and Tom are having their wedding reception at the Warrington FireHall. They can spend at the most $3000 for the reception. If the hall charges a $250cleanup fee plus $25 per person, find the largest number of people they can invite.
38. Tuition. A nearby college charges annual tuition of $6440. Meg makes no more than$1610 per year in her summer job. What is the smallest number of summers that shemust work to make enough for 1 year’s tuition?
39. Graphing. Explain to a relative how a graph is helpful in solving each inequalitybelow. Be sure to include the significance of the point at which the lines meet (orwhat happens if the lines do not meet).
(a) 3x � 2 � 5 (b) 3x � 2 � 4 � x (c) 4(x � 1) 2 � 4x
40. College. Look at the data here about enrollment in college. Assume that the changesoccurred at a constant rate over the years. Make one linear graph for men and one forwomen, but on the same set of axes. What conclusions could you draw from readingthe graph?
No., in Millions, of Men in No., in Millions, of Women inYear the U.S. Enrolled in College the U.S. Enrolled in College
1960 2.3 1.21991 6.4 7.8
ANSWERS
37.
38.
39.
40.
256
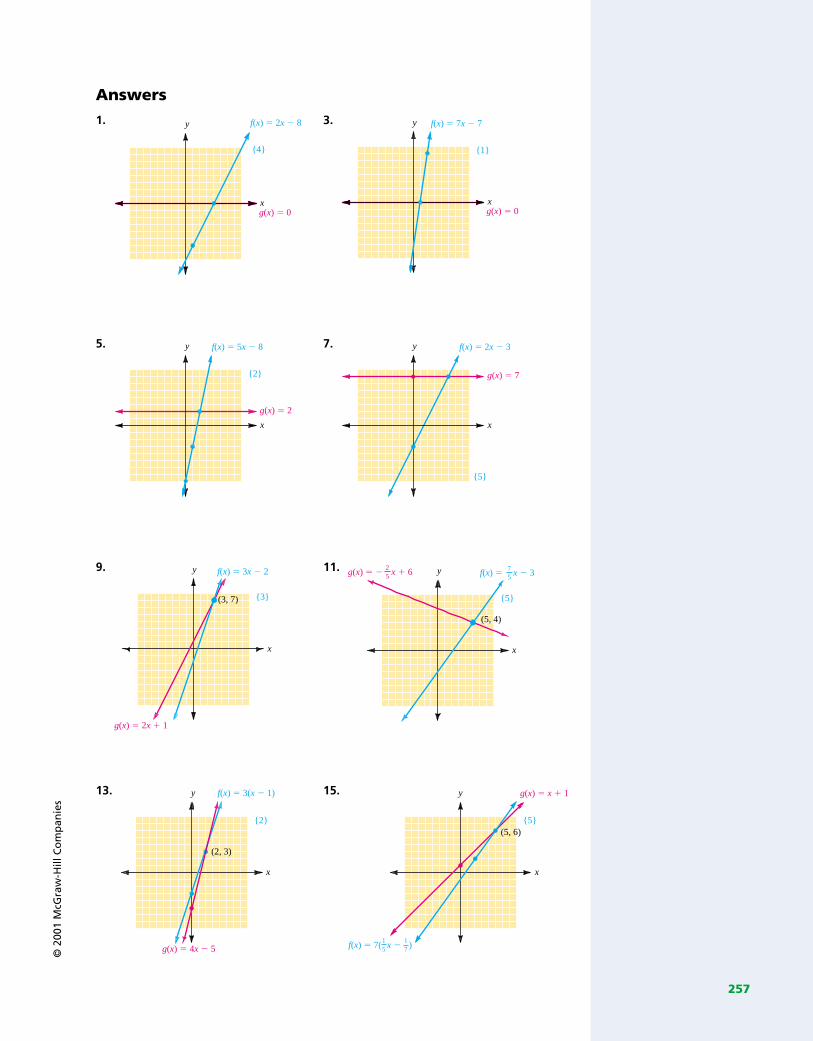
Answers1. 3.
5. 7.
9. 11.
13. 15. y
x
g(x) � x � 1
{5}(5, 6)
f(x) � 7( x � )51
71
y
x
f(x) � 3(x � 1)
g(x) � 4x � 5
{2}
(2, 3)
y
x
{5}
(5, 4)
g(x) � � 52
x � 6 f(x) � 57
x � 3y
x
f(x) � 3x � 2
g(x) � 2x � 1
{3}(3, 7)
y
x
f(x) � 2x � 3
{5}
g(x) � 7
y
x
f(x) � 5x � 8
{2}
g(x) � 2
y
xg(x) � 0
f(x) � 7x � 7
{1}
y
x
f(x) � 2x � 8
g(x) � 0
{4}
© 2
001
McG
raw
-Hill
Co
mp
anie
s
257
© 2
001
McG
raw
-Hill
Co
mp
anie
s
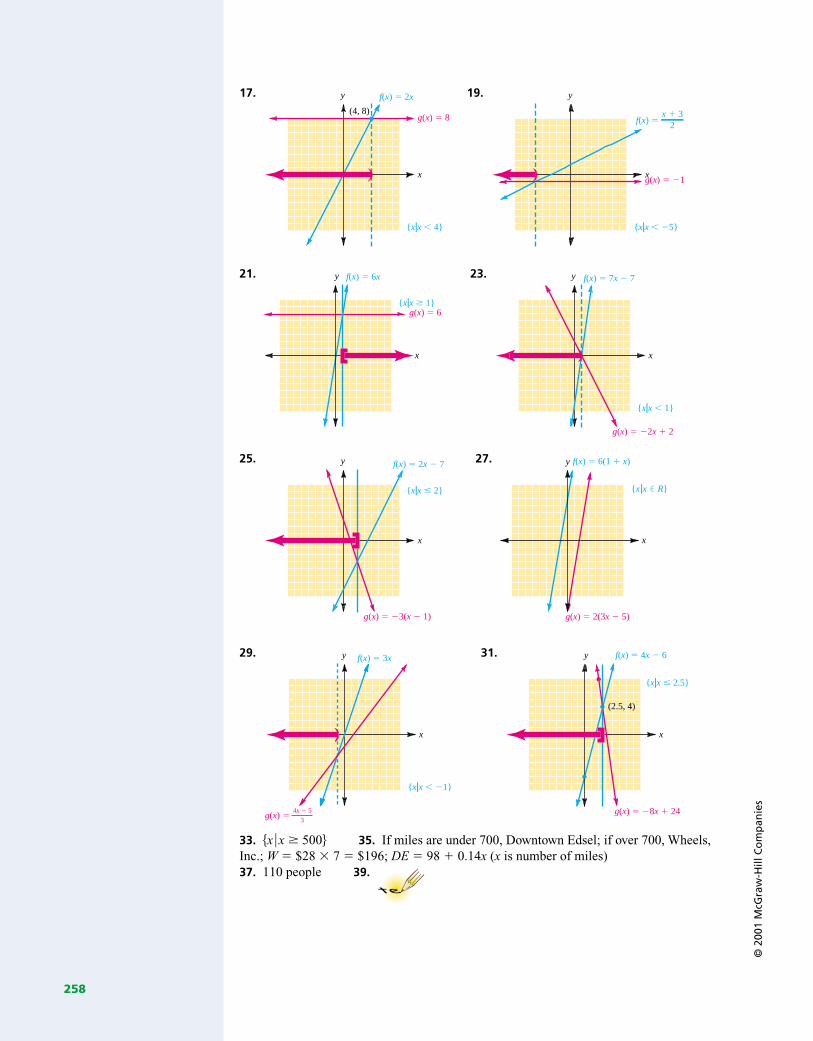
17. 19.
21. 23.
25. 27.
29. 31.
33. �x �x 500� 35. If miles are under 700, Downtown Edsel; if over 700, Wheels,Inc.; W � $28 7 � $196; DE � 98 � 0.14x (x is number of miles)37. 110 people 39.
f(x) � 4x � 6
g(x) � �8x � 24
{x�x � 2.5}
(2.5, 4)
y
x
f(x) � 3x
{x�x � �1}
y
x
g(x) � 3
4x � 5
f(x) � 6(1 � x)
g(x) � 2(3x � 5)
{x�x � R}
y
x
f(x) � 2x � 7
g(x) � �3(x � 1)
{x�x � 2}
x
y
f(x) � 7x � 7
g(x) � �2x � 2
{x�x � 1}
y
x
f(x) � 6x
g(x) � 6{x�x 1}
y
x
g(x) � �1
{x�x � �5}
f(x) � x � 3
2
y
x
f(x) � 2x
g(x) � 8
{x�x � 4}
(4, 8)
y
x
258