Embed Size (px)
Citation preview

450 IEEE JOURNAL ON SELECTED AREAS IN COMMUNICATIONS, VOL. 27, NO. 4, MAY 2009
Congestion-Aware, Loss-Resilient Bio-MonitoringSensor Networking for Mobile Health Applications
Fei Hu, Yang Xiao, Senior Member, IEEE, and Qi Hao, Member, IEEE,
Abstract—Many elder patients have multiple health conditionssuch as heart attacks (of various kinds), brain problems (suchas seizure, mental disorder, etc.), high blood pressure, etc.Monitoring those conditions needs different types of sensorsfor analog signal data acquisition, such as electrocardiogram(ECG) for heart beats, electroencephalogram (EEG) for brainsignals, and electromyogram (EMG) for muscles motions. Toreduce mobile-health (m-health) cost, the above sensors shouldbe made in tiny size, low memory, and long-term batteryoperations. We have designed a series of medical sensors withwireless networking capabilities. In this paper, we report ourwork in three aspects: (1) networked embedded system design,(2) network congestion reduction, and (3) network loss com-pensation. First, for networked embedded system design, wehave designed an integrated wireless sensor network hardware /software platform for multi-condition patient monitoring. Such asystem integrates ECG/EEG/other sensors with Radio FrequencyIdentification (RFID) into a Radio Frequency (RF) board througha programmable interface chip, called PSoc. Second, for networkcongestion reduction, the interface chip can use compressivesignal processing to extract bio-signal feature parameters andonly transmit those parameters. This provides an alternativeapproach to sensor network congestion reduction that aims toalleviate “hot spot” issues. Third, for network loss compensation,we have designed wireless loss recovery schemes for differentsituations as follows. (1) If original sensor data streams aretransmitted, network congestion will be a big concern dueto the heavy traffic. A receiver-only loss prediction will be agood solution. (2) If the signal parameters are transmitted, thetransmission loss mandates a 100% recovery rate. We havecomprehensively compared the performance of those schemes.The proposed mechanisms for m-health system have potentiallysignificant impacts on today’s elder nursing home managementand other mobile patient monitoring applications.
Index Terms—Mobile-health (m-health), sensor networks, net-work congestion, particle filtering, wavelets
I. INTRODUCTION
CURRENT healthcare systems, structured and optimizedfor reacting to crisis and managing illness, are facing
new challenges, e.g., a rapidly growing population of elderlyand rising health care spending. For example, according tothe U.S. Bureau of the Census, the number of adults age 65to 84 is expected to double from 35 millions to nearly 70millions by 2025 when the youngest Baby Boomers retire [1].Also, overall health care expenditures in the U.S. reached $1.8
Manuscript received 30 July 2008; revised 25 November 2008. The workis supported in parts by the U.S. National Science Foundation (NSF) undergrants CNS-0716455 and CNS-0716211.
F. Hu, Y. Xiao, and Q. Hao are with Univ. of Alabama, Tuscaloosa,AL, USA; F. Hu and Q. Hao are with Dept. of Electrical and ComputerEngineering, and Y. Xiao is with or Dept. of Computer Science (e-mails:[email protected], [email protected], [email protected]).
Digital Object Identifier 10.1109/JSAC.2009.090509.
TABLE IMULTIPLE HEALTHCARE PARAMETERS THAT COULD CAUSE ALERTS
Alert Type for Patients Detection Parameterwith Multiple Health that Goes beyond Normal RangeConditionsLow SpO2 SpO2<90% (default values, adjustable)Bradycardia HR>40 bpm (default values, adjustable)Tachycardia HR>150 bpm (default values, adjustable)HR change |ΔHR per 5 minutes |>19%HR stability Max HR variability from past 4 readings
>10%BP change Systolic or diastolic change>±11%
trillion in 2004 with almost 45 million Americans uninsured.In addition, a recent study found that almost one third of U.S.adults, most of whom held full-time jobs, were serving asinformal caregivers - mostly to an elderly parent [1]. It isprojected that U.S. health care expenditures will reach almost20% of the Gross Domestic Product (GDP) in less then 10years, threatening the wellbeing of the entire economy [1].
One critical issue for healthcare providers is the challengeof designing patient-centered processes that can improve thequality and safety of healthcare delivery. Such a patient-centered healthcare should enable improved patient-providerinteractions through advanced communication technologiesfor patients with multiple chronic illnesses. Telemedicinethrough wireless communication networks can allow remotepatient monitoring and convenient patient-provider electronicinformation exchange at any time and any place.
A patient with multiple health conditions needs a specialtelemedicine platform that is able to automatically collectmultiple health parameters from the patient’s body and thentimely send an alert to a remote healthcare office if thevalue of any parameter is beyond normal ranges. Those healthparameters include Heart Rate (HR), blood oxygenation level(SpO2), Blood Pressure (BP), and so on. Table I shows apartial list of physiological conditions that may cause medicalalerts [2], [3], [4], [5].
Recently, a promising wireless Telemedicine technology,called Medical Sensor Networks (MSNs) [6], [7], [8], [9],[10], [11], [12] , [46], [47], [48], has been proposed to closelymonitor changes in patients’ vital signs and provide feedbacksto help maintain an optimal health status. As shown in Fig.1, an MSN sensor typically includes a sensing chip to sensehealthcare parameters, a microcontroller to perform local dataprocessing (such as data compression) and networking oper-ations (such as communicating with a neighbor sensor), anda radio transceiver to wirelessly send/receive healthcare data.The entire MSN sensor is powered by batteries with a lifetime
0733-8716/09/$25.00 c© 2009 IEEE

HU et al.: CONGESTION-AWARE, LOSS-RESILIENT BIO-MONITORING SENSOR NETWORKING FOR MOBILE HEALTH APPLICATIONS 451
Sensing ChipSensing ChipECG signal
SpO2 value
EEG signal
MicrocontrollerMicrocontrollerRadio TransceiverRadio Transceiver
Antenna
Memory Power Source (AA Batteries)
Fig. 1. MSN sensor mote components
of several months. Because the power storage is limited, it isvery important to use low-energy MSN networking operations.
The MSN sensors can improve the healthcare quality greatlysince the automatic, and wireless healthcare data transmissioncan avoid patients’ frequent doctor visits and labor-intensivemanual healthcare parameter collections. Such sensors arealso important to capture medical emergency events. Forinstance, many serious heart problems affecting older peopleare transient and infrequent and can go unnoticed even bythe patients. A sudden slowing of the heart rate that leadsto a fainting spell may last less than a minute and occuronly once or twice a week. This is often enough to makedriving a car dangerous but not frequent enough for a doctorto spot it during a checkup or even by using a portable 24-hourelectrocardiogram (ECG) recorder (called a Holter Monitor).Another problem, the uncoordinated quivering of the smallupper chambers of the heart, a leading cause of stroke inpeople over 70, can be both infrequent and without obvioussymptoms. Therefore, patient-triggered ECG recorders couldmiss it. However, our MSN ECG sensor can automaticallycollect ECG data and trigger an alert to the doctor if the ECGdata mining software finds out an anomaly.
Note that an MSN sensor is different from traditionalwearable/portable medical devices, but this does not alwaysindicate that they are small and have wireless communicationcapability. Most such appliances are much heavier and largerthan an MSN sensor that can be easily attached to a patient’sbody.
We have conducted the practical design of an MSN thathas the following characteristics: (1) Our MSN is able tocontinuously collect multiple healthcare parameters from pa-tients with multiple health conditions, shown in Fig. 2(a).If a patient has multiple chronic diseases, it is importantto monitor multiple body parameters as shown in Table 1,instead of just one of them. Each sensor node can detect,sample, and process one or more physiological signals. Forexample, an ECG sensor can be used for monitoring heartactivity, an electromyogram (EMG) sensor for monitoringmuscle activities, an electroencephalogram (EEG) sensor formonitoring brain electrical activity, a blood pressure sensorfor monitoring blood pressure, and a breathing sensor forrespiration. Our system allows the use of an aggregationsensor, as shown in Fig. 2(a), to integrate all sensor data intodatabase records and send out. We used PDA (Personal DataAssistant) to serve as such an aggregation node, shown in Fig.2(b). (2) Our MSN can be applied in large US Nursing Homesthrough self-managed, relay-based wireless communicationarchitecture. We have built an MSN hardware/software systemthat is suitable to large Nursing Homes with a radius of300∼1000 feet. Each patient’s sensor has limited wirelesscommunication range (typically less than 100 feet) due to thelow-power transceiver and tiny antenna.
Besides the design of MSN hardware (such as RFID,EEG/ECG sensors, RF chips, etc.), we have comprehensivelyinvestigated the following two ways to transmit bio-signals,as shown in Fig. 3. (1) The traditional way (shown in Fig.3 top) is to simply transmit the bio-signals without anyintelligent data processing. The continuous stream (distributedin different packets) keeps flowing in the multi-hop sensornetworks. However, the wireless link can damage some signalvalues. Because any piece of signals could indicate someimportant medical symptom (such as a heart attack), thenetwork needs to recover the lost data. To reduce the networkcongestion, we abandon traditional TCP-style retransmissionand use destination-only loss compensation based on predic-tion algorithms. (2) Another congestion-aware transmission(shown in Fig. 3 bottom) is to compress the medical datathrough feature parameters extraction. The parameters arethen forwarded to the destination. However, the loss recoverycould not use prediction-based schemes since we need 100%error recovery. We thus have proposed a set of completeerror resistant network protocols (including network-assisted,localized recovery and enhanced erasure codes) to guaranteethe final signal reconstruction.
The rest of the paper is organized as follows. Section II pro-vides system architecture and hardware design methodologies.In Section III, we discuss a way to send out raw ECG/EEGstreams and to recover lost data through our proposed non-linear prediction algorithms. Section IV describes our parame-terized transformation for compressive signal transmission andcorresponding complete loss recovery schemes. Experimentresults are presented in Section V. Finally, we conclude thispaper in Section VI.
II. SYSTEM ARCHITECTURE
A. PSoc-based sensor-mote Interface
This work proposes a novel approach of interfacing medicalsensors to a RF mote (which includes wireless commu-nication and a Microcontroller) through a highly versatileProgrammable System on Chip (PSoC) Mixed-Signal arrayfrom Cypress [13], shown in Fig. 4.
The reasons for using PSoc instead of the built-in interfacein our built RF mote (to be discussed in Section II-B) areas follows. PSoc extends the computational capabilities ofthe RF mote, while keeping its power consumption in check.A PSoC Mixed-Signal Array is a low-power programmablesystems-on-chip (SoC) that allows programming of analog anddigital (mixed-signal) components that are typically used inembedded systems. It also has a built-in microcontroller whichintegrates and controls all of the programmed components.Because of the extended computational capabilities throughusing this mixed signal array, complex computations suchas filtering or triggering as well as application-specific datacompression or suppression can be implemented at individualnodes. This can further reduce the data throughput over thenetwork and result in reduced transmission time and improvednetwork traffic. On the other hand, the built-in interfaceof our built RF mote still relies on TinyOS programming,which needs a deep understanding of many NesC sub-libraries.Furthermore, to save space and cost, our RF mote does not

452 IEEE JOURNAL ON SELECTED AREAS IN COMMUNICATIONS, VOL. 27, NO. 4, MAY 2009
Nursing Home
Monitoring Center
Nursing Home
Monitoring CenterWireless
data relay
Multi-hop
Aggregation sensor (PDA)
SpO2 / BP sensor
EMG sensor
EEG sensor
ECG sensor
(a) WSNs for M-Health (b) Aggregation Node
Fig. 2. (a) Wireless Sensor Networks (WSNs) for M-Health and (b) Aggregation Node
Raw Stream
Bio-sensors
{X1, X2, …, Xn}Feature extraction
Pass sensor network without loss recovery
Prediction-based loss recovery
Pass network with 100% loss recovery
Signal reconstruction
Destination
Fig. 3. Two approaches to transmit medical sensor signals
Fig. 4. PSoc-based sensor-mote interface
have enough memory space (<16K bytes) to build multipleinterface routines. However, the PSoc allows multiple digitaland analog interfaces. Its programming style is straightforwardand the debugging tools are based on friendly GUI (GraphicalUser Interface). PSoc also has enough memory space tohandle extra medical signal processing, which is needed in ourmedical signal processing algorithms, explained in Sections IIIand IV.
The PSoC design software is different from those usedfor programming traditional fixed-function microprocessorbecause of PSoC’s configurable analog / digital hardwareblocks. The PSoC Designer Integrated Development Environ-ment (IDE) developed by Cypress Microsystems [13] is aninnovative software development environment. It is a GUI-based design suite that simplifies the designing of the config-urable blocks, provides the libraries for developing customizedapplication code, and also provides advanced debugging toolsto support the programming of the PSoC chip.
The raw data packets that are transmitted from PSoC toour designed RF mote (Section II-B) using UART port have
format shown in Fig. 5. The data has to be sent in a little-endian format. The synchronization byte (0x7E), packet type(0x42), UART address (0x007E = 7D 5E 00, because ofescaping byte), Message type UART (0A) and Group ID(7D) are highlighted in Fig. 5. The highlighted bytes on thethird column are the CRC (Cyclic Redundancy Check) errorcorrection bytes.
Fig. 6 describes our program flow of PSoC in order tosend the data in the TinyOS message structure describedabove. Since the data payload and the CRC change with eachpacket, a 13-integer array, iData (Fig. 6), containing onlythe data payload, is initialized with the constant source moteas 0x0001, cumulative data count as 0x0000, ADC channelnumber (remains constant) as 0x0001, and the sampled dataas all zeros. Ten sampled values are then added to the iDataarray. A cumulative count variable is used to keep track ofthe last sample number transmitted. This count is loaded intothe iData array after the samples have been loaded. The iDataarray is now required to be converted to a 26-character arraybecause all the sampled data is to be transmitted in the little-endian format. Once the new character array is formed, theCRC is initialized with a pre-calculated value of the standardbytes because they remain the same with every packet. The PCnow jumps to the UART sending function that initially sendsout the standard bytes (highlighted in Fig. 5, first column) thenthe character array that contains the data payload followed bythe CRC.
B. RF Mote Design
Our original RF mote was based on TelosB motes fromCrossbow Inc. [15]. It is an ultra-low-power wireless moduleintended for sensor networks applications. Regarded as thenext-generation mote platform, it offers 10kB on-chip RAMand also provides IEEE 802.15.4 Chipcon radio [16] withan integrated on-board antenna providing up to 125 metersof range. Constructed around a TI MSP430 microcontroller[17], the TelosB has on-board ADC peripherals with expansionbays, to which the customized sensor board is connected.
However, we found out a few problems when using TelosB.First, its unit price is high in terms of large-scale MSNdeployment [15]. Secondly, its power lifetime is around 3∼6months depending on how often the ECG signal is transmitted

HU et al.: CONGESTION-AWARE, LOSS-RESILIENT BIO-MONITORING SENSOR NETWORKING FOR MOBILE HEALTH APPLICATIONS 453
Fig. 5. Data format to be sent to RF mode
Start
Initialize array iData for Payload
Set ADC to sample continuouslyA
IsADC data Ready?
Increment cumulative data count by 0x0a
Populate iData[i+2] with ADC sampled data
B
Calculate CRC of data payload + standard bytes
Reset cnt to 0x000a
Enter cnt in iData array
A
IsCnt > 0xfff5?
UART sends sync bytes + standard bytes along with character array and
CRC bytes
Convert iData array to character array and change format to little endian
B
Initialize peripherals: ADC, UART
No
Y es
Y es
for i = 1 to 10
No
Fig. 6. Flowchart describing the PSoC sending sampled data
back to the server. Ideally, we hope that a cardiac patientcan carry such a low-cost ECG sensor for at least one yearwithout worrying about power exhaustion. Thirdly, its radiocomponents cannot be enhanced since we cannot use a betterradio transceiver / antenna to reach a longer distance.
Due to the above reasons, we have used Ember CPU-RFchips [18] to build our own RF motes shown in Fig. 7(a).The RF mote size is a little larger than 2 AA batteries. Theheart of the RF board is the Micro Central Unit (MCU) /ZigBee [19] Transceiver unit. To design such a RF mote,we could use either a separate MCU / Transceiver, or use aSoC (System-on-Chip) that incorporates the two componentstogether. The SoC option was chosen as it would be cheaperto implement, decrease programming complexity, and createan easier Printed Circuit Board (PCB) layout, as there willbe fewer parts to layout. The Ember EM250 SoC [18] wasselected for use in the ZigBee Data Forwarding Unit (DFU).
C. ECG Sensor
Our ECG sensor board design is assisted by HarvardUniversity CodeBlue team [20]. The ECG lead extensions
from the sensor board are pin-compatible and color codedto standard 3-Lead ECG monitoring systems. While there aredifferent flavors of physiological chest leads, this system wasdesigned to match any 3-Lead ECG Snap Set Lead wires.The Snap Set may be used to collect data by attaching tothe appropriate jellied ECG conductive adhesive electrodes ifhumans were to be used for testing purposes. An alternativewould be ECG signal simulators, as explained next.
The ECG generator used in this project is the Model 430B,12-lead ECG generator as shown in Fig. 7(b). This generatorprovides a complete PQRST waveform at six preset rates (60,75, 100, 120, 150, and 200 BPM (beats per minute)) as well assix preset amplitudes (0.1, 0.2, 0.5, 1.0, 2.0, and 5.0 mV). It isalso capable of generating square waves using its 5 ECG snapsplus 10 banana jacks. This provides a good testing interfacebecause this project will be upgraded to a 12-lead monitoringsystem in the future. Fig. 7(b) also shows the connectionbetween 430B ECG simulator and our designed RF motes.
D. EEG Sensor
Recently we have designed a low-cost, portable, wirelessEEG sensor platform that includes two primary elements:
454 IEEE JOURNAL ON SELECTED AREAS IN COMMUNICATIONS, VOL. 27, NO. 4, MAY 2009
(a) Our built RF Board (b) Model 430B Patient Simulator (c) Analog EEG Board with Electrodes
Fig. 7. (a) Our built RF Board, (b) Model 430B Patient Simulator, and (c) Analog EEG Board with Electrodes
the analog board (i.e., EEG sensor shown Fig. 7(c)) and thedigital board (also called “wireless mote” or “RF board”).Fig. 8 shows the system architecture. We implemented onlya two-channel case. More channels could be easily extendedbased on the same circuit principle. Two electrodes collectthe EEG channel data from the brain and one electrodegoes to the right leg. The input EEG analog signals needto pass DC (Direct Current) filter, amplifier, A/D converterand high-frequency filter. After the analog board filters andconditions the EEG signal, the A/D output is processed bythe PSoc chip. The ESD (Electro-Static Discharge) circuituses diode to achieve IC (Integrated Chip) protection and userwearing safety. The analog EEG signal amplification circuitis a crucial part. We did not use general instrumentationor linear amplifiers because we have found out that multi-stage combinational amplifier could provide a more accurateoutput gain. The Bessel Low-pass filter is adopted to filterout low-frequency signals. The digital board runs wirelesscommunication protocols.
The digital board samples the output signal of the analogboard. It accurately produces a digital representation of theEEG waveform. It then encapsulates the data into packets andsends them from the EEG sensor to a remote base station.Fig. 9 shows the entire design procedure of the digital boardsoftware. The EEG sensor remains in a passive listen stateuntil the radio receives a valid message.
E. RFID Design
There is not much research conducted on the integrationof RFID into medical sensor networks even though RFIDcould play an important role for elder cardiac healthcare.We have proposed to use the following two types of RFIDreaders in our MSN platforms for better monitoring of cardiacelder patients [47]: (1) Use Ultra-high frequency (UHF) RFIDreaders for patient tracing. They will be installed in the wallsof nursing homes to keep track of cardiac patients’ positionsin the buildings. UHF readers work at around 900MHz radiofrequency and have a tag-reading distance of 50∼150 feet.A UHF reader could send the patients’ location informationto a backend information database shown in Fig. 10. (2)Use High frequency (HF) RFID readers for medicine-takingmanagement. It is important to monitor the medicine name,taking amount, and taking schedule for elders who may nothave clear minds. Some medicine should be taken immediately
after an abnormal ECG signal is detected by the medicalcenter. For example, Heparin, a blood thinner, should betaken immediately after a heart attack. A HF reader couldbe embedded into the patient’s ECG sensor. For example,SkyeRead M1-Mini reader [21] could be integrated into aCrossbow sensor. The HF reader could read the medicine tagthrough the radio frequency of 13.56 MH. HF readers workwell within a distance of 5∼15 feet. Because a sensor (withthe HF reader) participates in the communications, shown inFig. 10, the medicine information finally enters the cardiacdatabase.
Fig. 11 shows our RFID control software modules. TheMSN gateway software is responsible for server-to-sensorswireless data transmission control, and the RF mote softwarehas all RFID Reader/Tag control functions (such as the colli-sion detection between one reader and multiple tags).
Unfortunately, none of the commercialized RFID readersallow us to reprogram the RFID for our proposed one-to-manyreader-tag collision avoidance protocol. In addition, currentRFID readers are very expensive.
F. EEG Warning Sub-System
Abnormal heart beats or brain status needs an accuratewarning system. The mental disorder warning signals could betriggered in two places of our system, shown in Fig. 12. (1) Atthe local processing unit, we designed EEG pattern recognitionsoftware in PSoc to perform initial, simple classification onnormal/abnormal EEG patterns. Abnormal pattern detectionwill trigger the warning device, which is an audio circuitto be designed in this project. The tiny warning device isintegrated with the EEG sensor so that the patient can hear itclearly. (2) At the remote server (doctor’s machine), the serverruns comprehensive mental disorder detection software. If anyserious drowsiness is detected, a warning message will be fedback to the patient’s EEG sensor.
III. WIRELESS-LOSS-RESILIENT MEDICAL
TRANSMISSION
There will be significant ECG/EEG data loss in a large-scale wireless sensor network. We have used the traditionaltwo ways to achieve reliable sensor transmission in a wirelessapplication [22], i.e., FEC (Forward Error Correction) andARQ (Auto Retransmission reQuest). Unfortunately, those twoschemes can largely shorten our sensors’ lifetime due to the

HU et al.: CONGESTION-AWARE, LOSS-RESILIENT BIO-MONITORING SENSOR NETWORKING FOR MOBILE HEALTH APPLICATIONS 455
Ch1 Electrode
EEG Signals
C h1
Ch2 Electrode
Right leg Electrode
ESD Protection & Current Limiter
Amplify Analog Signals
Reference for Skin Potential
Filter Analog Signals
Transmit through wireless communication protocol
Reconstruct EEG
Wireless error control
Generate EEG Visual Feedback
Visualize wireless networks
Visual feedback
Visual Topology
Digital output from analog board
Fig. 8. System level block diagram of wireless EEG sensor networks
Sampling of
Analog
Signals via
MSP430
12-Bit ADCs
Packetization
of EEG Data
TelosB Node Mote w/ MSP430 Processor, Chipcon CC2420 802.15.4 Radio
Input from analog circuit
Output to Monitor &
Database
Packetization
of EEG Data
Transmission
of Data Via
CC2420
Receipt of
Packets via
CC2420
Transmission
of EEG Data to
Base
Computer via
USB
TelosB Gateway Mote
Packet
Parsing &
Data
Extraction
Real-Time
Display and
Aggregation
of Data
Base Station Software
Fig. 9. Digital signal /Software Flow Diagram
Medicine Tag
Location Tag
Medicine
Medical Sensor Network
UHF Reader
Medical Database
HF ReaderRF mote
Fig. 10. UHF/HF RFID Readers for healthcare
large wireless communication overhead. FEC adds redundanterror-control bits to the source data, and ARQ uses frequentretransmissions. The above two traditional schemes ignoredthe following simple fact [23], [24]: in resource-constrainedMSN, most of node’s power energy is consumed in hop-to-hopwireless communications instead of in local CPU processing.(In Section V, we will provide energy measurement results).The energy cost of transmitting 1 KB for a distance of 100 m isapproximately equal to executing 3 Million local instructionsby a 4MHz CPU [25].
Thus, this research has resorted to destination-side lossrecovery approach (i.e., predicting system future states bya sensor mote itself ). It uses only local processing without
resorting source sensors. Unlike FEC and ARQ, our schemedoes not increase wireless communication overhead. We haveconducted a comparative study of two promising interference-resistance methods, i.e., Sequential Monte Carlo (also calledparticle filters) [27] and Extended Kalman Filtering (EKF).We hope to obtain insights into which method works betterfor ECG/EEG loss compensation.
A. Monte Carlo Based Loss Compensation
The motivation for using particle filters (or SequentialMonte Carlo) is two-fold. For one, particle filters can representalmost arbitrary posterior distributions; they are certainly well-suited to accommodate the types of uncertainty that arise inour distributed control scenario. More importantly, particlefilters estimate posteriors over entire paths, not just the currentstate. Each particle can be thought of as an entire history ortrajectory, and the set of all particles represents an approxima-tion of the posterior over trajectories. This property of particlefilters is not owned in Kalman filters.
We are concerned with the real-time next state estimationfor non-Gaussian MG control signals. The unobserved globalstate {xt; t ∈ N} is modeled as a Markov process with initialdistribution p(x0) and transition probability p(xt|xt−1). Theobservations {yt; t ∈ N∗} are assumed to be conditionally

456 IEEE JOURNAL ON SELECTED AREAS IN COMMUNICATIONS, VOL. 27, NO. 4, MAY 2009
Sensor Network Gateway Control (to receive RFID readings / sensor data) RF sensor-RFID
control module
RF sensor-RFID control module
RFID one-to-many Reader-to-tag collision avoidance Module
RFID reader-tag communication protocols RFID tag data collection protocols
Fig. 11. RFID Control Software Modules
Fig. 12. (In EEG design) Drowsiness Warning System
independent in time given the process xt and of marginaldistribution p(yt|xt). We denote system state up to time t
as x0:t�= {x0, · · ·,xt} and observations up to time t . The
measurements yt are recorded by K controllers, and we use ykt
to denote the subset of observations made by the k − th con-troller. Our goal here is to predict (in real time) the posterior
distribution p(x0:t|y1:t). y1:t�= {y1, · · ·,yt}. We call state
trajectories as particles. There is an importance weight asso-ciated with each particle. At a given time instant, this weightis representative of how well the state trajectory conforms tomodel dynamics and describes the set of observations, relativeto the other particles. Whenever there is a transition betweentime instants, and a new observation becomes available, eachtrajectory is extended, and its associated weight is adjustedaccording to how well it explains the new observation.
If we do not use networked prediction, that is, there exists asingle controller in the entire system that accepts all sensors’inputs and controls all devices, (this centralized control is notrealistic in our scenario), and we may follow generic steps toestimate the posterior distribution [26], [27]:
Step 1 (particle initialization): Each particle (total number:N) is sampled from initial distribution. x(i)
0 ∼ p(x0), and everyimportance weight is initialized to: ω
(i)0 ∼ 1/N .
Step 2 (importance sampling): For each I = 1, 2, · · · , N ,x(i)
0 is sampled from an importance distributionπ(xt|x(i)
0:t−1,y1:t), which may be any distribution. Theimportance weights are evaluated as:
ω(i)i =
p(yt|x(i)t )p(x(i)
t |x(i)t−1)
π(x(i)t |x(i)
0:t−1, y1:t)(1)
TABLE IIDESCRIPTION OF THE VARIABLES
Variable Meaningxk Actual state vectorzk Actual measurement vectorxk Approximate state vector from 5.3zk Approximate measurement vector from 5.4xk An aposteriori state estimate at time kwk Random variable representing process noisevk Random variable representing measurement noiseA The Jacobian matrix of partial derivatives of f
with respect to xW the Jacobian matrix of partial derivatives of f
with respect to wH The Jacobian matrix of partial derivatives of h
with respect to xV The Jacobian matrix of partial derivatives of h
with respect to v
Step 3 (selection): N particles{x(i)
0:t; i = 1, · · · , N}
are formed by sampling with replacement from the set{x(i)
0:t; i = 1, · · · , N}
where the probability of sampling the i-
th trajectory is ω(i)t . Note that Steps 2 and 3 will be repeated
until system convergence.
B. Extended Kalman Filtering
A Kalman filter that linearizes about the current mean andcovariance is referred to as an EKF [28]. We have used EKFto recover the damaged ECG data [47]. The information inTable II shows some variables used.
For the EKF, the state estimate is governed by a non-lineardifferential equation. Assume that f represents the non-linearfunction that relates the state at the previous time step, k - 1,

HU et al.: CONGESTION-AWARE, LOSS-RESILIENT BIO-MONITORING SENSOR NETWORKING FOR MOBILE HEALTH APPLICATIONS 457
to the state at the current time step, k. An optional drivingfunction may be included as uk−1, and w represents the zero-mean Gaussian process noise. The measurement equation is inEq. (3). Similarly, h is the non-linear function that relates xk
to the measurement zk. Assume that vk is the measurementnoise. Since individual noise values, wk and vk , are not knownat each time step, instead the estimated state and measurementcan be replaced with equation Eqs. (4) and (5), respectively. Inboth, xk is a posteriori estimate of the state from a previoustime step k.
xk = f(xk−1, uk−1, wk−1) (2)
zk = h(xk, vk) (3)
xk = f(xk−1, uk−1, 0) (4)
zk = h(xk, 0) (5)
New linearizing equations are needed to estimate a processwith non-linear relationships. The governing equations seen inEqs. (6) and (7) linearize about Eqs. (4) and (5), respectively.The equations for the matrices A, W , H , and V , seen in theseequations can be seen in Eq. (8) through Eq. (11), respectively.For simplicity, the time subscript k is not used in the notationfor these matrices even though they are in fact different ateach time step.
xk ≈ xk + A(xk−1 − xk−1) + Wwk−1 (6)
zk ≈ zk + H(xk − xk) + V vk (7)
A[i,j] =∂f[i]
∂x[j](xk−1, uk−1, 0) (8)
W[i,j] =∂f[i]
∂w[j](xk−1, uk−1, 0) (9)
H[i,j] =∂h[i]
∂x[j](xk, 0) (10)
V[i,j] =∂h[i]
∂v[j](xk, 0) (11)
Given all this information, a new prediction error andmeasurement residual can be defined. Recall that the measure-ment residual reflects the discrepancy between the predictedmeasurement, zk, and the actual measurement, zk . These canbe seen in Eqs (12) and (13), respectively.
exk≡ xk − xk (12)
ezk≡ zk − zk (13)
Unfortunately, in practice one does not have access to xk
in Eq. (12), since it is the actual state vector attempting tobe estimated. One does have access to zk since it is theactual measurement that one is using to make an estimate.
By utilizing Eqs. (12) and (13), approximate linear governingequations for an error process can be written. These can beseen in Eqs. (14) and (15). It should be noted εk and ηk, repre-senting new independent random variables having zero meanand covariance matrices WQkW
T and VRkVT . Recall thatQ and R are the process noise covariance and measurementnoise covariance matrices, respectively. Additionally, exk
hasa covariance matrix of E
⌊exk
eTxk
⌋.
exk≈ A(xk−1 − xk−1) + εk (14)
ezk≈ Hexk
+ ηk (15)
It can be seen that Eqs. (14) and (15) are linear, and resem-ble the original discrete Kalman filter cases. This suggests thatthere should be a better way to estimate the error predictionof Eq (15). This new estimate of exk
, called e, can be foundby using Eq (13) and a second hypothetical Kalman filter. TheKalman filter equation used for this estimate is:
ek = Kkezk(16)
Once Eq. (16) is attained, it can be used in Eq. (17) toobtain an aposterioristate estimate for the original non-linearprocess. By substituting Eq. (16) into Eq. (17), the equationin Eq. (18) is obtained. Finally, by substituting Eq. (13) intoEq. (18), the equation which will be used for the measurementupdate in the extended Kalman filter is achieved (see Eq. (19)).Note that xk and zk come from Eqs. (2) and (3), with theappropriate substitution for the measurement error covariance.
xk = xk + ek (17)
xk = xk + Kkezk(18)
xk = xk + Kk(zk − zk) (19)
C. ECG Modeling for Particle Filtering / EKF computation
Due to the non-linearity of ECG data, we need to determinethe equation which governs an ECG and apply it to the EKF.Produced by an ECG, the signal is constructed by measuringelectrical potentials between various points of the body usinga galvanometer. Fig. 13 shows an example of a normal ECGtrace, consisting of a P wave, a QRS complex and a T wave.
McSharry et al. have proposed a synthetic ECG generator,which is based on a nonlinear dynamic model [29]. Thismodel has several parameters, P , Q, R, S, and T , whichcome from the ECG, and makes it adaptable to many normaland abnormal signals. The dynamic model consists of a threedimensional state equation, which generates a trajectory withthe coordinate (x,y,z). These equations may be seen in Eq.(20) through Eq. (22). The variables α, Δθi, and θ are givenin Eq. (23) through Eq. (25). Note that Eq. (25) is the fourquadrant arctangent of the real parts of the elements of xand y, with the bounds given in Eq. (26). The variable ω isthe angular velocity of the trajectory as it moves around thelimit cycle. The baseline wander of the ECG signal has beenmodeled with z0.

458 IEEE JOURNAL ON SELECTED AREAS IN COMMUNICATIONS, VOL. 27, NO. 4, MAY 2009
Fig. 13. Example of a Normal ECG Trace
x′= αx − ωy (20)
y′= αy + ωx. (21)
z′= −
∑i∈(P,Q,R,S,T ))
αiΔθiexp
(−Δθ2
i
2b2i
)− (z − z0) (22)
α = 1 −√
x2 + y2 (23)
Δθi = (θ − θi)mod (2π) (24)
θ = arctan2 (y, x) (25)
−π ≤ arctan (y, x) ≤ π (26)
The three dimensional trajectory which is generated consistsof a circular limit cycle which is pushed up and down when itapproaches one of the P , Q, R, S, and T points. In fact, eachof the components of the ECG waveform has been modeledwith a Gaussian function, which is located at a specific angle.This can be seen in Eq. (20) through Eq. (22) by neglecting thebaseline wander term, z − z0, and integrating the z
′equation.
The projection of the three dimensional trajectory on the zaxis gives a synthetic ECG signal.
IV. NETWORK CONGESTION AWARE MEDICAL
TRANSMISSION
A. Medical Data Compression through Feature Coefficients
The above section simply transmits original ECG waveswithout any compression. Its advantage is to reduce softwarecomplexity and CPU processing workload. Furthermore, theloss recovery algorithms in the receiver side does not needto be 100% reliable since the consecutive ECG can still beunderstood even with some data errors. However, the abovescheme brings significant network overhead. The wirelessbandwidth can be easily consumed by the ECG/EEG streamsand thus network congestion (called “hot spots”) can occur insome middle sensors. To reduce the network congestion andalso save wireless transceiver energy consumption, we proposeto use accurate feature extraction to compress the generated
ECG wave data. Our feature finding strategy is based on multi-scale wavelet analysis [48]. It can use localized singularitydetection to zoom in non-smooth ECG variations.
The application of wavelet decomposition can provide fea-ture coefficients for ECG classification. This initial heart beatpattern classification can at least tell us whether the patienthas any abnormal heart beats. Therefore, our PSoc interface(see Section II-A) can filter normal sensor data and onlytransmit abnormal data. This further saves network bandwidth.To improve the ECG classification accuracy in terms ofidentifying different types of abnormal heart beats, we haveinvestigated the theory of Support Vector Machine (SVM),which has been proved to be able to minimize the probabilityof misclassifying yet-to-be-seen patterns [31], [32]. The basicprocedure of SVM algorithm is as follows. Considering theproblem of separating the set of training vectors belonging totwo separate classes, we have
S = {(x, y) | {(x1, y1) , (x2, y2) · · · , (xL, yL)} ;x ∈ Rn, y ∈ (−1, 1)} (27)
To apply the above SVM theory, we first extract somedominant features from ECG data to serve as the SVMclassification vectors. Wavelets analysis is well known forits feature extraction efficiency for non-periodic signals. TheWavelet Transform of a function f is a convolution productof the time series with the scaled and translated kernel, andis given by:
WS,X0 =∫ +∞
−∞
1s• Ψ
(x − x0
s
)• f (x) dx (28)
, where s is a scale parameter and is a space parameter.To find out the “features” (i.e., the singularity points) of
the above wavelet function, here we introduce the concept ofLocal Holder Exponent (LHE) [33]. The LHE of a functionf(•) at the point x0, denoted as h(x0), is defined as the largestexponent such that there exists a polynomial Pn (x) of ordern satisfying the following condition for a in a neighborhoodof x0:
|f (x) − Pn (x − x0)| ≤ C • |x − x0|k (29)
To reduce the regular wavelet analysis redundancy andcalculation complexity, WTMM [33] proposes to change the“continuous” sum over space (see Eq (2)) to a “discrete”sum over the local Maxima of |Ws,x0 (f)|. Although WTMMprovides efficient estimation for “Global” scaling of ECG timeseries, it has been shown that the “Local” scaling analysiscould provide more relevant information on feature extraction[34]. Through the Struzik Multiplicative Cascade Model [34],we can estimate the LHE at singularity x0 as the slope [48].
Even though the wavelet analysis and LHE can provideus a series of ECG features, it is necessary to increase theaccuracy of the induction algorithms through the reduction ofparameters. We used Wrapper approach in [31] to conduct asearch in the wavelet space. Our Wrapper algorithm includesa “State” that is a vector of LHE, an initial state (set to empty),a heuristic evaluation through 5-fold cross-validation (repeatedmultiple times with a small penalty for every ECG feature),and a Hill-climbing search algorithm.

HU et al.: CONGESTION-AWARE, LOSS-RESILIENT BIO-MONITORING SENSOR NETWORKING FOR MOBILE HEALTH APPLICATIONS 459
1. Adaptive Wavelet (use software threshold wavelet for easier scaling analysis)
1. Adaptive Wavelet (use software threshold wavelet for easier scaling analysis)
2. WTMM Transformation2. WTMM Transformation 2a. Generate WTMM coefficients and Maxima Lines2a. Generate WTMM coefficients and Maxima Lines
3. Struzik Multiplicative Cascade Algorithm
3. Struzik Multiplicative Cascade Algorithm
3a. Holder Exponent Estimation3a. Holder Exponent Estimation
4. Wrapper algorithm for feature reduction4. Wrapper algorithm for feature reduction5. Feature coefficients & classification5. Feature coefficients & classification
Fig. 14. ECG Data Series Feature Extraction Software components
Regarding to heart beat Arrhythmia, we have chosen thefollowing four types: (1) Paced rhythm, (2) Atrial Fibrilla-tion, (3) Nodal (A-V junctional) rhythm, and (4) Ventricularfibrillation. For each of the five rhythms (i.e., Normal (NSR),Paced, A-Fib, Nordal, and V-Fib), we have used the followingprocedure (see Fig. 14 [48]) to extract the WTMM LHEs thatwill be used for the input vectors of SVM model. Note thatStep 3a (in Fig. 14) does not directly use the “single-value”Holder exponents since we have used statistical analysis basedon large amount of MIT-BIH arrhythmia record flows [35].Thus we have calculated the Probability Densities of differentLHEs and then fitted those densities into a Gaussian model.
B. Wireless Loss Recovery for Compressed Transmission
Here we revisit wireless loss recovery issue from anotherperspective. Although we could use Particle Filtering / EKFto achieve good loss compensation, we do not need to achieve100% loss recovery for continuous ECG waves. However, inthe compressed data transmission through wavelet feature ex-traction, any wavelet coefficient is critical to destination signalreconstruction. In other words, we need a 100% wireless lossrecovery rate. We have used two strategies to perform 100%loss recovery: one is hop-to-hop, localized retransmission andthe other is end-to-end, code-distribution based reconstruction.
1) Hop-to-hop Localized Loss Recovery: Data Retrans-mission (D-R) is a typical approach since it can resendthe damaged data packet. Most D-R schemes are based onInternet TCP that uses end-to-end retransmission, and allrouters between the two ends do not check / recover packetloss. Although simple and publicly available, TCP cannotachieve optimal MSN error recovery performance due tothe following reason: the wireless transmission errors canaccumulate exponentially over each hop. To simply illustratethis, assume that the packet error rate of a wireless hop is p,and then the chances of exchanging a message successfullyacross a single hop is (1− p). The probability that a messageis successfully received across n hops decrease quickly to(1− p)n.
Inspired by [22] but with 100% recovery consideration, wehave designed a localized loss recovery scheme as shown inFig. 15. First of all, the sensors use a self-organized topologymanagement scheme to get to know which “ripple” it belongs
to. The same ripple means the same number of hops to a sink(base station). In Fig. 15, after B sends out a packet to A (theclosest sensor to B), B sets up a timer T1. If T1 expires and Bhas still not received a positive acknowledgement packet fromA, B will retransmit the packet to A. If B attempts more than3 retransmissions without success, it regards A as unreachable(possibly due to an unreliable wireless link), and it then findsanother good path as follows. B checks the reachability ofA’s neighbors H and E. If either of them is reachable, Bwill transmit the packet to one of them. If both H and E areunreachable, it goes back one ripple, i.e., to K. K discoversB’s neighbors and tries to deliver the packet. Eventually thepacket gets through without any loss.
2) End-to-end Loss Recovery through Multi-path ErasureCodes: Using erasure code [39], [40], we can reconstructm original messages with any m out of n code words.Its basic principle is shown in Fig. 16, where the originalbits could be added some redundant bits, and even partialreceived bits could be used to reconstruct original message.If n is sufficiently large compared to the loss rate, wecan achieve high reliability without retransmission [41]. Aparticular erasure code algorithm called Reed-Solomon (R-S)code is used. For R-S encoding process, there exists encodingfunction C(X) where X is a vector of m messages. ThenC(X) will produce a vector of n code words (n > m). Alinear code has a property of C(X) + C(Y ) = C(X + Y ).A linear code can be represented with a matrix A, and codeword vector for message vector X is simply AX . Encoding ismatrix-vector multiplication. Decoding is finding X such thatAX = Z for a received code word vector Z . This is to find thesolution of linear equation AX = Z . This code is very useful,since encoding and decoding are computationally inexpensive.This is especially attractive in resource-constrained sensornetworks.
Matrix A should have m linearly independent rows sothat linear equation has unique solution, and in turn uniquemessage vector. Vandermonde Matrix is typically used [39],[41]. For n by m Vandermonde matrix (n > m), any set ofm rows forms nonsingular matrix. That is to say, whateverset with m rows we may choose, rows in the set are linearlyindependent. It has the following format:

460 IEEE JOURNAL ON SELECTED AREAS IN COMMUNICATIONS, VOL. 27, NO. 4, MAY 2009
ECG sensor
Sink
Fig. 15. Ripple-to-ripple loss recovery
Original k bits
R -S C oded bits
R edundant bits
Destination s ideS ourc
es ide
Any k bits
Original bits
R econstruction
Fig. 16. Multi-path receiving to reconstruct original data via erasure codes
⎡⎢⎢⎢⎢⎢⎣
1 x1 x21 · · · xm−1
1
1 x2 x22 · · · xm−1
2...
...... · · · ...
1 xn−1 x2n−1 · · · xm−1
n−1
1 xn x2n · · · xm−1
n
⎤⎥⎥⎥⎥⎥⎦ (30)
Erasure codes implementation for sensor networks is pre-sented as follows. First, we need to encode the applicationlayer messages (that hold EEG/ECG data) into code words.To reduce communication overhead, we need to put multipleindependent code words into a packet. Second, we needto use the concept of extension field [41], where a fieldis any set of elements which satisfies the field axioms forboth addition and multiplication and is commutative divisionalgebra. Field axioms include commutativity, associativity,distributivity, identity, and inverse. An archaic name for a fieldis rational domain. A field with a finite number of membersis known as a finite field or Galois field. Extension field isa Galois field whose elements are integers in [0, pr − 1]. Forefficient use of bits in packets, we use extension field withbase 2. Third, we need an operation table in the sensor’smemory for the following reasons. Operations on extensionfield are not simply addition and multiplication combinedwith modulo operation. They are polynomial operations withmodulo. Rather than performing complex computation onthe fly, a table is used to lookup result of operation. Formultiplication and division operation, exponent and log valuesare computed and stored as tables.
Fig. 17. MSN software GUI (Graphical User Interface)
Fig. 18. EEG signal visualization in the doctor’s machine
V. EXPERIMENTAL RESULTS
A. System GUI (Graphical User Interface)
All patients’ sensors have the capability of remotewakeup/sleep control. The monitoring center can pull out anysensor’s data and visualize them in a friendly GUI, shown inFig. 17. We have also embedded CodeBlue sensor localizationtechnology [9] in our software. This is GPS-free system witharound 3 meters of localization errors.
Fig. 18 shows the GUI for EEG signal capturing. EachEEG channel’s data is displayed separately. The EEG signalscould be changed easily if the patient blinks the eyes due toelectrical signal interference from eyes and scalp. Therefore,our software allows remote “zoom-in” for a specific patientto observe the EEG values with higher resolution over a longterm. Fig. 18 shows a button called “Zoom mode” in the rightside of the GUI.
Our ECG analysis software can automatically highlight allTRS peaks for doctor’s better heart attack decision. It is basedon function’s localized singularity analysis. Fig. 19 illustratesthis effect.
An important feature of our MSN software is that weare able to control the ECG sensors’ performance parame-ters (such as ECG detection threshold) through the remotecommand transmission from the server to any ECG sensor.We can set up the ECG server (i.e., the MSN workstation)control parameters to change the sensors’ detection frequency,i.e., how many ECG values which we should collect in eachsecond. As we know, a higher detection frequency can bring

HU et al.: CONGESTION-AWARE, LOSS-RESILIENT BIO-MONITORING SENSOR NETWORKING FOR MOBILE HEALTH APPLICATIONS 461
Fig. 19. ECG Data Display (Top) original stream with automatic ECG wavepeak finding (Bottom)
higher ECG signal quality; however, it also causes the higherpower consumption in each sensor, and more memory storageoverhead in each RF board. A good balance is needed. Herewe collect ECG values every 0.01 seconds, which is goodenough to capture each change of heart beats.
To demonstrate the native impacts of wireless transmissionerrors on MSN performance, we did not use any error recoveryscheme but collected the packet loss rate at different sendingrates (5 packets/sec ∼ 40 packets/sec) and different mobilityspeeds (walking - 3 mph, running - 10 mph, driving - 30mph), network scale = 12 sensors. As shown in Fig. 20(a), anincreasing traffic load could cause up to a 19% loss rate. Whentwo neighboring sensors try to send out data simultaneously,a wireless access conflict occurs. Wireless conflicts can causedata errors. On the other hand, the increasing mobility couldalso lead to higher wireless error rate since mobility couldmake an established route useless, and during the establish-ment of a new route, many packets can get lost.
B. Wireless Loss
Besides the aforementioned data error reasons (i.e., MAC-layer wireless conflicts and patients’ mobility), other factorsthat cause packet transmission errors and losses could be statedas follows: (1) Wireless signal energy loss during propagationis one reason. It is well-known that the received wireless signalstrength decreases when distance from the sender increases.When the received signal is too weak, it is difficult for thereceiver to detect the original values. Thus, typically, it justsimply discards the received data from its buffer, and this cancause packet loss. (2) Radio reflection / diffraction / scatteringis another reason. They can damage the wireless signals. Anerroneous packet will be discarded by any receiver, and thiscauses packet loss.
C. Energy Consumption
The top concern for sensor networks is energy consumptionsince it determines the batteries’ lifetime. Our energy measure-ment includes two places as follows:
(1) PSoc chip with source EEG/ECG compression algo-rithms through wavelets and pre-transmission signal process-ing calculations. Fig. 4 has shown the architecture of PSoc
interface that handles medical signal pre-processing before thewireless transceiver sends them out. Such a local calculationconsumes certain energy. Cypress MicroSystems [13] hasmade a Power calculator available to the PSoC users, and thishelps developers to estimate the power consumption in thechip. Based on the Power calculator results, we can estimatethe current and power consumption for our thresholding andcardiac monitoring system.
(2) The RF mote with CPU / memory and wirelesstransceiver. It performs all sensor network wireless com-munication protocols such as multi-hop relay, erasure codesmulti-path maintenance, sensor localization, etc. Because it isdifficult to directly measure energy consumption of sensorshardware, we have thus resorted to an accurate simulatorcalled PowerTossim [14] where hardware peripherals (such asthe radio, EEPROM, LEDs, and so forth) are instrumented toobtain a trace of each device’s activity during the simulationrun. To scale up to large numbers of sensor nodes, Power-TOSSIM runs applications as a native executable and doesnot directly simulate each node’s CPU at the instruction level.PowerTOSSIM employs a code-transformation technique toestimate the number of CPU cycles executed by each node.Finally, the trace of each node’s activity is fed into a detailedmodel of hardware energy consumption, yielding per-nodeenergy consumption data. This energy model can be readilymodified for different hardware platforms.
1) The energy saving performance of compressed ECGtransmission: We are interested in the energy saving effect ofcompressed signal transmission through multi-scale waveletfeature extraction (Section IV-A). (1) First, we investigatedthe raw ECG stream case without compression. Fig. 20(b)is our energy measurement result in relative percentage. Itreflects the general case in most sensor networks: most energyis consumed in RF communications instead of in local CPUprocessing due to the expensive antenna issuing power andmany hops of data relay. (2) Then we introduced wavelet com-pression into source data and transmit only the decompositioncoefficients. Although the 100% error/loss recovery (throughnetwork single-hop retransmission and erasure code multi-path reconstruction) could consume more energy than non-compression case where the network doesn’t participate in theloss recovery (the destination does the particle filtering-basedprediction), the total wireless transmission energy is largelyreduced through data compression. As shown in Fig. 20(c), wecan see that the percentage of different energy components hasshifted quite a lot from wireless transmissions to local CPU(PSoc) processing.
D. Wavelet-based feature extraction and classification
Our wavelet analysis has satisfactory signal reconstructionperformance (after using 100% error recovery, see SectionIV-B). Fig. 21 is our ECG signal reconstruction result. Theyhave very good matching.
To validate our LHE / WTMM -based feature extractionand classification (Section IV-A), we have used the followingECG data sets from heart attack patients: (1) 10 Normal SinusRhythms (NSR) were recorded from real ECG sensors; (2)Other Arrhythmia came from PhysioNet [35], which provides

462 IEEE JOURNAL ON SELECTED AREAS IN COMMUNICATIONS, VOL. 27, NO. 4, MAY 2009
5 10 15 20 25 30 35 400.02
0.04
0.06
0.08
0.1
0.12
0.14
0.16
0.18
0.2
0.22C
over
age
Inte
nsity
(Vn)
Sending Rate (packets/sec)
Mobility = 3 MPHMobility = 10 MPHMobility = 30 MPH
(a) Packet Loss Rate (b) Before multi-scale wavelet processing (c) After multi-scale processing
Fig. 20. (a) Packet Loss Rate during different sending rates and patient mobility speeds, (b) Before multi-scale wavelet processing, and (c) After multi-scaleprocessing
0 100 200 300 400 500 600 700 800 900 10001800
2000
2200
2400
2600
2800ECG signal reconstruction
Number of samples
Orginal signalReconstruction signal
Fig. 21. ECG reconstruction after receiving wavelet coefficients
a set of databases that group records of one or more digitizedECG signals, as well as a set of their corresponding beat andrhythm annotations. Especially, we have used (a) PhysioNetMIT-BIH Noise Stress Test Database that contains typicalnoises in ambulatory ECG recordings, and (b) PhysioNetMIT-BIH Arrhythmia Database, which is used to study thedifferent types of arrhythmias. As we mentioned in SectionIV-A, the purpose of ECG feature extraction is not onlyfor data compression. More importantly, the local sensor cancoarsely determine whether the ECG signals indicate abnormalheart beat patterns. Our SVM-based ECG classification resultsare shown in Fig. 22(a). In that diagram, we have alsocompared our classification performance to two of the bestECG classification algorithms, i.e., Bayesian Classifier [37]and Decision Tree [36]. Although the accuracy for NSR issimilar between ours and others, the accuracy to identifyarrhythmia is higher in our scheme. More importantly, ouralgorithm can use WTMM /Wrapper to efficiently extractmultiple features from a “large-scale” ECG database withina reasonable small calculation time.
E. EEG (brain signal) compressed transmission
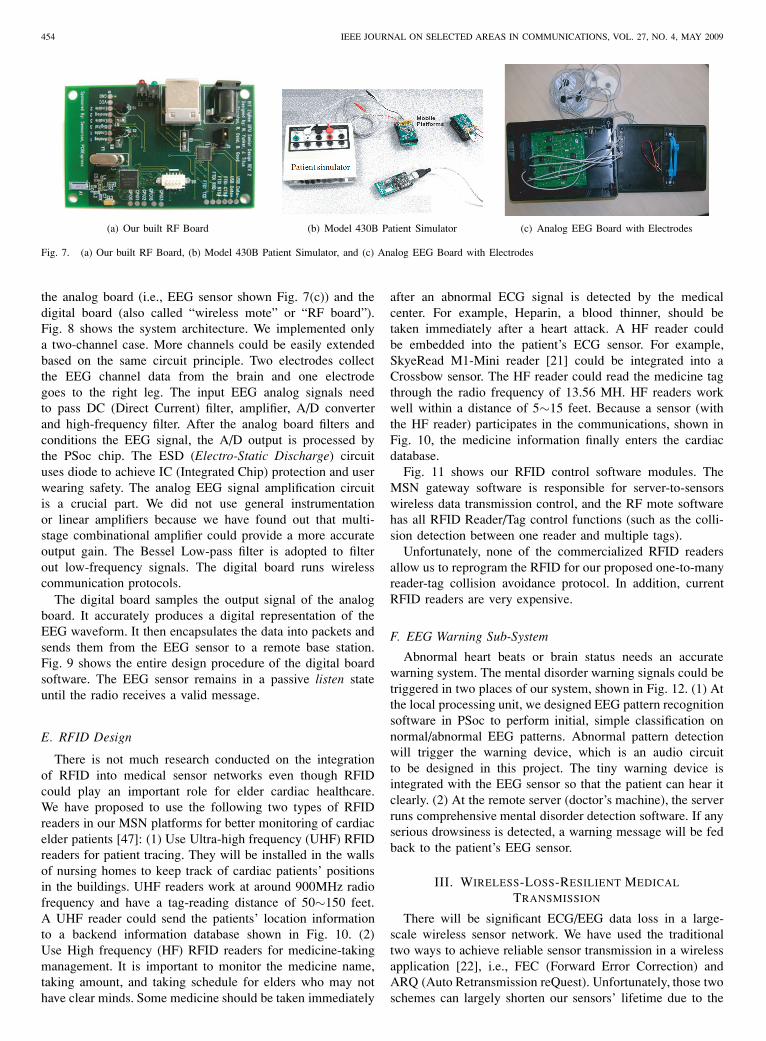
Besides ECG (heart beat signals), we have also investigatedthe compression effects of EEG brain signals. Fig. 23 (upper)shows compressive measurements of one channel EEG signalswith 16 sensing elements at random sampling rate, resultingin a compression ratio of 1024/120, and Fig. 23 (lower)
reconstructed EEG signals from the compressively sampleddata. Fig. 24 is the 2D scalp map projection of the first 6independent components of the compressively sampled dataafter interpolation.
F. RFID performance
Section II-E has discussed our designed RFID principle. Itplays an important role in patient’s medicine management. Wehave built medical database with the collected RFID data suchas patient’s medicine information. We have also built the GUIto automatically display warning message if there is overdosecase or the patient takes wrong medicine. Please refer to [47]on our results on RFID performance.
G. Extended Kalman Filter (EKF) for loss prediction
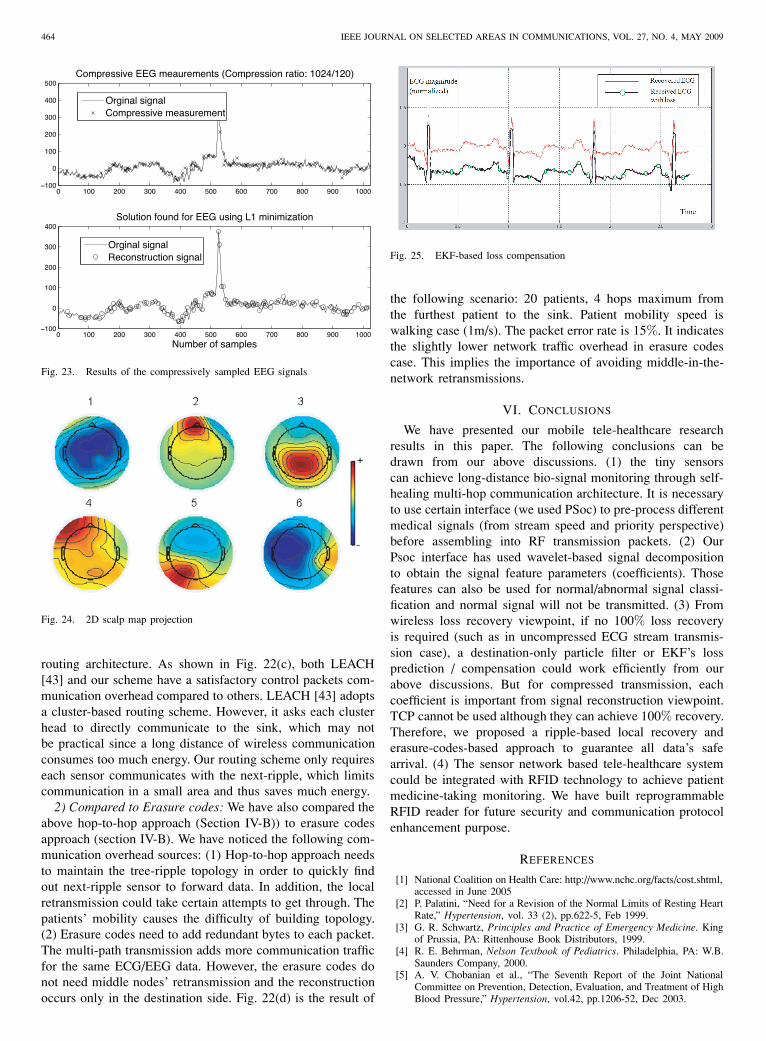
We have utilized the accomplishments of Sameni et al.,[44] who were able to linearize the ECG model and applythe EKF to it in Matlab. Their usage was noninvasive fetalECG extraction. Their scheme can be applied in a completelydifferent area, wireless data recovery. The actual ECG datacame from the PhysioBank database of physiological signals[35]. A sample of one of these normal ECG signals can beseen in Fig. 25 (the heavier curve). In this experiment, weassumed that the lost rate is 10%. Fig. 25 bottom curve isa received ECG stream with lost data. We have marked allmissed data. Fig. 25 upper curve is our EKF-recovered ECGdata. We have increased the repaired ECG stream’s magnitudefor certain level to clearly compare those two streams. As wecan see, the repaired stream keeps all ECG features and can beused for further pattern recognition to detect abnormal heartbeats.
H. Particle filtering for loss recovery
To measure the matching level between the repaired waveand original sent one, we have used the function xcorr (i.e.the Matlab cross-correlation function). It measures similarity(in the range of 0∼100%) between two given signals, as afunction of the relative time-shift (we used 0 in our case)between them.

HU et al.: CONGESTION-AWARE, LOSS-RESILIENT BIO-MONITORING SENSOR NETWORKING FOR MOBILE HEALTH APPLICATIONS 463
1 1.5 2 2.5 3 3.5 4 4.5 586
88
90
92
94
96
98
Five heart beat rhythms1: NSR; 2: pACED; 3: A−Fib; 4: Nordal; 5: V−Fib
Cla
ssifi
catio
n ac
cura
cy(%
)
OursBayesianDecision Tree
(a) Classification Accuracy
10 20 30 40 50 60 70 80 9099
99.1
99.2
99.3
99.4
99.5
99.6
99.7
99.8
99.9
100
Mat
chin
g le
vel
No. of particles
Particle for ECG
EKF for ECG
Particle for EEG
EKF for EEG
(b) Comparisons
0 5 10 15 20 25 30 35 400
1000
2000
3000
4000
5000
6000
7000
8000
9000
Pac
kets
sen
t (al
l nod
es)
Network density (sensors/square meter)
Our tree−zone schemeLeachZRPFlat topology + flooding
(c) Communication Overhead
100 150 200 250 300 350 40010
15
20
25
30
35
40
45
50
55
60
ECG Sensing frequency (Hz)
Kby
tes/
s
Hop−to−hopErasure codes
(d) Network Traffic
Fig. 22. (a) Normal/Arrhythmia Classification Accuracy, (b) Comparisons between Particle Filter and EKF, (c) Hop-to-hop Error Recovery: CommunicationOverhead, and (d) Network Traffic Load for Two Loss Recovery Schemes
To compare the Particle Filter and EKF, we have changedthe number of “particles” (i.e., system state trajectories) tosee the matching level between those two signals. For ECG(heart beat), the two loss recovery schemes have almost thesame performance after we use particles of more than 60 (seeFig. 22(b) top two curves). However, for EEG (brain signals),we have found that EKF has worse performance than Particlefilter (see Fig. 22(b) lower two curves). One possible reasoncould be due to the following fact: it is understood that particlefilter has stronger capability to predict and correct signals withnon-linearity and non-Gaussian noise, while EKF does nothave stable prediction performance when signal non-linearityis too high. While ECG has typically good regularity due toits direct human pulse measurement, the EEG measurementcan be more difficult and have less linearity due to the eyeblinking and head movement. On the other hand, our PSocinterface (see Section II-A) has already filtered most of thenoise in ECG/EEG signals, but it cannot distinguish betweenscalp radiation and eye-movement bio-electric signals. ThusEEG has higher variations than ECG stream.
We have also found that the implementation of Particle filteris more complex when considering more particles. The corre-sponding PSoc memory overhead is larger than EKF “states”maintenance. But thanks to the fast increasing memory densityin the last decade, the storage issue is not as critical as CPUcalculation overhead.
I. Complete loss recovery (via wavelet): Communication over-head
1) Hop-to-hop loss recovery: In Section IV-B, we dis-cussed 100% loss recovery through network-assisted localizedretransmission. But its efficiency depends on our proposedripple-based topology management structure. A crucial metricfor the complexity of sensor network topology control pro-tocols is the amount of control packets transmitted betweenindividual nodes. We compare our ripple-based (also calledtree-zone) routing architecture to other three topology controlschemes that are based on other ad hoc routing protocolsincluding flat topology, LEACH [43], and ZRP [42], andcalculate the number of control packets transmitted in the
464 IEEE JOURNAL ON SELECTED AREAS IN COMMUNICATIONS, VOL. 27, NO. 4, MAY 2009
0 100 200 300 400 500 600 700 800 900 1000−100
0
100
200
300
400
500Compressive EEG meaurements (Compression ratio: 1024/120)
Orginal signalCompressive measurement
0 100 200 300 400 500 600 700 800 900 1000−100
0
100
200
300
400Solution found for EEG using L1 minimization
Number of samples
Orginal signalReconstruction signal
Fig. 23. Results of the compressively sampled EEG signals
Fig. 24. 2D scalp map projection
routing architecture. As shown in Fig. 22(c), both LEACH[43] and our scheme have a satisfactory control packets com-munication overhead compared to others. LEACH [43] adoptsa cluster-based routing scheme. However, it asks each clusterhead to directly communicate to the sink, which may notbe practical since a long distance of wireless communicationconsumes too much energy. Our routing scheme only requireseach sensor communicates with the next-ripple, which limitscommunication in a small area and thus saves much energy.
2) Compared to Erasure codes: We have also compared theabove hop-to-hop approach (Section IV-B)) to erasure codesapproach (section IV-B). We have noticed the following com-munication overhead sources: (1) Hop-to-hop approach needsto maintain the tree-ripple topology in order to quickly findout next-ripple sensor to forward data. In addition, the localretransmission could take certain attempts to get through. Thepatients’ mobility causes the difficulty of building topology.(2) Erasure codes need to add redundant bytes to each packet.The multi-path transmission adds more communication trafficfor the same ECG/EEG data. However, the erasure codes donot need middle nodes’ retransmission and the reconstructionoccurs only in the destination side. Fig. 22(d) is the result of
Fig. 25. EKF-based loss compensation
the following scenario: 20 patients, 4 hops maximum fromthe furthest patient to the sink. Patient mobility speed iswalking case (1m/s). The packet error rate is 15%. It indicatesthe slightly lower network traffic overhead in erasure codescase. This implies the importance of avoiding middle-in-the-network retransmissions.
VI. CONCLUSIONS
We have presented our mobile tele-healthcare researchresults in this paper. The following conclusions can bedrawn from our above discussions. (1) the tiny sensorscan achieve long-distance bio-signal monitoring through self-healing multi-hop communication architecture. It is necessaryto use certain interface (we used PSoc) to pre-process differentmedical signals (from stream speed and priority perspective)before assembling into RF transmission packets. (2) OurPsoc interface has used wavelet-based signal decompositionto obtain the signal feature parameters (coefficients). Thosefeatures can also be used for normal/abnormal signal classi-fication and normal signal will not be transmitted. (3) Fromwireless loss recovery viewpoint, if no 100% loss recoveryis required (such as in uncompressed ECG stream transmis-sion case), a destination-only particle filter or EKF’s lossprediction / compensation could work efficiently from ourabove discussions. But for compressed transmission, eachcoefficient is important from signal reconstruction viewpoint.TCP cannot be used although they can achieve 100% recovery.Therefore, we proposed a ripple-based local recovery anderasure-codes-based approach to guarantee all data’s safearrival. (4) The sensor network based tele-healthcare systemcould be integrated with RFID technology to achieve patientmedicine-taking monitoring. We have built reprogrammableRFID reader for future security and communication protocolenhancement purpose.
REFERENCES
[1] National Coalition on Health Care: http://www.nchc.org/facts/cost.shtml,accessed in June 2005
[2] P. Palatini, “Need for a Revision of the Normal Limits of Resting HeartRate,” Hypertension, vol. 33 (2), pp.622-5, Feb 1999.
[3] G. R. Schwartz, Principles and Practice of Emergency Medicine. Kingof Prussia, PA: Rittenhouse Book Distributors, 1999.
[4] R. E. Behrman, Nelson Textbook of Pediatrics. Philadelphia, PA: W.B.Saunders Company, 2000.
[5] A. V. Chobanian et al., “The Seventh Report of the Joint NationalCommittee on Prevention, Detection, Evaluation, and Treatment of HighBlood Pressure,” Hypertension, vol.42, pp.1206-52, Dec 2003.

HU et al.: CONGESTION-AWARE, LOSS-RESILIENT BIO-MONITORING SENSOR NETWORKING FOR MOBILE HEALTH APPLICATIONS 465
[6] E. Jovanov, A. Lords, D. Raskovic, P. Cox, R. Adhami, and F. Andrasik,“Stress Monitoring Using a Distributed Wireless Intelligent SensorSystem,” IEEE Engineering in Medicine and Biology Magazine, Vol.22, No.3, May/Jun. 2003, pp. 49-55.
[7] E. Jovanov, A. Milenkovic, C. Otto, and P. C. de Groen, “A wirelessbody area network of intelligent motion sensors for computer assistedphysical rehabilitation,” Journal of NeuroEngineering and Rehabilita-tion, 2:6, pp. 18-19. Mar. 1, 2005.
[8] J. Welch, F. Guilak, and S. D. Baker, “A Wireless ECG Smart Sensorfor Broad Application in Life Threatening Event Detection,” in Proc. ofEMBS ’04, pp. 3447-3449.
[9] D. Malan, T. R. F. Fulford-Jones, M. Welsh, and S. Moulton, “CodeBlue:An Ad Hoc Sensor Network Infrastructure for Emergency MedicalCare,” in Proc. of WAMES 2004, pp. 12-14.
[10] M. J. Mathie and B. G. Celler, “A System For Monitoring Posture AndPhysical Activity Using Accelerometers,” in Proc. of EMBS ’01, pp.3654- 3657.
[11] M. J. Mathie and B. G. Celler, “Moteiv: Wireless Sensor Networks,”Available at: http://www.moteiv.com, Accessed: June 2005.
[12] C. Otto, J. P. Gober, R. W. McMurtrey, A. Milenkovic, and Emil Jo-vanov, “An Implementation of Hierarchical Signal Processing on aWireless Sensor in TinyOS Environment,” Proc. of the 43rd ACMSoutheastern Conference, Mar. 2005, Vol. 2, pp. 49-53.
[13] Cypress CY8C27443 Datasheet, in http://www.cypress.com[14] PowerTossim software: http://www.eecs.harvard.edu/ shnayder/ptossim/.[15] Crossbow Inc. http://www.xbow.com.[16] Chipcon Inc. http://www.chipcon.com[17] Texas Instruments: http://www.ti.com[18] Ember Inc., http://www.ember.com[19] Zigbee wireless communication standard: http://www.zigbee.org[20] M. Welsh, B. Chen, et al., CodeBlue: Wireless Sensor Networks for
Medical Care, Harvard University. 2006.[21] SkyeReadTM M1-mini is reader: see the following site for more
details: http:// www.skyetek.com/[22] F. Hu, “Modeling and Allocation of Connections in Next-generation
Wireless Networks,” PhD Thesis, Clarkson University. Jun. 2002.[23] I. F. Akyildiz, W.J. Su, Y. Sankarasubramaniam, and E. Cayirci, “A
survey on sensor networks,” IEEE Communications Magazine, Aug.2002, pp. 102-114.
[24] A. Sinha and A. Chandrakasan, “Dynamic Power Management inWireless Sensor Networks,” IEEE Design & Test of Computers, Vol.18, No. 2, Mar.-Apr. 2001.
[25] Sensor node, From Wikipedia, the free encyclopedia, vistited in Nov2008, http://www.wikipedia.org/
[26] M. J. Coates, ”Distributed Particle Filtering for Sensor Networks,” inProc. of IPSN, Apr. 2004.
[27] A. Doucet, N. de Freitas, and N. J. Gordon, Eds., Sequential MonteCarlo Methods in Practice, Series: Statistics for Engineering andInformation Science. Springer-Verlag, New York, 2001.
[28] G. Welch and G. Bishop, An Introduction to the Kalman Filter. Availablefrom http://www.cs.unc.edu/ welch/kalman/kalmanIntro.html.
[29] P.E. McSharry, G.D. Clifford, L. Tarassenko, L. A. Smith, “A dynamicalmodel for generating synthetic electrocardiogram signals,” IEEE Trans-actions on Biomedical Engineering, Vol. 50, No. 3, Mar. 2003, pp. 289- 294.
[30] Wavelet Tutorial, visited in Nov of 2008: http://users.rowan.edu/ po-likar/WAVELETS/WTtutorial.html.
[31] A. J. Joshi, (PhD Progress Report), “Data Mining of BiomedicalSignals,” Dept. of CSE, Indian Institute of Technology, Aug. 27, 2005.
[32] C. Burges, “A tutorial on support vector machines for pattern recogni-tion,” Data Mining and Knowledge Discovery, Vol. 2, No. 2, pp.121-167,1998.
[33] Wavelet singularity analysis: see http://hesperia.gsfc.nasa.gov. Visited inNov of 2008.
[34] Z. R. Struzik, “Determining local singularity strengths and their spectrawith the wavelet transform,” Fractals, 8(2), 2000.
[35] The Research Resource for Complex Physiologic Signals (2004, Sept.8). PhysioNet [Online]. Available: http://www.physionet.org.
[36] R. Le Blanc, “Quantitative analysis of cardiac arrhythmias,” CRC:Critical Review Biomed. Eng. vol. 14, no. 1, pp. 1-43, 1986.
[37] T. M. Mitchell, Machine Learning, 1997.[38] C. Wan, A. T. Campbell, and L. Krishnamurthy, “PSFQ: a reliable
transport protocol for wireless sensor networks,” In Proc. of ACM WSNA’02, pp. 1-11.
[39] S. Kim, “Efficient Erasure Code for Wireless Sensor Networks”, avail-able from: (visited in Nov of 2008), http://www.cs.berkeley.edu/
[40] J. Blomer, M. Kalfane, R. Karp, M. Karpinski, M. Luby, and D. Zuck-erman, “An xor-based erasure-resilient coding scheme,” ICSI TechnicalReport tr-95-048.
[41] S. Parikh, “On the use of erasure codes in unreliable data network,” MSthesis, Dept of EECS, MIT, 2001.
[42] Z. Haas and M. Pearlman, “The Zone Routing Protocol (ZRP) for AdHoc Networks”, IETF Internet draft for the Manet group, June 1999.
[43] W. R. Heinzelman, “Application-specific protocol architectures for wire-less networks,” PhD Thesis, MIT, Jun. 2000.
[44] R. Sameni, M. B. Shamsollahi, C. Jutten, M. Babaie-Zade, “Filteringnoisy ECG signals using the extended Kalman filter based on a modifieddynamic ECG model,” Computers in Cardiology, 2005,pp.1017 - 1020.
[45] TinyOS and NesC: http://www.tinyos.net.[46] F. Hu, M. Jiang, L. Celentano, and Y. Xiao, “Robust medical ad
hoc sensor networks (MASN) with wavelet-based ECG data mining,”(Elsevier) Ad Hoc Networks, Vol. 6, No. 7, pp. 986-1012, Sep. 2008.
[47] F. Hu, L. Celentano, and Y. Xiao, “Error-Resistant RFID-AssistedWireless Sensor Networks for Cardiac Tele-healthcare,” Wireless Com-munications and Mobile Computing (WCMC) Journal, Vol. 9, No. 1,pp. 85-101, Jan. 2009.
[48] F. Hu, M. Jiang, Ma. Wagner, and D. Dong “Privacy-Preserving Tele-cardiology Sensor Networks: Towards A Low-cost, Portable WirelessHardware / Software Co-design ”, IEEE Transactions on InformationTechnology in Biomedicine, Vol. 11, No. 6, Nov. 2007, pp. 617-627.
Fei Hu is currently an associate professor in theDept. of Electrical and Computer Engineering atthe Univ. of Alabama, Tuscaloosa, AL, USA. Hisresearch interests are wireless networks, wirelesssecurity and their applications in Bio-Medicine. Hisresearch has been supported by NSF, Cisco, Sprint,and other sources. He obtained his first Ph.D. degreeat Shanghai Tongji Univ., China in Signal Processing(in 1999), and second Ph.D. degree at ClarksonUniv. (New York State) in the field of Electrical andComputer Engineering (in 2002). He has published
over 100 journal/conference papers and book (chapters). He is also the editorfor over 5 international journals.
Yang Xiao (SM’04) is currently with Dept. of Com-puter Science at The Univ. of Alabama. He currentlyserves as Editor-in-Chief for International Journalof Security and Networks (IJSN), International Jour-nal of Sensor Networks (IJSNet), and InternationalJournal of Telemedicine and Applications (IJTA). Heserves as an associate editor for several journals,e.g., IEEE Transactions on Vehicular Technology.His research areas are security, telemedicine, sensornetworks, and wireless networks. He has publishedmore than 300 papers in major journals, refereed
conference proceedings, book chapters related to these research areas.
Qi Hao (M’06) is an assistant professor of Dept.of Electrical and Computer Engineering at TheUniv. of Alabama. He earned his Ph.D. from DukeUniv. for the work in design and implementationof wireless distributed infrared sensors in 2006. Hispost-doctoral training in Visualization and VirtualEnvironment Center at The Univ. of Kentucky wasfocused on 3-D computer vision for human trackingand identification. His current research interests in-clude compressive sensing, intelligent wireless sen-sor networks, and biomedical image processing.