Embed Size (px)
Citation preview
Review
Aircraft engine exhaust emissions and other airport-related
contributions to ambient air pollution: A review
Mauro Masiol, Roy M. Harrison*
Division of Environmental Health and Risk Management, School of Geography, Earth and Environmental Sciences, University of Birmingham, Edgbaston,
Birmingham B15 2TT, United Kingdom
h i g h l i g h t s
! Aviation is globally growing (þ5% y#1) mainly driven by developing countries.
! Airport operations cause an increase in ground-level pollution.
! Chemical and physical properties of the emitted gases and particles are reviewed.
! An overview of other additional sources within airports is provided.
! Future research needs on aircraft emissions are highlighted.
a r t i c l e i n f o
Article history:
Received 19 December 2013
Received in revised form
23 May 2014
Accepted 26 May 2014
Available online 28 May 2014
Keywords:
Aviation
Atmospheric pollution
Emissions
LTO cycles
Particulate matter
Oxides of nitrogen
a b s t r a c t
Civil aviation is fast-growing (about þ5% every year), mainly driven by the developing economies and
globalisation. Its impact on the environment is heavily debated, particularly in relation to climate forcing
attributed to emissions at cruising altitudes and the noise and the deterioration of air quality at ground-
level due to airport operations. This latter environmental issue is of particular interest to the scientific
community and policymakers, especially in relation to the breach of limit and target values for many air
pollutants, mainly nitrogen oxides and particulate matter, near the busiest airports and the resulting
consequences for public health. Despite the increased attention given to aircraft emissions at ground-
level and air pollution in the vicinity of airports, many research gaps remain. Sources relevant to air
quality include not only engine exhaust and non-exhaust emissions from aircraft, but also emissions
from the units providing power to the aircraft on the ground, the traffic due to the airport ground service,
maintenance work, heating facilities, fugitive vapours from refuelling operations, kitchens and restau-
rants for passengers and operators, intermodal transportation systems, and road traffic for transporting
people and goods in and out to the airport. Many of these sources have received inadequate attention,
despite their high potential for impact on air quality. This review aims to summarise the state-of-the-art
research on aircraft and airport emissions and attempts to synthesise the results of studies that have
addressed this issue. It also aims to describe the key characteristics of pollution, the impacts upon global
and local air quality and to address the future potential of research by highlighting research needs.
© 2014 Elsevier Ltd. All rights reserved.
1. Introduction
Among pollution issues, poor air quality attracts a high level of
interest within the scientific community and engages public
opinion because of the known relationship between exposure to
many air pollutants and increased adverse short- and long-term
effects on human health (e.g., Schwartz, 1997; Ayres, 1998;
Brunekreef and Holgate, 2002; Kampa and Castanas, 2008;
Maynard, 2009; Yang and Omaye, 2009; Rückerl et al., 2011). In
addition, air pollution can seriously impair visibility (Hyslop, 2009),
may damage materials in buildings and cultural heritage (Watt
et al., 2009; Screpanti and De Marco, 2009) and has direct and in-
direct effects upon climate (Ramanathan and Feng, 2009). While air
pollution remains a major concern for developing countries
(Fenger, 2009; Liaquat et al., 2010) as a result of the rapid growth of
population, energy demand and economic growth, developed
countries have experienced a significant decline in the concentra-
tions of many air pollutants over the past decade.
* Corresponding author. Current address: Department of Environmental Sci-
ences/Center of Excellence in Environmental Studies, King Abdulaziz University, PO
Box 80203, Jeddah 21589, Saudi Arabia.
E-mail address: [email protected] (R.M. Harrison).
Contents lists available at ScienceDirect
Atmospheric Environment
journal homepage: www.elsevier .com/locate/atmosenv
http://dx.doi.org/10.1016/j.atmosenv.2014.05.070
1352-2310/© 2014 Elsevier Ltd. All rights reserved.
Atmospheric Environment 95 (2014) 409e455
Airport emissions (AEs) have received increasing attention in
recent years because of the rapid growth of air transport volumes
and the expected expansion to meet capacity needs for future years
(Amato et al., 2010; Kurniawan and Khardi, 2011; Kinsey et al.,
2011). Most studies highlight knowledge gaps (e.g., Webb et al.,
2008; Wood et al., 2008a; Lee et al., 2010) which are a matter of
concern as the literature indicates that aircraft emissions can
significantly affect air quality near airports (Unal et al., 2005;
Carslaw et al., 2006; Herndon et al., 2008; Carslaw et al., 2008;
Mazaheri et al., 2009; Dodson et al., 2009) and in their surround-
ings (Farias and ApSimon, 2006; Peace et al., 2006; Hu et al., 2009;
Amato et al., 2010; Jung et al., 2011; Hsu et al., 2012). Emission
standards for new types of aircraft engines have been implemented
since the late 1970s by the International Civil Aviation Organization
(ICAO) through the Committee on Aircraft Engine Emissions (CAEE)
and the subsequent Committee on Aviation Environmental Pro-
tection (CAEP). One of the key actions of the ICAO committees was
the provision on engine emissions in Volume II of Annex 16 to the
Convention on International Civil Aviation, the so-called “Chicago
Convention”, which recommended protocols for the measurement
of carbon monoxide (CO), nitrogen oxides (NO þ NO2 ¼ NOx), un-
burned hydrocarbons (UHC) and smoke number (SN) for new en-
gines (ICAO, 2008). Standards were listed on a certification
databank (EASA, 2013), which represents a benchmark for engine
emissions performance and is used in many regulatory evaluations
(ICAO, 2011). This regulation has produced significant improve-
ments in engine and fuel efficiency and technical progress to reduce
emissions. However, although these efforts have led to a substantial
reduction in direct aircraft emissions over the past two decades,
these gains may be offset by the forecast growth of the aviation
industry and the resulting increase in airport traffic (ICAO, 2011).
Furthermore, the ICAO regulation address only four main generic
pollutants and a more detailed chemical and physical characteri-
sation of exhausts is required to quantitatively and qualitatively
assess aircraft emissions. An increasing number of studies provide a
detailed chemical speciation for many exhaust compounds,
including gases and airborne particulate matter (e.g., Anderson
et al., 2006; Herndon et al., 2008; Agrawal et al., 2008; Mazaheri
et al., 2009; Onasch et al., 2009; Herndon et al., 2009; Kinsey
et al., 2011; Mazaheri et al., 2011; Santoni et al., 2011). However,
the literature remains very sparse and many questions remain
unresolved because of the large differences in measurement stra-
tegies, technologies and methods, compounds analysed and envi-
ronments studied.
Aircraft exhausts are only one of several sources of emission at
an airport (ICAO, 2011). Although exhaust plumes from aircraft
engines were conventionally considered to account for most of the
emissions, other sources are present within modern airports and
contribute to air pollution at the local scale. Among these, tyre,
brake and asphalt wear and the re-suspension of particles due to
the turbulence created by the aircraft movements can account for
large fractions of total particulate matter mass (e.g., British Airports
Authority, 2006), but their chemical and physical characteristics
have been investigated in only a few studies (Bennett and Christie,
2011; Bennett et al., 2011). Moreover, the emissions of the units
providing power to the aircraft on the ground have received rela-
tively little consideration despite their potentially high impact on
the local air quality (Sch€afer et al., 2003; Ratliff et al., 2009;
Mazaheri et al., 2011). These units include the auxiliary power
units (APUs), which are small on-board gas-turbine engines, and
the ground power units (GPUs) provided by airports. In addition,
airport ground service equipment (GSEs) further impact the air
List of abbreviations
AAFEX Alternative Aviation Fuel Experiment
AEs Airport emissions
APEX Aircraft Particle Emissions eXperiment
APU Auxiliary power unit
BC Black carbon
C* Effective saturation concentration
CIs Chemi-ions
CIMS Chemical ionisation mass spectrometry
EC Elemental carbon
EI Emission index
EXCAVATE EXperiment to Characterise Aircraft Volatile Aerosol
and Trace-species Emissions
F00 Engine thrust expressed as a percentage of maximum
rated power
FGEP Fixed ground electrical power
FSC Fuel sulphur content
FT FischereTropsch fuel
GMD Geometric number mean diameter
GPUs Ground power units
GRPs Ground running procedures
GSEs Ground service equipments
ICAO International Civil Aviation Organization
LTO Landing and take-off cycle
OC Organic carbon
NMHC Non-methane hydrocarbon
NOx Nitrogen oxides (NO þ NO2)
NOy Reactive odd nitrogen (NOx and their oxidation
products)
OA Organic aerosol
PAHs Polycyclic aromatic hydrocarbons
PM Particulate matter
PM1 Particulate matter (aerodynamic diameter less than
1 mm)
PM2.5 Particulate matter (aerodynamic diameter less than
2.5 mm)
PM10 Particulate matter (aerodynamic diameter less than
10 mm)
RF Radiative forcing
RPK Revenue passenger kilometres
RTK Revenue tonne kilometres
SARS Severe acute respiratory syndrome
SIA Secondary inorganic aerosol
SN Smoke number
SOA Secondary organic aerosol
SVOCs Semi-volatile organic compounds
TC Total carbon
TF Turbofan engine
TIM Time-in-mode
TJ Turbojet engine
TP Turboprop engine
TS Turboshaft engine
UFP Ultrafine particles (diameter <100 nm)
UHC Unburned hydrocarbons
VOCs Volatile organic compounds
ε Abundance ratio ((!SO3þH2SO4)/total sulphur)
x Partitioning coefficient
M. Masiol, R.M. Harrison / Atmospheric Environment 95 (2014) 409e455410
quality (e.g., Nambisan et al., 2000; Amin, 2001; Sch€afer et al.,
2003). GSEs include most of the equipment that an airport offers
as a service for flights and passengers and includes a large number
of vehicles, such as passenger buses, baggage and food carriers,
container loader, refilling trucks, cleaning, lavatory services and de/
anti-icing vehicles, and tugs, which are used to move any equip-
ment or to push the aircraft between gates and taxiways. Only few
studies are available on the air traffic-related emissions produced
by ground services such as GSEs, GPUs or APUs (e.g., Webb et al.,
2008; Ratliff et al., 2009; Mazaheri et al., 2011; Presto et al., 2011).
Additional sources may also be present at airports, including
maintenance work, heating facilities, fugitive vapours from refu-
elling operations, kitchens and restaurants for passengers and op-
erators, etc. Moreover, as many airports are located far from cities,
their emission inventories should also include sources not directly
present within a terminal, but on which the airport has an influ-
ence. These sources may include intermodal transportation sys-
tems or road traffic including private cars, taxis, shuttle buses and
trucks for transporting people and goods in and out of the airport.
As most large airports are located near heavily populated urban
settlements, in combination they have a potentially significant
impact on the environment and health of people living in their
vicinity. For example, 150 airports in the USA are located in areas
designated to be in non-attainment for one or more criteria air
pollutants (Ratliff et al., 2009). In undertaking air quality assess-
ments and the development of successful mitigation strategies, it is
therefore fundamental to consider all the aspects associated with
the entire “airport system”. However, current information on many
aspects of this polluting source is inadequate, including a detailed
speciation of hydrocarbons, physicochemical characteristics of
particles, volatile and semi-volatile emissions and especially the
secondary transformations from the aging of aircraft exhausts and
other airport-related emissions. Some of these gaps are well sum-
marised in a US Transportation Research Board report (Webb et al.,
2008).
1.1. Aims and outline of the review
Since the scientific literature on AEs remains very sparse and
many questions are still open, this review aims to summarise the
state-of-the-art of airport emissions research and attempts to
synthesise and analyse the published studies. An overview of cur-
rent information on airport-related emissions is presented and the
key characteristics of the pollution and the impacts on the local and
global air quality are discussed. This review further summarises the
various methodologies used for measurements and attempts to
critically interpret the data available in the literature. Finally, this
review will highlight priority areas for research.
The next section traces the main stages of the development of
civil aviation, by focussing especially on the changes and develop-
ment strategies of modern airport systems. Recent traffic data and
statistics are presented and the trends are also discussed in order to
understand the potential future growth of air transport, which is
fundamental to forecasting the impacts of aviation in future years.
The third section gives an overview of the operation of aircraft
engines, briefly discusses the most widely used technologies, de-
scribes some fuel characteristics, such as the sulphur content, and
analyses the current use and future jet fuel consumption scenarios.
The fourth section reviews the current information on aircraft en-
gine exhaust: the landing and take-off cycles are described since
they are commonly used to assess aircraft emissions during the
operational conditions within an airport and within the atmo-
spheric surface boundary layer; the main gaseous and particulate-
phase compounds emitted by aircraft are listed and their key
chemical and physical characteristics are described in separate
subsections. A summary of data on the emission indices for many
pollutants is also provided. The fifth section describes the non-
exhaust emissions related to aircraft operations, such as the tyre
and brake wear and the re-suspension of runway material, which
have been little investigated even though they may have serious
impacts on local air quality. The sixth section reviews data on the
non-aircraft emissions potentially present within an airport,
including the ground service equipment emissions, the auxiliary/
ground power units and others. The seventh section presents the
results of studies conducted indoors and outdoors at airports to
directly assess the impacts of AEs upon human health. Finally, this
paper reviews the results of the recent literature on aircraft emis-
sions and other airport-related contributions to highlight the po-
tential role of AEs upon local air quality.
2. Present scenarios and future perspectives of civil aviation
and airports
The Airport Council International (ACI, 2013) has reported
recent statistics on the air traffic volumes for 2012: more than 79
million aircraft movements carried annually 5.7 billion passengers
between 1598 airports located in 159 countries, and reported that
the total cargo volume handled by airports was 93 million tonnes.
However, these numbers are expected to further increase in the
forthcoming decades: in the past half century, the aviation industry
has experienced a strong and rapid expansion as the world econ-
omy has grown and the technology of air transport has developed
(Baughcum et al., 1999). Generally, air traffic has been expressed as
revenue passenger kilometres (RPKs) by multiplying the number of
revenue-paying passengers aboard the vehicle by the travelled
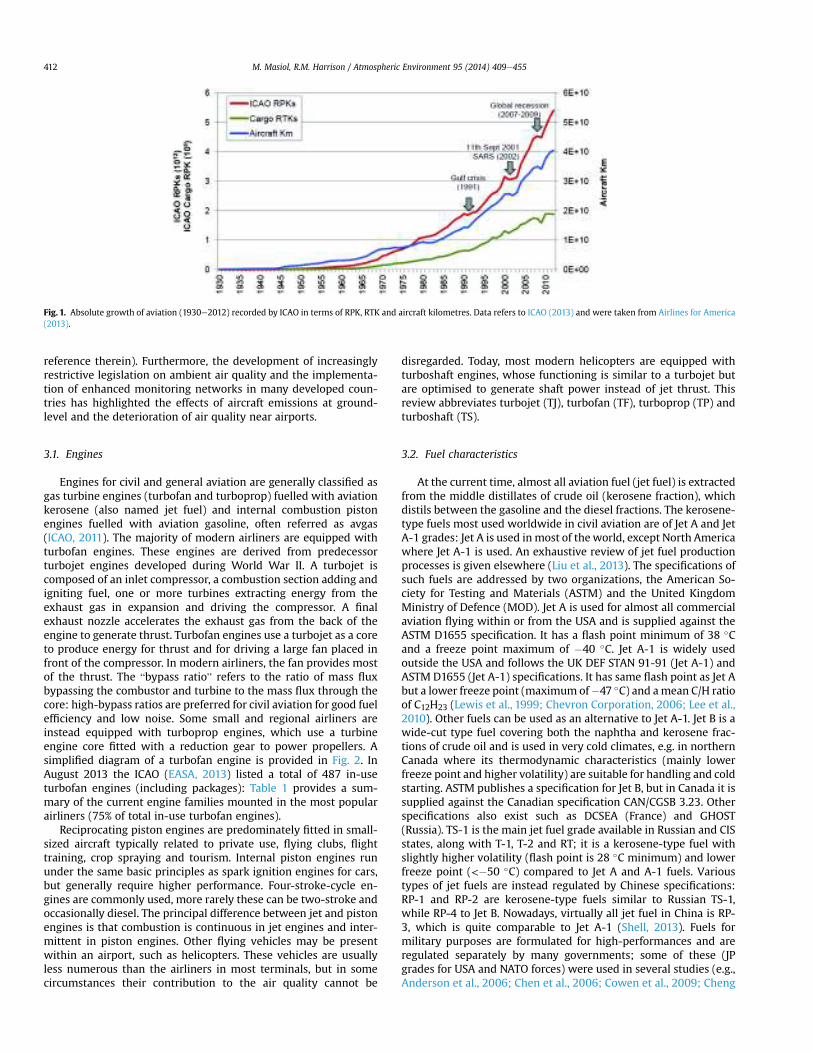
distance, or occasionally in revenue tonne kilometres (RTK). Fig. 1
shows the absolute growth of aviation recorded by ICAO in terms
of RPK, RTK and aircraft kilometres from the 1930s to today (ICAO,
2013; Airlines for America, 2013). Despite some global-scale events,
such as the Gulf crisis (1991), the terrorist attack of 11th September
2011, the outbreak of severe acute respiratory syndrome (SARS) in
2002e2003 and the recent global economic crisis (2008e2009), an
average annual growth rate of 5% was observed and this trend is
expected to continue over the next decades mainly driven by the
economic growth of emerging regions (ACI, 2007, 2008; Airbus,
2012; Boeing, 2013). It is anticipated that there will be more than
9 billion passengers globally by 2025 and more than 214 million
tonnes of total world freight traffic are forecast over almost 120
million air traffic movements (ACI, 2007). The future growth of air
transport will inevitably lead to the growth of airline fleets and
route networks and will therefore lead to an associated increase in
airport capacity in terms of both passengers and cargo. This poses
questions as to the consequent impact on air quality.
3. Aircraft: characteristics and in-use technologies
Emissions from aircraft engines are recognised as amajor source
of pollutants at airports and have been extensively investigated
over the past 40 years. Initially, the main historical concern for
supersonic aircraft was over stratospheric ozone depletion
(Johnston, 1971) and secondarily about the formation of contrails at
cruising heights (Murcray, 1970; Schumann, 2005) and indirect
effect on the Earth's radiative budgets (Kuhn, 1970). Apart the
development of the Concorde and the Tupolev Tu-144, a supersonic
fleet flying in the stratosphere was never developed and today all
commercial airliners are subsonic equipped with turbofan or
turboprop engines. Therefore, the main present issue arising from
civil aviation has today shifted to the increased levels of ozone in
the upper troposphere and lower stratosphere resulting from the
atmospheric chemistry of emitted NOx (Lee et al., 2010 and
M. Masiol, R.M. Harrison / Atmospheric Environment 95 (2014) 409e455 411
reference therein). Furthermore, the development of increasingly
restrictive legislation on ambient air quality and the implementa-
tion of enhanced monitoring networks in many developed coun-
tries has highlighted the effects of aircraft emissions at ground-
level and the deterioration of air quality near airports.
3.1. Engines
Engines for civil and general aviation are generally classified as
gas turbine engines (turbofan and turboprop) fuelled with aviation
kerosene (also named jet fuel) and internal combustion piston
engines fuelled with aviation gasoline, often referred as avgas
(ICAO, 2011). The majority of modern airliners are equipped with
turbofan engines. These engines are derived from predecessor
turbojet engines developed during World War II. A turbojet is
composed of an inlet compressor, a combustion section adding and
igniting fuel, one or more turbines extracting energy from the
exhaust gas in expansion and driving the compressor. A final
exhaust nozzle accelerates the exhaust gas from the back of the
engine to generate thrust. Turbofan engines use a turbojet as a core
to produce energy for thrust and for driving a large fan placed in
front of the compressor. In modern airliners, the fan provides most
of the thrust. The “bypass ratio” refers to the ratio of mass flux
bypassing the combustor and turbine to the mass flux through the
core: high-bypass ratios are preferred for civil aviation for good fuel
efficiency and low noise. Some small and regional airliners are
instead equipped with turboprop engines, which use a turbine
engine core fitted with a reduction gear to power propellers. A
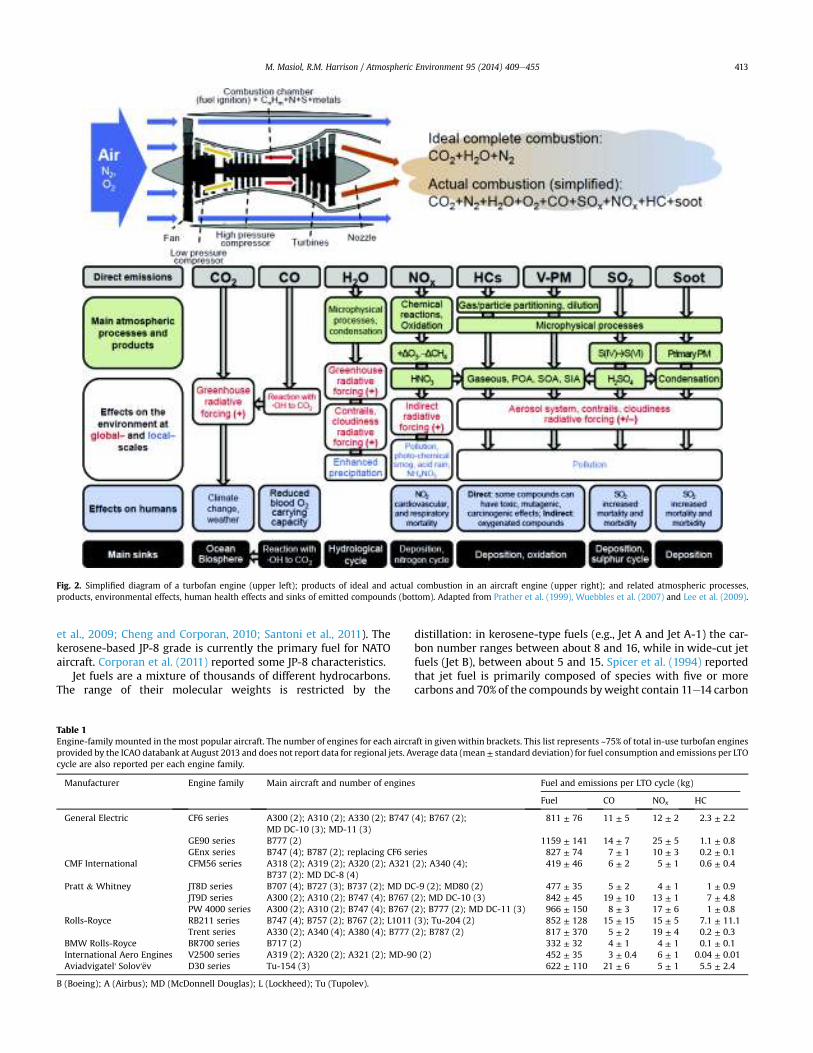
simplified diagram of a turbofan engine is provided in Fig. 2. In
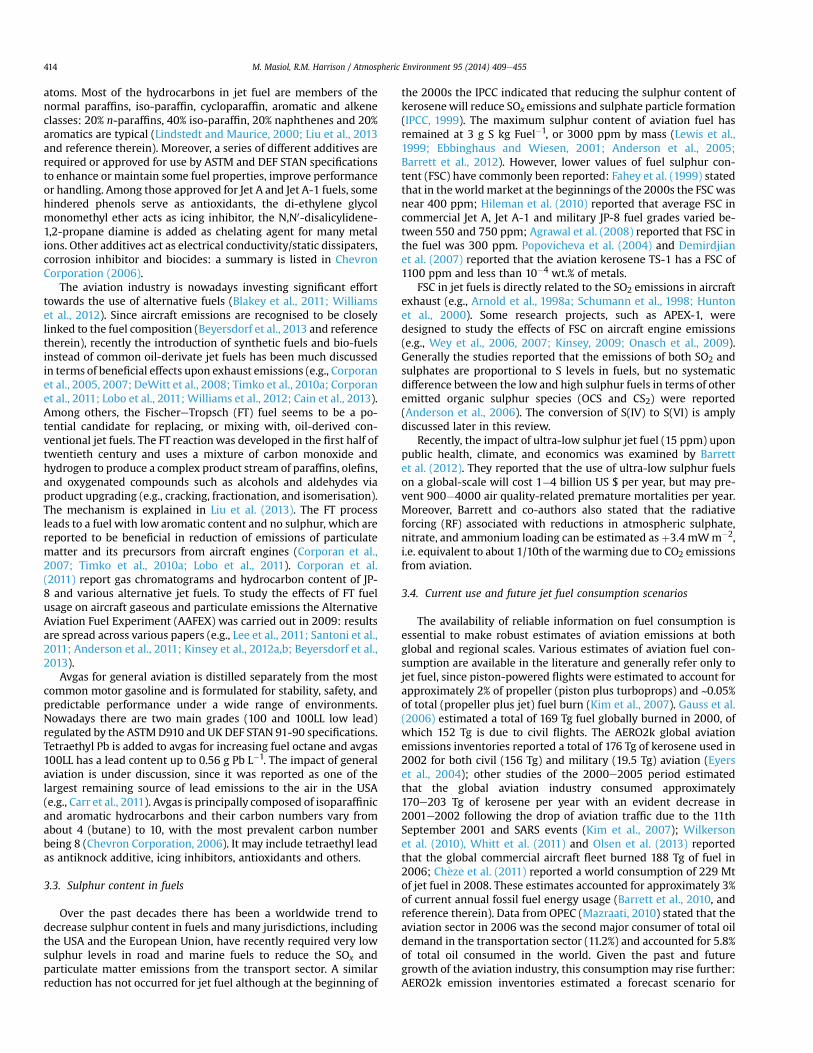
August 2013 the ICAO (EASA, 2013) listed a total of 487 in-use
turbofan engines (including packages): Table 1 provides a sum-
mary of the current engine families mounted in the most popular
airliners (75% of total in-use turbofan engines).
Reciprocating piston engines are predominately fitted in small-
sized aircraft typically related to private use, flying clubs, flight
training, crop spraying and tourism. Internal piston engines run
under the same basic principles as spark ignition engines for cars,
but generally require higher performance. Four-stroke-cycle en-
gines are commonly used, more rarely these can be two-stroke and
occasionally diesel. The principal difference between jet and piston
engines is that combustion is continuous in jet engines and inter-
mittent in piston engines. Other flying vehicles may be present
within an airport, such as helicopters. These vehicles are usually
less numerous than the airliners in most terminals, but in some
circumstances their contribution to the air quality cannot be
disregarded. Today, most modern helicopters are equipped with
turboshaft engines, whose functioning is similar to a turbojet but
are optimised to generate shaft power instead of jet thrust. This
review abbreviates turbojet (TJ), turbofan (TF), turboprop (TP) and
turboshaft (TS).
3.2. Fuel characteristics
At the current time, almost all aviation fuel (jet fuel) is extracted
from the middle distillates of crude oil (kerosene fraction), which
distils between the gasoline and the diesel fractions. The kerosene-
type fuels most used worldwide in civil aviation are of Jet A and Jet
A-1 grades: Jet A is used inmost of the world, except North America
where Jet A-1 is used. An exhaustive review of jet fuel production
processes is given elsewhere (Liu et al., 2013). The specifications of
such fuels are addressed by two organizations, the American So-
ciety for Testing and Materials (ASTM) and the United Kingdom
Ministry of Defence (MOD). Jet A is used for almost all commercial
aviation flying within or from the USA and is supplied against the
ASTM D1655 specification. It has a flash point minimum of 38 %C
and a freeze point maximum of #40 %C. Jet A-1 is widely used
outside the USA and follows the UK DEF STAN 91-91 (Jet A-1) and
ASTM D1655 (Jet A-1) specifications. It has same flash point as Jet A
but a lower freeze point (maximum of#47 %C) and amean C/H ratio
of C12H23 (Lewis et al., 1999; Chevron Corporation, 2006; Lee et al.,
2010). Other fuels can be used as an alternative to Jet A-1. Jet B is a
wide-cut type fuel covering both the naphtha and kerosene frac-
tions of crude oil and is used in very cold climates, e.g. in northern
Canada where its thermodynamic characteristics (mainly lower
freeze point and higher volatility) are suitable for handling and cold
starting. ASTM publishes a specification for Jet B, but in Canada it is
supplied against the Canadian specification CAN/CGSB 3.23. Other
specifications also exist such as DCSEA (France) and GHOST
(Russia). TS-1 is the main jet fuel grade available in Russian and CIS
states, along with T-1, T-2 and RT; it is a kerosene-type fuel with
slightly higher volatility (flash point is 28 %C minimum) and lower
freeze point (<#50 %C) compared to Jet A and A-1 fuels. Various
types of jet fuels are instead regulated by Chinese specifications:
RP-1 and RP-2 are kerosene-type fuels similar to Russian TS-1,
while RP-4 to Jet B. Nowadays, virtually all jet fuel in China is RP-
3, which is quite comparable to Jet A-1 (Shell, 2013). Fuels for
military purposes are formulated for high-performances and are
regulated separately by many governments; some of these (JP
grades for USA and NATO forces) were used in several studies (e.g.,
Anderson et al., 2006; Chen et al., 2006; Cowen et al., 2009; Cheng
Fig. 1. Absolute growth of aviation (1930e2012) recorded by ICAO in terms of RPK, RTK and aircraft kilometres. Data refers to ICAO (2013) and were taken from Airlines for America
(2013).
M. Masiol, R.M. Harrison / Atmospheric Environment 95 (2014) 409e455412
et al., 2009; Cheng and Corporan, 2010; Santoni et al., 2011). The
kerosene-based JP-8 grade is currently the primary fuel for NATO
aircraft. Corporan et al. (2011) reported some JP-8 characteristics.
Jet fuels are a mixture of thousands of different hydrocarbons.
The range of their molecular weights is restricted by the
distillation: in kerosene-type fuels (e.g., Jet A and Jet A-1) the car-
bon number ranges between about 8 and 16, while in wide-cut jet
fuels (Jet B), between about 5 and 15. Spicer et al. (1994) reported
that jet fuel is primarily composed of species with five or more
carbons and 70% of the compounds byweight contain 11e14 carbon
Fig. 2. Simplified diagram of a turbofan engine (upper left); products of ideal and actual combustion in an aircraft engine (upper right); and related atmospheric processes,
products, environmental effects, human health effects and sinks of emitted compounds (bottom). Adapted from Prather et al. (1999), Wuebbles et al. (2007) and Lee et al. (2009).
Table 1
Engine-family mounted in the most popular aircraft. The number of engines for each aircraft in givenwithin brackets. This list represents ~75% of total in-use turbofan engines
provided by the ICAO databank at August 2013 and does not report data for regional jets. Average data (mean ± standard deviation) for fuel consumption and emissions per LTO
cycle are also reported per each engine family.
Manufacturer Engine family Main aircraft and number of engines Fuel and emissions per LTO cycle (kg)
Fuel CO NOx HC
General Electric CF6 series A300 (2); A310 (2); A330 (2); B747 (4); B767 (2);
MD DC-10 (3); MD-11 (3)
811 ± 76 11 ± 5 12 ± 2 2.3 ± 2.2
GE90 series B777 (2) 1159 ± 141 14 ± 7 25 ± 5 1.1 ± 0.8
GEnx series B747 (4); B787 (2); replacing CF6 series 827 ± 74 7 ± 1 10 ± 3 0.2 ± 0.1
CMF International CFM56 series A318 (2); A319 (2); A320 (2); A321 (2); A340 (4);
B737 (2): MD DC-8 (4)
419 ± 46 6 ± 2 5 ± 1 0.6 ± 0.4
Pratt & Whitney JT8D series B707 (4); B727 (3); B737 (2); MD DC-9 (2); MD80 (2) 477 ± 35 5 ± 2 4 ± 1 1 ± 0.9
JT9D series A300 (2); A310 (2); B747 (4); B767 (2); MD DC-10 (3) 842 ± 45 19 ± 10 13 ± 1 7 ± 4.8
PW 4000 series A300 (2); A310 (2); B747 (4); B767 (2); B777 (2); MD DC-11 (3) 966 ± 150 8 ± 3 17 ± 6 1 ± 0.8
Rolls-Royce RB211 series B747 (4); B757 (2); B767 (2); L1011 (3); Tu-204 (2) 852 ± 128 15 ± 15 15 ± 5 7.1 ± 11.1
Trent series A330 (2); A340 (4); A380 (4); B777 (2); B787 (2) 817 ± 370 5 ± 2 19 ± 4 0.2 ± 0.3
BMW Rolls-Royce BR700 series B717 (2) 332 ± 32 4 ± 1 4 ± 1 0.1 ± 0.1
International Aero Engines V2500 series A319 (2); A320 (2); A321 (2); MD-90 (2) 452 ± 35 3 ± 0.4 6 ± 1 0.04 ± 0.01
Aviadvigatel' Solov'€ev D30 series Tu-154 (3) 622 ± 110 21 ± 6 5 ± 1 5.5 ± 2.4
B (Boeing); A (Airbus); MD (McDonnell Douglas); L (Lockheed); Tu (Tupolev).
M. Masiol, R.M. Harrison / Atmospheric Environment 95 (2014) 409e455 413
atoms. Most of the hydrocarbons in jet fuel are members of the
normal paraffins, iso-paraffin, cycloparaffin, aromatic and alkene
classes: 20% n-paraffins, 40% iso-paraffin, 20% naphthenes and 20%
aromatics are typical (Lindstedt and Maurice, 2000; Liu et al., 2013
and reference therein). Moreover, a series of different additives are
required or approved for use by ASTM and DEF STAN specifications
to enhance or maintain some fuel properties, improve performance
or handling. Among those approved for Jet A and Jet A-1 fuels, some
hindered phenols serve as antioxidants, the di-ethylene glycol
monomethyl ether acts as icing inhibitor, the N,N0-disalicylidene-
1,2-propane diamine is added as chelating agent for many metal
ions. Other additives act as electrical conductivity/static dissipaters,
corrosion inhibitor and biocides: a summary is listed in Chevron
Corporation (2006).
The aviation industry is nowadays investing significant effort
towards the use of alternative fuels (Blakey et al., 2011; Williams
et al., 2012). Since aircraft emissions are recognised to be closely
linked to the fuel composition (Beyersdorf et al., 2013 and reference
therein), recently the introduction of synthetic fuels and bio-fuels
instead of common oil-derivate jet fuels has been much discussed
in terms of beneficial effects upon exhaust emissions (e.g., Corporan
et al., 2005, 2007; DeWitt et al., 2008; Timko et al., 2010a; Corporan
et al., 2011; Lobo et al., 2011; Williams et al., 2012; Cain et al., 2013).
Among others, the FischereTropsch (FT) fuel seems to be a po-
tential candidate for replacing, or mixing with, oil-derived con-
ventional jet fuels. The FT reactionwas developed in the first half of
twentieth century and uses a mixture of carbon monoxide and
hydrogen to produce a complex product stream of paraffins, olefins,
and oxygenated compounds such as alcohols and aldehydes via
product upgrading (e.g., cracking, fractionation, and isomerisation).
The mechanism is explained in Liu et al. (2013). The FT process
leads to a fuel with low aromatic content and no sulphur, which are
reported to be beneficial in reduction of emissions of particulate
matter and its precursors from aircraft engines (Corporan et al.,
2007; Timko et al., 2010a; Lobo et al., 2011). Corporan et al.
(2011) report gas chromatograms and hydrocarbon content of JP-
8 and various alternative jet fuels. To study the effects of FT fuel
usage on aircraft gaseous and particulate emissions the Alternative
Aviation Fuel Experiment (AAFEX) was carried out in 2009: results
are spread across various papers (e.g., Lee et al., 2011; Santoni et al.,
2011; Anderson et al., 2011; Kinsey et al., 2012a,b; Beyersdorf et al.,
2013).
Avgas for general aviation is distilled separately from the most
common motor gasoline and is formulated for stability, safety, and
predictable performance under a wide range of environments.
Nowadays there are two main grades (100 and 100LL low lead)
regulated by the ASTMD910 and UK DEF STAN 91-90 specifications.
Tetraethyl Pb is added to avgas for increasing fuel octane and avgas
100LL has a lead content up to 0.56 g Pb L#1. The impact of general
aviation is under discussion, since it was reported as one of the
largest remaining source of lead emissions to the air in the USA
(e.g., Carr et al., 2011). Avgas is principally composed of isoparaffinic
and aromatic hydrocarbons and their carbon numbers vary from
about 4 (butane) to 10, with the most prevalent carbon number
being 8 (Chevron Corporation, 2006). It may include tetraethyl lead
as antiknock additive, icing inhibitors, antioxidants and others.
3.3. Sulphur content in fuels
Over the past decades there has been a worldwide trend to
decrease sulphur content in fuels and many jurisdictions, including
the USA and the European Union, have recently required very low
sulphur levels in road and marine fuels to reduce the SOx and
particulate matter emissions from the transport sector. A similar
reduction has not occurred for jet fuel although at the beginning of
the 2000s the IPCC indicated that reducing the sulphur content of
kerosenewill reduce SOx emissions and sulphate particle formation
(IPCC, 1999). The maximum sulphur content of aviation fuel has
remained at 3 g S kg Fuel#1, or 3000 ppm by mass (Lewis et al.,
1999; Ebbinghaus and Wiesen, 2001; Anderson et al., 2005;
Barrett et al., 2012). However, lower values of fuel sulphur con-
tent (FSC) have commonly been reported: Fahey et al. (1999) stated
that in theworldmarket at the beginnings of the 2000s the FSCwas
near 400 ppm; Hileman et al. (2010) reported that average FSC in
commercial Jet A, Jet A-1 and military JP-8 fuel grades varied be-
tween 550 and 750 ppm; Agrawal et al. (2008) reported that FSC in
the fuel was 300 ppm. Popovicheva et al. (2004) and Demirdjian
et al. (2007) reported that the aviation kerosene TS-1 has a FSC of
1100 ppm and less than 10#4 wt.% of metals.
FSC in jet fuels is directly related to the SO2 emissions in aircraft
exhaust (e.g., Arnold et al., 1998a; Schumann et al., 1998; Hunton
et al., 2000). Some research projects, such as APEX-1, were
designed to study the effects of FSC on aircraft engine emissions
(e.g., Wey et al., 2006, 2007; Kinsey, 2009; Onasch et al., 2009).
Generally the studies reported that the emissions of both SO2 and
sulphates are proportional to S levels in fuels, but no systematic
difference between the low and high sulphur fuels in terms of other
emitted organic sulphur species (OCS and CS2) were reported
(Anderson et al., 2006). The conversion of S(IV) to S(VI) is amply
discussed later in this review.
Recently, the impact of ultra-low sulphur jet fuel (15 ppm) upon
public health, climate, and economics was examined by Barrett
et al. (2012). They reported that the use of ultra-low sulphur fuels
on a global-scale will cost 1#4 billion US $ per year, but may pre-
vent 900#4000 air quality-related premature mortalities per year.
Moreover, Barrett and co-authors also stated that the radiative
forcing (RF) associated with reductions in atmospheric sulphate,
nitrate, and ammonium loading can be estimated asþ3.4 mWm#2,
i.e. equivalent to about 1/10th of the warming due to CO2 emissions
from aviation.
3.4. Current use and future jet fuel consumption scenarios
The availability of reliable information on fuel consumption is
essential to make robust estimates of aviation emissions at both
global and regional scales. Various estimates of aviation fuel con-
sumption are available in the literature and generally refer only to
jet fuel, since piston-powered flights were estimated to account for
approximately 2% of propeller (piston plus turboprops) and ~0.05%
of total (propeller plus jet) fuel burn (Kim et al., 2007). Gauss et al.
(2006) estimated a total of 169 Tg fuel globally burned in 2000, of
which 152 Tg is due to civil flights. The AERO2k global aviation
emissions inventories reported a total of 176 Tg of kerosene used in
2002 for both civil (156 Tg) and military (19.5 Tg) aviation (Eyers
et al., 2004); other studies of the 2000e2005 period estimated
that the global aviation industry consumed approximately
170e203 Tg of kerosene per year with an evident decrease in
2001e2002 following the drop of aviation traffic due to the 11th
September 2001 and SARS events (Kim et al., 2007); Wilkerson
et al. (2010), Whitt et al. (2011) and Olsen et al. (2013) reported
that the global commercial aircraft fleet burned 188 Tg of fuel in
2006; Ch"eze et al. (2011) reported a world consumption of 229 Mt
of jet fuel in 2008. These estimates accounted for approximately 3%
of current annual fossil fuel energy usage (Barrett et al., 2010, and
reference therein). Data from OPEC (Mazraati, 2010) stated that the
aviation sector in 2006 was the second major consumer of total oil
demand in the transportation sector (11.2%) and accounted for 5.8%
of total oil consumed in the world. Given the past and future
growth of the aviation industry, this consumption may rise further:
AERO2k emission inventories estimated a forecast scenario for
M. Masiol, R.M. Harrison / Atmospheric Environment 95 (2014) 409e455414
2025 in which the fuel demand for aviation will be 327 Tg y#1
(Eyers et al., 2004); Ch"eze et al. (2011) reported that the world jet
fuel demand is projected to grow by 38% between 2008 and 2025,
rising to more than 316 Mt in 2025 at a mean growth rate of 1.9%
per year. Owen et al. (2010) estimated the future global aviation
emissions under four of the IPCC/SRES (Intergovernmental Panel on
Climate Change/Special Report on Emissions Scenarios) marker
scenarios and reported a fuel use of 336 Tg in 2020 and varying
from 426 to 766 Tg for 2050. This study also reported an estimate of
325 Tg for 2050 if the ambitious technology targets of the Advisory
Council for Aeronautical Research in Europe (ACARE, 2002) were to
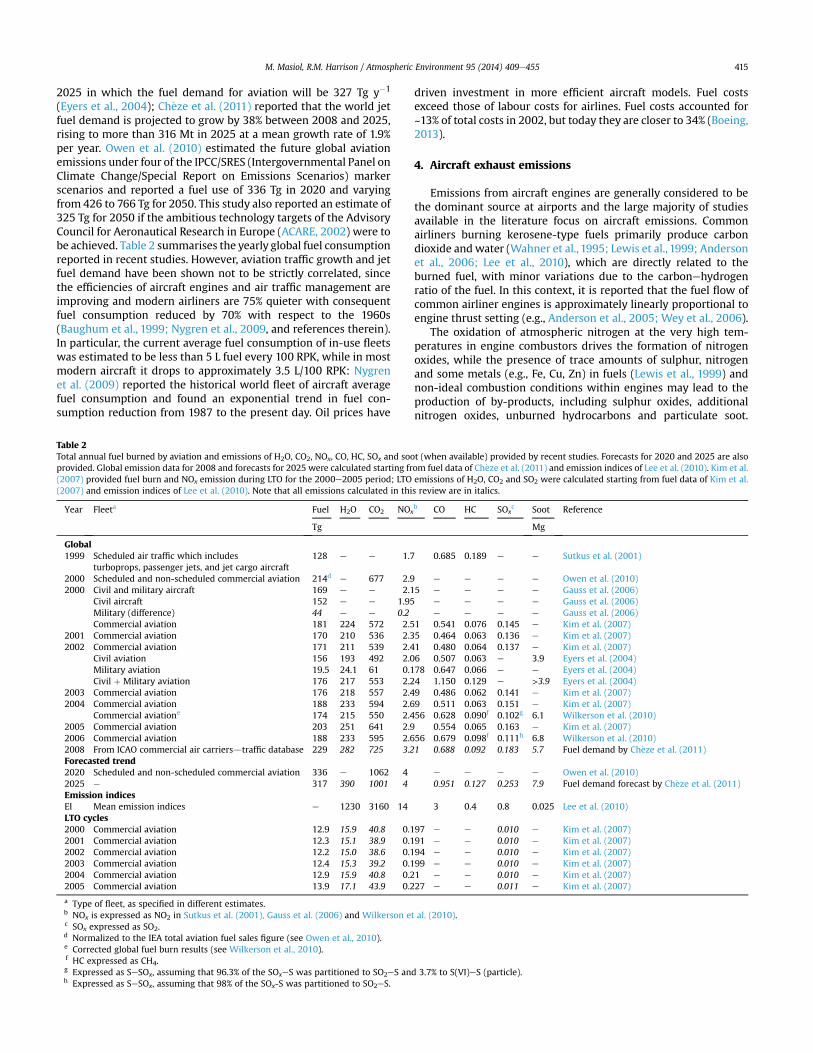
be achieved. Table 2 summarises the yearly global fuel consumption
reported in recent studies. However, aviation traffic growth and jet
fuel demand have been shown not to be strictly correlated, since
the efficiencies of aircraft engines and air traffic management are
improving and modern airliners are 75% quieter with consequent
fuel consumption reduced by 70% with respect to the 1960s
(Baughum et al., 1999; Nygren et al., 2009, and references therein).
In particular, the current average fuel consumption of in-use fleets
was estimated to be less than 5 L fuel every 100 RPK, while in most
modern aircraft it drops to approximately 3.5 L/100 RPK: Nygren
et al. (2009) reported the historical world fleet of aircraft average
fuel consumption and found an exponential trend in fuel con-
sumption reduction from 1987 to the present day. Oil prices have
driven investment in more efficient aircraft models. Fuel costs
exceed those of labour costs for airlines. Fuel costs accounted for
~13% of total costs in 2002, but today they are closer to 34% (Boeing,
2013).
4. Aircraft exhaust emissions
Emissions from aircraft engines are generally considered to be
the dominant source at airports and the large majority of studies
available in the literature focus on aircraft emissions. Common
airliners burning kerosene-type fuels primarily produce carbon
dioxide and water (Wahner et al., 1995; Lewis et al., 1999; Anderson
et al., 2006; Lee et al., 2010), which are directly related to the
burned fuel, with minor variations due to the carbonehydrogen
ratio of the fuel. In this context, it is reported that the fuel flow of
common airliner engines is approximately linearly proportional to
engine thrust setting (e.g., Anderson et al., 2005; Wey et al., 2006).
The oxidation of atmospheric nitrogen at the very high tem-
peratures in engine combustors drives the formation of nitrogen
oxides, while the presence of trace amounts of sulphur, nitrogen
and some metals (e.g., Fe, Cu, Zn) in fuels (Lewis et al., 1999) and
non-ideal combustion conditions within engines may lead to the
production of by-products, including sulphur oxides, additional
nitrogen oxides, unburned hydrocarbons and particulate soot.
Table 2
Total annual fuel burned by aviation and emissions of H2O, CO2, NOx, CO, HC, SOx and soot (when available) provided by recent studies. Forecasts for 2020 and 2025 are also
provided. Global emission data for 2008 and forecasts for 2025 were calculated starting from fuel data of Ch"eze et al. (2011) and emission indices of Lee et al. (2010). Kim et al.
(2007) provided fuel burn and NOx emission during LTO for the 2000e2005 period; LTO emissions of H2O, CO2 and SO2 were calculated starting from fuel data of Kim et al.
(2007) and emission indices of Lee et al. (2010). Note that all emissions calculated in this review are in italics.
Year Fleeta Fuel H2O CO2 NOxb CO HC SOx
c Soot Reference
Tg Mg
Global
1999 Scheduled air traffic which includes
turboprops, passenger jets, and jet cargo aircraft
128 e e 1.7 0.685 0.189 e e Sutkus et al. (2001)
2000 Scheduled and non-scheduled commercial aviation 214d e 677 2.9 e e e e Owen et al. (2010)
2000 Civil and military aircraft
Civil aircraft
Military (difference)
169
152
44
e
e
e
e
e
e
2.15
1.95
0.2
e
e
e
e
e
e
e
e
e
e
e
e
Gauss et al. (2006)
Gauss et al. (2006)
Gauss et al. (2006)
Commercial aviation 181 224 572 2.51 0.541 0.076 0.145 e Kim et al. (2007)
2001 Commercial aviation 170 210 536 2.35 0.464 0.063 0.136 e Kim et al. (2007)
2002 Commercial aviation 171 211 539 2.41 0.480 0.064 0.137 e Kim et al. (2007)
Civil aviation 156 193 492 2.06 0.507 0.063 e 3.9 Eyers et al. (2004)
Military aviation 19.5 24.1 61 0.178 0.647 0.066 e e Eyers et al. (2004)
Civil þ Military aviation 176 217 553 2.24 1.150 0.129 e >3.9 Eyers et al. (2004)
2003 Commercial aviation 176 218 557 2.49 0.486 0.062 0.141 e Kim et al. (2007)
2004 Commercial aviation 188 233 594 2.69 0.511 0.063 0.151 e Kim et al. (2007)
Commercial aviatione 174 215 550 2.456 0.628 0.090f 0.102g 6.1 Wilkerson et al. (2010)
2005 Commercial aviation 203 251 641 2.9 0.554 0.065 0.163 e Kim et al. (2007)
2006 Commercial aviation 188 233 595 2.656 0.679 0.098f 0.111h 6.8 Wilkerson et al. (2010)
2008 From ICAO commercial air carriersdtraffic database 229 282 725 3.21 0.688 0.092 0.183 5.7 Fuel demand by Ch"eze et al. (2011)
Forecasted trend
2020 Scheduled and non-scheduled commercial aviation 336 e 1062 4 e e e e Owen et al. (2010)
2025 e 317 390 1001 4 0.951 0.127 0.253 7.9 Fuel demand forecast by Ch"eze et al. (2011)
Emission indices
EI Mean emission indices e 1230 3160 14 3 0.4 0.8 0.025 Lee et al. (2010)
LTO cycles
2000 Commercial aviation 12.9 15.9 40.8 0.197 e e 0.010 e Kim et al. (2007)
2001 Commercial aviation 12.3 15.1 38.9 0.191 e e 0.010 e Kim et al. (2007)
2002 Commercial aviation 12.2 15.0 38.6 0.194 e e 0.010 e Kim et al. (2007)
2003 Commercial aviation 12.4 15.3 39.2 0.199 e e 0.010 e Kim et al. (2007)
2004 Commercial aviation 12.9 15.9 40.8 0.21 e e 0.010 e Kim et al. (2007)
2005 Commercial aviation 13.9 17.1 43.9 0.227 e e 0.011 e Kim et al. (2007)
a Type of fleet, as specified in different estimates.b NOx is expressed as NO2 in Sutkus et al. (2001), Gauss et al. (2006) and Wilkerson et al. (2010).c SOx expressed as SO2.d Normalized to the IEA total aviation fuel sales figure (see Owen et al., 2010).e Corrected global fuel burn results (see Wilkerson et al., 2010).f HC expressed as CH4.g Expressed as SeSOx, assuming that 96.3% of the SOxeS was partitioned to SO2eS and 3.7% to S(VI)eS (particle).h Expressed as SeSOx, assuming that 98% of the SOx-S was partitioned to SO2eS.
M. Masiol, R.M. Harrison / Atmospheric Environment 95 (2014) 409e455 415
Furthermore, exhausts can also contain species from the combus-
tion and release of lubricant oils (Dakhel et al., 2007; Timko et al.,
2010b; Yu et al., 2010; Kinsey et al., 2011; Yu et al., 2012) and
frommechanical component wear (Petzold et al., 1998; Demirdjian
et al., 2007). Therefore a more realistic, but simplified, combustion
scheme in aircraft engines can be summarised as (Lee et al., 2009):
CnHm þ N2 þ O2 þ S/ CO2 þ N2 þ H2O þ O2
þ CO þ SOx þ NOx þ HC þ soot
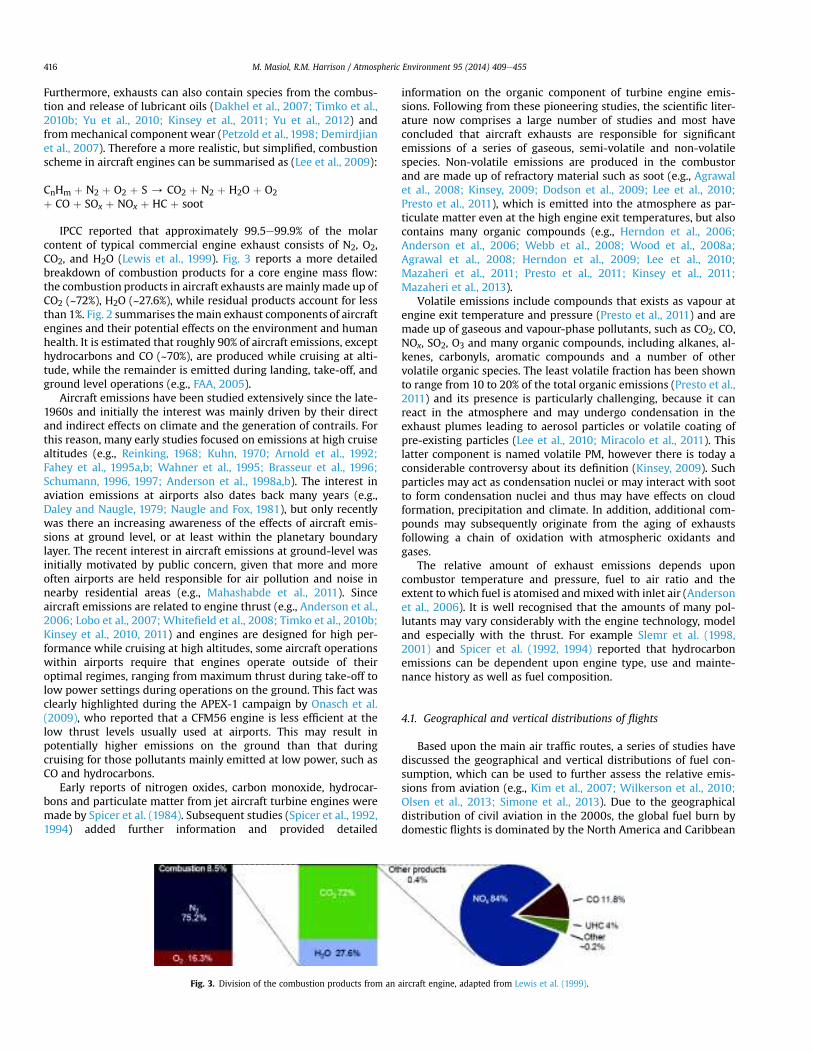
IPCC reported that approximately 99.5e99.9% of the molar
content of typical commercial engine exhaust consists of N2, O2,
CO2, and H2O (Lewis et al., 1999). Fig. 3 reports a more detailed
breakdown of combustion products for a core engine mass flow:
the combustion products in aircraft exhausts aremainly made up of
CO2 (~72%), H2O (~27.6%), while residual products account for less
than 1%. Fig. 2 summarises themain exhaust components of aircraft
engines and their potential effects on the environment and human
health. It is estimated that roughly 90% of aircraft emissions, except
hydrocarbons and CO (~70%), are produced while cruising at alti-
tude, while the remainder is emitted during landing, take-off, and
ground level operations (e.g., FAA, 2005).
Aircraft emissions have been studied extensively since the late-
1960s and initially the interest was mainly driven by their direct
and indirect effects on climate and the generation of contrails. For
this reason, many early studies focused on emissions at high cruise
altitudes (e.g., Reinking, 1968; Kuhn, 1970; Arnold et al., 1992;
Fahey et al., 1995a,b; Wahner et al., 1995; Brasseur et al., 1996;
Schumann, 1996, 1997; Anderson et al., 1998a,b). The interest in
aviation emissions at airports also dates back many years (e.g.,
Daley and Naugle, 1979; Naugle and Fox, 1981), but only recently
was there an increasing awareness of the effects of aircraft emis-
sions at ground level, or at least within the planetary boundary
layer. The recent interest in aircraft emissions at ground-level was
initially motivated by public concern, given that more and more
often airports are held responsible for air pollution and noise in
nearby residential areas (e.g., Mahashabde et al., 2011). Since
aircraft emissions are related to engine thrust (e.g., Anderson et al.,
2006; Lobo et al., 2007; Whitefield et al., 2008; Timko et al., 2010b;
Kinsey et al., 2010, 2011) and engines are designed for high per-
formance while cruising at high altitudes, some aircraft operations
within airports require that engines operate outside of their
optimal regimes, ranging from maximum thrust during take-off to
low power settings during operations on the ground. This fact was
clearly highlighted during the APEX-1 campaign by Onasch et al.
(2009), who reported that a CFM56 engine is less efficient at the
low thrust levels usually used at airports. This may result in
potentially higher emissions on the ground than that during
cruising for those pollutants mainly emitted at low power, such as
CO and hydrocarbons.
Early reports of nitrogen oxides, carbon monoxide, hydrocar-
bons and particulate matter from jet aircraft turbine engines were
made by Spicer et al. (1984). Subsequent studies (Spicer et al., 1992,
1994) added further information and provided detailed
information on the organic component of turbine engine emis-
sions. Following from these pioneering studies, the scientific liter-
ature now comprises a large number of studies and most have
concluded that aircraft exhausts are responsible for significant
emissions of a series of gaseous, semi-volatile and non-volatile
species. Non-volatile emissions are produced in the combustor
and are made up of refractory material such as soot (e.g., Agrawal
et al., 2008; Kinsey, 2009; Dodson et al., 2009; Lee et al., 2010;
Presto et al., 2011), which is emitted into the atmosphere as par-
ticulate matter even at the high engine exit temperatures, but also
contains many organic compounds (e.g., Herndon et al., 2006;
Anderson et al., 2006; Webb et al., 2008; Wood et al., 2008a;
Agrawal et al., 2008; Herndon et al., 2009; Lee et al., 2010;
Mazaheri et al., 2011; Presto et al., 2011; Kinsey et al., 2011;
Mazaheri et al., 2013).
Volatile emissions include compounds that exists as vapour at
engine exit temperature and pressure (Presto et al., 2011) and are
made up of gaseous and vapour-phase pollutants, such as CO2, CO,
NOx, SO2, O3 and many organic compounds, including alkanes, al-
kenes, carbonyls, aromatic compounds and a number of other
volatile organic species. The least volatile fraction has been shown
to range from 10 to 20% of the total organic emissions (Presto et al.,
2011) and its presence is particularly challenging, because it can
react in the atmosphere and may undergo condensation in the
exhaust plumes leading to aerosol particles or volatile coating of
pre-existing particles (Lee et al., 2010; Miracolo et al., 2011). This
latter component is named volatile PM, however there is today a
considerable controversy about its definition (Kinsey, 2009). Such
particles may act as condensation nuclei or may interact with soot
to form condensation nuclei and thus may have effects on cloud
formation, precipitation and climate. In addition, additional com-
pounds may subsequently originate from the aging of exhausts
following a chain of oxidation with atmospheric oxidants and
gases.
The relative amount of exhaust emissions depends upon
combustor temperature and pressure, fuel to air ratio and the
extent to which fuel is atomised andmixed with inlet air (Anderson
et al., 2006). It is well recognised that the amounts of many pol-
lutants may vary considerably with the engine technology, model
and especially with the thrust. For example Slemr et al. (1998,
2001) and Spicer et al. (1992, 1994) reported that hydrocarbon
emissions can be dependent upon engine type, use and mainte-
nance history as well as fuel composition.
4.1. Geographical and vertical distributions of flights
Based upon the main air traffic routes, a series of studies have
discussed the geographical and vertical distributions of fuel con-
sumption, which can be used to further assess the relative emis-
sions from aviation (e.g., Kim et al., 2007; Wilkerson et al., 2010;
Olsen et al., 2013; Simone et al., 2013). Due to the geographical
distribution of civil aviation in the 2000s, the global fuel burn by
domestic flights is dominated by the North America and Caribbean
Fig. 3. Division of the combustion products from an aircraft engine, adapted from Lewis et al. (1999).
M. Masiol, R.M. Harrison / Atmospheric Environment 95 (2014) 409e455416
regions, while fuel consumed by international flights is dominated
by Asia, North America and the Caribbean, andWestern Europe and
North Atlantic (Kim et al., 2007). Using the Aviation Emissions In-
ventory Code (AEIC, Stettler et al., 2011) Simone et al. (2013) esti-
mated the fuel burn by country of origin/destination in 2005 and
reported that the USA was the most important (59.1 Tg), followed
by Japan (9.7 Tg), UK (9.4 Tg), China (8.5 Tg, excluding Hong Kong),
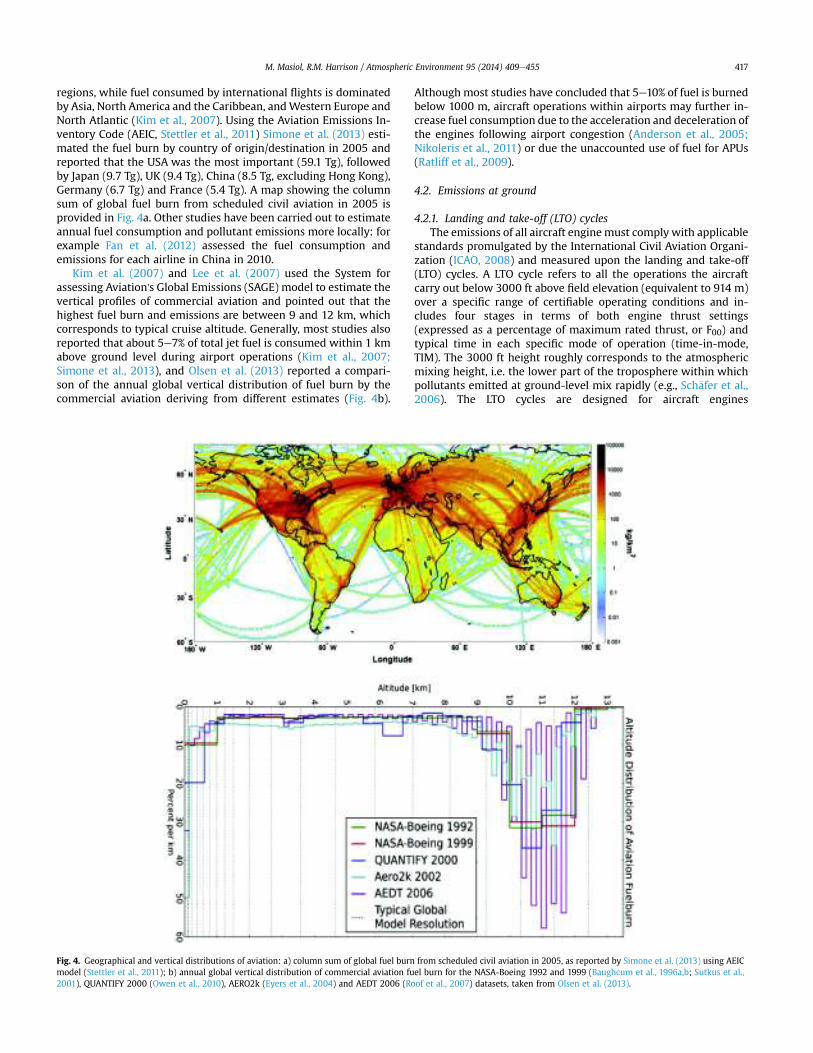
Germany (6.7 Tg) and France (5.4 Tg). A map showing the column
sum of global fuel burn from scheduled civil aviation in 2005 is
provided in Fig. 4a. Other studies have been carried out to estimate
annual fuel consumption and pollutant emissions more locally: for
example Fan et al. (2012) assessed the fuel consumption and
emissions for each airline in China in 2010.
Kim et al. (2007) and Lee et al. (2007) used the System for
assessing Aviation's Global Emissions (SAGE) model to estimate the
vertical profiles of commercial aviation and pointed out that the
highest fuel burn and emissions are between 9 and 12 km, which
corresponds to typical cruise altitude. Generally, most studies also
reported that about 5e7% of total jet fuel is consumed within 1 km
above ground level during airport operations (Kim et al., 2007;
Simone et al., 2013), and Olsen et al. (2013) reported a compari-
son of the annual global vertical distribution of fuel burn by the
commercial aviation deriving from different estimates (Fig. 4b).
Althoughmost studies have concluded that 5e10% of fuel is burned
below 1000 m, aircraft operations within airports may further in-
crease fuel consumption due to the acceleration and deceleration of
the engines following airport congestion (Anderson et al., 2005;
Nikoleris et al., 2011) or due the unaccounted use of fuel for APUs
(Ratliff et al., 2009).
4.2. Emissions at ground
4.2.1. Landing and take-off (LTO) cycles
The emissions of all aircraft enginemust comply with applicable
standards promulgated by the International Civil Aviation Organi-
zation (ICAO, 2008) and measured upon the landing and take-off
(LTO) cycles. A LTO cycle refers to all the operations the aircraft
carry out below 3000 ft above field elevation (equivalent to 914 m)
over a specific range of certifiable operating conditions and in-
cludes four stages in terms of both engine thrust settings
(expressed as a percentage of maximum rated thrust, or F00) and
typical time in each specific mode of operation (time-in-mode,
TIM). The 3000 ft height roughly corresponds to the atmospheric
mixing height, i.e. the lower part of the troposphere within which
pollutants emitted at ground-level mix rapidly (e.g., Sch€afer et al.,
2006). The LTO cycles are designed for aircraft engines
Fig. 4. Geographical and vertical distributions of aviation: a) column sum of global fuel burn from scheduled civil aviation in 2005, as reported by Simone et al. (2013) using AEIC
model (Stettler et al., 2011); b) annual global vertical distribution of commercial aviation fuel burn for the NASA-Boeing 1992 and 1999 (Baughcum et al., 1996a,b; Sutkus et al.,
2001), QUANTIFY 2000 (Owen et al., 2010), AERO2k (Eyers et al., 2004) and AEDT 2006 (Roof et al., 2007) datasets, taken from Olsen et al. (2013).
M. Masiol, R.M. Harrison / Atmospheric Environment 95 (2014) 409e455 417
manufactured after 1985 whose rated output is greater than
26.7 kN and aim to guarantee they not exceed certain regulatory
environmental limits for a series of pollutants, namely unburned
total hydrocarbons, carbon monoxide, nitrogen oxides and smoke
number (SN). This latter parameter is roughly representative of the
amount of soot an engine generates (e.g., Wayson et al., 2009;
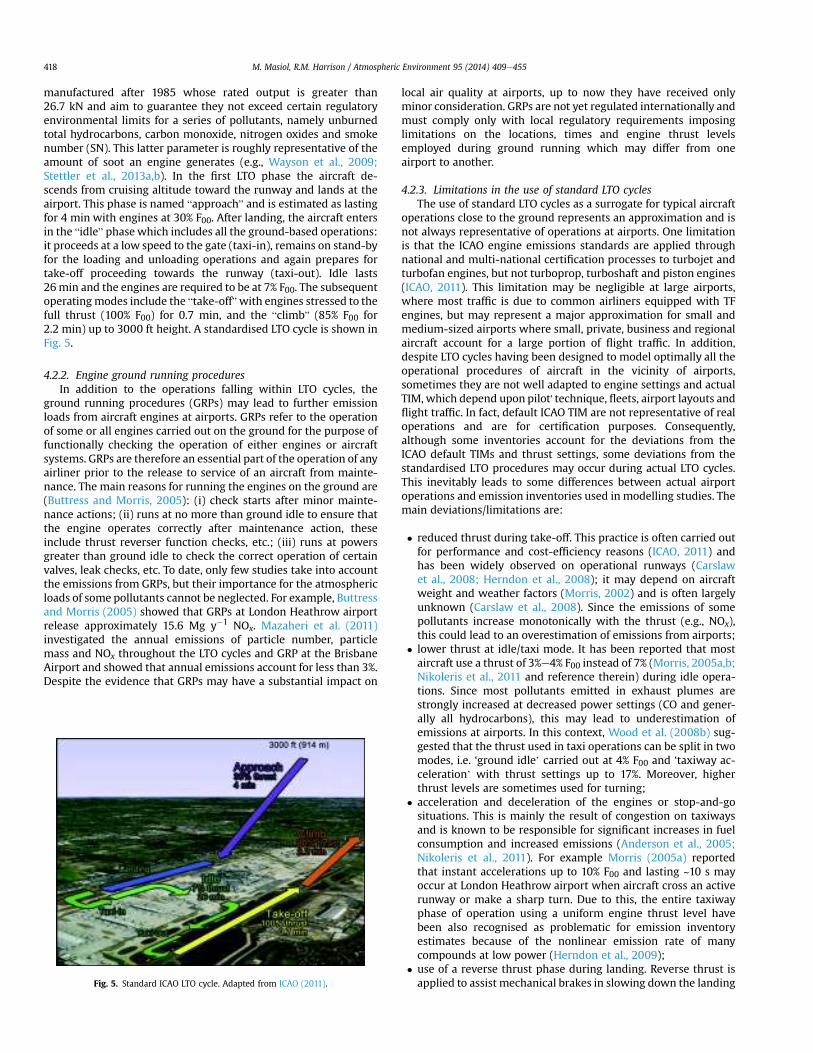
Stettler et al., 2013a,b). In the first LTO phase the aircraft de-
scends from cruising altitude toward the runway and lands at the
airport. This phase is named “approach” and is estimated as lasting
for 4 min with engines at 30% F00. After landing, the aircraft enters
in the “idle” phase which includes all the ground-based operations:
it proceeds at a low speed to the gate (taxi-in), remains on stand-by
for the loading and unloading operations and again prepares for
take-off proceeding towards the runway (taxi-out). Idle lasts
26min and the engines are required to be at 7% F00. The subsequent
operatingmodes include the “take-off”with engines stressed to the
full thrust (100% F00) for 0.7 min, and the “climb” (85% F00 for
2.2 min) up to 3000 ft height. A standardised LTO cycle is shown in
Fig. 5.
4.2.2. Engine ground running procedures
In addition to the operations falling within LTO cycles, the
ground running procedures (GRPs) may lead to further emission
loads from aircraft engines at airports. GRPs refer to the operation
of some or all engines carried out on the ground for the purpose of
functionally checking the operation of either engines or aircraft
systems. GRPs are therefore an essential part of the operation of any
airliner prior to the release to service of an aircraft from mainte-
nance. The main reasons for running the engines on the ground are
(Buttress and Morris, 2005): (i) check starts after minor mainte-
nance actions; (ii) runs at no more than ground idle to ensure that
the engine operates correctly after maintenance action, these
include thrust reverser function checks, etc.; (iii) runs at powers
greater than ground idle to check the correct operation of certain
valves, leak checks, etc. To date, only few studies take into account
the emissions from GRPs, but their importance for the atmospheric
loads of some pollutants cannot be neglected. For example, Buttress
and Morris (2005) showed that GRPs at London Heathrow airport
release approximately 15.6 Mg y#1 NOx. Mazaheri et al. (2011)
investigated the annual emissions of particle number, particle
mass and NOx throughout the LTO cycles and GRP at the Brisbane
Airport and showed that annual emissions account for less than 3%.
Despite the evidence that GRPs may have a substantial impact on
local air quality at airports, up to now they have received only
minor consideration. GRPs are not yet regulated internationally and
must comply only with local regulatory requirements imposing
limitations on the locations, times and engine thrust levels
employed during ground running which may differ from one
airport to another.
4.2.3. Limitations in the use of standard LTO cycles
The use of standard LTO cycles as a surrogate for typical aircraft
operations close to the ground represents an approximation and is
not always representative of operations at airports. One limitation
is that the ICAO engine emissions standards are applied through
national and multi-national certification processes to turbojet and
turbofan engines, but not turboprop, turboshaft and piston engines
(ICAO, 2011). This limitation may be negligible at large airports,
where most traffic is due to common airliners equipped with TF
engines, but may represent a major approximation for small and
medium-sized airports where small, private, business and regional
aircraft account for a large portion of flight traffic. In addition,
despite LTO cycles having been designed to model optimally all the
operational procedures of aircraft in the vicinity of airports,
sometimes they are not well adapted to engine settings and actual
TIM, which depend upon pilot' technique, fleets, airport layouts and
flight traffic. In fact, default ICAO TIM are not representative of real
operations and are for certification purposes. Consequently,
although some inventories account for the deviations from the
ICAO default TIMs and thrust settings, some deviations from the
standardised LTO procedures may occur during actual LTO cycles.
This inevitably leads to some differences between actual airport
operations and emission inventories used in modelling studies. The
main deviations/limitations are:
! reduced thrust during take-off. This practice is often carried out
for performance and cost-efficiency reasons (ICAO, 2011) and
has been widely observed on operational runways (Carslaw
et al., 2008; Herndon et al., 2008); it may depend on aircraft
weight and weather factors (Morris, 2002) and is often largely
unknown (Carslaw et al., 2008). Since the emissions of some
pollutants increase monotonically with the thrust (e.g., NOx),
this could lead to an overestimation of emissions from airports;
! lower thrust at idle/taxi mode. It has been reported that most
aircraft use a thrust of 3%e4% F00 instead of 7% (Morris, 2005a,b;
Nikoleris et al., 2011 and reference therein) during idle opera-
tions. Since most pollutants emitted in exhaust plumes are
strongly increased at decreased power settings (CO and gener-
ally all hydrocarbons), this may lead to underestimation of
emissions at airports. In this context, Wood et al. (2008b) sug-
gested that the thrust used in taxi operations can be split in two
modes, i.e. ‘ground idle’ carried out at 4% F00 and ‘taxiway ac-
celeration’ with thrust settings up to 17%. Moreover, higher
thrust levels are sometimes used for turning;
! acceleration and deceleration of the engines or stop-and-go
situations. This is mainly the result of congestion on taxiways
and is known to be responsible for significant increases in fuel
consumption and increased emissions (Anderson et al., 2005;
Nikoleris et al., 2011). For example Morris (2005a) reported
that instant accelerations up to 10% F00 and lasting ~10 s may
occur at London Heathrow airport when aircraft cross an active
runway or make a sharp turn. Due to this, the entire taxiway
phase of operation using a uniform engine thrust level have
been also recognised as problematic for emission inventory
estimates because of the nonlinear emission rate of many
compounds at low power (Herndon et al., 2009);
! use of a reverse thrust phase during landing. Reverse thrust is
applied to assist mechanical brakes in slowing down the landingFig. 5. Standard ICAO LTO cycle. Adapted from ICAO (2011).
M. Masiol, R.M. Harrison / Atmospheric Environment 95 (2014) 409e455418
aircraft and is not generally required for normal operations onto
a dry runway (ICAO, 2011). However, it generally occurs with
idle thrust power as a prudent safety precaution, and under
some circumstances it may also occur at power higher than 10%
F00 (Morris and Easey, 2005; Stettler et al., 2011). Generally,
reverse thrust is applied for 10e20 s (Fanning et al., 2007;
Stettler et al., 2011), but may vary as a function of the landing
velocity, runway length and aircraft weight;
! the evident differences between the standard TIM, which is used
as part of the ICAO engine emissions certification processes, and
the actual TIM used at airports (e.g., Unique, 2004; Watterson
et al., 2004; Patterson et al., 2009; Stettler et al., 2011;
Mazaheri et al., 2011; Khadilkar and Balakrishnan, 2012). For
example, Patterson et al. (2009) and Khadilkar and Balakrishnan
(2012) observed that total fuel burn during departures and ar-
rivals at airports is generally overestimated by the ICAO method
with respect to emissions computed from real-time aircraft
flight data. Other studies have also reported measured TIM at
airports: Unique (2004) reported TIM in Zurich airport and
detected differences in all the LTO phases: idle (#43%), approach
(þ10%), climb (#77%) and take-off (þ129%) which have been
estimated to have a strong impact on the calculation of emis-
sions, resulting in reduced fuel flow (#38%) and NOx emissions
(#31%);
! the composition of the fleet that serves an airport and the
weight of the aircraft. Since the ICAO certifies the engines and
not the full aircraft, some airplane characteristics, mainly the
aircraft weight, may have a key role in determining the emis-
sions. Furthermore, in addition to the mass of the aircraft, its
load of fuel, passengers and goods affect the overall weight: it is
reported that passengers, crew and luggage usually add 6e15%
to aircraft weight (Hu et al., 2009). Most of those factors vary
from flight to flight, are largely unknown and may have direct
implications for reduced thrust during take-off. In fact, it should
be inferred that the increase of the aircraft weight has direct
effects upon the thrust levels needed for carrying out usual LTO
operations. For example, Carslaw et al. (2008) studied the NOx
emissions at London Heathrow and found evidence for statis-
tically significant differences in the emissions from the same
engine type used on the same aircraft frame. Among other fac-
tors, they speculated that the aircraft weight could be a cause. In
a study conducted in eight major busy airports, Turgut and
Rosen (2010) detected significant differences in the emissions
of some pollutants and concluded that every airport has LTO
cycles carried out by aircraft with different characteristics and,
consequently, emissions. Another recent study by Turgut et al.
(2013) showed a good relationship between aircraft mass and
the NOx emission during take-off and climb, which supports the
concept of an explicit relationship between the aircraft weight
and emissions. There is a general lack of knowledge about the
relationships between aircraft mass and emissions, although
some recent studies have indicated that heavier aircraft also
emit more particles (Zhu et al., 2011).
Recent studies assessing airport emissions have proposed and
used LTO cycles which are much more complex than those stand-
ardised by the ICAO. For example, in a study of the air quality and
public health impacts of UK airports, Stettler et al. (2011) used
specific TIMs derived fromWatterson et al. (2004) and Underwood
et al. (2004) composed of 12 phases, namely approach, landing roll,
reverse thrust, taxi-in, taxiway acceleration, APU, taxi-out, taxiway
acceleration, hold, take-off, initial climb and climb-out. Proposed
TIMs were developed by analysing the common procedures of an
A320 aircraft at London Heathrow, but may vary by aircraft size
category. Other studies (e.g., Ratliff et al., 2009), used models, such
as the Emissions and Dispersion Modelling System (EDMS), which
also requires jet fuel quality data, main engine and APU specifica-
tions, aircraft weight and ground operating time to generate more
reliable emission estimates.
4.2.4. The emission indices (EIs)
The emissions during standardised LTO cycles are then reported
as emission indices (EIs) expressed as mass of pollutant emitted per
unit mass of fuel burned. Fuel-based emission indices for the
compound X are calculated according to:
EIðXÞ ¼ Fc$!
MX
"
MCO2
#
$ðDX=DCO2Þ
where Fc represents the stoichiometric calculation of CO2 produced
per kilogram of fuel consumed (with units g CO2 kg Fuel#1)
assuming complete combustion and given a particular hydrogen to
carbon ratio (e.g., Herndon et al., 2004). Mx and MCO2are the mo-
lecular weights of the compound X and CO2, respectively, and DX
andDCO2 are the enhancements of compound X and CO2within the
plume, respectively (e.g., Anderson et al., 2006). Unless specified
differently, by convention EI(NOx) is defined in terms of NO2 and
therefore the mass of NOx emissions is:
NOx as NO2 ¼ NO2 emissions
þNO emissions$MðNO2Þ=MðNOÞ
where M(NO2) and M(NO) are the molecular weights of NO2 and
NO, respectively. In a similar way it should be specified that
EI(hydrocarbons) is often referenced to methane (Wahner et al.,
1995). ICAO maintains a databank of engine certification data for
commercial aviation reporting EIs for the four selected pollutants
(EASA, 2013). Emissions of a pollutant X from an engine can be
therefore calculated using three parameters: the first two are
provided by the ICAO databank and are the main engine EI(X) and
the engine fuel flow, i.e., the burned fuel at a defined power setting
(expressed as kg s#1); the third parameter is the time-in-mode
(TIM), i.e. the time the engines spend at an identified power
setting (ICAO, 2011):
EmissionðXÞ ¼ EIðXÞ$TIM$fuel flow
Analogous to the EI for the emitted pollutant, emission indices
for the number of particles have been commonly reported in the
literature. For convention, they are here reported as EI(#).
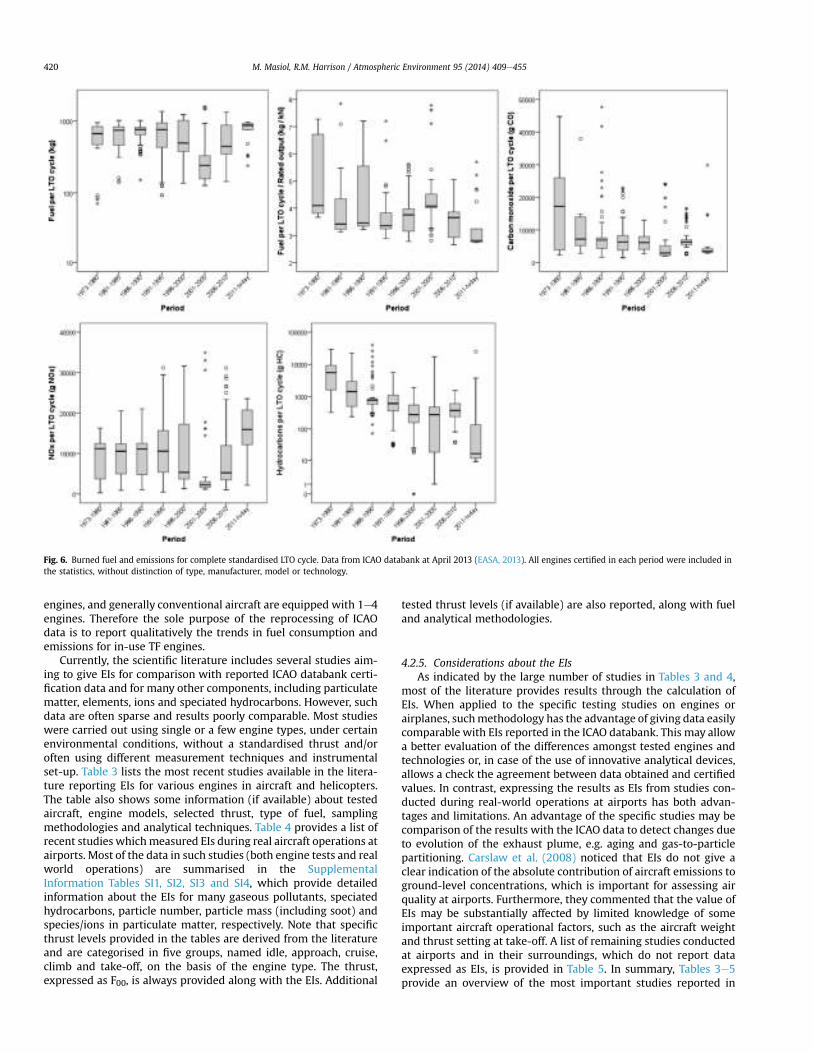
Using ICAO EIs and standardised LTO TIMs, Figs. 6e8 report a
reprocessing of the data included in the ICAO databank. In partic-
ular, Fig. 6 shows the total burned fuel and the mass of emitted
pollutants (CO, NOx and hydrocarbons) during a complete LTO cy-
cle, i.e. the sum of standardised time in each mode per fuel flow per
average EI at each of the four power settings (ICAO, 2013); data are
organised to show the changes in the ICAO emission data for in-use
engines certified from 1973 to present (five year steps). Since
different engines have different characteristics, including the thrust
force, Fig. 6 also shows the ratios between the fuel burned during
complete LTO cycles and the engine maximum rated thrust (in kN)
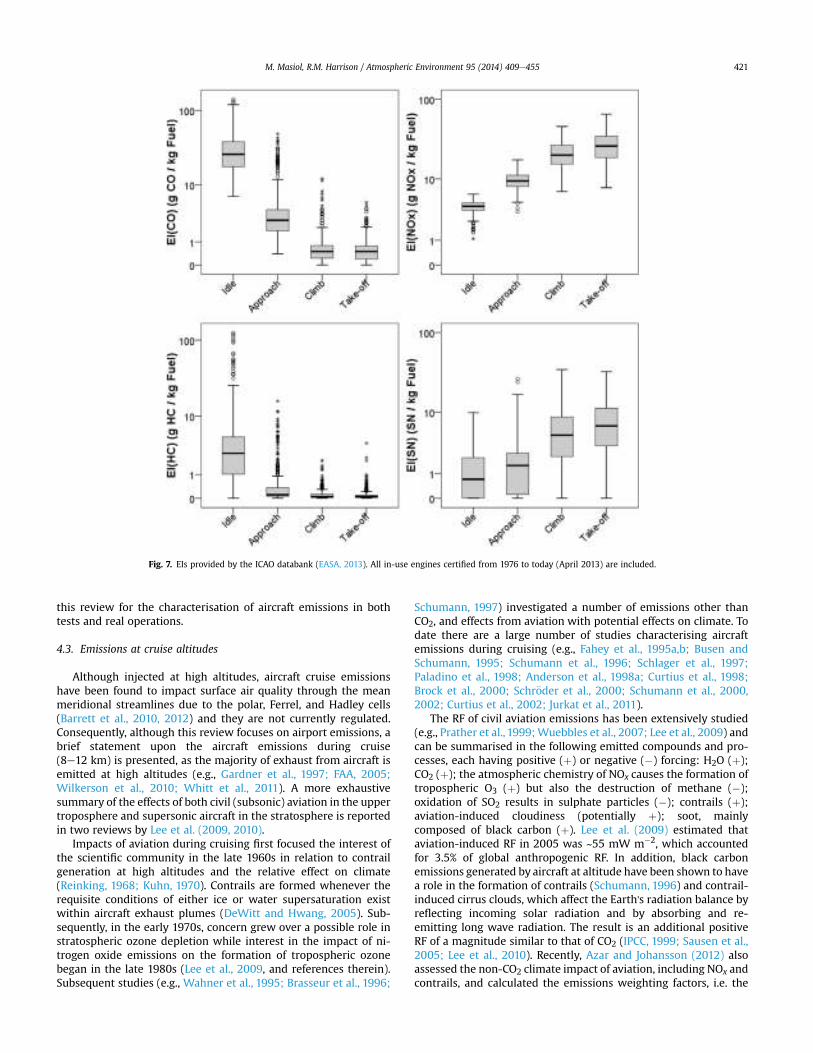
to normalise the fuel consumption of the engine power. Fig. 7
summarises the ICAO EI data (all in-use engines certified from
1976 to today) per each LTO stage, expressed as g pollutant emitted
per kg fuel burned. Fig. 8 shows the total burned fuel and emissions
per each LTO phase, i.e. the product of EIs per standardised time in
each phase per fuel flow. The reprocessing of ICAO data does not
take into account the number of units produced for each engine
model, but only the different models produced and still in service in
April 2013 (and included in the ICAO databank), regardless of
manufacturer, type and technology. Moreover, data refer to single
M. Masiol, R.M. Harrison / Atmospheric Environment 95 (2014) 409e455 419
engines, and generally conventional aircraft are equipped with 1e4
engines. Therefore the sole purpose of the reprocessing of ICAO
data is to report qualitatively the trends in fuel consumption and
emissions for in-use TF engines.
Currently, the scientific literature includes several studies aim-
ing to give EIs for comparison with reported ICAO databank certi-
fication data and for many other components, including particulate
matter, elements, ions and speciated hydrocarbons. However, such
data are often sparse and results poorly comparable. Most studies
were carried out using single or a few engine types, under certain
environmental conditions, without a standardised thrust and/or
often using different measurement techniques and instrumental
set-up. Table 3 lists the most recent studies available in the litera-
ture reporting EIs for various engines in aircraft and helicopters.
The table also shows some information (if available) about tested
aircraft, engine models, selected thrust, type of fuel, sampling
methodologies and analytical techniques. Table 4 provides a list of
recent studies whichmeasured EIs during real aircraft operations at
airports. Most of the data in such studies (both engine tests and real
world operations) are summarised in the Supplemental
Information Tables SI1, SI2, SI3 and SI4, which provide detailed
information about the EIs for many gaseous pollutants, speciated
hydrocarbons, particle number, particle mass (including soot) and
species/ions in particulate matter, respectively. Note that specific
thrust levels provided in the tables are derived from the literature
and are categorised in five groups, named idle, approach, cruise,
climb and take-off, on the basis of the engine type. The thrust,
expressed as F00, is always provided along with the EIs. Additional
tested thrust levels (if available) are also reported, along with fuel
and analytical methodologies.
4.2.5. Considerations about the EIs
As indicated by the large number of studies in Tables 3 and 4,
most of the literature provides results through the calculation of
EIs. When applied to the specific testing studies on engines or
airplanes, suchmethodology has the advantage of giving data easily
comparable with EIs reported in the ICAO databank. This may allow
a better evaluation of the differences amongst tested engines and
technologies or, in case of the use of innovative analytical devices,
allows a check the agreement between data obtained and certified
values. In contrast, expressing the results as EIs from studies con-
ducted during real-world operations at airports has both advan-
tages and limitations. An advantage of the specific studies may be
comparison of the results with the ICAO data to detect changes due
to evolution of the exhaust plume, e.g. aging and gas-to-particle
partitioning. Carslaw et al. (2008) noticed that EIs do not give a
clear indication of the absolute contribution of aircraft emissions to
ground-level concentrations, which is important for assessing air
quality at airports. Furthermore, they commented that the value of
EIs may be substantially affected by limited knowledge of some
important aircraft operational factors, such as the aircraft weight
and thrust setting at take-off. A list of remaining studies conducted
at airports and in their surroundings, which do not report data
expressed as EIs, is provided in Table 5. In summary, Tables 3e5
provide an overview of the most important studies reported in
Fig. 6. Burned fuel and emissions for complete standardised LTO cycle. Data from ICAO databank at April 2013 (EASA, 2013). All engines certified in each period were included in
the statistics, without distinction of type, manufacturer, model or technology.
M. Masiol, R.M. Harrison / Atmospheric Environment 95 (2014) 409e455420
this review for the characterisation of aircraft emissions in both
tests and real operations.
4.3. Emissions at cruise altitudes
Although injected at high altitudes, aircraft cruise emissions
have been found to impact surface air quality through the mean
meridional streamlines due to the polar, Ferrel, and Hadley cells
(Barrett et al., 2010, 2012) and they are not currently regulated.
Consequently, although this review focuses on airport emissions, a
brief statement upon the aircraft emissions during cruise
(8e12 km) is presented, as the majority of exhaust from aircraft is
emitted at high altitudes (e.g., Gardner et al., 1997; FAA, 2005;
Wilkerson et al., 2010; Whitt et al., 2011). A more exhaustive
summary of the effects of both civil (subsonic) aviation in the upper
troposphere and supersonic aircraft in the stratosphere is reported
in two reviews by Lee et al. (2009, 2010).
Impacts of aviation during cruising first focused the interest of
the scientific community in the late 1960s in relation to contrail
generation at high altitudes and the relative effect on climate
(Reinking, 1968; Kuhn, 1970). Contrails are formed whenever the
requisite conditions of either ice or water supersaturation exist
within aircraft exhaust plumes (DeWitt and Hwang, 2005). Sub-
sequently, in the early 1970s, concern grew over a possible role in
stratospheric ozone depletion while interest in the impact of ni-
trogen oxide emissions on the formation of tropospheric ozone
began in the late 1980s (Lee et al., 2009, and references therein).
Subsequent studies (e.g., Wahner et al., 1995; Brasseur et al., 1996;
Schumann, 1997) investigated a number of emissions other than
CO2, and effects from aviation with potential effects on climate. To
date there are a large number of studies characterising aircraft
emissions during cruising (e.g., Fahey et al., 1995a,b; Busen and
Schumann, 1995; Schumann et al., 1996; Schlager et al., 1997;
Paladino et al., 1998; Anderson et al., 1998a; Curtius et al., 1998;
Brock et al., 2000; Schr€oder et al., 2000; Schumann et al., 2000,
2002; Curtius et al., 2002; Jurkat et al., 2011).
The RF of civil aviation emissions has been extensively studied
(e.g., Prather et al., 1999;Wuebbles et al., 2007; Lee et al., 2009) and
can be summarised in the following emitted compounds and pro-
cesses, each having positive (þ) or negative (#) forcing: H2O (þ);
CO2 (þ); the atmospheric chemistry of NOx causes the formation of
tropospheric O3 (þ) but also the destruction of methane (#);
oxidation of SO2 results in sulphate particles (#); contrails (þ);
aviation-induced cloudiness (potentially þ); soot, mainly
composed of black carbon (þ). Lee et al. (2009) estimated that
aviation-induced RF in 2005 was ~55 mW m#2, which accounted
for 3.5% of global anthropogenic RF. In addition, black carbon
emissions generated by aircraft at altitude have been shown to have
a role in the formation of contrails (Schumann, 1996) and contrail-
induced cirrus clouds, which affect the Earth's radiation balance by
reflecting incoming solar radiation and by absorbing and re-
emitting long wave radiation. The result is an additional positive
RF of a magnitude similar to that of CO2 (IPCC, 1999; Sausen et al.,
2005; Lee et al., 2010). Recently, Azar and Johansson (2012) also
assessed the non-CO2 climate impact of aviation, including NOx and
contrails, and calculated the emissions weighting factors, i.e. the
Fig. 7. EIs provided by the ICAO databank (EASA, 2013). All in-use engines certified from 1976 to today (April 2013) are included.
M. Masiol, R.M. Harrison / Atmospheric Environment 95 (2014) 409e455 421
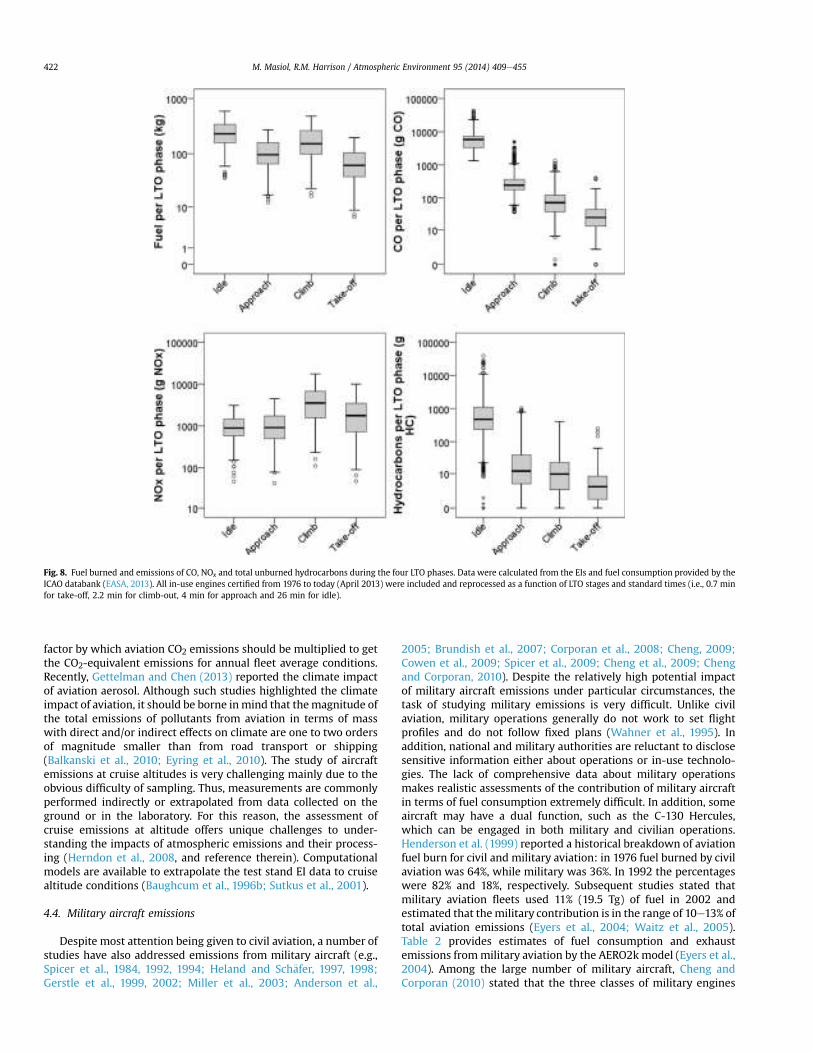
factor by which aviation CO2 emissions should be multiplied to get
the CO2-equivalent emissions for annual fleet average conditions.
Recently, Gettelman and Chen (2013) reported the climate impact
of aviation aerosol. Although such studies highlighted the climate
impact of aviation, it should be borne inmind that themagnitude of
the total emissions of pollutants from aviation in terms of mass
with direct and/or indirect effects on climate are one to two orders
of magnitude smaller than from road transport or shipping
(Balkanski et al., 2010; Eyring et al., 2010). The study of aircraft
emissions at cruise altitudes is very challenging mainly due to the
obvious difficulty of sampling. Thus, measurements are commonly
performed indirectly or extrapolated from data collected on the
ground or in the laboratory. For this reason, the assessment of
cruise emissions at altitude offers unique challenges to under-
standing the impacts of atmospheric emissions and their process-
ing (Herndon et al., 2008, and reference therein). Computational
models are available to extrapolate the test stand EI data to cruise
altitude conditions (Baughcum et al., 1996b; Sutkus et al., 2001).
4.4. Military aircraft emissions
Despite most attention being given to civil aviation, a number of
studies have also addressed emissions from military aircraft (e.g.,
Spicer et al., 1984, 1992, 1994; Heland and Sch€afer, 1997, 1998;
Gerstle et al., 1999, 2002; Miller et al., 2003; Anderson et al.,
2005; Brundish et al., 2007; Corporan et al., 2008; Cheng, 2009;
Cowen et al., 2009; Spicer et al., 2009; Cheng et al., 2009; Cheng
and Corporan, 2010). Despite the relatively high potential impact
of military aircraft emissions under particular circumstances, the
task of studying military emissions is very difficult. Unlike civil
aviation, military operations generally do not work to set flight
profiles and do not follow fixed plans (Wahner et al., 1995). In
addition, national and military authorities are reluctant to disclose
sensitive information either about operations or in-use technolo-
gies. The lack of comprehensive data about military operations
makes realistic assessments of the contribution of military aircraft
in terms of fuel consumption extremely difficult. In addition, some
aircraft may have a dual function, such as the C-130 Hercules,
which can be engaged in both military and civilian operations.
Henderson et al. (1999) reported a historical breakdown of aviation
fuel burn for civil and military aviation: in 1976 fuel burned by civil
aviation was 64%, while military was 36%. In 1992 the percentages
were 82% and 18%, respectively. Subsequent studies stated that
military aviation fleets used 11% (19.5 Tg) of fuel in 2002 and
estimated that themilitary contribution is in the range of 10e13% of
total aviation emissions (Eyers et al., 2004; Waitz et al., 2005).
Table 2 provides estimates of fuel consumption and exhaust
emissions frommilitary aviation by the AERO2k model (Eyers et al.,
2004). Among the large number of military aircraft, Cheng and
Corporan (2010) stated that the three classes of military engines
Fig. 8. Fuel burned and emissions of CO, NOx and total unburned hydrocarbons during the four LTO phases. Data were calculated from the EIs and fuel consumption provided by the
ICAO databank (EASA, 2013). All in-use engines certified from 1976 to today (April 2013) were included and reprocessed as a function of LTO stages and standard times (i.e., 0.7 min
for take-off, 2.2 min for climb-out, 4 min for approach and 26 min for idle).
M. Masiol, R.M. Harrison / Atmospheric Environment 95 (2014) 409e455422
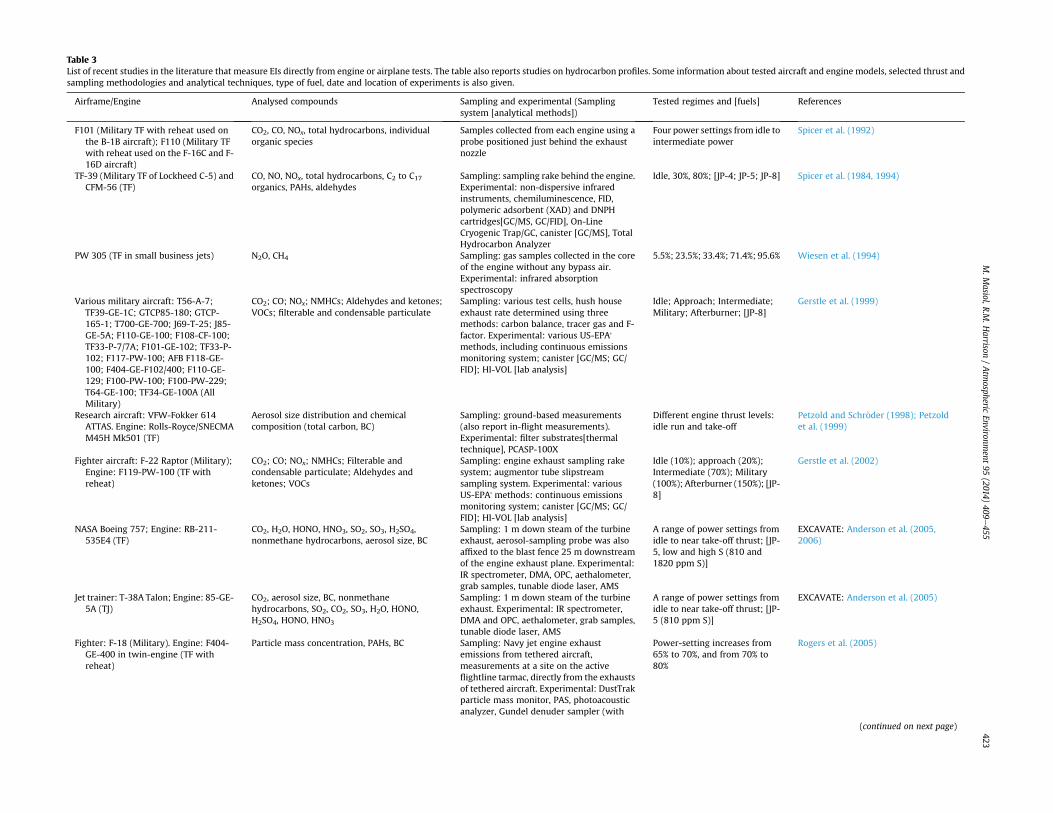
Table 3
List of recent studies in the literature that measure EIs directly from engine or airplane tests. The table also reports studies on hydrocarbon profiles. Some information about tested aircraft and engine models, selected thrust and
sampling methodologies and analytical techniques, type of fuel, date and location of experiments is also given.
Airframe/Engine Analysed compounds Sampling and experimental (Sampling
system [analytical methods])
Tested regimes and [fuels] References
F101 (Military TF with reheat used on
the B-1B aircraft); F110 (Military TF
with reheat used on the F-16C and F-
16D aircraft)
CO2, CO, NOx, total hydrocarbons, individual
organic species
Samples collected from each engine using a
probe positioned just behind the exhaust
nozzle
Four power settings from idle to
intermediate power
Spicer et al. (1992)
TF-39 (Military TF of Lockheed C-5) and
CFM-56 (TF)
CO, NO, NOx, total hydrocarbons, C2 to C17organics, PAHs, aldehydes
Sampling: sampling rake behind the engine.
Experimental: non-dispersive infrared
instruments, chemiluminescence, FID,
polymeric adsorbent (XAD) and DNPH
cartridges[GC/MS, GC/FID], On-Line
Cryogenic Trap/GC, canister [GC/MS], Total
Hydrocarbon Analyzer
Idle, 30%, 80%; [JP-4; JP-5; JP-8] Spicer et al. (1984, 1994)
PW 305 (TF in small business jets) N2O, CH4 Sampling: gas samples collected in the core
of the engine without any bypass air.
Experimental: infrared absorption
spectroscopy
5.5%; 23.5%; 33.4%; 71.4%; 95.6% Wiesen et al. (1994)
Various military aircraft: T56-A-7;
TF39-GE-1C; GTCP85-180; GTCP-
165-1; T700-GE-700; J69-T-25; J85-
GE-5A; F110-GE-100; F108-CF-100;
TF33-P-7/7A; F101-GE-102; TF33-P-
102; F117-PW-100; AFB F118-GE-
100; F404-GE-F102/400; F110-GE-
129; F100-PW-100; F100-PW-229;
T64-GE-100; TF34-GE-100A (All
Military)
CO2; CO; NOx; NMHCs; Aldehydes and ketones;
VOCs; filterable and condensable particulate
Sampling: various test cells, hush house
exhaust rate determined using three
methods: carbon balance, tracer gas and F-
factor. Experimental: various US-EPA'
methods, including continuous emissions
monitoring system; canister [GC/MS; GC/
FID]; HI-VOL [lab analysis]
Idle; Approach; Intermediate;
Military; Afterburner; [JP-8]
Gerstle et al. (1999)
Research aircraft: VFW-Fokker 614
ATTAS. Engine: Rolls-Royce/SNECMA
M45H Mk501 (TF)
Aerosol size distribution and chemical
composition (total carbon, BC)
Sampling: ground-based measurements
(also report in-flight measurements).
Experimental: filter substrates[thermal
technique], PCASP-100X
Different engine thrust levels:
idle run and take-off
Petzold and Schr€oder (1998); Petzold
et al. (1999)
Fighter aircraft: F-22 Raptor (Military);
Engine: F119-PW-100 (TF with
reheat)
CO2; CO; NOx; NMHCs; Filterable and
condensable particulate; Aldehydes and
ketones; VOCs
Sampling: engine exhaust sampling rake
system; augmentor tube slipstream
sampling system. Experimental: various
US-EPA' methods: continuous emissions
monitoring system; canister [GC/MS; GC/
FID]; HI-VOL [lab analysis]
Idle (10%); approach (20%);
Intermediate (70%); Military
(100%); Afterburner (150%); [JP-
8]
Gerstle et al. (2002)
NASA Boeing 757; Engine: RB-211-
535E4 (TF)
CO2, H2O, HONO, HNO3, SO2, SO3, H2SO4,
nonmethane hydrocarbons, aerosol size, BC
Sampling: 1 m down steam of the turbine
exhaust, aerosol-sampling probe was also
affixed to the blast fence 25 m downstream
of the engine exhaust plane. Experimental:
IR spectrometer, DMA, OPC, aethalometer,
grab samples, tunable diode laser, AMS
A range of power settings from
idle to near take-off thrust; [JP-
5, low and high S (810 and
1820 ppm S)]
EXCAVATE: Anderson et al. (2005,
2006)
Jet trainer: T-38A Talon; Engine: 85-GE-
5A (TJ)
CO2, aerosol size, BC, nonmethane
hydrocarbons, SO2, CO2, SO3, H2O, HONO,
H2SO4, HONO, HNO3
Sampling: 1 m down steam of the turbine
exhaust. Experimental: IR spectrometer,
DMA and OPC, aethalometer, grab samples,
tunable diode laser, AMS
A range of power settings from
idle to near take-off thrust; [JP-
5 (810 ppm S)]
EXCAVATE: Anderson et al. (2005)
Fighter: F-18 (Military). Engine: F404-
GE-400 in twin-engine (TF with
reheat)
Particle mass concentration, PAHs, BC Sampling: Navy jet engine exhaust
emissions from tethered aircraft,
measurements at a site on the active
flightline tarmac, directly from the exhausts
of tethered aircraft. Experimental: DustTrak
particle mass monitor, PAS, photoacoustic
analyzer, Gundel denuder sampler (with
Power-setting increases from
65% to 70%, and from 70% to
80%
Rogers et al. (2005)
(continued on next page)
M.Masio
l,R.M
.Harriso
n/Atm
ospheric
Enviro
nmen
t95(2014
)409e455
423
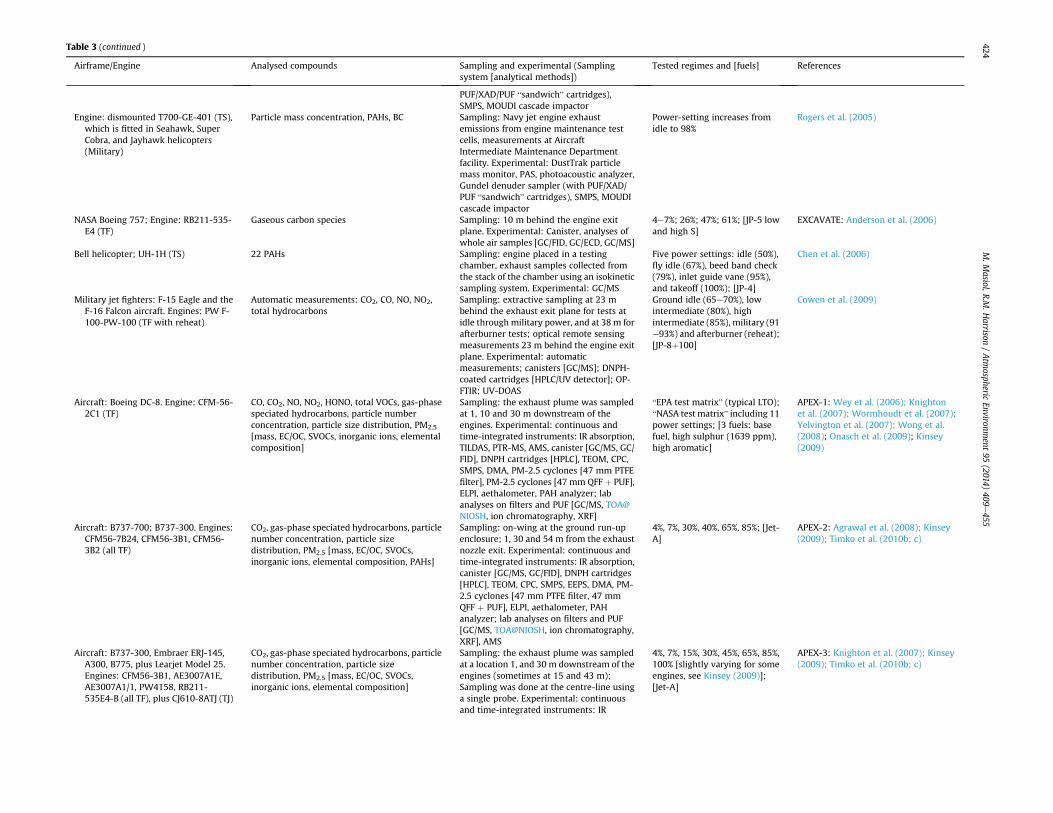
Table 3 (continued )
Airframe/Engine Analysed compounds Sampling and experimental (Sampling
system [analytical methods])
Tested regimes and [fuels] References
PUF/XAD/PUF “sandwich” cartridges),
SMPS, MOUDI cascade impactor
Engine: dismounted T700-GE-401 (TS),
which is fitted in Seahawk, Super
Cobra, and Jayhawk helicopters
(Military)
Particle mass concentration, PAHs, BC Sampling: Navy jet engine exhaust
emissions from engine maintenance test
cells, measurements at Aircraft
Intermediate Maintenance Department
facility. Experimental: DustTrak particle
mass monitor, PAS, photoacoustic analyzer,
Gundel denuder sampler (with PUF/XAD/
PUF “sandwich” cartridges), SMPS, MOUDI
cascade impactor
Power-setting increases from
idle to 98%
Rogers et al. (2005)
NASA Boeing 757; Engine: RB211-535-
E4 (TF)
Gaseous carbon species Sampling: 10 m behind the engine exit
plane. Experimental: Canister, analyses of
whole air samples [GC/FID, GC/ECD, GC/MS]
4e7%; 26%; 47%; 61%; [JP-5 low
and high S]
EXCAVATE: Anderson et al. (2006)
Bell helicopter; UH-1H (TS) 22 PAHs Sampling: engine placed in a testing
chamber, exhaust samples collected from
the stack of the chamber using an isokinetic
sampling system. Experimental: GC/MS
Five power settings: idle (50%),
fly idle (67%), beed band check
(79%), inlet guide vane (95%),
and takeoff (100%); [JP-4]
Chen et al. (2006)
Military jet fighters: F-15 Eagle and the
F-16 Falcon aircraft. Engines: PW F-
100-PW-100 (TF with reheat)
Automatic measurements: CO2, CO, NO, NO2,
total hydrocarbons
Sampling: extractive sampling at 23 m
behind the exhaust exit plane for tests at
idle throughmilitary power, and at 38m for
afterburner tests; optical remote sensing
measurements 23 m behind the engine exit
plane. Experimental: automatic
measurements; canisters [GC/MS]; DNPH-
coated cartridges [HPLC/UV detector]; OP-
FTIR; UV-DOAS
Ground idle (65e70%), low
intermediate (80%), high
intermediate (85%), military (91
e93%) and afterburner (reheat);
[JP-8þ100]
Cowen et al. (2009)
Aircraft: Boeing DC-8. Engine: CFM-56-
2C1 (TF)
CO, CO2, NO, NO2, HONO, total VOCs, gas-phase
speciated hydrocarbons, particle number
concentration, particle size distribution, PM2.5
[mass, EC/OC, SVOCs, inorganic ions, elemental
composition]
Sampling: the exhaust plume was sampled
at 1, 10 and 30 m downstream of the
engines. Experimental: continuous and
time-integrated instruments: IR absorption,
TILDAS, PTR-MS, AMS, canister [GC/MS, GC/
FID], DNPH cartridges [HPLC], TEOM, CPC,
SMPS, DMA, PM-2.5 cyclones [47 mm PTFE
filter], PM-2.5 cyclones [47 mm QFF þ PUF],
ELPI, aethalometer, PAH analyzer; lab
analyses on filters and PUF [GC/MS, TOA@
NIOSH, ion chromatography, XRF]
“EPA test matrix” (typical LTO);
“NASA test matrix” including 11
power settings; [3 fuels: base
fuel, high sulphur (1639 ppm),
high aromatic]
APEX-1: Wey et al. (2006); Knighton
et al. (2007); Wormhoudt et al. (2007);
Yelvington et al. (2007); Wong et al.
(2008); Onasch et al. (2009); Kinsey
(2009)
Aircraft: B737-700; B737-300. Engines:
CFM56-7B24, CFM56-3B1, CFM56-
3B2 (all TF)
CO2, gas-phase speciated hydrocarbons, particle
number concentration, particle size
distribution, PM2.5 [mass, EC/OC, SVOCs,
inorganic ions, elemental composition, PAHs]
Sampling: on-wing at the ground run-up
enclosure; 1, 30 and 54 m from the exhaust
nozzle exit. Experimental: continuous and
time-integrated instruments: IR absorption,
canister [GC/MS, GC/FID], DNPH cartridges
[HPLC], TEOM, CPC, SMPS, EEPS, DMA, PM-
2.5 cyclones [47 mm PTFE filter, 47 mm
QFF þ PUF], ELPI, aethalometer, PAH
analyzer; lab analyses on filters and PUF
[GC/MS, TOA@NIOSH, ion chromatography,
XRF], AMS
4%, 7%, 30%, 40%, 65%, 85%; [Jet-
A]
APEX-2: Agrawal et al. (2008); Kinsey
(2009); Timko et al. (2010b; c)
Aircraft: B737-300, Embraer ERJ-145,
A300, B775, plus Learjet Model 25.
Engines: CFM56-3B1, AE3007A1E,
AE3007A1/1, PW4158, RB211-
535E4-B (all TF), plus CJ610-8ATJ (TJ)
CO2, gas-phase speciated hydrocarbons, particle
number concentration, particle size
distribution, PM2.5 [mass, EC/OC, SVOCs,
inorganic ions, elemental composition]
Sampling: the exhaust plume was sampled
at a location 1, and 30 m downstream of the
engines (sometimes at 15 and 43 m);
Sampling was done at the centre-line using
a single probe. Experimental: continuous
and time-integrated instruments: IR
4%, 7%, 15%, 30%, 45%, 65%, 85%,
100% [slightly varying for some
engines, see Kinsey (2009)];
[Jet-A]
APEX-3: Knighton et al. (2007); Kinsey
(2009); Timko et al. (2010b; c)
M.Masio
l,R.M
.Harriso
n/Atm
ospheric
Enviro
nmen
t95(2014
)409e455
424
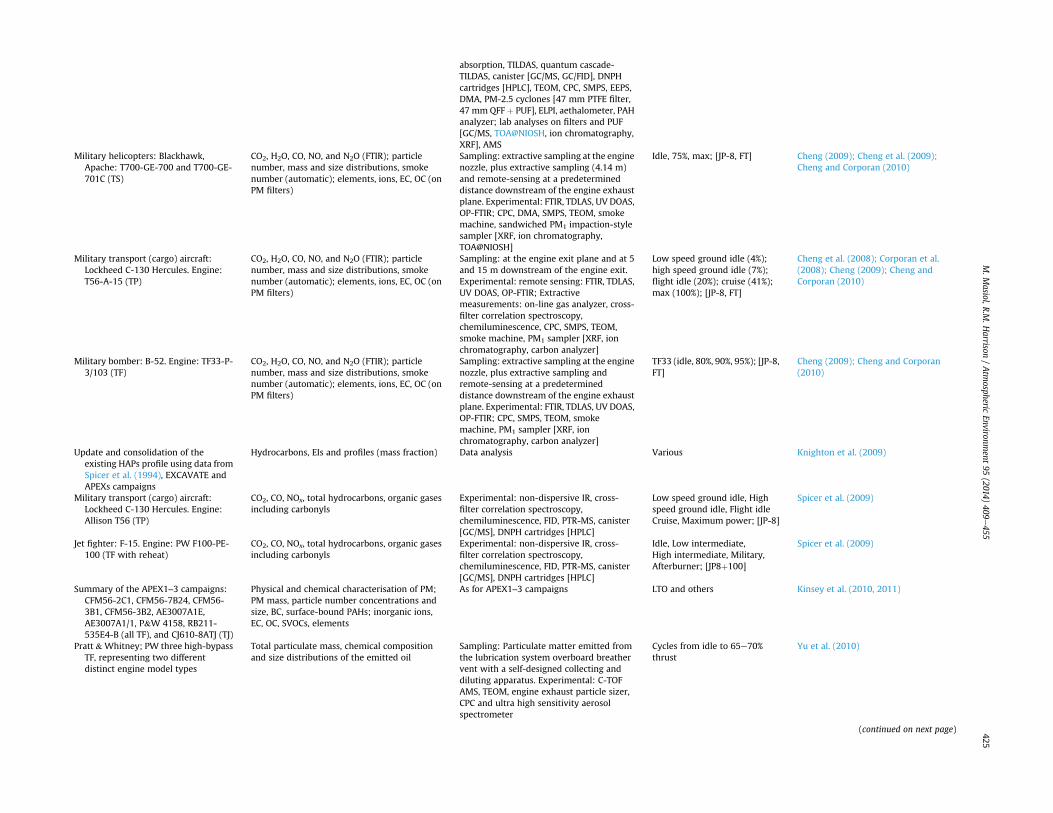
absorption, TILDAS, quantum cascade-
TILDAS, canister [GC/MS, GC/FID], DNPH
cartridges [HPLC], TEOM, CPC, SMPS, EEPS,
DMA, PM-2.5 cyclones [47 mm PTFE filter,
47 mm QFF þ PUF], ELPI, aethalometer, PAH
analyzer; lab analyses on filters and PUF
[GC/MS, TOA@NIOSH, ion chromatography,
XRF], AMS
Military helicopters: Blackhawk,
Apache: T700-GE-700 and T700-GE-
701C (TS)
CO2, H2O, CO, NO, and N2O (FTIR); particle
number, mass and size distributions, smoke
number (automatic); elements, ions, EC, OC (on
PM filters)
Sampling: extractive sampling at the engine
nozzle, plus extractive sampling (4.14 m)
and remote-sensing at a predetermined
distance downstream of the engine exhaust
plane. Experimental: FTIR, TDLAS, UV DOAS,
OP-FTIR; CPC, DMA, SMPS, TEOM, smoke
machine, sandwiched PM1 impaction-style
sampler [XRF, ion chromatography,
TOA@NIOSH]
Idle, 75%, max; [JP-8, FT] Cheng (2009); Cheng et al. (2009);
Cheng and Corporan (2010)
Military transport (cargo) aircraft:
Lockheed C-130 Hercules. Engine:
T56-A-15 (TP)
CO2, H2O, CO, NO, and N2O (FTIR); particle
number, mass and size distributions, smoke
number (automatic); elements, ions, EC, OC (on
PM filters)
Sampling: at the engine exit plane and at 5
and 15 m downstream of the engine exit.
Experimental: remote sensing: FTIR, TDLAS,
UV DOAS, OP-FTIR; Extractive
measurements: on-line gas analyzer, cross-
filter correlation spectroscopy,
chemiluminescence, CPC, SMPS, TEOM,
smoke machine, PM1 sampler [XRF, ion
chromatography, carbon analyzer]
Low speed ground idle (4%);
high speed ground idle (7%);
flight idle (20%); cruise (41%);
max (100%); [JP-8, FT]
Cheng et al. (2008); Corporan et al.
(2008); Cheng (2009); Cheng and
Corporan (2010)
Military bomber: B-52. Engine: TF33-P-
3/103 (TF)
CO2, H2O, CO, NO, and N2O (FTIR); particle
number, mass and size distributions, smoke
number (automatic); elements, ions, EC, OC (on
PM filters)
Sampling: extractive sampling at the engine
nozzle, plus extractive sampling and
remote-sensing at a predetermined
distance downstream of the engine exhaust
plane. Experimental: FTIR, TDLAS, UV DOAS,
OP-FTIR; CPC, SMPS, TEOM, smoke
machine, PM1 sampler [XRF, ion
chromatography, carbon analyzer]
TF33 (idle, 80%, 90%, 95%); [JP-8,
FT]
Cheng (2009); Cheng and Corporan
(2010)
Update and consolidation of the
existing HAPs profile using data from
Spicer et al. (1994), EXCAVATE and
APEXs campaigns
Hydrocarbons, EIs and profiles (mass fraction) Data analysis Various Knighton et al. (2009)
Military transport (cargo) aircraft:
Lockheed C-130 Hercules. Engine:
Allison T56 (TP)
CO2, CO, NOx, total hydrocarbons, organic gases
including carbonyls
Experimental: non-dispersive IR, cross-
filter correlation spectroscopy,
chemiluminescence, FID, PTR-MS, canister
[GC/MS], DNPH cartridges [HPLC]
Low speed ground idle, High
speed ground idle, Flight idle
Cruise, Maximum power; [JP-8]
Spicer et al. (2009)
Jet fighter: F-15. Engine: PW F100-PE-
100 (TF with reheat)
CO2, CO, NOx, total hydrocarbons, organic gases
including carbonyls
Experimental: non-dispersive IR, cross-
filter correlation spectroscopy,
chemiluminescence, FID, PTR-MS, canister
[GC/MS], DNPH cartridges [HPLC]
Idle, Low intermediate,
High intermediate, Military,
Afterburner; [JP8þ100]
Spicer et al. (2009)
Summary of the APEX1‒3 campaigns:
CFM56-2C1, CFM56-7B24, CFM56-
3B1, CFM56-3B2, AE3007A1E,
AE3007A1/1, P&W 4158, RB211-
535E4-B (all TF), and CJ610-8ATJ (TJ)
Physical and chemical characterisation of PM;
PM mass, particle number concentrations and
size, BC, surface-bound PAHs; inorganic ions,
EC, OC, SVOCs, elements
As for APEX1‒3 campaigns LTO and others Kinsey et al. (2010, 2011)
Pratt &Whitney; PW three high-bypass
TF, representing two different
distinct engine model types
Total particulate mass, chemical composition
and size distributions of the emitted oil
Sampling: Particulate matter emitted from
the lubrication system overboard breather
vent with a self-designed collecting and
diluting apparatus. Experimental: C-TOF
AMS, TEOM, engine exhaust particle sizer,
CPC and ultra high sensitivity aerosol
spectrometer
Cycles from idle to 65e70%
thrust
Yu et al. (2010)
(continued on next page)
M.Masio
l,R.M
.Harriso
n/Atm
ospheric
Enviro
nmen
t95(2014
)409e455
425
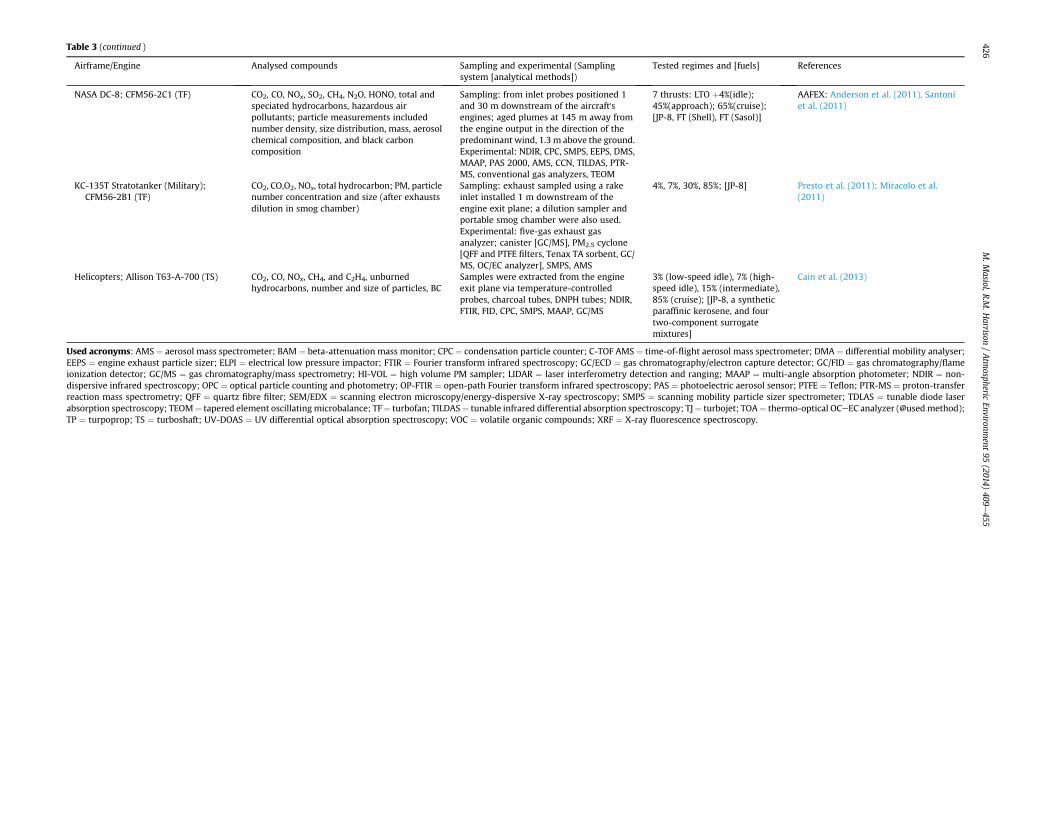
Table 3 (continued )
Airframe/Engine Analysed compounds Sampling and experimental (Sampling
system [analytical methods])
Tested regimes and [fuels] References
NASA DC-8; CFM56-2C1 (TF) CO2, CO, NOx, SO2, CH4, N2O, HONO, total and
speciated hydrocarbons, hazardous air
pollutants; particle measurements included
number density, size distribution, mass, aerosol
chemical composition, and black carbon
composition
Sampling: from inlet probes positioned 1
and 30 m downstream of the aircraft's
engines; aged plumes at 145 m away from
the engine output in the direction of the
predominant wind, 1.3 m above the ground.
Experimental: NDIR, CPC, SMPS, EEPS, DMS,
MAAP, PAS 2000, AMS, CCN, TILDAS, PTR-
MS, conventional gas analyzers, TEOM
7 thrusts: LTO þ4%(idle);
45%(approach); 65%(cruise);
[JP-8, FT (Shell), FT (Sasol)]
AAFEX: Anderson et al. (2011), Santoni
et al. (2011)
KC-135T Stratotanker (Military);
CFM56-2B1 (TF)
CO2, CO,O2, NOx, total hydrocarbon; PM, particle
number concentration and size (after exhausts
dilution in smog chamber)
Sampling: exhaust sampled using a rake
inlet installed 1 m downstream of the
engine exit plane; a dilution sampler and
portable smog chamber were also used.
Experimental: five-gas exhaust gas
analyzer; canister [GC/MS], PM2.5 cyclone
[QFF and PTFE filters, Tenax TA sorbent, GC/
MS, OC/EC analyzer], SMPS, AMS
4%, 7%, 30%, 85%; [JP-8] Presto et al. (2011); Miracolo et al.
(2011)
Helicopters; Allison T63-A-700 (TS) CO2, CO, NOx, CH4, and C2H4, unburned
hydrocarbons, number and size of particles, BC
Samples were extracted from the engine
exit plane via temperature-controlled
probes, charcoal tubes, DNPH tubes; NDIR,
FTIR, FID, CPC, SMPS, MAAP, GC/MS
3% (low-speed idle), 7% (high-
speed idle), 15% (intermediate),
85% (cruise); [JP-8, a synthetic
paraffinic kerosene, and four
two-component surrogate
mixtures]
Cain et al. (2013)
Used acronyms: AMS ¼ aerosol mass spectrometer; BAM ¼ beta-attenuation mass monitor; CPC ¼ condensation particle counter; C-TOF AMS ¼ time-of-flight aerosol mass spectrometer; DMA ¼ differential mobility analyser;
EEPS ¼ engine exhaust particle sizer; ELPI ¼ electrical low pressure impactor; FTIR ¼ Fourier transform infrared spectroscopy; GC/ECD ¼ gas chromatography/electron capture detector; GC/FID ¼ gas chromatography/flame
ionization detector; GC/MS ¼ gas chromatography/mass spectrometry; HI-VOL ¼ high volume PM sampler; LIDAR ¼ laser interferometry detection and ranging; MAAP ¼ multi-angle absorption photometer; NDIR ¼ non-
dispersive infrared spectroscopy; OPC ¼ optical particle counting and photometry; OP-FTIR ¼ open-path Fourier transform infrared spectroscopy; PAS ¼ photoelectric aerosol sensor; PTFE ¼ Teflon; PTR-MS ¼ proton-transfer
reaction mass spectrometry; QFF ¼ quartz fibre filter; SEM/EDX ¼ scanning electron microscopy/energy-dispersive X-ray spectroscopy; SMPS ¼ scanning mobility particle sizer spectrometer; TDLAS ¼ tunable diode laser
absorption spectroscopy; TEOM¼ tapered element oscillatingmicrobalance; TF¼ turbofan; TILDAS¼ tunable infrared differential absorption spectroscopy; TJ¼ turbojet; TOA¼ thermo-optical OCeEC analyzer (@usedmethod);
TP ¼ turpoprop; TS ¼ turboshaft; UV-DOAS ¼ UV differential optical absorption spectroscopy; VOC ¼ volatile organic compounds; XRF ¼ X-ray fluorescence spectroscopy.
M.Masio
l,R.M
.Harriso
n/Atm
ospheric
Enviro
nmen
t95(2014
)409e455
426
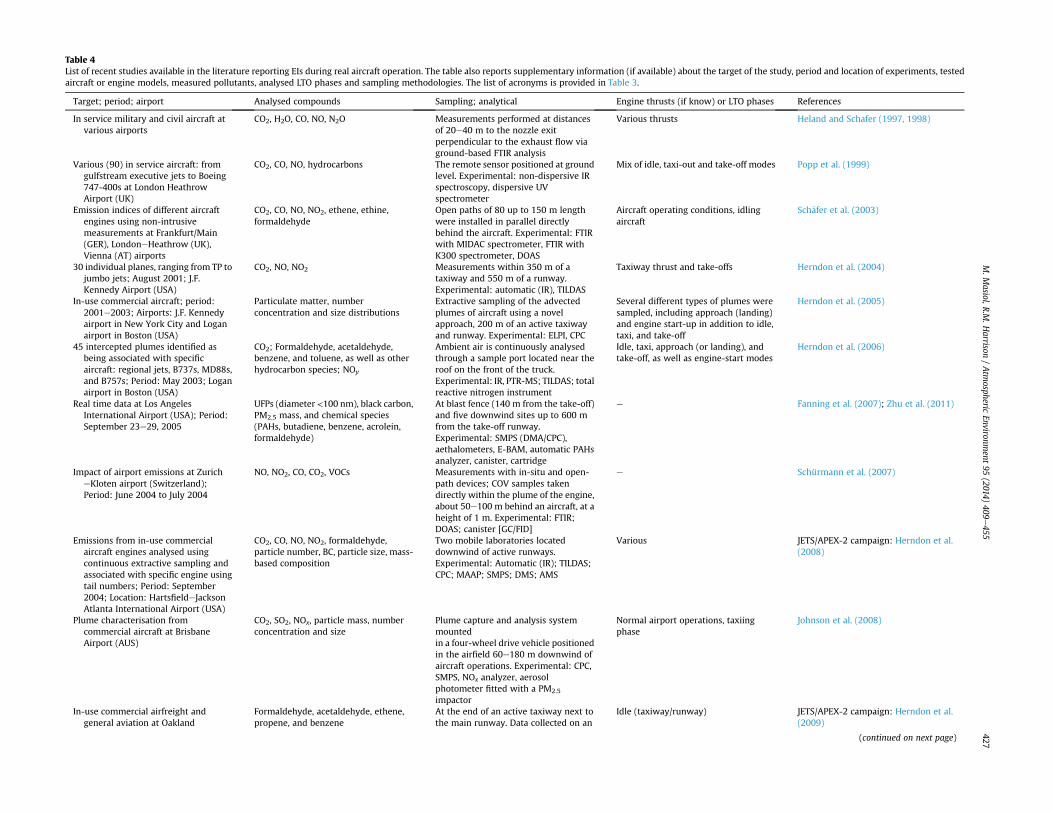
Table 4
List of recent studies available in the literature reporting EIs during real aircraft operation. The table also reports supplementary information (if available) about the target of the study, period and location of experiments, tested
aircraft or engine models, measured pollutants, analysed LTO phases and sampling methodologies. The list of acronyms is provided in Table 3.
Target; period; airport Analysed compounds Sampling; analytical Engine thrusts (if know) or LTO phases References
In service military and civil aircraft at
various airports
CO2, H2O, CO, NO, N2O Measurements performed at distances
of 20e40 m to the nozzle exit
perpendicular to the exhaust flow via
ground-based FTIR analysis
Various thrusts Heland and Schafer (1997, 1998)
Various (90) in service aircraft: from
gulfstream executive jets to Boeing
747-400s at London Heathrow
Airport (UK)
CO2, CO, NO, hydrocarbons The remote sensor positioned at ground
level. Experimental: non-dispersive IR
spectroscopy, dispersive UV
spectrometer
Mix of idle, taxi-out and take-off modes Popp et al. (1999)
Emission indices of different aircraft
engines using non-intrusive
measurements at Frankfurt/Main
(GER), LondoneHeathrow (UK),
Vienna (AT) airports
CO2, CO, NO, NO2, ethene, ethine,
formaldehyde
Open paths of 80 up to 150 m length
were installed in parallel directly
behind the aircraft. Experimental: FTIR
with MIDAC spectrometer, FTIR with
K300 spectrometer, DOAS
Aircraft operating conditions, idling
aircraft
Sch€afer et al. (2003)
30 individual planes, ranging from TP to
jumbo jets; August 2001; J.F.
Kennedy Airport (USA)
CO2, NO, NO2 Measurements within 350 m of a
taxiway and 550 m of a runway.
Experimental: automatic (IR), TILDAS
Taxiway thrust and take-offs Herndon et al. (2004)
In-use commercial aircraft; period:
2001e2003; Airports: J.F. Kennedy
airport in New York City and Logan
airport in Boston (USA)
Particulate matter, number
concentration and size distributions
Extractive sampling of the advected
plumes of aircraft using a novel
approach, 200 m of an active taxiway
and runway. Experimental: ELPI, CPC
Several different types of plumes were
sampled, including approach (landing)
and engine start-up in addition to idle,
taxi, and take-off
Herndon et al. (2005)
45 intercepted plumes identified as
being associated with specific
aircraft: regional jets, B737s, MD88s,
and B757s; Period: May 2003; Logan
airport in Boston (USA)
CO2; Formaldehyde, acetaldehyde,
benzene, and toluene, as well as other
hydrocarbon species; NOy
Ambient air is continuously analysed
through a sample port located near the
roof on the front of the truck.
Experimental: IR, PTR-MS; TILDAS; total
reactive nitrogen instrument
Idle, taxi, approach (or landing), and
take-off, as well as engine-start modes
Herndon et al. (2006)
Real time data at Los Angeles
International Airport (USA); Period:
September 23e29, 2005
UFPs (diameter <100 nm), black carbon,
PM2.5 mass, and chemical species
(PAHs, butadiene, benzene, acrolein,
formaldehyde)
At blast fence (140 m from the take-off)
and five downwind sites up to 600 m
from the take-off runway.
Experimental: SMPS (DMA/CPC),
aethalometers, E-BAM, automatic PAHs
analyzer, canister, cartridge
e Fanning et al. (2007); Zhu et al. (2011)
Impact of airport emissions at Zurich
eKloten airport (Switzerland);
Period: June 2004 to July 2004
NO, NO2, CO, CO2, VOCs Measurements with in-situ and open-
path devices; COV samples taken
directly within the plume of the engine,
about 50e100 m behind an aircraft, at a
height of 1 m. Experimental: FTIR;
DOAS; canister [GC/FID]
e Schürmann et al. (2007)
Emissions from in-use commercial
aircraft engines analysed using
continuous extractive sampling and
associated with specific engine using
tail numbers; Period: September
2004; Location: HartsfieldeJackson
Atlanta International Airport (USA)
CO2, CO, NO, NO2, formaldehyde,
particle number, BC, particle size, mass-
based composition
Two mobile laboratories located
downwind of active runways.
Experimental: Automatic (IR); TILDAS;
CPC; MAAP; SMPS; DMS; AMS
Various JETS/APEX-2 campaign: Herndon et al.
(2008)
Plume characterisation from
commercial aircraft at Brisbane
Airport (AUS)
CO2, SO2, NOx, particle mass, number
concentration and size
Plume capture and analysis system
mounted
in a four-wheel drive vehicle positioned
in the airfield 60e180 m downwind of
aircraft operations. Experimental: CPC,
SMPS, NOx analyzer, aerosol
photometer fitted with a PM2.5
impactor
Normal airport operations, taxiing
phase
Johnson et al. (2008)
In-use commercial airfreight and
general aviation at Oakland
Formaldehyde, acetaldehyde, ethene,
propene, and benzene
At the end of an active taxiway next to
the main runway. Data collected on an
Idle (taxiway/runway) JETS/APEX-2 campaign: Herndon et al.
(2009)
(continued on next page)
M.Masio
l,R.M
.Harriso
n/Atm
ospheric
Enviro
nmen
t95(2014
)409e455
427
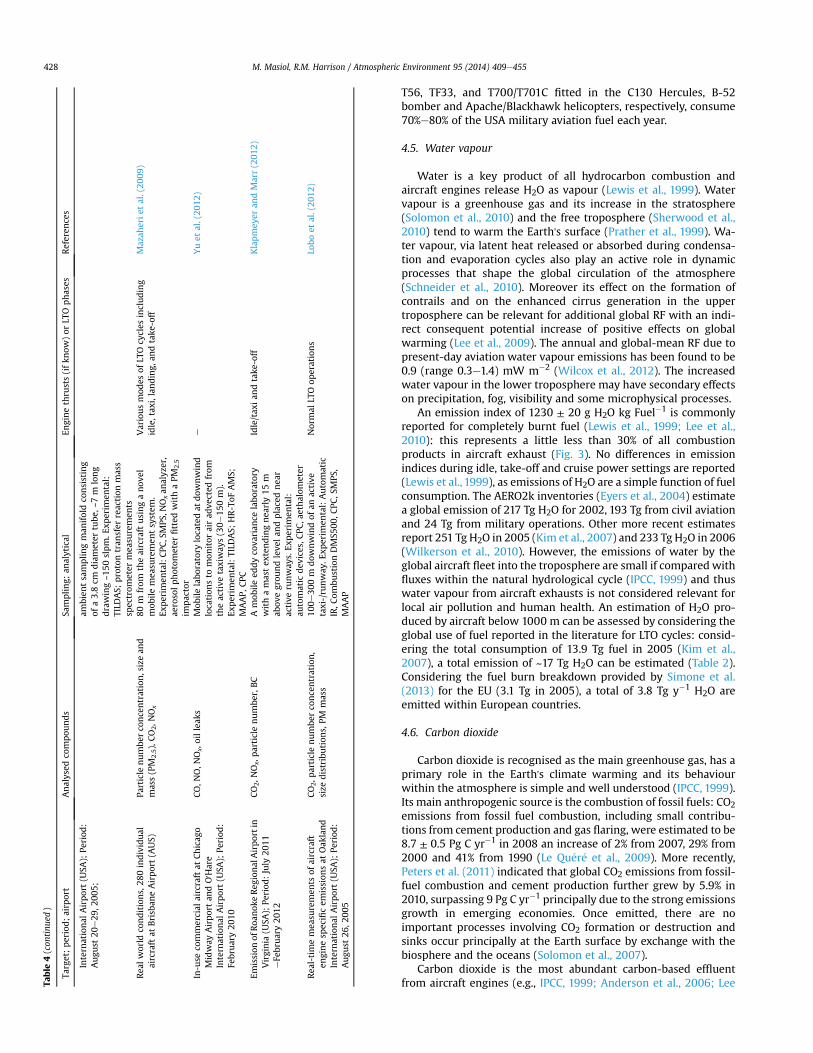
T56, TF33, and T700/T701C fitted in the C130 Hercules, B-52
bomber and Apache/Blackhawk helicopters, respectively, consume
70%e80% of the USA military aviation fuel each year.
4.5. Water vapour
Water is a key product of all hydrocarbon combustion and
aircraft engines release H2O as vapour (Lewis et al., 1999). Water
vapour is a greenhouse gas and its increase in the stratosphere
(Solomon et al., 2010) and the free troposphere (Sherwood et al.,
2010) tend to warm the Earth's surface (Prather et al., 1999). Wa-
ter vapour, via latent heat released or absorbed during condensa-
tion and evaporation cycles also play an active role in dynamic
processes that shape the global circulation of the atmosphere
(Schneider et al., 2010). Moreover its effect on the formation of
contrails and on the enhanced cirrus generation in the upper
troposphere can be relevant for additional global RF with an indi-
rect consequent potential increase of positive effects on global
warming (Lee et al., 2009). The annual and global-mean RF due to
present-day aviation water vapour emissions has been found to be
0.9 (range 0.3e1.4) mW m#2 (Wilcox et al., 2012). The increased
water vapour in the lower troposphere may have secondary effects
on precipitation, fog, visibility and some microphysical processes.
An emission index of 1230 ± 20 g H2O kg Fuel#1 is commonly
reported for completely burnt fuel (Lewis et al., 1999; Lee et al.,
2010): this represents a little less than 30% of all combustion
products in aircraft exhaust (Fig. 3). No differences in emission
indices during idle, take-off and cruise power settings are reported
(Lewis et al., 1999), as emissions of H2O are a simple function of fuel
consumption. The AERO2k inventories (Eyers et al., 2004) estimate
a global emission of 217 Tg H2O for 2002, 193 Tg from civil aviation
and 24 Tg from military operations. Other more recent estimates
report 251 Tg H2O in 2005 (Kim et al., 2007) and 233 Tg H2O in 2006
(Wilkerson et al., 2010). However, the emissions of water by the
global aircraft fleet into the troposphere are small if compared with
fluxes within the natural hydrological cycle (IPCC, 1999) and thus
water vapour from aircraft exhausts is not considered relevant for
local air pollution and human health. An estimation of H2O pro-
duced by aircraft below 1000 m can be assessed by considering the
global use of fuel reported in the literature for LTO cycles: consid-
ering the total consumption of 13.9 Tg fuel in 2005 (Kim et al.,
2007), a total emission of ~17 Tg H2O can be estimated (Table 2).
Considering the fuel burn breakdown provided by Simone et al.
(2013) for the EU (3.1 Tg in 2005), a total of 3.8 Tg y#1 H2O are
emitted within European countries.
4.6. Carbon dioxide
Carbon dioxide is recognised as the main greenhouse gas, has a
primary role in the Earth's climate warming and its behaviour
within the atmosphere is simple and well understood (IPCC, 1999).
Its main anthropogenic source is the combustion of fossil fuels: CO2
emissions from fossil fuel combustion, including small contribu-
tions from cement production and gas flaring, were estimated to be
8.7 ± 0.5 Pg C yr#1 in 2008 an increase of 2% from 2007, 29% from
2000 and 41% from 1990 (Le Qu#er#e et al., 2009). More recently,
Peters et al. (2011) indicated that global CO2 emissions from fossil-
fuel combustion and cement production further grew by 5.9% in
2010, surpassing 9 Pg C yr#1 principally due to the strong emissions
growth in emerging economies. Once emitted, there are no
important processes involving CO2 formation or destruction and
sinks occur principally at the Earth surface by exchange with the
biosphere and the oceans (Solomon et al., 2007).
Carbon dioxide is the most abundant carbon-based effluent
from aircraft engines (e.g., IPCC, 1999; Anderson et al., 2006; LeeTable
4(continued
)
Target;
period;airport
Analysedco
mpounds
Sampling;analytical
Enginethrusts(ifknow)orLTO
phases
References
Intern
ationalAirport
(USA);
Period:
August
20e29,2005;
ambientsamplingmanifold
consisting
ofa3.8
cmdiametertube,~7m
long
drawing~150slpm.Experimental:
TILDAS;protontransferreactionmass
spectrometermeasu
rements
Realworldco
nditions,280individual
aircraftatBrisb
aneAirport
(AUS)
Particle
numberco
ncentration,sizeand
mass
(PM
2.5),CO2,NOx
80m
from
theaircraftusinganovel
mobilemeasu
rementsystem.
Experimental:CPC,SMPS,N
Oxanalyzer,
aerosolphotometerfittedwithaPM
2.5
impactor
VariousmodesofLTO
cyclesincluding
idle,taxi,landing,andtake-off
Mazaherietal.(2009)
In-use
commercialaircraftatChicago
MidwayAirport
andO'Hare
Intern
ationalAirport
(USA);
Period:
February
2010
CO,NO,NOx,oilleaks
Mobilelaboratory
locatedatdownwind
locationsto
monitorairadvectedfrom
theactivetaxiw
ays(30#150m).
Experimental:TILDAS;HR-ToFAMS;
MAAP,CPC
eYuetal.(2012)
EmissionofRoanokeRegionalAirportin
Virginia
(USA);
Period:July
2011
eFebruary
2012
CO2,NOx,particle
number,BC
Amobileeddyco
variance
laboratory
withamast
extendingnearly15m
abovegroundlevelandplacednear
activerunways.Experimental:
automaticdevices,CPC,aethalometer
Idle/taxiandtake-off
KlapmeyerandMarr
(2012)
Real-timemeasu
rements
ofaircraft
enginesp
ecificemissionsatOakland
Intern
ationalAirport
(USA);
Period:
August
26,2005
CO2,particle
numberco
ncentration,
sizedistributions,PM
mass
100e300m
downwindofanactive
taxi-/runway.Experimental:Automatic
IR,CombustionDMS500,CPC,SMPS,
MAAP
Norm
alLTO
operations
Loboetal.(2012)
M. Masiol, R.M. Harrison / Atmospheric Environment 95 (2014) 409e455428
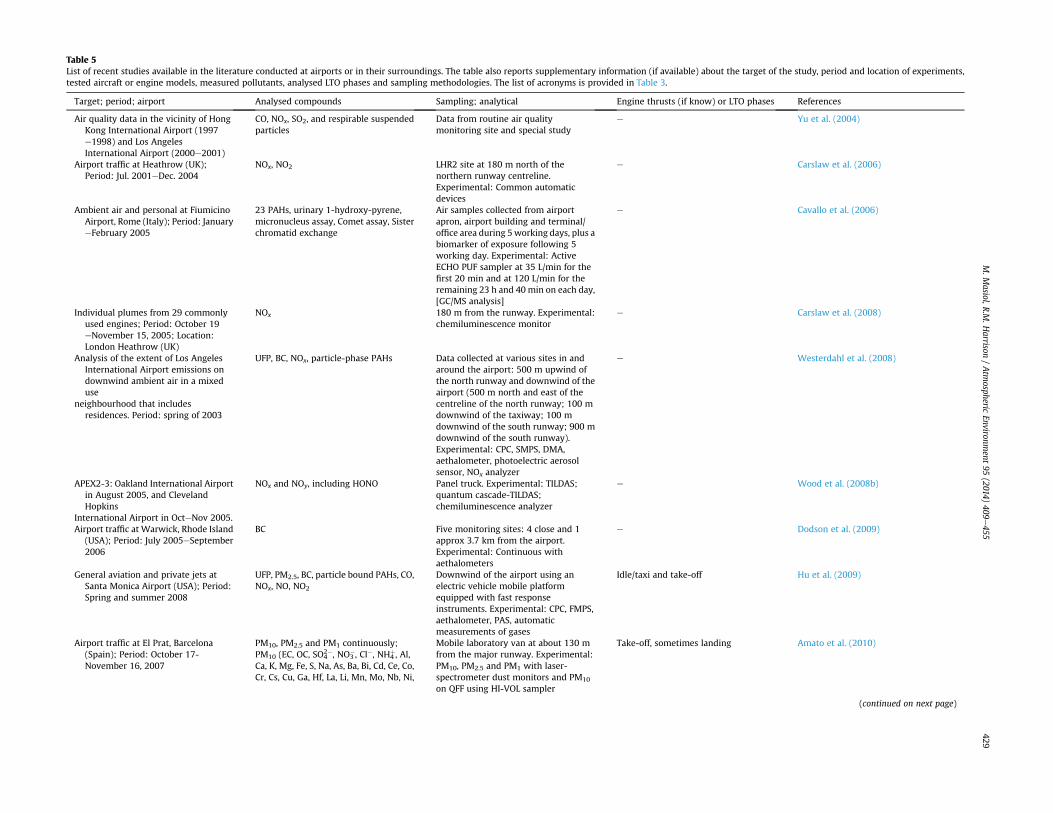
Table 5
List of recent studies available in the literature conducted at airports or in their surroundings. The table also reports supplementary information (if available) about the target of the study, period and location of experiments,
tested aircraft or engine models, measured pollutants, analysed LTO phases and sampling methodologies. The list of acronyms is provided in Table 3.
Target; period; airport Analysed compounds Sampling; analytical Engine thrusts (if know) or LTO phases References
Air quality data in the vicinity of Hong
Kong International Airport (1997
e1998) and Los Angeles
International Airport (2000e2001)
CO, NOx, SO2, and respirable suspended
particles
Data from routine air quality
monitoring site and special study
e Yu et al. (2004)
Airport traffic at Heathrow (UK);
Period: Jul. 2001eDec. 2004
NOx, NO2 LHR2 site at 180 m north of the
northern runway centreline.
Experimental: Common automatic
devices
e Carslaw et al. (2006)
Ambient air and personal at Fiumicino
Airport, Rome (Italy); Period: January
eFebruary 2005
23 PAHs, urinary 1-hydroxy-pyrene,
micronucleus assay, Comet assay, Sister
chromatid exchange
Air samples collected from airport
apron, airport building and terminal/
office area during 5working days, plus a
biomarker of exposure following 5
working day. Experimental: Active
ECHO PUF sampler at 35 L/min for the
first 20 min and at 120 L/min for the
remaining 23 h and 40 min on each day,
[GC/MS analysis]
e Cavallo et al. (2006)
Individual plumes from 29 commonly
used engines; Period: October 19
eNovember 15, 2005; Location:
London Heathrow (UK)
NOx 180 m from the runway. Experimental:
chemiluminescence monitor
e Carslaw et al. (2008)
Analysis of the extent of Los Angeles
International Airport emissions on
downwind ambient air in a mixed
use
neighbourhood that includes
residences. Period: spring of 2003
UFP, BC, NOx, particle-phase PAHs Data collected at various sites in and
around the airport: 500 m upwind of
the north runway and downwind of the
airport (500 m north and east of the
centreline of the north runway; 100 m
downwind of the taxiway; 100 m
downwind of the south runway; 900 m
downwind of the south runway).
Experimental: CPC, SMPS, DMA,
aethalometer, photoelectric aerosol
sensor, NOx analyzer
e Westerdahl et al. (2008)
APEX2-3: Oakland International Airport
in August 2005, and Cleveland
Hopkins
International Airport in OcteNov 2005.
NOx and NOy, including HONO Panel truck. Experimental: TILDAS;
quantum cascade-TILDAS;
chemiluminescence analyzer
e Wood et al. (2008b)
Airport traffic at Warwick, Rhode Island
(USA); Period: July 2005eSeptember
2006
BC Five monitoring sites: 4 close and 1
approx 3.7 km from the airport.
Experimental: Continuous with
aethalometers
e Dodson et al. (2009)
General aviation and private jets at
Santa Monica Airport (USA); Period:
Spring and summer 2008
UFP, PM2.5, BC, particle bound PAHs, CO,
NOx, NO, NO2
Downwind of the airport using an
electric vehicle mobile platform
equipped with fast response
instruments. Experimental: CPC, FMPS,
aethalometer, PAS, automatic
measurements of gases
Idle/taxi and take-off Hu et al. (2009)
Airport traffic at El Prat, Barcelona
(Spain); Period: October 17-
November 16, 2007
PM10, PM2.5 and PM1 continuously;
PM10 (EC, OC, SO42#, NO3
#, Cl#, NH4þ, Al,
Ca, K, Mg, Fe, S, Na, As, Ba, Bi, Cd, Ce, Co,
Cr, Cs, Cu, Ga, Hf, La, Li, Mn, Mo, Nb, Ni,
Mobile laboratory van at about 130 m
from the major runway. Experimental:
PM10, PM2.5 and PM1 with laser-
spectrometer dust monitors and PM10
on QFF using HI-VOL sampler
Take-off, sometimes landing Amato et al. (2010)
(continued on next page)
M.Masio
l,R.M
.Harriso
n/Atm
ospheric
Enviro
nmen
t95(2014
)409e455
429
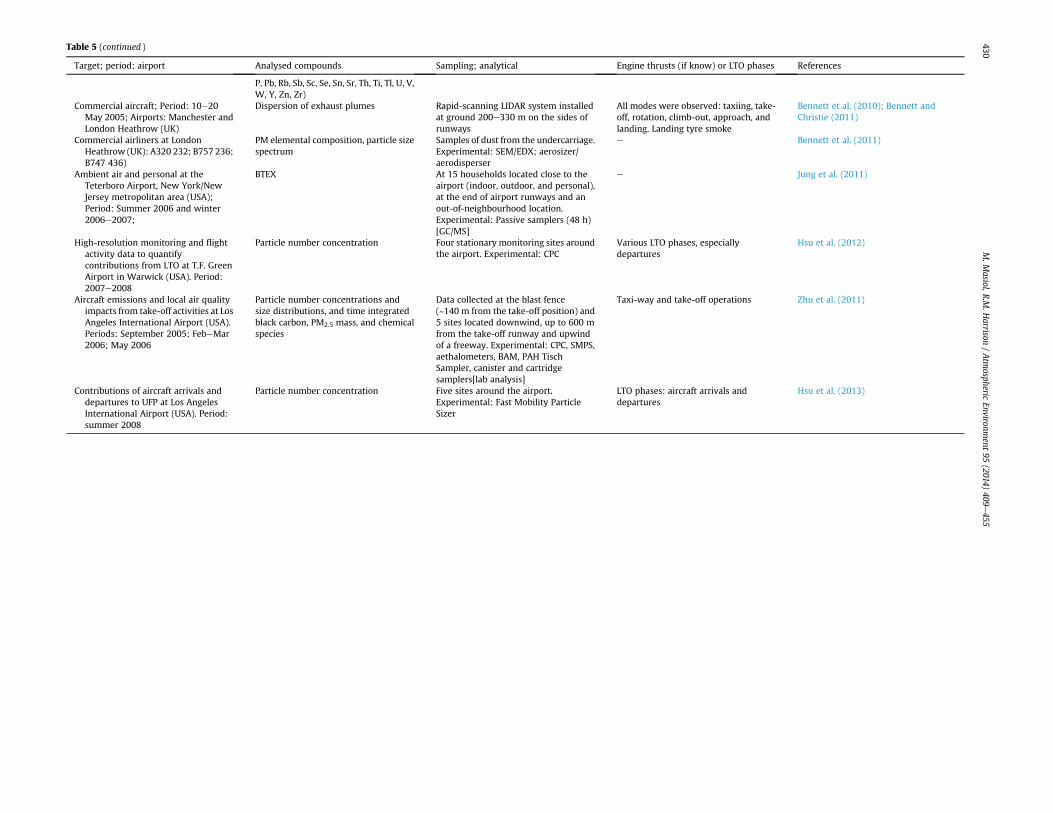
Table 5 (continued )
Target; period; airport Analysed compounds Sampling; analytical Engine thrusts (if know) or LTO phases References
P, Pb, Rb, Sb, Sc, Se, Sn, Sr, Th, Ti, Tl, U, V,
W, Y, Zn, Zr)
Commercial aircraft; Period: 10e20
May 2005; Airports: Manchester and
London Heathrow (UK)
Dispersion of exhaust plumes Rapid-scanning LIDAR system installed
at ground 200e330 m on the sides of
runways
All modes were observed: taxiing, take-
off, rotation, climb-out, approach, and
landing. Landing tyre smoke
Bennett et al. (2010); Bennett and
Christie (2011)
Commercial airliners at London
Heathrow (UK): A320 232; B757 236;
B747 436)
PM elemental composition, particle size
spectrum
Samples of dust from the undercarriage.
Experimental: SEM/EDX; aerosizer/
aerodisperser
e Bennett et al. (2011)
Ambient air and personal at the
Teterboro Airport, New York/New
Jersey metropolitan area (USA);
Period: Summer 2006 and winter
2006e2007;
BTEX At 15 households located close to the
airport (indoor, outdoor, and personal),
at the end of airport runways and an
out-of-neighbourhood location.
Experimental: Passive samplers (48 h)
[GC/MS]
e Jung et al. (2011)
High-resolution monitoring and flight
activity data to quantify
contributions from LTO at T.F. Green
Airport in Warwick (USA). Period:
2007e2008
Particle number concentration Four stationary monitoring sites around
the airport. Experimental: CPC
Various LTO phases, especially
departures
Hsu et al. (2012)
Aircraft emissions and local air quality
impacts from take-off activities at Los
Angeles International Airport (USA).
Periods: September 2005; FebeMar
2006; May 2006
Particle number concentrations and
size distributions, and time integrated
black carbon, PM2.5 mass, and chemical
species
Data collected at the blast fence
(~140 m from the take-off position) and
5 sites located downwind, up to 600 m
from the take-off runway and upwind
of a freeway. Experimental: CPC, SMPS,
aethalometers, BAM, PAH Tisch
Sampler, canister and cartridge
samplers[lab analysis]
Taxi-way and take-off operations Zhu et al. (2011)
Contributions of aircraft arrivals and
departures to UFP at Los Angeles
International Airport (USA). Period:
summer 2008
Particle number concentration Five sites around the airport.
Experimental: Fast Mobility Particle
Sizer
LTO phases: aircraft arrivals and
departures
Hsu et al. (2013)
M.Masio
l,R.M
.Harriso
n/Atm
ospheric
Enviro
nmen
t95(2014
)409e455
430
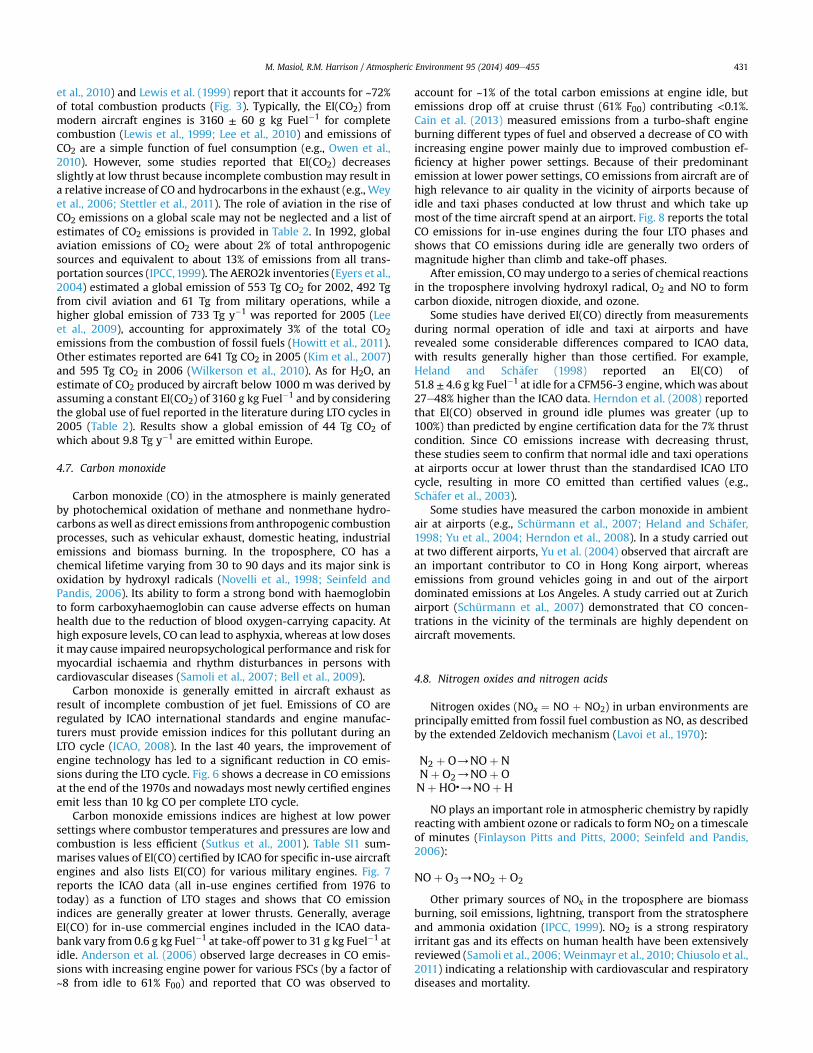
et al., 2010) and Lewis et al. (1999) report that it accounts for ~72%
of total combustion products (Fig. 3). Typically, the EI(CO2) from
modern aircraft engines is 3160 ± 60 g kg Fuel#1 for complete
combustion (Lewis et al., 1999; Lee et al., 2010) and emissions of
CO2 are a simple function of fuel consumption (e.g., Owen et al.,
2010). However, some studies reported that EI(CO2) decreases
slightly at low thrust because incomplete combustion may result in
a relative increase of CO and hydrocarbons in the exhaust (e.g., Wey
et al., 2006; Stettler et al., 2011). The role of aviation in the rise of
CO2 emissions on a global scale may not be neglected and a list of
estimates of CO2 emissions is provided in Table 2. In 1992, global
aviation emissions of CO2 were about 2% of total anthropogenic
sources and equivalent to about 13% of emissions from all trans-
portation sources (IPCC,1999). The AERO2k inventories (Eyers et al.,
2004) estimated a global emission of 553 Tg CO2 for 2002, 492 Tg
from civil aviation and 61 Tg from military operations, while a
higher global emission of 733 Tg y#1 was reported for 2005 (Lee
et al., 2009), accounting for approximately 3% of the total CO2
emissions from the combustion of fossil fuels (Howitt et al., 2011).
Other estimates reported are 641 Tg CO2 in 2005 (Kim et al., 2007)
and 595 Tg CO2 in 2006 (Wilkerson et al., 2010). As for H2O, an
estimate of CO2 produced by aircraft below 1000 mwas derived by
assuming a constant EI(CO2) of 3160 g kg Fuel#1 and by considering
the global use of fuel reported in the literature during LTO cycles in
2005 (Table 2). Results show a global emission of 44 Tg CO2 of
which about 9.8 Tg y#1 are emitted within Europe.
4.7. Carbon monoxide
Carbon monoxide (CO) in the atmosphere is mainly generated
by photochemical oxidation of methane and nonmethane hydro-
carbons aswell as direct emissions from anthropogenic combustion
processes, such as vehicular exhaust, domestic heating, industrial
emissions and biomass burning. In the troposphere, CO has a
chemical lifetime varying from 30 to 90 days and its major sink is
oxidation by hydroxyl radicals (Novelli et al., 1998; Seinfeld and
Pandis, 2006). Its ability to form a strong bond with haemoglobin
to form carboxyhaemoglobin can cause adverse effects on human
health due to the reduction of blood oxygen-carrying capacity. At
high exposure levels, CO can lead to asphyxia, whereas at low doses
it may cause impaired neuropsychological performance and risk for
myocardial ischaemia and rhythm disturbances in persons with
cardiovascular diseases (Samoli et al., 2007; Bell et al., 2009).
Carbon monoxide is generally emitted in aircraft exhaust as
result of incomplete combustion of jet fuel. Emissions of CO are
regulated by ICAO international standards and engine manufac-
turers must provide emission indices for this pollutant during an
LTO cycle (ICAO, 2008). In the last 40 years, the improvement of
engine technology has led to a significant reduction in CO emis-
sions during the LTO cycle. Fig. 6 shows a decrease in CO emissions
at the end of the 1970s and nowadays most newly certified engines
emit less than 10 kg CO per complete LTO cycle.
Carbon monoxide emissions indices are highest at low power
settings where combustor temperatures and pressures are low and
combustion is less efficient (Sutkus et al., 2001). Table SI1 sum-
marises values of EI(CO) certified by ICAO for specific in-use aircraft
engines and also lists EI(CO) for various military engines. Fig. 7
reports the ICAO data (all in-use engines certified from 1976 to
today) as a function of LTO stages and shows that CO emission
indices are generally greater at lower thrusts. Generally, average
EI(CO) for in-use commercial engines included in the ICAO data-
bank vary from 0.6 g kg Fuel#1 at take-off power to 31 g kg Fuel#1 at
idle. Anderson et al. (2006) observed large decreases in CO emis-
sions with increasing engine power for various FSCs (by a factor of
~8 from idle to 61% F00) and reported that CO was observed to
account for ~1% of the total carbon emissions at engine idle, but
emissions drop off at cruise thrust (61% F00) contributing <0.1%.
Cain et al. (2013) measured emissions from a turbo-shaft engine
burning different types of fuel and observed a decrease of CO with
increasing engine power mainly due to improved combustion ef-
ficiency at higher power settings. Because of their predominant
emission at lower power settings, CO emissions from aircraft are of
high relevance to air quality in the vicinity of airports because of
idle and taxi phases conducted at low thrust and which take up
most of the time aircraft spend at an airport. Fig. 8 reports the total
CO emissions for in-use engines during the four LTO phases and
shows that CO emissions during idle are generally two orders of
magnitude higher than climb and take-off phases.
After emission, COmay undergo to a series of chemical reactions
in the troposphere involving hydroxyl radical, O2 and NO to form
carbon dioxide, nitrogen dioxide, and ozone.
Some studies have derived EI(CO) directly from measurements
during normal operation of idle and taxi at airports and have
revealed some considerable differences compared to ICAO data,
with results generally higher than those certified. For example,
Heland and Sch€afer (1998) reported an EI(CO) of
51.8 ± 4.6 g kg Fuel#1 at idle for a CFM56-3 engine, which was about
27e48% higher than the ICAO data. Herndon et al. (2008) reported
that EI(CO) observed in ground idle plumes was greater (up to
100%) than predicted by engine certification data for the 7% thrust
condition. Since CO emissions increase with decreasing thrust,
these studies seem to confirm that normal idle and taxi operations
at airports occur at lower thrust than the standardised ICAO LTO
cycle, resulting in more CO emitted than certified values (e.g.,
Sch€afer et al., 2003).
Some studies have measured the carbon monoxide in ambient
air at airports (e.g., Schürmann et al., 2007; Heland and Sch€afer,
1998; Yu et al., 2004; Herndon et al., 2008). In a study carried out
at two different airports, Yu et al. (2004) observed that aircraft are
an important contributor to CO in Hong Kong airport, whereas
emissions from ground vehicles going in and out of the airport
dominated emissions at Los Angeles. A study carried out at Zurich
airport (Schürmann et al., 2007) demonstrated that CO concen-
trations in the vicinity of the terminals are highly dependent on
aircraft movements.
4.8. Nitrogen oxides and nitrogen acids
Nitrogen oxides (NOx ¼ NO þ NO2) in urban environments are
principally emitted from fossil fuel combustion as NO, as described
by the extended Zeldovich mechanism (Lavoi et al., 1970):
N2 þ O/NOþ NNþ O2/NOþ ONþ HO!
/NOþ H
NO plays an important role in atmospheric chemistry by rapidly
reacting with ambient ozone or radicals to form NO2 on a timescale
of minutes (Finlayson Pitts and Pitts, 2000; Seinfeld and Pandis,
2006):
NOþ O3/NO2 þ O2
Other primary sources of NOx in the troposphere are biomass
burning, soil emissions, lightning, transport from the stratosphere
and ammonia oxidation (IPCC, 1999). NO2 is a strong respiratory
irritant gas and its effects on human health have been extensively
reviewed (Samoli et al., 2006;Weinmayr et al., 2010; Chiusolo et al.,
2011) indicating a relationship with cardiovascular and respiratory
diseases and mortality.
M. Masiol, R.M. Harrison / Atmospheric Environment 95 (2014) 409e455 431
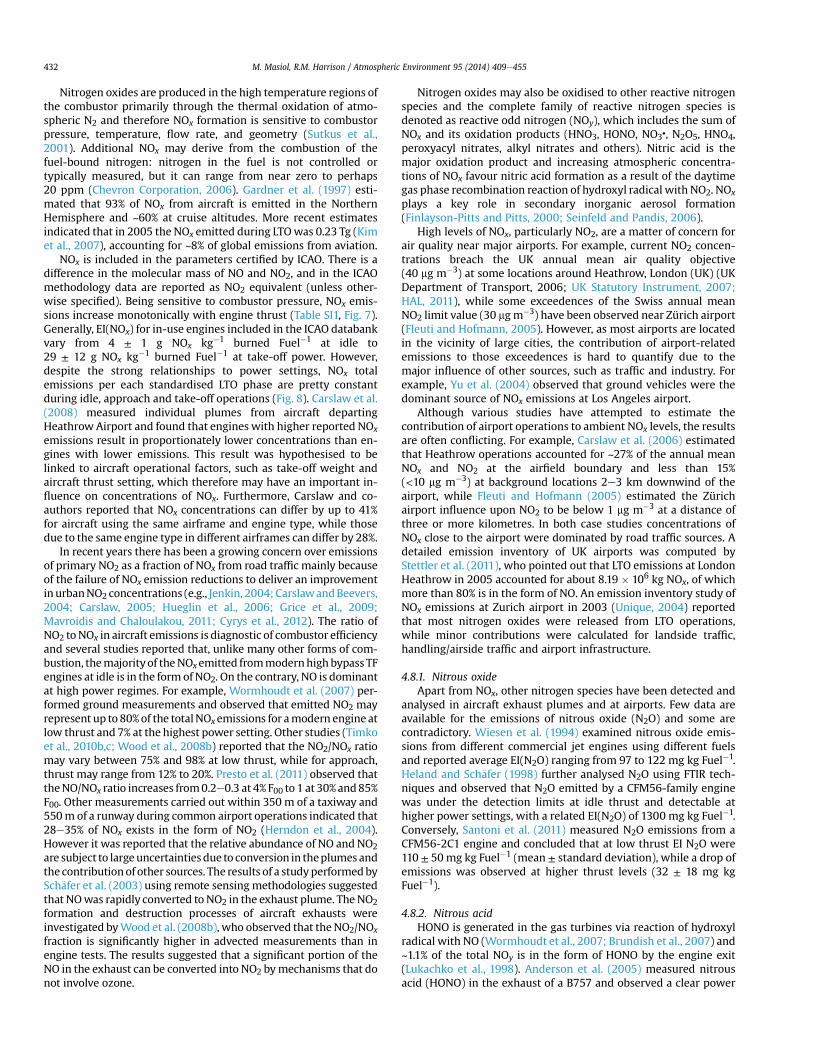
Nitrogen oxides are produced in the high temperature regions of
the combustor primarily through the thermal oxidation of atmo-
spheric N2 and therefore NOx formation is sensitive to combustor
pressure, temperature, flow rate, and geometry (Sutkus et al.,
2001). Additional NOx may derive from the combustion of the
fuel-bound nitrogen: nitrogen in the fuel is not controlled or
typically measured, but it can range from near zero to perhaps
20 ppm (Chevron Corporation, 2006). Gardner et al. (1997) esti-
mated that 93% of NOx from aircraft is emitted in the Northern
Hemisphere and ~60% at cruise altitudes. More recent estimates
indicated that in 2005 the NOx emitted during LTOwas 0.23 Tg (Kim
et al., 2007), accounting for ~8% of global emissions from aviation.
NOx is included in the parameters certified by ICAO. There is a
difference in the molecular mass of NO and NO2, and in the ICAO
methodology data are reported as NO2 equivalent (unless other-
wise specified). Being sensitive to combustor pressure, NOx emis-
sions increase monotonically with engine thrust (Table SI1, Fig. 7).
Generally, EI(NOx) for in-use engines included in the ICAO databank
vary from 4 ± 1 g NOx kg#1 burned Fuel#1 at idle to
29 ± 12 g NOx kg#1 burned Fuel#1 at take-off power. However,
despite the strong relationships to power settings, NOx total
emissions per each standardised LTO phase are pretty constant
during idle, approach and take-off operations (Fig. 8). Carslaw et al.
(2008) measured individual plumes from aircraft departing
Heathrow Airport and found that engines with higher reported NOx
emissions result in proportionately lower concentrations than en-
gines with lower emissions. This result was hypothesised to be
linked to aircraft operational factors, such as take-off weight and
aircraft thrust setting, which therefore may have an important in-
fluence on concentrations of NOx. Furthermore, Carslaw and co-
authors reported that NOx concentrations can differ by up to 41%
for aircraft using the same airframe and engine type, while those
due to the same engine type in different airframes can differ by 28%.
In recent years there has been a growing concern over emissions
of primary NO2 as a fraction of NOx from road traffic mainly because
of the failure of NOx emission reductions to deliver an improvement
inurbanNO2 concentrations (e.g., Jenkin, 2004; CarslawandBeevers,
2004; Carslaw, 2005; Hueglin et al., 2006; Grice et al., 2009;
Mavroidis and Chaloulakou, 2011; Cyrys et al., 2012). The ratio of
NO2 to NOx in aircraft emissions is diagnostic of combustor efficiency
and several studies reported that, unlike many other forms of com-
bustion, themajorityof theNOxemitted frommodernhigh bypass TF
engines at idle is in the form of NO2. On the contrary, NO is dominant
at high power regimes. For example, Wormhoudt et al. (2007) per-
formed ground measurements and observed that emitted NO2 may
represent up to 80%of the totalNOxemissions for amodern engine at
low thrust and 7% at the highest power setting. Other studies (Timko
et al., 2010b,c; Wood et al., 2008b) reported that the NO2/NOx ratio
may vary between 75% and 98% at low thrust, while for approach,
thrust may range from 12% to 20%. Presto et al. (2011) observed that
theNO/NOx ratio increases from0.2e0.3 at 4% F00 to 1 at 30% and85%
F00. Other measurements carried out within 350 m of a taxiway and
550m of a runway during common airport operations indicated that
28e35% of NOx exists in the form of NO2 (Herndon et al., 2004).
However it was reported that the relative abundance of NO and NO2
are subject to largeuncertaintiesdue to conversion in theplumes and
the contributionof other sources. The results of a studyperformedby
Sch€afer et al. (2003) using remote sensing methodologies suggested
that NOwas rapidly converted to NO2 in the exhaust plume. The NO2
formation and destruction processes of aircraft exhausts were
investigated byWood et al. (2008b), who observed that theNO2/NOx
fraction is significantly higher in advected measurements than in
engine tests. The results suggested that a significant portion of the
NO in the exhaust can be converted into NO2 bymechanisms that do
not involve ozone.
Nitrogen oxides may also be oxidised to other reactive nitrogen
species and the complete family of reactive nitrogen species is
denoted as reactive odd nitrogen (NOy), which includes the sum of
NOx and its oxidation products (HNO3, HONO, NO3!, N2O5, HNO4,
peroxyacyl nitrates, alkyl nitrates and others). Nitric acid is the
major oxidation product and increasing atmospheric concentra-
tions of NOx favour nitric acid formation as a result of the daytime
gas phase recombination reaction of hydroxyl radical with NO2. NOx
plays a key role in secondary inorganic aerosol formation
(Finlayson-Pitts and Pitts, 2000; Seinfeld and Pandis, 2006).
High levels of NOx, particularly NO2, are a matter of concern for
air quality near major airports. For example, current NO2 concen-
trations breach the UK annual mean air quality objective
(40 mg m#3) at some locations around Heathrow, London (UK) (UK
Department of Transport, 2006; UK Statutory Instrument, 2007;
HAL, 2011), while some exceedences of the Swiss annual mean
NO2 limit value (30 mgm#3) have been observed near Zürich airport
(Fleuti and Hofmann, 2005). However, as most airports are located
in the vicinity of large cities, the contribution of airport-related
emissions to those exceedences is hard to quantify due to the
major influence of other sources, such as traffic and industry. For
example, Yu et al. (2004) observed that ground vehicles were the
dominant source of NOx emissions at Los Angeles airport.
Although various studies have attempted to estimate the
contribution of airport operations to ambient NOx levels, the results
are often conflicting. For example, Carslaw et al. (2006) estimated
that Heathrow operations accounted for ~27% of the annual mean
NOx and NO2 at the airfield boundary and less than 15%
(<10 mg m#3) at background locations 2e3 km downwind of the
airport, while Fleuti and Hofmann (2005) estimated the Zürich
airport influence upon NO2 to be below 1 mg m#3 at a distance of
three or more kilometres. In both case studies concentrations of
NOx close to the airport were dominated by road traffic sources. A
detailed emission inventory of UK airports was computed by
Stettler et al. (2011), who pointed out that LTO emissions at London
Heathrow in 2005 accounted for about 8.19 ) 106 kg NOx, of which
more than 80% is in the form of NO. An emission inventory study of
NOx emissions at Zurich airport in 2003 (Unique, 2004) reported
that most nitrogen oxides were released from LTO operations,
while minor contributions were calculated for landside traffic,
handling/airside traffic and airport infrastructure.
4.8.1. Nitrous oxide
Apart from NOx, other nitrogen species have been detected and
analysed in aircraft exhaust plumes and at airports. Few data are
available for the emissions of nitrous oxide (N2O) and some are
contradictory. Wiesen et al. (1994) examined nitrous oxide emis-
sions from different commercial jet engines using different fuels
and reported average EI(N2O) ranging from 97 to 122 mg kg Fuel#1.
Heland and Sch€afer (1998) further analysed N2O using FTIR tech-
niques and observed that N2O emitted by a CFM56-family engine
was under the detection limits at idle thrust and detectable at
higher power settings, with a related EI(N2O) of 1300 mg kg Fuel#1.
Conversely, Santoni et al. (2011) measured N2O emissions from a
CFM56-2C1 engine and concluded that at low thrust EI N2O were
110 ± 50 mg kg Fuel#1 (mean ± standard deviation), while a drop of
emissions was observed at higher thrust levels (32 ± 18 mg kg
Fuel#1).
4.8.2. Nitrous acid
HONO is generated in the gas turbines via reaction of hydroxyl
radical with NO (Wormhoudt et al., 2007; Brundish et al., 2007) and
~1.1% of the total NOy is in the form of HONO by the engine exit
(Lukachko et al., 1998). Anderson et al. (2005) measured nitrous
acid (HONO) in the exhaust of a B757 and observed a clear power
M. Masiol, R.M. Harrison / Atmospheric Environment 95 (2014) 409e455432
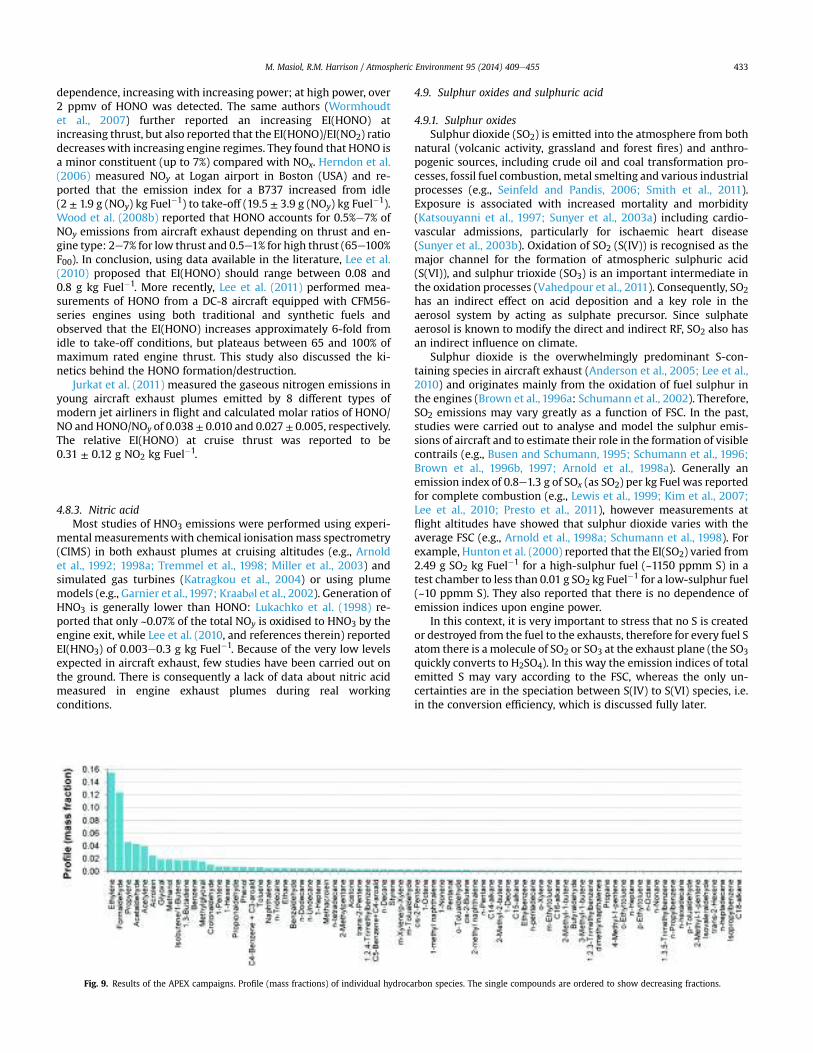
dependence, increasing with increasing power; at high power, over
2 ppmv of HONO was detected. The same authors (Wormhoudt
et al., 2007) further reported an increasing EI(HONO) at
increasing thrust, but also reported that the EI(HONO)/EI(NO2) ratio
decreases with increasing engine regimes. They found that HONO is
a minor constituent (up to 7%) compared with NOx. Herndon et al.
(2006) measured NOy at Logan airport in Boston (USA) and re-
ported that the emission index for a B737 increased from idle
(2 ± 1.9 g (NOy) kg Fuel#1) to take-off (19.5 ± 3.9 g (NOy) kg Fuel#1).
Wood et al. (2008b) reported that HONO accounts for 0.5%e7% of
NOy emissions from aircraft exhaust depending on thrust and en-
gine type: 2e7% for low thrust and 0.5e1% for high thrust (65e100%
F00). In conclusion, using data available in the literature, Lee et al.
(2010) proposed that EI(HONO) should range between 0.08 and
0.8 g kg Fuel#1. More recently, Lee et al. (2011) performed mea-
surements of HONO from a DC-8 aircraft equipped with CFM56-
series engines using both traditional and synthetic fuels and
observed that the EI(HONO) increases approximately 6-fold from
idle to take-off conditions, but plateaus between 65 and 100% of
maximum rated engine thrust. This study also discussed the ki-
netics behind the HONO formation/destruction.
Jurkat et al. (2011) measured the gaseous nitrogen emissions in
young aircraft exhaust plumes emitted by 8 different types of
modern jet airliners in flight and calculated molar ratios of HONO/
NO and HONO/NOy of 0.038 ± 0.010 and 0.027 ± 0.005, respectively.
The relative EI(HONO) at cruise thrust was reported to be
0.31 ± 0.12 g NO2 kg Fuel#1.
4.8.3. Nitric acid
Most studies of HNO3 emissions were performed using experi-
mental measurements with chemical ionisationmass spectrometry
(CIMS) in both exhaust plumes at cruising altitudes (e.g., Arnold
et al., 1992; 1998a; Tremmel et al., 1998; Miller et al., 2003) and
simulated gas turbines (Katragkou et al., 2004) or using plume
models (e.g., Garnier et al., 1997; Kraabøl et al., 2002). Generation of
HNO3 is generally lower than HONO: Lukachko et al. (1998) re-
ported that only ~0.07% of the total NOy is oxidised to HNO3 by the
engine exit, while Lee et al. (2010, and references therein) reported
EI(HNO3) of 0.003e0.3 g kg Fuel#1. Because of the very low levels
expected in aircraft exhaust, few studies have been carried out on
the ground. There is consequently a lack of data about nitric acid
measured in engine exhaust plumes during real working
conditions.
4.9. Sulphur oxides and sulphuric acid
4.9.1. Sulphur oxides
Sulphur dioxide (SO2) is emitted into the atmosphere from both
natural (volcanic activity, grassland and forest fires) and anthro-
pogenic sources, including crude oil and coal transformation pro-
cesses, fossil fuel combustion, metal smelting and various industrial
processes (e.g., Seinfeld and Pandis, 2006; Smith et al., 2011).
Exposure is associated with increased mortality and morbidity
(Katsouyanni et al., 1997; Sunyer et al., 2003a) including cardio-
vascular admissions, particularly for ischaemic heart disease
(Sunyer et al., 2003b). Oxidation of SO2 (S(IV)) is recognised as the
major channel for the formation of atmospheric sulphuric acid
(S(VI)), and sulphur trioxide (SO3) is an important intermediate in
the oxidation processes (Vahedpour et al., 2011). Consequently, SO2
has an indirect effect on acid deposition and a key role in the
aerosol system by acting as sulphate precursor. Since sulphate
aerosol is known to modify the direct and indirect RF, SO2 also has
an indirect influence on climate.
Sulphur dioxide is the overwhelmingly predominant S-con-
taining species in aircraft exhaust (Anderson et al., 2005; Lee et al.,
2010) and originates mainly from the oxidation of fuel sulphur in
the engines (Brown et al., 1996a: Schumann et al., 2002). Therefore,
SO2 emissions may vary greatly as a function of FSC. In the past,
studies were carried out to analyse and model the sulphur emis-
sions of aircraft and to estimate their role in the formation of visible
contrails (e.g., Busen and Schumann, 1995; Schumann et al., 1996;
Brown et al., 1996b, 1997; Arnold et al., 1998a). Generally an
emission index of 0.8e1.3 g of SOx (as SO2) per kg Fuel was reported
for complete combustion (e.g., Lewis et al., 1999; Kim et al., 2007;
Lee et al., 2010; Presto et al., 2011), however measurements at
flight altitudes have showed that sulphur dioxide varies with the
average FSC (e.g., Arnold et al., 1998a; Schumann et al., 1998). For
example, Hunton et al. (2000) reported that the EI(SO2) varied from
2.49 g SO2 kg Fuel#1 for a high-sulphur fuel (~1150 ppmm S) in a
test chamber to less than 0.01 g SO2 kg Fuel#1 for a low-sulphur fuel
(~10 ppmm S). They also reported that there is no dependence of
emission indices upon engine power.
In this context, it is very important to stress that no S is created
or destroyed from the fuel to the exhausts, therefore for every fuel S
atom there is a molecule of SO2 or SO3 at the exhaust plane (the SO3
quickly converts to H2SO4). In this way the emission indices of total
emitted S may vary according to the FSC, whereas the only un-
certainties are in the speciation between S(IV) to S(VI) species, i.e.
in the conversion efficiency, which is discussed fully later.
Fig. 9. Results of the APEX campaigns. Profile (mass fractions) of individual hydrocarbon species. The single compounds are ordered to show decreasing fractions.
M. Masiol, R.M. Harrison / Atmospheric Environment 95 (2014) 409e455 433
The importance of SO2 emissions at local scale, i.e. near the
airports, was highlighted by Yu et al. (2004), who found that
sulphur dioxide was a good tracer of aircraft emissions at both Los
Angeles and Hong Kong airports. However, on a global scale the
aviation source is considered to be secondary with respect to other
major sources of SO2: Kjellstr€om et al. (1999) used an atmospheric
general circulation model including the atmospheric sulphur cycle
to investigate the impact of aircraft sulphur emissions on the global
sulphur budget of the atmosphere and concluded that aviation
accounted for about 1% of the total sulphate mass north of 40%N,
where aircraft emissions are largest. In 2004, about 0.18 Tg of SO2
was estimated to be emitted from aviation (Lee et al., 2010) using an
EI(SO2) of 0.8 g Fuel#1. An estimation of SO2 produced by aircraft
below 1000 m can be computed by applying a constant EI(SO2) of
0.8 g kg Fuel#1 and by considering the global use of fuel reported by
the literature during LTO cycles in 2005 (Table 2). Results show a
global emission of 11Mg SO2 of which about 2.5Mg y#1 are emitted
within Europe.
4.9.2. Conversion of S(IV) to S(VI)
Despite SO2 being the dominant S-species in aircraft exhaust
emissions, a fraction can be further oxidised to form S(VI) as SO3
and H2SO4 (Lee et al., 2010). The presence of SO3 has been estab-
lished in gas turbine engine exhaust and as attributed mainly to the
oxidation of SO2 by O atoms (Arnold et al., 1998a) or by hydroxyl
radicals in exhaust plumes (Tremmel and Schumann, 1999). The
further reaction with water vapour rapidly converts SO3 to sul-
phuric acid, according to Stockwell and Calvert (1983); Stockwell
(1994); Brown et al. (1996a) and Seinfeld and Pandis (2006):
SO2 þHO! þM/HOSO2! þM
HOSO2! þ O2/SO3 þHO2
!
SO3 þ H2OþM/H2SO4 þM
Starik et al. (2002) computed that ~1% of the sulphur is converted
into SO3 within the combustor and about 10% into SO3 and H2SO4
before the engine exit. Past numerical simulations of H2SO4 for-
mation from atomic oxygen and hydroxyl radical in aircraft engines
indicated that between 2% and 10% of the fuel sulphur is emitted as
S(VI) (Brown et al., 1996a; Lukachko et al., 1998). However, current
understanding indicates a more realistic value of 2% (or possibly
less). These studies also indicate that S(VI) conversion in the turbine
is kinetically limited by the level of atomic oxygen, resulting in a
higher oxidation efficiency at lower FSCs. Katragkou et al. (2004)
report that the limiting factor of this series of reactions is the
oxidation of SO2 by the hydroxyl radical, which is somewhat un-
certain at the high temperatures in gas turbine engines. The
knowledge of the mechanisms involving sulphur species and their
interactions with H, O atoms and radicals occurring within a
combustor is far from complete and are the subject of discussion
(e.g., Blitz et al., 2003; Somnitz et al., 2005; DeWitt and Hwang,
2005; Yilmaz et al., 2006; Hindiyarti et al., 2007; Rasmussen et al.,
2007; Wheeler and Schaefer, 2009; Hwang et al., 2010).
Once emitted, the gaseous sulphuric acid may act as an impor-
tant precursor for aerosol because of its low vapour pressure. An
understanding of the processes controlling sulphate aerosols is
therefore essential to the study of the mechanisms of formation of
particles generated by aircraft (e.g., Starik et al., 2004). For example,
Arnold et al. (1998a) reported no detectable levels of sulphuric acid
in the gas phase behind an in-flight commercial aircraft, leading to
the inference that initially formed H2SO4 experiences a rapid gas-
to-particle conversion at plume ages <1.6 s. Sulphuric acid was
measured in several other studies at cruising altitudes and for
different FSCs (e.g., Fahey et al., 1995b; Busen and Schumann, 1995;
Schumann et al., 1996; Curtius et al., 1998; Arnold et al., 1998a;
Schr€oder et al., 2000; Schumann et al., 2000; Curtius et al., 2002)
as well as in fuel combustion experiments at ground-level (Frenzel
and Arnold, 1994; Curtius et al., 1998, 2002; Kiendler and Arnold,
2002; Sorokin et al., 2004) and during combustor testing
(Katragkou et al., 2004). Curtius et al. (2002) reported H2SO4 con-
centrations measured in the plume were up to 600 pptv for a
56 ppmm FSC, while the average concentration of H2SO4 measured
in the ambient atmosphere outside the aircraft plume was 88 pptv
and the maximum ambient atmospheric concentration 300 pptv.
The abundance ratio, sometime named conversion factor
(ε¼ (SO3þH2SO4)/total sulphur) has beenwidely used to assess the
ratio of S(VI) to total sulphur at the exit of engines. The literature
offers numerous estimates or measures of ε. However, the results
are often difficult to compare as they are derived by different
methods, ranging from direct measurements, indirect computa-
tions and models. In addition, most studies take in account only
particulate sulphate, while only a few studies have measured both
particulate and gaseous phases. Anyway, Timko et al. (2010b)
demonstrated that the conversion of S(IV) to S(VI) is independent
of engine technology for most modern in-use engines. Earlier
values of ε are well summarised in DeWitt and Hwang (2005),
while most recent measurements and modelling studies of aircraft
plume chemistry reported other direct, indirect and inferred values
of ε. Generally, ε values between 1 and 3% are commonly reported.
For example, ε values between 6 and 31% have been calculated for a
B757 aircraft (Miake-Lye et al., 1998), while Schumann et al. (2002)
observed ε between 0.34 and 4.5% for an old engine (Mk501) and
3.3 ± 1.8% for a modern engine (CFM56-3B1). For low FSC, they also
reported that ε was considerably smaller than implied by the vol-
ume of volatile particles in the exhaust, while for FSC*100 ppm,
sulphuric acid is the most important precursor of volatile aerosols
formed in aircraft exhaust plumes of modern engines. Kiendler and
Arnold (2002) inferred an ε value of 2 ± 0.8% for a M45H engine on
the ground, while Curtius et al. (1998, 2002) reported 3.3 ± 1.8% in
the plume of a B737-300 aircraft in flight by measuring the total
H2SO4 content in both gaseous and aerosol phases. The sulphur
conversion fraction of an RB211 engine was computed by Starik
et al. (2002) using a model and results showed that increases in
FSC cause a minor reduction in ε, reporting valuesz9%, andz8.4%
for FSC of 0.04% and 0.3%, respectively. Wilson et al. (2004) and
Sorokin et al. (2004) observed ε of 2.3 ± 1.2% in an A310 equipped
with a CF6-series engine at an exhaust age of about 5 ms from the
combustor exit, while Jurkat et al. (2011) derived ε for various in-
flight aircraft and reported an average value of 2.2 ± 0.5%, varying
from a minimum of 1.2% for a Trent-series and a maximum of 2.8%
for a CMF56-series engines. Wong et al. (2008) modelled the
microphysical processes involved and suggested conversion effi-
ciency of 1e2%. Timko et al. (2010b) reported ε ranging from 0.08%
to 0.01%, while Kinsey et al. (2011) suggest a median value of 2.4%.
Petzold et al. (2005b) reported that sulphur partitioning at 150 %C
was 97% SO2 + 2.7% gaseous H2SO4 < 0.3% chemisorbed H2SO4 at
soot particle surface. Regarding the relative abundance of the two
S(VI) species, during the COMS experiments Sorokin et al. (2004)
reported that SO3 represented the major fraction of S(VI) in the
exhaust behind the combustor and that SO3 conversion to H2SO4
takes place in the sampling line where the exhaust gases spend a
sufficiently long time and where the temperature is markedly
lower than in the hot exhaust. Other experimental measurements
made during the EXCAVATE experiment by Anderson et al. (2005)
led to the conclusion that the fraction of total sulphur that exis-
ted as SO3 would have to be less than 0.005%.
According to the conversion factors for sulphur species and
taking in account the mass conservation of S in the exhaust plumes
(no S is created or destroyed from the fuel to the exhausts), the
computation of the EIs can be assessed by applying:
M. Masiol, R.M. Harrison / Atmospheric Environment 95 (2014) 409e455434
EIðSO2Þ ¼ ðMðSO2Þ=MðSÞÞ$FSC$ð1# εÞ
and
EIðSO2#4 Þ ¼ ðMðSO2#
4 Þ=MðSÞÞ$FSC$ε
where M( ) represents the molecular weights of sulphur species,
FSC is the fuel sulphur content and ε is the S(IV) to S(VI) conversion
efficiency as a fraction, e.g. 0.02 and a unit conversion may be
necessary (e.g. if FSC is in expressed ppmm, etc).
Another important consideration concerning the sulphate
derived from aircraft engines was pointed out during the APEX-1
project, which was primarily developed to investigate the effects
of fuel composition on emissions at various power settings (e.g.,
Wey et al., 2006; Knighton et al., 2007; Yelvington et al., 2007;
Onasch et al., 2009). General results from the testing of a CFM56-
series engine showed a strong linear relationship (r2 ¼ 0.93) be-
tween FSC and emission indices for sulphate, which can be
approximately described by the linear equation EI (sulphur in mg
kg Fuel#1) ¼ 0.0136 FSC (in ppm)þ4.4952 (Kinsey, 2009).
4.10. Ozone
Ozone (O3) is a reactive oxidant gas playing a key role in
photochemical air pollution and in atmospheric oxidation pro-
cesses. Ozone is associated with decrements in respiratory function
and death from respiratory causes (Jerrett et al., 2009; Yang and
Omaye, 2009). Although in the upper atmosphere it acts as a bar-
rier for ultraviolet radiation, in the lower troposphere is a sec-
ondary air pollutant generated through a series of complex
photochemical reactions involving reactive hydrocarbons, solar
radiation and NO2 (Finlayson-Pitts and Pitts, 2000; Seinfeld and
Pandis, 2006).
Ozone is not primarily produced by aircraft engines, however
some ozone precursor such as CO, NOx and VOCs are emitted from
the exhaust and may subsequently increase the boundary layer O3
pollution. Note that, amongst the ozone precursors, both CO and
many VOCs aremainly emitted at low power settings during airport
taxi and idle operations, while NOx is mainly released during take-
off and climb phases, when engines reach higher thrusts. It is re-
ported that NO emissions, which are dominant at highest thrusts,
initially cause local ozone reductions in aircraft plumes (Kraabøl
et al., 2000a,b) following:
O3 þ NO/NO2 þ O2
but subsequently the photolysis of NO2 may form atomic oxygen
which reacts with molecular O2 to form O3:
NO2 þ hn/NOþ OOþ O2 þM/O3 þM
where M is N2, O2 or another molecule absorbing the excess energy
to stabilise the ozone formed (Seinfeld and Pandis, 2006). A con-
trary effect, i.e. a decrease in O3 concentrations, may also occur due
to the reaction of ozone with other compounds emitted from
aircraft. For example, it is recognised that alkenes, which are
emitted in the exhaust plumes, are susceptible to reaction with
ozone forming primary carbonyls and bi-radicals (e.g., Grosjean
et al., 1994; Seinfeld and Pandis, 2006) and consuming O3.
Although the effects of aircraft emissions on ozone depletion in
the upper troposphere and stratosphere have been addressed by
IPCC (1999) and the European 6th Framework ‘ATTICA’ (Assess-
ment of Transport Impacts on Climate Change and Ozone Deple-
tion) project (Lee et al., 2010), less attention has been given to the
effects within the boundary layer due to emissions during LTO
operations.
4.11. Hydrocarbons
Unburned hydrocarbons (UHC) are emitted as a result of the
inefficiency of jet turbine engines to completely convert fuel to CO2
and H2O (Knighton et al., 2009). Although the levels of UHC emitted
by aviation are considered negligible relative to emissions from
surface transportation systems such road traffic, they may cause
adverse health effects on exposed people, including workers and
travellers at airports, and residents who live near large hubs.
Therefore, UHC are included as parameter to be monitored during
the LTO cycles by ICAO (ICAO, 2008). Analysing the data provided by
the ICAO databank (EASA, 2013), a large range in the magnitude of
UHC emissions between different engine models can be observed.
Moreover, ICAO data clearly show that the emission of UHC during
complete LTO cycles have fallen considerably since the 1970s
(Fig. 6), mainly due to the development of more efficient
technologies.
Unfortunately, the UHC parameter used by ICAO only refers to
the lump sum of all hydrocarbons, including contributions from
methane, and no corrections aremade for background levels within
the engine intake air (Anderson et al., 2006; Lee et al., 2010).
Consequently, UHC data give no information on the large number of
specific non-methane hydrocarbons (NMHCs) nowadays identified,
and in some cases quantified, in aircraft exhaust plumes (Wilson
et al., 2004; Anderson et al., 2006; Lobo et al., 2007; Agrawal
et al., 2008; Herndon et al., 2009). This fact clearly represents a
significant gap in the knowledge of impacts of aircraft on both
environmental and human health endpoints, because of the very
different physicochemical and toxicological properties of each class
of organic compounds. Most emitted VOC are known ozone pre-
cursors, many are particle precursors and can impact visibility after
particle formation. Some compounds are known or are suspected to
have adverse effects on human health and the environment.
Among the hydrocarbons emitted in aircraft exhaust, 14 species (12
compounds and two groups of complex organic compounds) are
present in the Hazardous Air Pollutants (HAP) list compiled by the
USEPA (Federal Aviation Administration, 2003). These compounds
are 1,3-butadiene, n-hexane, acetaldehyde, xylene, acrolein, pro-
pionaldehyde, benzene, styrene, ethylbenzene, toluene, formalde-
hyde, lead compounds and polycyclic organic matter as 7 and 16
PAH groups.
In the last 20 years, various research programmes and experi-
ments have been carried out to give more detailed data on the
speciated hydrocarbon emissions of aircraft engines. Among others,
some milestones are listed hereafter. Spicer et al. (1984, 1994)
measured detailed organic emissions for the CFM56-class engines
burning various JP-grade fuels; Gerstle et al. (1999, 2002) reported
UHC emission rates for several military engines not included in the
ICAO databank; the EXCAVATE campaign (Anderson et al., 2005,
2006) investigated the speciated-hydrocarbon emissions from an
RB211-535-E4 engine at two different fuel sulphur levels; Herndon
et al. (2006) investigated a set of hydrocarbons from in-use aircraft
at Boston Logan International Airport; the APEX-1 campaign (Wey
et al., 2006) reported the hydrocarbon speciation for a CFM56-2C1
engine using fuels with differing FSC (Knighton et al., 2007;
Yelvington et al., 2007); Schürmann et al. (2007) sampled volatile
organic compounds in diluted exhausts; the JETS/APEX-2 and
APEX-3 campaigns (Lobo et al., 2007; Kinsey, 2009) reported data
for speciated hydrocarbons in both a staged aircraft test (Yelvington
et al., 2007; Wey et al., 2007; Agrawal et al., 2008; Timko et al.,
2010c) and at airports (Wood et al., 2008b; Herndon et al., 2009);
Knighton et al. (2009) consolidated earlier data from Spicer et al.
M. Masiol, R.M. Harrison / Atmospheric Environment 95 (2014) 409e455 435
(1984, 1994), EXCAVATE and APEX studies; Cain et al. (2013)
measured speciated hydrocarbon emissions from a TS engine
burning various (conventional, alternative and surrogate) fuels.
Although those studies have yielded much useful information
for characterising the emissions of hydrocarbons, to date there is
still a great deal of work to be done, many chemical and physical
characteristics remain unclear, and some conflicting results need to
the further investigated. Firstly, Spicer et al. (1984) reported that a
significant percentage (30%e40%) of the total hydrocarbon emis-
sions at idle are made up of a large number of exhaust compounds
with aliphatic, cycloaliphatic and aromatic structures, predomi-
nantly ethylene, propylene, acetylene, 1-butene, methane, and
formaldehyde. This latter carbonyl was found to be the predomi-
nant aldehyde present in the exhaust. In addition to byproducts of
combustion, some studies (Spicer et al., 1992, 1994; Slemr et al.,
2001) also observed that unburned/unreacted fuel compounds
are emitted in the engine exhaust from fuel cracking and incom-
plete combustion. Spicer et al. (1984) reported that compounds
from unburned fuel may represent a major component of exhausts
and that they are mainly composed of normal C10eC16 paraffins
with smaller amounts of alkyl substituted aromatics, cycloparaffins,
and branched alkanes. The unburned fuel component was also
observed to be virtually eliminated at the 30% and 80% F00 condi-
tions, when concentrations of all of the individual hydrocarbons are
very low. Similar results were reported by Slemr et al. (2001) in
both modern commercial high bypass TF engines (CFM56-2C1) and
older technology engines (Rolls Royce M45H Mk501) with emis-
sions dominated by alkenes and alkynes due to fuel cracking and
aromatic compounds arising from unburned fuel.
These pioneering results were largely confirmed by more recent
studies, which generally reported that emitted hydrocarbons are
composed of relatively light weight (C2eC6) species, including al-
kanes and alkenes, formaldehyde, methanol, ethylene, acetalde-
hyde, acetic acid, benzene, toluene, phenol, styrene, naphthalene
and methylnaphthalenes (Slemr et al., 2001; Anderson et al., 2006;
Knighton et al., 2007; Yelvington et al., 2007; Schürmann et al.,
2007; Kinsey, 2009). The results of the whole APEX study (Kinsey,
2009) partially confirmed previous data, indicating that generally
the gaseous hydrocarbon emissions of various engines primarily
consist of formaldehyde (16e28% of total gaseous emissions),
ethylene (8e23%), acetaldehyde (5e13%), acetylene (5e15%), pro-
pene (2e8%) and glyoxal (3e8%), with significant quantities of
acrolein (<4%), benzene (<3%), 1,3-butadiene (<3%), and toluene
(<1%), while 16e42% of total non-methane volatile compounds
remained unresolved. The sum of HCHO, ethylene, acetaldehyde,
and propene may account for roughly 75% of the volatile organic
compounds, while benzene, toluene, xylenes, and other substituted
benzene compounds, oxygenates (acetone, glyoxal, and propanal),
olefins (butene, pentene, hexane), and naphthalenes constitute the
remaining 20% (Timko et al., 2010c). In addition to the numerous
papers published, US Environmental Protection Agency (US EPA,
2009) also created a companion spreadsheet including data on
speciated hydrocarbon from APEX projects. Fig. 9 summarises the
data from APEX campaigns in terms of profile (mass fraction) of the
emitted hydrocarbons.
The total hydrocarbon EIs are highest at low power settings,
where combustor temperatures and pressures are low and com-
bustion is less efficient (Sutkus et al., 2001; Yelvington et al., 2007).
UHC data provided by ICAO also confirm this behaviour for in-use
TF engines (Fig. 7). Similarly, many studies have reported the
same behaviour for individual hydrocarbon species. Spicer et al.
(1992, 1994) and Slemr et al. (2001) first reported that the emis-
sions of many hydrocarbon species dropped at higher engine power
by a factor of 20e50 and unburned fuel components disappeared.
The EXCAVATE campaign (Anderson et al., 2006) also highlighted
that most hydrocarbon species are strongly power dependent, with
EIs at high thrusts dramatically lower than at idle. During APEX-
1,2,3 campaigns, Knighton et al. (2007) observed that at engine
power conditions significantly higher than 15% F00, the engine
combustion efficiency is close to 100%, resulting in hydrocarbon
emissions often below the detection levels for many individual
compounds. The inverse dependence of UHC upon thrust has a high
relevance for air quality at airports, where idle and taxi phases are
conducted at low thrusts and take upmost of the time. Fig. 8 shows
that the cumulative UHC emission spans over two order of
magnitude for in-use engines passing from idle to take-off during
standardised LTO cycles.
Despite these interesting studies, the scientific literature still
offers poor information on the hydrocarbon speciation and the few
available data are often conflicting. For example, the potential
changes in the hydrocarbon profiles at varying power are still un-
clear and deserve further investigation. Despite the large depen-
dence of the magnitude of total UHC emitted from different
engines, Knighton et al. (2009) observed that the ratios between
the formaldehyde versus other hydrocarbon species were constant
and independent of power settings. Although this result indicates
constant hydrocarbon profiles with varying thrust, these results are
inconsistent with other studies showing clear shifts of the hydro-
carbon speciation with power. For example, during the EXCAVATE
campaign, Anderson et al. (2006) observed that alkenes (mainly
ethene) constituted more than 70% of the observed total NMHC
emissions at idle, while at 61% F00 aromatic species (mostly
toluene) accounted for over 50% of the total. There is currently a
lack of information about the emitted hydrocarbons and this gap is
mainly evident for emissions at power settings below the ICAO 7%
idle. The behaviour and data for the most important classes of or-
ganics are discussed hereafter in separate sub-subsections.
4.11.1. Methane
Methane (CH4) is a radiatively active gas and is estimated to be
25 times more effective on a per-molecule level than CO2 in terms
of greenhouse effect at hundred-year time scales (Lelieveld et al.,
1998). Moreover, its roles in atmospheric chemistry to produce
tropospheric ozone and stratospheric water vapour indirectly
enhance its climate forcing effects. Although natural emissions
from wetlands are largely recognised as dominant sources of
methane at global scales, anthropogenic sources, such as energy,
agriculture, waste and biomass burning can further contribute to its
load in the atmosphere (Dlugokencky et al., 2011 and references
therein). Most studies report that turbine engines are not a sig-
nificant source of CH4 and have concluded that most engines tend
to produce minor amounts of methane at idle and may consume it
at higher engine power (Spicer et al., 1992, 1994; Vay et al., 1998;
Slemr et al., 2001; Anderson et al., 2006; Santoni et al., 2011).
Wiesen et al. (1994) examined methane emissions from different
commercial jet engines (PW 305 and RB211) under various flight
conditions using different fuels and concluded that air traffic does
not contribute significantly to the global budget of methane.
Santoni et al. (2011) measured methane emissions from a CFM56-
2C1 engine aboard a NASA DC-8 aircraft and reported that the EI
for CH4 was (mean ± standard deviation) 170 ± 160 mg kg Fuel#1 at
4% and 7% F00, while negative values (54 ± 33 mg kg Fuel#1) were
reported for higher thrust settings, indicating consumption of
methane by the engine.
4.11.2. Alkanes, alkenes and alkynes
During the EXCAVATE campaign, Anderson et al. (2006) re-
ported that the alkene species constituted over 90% of the observed
total NMHC at idle but less than 20% at higher engine power set-
tings. They also observed large decreases in alkane and alkene
M. Masiol, R.M. Harrison / Atmospheric Environment 95 (2014) 409e455436
emissions with increasing engine power for various FSCs. In
particular, EXCAVATE results showed that propylene underwent
the most dramatic decrease, exhibiting a drop of mixing ratios by a
factor ~280 from 7 to 61% F00. In the same manner, isoprene
dropped from ~2.5 ppbv to less than ~5 pptv (i.e., below the
detection limit). On the other hand, these results reported de-
creases in alkane compounds which were much more modest,
typically under a factor of 10. Schürmann et al. (2007) revealed that
though isoprene was not directly found in emissions from kerosene
refuelling, it was detected in considerable amounts in the aircraft
exhaust which indicates that isoprene is most likely formed in the
combustion process of a jet engine.
4.11.3. Carbonyls
Due to their known adverse effects on human health, some
carbonyls (formaldehyde, acetaldehyde, propionaldehyde and
acrolein) have been included in the HAP list (Federal Aviation
Administration, 2003). However, nowadays there is a gap in the
current state of knowledge regarding the toxicity of many other
aldehydes (including glyoxal, methylglyoxal and crotonaldehyde)
which are detected in sizeable quantities in aircraft exhaust plumes
and have potential toxic effects (Wood et al., 2008). APEX results
(Kinsey, 2009) clearly showed that carbonyls generally account for
most of the gaseous hydrocarbons emitted by common aircraft
engines. Agrawal et al. (2008) reported that the major three con-
tributors to carbonyl emissions are formaldehyde, acetaldehyde
and acetone, and showed that carbonyl emissions are significantly
higher during the idle mode than at higher thrusts. However,
measurements of carbonyl EIs were also found to be very variable
since they are sensitive to changes in ambient temperature
(Yelvington et al., 2007; Knighton et al., 2007; Agrawal et al., 2008).
Similar results were obtained for TS engines: Cain et al. (2013)
observed that the EIs for the most prevalent aldehydes emitted at
various engine power combinations were formaldehyde, acetal-
dehyde, and propionaldehyde and also reported a decrease with
increasing engine power. The results of such engine tests seem to
be confirmed by ambient measurements. For example, Fanning
et al. (2007) and Zhu et al. (2011) reported that the time averaged
concentrations of formaldehyde and acrolein were elevated at the
Los Angeles International airport relative to a background reference
site.
4.11.4. Aromatic compounds
Benzene, toluene, ethylbenzene, and ortho-, meta-, and para-
xylenes are an important group of VOCs collectively known as
BTEX. In urban environments BTEX are principally emitted by
vehicle exhaust gases because of their presence in fuels, lubricating
and heating oil, while minor sources include gasoline evaporation,
use of solvents and paint, leakage from natural gas and liquefied
petroleum gas. The adverse health effects of benzene are well
known (e.g., WHO, 2000; Saillenfait et al., 2003; Pariselli et al.,
2009, and reference therein) and it is included as a known hu-
man carcinogen by the IARC classification system. BTEX are highly
reactive in the troposphere playing a key role in atmospheric
chemistry as important photochemical precursors for tropospheric
ozone and secondary organic aerosol generation (Atkinson, 2000;
Atkinson and Arey, 2003).
Aromatic compounds are present in jet fuels, and can therefore
be emitted as both unburned material and byproducts of incom-
plete hydrocarbon combustion, but also from fuel evaporation and
refuelling (Anderson et al., 2005, 2006). In this context, the benzene
to toluene ratio (B/T) was often proposed to identify the fuel vs
combustion origin of hydrocarbon mixtures. For example,
Schürmann et al. (2007) observed that the B/T ratio at an airport is
well below 1 for refuelling emissions and engine ignition while in
the exhaust this value reaches up to 1.7. The US EPA (2009) mass
fraction profiles (Fig. 9) clearly show that BTEX account for ~4% of
identified compounds, while other relevant aromatics (in order of
decreasing mass fraction) are phenol, 1,2,4-trimethylbenzene, sty-
rene, m-ethyltoluene and 1,2,3-trimethylbenzene. Generally, the
literature shows large decreases in benzene and toluene emissions
with increasing engine power, both for TF (Anderson et al., 2006)
and TS engines (Cain et al., 2013). In particular, by studying the
hydrocarbon emissions from a TS engine operating with conven-
tional (JP-8), alternative and surrogate fuels, Cain et al. (2013)
hypothesised that fuel composition and structure may play a sig-
nificant role in the aromatic emissions of aircraft. They speculated
that the propensity of the molecular structure of paraffins in fuels
to produce benzene or toluene was observed to follow
cycloparaffin > iso-paraffin > n-paraffin. This study also attempted
to depict the chemical processes at the basis of their observations
and hypothesised that iso- and n-paraffins must first undergo
either ring closure or decomposition to combustion/pyrolytic in-
termediates prone to ring formation (e.g., propargyl radicals and
propylene) to ultimately form cyclic and aromatic compounds. In
addition, Cain et al. (2013) reported that an increased branching
ratio of iso-paraffins resulted in higher production rates of the C3-
intermediates, which further contribute to ring/aromatic formation
and growth.
4.11.5. Polycyclic aromatic hydrocarbons
Among the large number of hydrocarbon species emitted by
aircraft engines, the polycyclic aromatic hydrocarbons (PAHs)
deserve particular attention because most congeners are known,
probable or possible human carcinogens (WHO, 2000; Armstrong
et al., 2004; IARC, 2010) and because of their ubiquitous presence
in the urban atmosphere (Ravindra et al., 2008; Zhang and Tao,
2009). PAH are semi-volatile and partition between the gaseous
and particulate phases; lighter PAHs (2e3 aromatic rings) are
present almost exclusively in the vapour-phase, whereas PAHs with
higher molecular weights (>4 rings) are almost totally adsorbed on
particles. Although PAHs may undergo oxidation by several atmo-
spheric oxidants, their potential for long range transport cannot be
disregarded (e.g., Keyte et al., 2013).
Agrawal et al. (2008) showed that lighter congeners such
naphthalene and its 1-methyl and 2-methyl derivatives contribute
strongly to the total PAH mass in various aircraft (TF) emissions at
differing thrust modes. Moreover, they also reported that the
EI(naphthalene) increased as power increased from idle mode
falling off as the engine operated at the highest power. Chen et al.
(2006) characterised the PAH emissions of the TS engine of a he-
licopter at five power settings and reported a mean total PAH
concentration in the exhaust of 843 mg m#3, with a maximum of
1653 mgm#3 emitted during ground idle. The emission level of total
PAHs during a complete LTO cycle was estimated to be 1.15 g PAHs
LTO#1. Even if the results provide evidence for high mass concen-
trations of total emitted PAH, the speciation revealed that lighter
congeners, which have generally lower carcinogenic potencies,
were dominant: 59.7% of total PAHs emissions were made up of
naphthalene, 37.8% of three-ring congeners, while the remaining
2.5% of PAHs had four- to seven-rings. The emission factor revealed
U-shaped behaviour: maximum at idle (50%), minimum at fly idle
(67%) and increasing until max thrust (100% F00).
Although the PAH pollution at airports can be overwhelmed by
external sources, such as vehicular traffic and industrial emissions,
a number of studies have indicated airport emissions cannot be
neglected. Cavallo et al. (2006) measured the concentrations of 23
PAH in three areas (airport apron, building and terminal/office) of a
major Italian airport (Fiumicino, Rome). The airport apron was
found to be suffering the highest levels of total PAHs (27.7 mg m#3)
M. Masiol, R.M. Harrison / Atmospheric Environment 95 (2014) 409e455 437
with a prevalence of 2e3 ring PAH such asmethylnaphthalenes and
acenaphthene presumably associated with jet fuel combustion.
However, they also showed that PAH levels were lower than the
threshold limit value proposed for occupational exposure by ACGIH
(0.2 mg m#3). Similar results were obtained by Zhu et al. (2011),
who observed that the semi-volatile PAHs (from phenanthrene to
chrysene) were consistently higher at both blast fence and down-
wind sites from the take-off runway of Los Angeles airport than at a
background site. This study also indicated naphthalene as the most
abundant gas-phase PAH (80e85% of the total PAHs).
4.11.6. Organic sulphur, nitrogen and chlorinated species
Since jet fuels contain variable FSC, some organic sulphur spe-
cies may form during combustion. Anderson et al. (2006) measured
the emissions of OCS, CS2 and dimethyl sulphide (DMS) from a
RB211-series TF engine at varying engine power and burning two
different FSC fuels. Results showed no consistent trends for OCS and
CS2 with varying thrust settings and suggested that the sources of
those gases are insensitive to the FSC. In contrast, this study
revealed that levels of DMS are dramatically reduced from
approximately ambient levels at idle to near the instrument
detection limit as engine power is increased and speculated that
ambient DMS is essentially burned (oxidised) out of the exhaust
stream at combustor temperatures associated with high engine
power.
The presence of organic nitrogen species in aircraft exhaust may
derive from the presence of nitrogen in fuels and from the potential
reaction between alkanes and NOx within the exhaust plume.
During the EXCAVATE campaign, alkylnitrate species were
observed in exhaust plumes with methyl nitrate, iso-propyl nitrate,
and 2-butyl nitrate accounting for 80e90% of the total N-containing
organic species (Anderson et al., 2006). In particular, methyl nitrate
was observed to follow U-shaped curves of EI vs. fuel flow, with
minimum emissions at mid-range thrust, slightly increased emis-
sions at low thrust and strongly increased at higher powers.
Chlorinated organic compounds can form in aircraft exhaust as
by-products of fossil fuel combustion in the presence of chlorine.
Chlorine can be present in fuels because refineries can use salt
driers to remove water from fuels (Anderson et al., 2006), and in
certain circumstances may be present in ambient air as sea salt,
such as in coastal environments. Despite the lack of available data
in the literature, there is no evidence to date that chlorinated
compounds are produced by aircraft engines. For example, Agrawal
et al. (2008) observed that the emissions of dioxins from various
aircraft engines are below the detection limit.
4.12. Chemi-ions
Aircraft exhausts also contain gaseous ions, the so called chemi-
ions (CIs), have been measured in several studies (e.g., Reiner and
Arnold, 1993, 1994; Arnold et al., 1998b; Yu and Turco, 1997;
Kiendler and Arnold, 2002; Eichkorn et al., 2002; Haverkamp
et al., 2004; Sorokin et al., 2004; Miller et al., 2005; Anderson
et al., 2005). Their formation was also found in various mobile
sources (e.g., Seigneur, 2009) and is attributed to the radical-
eradical reactions during combustion processes. Once emitted, CIs
may evolve chemically via ioneion recombination and ion-
emolecule reactions involving trace gas molecules present in the
exhaust (Kiendler and Arnold, 2002) and may act as aerosol pre-
cursors (Sorokin and Mirabel, 2001; Eichkorn et al., 2002). Starik
(2008) provides a scheme of ion formation in hydrocarbon flames
and inside the combustor.
Relatively high number concentrations of CIs have been
measured: in the SULFUR experiments (Schumann et al., 2002 and
reference therein) 109 ions cm#3 were reported at ground level, i.e.,
of the order of 1017 CIs kg Fuel#1, but it was also reported that CIs
decrease rapidly with increasing plume age (Arnold et al., 2000;
Sorokin and Mirabel, 2001). Haverkamp et al. (2004) measured EI
for the total (positive and negative) ions of 1.2 ) 1016e2 ) 1016 CIs
kg Fuel#1 and observed number concentrations of the same order
of magnitude for both negative and positive ions: negative CIs
varied from 6 ) 107 and 2.1 ) 108 molecules cm#3, while positive
ions ranged from 4) 107 to 1.7 ) 108 molecules cm#3. About 50% of
the measured ions have masses heavier than 100 amu and themost
massive ions show masses up to 1500e3000 amu, depending on
the fuel flow (thrust) and FSC (Haverkamp et al., 2004). Schumann
et al. (2002) reported masses also exceeding 8500 amu. Identified
negative CIs include many organic ions and cluster ions containing
sulphuric acid, e.g., HSO4‒(H2SO4)n, HSO4
‒(H2SO4)n(SO3)m (n < 3,
m ¼ 0,1), NO3‒ (HNO3)m and HSO4
‒(HNO3)m (m ¼ 1,2). Kiendler and
Arnold (2002) further reported a low stability of HSO4‒(H2SO4)n
(n * 3) against thermal detachment of H2SO4 at high temperatures,
indicating the presence of gaseous H2SO4 in exhaust plumes. Pos-
itive CIs are mostly oxygen-containing organic compounds
(Schumann et al., 2002) and considering the heavy masses of most
CI, Haverkamp et al. (2004) also hypothesised the presence of large
organic molecules, such as PAHs.
The generation of CIs in the combustor, their physico-chemical
characteristics and the changes occurring along with plume aging
are not yet well understood andmerit further investigation as these
ions may play a key role in the formation of numerous volatile
aerosol particles (e.g., Yu and Turco, 1997; Arnold et al., 2000;
Sorokin and Mirabel, 2001; Haverkamp et al., 2004; Miller et al.,
2005).
4.13. Particulate matter
Particulate matter (PM) is emitted by a great variety of both
natural and anthropogenic sources. The latter include a large va-
riety of anthropogenic processes, which emit particles with very
different chemical composition and physical properties. Nowadays,
PM composition and sources have been extensively investigated in
a large number of different environments (e.g., Viana et al., 2008;
Harrison et al., 2012; Amato et al., 2013). However, few data on
PM emissions are historically available for aircraft engines (Wayson
et al., 2009; Kinsey et al., 2011). In addition, ICAO has not yet
defined any emission standard for PM to be applied during LTO
cycles and is therefore interested in setting a certification limit for
this pollutant to address related air quality and climate issues
(Kinsey, 2009). In this context, there are some current programmes
aiming to describe the PM emissions from aircraft engines, e.g., the
Society of Automotive Engineers (SAE) E-31 Committee is devel-
oping a standard PM test method for aircraft engine certification
(SAE, 2009).
Despite a number of studies which have been published recently
on PM emissions from gas turbine engines from both a physical and
a chemical point of view (e.g., Corporan et al., 2008; Whitefield
et al., 2008; Herndon et al., 2008; Agrawal et al., 2008;
Westerdahl et al., 2008; Kinsey et al., 2010, 2011), current data on
aircraft-generated PM are still wholly inadequate and many open
questions wait to be addressed. This gap appears to be a pressing
issue because many epidemiological studies have found a strong
correlation between the exposure to PM and some significant
adverse human health effects (e.g., Pope and Dockery, 2006;
Valavanidis et al., 2008; Polichetti et al., 2009; Karakatsani et al.,
2012; Anderson et al., 2012; Heal et al., 2012; Martinelli et al.,
2013). PM inhalation can affect morbidity and can lead to an in-
crease in hospital admissions, and is significantly associated with
mortality and to a substantial reduction in life expectancy (Pope
M. Masiol, R.M. Harrison / Atmospheric Environment 95 (2014) 409e455438
et al., 2009; Hoek et al., 2010; Sapkota et al., 2012; Raaschou-
Nielsen et al., 2013).
4.13.1. Volatile and non-volatile PM
PM generated from aircraft engines can be classified into two
major fractions: non-volatile and volatile PM (e.g., Kinsey, 2009;
Presto et al., 2011), while the combination of both volatile and
non-volatile PM is commonly referred as total PM. Non-volatile PM
is directly emitted by engines and is mainly composed of graphitic/
elemental/black carbon with traces of metals, which are stable at
the high temperatures and pressures normally reached in the
exhaust plumes. Volatile PM is instead formed through the gas-to-
particle partitioning and conversion processes of sulphur and
various organic gases (Robinson et al., 2010; Timko et al., 2010b),
which occur after the emission in the near-field plume downstream
of the engine (Kinsey et al., 2011). Since the most volatile PM
components are partitioned into the gas- and particulate-phases,
their behaviour is sensitive on the changes in the environmental
conditions with respect to the near-plume and in any case many
compounds can remain in equilibrium between the two phases.
This component is therefore very sensitive to the sampling condi-
tions (Wey et al., 2006; Wong et al., 2011; Presto et al., 2011). In
particular, the organic component of the volatile PM undergoing
partitioning between the two phases is named organic aerosol (OA)
and can be composed of a large number of different hydrocarbon
classes. Moreover, as the reactive compounds can be affected by
oxidation by a number of atmospheric oxidant species (mainly
hydroxyl, nitrate radicals and ozone), it can be expected that the
composition and the quantity of volatile PM changes progressively
away from the plume, after natural cooling, dilution and chemical
processes occur in the atmosphere. Many hydrocarbons of high
volatility, such as BTEX, low molecular weight PAHs, alkanes and
many others, may be easily oxidised to species with substantially
lower volatilities (Kroll and Seinfeld, 2008) and, thus, may act as
precursors for the formation of the secondary organic aerosol
(SOA). The formation and the properties of the SOA, including their
gas/particle partitioning, are an intense area of research (e.g.,
Pandis et al., 1992; Pankow, 1994; Odum et al., 1996; Kroll and
Seinfeld, 2008; Hallquist et al., 2009) and the common way to
describe the partitioning of a constituent i between the gas- and the
condensed-phases with mass concentration COA can be described
by a partitioning coefficient, xi:
xi ¼ 1"$
1þ!
C,i
"
COA#%
where C,i is the effective saturation concentration of the compound,
i.e. a semi-empirical property describing the partitioning of com-
plex mixtures. Donahue et al. (2009) proposed three different
classes of compounds on the basis of their C* values: (i) the low
volatility organic compounds, showing C* from 10#2 to 10#1 mgm#3
and mostly remaining in the condensed phase under common at-
mospheric conditions; (ii) the SVOCs, exhibiting C* between 100
and 102 mgm#3 and undergoing significant partitioning and (iii) the
intermediate volatility organic compounds (IVOCs), having C* in the
order of magnitude of 103e106 mgm#3, which are almost entirely in
the gas-phase. Recently, some studies have pointed out that most
hydrocarbons emitted by aircraft engines are thought to be
important SOA precursors (Miracolo et al., 2011; Presto et al., 2011),
being in the IVOC and SVOC classes. However, the potential of hy-
drocarbons emitted by aircraft exhaust to form secondary compo-
nents is currently poorly understood.
4.13.2. Particulate mass
Generally, the emission indices of PM mass range from
approximately 10 to 550mg PM kg Fuel#1 (Kinsey, 2009). U-shaped
curves of PM emissions versus thrust are commonly reported in the
literature, showing elevated emissions at low power settings, a
decrease to a minimum at midrange power, and then an increase at
high or full power (Whitefield et al., 2008; Kinsey, 2009; Kinsey
et al., 2010, 2011). Agrawal et al. (2008) noted a 10e40-fold in-
crease in the EI(PM) as the engine power increased from idle to
climb thrust. However, there are deviations from this behaviour:
the PM mass emission indices at varying thrusts have been shown
to depend on various factors, including engine families, technology,
FSC, operating power, cold and warm engine conditions and envi-
ronmental conditions (e.g., Kinsey, 2009) and real-time emission
rates for PM for a typical TF engine have revealed significant PM
spikes during changes in power settings (Agrawal et al., 2008).
The measurements of PM from aircraft exhaust are heavily
dependent on the adopted methodology (e.g., Presto et al., 2011).
Since the volatile PMmay undergo rapid changes in time and space,
the sampling protocol, such as the distance from the engine exit,
and other parameters having implications on the aging of plumes
play a key role in the mass of sampled particles. In addition, the
environmental conditions (e.g., temperature, humidity, sunlight,
wind, etc.) can also affect PM mass, particularly through the po-
tential for particle formation, coagulation, and growth (e.g.,
Herndon et al., 2005). Timko et al. (2010b) reported that soot is the
only type of particle detected at the engine exit plane, while volatile
particles are only detected downwind (15e50 m) due to the
nucleation of sulphate and organic materials in the cooling exhaust
plume. Kinsey et al. (2010) indicated that a variable amount (40%e
80%) of the total PM can be composed of volatile matter, mainly in
the form of sulphur and organics. Lobo et al. (2012) measured the
specific PM emissions during normal LTO operations at a distance of
100e300 m downwind of an active taxi-/runway at the Oakland
International Airport and reported EI(PM) between 100 and
700 mg PM kg Fuel#1 under both the idle/taxi and take-off condi-
tions for various aircraft/engine combinations.
4.13.3. Particle number concentration
During the APEX campaigns, the observed EI(#) varied from
approximately 1$1015 to 1$1017 particles kg Fuel#1 (Kinsey, 2009;
Kinsey et al., 2010) and are therefore comparable on a per unit
fuel burn basis to the number of particles generated from other
combustion sources, such as ship emissions, biomass burning and
forest fires (Kumar et al., 2013). Generally most TF engines tested
during APEX projects exhibited EI(#) strongly correlated with fuel
flow (Kinsey et al., 2010), with higher EI at low power settings
following a logarithmic relationship of EI(#) to thrust:
EIð#Þ ¼ m$½lnðfuel flowÞ. þ b
where m represents the slope of the regression line with values
ranging from #2$1015 to #3$1016 and b is the intercept of the
regression line varying from 2$1016 to 2$1017 (Kinsey, 2009). Simi-
larly to EI(PM) the particle number indices were however observed
to be sensitive to engine technology, FSC, operating power and
environmental conditions: Kinsey (2009) also reported a
completely different behaviour for a TJ engine (CJ610-8ATJ), with
EI(#) lower at idle and relatively constant at higher F00.
It was shown that EI(#) tends to increase moving away from the
engine exit plane. EXCAVATE results (Anderson et al., 2005) re-
ported increases by a factor of 10 at 25e35 m than at 1 m down-
stream of the exhaust plane. Timko et al. (2010b) further observed
differences in particle number emissions sampled at engine exit
plane and downwind (15e50 m) of the engine. They reported that
soot is the main species detected at the engine exit plane, while the
nucleation of volatile particles in the cooling exhaust gases
M. Masiol, R.M. Harrison / Atmospheric Environment 95 (2014) 409e455 439
measured downwind further led to increases in the particle num-
ber of 1e2 orders of magnitude.
Cheng and Corporan (2010) reported particle number emissions
from military engines operated with JP-8 fuel in various thrust
settings. They observed that a common TF engine emits increasing
number of particles at increasing thrust with particle number
emission indices of 5.5$1015, 5.3$1015, 9.6$1015, and
8.9$1015 particles kg Fuel#1 for the idle, 80%, 90% and 95% power
setting, respectively. An inverse pattern with decreasing emissions
at increased power settings was instead reported for a common TP
engine equipping the widespread used military cargo C-130 Her-
cules: averaged EI were 1.8$1016, 1.4$1016, 1.4$1016, 1.0$1016, and
1.2$1016 particles kg-Fuel#1 for 4%, 7%, 20%, 41% and max thrusts,
respectively. This study also examined two common TS engines
used in most helicopters and aircraft and reported increasing
emissions of particles with increasing thrust: 3.1$1015 (idle),
3.3$1015 (75%) and 5.5$1015 (max thrust) particles kg-Fuel#1 and
1.1$1014 (idle) 1.8$1015 (75%) and 3.0$1015 (max thrust), respectively.
Similar results were observed by Cain et al. (2013) in a TS engine
burning various types of fuel: JP-8 fuel emissions were between
1015 and 1016 particles kg-Fuel#1, while emissions from other
alternative and surrogate fuels were 1e2 order of magnitude lower.
Measurements of EI(#) at airports indicated similar results. Lobo
et al. (2012)measured the specific PM emissions during normal LTO
operations at a distance 100e300 m downwind of an active taxi-/
runway at the Oakland International Airport and associated the
data with various aircraft/engine combinations. They observed
similar EI(#) for both idle/taxi (7$1015e3$1017 particles kg Fuel#1)
and take-off (4$1015e2$1017 particles kg Fuel#1) phases. Klapmeyer
and Marr (2012) reported that the EI(#) for in-use aircraft at a
regional airport varied from 1.4$1016 to 7.1$1016 particles kg Fuel#1
and observed slightly higher concentrations during taxi phases
than during take-offs.
The beneficial effects of alternative fuels upon particle emissions
are nowadays under discussion. Although this review does not
focus on such effects, it is interesting to note that some studies have
highlighted potential positive effects on the EI(#) and EI(PM). For
example, Lobo et al. (2011) reported reduced emissions of PM
number emissions of about one third using 50% FT/50% Jet-A1 blend
instead of Jet-A1.
4.13.4. Size distributions
Size distributions of airborne particles influence their residence
time and dispersion (Allen et al., 2001). In addition, the dimensions
of particles are directly related to their emission sources, as me-
chanically generated particles (e.g., wind-blown dust, sea spray) are
generally largest than 1 mm, while combustion-generated (high-
temperature processes, traffic, many industrial activities) are typi-
cally smaller than 1 mm (e.g., Lewis and Schwartz, 2004; Seinfeld
and Pandis, 2006; Ning and Sioutas, 2010). Ultrafine particles
(UFPs, diameter <100 nm) typically constitute ~90% or more of
particle number count in areas influenced by vehicle emissions
(Morawska et al., 2008). UFPs have larger surface area per unit mass
with respect to larger particles and can potentially contain high
proportions of organic material such as polycyclic aromatic hy-
drocarbons. Moreover, UFPs can penetrate deeper into the respi-
ratory tract and into cells possibly posing an elevated risk for
human health (Oberdorster et al., 2004; Delfino et al., 2005;
Br€auner et al., 2007; Belleudi et al., 2010; Knibbs et al., 2011).
A large number of studies (e.g., Herndon et al., 2005; Wey et al.,
2007; Westerdahl et al., 2008; Cheng et al., 2008; Mazaheri et al.,
2009; Dodson et al., 2009; Kinsey, 2009; Kinsey et al., 2011; Zhu
et al., 2011; Presto et al., 2011; Hsu et al., 2013) have provided ev-
idence that AEs may lead to increased concentrations of UFPs.
However, the nature of semi-volatile compounds emitted by
aircraft, the possible mechanisms of secondary aerosol formation
and the dilution effect, make it difficult to associate ameasured size
distribution with a specific source. Studies performed at the
exhaust exit-plane or directly downstream of the engine cannot
usefully be compared with data obtained in ambient air sampled at
airports. However, even if differences and limitations exist, some
trends and recurring modes have been identified in most studies.
A study by Shumway (2002) used scanning electron microscopy
to analyse individual particles emitted from military engines and
reported predominant particles with dimensions ranging from 22
to 120 nm. It was observed that emitted particles were discrete at
low thrust (approach and idle), while they tended to agglomerate at
higher power (intermediate and military modes). Similar results
have recently been reported by Mazaheri et al. (2013), who ana-
lysed the aircraft emissions during normal takeoff and landing
operations at an international airport by using the transmission
electronmicroscopy technique. They reported particles in the range
of 5e100 nm in diameter with a dominant nucleation mode
(18#20 nm) and semisolid spherical shapes. Nowadays most
studies measure particle size distributions using automatic in-
struments, such as scanning mobility particle sizers (SMPS), elec-
trical low pressure impactors (ELPI), and differential mobility
spectrometers (DMS). A comprehensive review of these devices is
provided elsewhere (Kumar et al., 2010). Anderson et al. (2005)
reported that exhaust exit-plane measurements on engines
mounted in test cells and B757 aircraft in run-up facilities produce
of the order of 1015 soot particles per kg of fuel burned with a mean
mass diameter of 40e60 nm. Using an improved version of the
nanometre aerosol size analyser (nASA), they also reported that the
aerosol size distribution at 1m from a B757 engine is a combination
of volatile and non-volatile particles with a bimodal distribution.
The first (non-volatile) mode was measured by heating the aerosol
to 300 %C before analysis with the nASA andwas found to be around
20 nm; this mode was thought to be primarily composed of soot
and other components including zinc, aluminium, and titanium
which are from the abrasion of engine components or the trace
metal impurities in the fuel. The second (volatile) mode was
observed at 7 nm and comprised particles that vaporise below
300 %C.
During the APEX campaigns (e.g., Wey et al., 2007; Kinsey, 2009;
Kinsey et al., 2010), the particle size distributions of the emissions
were generally found to be unimodal and log-normally distributed,
with electrical mobility diameters ranging from ~3 nm to >100 nm
and a geometric number mean diameter (GMD) of ~10e35 nm. A
slightly dependence of GMD on thrust was detected, with GMD of
10e20 nm at low fuel flow rates, a decrease at mid-power and then
an increase at higher thrust. These studies also reported the pres-
ence of a prominent nucleation mode mainly on samples collected
farther from the engine exit (30m)with respect to gases sampled at
1 or 10 m. This second mode was attributed to the secondary
aerosol generation caused by the expansion and cooling of the
exhaust plume and is composed of sulphuric acid and low-volatility
hydrocarbons (Wey et al., 2007). APEX results detected changes in
both the GMD and related geometric standard deviation (GSD) of
the particle size distributions at varying engine and fuel type,
thrust, and environmental conditions.
While APEX reported size distributions for commercial in-use
airliner engines, we report data from other studies on differing
engine types and technologies. Rogers et al. (2005) showed that the
particles measured in the exhaust of two military engines (a FT
with afterburner and a TS) were unimodally distributed with peaks
at 20e40 nm. Cheng et al. (2008) observed that the particle number
size distributions downstream of a C-130 Hercules showed peaks
between 50 and 80 nm for engine power settings ranging from idle
to maximum thrust. They also observed a clear trend of increasing
M. Masiol, R.M. Harrison / Atmospheric Environment 95 (2014) 409e455440
particle diameter with increasing engine power setting and dis-
tance from the engine exit. Cheng et al. (2008) detected the pres-
ence of another peak corresponding to the lower instrumental
limit, presumed to be an additional mode below 20 nm. Cheng and
Corporan (2010) reported unimodal size distributions for military
turbofan, turboprop and turboshaft emissions sampled at the en-
gine exhaust plane. They observed that both the total particle
number concentration and GMD increased as the engine power
increased for all tested engines. In particular, the observed GMD
ranged from 55 nm (at idle) to 85 nm (at 95% F00) in turbofan, from
51 nm (at idle) to 67 nm (at max thrust) in turboprop and from
20 nm (at idle) to 42 nm (at max thrust) in a turboshaft engine.
4.13.5. Changes of particle number and size after the dilution of
plumes
The effects of the aircraft-related emissions of UFP at airports
have received increasing attention in recent years and some studies
have demonstrated a clear dependence of UFP concentrations and
size distributions upon aircraft operations. In addition, UFP mea-
surements upwind and downwind of airports are of particular
importance because they are performed under ambient conditions,
i.e. after the plume has been diluted by air and the particle coag-
ulation and gas-to-particle condensation processes have occurred.
Hu et al. (2009) studied the effect of aircraft movements in a
neighbourhood adjacent to the regional airport of Santa Monica
and observed that spikes in the particle number concentration
related to the take-off phase were 440 times elevated above back-
ground and reached 2.2) 106 particles cm#3. At a site located at the
blast fence of Los Angeles International Airport, Zhu et al. (2011)
reported that total UFPs counts exceeded 107 particles cm#3 dur-
ing take-offs. This study further investigated temporal profiles in
particle concentration of 30 nm mobility diameter (corresponding
to the mean geometric mode of emitted particles) due to isolated
aircraft take-off events: dramatic increases of particle concentra-
tions (from 1.6$103 to 1.7$104 particles cm#3) were reported when
aircraft engines are accelerated to the 100% thrust power for take-
off, followed by decreases of number concentrations showing an
exponential decay. Similar findings have been reported by Hsu et al.
(2012), who observed that departures of jet engine aircraft on a
runway may contribute to 1$103 to 7$104 particles cm#3. The same
authors further revealed significant higher increases of UFP at Los
Angeles International airport (Hsu et al., 2013) due to the LTO ac-
tivity: 2$106‒7$106 particles cm#3 increase at a monitor at the end
of the departure runway, 8$104‒1.4$105 particles cm#3 at a site
250 m downwind from the runway.
Changes in the particle size distributions can also occur after
plumes are diluted in ambient air due to coagulation. However,
most studies have shown that particle size distributions at airports
are comparable with those measured during engine tests. Air
monitoring carried out in the surroundings of the Los Angeles In-
ternational Airport found that the upwind site was dominated by
particles of approximately 90 nm diameter whereas downwind
sites were dominated by finer particles, peaking at approximately
10e15 nm (Westerdahl et al., 2008), which corresponds to the size
reported during APEX campaigns for many in-use engines (Kinsey
et al., 2010). Similarly, Fanning et al. (2007) and Zhu et al. (2011)
reported very high number concentrations of UFPs collected at
the blast fence site, with the highest numbers found at a particle
size of approximately 14 nm. The same study further observed that
the UFP number concentrations measured in a residential com-
munity approximately 2e3 km downwind of the airport were in-
termediate in concentration between the airport runway and the
background reference site. This finding was associated with aircraft
take-off activities and the authors noted the significant exposure
and possible health implications for people living near the airport.
Mazaheri et al. (2009) revealed that size distributions exhibit
similar modality during all phases of the LTO cycles with particles
predominantly in the range of 4e100 nm in diameter. This latter
study also reported two distinct modes: a nucleation mode at di-
ameters <30 nm observed in all LTO modes and an accumulation
mode between 40 and 100 nm more pronounced during take-offs.
While the nucleation mode exhibited the highest number con-
centration of all modes, the accumulation mode dominated the
particle mass size distributions. Lobo et al. (2012) measured the
specific PM emissions during normal LTO operations at a distance of
100e300 m downwind of an active taxi-/runway at the Oakland
International Airport and associated the data with various aircraft/
engine combinations. The size distributions were typically bimodal
with a nucleation mode composed of freshly nucleated PM and an
accumulation mode mostly made up of soot with some condensed
volatile material. These observations closely parallel the mecha-
nisms and size distribution of particles in diesel exhaust (Harrison
et al., 2011).
4.14. Chemical composition of PM
Although the chemical composition of PM may include most of
the periodic table of the elements and many thousands of different
organic compounds, it is principally composed of few major com-
ponents, which usually represent several percent of the total mass
of particles, and some of those may remain in thermodynamic
equilibrium between gaseous and particle phases. The particulate
matter emitted directly by aircraft is mostly composed of soot (e.g.,
Anderson et al., 2005; Timko et al., 2010b), while sulphate and
semi-volatile hydrocarbons may further coat the particles after the
plume dilution. However, aircraft PM may also contain traces of
metals and ions, which are mainly the result of: (i) fuel impurities;
(ii) corrosion and wear of mechanical components of engines; (iii)
pre-existing PM drawn in the combustor. The following sub-
subsections discuss the various components separately.
4.14.1. Carbonaceous PM
Carbonaceous PM consists of a complex mixture of elemental
carbon (EC) and organic carbon (OC) (jointly referred to as soot) and
commonly accounts for a large fraction of ambient fine particle
mass in both rural and urban environments. Soot is primarily
generated by incomplete combustion processes through the py-
rolysis of organic fuels used in combustion processes. Many studies
have discussed the various types of such particles; however there
are still controversies and open discussion about the terminology to
adopt. The terms used to identify the various fractions of carbo-
naceous aerosols, such as soot, black carbon (BC), elemental carbon
(EC), equivalent black carbon and refractory black carbon are
mainly associated with the corresponding measurement methods
(e.g., P€oschl, 2003; Andreae and Gelencs#er, 2006; Bond and
Bergstrom, 2006; Kondo et al., 2011; Buseck et al., 2012; Long
et al., 2013; Novakov and Rosen, 2013) and more generally refer
to the most refractory and light-absorbing component of carbo-
naceous combustion particles, even if the underlying definitions
and measurement methods are different (Petzold et al., 2013).
Without going into the merits of this discussion, this section pro-
vides an overview of the data concerning the carbonaceous fraction
and the terms used (soot, BC and EC) are the same as reported by
the original authors. In any case, Lee et al. (2010) indicated that BC
is often used interchangeably with soot in the literature relating to
aircraft emissions, although in the strictest sense they are different.
The airliners of 1960s and 1970s emitted visible and dark
exhaust plumes, especially during take-off. In recent decades, a
great effort has beenmade bymost enginemanufacturers to reduce
such emissions, which consisted mainly of soot and organics, and
M. Masiol, R.M. Harrison / Atmospheric Environment 95 (2014) 409e455 441
nowadays most modern airliners do not emit visible plumes.
However, soot is still the primary form of non-volatile PM emitted
by jet engines (e.g., Timko et al., 2010b), even if its contribution
represents only few percent of the global atmospheric BC emission
(Hendricks et al., 2004).
From a morphological point of view, soot particles emitted by
aircraft engines have nearly spherical shapes with lognormal size
distributions peaking at 30e60 nm (Petzold et al., 2003, 2005a;
Popovicheva et al., 2004). However, once emitted soot particles
quickly build complex agglomerates causing a second mode of
larger particles between 100 and 500 nm, which are totally amor-
phous (Petzold et al., 1998; Popovitcheva et al., 2000, 2004;
Demirdjian et al., 2007). Despite the structural characteristics of
soot being of primary importance in relation to its atmospheric
properties, there is a lack of experimental data on microstructure,
composition and hygroscopicity of original soot emitted from
aircraft engines. Some studies conducted at cruise height (K€archer
et al., 1996; Gleitsmann and Zellner,1998) have assumed that all the
soot particles in exhausts are hydrophobic. Demirdjian et al. (2007)
used a combination of several analytical methods to study the
microstructure and the composition of soot agglomerates sampled
in an aircraft engine combustor and reported that soot was in two
main fractions having quite different physicochemical properties. A
major fraction of particles was found to be made up of amorphous
carbon with small amounts of oxygen, sulphur and iron and was
rather hydrophobic, while a second fraction was characterised by
various structures and a large amount of impurities and was highly
hydrophilic. Vander Wal et al. (2010) compared the physical
structure and the chemical composition of soot produced by
different sources, including a modern TF engine, using high reso-
lution transmission electron microscopy and X-ray photoelectron
spectroscopy. The results showed that some physical characteristics
of jet engine soot, such as the lamella length distributions, are in-
termediate between soot produced by other sources such as wild-
fires and diesel, while other characteristics are singular. Jet soot was
reported to have the highest sp3 carbon content, in fact higher than
the sp2 (graphitic) content, the greatest oxygen content in the form
of phenolic and carbonyl groups and the widest range of hetero-
elements, including S, Na, N, Zn, Ba.
From a chemical point of view, soot is mainly made up of
graphitic BC (Petzold et al., 1999; Popovicheva et al., 2004), but
some particles can be also coated with organic materials and
sulphur species (e.g., Petzold et al., 2003). For example, the hy-
groscopic properties of jet engine combustion particles have been
investigated in several rig-tests and results have confirmed that the
water uptake by combustion particles is generally independent of
combustor operating conditions, but increases significantly with
increasing FSC level, which is attributed to an increasing amount of
sulphuric acid adsorbed on the particles (Gysel et al., 2003). The
uptake of sulphuric acid and organics seems to be enhanced by the
surface irregularities in the soot. The typical fractal agglomerate
structure of soot may offer a large specific surface area for
adsorption and chemical reactions (Popovitcheva et al., 2000).
Recently, Loukhovitskaya et al. (2013) also investigated the uptake
of HNO3 on aviation soot.
The EIs of elemental and organic carbon were investigated
during APEX campaigns (Kinsey, 2009; Onasch et al., 2009): results
showed that EC ranged from 21 to 98mg kg Fuel#1 and OC between
37 and 83 mg kg Fuel#1. Most studies indicated that BC emissions
are a function of engine thrust settings (Anderson et al., 2005; Wey
et al., 2007; Kinsey, 2009; Kinsey et al., 2011), but are nearly in-
dependent of FSC (e.g., Wilson et al., 2004; Kinsey, 2009). During
the EXCAVATE campaign, Anderson et al. (2005) concluded that
black carbon emission indices increase significantly from idle to
cruise power. These findings are also consistent with the results of
the APEX campaigns: Wey et al. (2007) and Kinsey et al. (2011)
reported that BC emissions are minimum at low power and in-
crease with thrust settings, reaching values more than
0.3 g kg Fuel#1 at power levels higher than 85% F00 and dominating
the total mass emissions. Agrawal et al. (2008) reported that the
carbonaceous PM composition (EC þ OC mass) significantly in-
creases with power and shifts from OC-rich at idle to EC-rich with
rising thrust regimes. Similar findings were observed by Petzold
and Schr€oder (1998), who indicated that the ratio of BC to total
carbon ranged from 11% at idle to >80% at take-off thrust. This
result is predictable when considering that the highest emissions of
hydrocarbons occur at low power. Presto et al. (2011) recently
investigated both the elemental carbon and the organic aerosol
emitted by a CFM56-series engine at varying thrust settings after
the exhaust using a smog chamber. Their findings confirmed the U-
shaped curves of PM emissions versus thrust commonly reported in
the literature, but also added new important knowledge on the
relative contributes of EC and OA. At low power (4%e7% F00), most
PM is composed of OA, while at 30% thrust very low emissions of
both elemental and organic components were observed. At climb
power (85%), an abrupt increase of EI(PM) occurred, mainly driven
by EC, which accounted for about two thirds of the total PM.
The chemical characterisation of the organic component of the
PM indicated that over 70% of the particle-phase organic com-
pounds are made up of SVOC compounds in the n-alkane (mainly
C23 to C33), PAH, and sterane/hopane compound classes (Kinsey
et al., 2011). Besides the lighter PAHs, which mainly partition in
the gaseous phase, the heavier congeners are principally in the
particulate phase and generally also have the highest carcinogenic
and mutagenic potencies (Delgado-Saborit et al., 2011). Hu et al.
(2009) studied the effect of aircraft movements at a site located
100 m downwind of the regional airport of Santa Monica and re-
ported spikes in concentration of particle-bound PAHs occurring
during jet take-offs (440 ng m#3, i.e. 90 times the local background
levels), however they did not detect significantly higher average
levels of PAHs at airports. It is interesting to note that PAH emis-
sions at airports may also undergo local deposition. In a study
carried out at Delhi International Airport, Ray et al. (2008) observed
that PAH contamination in the <2 mm surface soil layer reached
maximum levels at a site near the landing area. The presence of
PM-bound hopanes and steranes is also intriguing because these
compounds are present in crude oil and are also largely used as
molecular markers of vehicle emissions (e.g., Zielinska et al., 2004;
Kam et al., 2012). Additional insights are therefore necessary for the
characterisation of these organic compounds, which can derive
either from the unburned fuel or from the emission of lubricating
oils, which was hypothesised to have an important role in the mass
of organic PM (Yu et al., 2010).
The emission of carbonaceous PM was also reported in further
studies conducted at airports. For example, Dodson et al. (2009)
performed continuous BC measurements at five monitoring sites in
close proximity to a small regional airport inWarwick, Rhode Island.
By coupling BC data with real-time flight activities (departures and
arrivals) and meteorological data, they reported that aircraft de-
partures and arrivals (and other sources coincident in space and
time) contribute approximately 24e28% of the total BC concentra-
tions. Further, they also indicated that aircraft take-off makes a
greater contribution to BC levels than landing. Hu et al. (2009)
studied the effect of aircraft movements in a neighbourhood adja-
cent to the regional airport of Santa Monica and generally did not
observe elevated average levels of BC, although spikes in concen-
tration of this pollutant were observed associated with jet take-offs.
At a site located 100mdownwind of the take-off area, jet departures
resulted in short time (60 s) peaks with average concentrations of up
to 30 mg m#3, i.e. 100 times elevated above the local background.
M. Masiol, R.M. Harrison / Atmospheric Environment 95 (2014) 409e455442
4.14.2. The smoke number (SN)
Despite soot corresponding to the majority of the non-volatile
mass of PM emitted by aircraft, this component is not directly
certified by ICAO. However, the ICAO databank requires that an
exhaust opacity metric called the smoke number (SN) is measured
for TF engines. SN was defined as a “dimensionless term quanti-
fying smoke emission level based upon the staining of a filter by the
reference mass of exhaust gas sample and rated on a scale of
0e100” (ICAO, 2008). SNwas firstly collected on a filter by flowing a
defined volume of the exhaust gas (12e21 kg of exhaust gas per
squaremetre of filter) by a sample probe positioned directly behind
the engine nozzle and inside the exhaust jet. The degree of atten-
uation of the filter before and after the sampling was thus
measured using a reflectometer, and the SN was computed as:
SN ¼ 100$&
1# Rf
.
R0
(
where R0 and Rf are the absolute reflectance of the filter before and
after the sampling, respectively. Unfortunately, SN gives only a
qualitative estimate of particle emission and was recognised to be
dependent on sampling conditions, soot characteristics and
morphology, and therefore was assumed to have little value for
estimating atmospheric impacts (Anderson et al., 2005). Moreover,
it was reported that particles with a diameter less than 300 nm
passed through the filter and therefore only the larger particles are
collected resulting in a relative weak accuracy of measurement
(Kugele et al., 2005).
Several studies have attempted to correlate SN to BC mass
concentration (e.g., Champagne, 1971; Whyte, 1982; Girling et al.,
1990; Petzold and D€opelheuer, 1998; Wayson et al., 2009; Peck
et al., 2013; Stettler et al., 2013a,b) and today an interim method-
ology named first-order approximation 3.0 (FOA3) was developed
and used to estimate BC mass emissions normalised by fuel burn
EI(BC) from SN (Wayson et al., 2009). Although this calculationwas
reported to be dependent upon the mode-specific SN recorded in
the engine databank (e.g., Stettler et al., 2011), recently Stettler et al.
(2013b) observed that the correlation between BC and SN depends
on the particle size distribution and that the methods suggested to
convert SN to BC could lead to heavy underestimations of BC con-
centrations. An alternative method independent of the SN (FOX)
was also recently developed and first studies reported an improved
estimation of BC (Stettler et al., 2013a), but it needs to be further
tested. To fill this gap, recently a group of experts was called to
define new standard procedures for BC measurement at ground
level for regulatory purposes (SAE, 2009). In the absence of defined
standards, the scientific literature offers a number of studies on the
emission of soot, BC and EC.
4.14.3. Inorganic ions
The analysis of the major inorganic ions in aircraft exhaust has a
clear dependence on the adopted sampling methodology and can
be affected by many artefacts. As for most hydrocarbons, ions may
undergo gas-to-particle partitioning and some species may further
derive from chemical reactions in the atmosphere or on the filter
surface. For example, the concentrations of aerosol nitrate can be
affected by the adsorption of nitric acid gas on pre-existing parti-
cles, while evaporative losses occur at temperatures >20 %C and the
exhaust plumes largely exceed this temperature. In addition, sul-
phate may form quickly due to the oxidation of SO2, coating soot
particles. In view of this, Anderson et al. (2005) firstly reported that
the concentration of sulphate aerosol rose considerably as sampling
was performed progressively downstream of the engine, suggest-
ing that sulphate particles may originate or undergo rapid growth
within aircraft exhaust plumes. These findings were further
confirmed by APEX campaigns. Agrawal et al. (2008) noted that the
mass of the ions collected at 1 m from the engine exit plane were
below the detection limit for most ions, while only sulphate was
detectable. On the contrary, APEX samplings at 30 m reported
EI(ions) in the range of 30e40 mg kg Fuel#1 dominated by sulphate
(53%e72% of the total ion EIs) and ammonium (Kinsey et al., 2011).
In summary, there is a lack of data on the ionic component of
exhaust emissions of aircraft and this merits further investigation.
4.14.4. Elemental composition
There is a severe shortage of data on the elemental composition
of PM emitted by aircraft. Kinsey et al. (2011) reported that PM2.5
emissions are composed of various trace elements mainly origi-
nating from fuels, lubricating oils, engine wear and corrosion,
although release from the sampling line and fugitive dust may
contribute to the total load. During the APEX campaigns, the
elemental composition of PM emitted from aircraft engines was
analysed for a number of different aircraft engines. The total
elemental emissions (sum of Mg, Si, P, S, Cl, K, Ca, Ti, Cr, Mn, Fe, Ni,
Cu, Zn, Br, Ag, In, Sb, Te, I, Tl) were in the range of
6.3e27.5 mg elements kg Fuel#1, corresponding to 2e7% of the total
emitted PM and were dominated by sulphur (54%e80% of total
element mass) (Kinsey, 2009; Kinsey et al., 2011). As expected,
sulphur was well correlated with sulphate and most of the sulphur
on the filter exists as sulphate (Agrawal et al., 2008). Moreover, the
variability in the metal emissions was observed to be much greater
between different engines than between engine thrust settings
(Agrawal et al., 2008).
Recently, Mazaheri et al. (2013) investigated the physical and
chemical characteristics of individual particles collected in the ex-
hausts of in-use aircraft during landing and takeoff by using
transmissionmicroscopy and energy dispersive X-ray spectroscopy.
They reported that most of the measured particles have a spherical
shape in the nucleation mode (18#20 nm) and only contain C, O, S,
Cl, and in some cases K. They also reported fewer particles having a
more irregular shape resulting in a larger average aspect ratio and a
much greater and diverse range of elements. While the small
spherical particles have been linked to the combustion processes of
engines, the latter irregular particles have been linked to a diverse
range of sources, including tyre wear, fine dusts, vehicular traffic,
and possibly engine wear.
4.14.5. Secondary aerosol
Despite the potential role of aircraft emissions in forming SIA
and SOA, there is a lack of information on the chain of processes
affecting aircraft emissions once emitted in ambient air. A recent
study byMiracolo et al. (2011) used a smog chamber to simulate the
aging of the particulate matter emitted from a TF engine under
typical (summertime) atmospheric conditions. Their findings
pointed out the key role of the photo-oxidation processes in
forming both SIA and SOA. They reported that after several hours of
photo-oxidation, the ratio of secondary-to primary PMmass was on
average 35 ± 4.1, 17 ± 2.5, 60 ± 2.2 and 2.7 ± 1.1 for increasing
thrusts settings (4%, 7%, 30% and 85% F00, respectively). Miracolo
et al. (2011) also observed that SOA dominates the secondary PM
at low thrust, while secondary sulphate becomes the main sec-
ondary component at higher power.
It is not clear if aircraft emissions can influence the amount of
secondary aerosol on a large scale. In this regard, a recent study by
Woody and Arunachalam (2013) used the Community Multiscale
Air Quality (CMAQ) model to investigate the impacts of aircraft
emissions on SOA at the Hartsfield-Jackson Atlanta International
Airport. By applying the model at various spatial resolutions, they
reported that aircraft emissions reduced SOA by ~6% at 36 and 12-
km due to the chemistry of the free radicals with aircraft NOx, while
M. Masiol, R.M. Harrison / Atmospheric Environment 95 (2014) 409e455 443
at smaller resolution the interaction between the aircraft emissions
and external biogenic SOA precursors enhanced SOA (~12%).
5. Aircraft non-exhaust emissions
Although the vast majority of studies have focussed upon the
exhaust emissions from engines, there are other aircraft-related
emissions that may influence the air quality within an airport.
These include emissions from the power units, i.e. APUs and GPUs,
primary particles from tyre erosion and brake wear, oil leaks and
corrosion of aluminium alloys, all of which have been recognised to
impact air quality near airports but at date have received only
limited consideration.
5.1. Tyre, brake and runway surface wear
Tyre and brake wear during landing and runway dust re-
suspension have been estimated to be major sources of particu-
late matter. This is expected as smoke is clearly visible to the naked
eye when aircraft wheels contact the ground and spin up to the
landing velocity. Despite that, the proportion of the mass lost from
aircraft tyres and brakes that becomes suspended as fine PM has
not been extensively studied; the few available data indicate that
the rubber lost from tyre wear can vary from few grams to ~0.8 kg
per landing (Morris, 2006; Bennett et al., 2011 and references
therein). Particulate emissions from tyres have been suggested to
be dependent upon the maximum take-off weight, but other fac-
tors may have a role in the rubber wear, e.g., number of wheels,
weather conditions, engine type, airport runway length and
taxiway layout and operating procedures (Morris, 2006). The sub-
sequent activation of brakes to bring the aircraft to a stop may
further abrade brake lining material from discs and pads and may
release fine particles as for road vehicles (e.g., Pant and Harrison,
2013). From a physicochemical point of view, it is plausible that
brake wear includes both the emission of material from the abra-
sion of discs and the volatilisation and condensation of brake pad
materials, while soot may arise from the thermal degradation of
tyre polymers. This was confirmed by experimental data collected
at a major European airport: Amato et al. (2010) reported unusually
high levels of both organic carbon and metals possibly sourced
from tyre detritus/smoke in runway dust (Ba, Zn, Mo) and from
brake dust in ambient PM10 (Cu, Sb). In addition to tyre and brake
wear, landing field wear and re-suspension can also occur, as
usually aircraft land on a runway generally constructed of asphalt,
concrete, gravel or grass.
For example, studies at Gatwick airport estimated that tyre and
brake wear are dominant sources of PM10, accounting about 22 and
4.5 tonnes y#1, respectively, i.e. about 60% and 12% of all aircraft-
related emissions, respectively (British Airports Authority, 2006).
However, these emissions are subject to large uncertainties as they
are dependent on many factors, including speed at landing, some
aircraft characteristics (weight, number of wheels, brake material if
carbon or steel) and runway characteristics (length, weather con-
ditions) (Underwood et al., 2004).
Bennett et al. (2011) collected landing and braking dust samples
from the undercarriage (oleo legs) and wheel hubs of aircraft and
reported that they have bimodal distributions, with peaks at
aerodynamic diameters of about 10 and 50 mm. A further SEM-EDS
analysis has revealed that particles may contain various materials
embedded in a carbonaceous substrate: (i) soot arising from the
burning of the tyre rubber, from the asphalt tar or from brake
abrasion; (ii) runway dust mainly composed of typical crustal ma-
terials (quartz and feldspar particles) which are lifted mechanically
from the ground surface; (iii) small droplet (35 mm) of Fe, associated
with Co and other transition metals (Mn, Ni, V, Zn) which are
commonly found in asphalt concrete and (iv) irregular Fe particles
(<10 mm). This study also reported that aluminium, which is typi-
cally used as tracer for crustal materials from runwaywear, can also
derive from Al hydroxide included in some tyre formulations.
5.2. Other mechanical components
High-strength aluminium alloys are commonly used as the
aircraft fuselage materials in the body and wings, while minor
amounts of other elements (Cu, Zn, Mg) may be also present in
various airframe components (Wei et al., 1998). Aluminium alloys
have a microstructure that can be highly susceptible to intergran-
ular and pitting corrosion, and weathering is recognised as a major
cause of structural damage to aircraft structure and coatings
(Usmani and Donley, 2002; Russo et al., 2009: Knight et al., 2011),
along with long term operations (Ostash et al., 2006), runway de-
icing chemicals (Huttunen-Saarivirta et al., 2011) and atmo-
spheric pollution and salts (Cole and Paterson, 2009). The degra-
dation of aircraft mechanical components is also connected with
mechanical, and corrosion-mechanical (macrocracks) defects,
which lead to a decrease in its load-bearing capacity (Ostash et al.,
2006). Corrosion has many forms and affects most structural alloys
found in airframes: of particular importance is pitting and inter-
granular corrosion, which can develop into fatigue cracks, stress
corrosion cracks or exfoliation (Liao et al., 2008). In this light, it is
plausible that corrosion and mechanical stress of some aircraft
components may release metallic particles into the environment.
For example, using scanning electron microscopy techniques,
Amato et al. (2010) founded the relatively common presence of
platy aluminous particles derived from airframe corrosion in the
ambient PM10 samples collected near the El Prat airport in
Barcelona.
5.3. Oil leaks
In addition to exhaust from jet fuel combustion, oil escaping or
burning from lubricated parts may be vented overboard from
aircraft engines and therefore may further contribute to the total
emissions of aircraft (Onasch et al., 2009; Timko et al., 2010b; Yu
et al., 2010, 2012). Aircraft lubricating oils are usually composed
of a mixture of synthetic C5eC10 fatty acid esters of pentaerythritol
and dipentaerythritol with specialised additives (Yu et al., 2010,
2012). Some of these, such as tricresyl phosphate, are recognised
as toxic to humans (Craig and Barth, 1999; Van Netten, 1999;
Winder and Balouet, 2002: Marsillach et al., 2011) and have been
detected in ambient air and aircraft cabins, posing a risk for aviation
technicians, loaders, crew and passengers in case of release into the
environment (e.g., Solbu et al., 2010; Liyasova et al., 2011; Denola
et al., 2011; Schindler et al., 2013). Yu et al. (2010) reported that
the degree of degradation of lubrication oil during aircraft engine
operations as a result of friction and/or pyrolysis might be negli-
gible, suggesting that most emitted oil is unburned. Because of its
low volatility, unburned lubricating oil may exit from engines as
vapour or submicrometre droplets and may further condense and
add mass to the organic PM in the wake of the aircraft. Results of
exhaust characterisation measurements suggest that the contri-
bution of lubrication system releases to the organic PM may be
greater than the engine exhaust (Timko et al., 2010b): they esti-
mated that the contribution of oil leaks to the total mass of organics
generally lies within the range 10e20% for low thrust and 50% for
high thrust settings. A recent study (Yu et al., 2012) has identified
and quantified the lubricating oil in the particulate matter emis-
sions from various engines of in-service commercial aircraft at two
airports. This study used the characteristic mass marker of lubri-
cating oil (ion fragment intensity between m/z ¼ 85 and 71) to
M. Masiol, R.M. Harrison / Atmospheric Environment 95 (2014) 409e455444
distinguish lubricating oil from jet engine combustion products.
Results revealed that lubricating oil is commonly present in organic
PM emissions in association with emitted soot particles, unlike the
purely oil droplets observed at the lubrication system vent. The
contribution from lubricating oil in aircraft plumes was observed to
vary from 5% to 100% in measured aircraft plumes.
Yu et al. (2010) measured the size distributions of sub-
micrometre unburned lubricant oil released from engines with C-
TOF-AMS and UHSAS and reported a shift to larger sizes with
increasing power. At idle thrust they observed a C-TOF-AMS vac-
uum aerodynamic diameter (Dva) of 260 ± 3 nm, while the UHSAS
volume equivalent diameter (Dve) was 281± 9 nm. At higher engine
power, they observed modes at 272 ± 4 nm and 350 ± 8 nm for C-
TOF-AMS and UHSAS, respectively.
6. Other airport-related emissions
Apart from aircraft exhaust and non-exhaust emissions, other
sources can be present within an airport and can contribute to the
total pollutant load in the atmosphere. Among others, the emis-
sions of the power units providing power to the aircraft (APUs and
GPUs), the GSEs, additional sources on the modern terminals,
intermodal transportation systems and road traffic are further
considered as impacting upon the air quality and must be taken in
account in airport emission measurements.
6.1. Auxiliary and ground power units
The APUs are small on-board gas-turbine engines burning jet
fuel coupled with an electrical generator capable of supplying
electrical power to aircraft systems when required on the ground or
providing pneumatic or hydraulic power to start the main engines.
Despite APUs being installed in all modern airliners so as to be
energetically independent, their use is becoming less significant
over time due to the increasing trend toward mains supplied
ground power units (GPU) (Mazaheri et al., 2011). This ground
equipment is supplied by the airports and includes diesel powered
tugs of various types, ground carts, and also APUs installed on
ground carts (e.g., Kinsey et al., 2012b). Some airports also provide
electrical power to the aircraft by connecting directly to the ground
network and by using fixed ground electrical power (FGEP) units.
This system avoids the use of fuelled power units, with a subse-
quent reduction in local emissions and is thus very useful in air-
ports not complying with air quality standards.
The role of the APUs on the air quality at airports is nowadays
widely discussed and an increasing number of studies have esti-
mated their contribution. However, the results are often conflicting.
Sch€afer et al. (2003) indicated that APU emissions at airport service
buildings cannot be neglected in comparison to the main engine
emissions. The emission inventory of the airport of Zurich in 2004
(Fleuti and Hofmann, 2005) reported that although the aircraft
exhaust accounted for most of CO, hydrocarbons and NOx (89%, 45%,
82%, respectively of total emissions), a significant percent was from
APUs, GPUs, start-up-idle, handling/GSE, airside traffic and sta-
tionary sources, with APUs accounting for about half of the total
non-aircraft engine emissions. HAL (2011) reported that 19% of the
total NOx emissions of London Heathrow airport are due to the use
of APUs. A survey over 325 airports in the USA (Ratliff et al., 2009)
estimated the emissions from APUs and LTO cycles and stated that
the greatest percentage that APUs contributed to total aircraft
emissions was 10e15% for CO and between 15 and 30% for NOx and
SOx. However, this study also reported that the airports used by a
higher percentage of small and business jets tend to be affected by
higher emissions from the APUs. Stettler et al. (2011) estimated that
APUs contribute 6% to total PM2.5 emissions at major UK airports.
The effect of the APUs upon public health was recently estimated by
Yim et al. (2013), who calculated the emissions from aircraft LTO
activity, aircraft APUs and GSE at the top 20 UK airports, ranked by
passenger numbers. Their findings concluded that the ban on the
use of APUs would prevent about 11 averted early deaths per year
(90% confidence interval 7e16).
Unlike aircraft engines, APU emissions are not certificated by
ICAO, and the manufacturers generally consider information on
APU emissions rates as proprietary (ICAO, 2011), therefore there are
today few data available on APU emissions. Emissions from APU
depend on many factors and are subject to change through provi-
sion of GPU facilities from the airport. Some airports have imple-
mented policies to encourage the use of the GPU instead of APUs
(Mazaheri et al., 2011 and reference therein), however in the
absence of GPU availability, the use of APUs is still the only alter-
native to provide the energy for aircraft operations with engines off
and for the ignition of the engines. The first studies of APU emis-
sions started in the 1970s by the US Army (Kinsey et al., 2012b and
references therein) and our literature search has found very few
data in comparison to those on the jet engine emissions. However,
the main studies reporting (or reprocessing) data on the APU
emissions are increasing nowadays (Slogar and Holder, 1976;
Williams and Lee, 1985; Gerstle et al., 1999, 2002; Wade, 2002;
O'Brien and Wade, 2003; Sch€afer et al., 2003; Watterson et al.,
2004; EASA, 2011; Anderson et al., 2011; Blakey et al., 2011;
Kinsey et al., 2012b; Williams et al., 2012).
6.2. Ground service equipment emissions, vehicular traffic and
other sources
As they are strictly linked to the airport operations, the amount
of GSE vehicles clearly reflects the airport layout and traffic in terms
of both cargo and passengers. Moreover, the operation duration is
expected to increase with increasing aircraft size. Other factors
include the type of engines installed and the quality of fuels used
and the status of the vehicle fleet (age, wear and tear). Therefore, it
is not possible to identify the unique characteristics common to all
the airports and ICAO databanks not include any information about
GSE emissions. Similarly, the amount of road traffic in the form of
private cars, taxis, shuttle bus and trucks for transporting people
and goods in and out to the airport depends on the airport layout,
on the quality of the road links and intermodal transport systems
and, finally, is directly related to the number of passengers and
goods that the airport handles. As both the airport-induced
vehicular traffic and most of the GSEs have gasoline or diesel en-
gines, it is reasonable to consider them as common traffic. The
traffic source is recognised to be dominant in many urban envi-
ronments. Its chemical and physical characteristics are reported
elsewhere, in a large number of studies and reviews (e.g., Hueglin
et al., 2006; Thorpe and Harrison, 2008; Johansson et al., 2009;
Gietl et al., 2010; Kumar et al., 2011; Harrison et al., 2012; Pant
and Harrison, 2013; Amato et al., 2013).
Some studies have indicated that GSE may contribute a major
fraction of the total AEs. For example, a study carried out at the
McCarran airport in Las Vegas reported that approximately 60% of
the total airport emissions are related to GSE (Nambisan et al.,
2000). Schürmann et al. (2007) calculated that NO concentrations
at Zurich airport were dominated by emissions from ground sup-
port vehicles, while Unal et al. (2005) estimated that the impacts on
ozone and PM2.5 of GSE at the HartsfieldeJackson Atlanta Inter-
national airport are small compared to the aircraft impacts. In
addition, other miscellaneous sources may be also present at air-
ports and may further increase the total pollutant load, including
maintenance work, heating facilities, fugitive vapours from refu-
elling operations, kitchens and restaurants for passengers and
M. Masiol, R.M. Harrison / Atmospheric Environment 95 (2014) 409e455 445
operators, etc. Despite being intermittent and depending on the
airport layout, these emissions may be dominant in certain cir-
cumstances. For example, Amato et al. (2010) reported that the
local construction work for a new airport terminal in a major Eu-
ropean airport (El Prat, Barcelona) was an important contributor to
PM10 crustal dust levels along with road dust and aircraft re-
suspension, with a clear drop during the weekends.
7. Airport emissions and public health
While aircraft emissions at cruising altitudes are an air pollution
issue at global scale (Barrett et al., 2010; Koo et al., 2013), the
emissions within the planetary boundary layer due to the LTO op-
erations are certainly more local and it is plausible to believe they
may have a more direct effect on human health. Nevertheless, the
potential subsidence of air masses due to the Ferrell and Hadley
circulations, which may displace high altitude emissions toward
the ground cannot be disregarded (Barrett et al., 2010).
Air quality degradation in the locality of airports is considered
by some to pose a real public health hazard (Barrett et al., 2013) and
some recent estimates of the aviation contribution to premature
mortality have been reported (e.g., Ratliff et al., 2009; Levy et al.,
2012; Ashok et al., 2013; Yim et al., 2013). Although at the cur-
rent time, no specific target toxic compound has been identified to
be used as a marker or indicator for human exposure to jet engine
fuels and their combustion products (Tesseraux, 2004), it has been
estimated that over 2 million civilian and military personnel per
year are occupationally exposed to jet fuels and exhaust gases (Pleil
et al., 2000; Ritchie, 2003; Cavallo et al., 2006). Kerosene-based
fuels have the potential to cause acute or persistent neurotoxic
effects from acute, sub-chronic, or chronic exposure of humans or
animals (Ritchie et al., 2001), although evidence is lacking that
current levels of exposure are harmful. Occupational exposure can
occur by dermal, respiratory or oral ingestion routes of raw fuel,
vapour, aerosol or exhausts. It has been postulated that chronic
exposure to vapours and exhaust fumes could affect the operators
inside the airport (Cavallo et al., 2006) and aircraft crew (Denola
et al., 2011; Schindler et al., 2013), while occasional exposure can
affect all passengers in transit (Liyasova et al., 2011). In addition,
also the population living in the vicinity of airports can be exposed
(Jung et al., 2011).
However, the impact of LTO emissions on surface air quality and
human health is poorly quantified (Barrett et al., 2010) even though
most governments have recently focused attention on manage-
ment and reduction the environmental impacts of aviation. Some
studies have attempted to estimate the direct and indirect effects of
aviation to support environmental policy assessments and to
evaluate many possible future scenarios. A global-scale study by
Barrett et al. (2010) estimated that ~8000 premature deaths per
year can be attributed to aircraft emissions at cruising altitudes,
representing ~80% of the total impact of aviation (including LTO
emissions) and ~1% of air quality-related premature mortalities
from all sources.
A series of more local studies have been conducted to assess the
impact of AEs on human health. Generally the results have high-
lighted the potential adverse effects of AEs on public health and
also revealed the need for more extensive information about this
source. Three estimates were given for US airports in 2005: Ratliff
et al. (2009) analysed aircraft LTO emissions at 325 US airports
with commercial activity and estimated that 160 (90% confidence
interval 64e270) premature deaths occurred due to ambient par-
ticulate matter exposure attributable to the aircraft emissions; Levy
et al. (2012) estimated about 75 early deaths using activity data
from 99 US airports; Ashok et al. (2013) estimated that aviation LTO
emissions caused about 195 (90% confidence interval 80e340) early
deaths, while the same emissions were forecast to cause ~350 (90%
confidence interval 145e610) deaths in 2018. Arunachalam et al.
(2011) used the Community Multiscale Air Quality model (CMAQ)
to estimate the incremental contribution to PM2.5 due to com-
mercial aviation emissions during LTO cycles in two major and one
mid-sized US airport and reported that 8e9, 11e15 and 5
(depending on model resolution) premature deaths per year can be
estimated for Atlanta, Chicago and Providence airports, respec-
tively. In Europe, Yim et al. (2013) estimated that 110 (90% CI:
72e160) early deaths occur in the UK each year (based on 2005
data) due to airport emissions. The same study also assessed that up
to 65% of the health impacts of UK airports could be mitigated by
replacing current fuel with low FSC fuel, by electrifying GSE,
avoiding use of APUs and use of a single engine during the taxi
phase. Lin et al. (2008) estimated that residents living within five
miles of Rochester and La Guardia airports are affected by an
increased relative risk of hospital admission of 1.47 and 1.38
respectively compared to resident living>5miles distant. Jung et al.
(2011) characterised the levels of BTEX in the vicinity of the
Teterboro airport, New York/New Jersey metropolitan area, by
exposing passive samplers for 48 h at the end of airport runways, in
households close to the airport and out-of-neighbourhood loca-
tions. Results indicated that the average concentrations of benzene,
toluene, ethylbenzene, m-/p-xylenes and o-xylene in neighbour-
hood concentrations (0.8, 3.8, 0.4, 1.2 and 0.4 mg m#3, each BTEX
respectively) were not significantly different to those measured at
the airport runways (0.8, 3.2, 0.3, 1, and 0.3 mg m#3, respectively)
and higher than the out-of-neighbourhood locations (0.5, 1.1, 0.2,
0.8, and 0.4 mgm#3, respectively). Cavallo et al. (2006) characterised
the exposure to PAHs in airport personnel and evaluated the gen-
otoxic and oxidative effects in comparison with a selected control
group. They analysed 23 PAHs collected fromvarious areas over five
working days and urinary 1-hydroxypyrene (1-OHP) following five
working days as a biomarker of exposure. They reported an in-
duction of sister chromatid exchange due to PAH exposure,
although its health significance was not quantified.
8. Conclusions
The main goal of this review is to give an overview on the cur-
rent state of knowledge of airport-related emissions and to sum-
marise the key characteristics of pollution and the impacts on local
and global air quality. After thoroughly reviewing the latest avail-
able scientific literature, it can be concluded that the currently
available information on the impact of AEs upon air quality is
inadequate and the consequences of future growth in the volume of
air traffic are very hard to predict. Most work has focussed upon
aircraft engine exhaust during LTO cycles which accounts for a large
proportion of the total emitted pollutants. However other sources
such as the auxiliary power units, vehicular traffic and ground
service equipment are known sources that may seriously affect air
quality near to airports. In this way, it is apparent from the litera-
ture that while aircraft exhaust may account for most of the
pollution at some airports, there are other sources that need to be
addressed in more detail in the future, such as:
! tyre, brake, asphalt wear and the re-suspension of particles due
to the turbulence created by aircraft movements;
! the emissions from the units providing power to the aircraft
when required on the ground (APUs and GPUs);
! the ground support equipment that an airport offers as a service
for flights and passengers, including passenger buses, baggage
and food carts, container loaders, refilling trucks, cleaning, lav-
atory servicing and de/anti-icing vehicles, and tugs;
M. Masiol, R.M. Harrison / Atmospheric Environment 95 (2014) 409e455446
! the effects of the intermodal transportation systems, and road
traffic for transporting people and goods in and out to the
airport.
Most studies report that airport operations are responsible for
significant emissions of a series of non-volatile, gaseous and semi-
volatile species. Non-volatile emissions are made up of refractory
material such as soot, which is emitted as PM even at high tem-
peratures, but is also comprised of many organics and sulphur
compounds, the latter mainly in the form of sulphate. Volatile
emissions include compounds that exist as vapour at the engine
exit plane and are made up of gaseous and vapour-phase pollut-
ants, such as CO, NOx, SO2 and many organics (i.e. aromatics, al-
kanes, alkenes and a number of other VOCs). The less volatile
fraction is of especial interest as it can react in the atmosphere and
undergo gas-to-particle conversion by forming new particles or
condensing on pre-existing ones.
The volatile emissions have mostly been fairly well charac-
terised, but a comprehensive chemical speciation of the hydrocar-
bons and complete knowledge of their chemical processing in the
atmosphere is still lacking. Detailed information on the non-
volatile and semi-volatile compounds is also scarce. In spite of
the increasing attention given to AEs, many issues remain unad-
dressed and represent a serious gap on which scientific research
should focus. A list of the key characteristics of AEs that need to be
carefully addressed should include:
! a careful quantification of sulphuric acid, HONO and HNO3
directly emitted by aircraft for a large variety of engines.
Currently available data refer only to few engine types and the
changes of EI at varying thrusts are not completely clear. This
should also include seeking a better knowledge of the charac-
teristics and the evolution of emitted chemi-ions and a better
understanding of their role as a source of sulphur and nitrogen
species in plumes;
! a more realistic quantification of emission inventories for ni-
trogen oxides and organic compounds, which includes the
variability induced by the common practices of take-off and taxi
phases at reduced thrust;
! quantification of the effects of ozone-precursors emitted from
aircraft and other AEs on the levels of ground-level ozone at
airports, which to date have not been thoroughly investigated.
In particular, since well established atmospheric photochemical
reactions of many VOCs are known as potential sources of
elevated ozone concentrations in the troposphere, improved
chemical speciation of organic compounds is much needed.
Better apportionment of ozone formation potential from aircraft
emissions during LTO cycles and from other AEs should be also
estimated;
! standardisation of procedures for measurement of engine
exhaust at ground level for regulatory purposes, which appear
to be lacking mainly for PM and speciated hydrocarbon emis-
sions. Such methodologies should take into account the semi-
volatile components, which have been recognised to make a
major contribution to the total mass of emitted PM. Achieve-
ment of this objective is vital to be able to obtain data that are
comparable across different studies;
! further quantitative knowledge of the chemical and physical
modifications affecting many compounds and particulate mat-
ter in the atmosphere, including the oxidation of hydrocarbons
to less volatile species and the formation of sulphate on the
surface of pre-existing particles;
! chemical and physical characterisation of PM. Far fewer data
exist for PM than for the main gaseous pollutants. The chemical
speciation of PM is not fully understood and the role of plumes
aging on PMmass and composition is largely unknown. The role
of lubrication oils, fuel type and engine technology, age and
maintenance upon aircraft PM emissions also needs to be
investigated;
! a more detailed assessment of the health effects of the AEs
within and in the surroundings of major airports;
! the identification of particular chemical species to be used as a
tracers for most of the AE sources;
! the significance of airport operations for emission reduction and
management should be investigated in more depth. There is a
lack of information on the effects of time-in-modes, aircraft
waiting/idling durations, aircraft weight, and use of APU/GPU/
FGEP on the actual emission of pollutants. A more detailed
knowledge of such operations will lead to a more reliable
assessment of the quantities of exhaust pollutants emitted into
the air;
! the relative importance of near-airport, regional, and global
scale air quality impacts of airport and aircraft emissions need to
be further investigated. Most studies focus on local or global
effects of the AEs, but there is no comprehensive view of air
pollution over a full range of scales.
Quantification of the impact of airport emissions on local air
quality is very difficult due to the complexity of airport emissions
and the presence of substantial levels of pollution from other
sources, with many airports being located near to urban settle-
ments, major highways and roads or industrial installations. This
makes the signal of the AEs and, in particular, of aircraft emissions
very hard to distinguish. This is a serious gap because development
of cost-effective strategies to improve air quality tomeet regulatory
requirements demands a clear quantification of the contribution of
AEs to the total air pollution.
Acknowledgement
We gratefully acknowledge the European Union for funding the
Marie Curie Intra-European Fellowships for career development to
M. Masiol through the project entitled ‘Chemical and Physical
Properties and Source Apportionment of Airport Emissions in the
context of European Air Quality Directives’ (European Commission
proposal n% 328542 Project CHEERS, call: FP7-PEOPLE-2012-IEF).
Appendix A. Supplementary data
Supplementary data related to this article can be found at http://
dx.doi.org/10.1016/j.atmosenv.2014.05.070.
References
ACARE, 2002. Strategic Research Agenda, vol. 2. Advisory Council for AeronauticsResearch in Europe, Brussels.
ACI, 2013. ACI Releases its 2012 World Airport Traffic Report. Media Release, Air-ports Council International, Montreal. Available at: http://www.aci.aero/media/bc5239b4-07ac-4d1f-8cbb-db8f1b093d80/News/Releases/2013/PR_2013_08_28_WATR_Release_pdf.
ACI, 2008. ACI Global Traffic Forecast Report 2008e2027. In: ICAO Conference onthe Economics of Airports and Air Navigation Service, Montr#eal, 15e20September 2008. Working Paper, CEANS-WP/66. Available at: http://www.icao.int/Meetings/ceans/Documents/Ceans_Wp_066_en.pdf.
ACI, 2007. Global Traffic Forecast 2006e2025. Executive Summary. Edition 2007.Available at: http://www.aci.aero/aci/aci/file/Economics/ACI%20Executive%20Summary.pdf.
Agrawal, H., Sawant, A.A., Jansen, K., Miller, J.W., Cocker III, D.R., 2008. Character-ization of chemical and particulate emissions from aircraft engines. Atmos.Environ. 42, 4380e4392.
Airbus, 2012. Global Market Forecast 2012e2031.Airlines for America, 2013. Annual Results: World Airlines. Available at: http://
www.airlines.org/Pages/Annual-Results-World-Airlines.aspx (last accessedAugust, 2013).
M. Masiol, R.M. Harrison / Atmospheric Environment 95 (2014) 409e455 447
Allen, A.G., Nemitz, E., Shi, J.P., Harrison, R.M., Greenwood, J.C., 2001. Size distri-butions of trace metals in atmospheric aerosols in the United Kingdom. Atmos.Environ. 35, 4581e4591.
Amato, F., Schaap, M., Reche, C., Querol, X., 2013. Road traffic: a major source ofparticulate matter in Europe. Urban air quality in Europe. Handb. Environ.Chem. 26, 165e193.
Amato, F., Moreno, T., Pandolfi, M., Querol, X., Alastuey, A., Delgado, A., Pedrero, M.,Cots, N., 2010. Concentrations, sources and geochemistry of airborne particulatematter at a major European airport. J. Environ. Monit. 12, 854e862.
Amin, R.S., 2001. Airports and the General Conformity Process (No. UCB-ITS-RR-2001-1). Institute of Transportation Studies, University of California, Berkeley.Document Number. Available at: http://www.escholarship.org/uc/item/8nw2z88q.pdf (last accessed August, 2013).
Anderson, B.E., Cofer, W.R., Bagwell, D.R., Barrick, J.W., Hudgins, C.H., 1998a.Airborne observations of aircraft aerosol emissions I: total nonvolatile particleemission indices. Geophys. Res. Lett. 25, 1689e1692.
Anderson, B.E., Cofer, W.R., Barrick, J.D., Bagwell, D.R., Hudgins, C.H., 1998b.Airborne observations of aircraft aerosol emissions II: factors controlling vola-tile particle production. Geophys. Res. Lett. 25, 1693e1696.
Anderson, B.E., Branham, H.-S., Hudgins, C.H., Plant, J.V., Ballenthin, J.O., Miller, T.M.,Viggiano, A.A., Blake, D.R., Boudries, H., Canagaratna, M., Miake-Lye, R.C.,Onasch, T., Wormhoudt, J., Worsnop, D., Brunke, K.E., Culler, S., Penko, P.,Sanders, T., Han, H.-S., Lee, P., Pui, D.Y.H., Thornhill, K.L., Winstead, E.L., 2005.Experiment to Characterize Aircraft Volatile Aerosol and Trace-Species Emis-sions (EXCAVATE). NASA/TM-2005-213783. National Aeronautics and SpaceAdministration, Hampton, VA. August 2005.
Anderson, B.E., Chen, G., Blake, D.R., 2006. Hydrocarbon emissions from a moderncommercial airliner. Atmos. Environ. 40, 3601e3612.
Anderson, B.E., Beyersdorf, A.J., Hudgins, C.H., Plant, J.V., Thornhill, K.L.,Winstead, E.L., Ziemba, L.D., Howard, R., Corporan, E., Miake-Lye, R.C.,Herndon, S.C., Timko, M., Woods, E., Dodds, W., Lee, B., Santoni, G.,Whitefield, P., Hagen, D., Lobo, P., Knighton, W.B., Bulzan, D., Tacina, K., Wey, C.,Vander Wal, R., Bhargava, A., Kinsey, J., Liscinsky, D.S., 2011. Alternative AviationFuel Experiment (AAFEX). NASA/TM-;2011-217059.
Anderson, J.O., Thundiyil, J.G., Stolbach, A., 2012. Clearing the air: a review of theeffects of particulate matter air pollution on human health. J. Med. Toxicol. 8,166e175.
Andreae, M.O., Gelencs#er, A., 2006. Black carbon or brown carbon? The nature oflight-absorbing carbonaceous aerosols. Atmos. Chem. Phys. 6, 3131e3148.
Armstrong, B., Hutchinson, E., Unwin, J., Fletcher, T., 2004. Lung cancer risk afterexposure to polycyclic aromatic hydrocarbons: a review and meta-analysis.Environ. Health Perspect. 112, 970e978.
Arnold, F., Scheid, J., Stilp, T., Schlager, H., Reinhardt, M.E., 1992. Measurements of jetaircraft emissions at cruise altitude I: the odd-nitrogen gases NO, NO2, HNO2
and HNO3. Geophys. Res. Lett. 19, 2421e2424.Arnold, F., Kiendler, A., Wiedemer, V., Aberle, S., Stilp, T., Busen, R., 2000. Chemiion
concentration measurements in jet engine exhaust at the ground: implicationsfor ion chemistry and aerosol formation in the wake of a jet aircraft. Geophys.Res. Lett. 27, 1723e1726.
Arnold, F., Wohlfrom, K.-H., Klemm, M.W., Schneider, J., Gollinger, K., Schumann, U.,Busen, R., 1998a. First gaseous ion composition measurements in the exhaustplume of a jet aircraft in flight: implications for gaseous sulfuric acid, aerosols,and chemiions. Geophys. Res. Lett. 25, 2137e2140.
Arnold, F., Stilp, T., Busen, R., Schumann, U., 1998b. Jet engine exhaust chemiionmeasurements: implications for gaseous SO2 and H2SO4. Atmos. Environ. 32,3073e3077.
Arunachalam, S., Wang, B., Davis, N., Baek, B.H., Levy, J.I., 2011. Effect of chemistrytransport model scale and resolution on population exposure to PM2.5 fromaircraft emissions during landing and takeoff. Atmos. Environ. 45,3294e3300.
Ashok, A., Lee, I.H., Arunachalam, S., Waitz, I.A., Yim, S.H., Barrett, S.R., 2013.Development of a response surface model of aviation's air quality impacts in theUnited States. Atmos. Environ. 77, 445e452.
Atkinson, R., 2000. Atmospheric chemistry of VOCs and NOx. Atmos. Environ. 34,2063e2101.
Atkinson, R., Arey, J., 2003. Atmospheric degradation of volatile organic compounds.Chem. Rev. 103, 4605e4638.
Ayres, J.G., 1998. Health effects of gaseous air pollutants. In: Hester, R.E.,Harrison, R.M. (Eds.), Issues in Environmental Science and Technology No. 10.Royal Society of Chemistry, Cambridge, pp. 1e20.
Azar, C., Johansson, D.J.A., 2012. Valuing the non-CO2 climate impacts of aviation.Clim. Change 111, 559e579.
Balkanski, Y., Myhre, G., Gauss, M., R€adel, G., Highwood, E.J., Shine, K.P., 2010. Directradiative effect of aerosols emitted by transport: from road, shipping andaviation. Atmos. Chem. Phys. 10, 4477e4489.
Barrett, S.R., Britter, R.E., Waitz, I.A., 2010. Global mortality attributable to aircraftcruise emissions. Environ. Sci. Technol. 44, 7736e7742.
Barrett, S.R.H., Yim, S.H.L., Gilmore, C.K., Murray, L.T., Tai, A.P.K., Kuhn, S.R.,Jacob, D.J., Yantosca, R.M., Byun, D., Ngan, F., Li, X.S., Ashok, A., Koo, J., Levy, J.,Dessens, O., Balasubramanian, S., Fleming, G.G., Wollersheim, C., Malina, R.,Pearlson, M.N., Stratton, R.W., Arunachalam, S., Binkowski, F.S., Hileman, J.I.,Waitz, I.A., 2012. Public health, climate and economic impacts of desulfurizingaviation fuel. Environ. Sci. Technol. 46, 4275e4282.
Barrett, S.R.H., Britter, R.E., Waitz, I.A., 2013. Impact of aircraft plume dynamics onairport local air quality. Atmos. Environ. 74, 247e258.
Baughcum, S.L., Begin, J.J., Franco, F., Greene, D.L., Lee, D.S., 1999. Aircraft emissions:current inventories and future scenarios. In: Penner, J.E., Lister, D.H., Griggs, D.J.,Dokken, D.J., McFarland, M. (Eds.), Aviation and the Global Atmosphere, SpecialReport of the Intergovernmental Panel on Climate Change. Cambridge Univer-sity Press, Cambridge (Chapter 9).
Baughcum, S.L., Henderson, S.C., Tritz, T.G., 1996a. Scheduled Civil Aircraft EmissionsInventories for 1976 and 1984: Database Development and Analysis. NASA CR4722.
Baughcum, S.L., Henderson, S.C., Tritz, T.G., Pickett, D.C., 1996b. Scheduled CivilAircraft Emission Inventories for 1992: Database Development and Analysis.NASA CR-4700.
Bell, M.L., Peng, R.D., Dominici, F., Samet, J.M., 2009. Emergency hospital admissionsfor cardiovascular diseases and ambient levels of carbon monoxide: results for126 United States urban counties, 1999e2005. Circulation 120, 949e955.
Belleudi, V., Faustini, A., Stafoggia, M., Cattani, G., Marconi, A., Perucci, C.A.,Forastiere, F., 2010. Impact of fine and ultrafine particles on emergency hospitaladmissions for cardiac and respiratory diseases. Epidemiology 21, 414e423.
Bennett, M., Christie, S., 2011. An application of backscatter Lidar to model theodour nuisance arising from aircraft tyre smoke. Int. J. Environ. Pollut 44,316e328.
Bennett, M., Christie, S.M., Graham, A., Thomas, B.S., Vishnyakov, V., Morris, K.,Peters, D.M., Jones, R., Ansell, C., 2011. Composition of smoke generated bylanding aircraft. Environ. Sci. Technol. 45, 3533e3538.
Bennett, M., Christie, S., Graham, A., Raper, D.W., 2010. Lidar observations of aircraftexhaust plumes. J. Atmos. Ocean Technol. 27, 1638e1651.
Beyersdorf, A.J., Timko, M.T., Ziemba, L.D., Bulzan, D., Corporan, E., Herndon, S.C.,Howard, R., Miake-Lye, R., Thornhill, K.L., Winstead, E., Wey, C., Yu, Z.,Anderson, B.E., 2013. Reductions in aircraft particulate emissions due to the useof FischereTropsch fuels. Atmos. Chem. Phys. Discuss. 13, 15105e15139.
Blakey, S., Rye, L., Wilson, C.W., 2011. Aviation gas turbine alternative fuels: a re-view. P. Combust. Inst 33, 2863e2885.
Blitz, M.A., Hughes, K.J., Pilling, M.J., 2003. Determination of the high-pressurelimiting rate coefficient and the enthalpy of reaction for OH þ SO2. J. Phys.Chem. A 107, 1971e1978.
Boeing, 2013. Current Market Outlook 2013e2032. Market Analysis, Boeing Com-mercial Airplanes, Seattle. Available at: http://www.boeing.com/assets/pdf/commercial/cmo/pdf/Boeing_Current_Market_Outlook_2013.pdf.
Bond, T.C., Bergstrom, R.W., 2006. Light absorption by carbonaceous particles: aninvestigative review. Aerosol Sci. Technol. 40, 27e67.
Brasseur, G.P., Müller, J.F., Granier, C., 1996. Atmospheric impact of NOx emissions bysubsonic aircraft: a three-dimensional model study. J. Geophys. Res. Atmos. 101(D1), 1423e1428.
Br€auner, E.V., Forchhammer, L., Møller, P., Simonsen, J., Glasius, M., Wåhlin, P.,Raaschou-Nielsen, O., Loft, S., 2007. Exposure to ultrafine particles fromambient air and oxidative stress-induced DNA damage. Environ. Health Per-spect 115, 1177.
British Airports Authority, 2006. Gatwick 2010 Baseline Emission Inventory. Avail-able at: http://83.98.24.64/Documents/business_and_community/Publications/2006/2010_basline_emissions_inventory.pdf (last accessed September, 2013).
Brock, C.A., Schr€oder, F., K€archer, B., Petzold, A., Busen, R., Fiebig, M., 2000. Ultrafineparticle size distributions measured in aircraft exhaust plumes. J. Geophys. Res.Atmos. (1984e2012) 105 (D21), 26555e26567.
Brown, R.C., Miake-Lye, R.C., Anderson, M.R., Kolb, C.E., 1997. Aircraft sulfur emis-sions and the formation of visible contrails. Geophys. Res. Lett. 24, 385e388.
Brown, R.C., Anderson, M.R., Miake-Lye, R.C., Kolb, C.E., Sorokin, A.A., Buriko, Y.Y.,1996a. Aircraft exhaust sulfur emissions. Geophys. Res. Lett. 23, 3603e3606.
Brown, R.C., Miake-Lye, R.C., Anderson, M.R., Kolb, C.E., 1996b. Effect of aircraftexhaust sulfur emissions on near field plume aerosols. Geophys. Res. Lett. 23,3607e3610.
Brundish, K.D., Clague, A.R., Wilson, C.W., Miake-Lye, R.C., Brown, R.C.,Wormhoudt, J., Lukachko, S.P., Chobot, A.T., Yam, C.K., Waitz, I.A., Hagen, D.E.,Schmid, O., Whitefield, P.D., 2007. Evolution of carbonaceous aerosol andaerosol precursor emissions through a jet engine. J. Propul. Power 23, 959e970.
Brunekreef, B., Holgate, S.T., 2002. Air pollution and health. Lancet 360, 1233e1242.Buseck, P.R., Adachi, K., Gelencs#er, A., Tompa, #E., P#osfai, M., 2012. Are black carbon
and soot the same? Atmos. Chem. Phys. Discuss. 12, 24821e24846.Busen, R., Schumann, U., 1995. Visible contrail formation from fuels with different
sulfur contents. Geophys. Res. Lett. 22 (11), 1357e1360.Buttress, J.C., Morris, K.M., 2005. An estimation of the total NOx emissions resulting
from aircraft Engine Ground Running at Heathrow airport. In: British AirwaysEnvironmental Affairs, British Airways Technical Documents Relating to theAircraft Operations Supporting the Project for the Sustainable Development ofHeathrow, Document 1, ENV/KMM/1127/14.18, October 2005. British Airways,London. Available at: http://www.britishairways.com/cms/global/pdfs/csr/PSDH_Technical_Reports.pdf (last accessed September 2013).
Cain, J., DeWitt, M.J., Blunck, D., Corporan, E., Striebich, R., Anneken, D.,Klingshirn, C., Roquemore, W.M., Vander Wal, R., 2013. Characterization ofgaseous and particulate emissions from a turboshaft engine burning conven-tional, alternative, and surrogate fuels. Energ. Fuels 27, 2290e2302.
Carr, E., Lee, M., Marin, K., Holder, C., Hoyer, M., Pedde, M., Cook, R., Touma, J., 2011.Development and evaluation of an air quality modeling approach to assessnear-field impacts of lead emissions from piston-engine aircraft operating onleaded aviation gasoline. Atmos. Environ. 45, 5795e5804.
Carslaw, D.C., Ropkins, K., Laxen, D., Moorcroft, S., Marner, B., Williams, M.L., 2008.Near-field commercial aircraft contribution to nitrogen oxides by engine,
M. Masiol, R.M. Harrison / Atmospheric Environment 95 (2014) 409e455448
aircraft type, and airline by individual plume sampling. Environ. Sci. Technol.42, 1871e1876.
Carslaw, D.C., Beevers, S.D., Ropkins, K., Bell, M.C., 2006. Detecting and quantifyingaircraft and other on-airport contributions to ambient nitrogen oxides in thevicinity of a large international airport. Atmos. Environ. 40, 5424e5434.
Carslaw, D.C., 2005. Evidence of an increasing NO2/NOx emissions ratio from roadtraffic emissions. Atmos. Environ. 39 (26), 4793e4802.
Carslaw, D.C., Beevers, S.D., 2004. New Directions: should road vehicle emissionslegislation consider primary NO2? Atmos. Environ. 38, 1233e1234.
Cavallo, D., Ursini, C.L., Carelli, G., Iavicoli, I., Ciervo, A., Perniconi, B., Rondinone, B.,Gismondi, M., Iavicoli, S., 2006. Occupational exposure in airport personnel:characterization and evaluation of genotoxic and oxidative effects. Toxicology223, 26e35.
Champagne, D.L., 1971. Standard Measurement of Aircraft Gas Turbine EngineExhaust Smoke. ASME paper, 71-GT-88.
Chen, Y.C., Lee, W.-J., Uang, S.-N., Lee, S.-H., Tsai, P.-J., 2006. Characteristics ofpolycyclic aromatic hydrocarbon (PAH) emissions from a UH-1H helicopterengine and its impact on the ambient environment. Atmos. Environ. 40,7589e7597.
Cheng, M.-D., 2009. A Comprehensive Program for Measurement of Military AircraftEmissions. Strategic Environmental Research and Development Program,SERDP Project WP-1401 ORNL/TM-2009/256.
Cheng, M.-D., Corporan, E., 2010. A study of extractive and remote-sensing samplingand measurement of emissions from military aircraft engines. Atmos. Environ.44, 4867e4878.
Cheng, M.D., Corporan, E., DeWitt, M.J., Landgraf, B., 2009. Emissions of volatileparticulate components from turboshaft engines operated with JP-8 andFischer-Tropsch fuels. Aerosol Air Qual. Res. 9, 237e256.
Cheng, M.D., Corporan, E., DeWitt, M.J., Spicer, C.W., Holdren, M.W., Cowen, K.A.,Laskin, A., Harris, D.B., Shores, R.C., Kagann, R., Hashmonay, R., 2008. Probingemissions of military cargo aircraft: description of a joint field measurementstrategic environmental research and development program. JAWMA 58,787e796.
Chevron Corporation, 2006. Aviation Fuels Technical Review. Available at: https://www.cgabusinessdesk.com/document/aviation_tech_review.pdf (last accessedAugust 2013).
Ch"eze, B., Gastineau, P., Chevallier, J., 2011. Forecasting world and regional aviationjet fuel demands to the mid-term (2025). Energ. Policy 39, 5147e5158.
Chiusolo, M., Cadum, E., Stafoggia, M., Galassi, C., Berti, G., Faustini, A., Bisanti, L.,Vigotti, M.A., Patrizia Dessì, M., Cernigliaro, A., Mallone, S., Pacelli, B.,Minerba, S., Simonato, L., Forastiere, F., 2011. Short-term effects of nitrogendioxide on mortality and susceptibility factors in 10 Italian cities: the EpiAirstudy. Environ. Health Perspect. 119, 1233e1238.
Cole, I.S., Paterson, D.A., 2009. Modelling aerosol deposition rates on aircraft andimplications for pollutant accumulation and corrosion. Corros. Eng. Sci. Technol.44, 332e339.
Corporan, E., Reich, R., Monroig, O., DeWitt, M.J., Larson, V., Aulich, T., Mann, M.,Seames, W., 2005. Impacts of biodiesel on pollutant emissions of a JP-8-fueledturbine engine. JAWMA 55, 940e949.
Corporan, E., DeWitt, M.J., Belovich, V., Pawlik, R., Lynch, A.C., Gord, J.R., Meyer, T.R.,2007. Emissions characteristics of a turbine engine and research combustorburning a fischer-tropsch jet fuel. Energ. Fuels 21, 2615e2626.
Corporan, E., Quick, A., DeWitt, M.J., 2008. Characterization of particulate matterand gaseous emissions of a C-130H aircraft. JAWMA 58, 474e483.
Corporan, E., Edwards, T., Shafer, L., DeWitt, M.J., Klingshirn, C., Zabarnick, S.,West, Z., Striebich, R., Graham, J., Klein, J., 2011. Chemical, thermal stability, sealswell, and emissions studies of alternative jet fuels. Energ. Fuels 25, 955e966.
Cowen, K., Goodwin, B., Joseph, D., Tefend, M., Satola, J., Kagann, R., Hashmonay, R.,Spicer, C., Holdren, M., 2009. Extractive sampling and optical remote sensing ofF100 aircraft engine emissions. JAWMA 59, 531e539.
Craig, P.H., Barth, M.L., 1999. Evaluation of the hazards of industrial exposure totricresyl phosphate: a review and interpretation of the literature. J. Toxicol.Environ. Health B Crit. Rev. 2, 281e300.
Curtius, J., Sierau, B., Arnold, F., Baumann, R., Busen, R., Schulte, P., Schumann, U.,1998. First direct sulfuric acid detection in the exhaust plume of a jet aircraft inflight. Geophys. Res. Lett. 25, 923e926.
Curtius, J., Arnold, F., Schulte, P., 2002. Sulfuric acid measurements in the exhaustplume of a jet aircraft in flight: implications for the sulfuric acid formationefficiency. Geophys. Res. Lett. 29, 1113. http://dx.doi.org/10.1029/2001GL013813.
Cyrys, J., Eeftens, M., Heinrich, J., Ampe, C., Armengaud, A., Beelen, R., Bellander, T.,Beregszaszi, T., Birk, M., Cesaroni, G., Cirach, M., de Hoogh, K., De Nazelle, A., deVocht, F., Declercq, C., Dedele, A., Dimakopoulou, K., Eriksen, K., Galassi, C.,Grauleviciene, R., Grivas, G., Gruzieva, O., Hagenbjork Gustafsson, A.,Hoffmann, B., Iakovides, M., Ineichen, A., Kr€amer, U., Lanki, T., Lozano, P.,Madsen, C., Meliefste, K., Modig, L., M€olter, A., Mosler, G., Nieuwenhuijsen, M.,Nonnemacher, M., Oldenwening, M., Peters, A., Pontet, S., Probst-Hensch, N.,Quass, U., Raaschou-Nielsen, O., Ranzi, A., Sugiri, D., Stephanou, E.G., Taimisto, P.,Tsai, M.-Y., Vaskovi, E., Villani, S., Wang, M., Brunekreef, B., Hoek, G., 2012.Variation of NO2 and NOx concentrations between and within 36 Europeanstudy areas: results from the ESCAPE study. Atmos. Environ. 62, 374e390.
Dakhel, P.M., Lukachko, S.P., Waitz, I.A., Miake-Lye, R.C., Brown, R.C., 2007. Post-combustion evolution of soot properties in an aircraft engine. J. Propul. Power23, 942e948.
Daley, M.P.S., Naugle, M.D.F., 1979. Measurement and analysis of airport emissions.J. Air Pollut. Control Assoc. 29, 113e116.
Delfino, R.J., Sioutas, C., Malik, S., 2005. Potential role of ultrafine particles in as-sociations between airborne particle mass and cardiovascular health. Environ.Health Perspect 113, 934.
Delgado-Saborit, J.M., Stark, C., Harrison, R.M., 2011. Carcinogenic potential, levelsand sources of polycyclic aromatic hydrocarbon mixtures in indoor and outdoorenvironments and their implications for air quality standards. Environ. Int. 37,383e392.
Demirdjian, B., Ferry, D., Suzanne, J., Popovicheva, O.B., Persiantseva, N.M.,Shonija, N.K., 2007. Heterogeneities in the microstructure and composition ofaircraft engine combustor soot: impact on the water uptake. J. Atmos. Chem. 56,83e103.
Denola, G., Hanhela, P.J., Mazurek, W., 2011. Determination of tricresyl phosphate aircontamination in aircraft. Ann. Occup. Hyg. 55, 710e722.
DeWitt, K., Hwang, S.M., 2005. Sulfur Oxidation and Contrail Precursor Chemistry.NASA Grant Number NAG3-2674. Available at: http://archive.org/details/nasa_techdoc_20050123900 (last accessed August 2013).
DeWitt, M.J., Corporan, E., Graham, J., Minus, D., 2008. Effects of aromatic type andconcentration in Fischer-Tropsch fuel on emissions production and materialcompatibility. Energ. Fuels 22, 2411e2418.
Dlugokencky, E.J., Nisbet, E.G., Fisher, R., Lowry, D., 2011. Global atmosphericmethane: budget, changes and dangers. Philos. Trans. R. Soc. A Math. Phys. Eng.Sci. 369, 2058e2072.
Dodson, R.E., Houseman, E.A., Morin, B., Levy, J.I., 2009. An analysis of continuousblack carbon concentrations in proximity to an airport and major roadways.Atmos. Environ. 43, 3764e3773.
Donahue, N.M., Robinson, A.L., Pandis, S.N., 2009. Atmospheric organic particulatematter: from smoke to secondary organic aerosol. Atmos. Environ. 43, 94e106.
EASA (European Aviation Safety Agency), 2011. Studying, sAmpling and Measuringof aircraft ParticuLate Emissions III e Specific Contract 01 (SAMPLE III e SC.01)Research project EASA.2010/FC10 SC.01 23 October 2011. Available at: http://www.easa.europa.eu/safety-and-research/research-projects/docs/environment/2011-SAMPLE%20III%20SC.01-Studying,%20sAmpling%20and%20Measuring%20of%20Particulate%20Matter%20III%20Specific%20Contract%2001-Final%20Report%20v2.pdf (last accessed September 2013).
EASA (European Aviation Safety Agency), 2013. ICAO Aircraft Engine EmissionsDatabank (updated April 2013). Available at: http://easa.europa.eu/environment/edb/aircraft-engine-emissions.php.
Ebbinghaus, A., Wiesen, P., 2001. Aircraft fuels and their effect upon engine emis-sions. Air Space Eur. 3 (1/2), 101e103.
Eichkorn, S., Wohlfrom, K.-H., Arnold, F., Busen, R., 2002. Massive positive andnegative chemiions in the exhaust of an aircraft jet engine at ground-level:mass distribution measurements and implications for aerosol formation.Atmos. Environ. 36, 1821e1825.
Eyers, C.J., Addleton, D., Atkinson, K., Broomhead, M.J., Christou, R., Elliff, T., Falk, R.,Gee, I., Lee, D.S., Marizy, C., Michot, S., Middel, J., Newton, P., Norman, P.,Plohr, M., Raper, D., Stanciou, N., 2004. AERO2k Global Aviation Emissions In-ventories for 2002 and 2025 QINETIQ/04/01113, Farnborough, Hants, UK.
Eyring, V., Isaksen, I.S.A., Berntsen, T., Collins, W.J., Corbett, J.J., Endresen, O.,Grainger, R.G., Moldanova, J., Schlager, H., Stevenson, D.S., 2010. Transport im-pacts on atmosphere and climate: shipping. Atmos. Environ. 44, 4735e4771.
FAA (Federal Aviation Administration), 2005. Aviation & Emissions. A Primer,January 2005. Federal Aviation Administration Office of Environment and En-ergy. Available at: http://www.faa.gov/regulations_policies/policy_guidance/envir_policy/media/aeprimer.pdf (last accessed September 2013).
Fahey,D.W., Schumann,U.,Ackerman,S.,Artaxo,P.,Boucher,O.,Danilin,M.Y.,Karcher,B.,Minnis, P., Nakajima, T., Toon, O.B., 1999. Aviation-produced aerosols and cloudi-ness. In: Penner, J.E., Lister, D.H., Griggs, D.J., Dokken, D.J., McFarland, M. (Eds.),Aviation and theGlobalAtmosphere, Special Report of the Intergovernmental Panelon Climate Change. Cambridge University Press, Cambridge (Chapter 3).
Fahey, D.W., Keim, E.R., Woodbridge, E.L., Gao, R.S., Boering, K.A., Daube, B.C.,Wofsy, S.C., Lohmann, R.P., Hintsa, E.J., Dessler, A.E., Webster, C.R., May, R.D.,Brock, C.A., Wilson, J.C., Miake-Lye, R.C., Brown, R.C., Rodriguez, J.M.,Loewenstein, M., Proffitt, M.H., Stimpfle, R.M., Bowen, S.W., Chan, K.R., 1995a. Insitu observations in aircraft exhaust plumes in the lower stratosphere at mid-latitudes. J. Geophys. Res. 100 (D2), 3065e3074.
Fahey, D.W., Keim, E.R., Boering, K.A., Brock, C.A., Wilson, J.C., Jonsson, H.H.,Anthony, S., Hanisco, T.F., Wennberg, P.O., Miake-Lye, R.C., Salawitch, R.J.,Louisnard, N., Woodbridge, E.L., Gao, R.S., Donnelly, S.G., Wamsley, R.C., DelNegro, L.A., Solomon, S., Daube, B.C., Wofsy, S.C., Webster, C.R., May, R.D.,Kelly, K.K., Loewenstein, M., Podolske, J.R., Chan, K.R., 1995b. Emission mea-surements of the Concorde supersonic aircraft in the lower stratosphere. Sci-ence 270, 70e74.
Farias, F., ApSimon, H., 2006. Relative contributions from traffic and aircraft NOx
emissions to exposure in West London. Environ. Modell. Softw. 21, 477e485.Fan, W., Sun, Y., Zhu, T., Wen, Y., 2012. Emissions of HC, CO, NOx, CO2, and SO2 from
civil aviation in China in 2010. Atmos. Environ. 56, 52e57.Fanning, E., Yu, R.C., Lu, R., Froines, J., 2007. Monitoring and Modeling of Ultrafine
Particles and Black Carbon at the Los Angeles International Airport. FinalReport. California Air Resource Board Contract #04-325. Available at: http://arb.ca.gov/research/apr/past/04-325.pdf (last accessed September 2013).
Federal Aviation Administration, 2003. Select Resource Materials and AnnotatedBibliography on the Topic of Hazardous Air Pollutants (HAPs) Associated withAircraft. Airports and Aviation Report. Available from: http://www.faa.gov/regulations_policies/policy_guidance/envir_policy/media/HAPs_rpt.pdf (lastaccessed September 2013).
M. Masiol, R.M. Harrison / Atmospheric Environment 95 (2014) 409e455 449
Fenger, J., 2009. Air pollution in the last 50 years e from local to global. Atmos.Environ. 43, 13e22.
Finlayson-Pitts, B.J., Pitts, J.N., 2000. Chemistry of the Upper and Lower Atmo-sphere: Theory, Experiments, and Applications. Acad. Press, San Diego, p. 969.
Fleuti, E., Hofmann, P., 2005. Airport Local Air Quality Studies, ALAQS Case Study:Zürich Airport 2004, a Comparison of Modelled and Measured Air Quality. Tech.Rep. EEC/SEE/2005/017, EUROCONTROL. Available at: http://www.eurocontrol.int/eec/gallery/content/public/document/eec/report/2005/037_Comparison_of_Modelled_and_Measured_Air_Quality_Zurich_Airport_2004.pdf (lastaccessed August 2013).
Frenzel, A., Arnold, F., 1994. Sulfuric acid cluster ion formation by jet engines: im-plications for sulfuric acid formation and nucleation. In: Proceedings of theInternational Scientific Coll. On Impact of Emissions from Aircraft and Space-craft upon the Atmosphere, K€oln 1994, DLR-Mitt 94-06, pp. 106e112.
Gardner, R.M., Adams, K., Cook, T., Deidewig, F., Ernedal, S., Falk, R., Fleuti, E.,Herms, E., Johnson, C.E., Lecht, M., Lee, D.S., Leech, M., Lister, D., Mass#e, B.,Metcalfe, M., Newton, P., Schmitt, A., Vandenbergh, C., Van Drimmelen, R., 1997.The ANCAT/EC global inventory of NOx emissions from aircraft. Atmos. Environ.31, 1751e1766.
Garnier, F., Baudoin, C., Woods, P., Louisnard, N., 1997. Engine emission alteration inthe near field of an aircraft. Atmos. Environ. 31, 1767e1781.
Gauss, M., Isaksen, I.S.A., Lee, D.S., Søvde, O.A., 2006. Impact of aircraft NOx emis-sions on the atmosphere e tradeoffs to reduce the impact. Atmos. Chem. Phys.6, 1529e1548.
Gerstle, T., Virag, P., Wade, M., 1999. Aircraft Engine and Auxiliary Power UnitEmissions Testing. In: Participate Matter Results, vol. 3. Institute for Environ-ment, Safety, Occupational Health Risk Analysis (IERA). IERA-RS-BR-TR-1999-0006-Vol. 3. Available at: http://www.dtic.mil/cgi-bin/GetTRDoc?Location¼U2&doc¼GetTRDoc.pdf&AD¼ADA361473 (last accessed September2013).
Gerstle, T., Virag, P., Wade, M., 2002. Aircraft Engine and Auxiliary Power UnitEmissions Testing: Final Report Addendum F119-PW-100 Engine EmissionsTesting Report. United States Air Force: IERA.
Gettelman, A., Chen, C., 2013. The climate impact of aviation aerosols. Geophys. Res.Lett. 40, 2785e2789.
Gietl, J.K., Lawrence, R., Thorpe, A.J., Harrison, R.M., 2010. Identification of brakewear particles and derivation of a quantitative tracer for brake dust at a majorroad. Atmos. Environ. 44, 141e146.
Girling, S.P., Hurley, C.D., Mitchell, J.P., Nichols, A.L., 1990. Development and char-acterization of a smoke generator for the calibration of aerosol emissions fromgas turbine engines. Aerosol Sci. Technol. 13, 8e19.
Gleitsmann, G., Zellner, R., 1998. A modeling study of the formation of cloudcondensation nuclei in the jet regime of aircraft plumes. J. Geophys. Res. 103,19543e19555.
Grice, S., Stedman, J., Kent, A., Hobson, M., Norris, J., Abbott, J., Cooke, S., 2009.Recent trends and projections of primary NO2 emissions in Europe. Atmos.Environ. 43, 2154e2167.
Grosjean, D., Grosjean, E., Williams, E.L., 1994. Atmospheric chemistry of olefins: aproduct study of the ozone-alkene reaction with cyclohexane added to scav-enge hydroxyl radical. Environ. Sci. Technol. 28, 186e196.
Gysel, M., Nyeki, S., Weingartner, E., Baltensperger, U., Giebl, H., Hitzenberger, R.,Petzold, A., Wilson, C.W., 2003. Properties of jet engine combustion particlesduring the PartEmis experiment: hygroscopicity at subsaturated conditions.Geophys. Res. Lett. 30, 1566,. http://dx.doi.org/10.1029/2003GL016896.
HAL (Heathrow Airport Ltd.), 2011. Heathrow Air Quality Strategy 2011e2020.Available at: http://www.heathrowairport.com/static/Heathrow/Downloads/PDF/air-quality-strategy_LHR.pdf (last accessed August 2013).
Hallquist, M., Wenger, J.C., Baltensperger, U., Rudich, Y., Simpson, D., Claeys, M.,Dommen, J., Donahue, N.M., George, C., Goldstein, A.H., Hamilton, J.F.,Herrmann, H., Hoffmann, T., Iinuma, Y., Jang, M., Jenkin, M., Jimenez, J.L.,KiendlerScharr, A., Maenhaut, W., McFiggans, G., Mentel, T., Monod, A.,Prevot, A.S.H., Seinfeld, J.H., Surratt, J.D., Szmigielski, R., Wildt, J., 2009. Theformation, properties and impact of secondary organic aerosol: current andemerging issues. Atmos. Chem. Phys. 9, 5155e5235.
Harrison, R.M., Jones, A.M., Gietl, J., Yin, J., Green, D.C., 2012. Estimation of thecontributions of brake dust, tire wear, and resuspension to nonexhaust trafficparticles derived from atmospheric measurements. Environ. Sci. Technol. 46,6523e6529.
Harrison, R.M., Beddows, D.C.S., Dall'Osto, M., 2011. PMF analysis of wide-rangeparticle size spectra collected on a major highway. Environ. Sci. Technol. 45,5522e5528.
Haverkamp, H., Wilhelm, S., Sorokin, A., Arnold, F., 2004. Positive and negative ionmeasurements in jet aircraft engine exhaust: concentrations, sizes and impli-cations for aerosol formation. Atmos. Environ. 38, 2879e2884.
Heal, M.R., Kumar, P., Harrison, R.M., 2012. Particles, air quality, policy and health.Chem. Soc. Rev. 41, 6606e6630.
Heland, J., Sch€afer, K., 1998. Determination of major combustion products in aircraftexhausts by FTIR emission spectroscopy. Atmos. Environ. 32, 3067e3072.
Heland, J., Sch€afer, K., 1997. Analysis of aircraft exhausts with Fourier-transforminfrared emission spectroscopy. Appl. Opt. 36, 4922e4931.
Henderson, S.C., Wickrama, U.K., Baughcum, S.L., Begin, J.L., Franco, F., Greene, D.L.,Lee, D.S., Mclaren, M.L., Mortlock, A.K., Newton, P.J., Schmitt, A., Sutkus, D.J.,Vedantham, A., Wuebbles, D.J., 1999. Aircraft emissions: current inventories andfuture scenarios. In: Penner, J.E., Lister, D.H., Griggs, D.J., Dokken, D.J.,McFarland, M. (Eds.), Aviation and the Global Atmosphere, Special Report of the
Intergovernmental Panel on Climate Change. Cambridge University Press,Cambridge (Chapter 9).
Hendricks, J., K€archer, B., D€opelheuer, A., Feichter, J., Lohmann, U., Baumgardner, D.,2004. Simulating the global atmospheric black carbon cycle: a revisit to thecontribution of aircraft emissions. Atmos. Chem. Phys. 4, 2521e2541.
Herndon, S.C., Wood, E.C., Northway, M.J., Miake-Lye, R., Thornhill, L., Beyersdorf, A.,Anderson, B.E., Dowlin, R., Dodds, W., Knighton, W.B., 2009. Aircraft hydrocar-bon emissions at Oakland international airport. Environ. Sci. Technol. 43,1730e1736.
Herndon, S.C., Jayne, J.T., Lobo, P., Onasch, T.B., Fleming, G., Hagen, D.E.,Whitefield, P.D., Miake-Lye, R.C., 2008. Commercial aircraft engine emissionscharacterization of in-use aircraft at HartsfieldeJackson Atlanta InternationalAirport. Environ. Sci. Technol. 42, 1877e1883.
Herndon, S.C., Rogers, T., Dunlea, E.J., Jayne, J.T., Miake-Lye, R., Knighton, B., 2006.Hydrocarbon emissions from in-use commercial aircraft during airport opera-tions. Environ. Sci. Technol. 40, 4406e4413.
Herndon, S.C., Onasch, T.B., Frank, B.P., Marr, L.C., Jayne, J.T., Canagaratna, M.R.,Grygas, J., Lanni, T., Anderson, B.E., Worsnop, D., Miake-Lye, R.C., 2005. Partic-ulate emissions from in-use commercial aircraft. Aerosol Sci. Technol. 39,799e809.
Herndon, S., Shorter, J., Zahniser, M., Nelson, D., Jayne, J., Brown, R., Miake-Lye, R.C.,Waitz, I., Silva, P., Lanni, T., Demerjian, K., Kolb, C., 2004. NO and NO2 emissionratios measured from in-use commercial aircraft during taxi and takeoff. En-viron. Sci. Technol. 38, 6078e6084.
Hileman, J.I., Stratton, R.W., Donohoo, P.E., 2010. Energy content and alternative jetfuel viability. J. Propul. Power 26, 1184e1195.
Hindiyarti, L., Glarborg, P., Marshall, P., 2007. Reactions of SO3 with the O/H radicalpool under combustion conditions. J. Phys. Chem. A 111, 3984e3991.
Hoek, G., Boogaard, H., Knol, A., de Hartog, J., Slottje, P., Ayres, J.G., Borm, P.,Brunekreef, B., Donaldson, K., Forastiere, F., Holgate, S., Kreyling, W.G.,Nemery, B., Pekkanen, J., Stone, V., Wichmann, H.E., van der Sluijs, J., 2010.Concentration response functions for ultrafine particles and all-cause mortalityand hospital admissions: results of a european expert panel elicitation. Environ.Sci. Technol. 44, 476e482.
Howitt, O.J.A., Carruthers, M.A., Smith, I.J., Rodger, C.J., 2011. Carbon dioxide emis-sions from international air freight. Atmos. Environ. 45, 7036e7045.
Hsu, H.H., Adamkiewicz, G., Andres Houseman, E., Zarubiak, D., Spengler, J.D.,Levy, J.I., 2013. Contributions of aircraft arrivals and departures to ultrafineparticle counts near Los Angeles International Airport. Sci. Tot. Environ. 444,347e355.
Hsu, H.H., Adamkiewicz, G., Andres Houseman, E., Vallarino, J., Melly, S.J.,Wayson, R.L., Spengler, J.D., Levy, J.I., 2012. The relationship between aviationactivities and ultrafine particulate matter concentrations near a mid-sizedairport. Atmos. Environ. 50, 328e337.
Hu, S., Fruin, S., Kozawa, K., Mara, S., Winer, A.M., Paulson, S.E., 2009. Aircraftemission impacts in a neighborhood adjacent to a general aviation airport inSouthern California. Environ. Sci. Technol. 43, 8039e8045.
Hueglin, C., Buchmann, B., Weber, R.O., 2006. Long-term observation of real-worldroad traffic emission factors on a motorway in Switzerland. Atmos. Environ. 40,3696e3709.
Hunton, D.E., Ballenthin, J.O., Borghetti, J.F., Federico, G.S., Miller, T.M., Thorn, W.F.,Viggiano, A.A., Anderson, B.E., Coffer, W.R., McDougal, D.S., Wey, C.C., 2000.Chemical ionization mass spectrometric measurements of SO2 emissions fromjet engines in flight and test chamber operations. J. Geophys. Res. 105 (D22),26841e26855.
Huttunen-Saarivirta, E., Kuokkala, V.T., Kokkonen, J., Paajanen, H., 2011. Corrosioneffects of runway de-icing chemicals on aircraft alloys and coatings. Mat. Chem.Phys. 126, 138e151.
Hwang, S.M., Cooke, J.A., De Witt, K.J., Rabinowitz, M.J., 2010. Determination of therate coefficients of the SO2 þ O þM/ SO3 þM reaction. Int. J. Chem. Kinet. 42,168e180.
Hyslop, N.P., 2009. Impaired visibility: the air pollution people see. Atmos. Environ.43, 182e195.
IARC (International Agency for Research on Cancer), 2010. Some Non-HeterocyclicPolycyclic Aromatic Hydrocarbons and Some Related Exposures. In: IARCMonogr. Eval. Carcinog. Risk Hum. 92 (IARC, Lyon).
ICAO (International Civil Aviation Organization), 2013. Annual Report of the Council2012. Available at: http://www.icao.int/publications/pages/publication.aspx?docnum¼10001.
ICAO (International Civil Aviation Organization), 2011. Airport Air Quality Manual,first ed. International Civil Aviation Organization, Montr#eal.
ICAO (International Civil Aviation Organization), 2008. Environmental Protection(Annex 16). In: Aircraft Engine Emission, International Standards and Recom-mended Practices, vol. 2, ISBN 978-92-9231-123-0.
IPCC (Intergovernmental Panel on Climate Change), 1999. Aviation and theGlobal Atmosphere. Summary for Policymakers. IPCC Working Groups I andIII, p. 23.
Jenkin, M.E., 2004. Analysis of sources and partitioning of oxidant in the UKdpart2: contributions of nitrogen dioxide emissions and background ozone at akerbside location in London. Atmos. Environ. 38, 5131e5138.
Jerrett, M., Burnett, R.T., Pope, C.A., Ito, K., Thurston, G., Krewski, D., Shi, Y., Calle, E.,Thun, M., 2009. Longterm ozone exposure and mortality. N. Engl. J. Med. 360,1085e1095.
Johansson, C., Norman, M., Burman, L., 2009. Road traffic emission factors for heavymetals. Atmos. Environ. 43, 4681e4688.
M. Masiol, R.M. Harrison / Atmospheric Environment 95 (2014) 409e455450
Johnson, G.R., Mazaheri, M., Ristovski, Z.D., Morawska, L.A., 2008. Plume capturetechnique for the remote characterization of aircraft engine emissions. Environ.Sci. Technol. 42, 4850e4856.
Johnston, H., 1971. Reduction of stratospheric ozone by nitrogen oxide catalystsfrom supersonic transport exhaust. Science 173, 517e522.
Jung, K.H., Artigas, F., Shin, J.Y., 2011. Personal, indoor, and outdoor exposure toVOCs in the immediate vicinity of a local airport. Environ. Monit. Assess. 173,555e567.
Jurkat, T., Voigt, C., Arnold, F., Schlager, H., Kleffmann, J., Aufmhoff, H., Sch€auble, D.,Schaefer, M., Schumann, U., 2011. Measurements of HONO, NO, NOy and SO2 inaircraft exhaust plumes at cruise. Geophys. Res. Lett. 38, L10807. http://dx.doi.org/10.1029/2011GL046884.
Kam, W., Liacos, J.W., Schauer, J.J., Delfino, R.J., Sioutas, C., 2012. On-road emissionfactors of PM pollutants for light-duty vehicles (LDVs) based on urban streetdriving conditions. Atmos. Environ. 61, 378e386.
Kampa, M., Castanas, E., 2008. Human health effects of air pollution. Environ. Pollut151, 362e367.
Karakatsani, A., Analitis, A., Perifanou, D., Ayres, J.G., Harrison, R.M., Kotronarou, A.,Kavouras, I.G., Pekkanen, J., H€ameri, K., Kos, G.P.A., de Hartog, J.J., Hoek, G.,Katsouyanni, K., 2012. Particulate matter air pollution and respiratory symp-toms in individuals having either asthma or chronic obstructive pulmonarydisease: a European multicentre panel study. Environ. Health 11, 1e16.
K€archer, B., Peter, T., Biermann, U.M., Schumann, U., 1996. The initial composition ofjet condensation trails. J. Atmos. Sci. 53, 3066e3083.
Katragkou, E., Wilhelm, S., Arnold, F., 2004. First gaseous sulfur (VI) measurementsin the simulated internal flow of an aircraft gas turbine engine during projectPartEmis. Geophys. Res. Lett. 31, L02117. http://dx.doi.org/10.1029/2003GL018231.
Katsouyanni, K., Touloumi, G., Spix, C., Schwartz, J., Balducci, F., Medina, S., Rossi, G.,Wojtyniak, B., Sunyer, J., Bacharova, L., Schouten, J.P., Ponka, A., Anderson, H.R.,1997. Short-term effects of ambient sulfur dioxide and particulate matter onmortality in 12 European cities: results from time series data from the APHEAproject. Air Pollution and Health: a European Approach. Br. Med. J. 314,1658e1663.
Keyte, I.J., Harrison, R.M., Lammel, G., 2013. Chemical reactivity and long-rangetransport potential of polycyclic aromatic hydrocarbons e a review. Chem.Soc. Rev. 42, 9333e9391.
Khadilkar, H., Balakrishnan, H., 2012. Estimation of aircraft taxi fuel burn usingflight data recorder archives. Transp. Res. Part D 17, 532e537.
Kiendler, A., Arnold, F., 2002. Unambiguous identification and measurement ofsulfuric acid cluster chemiions in aircraft jet engine exhaust. Atmos. Environ.36, 1757e1761.
Kim, B.Y., Fleming, G.G., Lee, J.J., Waitz, I.A., Clarke, J.-P., Balasubramanian, S.,Malwitz, A., Klima, K., Locke, M., Holsclaw, C.A., Maurice, L.Q., Gupta, M.L., 2007.System for assessing Aviation's Global Emissions (SAGE), part 1: modeldescription and inventory results. Transp. Res. Part D 12, 325e346.
Kinsey, J.S., Timko, M.T., Herndon, S.C., Wood, E.C., Yu, Z., Miake-Lye, R.C., Lobo, P.,Whitefield, P., Hagen, D., Wey, C., Anderson, B.E., Beyersdorf, A.J., Hudgins, C.H.,Thornhill, K.L., Winstead, E., Howard, R., Bulzan, D.I., Tacina, K.B.,Knighton, W.B., 2012a. Determination of the emissions from an aircraft auxil-iary power unit (APU) during the Alternative Aviation Fuel Experiment(AAFEX). JAWMA 62, 420e430.
Kinsey, J.S., Timko, M.T., Herndon, S.C., Wood, E.C., Yu, Z., Miake-Lye, R.C., Lobo, P.,Whitefield, P., Hagen, D., Wey, C., Anderson, B.E., Beyersdorf, A.J., Hudgins, C.H.,Thornhill, K.L., Winstead, E., Howard, R., Bulzan, D.I., Tacina, K.B.,Knighton, W.B., 2012b. Determination of the emissions from an aircraft auxil-iary power unit (APU) during the alternative aviation fuel experiment (AAFEX).JAWMA 62, 420e430.
Kinsey, J.S., Hays, M.D., Dong, Y., Williams, D.C., Logan, R., 2011. Chemical charac-terization of the fine particle emissions from commercial aircraft engines dur-ing the Aircraft Particle Emissions eXperiment (APEX) 1 to 3. Environ. Sci.Technol. 45, 3415e3421.
Kinsey, J.S., Dong, Y., Williams, D.C., Logan, R., 2010. Physical characterization of thefine particle emissions from commercial aircraft engines during the aircraftparticle emissions experiment (APEX) 1 to 3. Atmos. Environ. 44, 2147e2156.
Kinsey, J.S., 2009. Characterization of Emissions from Commercial Aircraft Enginesduring the Aircraft Particle Emissions eXperiment (APEX) 1 to 3. EPA/600/R-09/130. U.S. Environmental Protection Agency, Washington, D.C.
Kjellstr€om, E., Feichter, J., Sausen, R., Hein, R., 1999. The contribution of aircraftemissions to the atmospheric sulfur budget. Atmos. Environ. 33, 3455e3465.
Klapmeyer, M.E., Marr, L.C., 2012. CO2, NOx, and particle emissions from aircraft andsupport activities at a regional airport. Environ. Sci. Technol. 46, 10974e10981.
Knibbs, L.D., Cole-Hunter, T., Morawska, L., 2011. A review of commuter exposure toultrafine particles and its health effects. Atmos. Environ. 45, 2611e2622.
Knight, S.P., Salagaras, M., Trueman, A.R., 2011. The study of intergranular corrosionin aircraft aluminium alloys using X-ray tomography. Corros. Sci. 53, 727e734.
Knighton, W.B., Rogers, T.M., Anderson, B.E., Herndon, S.C., Yelvington, P.E., Miake-Lye, R.C., 2007. Quantification of aircraft engine hydrocarbon emissions usingproton transfer reaction mass spectrometry. J. Propul. Power 23, 949e958.
Knighton, W.B., Herndon, S.C., Miake-Lye, R.C., 2009. Aircraft Engine SpeciatedOrganic Gases: Speciation of Unburned Organic Gases in Aircraft Exhaust.Environmental Protection Agency, Office of Transportation and Air Quality.Available at: http://origin.www.faa.gov/regulations_policies/policy_guidance/envir_policy/media/FAA-EPA_TSD_Speciated%20OG_Aircraft_052709.pdf (lastaccessed August 2013).
Kondo, Y., Sahu, L., Moteki, N., Khan, F., Takegawa, N., Liu, X., Koike, M., Miyakawa, T.,2011. Consistency and traceability of black carbon measurements made bylaser-induced incandescence, thermal-optical transmittance, and filter-basedphotoabsorption techniques. Aerosol Sci. Technol. 45, 295e312.
Koo, J., Wang, Q., Henze, D.K., Waitz, I.A., Barrett, S.R.H., 2013. Spatial sensitivities ofhuman health risk to intercontinental and high-altitude pollution. Atmos. En-viron. 71, 140e147.
Kraabøl, A.G., Flatøy, F., Stordal, F., 2000a. Impact of NOx emissions from subsonicaircraft: inclusion of plume processes in a three-dimensional model coveringEurope, North America, and the North Atlantic. J. Geophys. Res. 105 (D3),3573e3581.
Kraabøl, A.G., Konopka, P., Stordal, F., Schlager, H., 2000b. Modelling chemistry inaircraft plumes 1: comparison with observations and evaluation of a layeredapproach. Atmos. Environ. 34, 3939e3950.
Kraabøl, A.G., Berntsen, T.K., Sundet, J.K., Stordal, F., 2002. Impacts of NOx emissionsfrom subsonic aircraft in a global three-dimensional chemistry transport modelincluding plume processes. J. Geophys. Res. Atmos. (1984e2012) 107 (D22),ACH-22.
Kroll, J.H., Seinfeld, J.H., 2008. Chemistry of secondary organic aerosol: formationand evolution of low-volatility organics in the atmosphere. Atmos. Environ. 42,3593e3624.
Kugele, A., Jelinek, F., Gaffal, R., 2005. Aircraft Particulate Matter Emission Estima-tion Through all Phases of Flight. EUROCONTROL, EEC/SEE/2005/0014. Availableat: http://www.eurocontrol.int/eec/gallery/content/public/document/eec/report/2005/034_Aircraft_Particulate_Matter_Emission_Estimation.pdf (lastaccessed September 2013).
Kuhn, P.M., 1970. Airborne observations of contrail effects on the thermal radiationbudget. J. Atmos. Sci. 27, 937e942.
Kumar, P., Pirjola, L., Ketzel, M., Harrison, R., 2013. Nanoparticle emissions from 11non-vehicle exhaust sources e a review. Atmos. Environ. 67, 252e277.
Kumar, P., Ketzel, M., Vardoulakis, S., Pirjola, L., Britter, R., 2011. Dynamics anddispersion modelling of nanoparticles from road traffic in the urban atmo-spheric environmentda review. J. Aerosol Sci. 42, 580e603.
Kumar, P., Robins, A., Vardoulakis, S., Britter, R., 2010. A review of the characteristicsof nanoparticles in the urban atmosphere and the prospects for developingregulatory controls. Atmos. Environ. 44, 5035e5052.
Kurniawan, J.S., Khardi, S., 2011. Comparison of methodologies estimating emissionsof aircraft pollutants, environmental impact assessment around airports. En-viron. Impact Assess. Rev. 31, 240e252.
Lavoi, G., Heywood, J., Keck, J., 1970. Experimental and theoretical investigation ofnitric oxide formation in internal combustion engines. Combust. Sci. Technol. 1,313e326.
Le Qu#er#e, C., Raupach, M., Canadell, J., Marland, G., et al., 2009. Trends in the sourcesand sinks of carbon dioxide. Nat. Geosci. 2, 831e836.
Lee, B.H., Santoni, G.W., Wood, E.C., Herndon, S.C., Miake-Lye, R.C., Zahniser, M.S.,Wofsy, S.C., Lee, J.W.M., 2011. Measurements of nitrous acid in commercialaircraft exhaust at the Alternative Aviation Fuel Experiment. Environ. Sci.Technol. 45, 7648e7654.
Lee, D.S., Pitari, G., Grewe, V., Gierens, K., Penner, J.E., Petzold, A., Prather, M.J.,Schumann, U., Bais, A., Berntsen, T., Iachetti, D., Lim, L.L., Sausen, R., 2010.Transport impacts on atmosphere and climate: aviation. Atmos. Environ. 44,4678e4734.
Lee, D.S., Fahey, D.W., Forster, P.M., Newton, P.J., Wit, R.C.N., Lim, L.L., Owen, B.,Sausen, R., 2009. Aviation and global climate change in the 21st century. Atmos.Environ. 43, 3520e3537.
Lee, J.J., Waitz, I.A., Kim, B.Y., Fleming, G.G., Maurice, L., Holsclaw, C.A., 2007. Systemfor assessing Aviation's Global Emissions (SAGE), part 2: uncertainty assess-ment. Transp. Res. D Trans. Environ. 12, 381e395.
Lelieveld, J., Crutzen, P.J., Dentener, F.J., 1998. Changing concentration, lifetime andclimate forcing of atmospheric methane. Tellus B 50, 128e150.
Levy, J.I., Woody, M., Baek, B.H., Shankar, U., Arunachalam, S., 2012. Current andfuture particulate-matter-related mortality risks in the United States fromaviation emissions during landing and takeoff. Risk Anal. 32, 237e249.
Lewis, E.R., Schwartz, S.E., 2004. Sea Salt Aerosol Production. Mechanisms, Methods,Measurements, and Models e a Critical Review. In: Geophysical MonographSeries, vol. 152. AGU, Washington DC, 413 pp.
Lewis, J.S., Niedzwiecki, R.W., Bahr, D.W., Bullock, S., Cumpsty, N., Dodds, W.,DuBois, D., Epstein, A., Freguson, W.W., Fiorento, A., Gorbatko, A.A., Hagen, D.E.,Hart, P.J., Hayashi, S., Jamieson, J.B., Kerrebrock, J., Lecht, M., Lowrie, B., Miake-Lye, R.C., Mortlock, A.K., Moses, C., Renger, K., Sampath, S., Sanborn, J., Simon, B.,Sorokin, A., Taylor, W., Waitz, I., Wey, C.C., Whitefield, P., Wilson, C.W., Wu, S.,1999. Aircraft technology and its relation to emissions. In: Penner, J.E.,Lister, D.H., Griggs, D.J., Dokken, D.J., McFarland, M. (Eds.), Aviation and theGlobal Atmosphere, Special Report of the Intergovernmental Panel on ClimateChange. Cambridge University Press, Cambridge (Chapter 7).
Liao, M., Chen, W.R., Bellinger, N.C., 2008. Effects of ultrasonic impact treatment onfatigue behavior of naturally exfoliated aluminum alloys. Int. J. Fatigue 30,717e726.
Liaquat, A.M., Kalam, M.A., Masjuki, H.H., Jayed, M.H., 2010. Potential emissionsreduction in road transport sector using biofuel in developing countries. Atmos.Environ. 44, 3869e3877.
Lin, S., Munsie, J.P., Herdt-Losavio, M., Hwang, S.A., Civerolo, K., McGarry, K.,Gentile, T., 2008. Residential proximity to large airports and potentialhealth impacts in New York State. Int. Arch. Occup. Environ. Health 81,797e804.
M. Masiol, R.M. Harrison / Atmospheric Environment 95 (2014) 409e455 451
Lindstedt, R.P., Maurice, L.Q., 2000. Detailed chemical-kinetic model for aviationfuels. J. Propul. Power 16, 187e195.
Liyasova, M., Li, B., Schopfer, L.M., Nachon, F., Masson, P., Furlong, C.E., Lockridge, O.,2011. Exposure to tri-o-cresyl phosphate detected in jet airplane passengers.Toxicol. Appl. Pharm. 256, 337e347.
Liu, G., Yan, B., Chen, G., 2013. Technical review on jet fuel production. Renew. Sust.Energ. Rev. 25, 59e70.
Lobo, P., Hagen, D.E., Whitefield, P.D., 2012. Measurement and analysis of aircraftengine PM emissions downwind of an active runway at the Oakland Interna-tional Airport. Atmos. Environ. 61, 114e123.
Lobo, P., Hagen, D.E., Whitefield, P.D., 2011. Comparison of PM emissions from acommercial jet engine burning conventional, biomass, and FischereTropschfuels. Environ. Sci. Technol. 45, 10744e10749.
Lobo, P., Whitefield, P.D., Hagen, D.E., Herndon, S.C., Jayne, J.T., Wood, E.C.,Knighton, W.B., Northway, M.J., Miake-Lye, R.C., Cocker, D., Sawant, A.,Agrawal, H., Miller, J.W., 2007. The Development of Exhaust Speciation Profilesfor Commercial Jet Engines, Final Report. Contract No. 04-344. California AirResources Board, Sacramento, CA. Oct 31, 2007. Available at: http://www.arb.ca.gov/research/apr/past/04-344.pdf (last accessed September 2013).
Long, C.M., Nascarella, M.A., Valberg, P.A., 2013. Carbon black vs. black carbon andother airborne materials containing elemental carbon: physical and chemicaldistinctions. Environ. Pollut 181, 271e286.
Loukhovitskaya, E.E., Talukdar, R.K., Ravishankara, A.R., 2013. Uptake of HNO3 onaviation kerosene and aircraft engine soot: influences of H2O or/and H2SO4.J. Phys. Chem. A 117, 4928e4936.
Lukachko, S.P., Waitz, I.A., Miake-Lye, R.C., Brown, R.C., Anderson, M.R., 1998. Pro-duction of sulphate aerosol precursors in the turbine and exhaust nozzle of anaircraft engine. J. Geophys. Res. 103 (D13), 16159e16174.
Mahashabde, A., Wolfe, P., Ashok, A., Dorbian, C., He, Q., Fan, A., Lukachko, S.,Mozdzanowska, A., Wollersheim, C., Barrett, S.R.H., Locke, M., Waitz, I.A., 2011.Assessing the environmental impacts of aircraft noise and emissions. Prog.Aerosp. Sci. 47, 15e52.
Marsillach, J., Richter, R.J., Kim, J.H., Stevens, R.C., MacCoss, M.J., Tomazela, D.,Suzuki, S.M., Schopfer, L.M., Lockridge, O., Furlong, C.E., 2011. Biomarkers oforganophosphorus (OP) exposures in humans. Neurotoxicology 32, 656e660.
Martinelli, N., Olivieri, O., Girelli, D., 2013. Air particulate matter and cardiovasculardisease: a narrative review. Eur. J. Intern. Med. 24, 295e302.
Mavroidis, I., Chaloulakou, A., 2011. Long-term trends of primary and secondary NO2
production in the Athens area. Variation of the NO2/NOx ratio. Atmos. Environ.45, 6872e6879.
Maynard, R.L., 2009. Health effects of urban pollution. In: Hester, R.E., Harrison, R.M.(Eds.), Issues in Environmental Science and Technology, vol. 28. Royal Society ofChemistry, Cambridge, pp. 108e128.
Mazaheri, M., Johnson, G.R., Morawska, L., 2009. Particle and gaseous emissionsfrom commercial aircraft at each stage of the landing and takeoff cycle. Environ.Sci. Technol. 43, 441e446.
Mazaheri, M., Johnson, G.R., Morawska, L., 2011. An inventory of particle andgaseous emissions from large aircraft thrust engine operations at an airport.Atmos. Environ. 45, 3500e3507.
Mazaheri, M., Bostrom, T.E., Johnson, G.R., Morawska, L., 2013. Composition andmorphology of particle emissions from in-use aircraft during takeoff andlanding. Environ. Sci. Technol. 47 (10), 5235e5242.
Mazraati, M., 2010. World aviation fuel demand outlook. OPEC Energy Rev. 34 (1),42e72.
Miake-Lye, R.C., Anderson, B.E., Cofer, W.R., Wallio, H.A., Nowicki, G.D.,Ballenthin, J.O., Hunton, D.E., Knighton, W.B., Miller, T.M., Seeley, J.V.,Viggiano, A.A., 1998. SOx oxidation and volatile aerosol in aircraft exhaustplumes depend on fuel sulfur content. Geophys. Res. Lett. 25, 1677e1680.
Miller, T.M., Ballenthin, J.O., Hunton, D.E., Viggiano, A.A., Wey, C.C., Anderson, B.E.,2003. Nitric acid emissions from the F100 jet engine. J. Geophys. Res. 108 (D1),4032. http://dx.doi.org/10.1029/2001JD001522.
Miller, T.M., Ballenthin, J.O., Viggiano, A.A., Anderson, B.E., Wey, C.C., 2005. Massdistribution and concentrations of negative chemiions in the exhaust of a jetengine: sulfuric acid concentrations and observation of particle growth. Atmos.Environ. 39, 3069e3079.
Miracolo, M.A., Hennigan, C.J., Ranjan, M., Nguyen, N.T., Gordon, T.D., Lipsky, E.M.,Presto, A.A., Donahue, N.M., Robinson, A.L., 2011. Secondary aerosol formationfrom photochemical aging of aircraft exhaust in a smog chamber. Atmos. Chem.Phys. 11, 4135e4147.
Morawska, L., Ristovski, Z., Jayaratne, E.R., Keogh, D.U., Ling, X., 2008. Ambient nanoand ultrafine particles from motor vehicle emissions: characteristics, ambientprocessing and implications on human exposure. Atmos. Environ. 42,8113e8138.
Morris, K., 2006. An estimation of the tyre material erosion from measurements ofaircraft. In: British Airways Environmental Affairs, British Airways TechnicalDocuments Relating to the Aircraft Operations Supporting the Project for theSustainable Development of Heathrow, Document 7, EJT/KMM/1131/14.18.British Airways, London. Available at: http://www.britishairways.com/cms/global/pdfs/csr/PSDH_Technical_Reports.pdf (last accessed September 2013).
Morris, K., 2005a. Reverse Thrust Examples from British Airways Operations. In:British Airways Environmental Affairs, British Airways Technical DocumentsRelating to the Aircraft Operations Supporting the Project for the SustainableDevelopment of Heathrow, Document 3, WG2/TG4-IP5/7. British Airways,London. Available at: http://www.britishairways.com/cms/global/pdfs/csr/PSDH_Technical_Reports.pdf (last accessed September 2013).
Morris, K., 2005b. Results from a number of surveys of power settings used duringtaxi operations. In: British Airways Environmental Affairs, British AirwaysTechnical Documents Relating to the Aircraft Operations Supporting the Projectfor the Sustainable Development of Heathrow, Document 5, EJT/KMM/1126/14.8. British Airways, London. Available at: http://www.britishairways.com/cms/global/pdfs/csr/PSDH_Technical_Reports.pdf (last accessed September2013).
Morris, K., Easey, N., 2005. Results from two surveys of the use of reverse thrust ofaircraft landing at Heathrow airport. In: British Airways Environmental Affairs,British Airways Technical Documents Relating to the Aircraft Operations Sup-porting the Project for the Sustainable Development of Heathrow, Document 6,EJT/KMM/1128/14.18. British Airways, London. Available at: http://www.britishairways.com/cms/global/pdfs/csr/PSDH_Technical_Reports.pdf (lastaccessed September 2013).
Morris, K., 2002. Take-off at less than full power. In: British Airways EnvironmentalAffairs, British Airways Technical Documents Relating to the Aircraft OperationsSupporting the Project for the Sustainable Development of Heathrow, Docu-ment 2, WG 3 AEMTG WP10/10. British Airways, London. Available at: http://www.britishairways.com/cms/global/pdfs/csr/PSDH_Technical_Reports.pdf(last accessed September 2013).
Murcray, W.B., 1970. On the possibility of weather modification by aircraft contrails.Mon. Weather Rev. 98, 745e748.
Nambisan, S., Kajkowski, J., Menon, R., 2000. A preliminary survey of ground serviceequipment running times and its implications for air quality estimates at air-ports. In: Nambisan, S. (Ed.), The 2020 Vision of Air Transportation. AmericanSociety of Civil Engineers, San Francisco CA, pp. 144e152.
Naugle, F., Fox, D.L., 1981. Aircraft and air pollution. Environ. Sci. Technol. 1,391e395.
Nikoleris, T., Gupta, G., Kistler, M., 2011. Detailed estimation of fuel consumptionand emissions during aircraft taxi operations at Dallas/Fort Worth InternationalAirport. Transp. Res. D 16, 302e308.
Ning, Z., Sioutas, C., 2010. Atmospheric processes influencing aerosols generated bycombustion and the inference of their impact on public exposure: a review.Aerosol Air Qual. Res. 10, 43e58.
Novakov, T., Rosen, H., 2013. The black carbon story: early history and new per-spectives. AMBIO 42 (7), 840e851.
Novelli, P.C., Masarie, K.A., Lang, P.M., 1998. Distributions and recent changes ofcarbon monoxide in the lower troposphere. J. Geophys. Res. 103 (D15),19,015e19,033.
Nygren, E., Aleklett, K., H€o€ok, M., 2009. Aviation fuel and future oil productionscenarios. Energ. Policy 37, 4003e4010.
O'Brien, R.J., Wade, M.D., 2003. Air Emissions Inventory Guidance Document forMobile Sources at Air Force Installations (Revised December 2003). IERA-RS-BR-SR-2001-0010.
Oberdorster, G., Sharp, Z., Atudorei, V., Elder, A., Gelein, R., Kreyling, W., Cox, C.,2004. Translocation of inhaled ultrafine particles to the brain. Inhal. Toxicol. 16,437e445.
Odum, J.R., Hoffmann, T., Bowman, F., Collins, D., Flagan, R.C., Seinfeld, J.H., 1996.Gas/particle partitioning and secondary organic aerosol yields. Environ. Sci.Technol. 30, 2580e2585.
Olsen, S.C., Wuebbles, D.J., Owen, B., 2013. Comparison of global 3-D aviationemissions datasets. Atmos. Chem. Phys. 13, 429e441.
Onasch, T.B., Jayne, J.T., Herndon, S., Worsnop, D.R., Miake-Lye, R.C., Mortimer, I.P.,Anderson, B.E., 2009. Chemical properties of aircraft engine particulate exhaustemissions. J. Propul. Power 25, 1121e1137.
Ostash, O.P., Andreiko, I.M., Holovatyuk, Y.V., 2006. Degradation of materials andfatigue durability of aircraft constructions after long-term operation. Mater. Sci.42, 427e439.
Owen, B., Lee, D.S., Lim, L., 2010. Flying into the future: aviation emissions scenariosto 2050. Environ. Sci. Technol. 44, 2255e2260.
Paladino, J., Whitefield, P., Hagen, D., Hopkins, A.R., Trueblood, M., 1998. Particleconcentration characterization for jet engine emissions under cruise conditions.Geophys. Res. Lett. 25, 1697e1700.
Pandism, S.N., Harle, R.A., Cass, G.R., Seinfeld, J.H., 1992. Secondary organic aerosolformation and transport. Atmos. Environ. A General Top. 26, 2269e2282.
Pankow, J.F., 1994. An absorption model of the gas/aerosol partitioning involved inthe formation of secondary organic aerosol. Atmos. Environ. 28, 189e193.
Pant, P., Harrison, R.M., 2013. Estimation of the contribution of road traffic emis-sions to particulate matter concentrations from field measurements: a review.Atmos. Environ. 77, 78e97.
Pariselli, F., Sacco, M.G., Ponti, J., Rembges, D., 2009. Effects of toluene and benzeneair mixtures on human lung cells (A549). Exp. Toxicol. Pathol 61, 381e386.
Patterson, J., Noel, G.J., Senzig, D.A., Roof, C.J., Fleming, G.G., 2009. Analysis of de-parture and arrival profiles using real-time aircraft data. J. Aircr. 46, 1094e1103.
Peace, H., Maughan, J., Owen, B., Raper, D., 2006. Identifying the contribution ofdifferent airport related sources to local urban air quality. Environ. Modell.Softw 21, 532e538.
Peck, J., Oluwole, O.O., Wong, H.W., Miake-Lye, R.C., 2013. An algorithm to estimateaircraft cruise black carbon emissions for use in developing a cruise emissionsinventory. JAWMA 63, 367e375.
Peters, G.P., Marland, G., Le Qu#er#e, C., Boden, T., Canadell, J.G., Raupach, M.R., 2011.Rapid growth in CO2 emissions after the 2008e2009 global financial crisis. Nat.Clim. Change 2, 2e4.
Petzold, A., Ogren, J.A., Fiebig, M., Laj, P., Li, S.-M., Baltensperger, U., Holzer-Popp, T.,Kinne, S., Pappalardo, G., Sugimoto, N., Wehrli, C., Wiedensohler, A., Zhang, X.-Y.,
M. Masiol, R.M. Harrison / Atmospheric Environment 95 (2014) 409e455452
2013. Recommendations for reporting “black carbon” measurements. Atmos.Chem. Phys. 13, 8365e8379.
Petzold, A., Gysel, M., Vancassel, X., Hitzenberger, R., Puxbaum, H., Vrochticky, S.,Weingartner, E., Baltensperger, U., Mirabel, P., 2005a. On the effects of organicmatter and sulfur-containing compounds on the CCN activation of combustionparticles. Atmos. Chem. Phys. 5, 3187e3203.
Petzold, A., Fiebig, M., Fritzsche, L., Stein, C., Schumann, U., Wilson, C.W.,Hurley, C.D., Arnold, F., Katragkou, E., Baltensperger, U., Gysel, M., Nyeki, S.,Hitzenberger, R., Giebl, H., Hughes, K.J., Kurtenbach, R., Wiesen, P., Madden, P.,Puxbaum, H., Vrchoticky, S., Wahl, C., 2005b. Particle emissions from aircraftengines e a survey of the European project PartEmis. Meteorol. Z. 14, 465e476.
Petzold, A., Stein, C., Nyeki, S., Gysel, M., Weingartner, E., Baltensperger, U., Giebl, H.,Hitzenberger, R., D€opelheuer, A., Vrchoticky, S., Puxbaum, H., Johnson, M.,Hurley, C.D., Marsh, R., Wilson, C.W., 2003. Properties of jet engine combustionparticles during the PartEmis experiment: microphysics and chemistry. Geo-phys. Res. Lett. 30, 1719.
Petzold, A., Strom, J., Schroeder, F.P., Karcher, B., 1999. Carbonaceous aerosol in jetengine exhaust: emission characteristics and implications for heterogeneouschemical reactions. Atmos. Environ. 33, 2689e2698.
Petzold, A., D€opelheuer, A., 1998. Reexamination of black carbon mass emissionindices of a jet engine. Aerosol Sci. Technol. 29, 355e356.
Petzold, A., Schr€oder, F.P., 1998. Jet engine exhaust aerosol characterization. AerosolSci. Technol. 28, 62e76.
Petzold, A., Str€om, J., Ohlsson, S., Schr€oder, F.P., 1998. Elemental composition andmorphology of ice-crystal residual particles in cirrus clouds and contrails.Atmos. Res. 49, 21e34.
Pleil, J.D., Smith, L.B., Zelnick, S.D., 2000. Personal exposure to JP-8 jet fuel vapoursand exhaust at air force bases. Environ. Health Perspect 108, 183e192.
Polichetti, G., Cocco, S., Spinali, A., Trimarco, V., Nunziata, A., 2009. Effects of par-ticulate matter (PM10, PM2.5 and PM1) on the cardiovascular system. Toxicology261, 1e8.
Pope III, C.A., Ezzati, M., Dockery, D.W., 2009. Fine-Particulate air pollution and lifeexpectancy in the United States. N. Engl. J. Med. 360, 376e386.
Pope III, C.A., Dockery, D.W., 2006. Health effects of fine particulate air pollution:lines that connect. JAWMA 56, 709e742.
Popovicheva, O.B., Persiantseva, N.M., Lukhovitskaya, E.E., Shonija, N.K.,Zubareva, N.A., Demirdjian, B., Ferry, D., Suzanne, J., 2004. Aircraft engine sootas contrail nuclei. Geophys. Res. Lett. 31 http://dx.doi.org/10.1029/2003GL018888.
Popovitcheva, O.B., Persiantseva, N.M., Trukhin, M.E., Rulev, G.B., Shonija, N.K.,Buriko, Y.Y., Starik, A.M., Demirdjian, B., Ferry, D., Suzanne, J., 2000. Experi-mental characterization of aircraft combustor soot: microstructure, surfacearea, porosity and water adsorption. Phys. Chem. Chem. Phys. 2, 4421e4426.
Popp, P.J., Bishop, G.A., Stedman, D.H., 1999. Method for commercial aircraft nitricoxide emission measurements. Environ. Sci. Technol. 33, 1542e1544.
P€oschl, U., 2003. Aerosol particle analysis: challenges and progress. Anal. Bioanal.Chem. 375, 30e32.
Prather, M., Sausen, R., Grossman, A.S., Haywood, J.M., Rind, D., Subbaraya, B.H.,1999. Potential climate change from aviation. In: Penner, J.E., Lister, D.H.,Griggs, D.J., Dokken, D.J., McFarland, M. (Eds.), Aviation and the Global Atmo-sphere, Special Report of the Intergovernmental Panel on Climate Change.Cambridge University Press, Cambridge (Chapter 6).
Presto, A.A., Nguyen, N.T., Ranjan, M., Reeder, A.J., Lipsky, E.M., Hennigan, C.J.,Miracolo, M.A., Riemer, D.D., Robinson, A.L., 2011. Fine particle and organicvapor emissions from staged tests of an in-use aircraft engine. Atmos. Environ.45 (21), 3603e3612.
Raaschou-Nielsen, O., Andersen, Z.J., Beelen, R., Samoli, E., Stafoggia, M.,Weinmayr, G., Hoffmann, B., Fischer, P., Nieuwenhuijsen, M.J., Brunekreef, B.,Xun, W.W., Katsouyanni, K., Dimakopoulou, K., Sommar, J., Forsberg, B.,Modig, L., Oudin, A., Oftedal, B., Schwarze, P.E., Nafstad, P., De Faire, U.,Pedersen, N.L., €Ostenson, C.-G., Fratiglioni, L., Penell, J., Korek, M., Pershagen, G.,Eriksen, K.T., Sørensen, M., Tjønneland, A., Ellermann, T., Eeftens, M.,Peeters, P.H., Meliefste, K., Wang, M., Bueno-de-Mesquita, B., Key, T.J., deHoogh, K., Concin, H., Nagel, G., Vilier, A., Grioni, S., Krogh, V., Tsai, M.-Y.,Ricceri, F., Sacerdote, C., Galassi, C., Migliore, E., Ranzi, A., Cesaroni, G.,Badaloni, C., Forastiere, F., Tamayo, I., Amiano, P., Dorronsoro, M.,Trichopoulou, A., Bamia, C., Vineis, P., Hoek, G., 2013. Air pollution and lungcancer incidence in 17 European cohorts: prospective analyses from the Euro-pean Study of Cohorts for Air Pollution Effects (ESCAPE). Lancet Oncol. 14,813e822.
Ramanathan, V., Feng, Y., 2009. Air pollution, greenhouse gases and climate change:global and regional perspectives. Atmos. Environ. 43, 37e50.
Rasmussen, C.L., Glarborg, P., Marshall, P., 2007. Mechanisms of radical removal bySO2. Proc. Combust. Inst. 31, 339e347.
Ratliff, G., Sequeira, C., Waitz, I., Ohsfeldt, M., Thrasher, T., Graham, M., Thompson, T.,2009. Aircraft Impacts on Local and Regional Air Quality in the United States.PARTNER Report 15 Final Report (Report No. PARTNER-COE-2009-002).
Ravindra, K., Sokhi, R., Van Grieken, R., 2008. Atmospheric polycyclic aromatichydrocarbons: source attribution, emission factors and regulation. Atmos. En-viron. 42, 2895e2921.
Ray, S., Khillare, P.S., Agarwal, T., Shridhar, V., 2008. Assessment of PAHs in soilaround the International Airport in Delhi, India. J. Hazard. Mater 156, 9e16.
Reiner, T., Arnold, F., 1993. Laboratory flow reactor measurements of the reactionSO3 þ H2O þ MH2SO4 þ M: implications for gaseous H2SO4 and aerosol for-mation in the plume of jet aircraft. Geophys. Res. Lett. 20, 2659e2662.
Reiner, T., Arnold, F., 1994. Laboratory flow reactor measurements of the reactionSO3 þ H2O þ MH2SO4 þ M: implications for gaseous H2SO4 and aerosol for-mation in aircraft exhaust plumes. J. Chem. Phys. 101, 7399e7407.
Reinking, R.F., 1968. Insolation reduction by contrails. Weather 23, 171e173.Ritchie, G.D., 2003. Biological and health effects of exposure to kerosene-based jet
fuels and performance additives. J. Toxicol. Environ. Health B 6, 357e451.Ritchie, G.D., Still, K.R., Alexander, W.K., Nordholm, A.F., Wilson, C.L., Rossi, I.J.,
Mattie, D.R., 2001. A review of the neurotoxicity risk of selected hydrocarbonfuels. J. Toxicol. Environ. Health B Crit. Rev. 4, 223e312.
Robinson, A.L., Grieshop, A.P., Donahue, N.M., Hunt, S.W., 2010. Updating the con-ceptual model for fine particle mass emissions from combustion systems.JAWMA 60, 1204e1222.
Rogers, F., Arnott, P., Zielinska, B., Sagebiel, J., Kelly, K.E., Wagner, D., Lighty, J.S.,Sarofim, A.F., 2005. Real-time measurements of jet aircraft engine exhaust.JAWMA 55, 583e593.
Roof, C., Hansen, A., Fleming, G.G., Thrasher, T., Nguyen, A., Hall, C., Dinges, E.,Bea, R., Grandi, F., Kim, B.Y., Usdrowski, S., Hollingsworth, P., 2007. AviationEnvironmental Design Tool (AEDT) System Architecture AEDT-AD-01. Availableat: http://www.faa.gov/about/office_org/headquarters_offices/apl/research/models/history/media/AEDT_Architecture.pdf (last accessed September 2013).
Rückerl, R., Schneider, A., Breitner, S., Cyrys, J., Peters, A., 2011. Health effects ofparticulate air pollution e a review of epidemiological evidence. Inhal. Toxicol23, 555e592.
Russo, S., Sharp, P.K., Dhamari, R., Mills, T.B., Hinton, B.R.W., Clark, G., Shankar, K.,2009. The influence of the environment and corrosion on the structuralintegrity of aircraft materials. Fatigue Fract. Eng. Mater. 32, 464e472.
SAE, 2009. Aerospace Information Report AIR6037 Aircraft Exhaust NonvolatileParticle Matter Measurement Method Development, vol. 4970. SAE Interna-tional, Warrendale, PA.
Saillenfait, A.M., Gallissot, F., Morel, G., Bonnet, P., 2003. Developmental toxicities ofethylbenzene, ortho-, meta-, para-xylene and technical xylene in rats followinginhalation exposure. Food Chem. Toxicol. 41, 415e429.
Samoli, E., Aga, E., Touloumi, G., Nisiotis, K., Forsberg, B., Lefranc, A., Pekkanen, J.,Wojtyniak, B., Schindler, C., Niciu, E., Brunstein, R., Dodi%c Fikfak, M., Schwartz, J.,Katsouyanni, K., 2006. Short-term effects of nitrogen dioxide on mortality: ananalysis within the APHEA project. Eur. Respir. J. 27, 1129e1138.
Samoli, E., Touloumi, G., Schwartz, J., Anderson, H.R., Schindler, C., Forsberg, B.,Vigotti, M.A., Vonk, J., Kosnik, M., Skorkovsky, J., Katsouyanni, K., 2007. Short-term effects of carbon monoxide on mortality: an analysis within the APHEAproject. Environ. Health Perspect 115, 1578e1583.
Santoni, G.W., Lee, B.H., Wood, E.C., Herndon, S.C., Miake-Lye, R.C., Wofsy, S.C.,McManus, J.B., Nelson, D.D., Zahniser, M.S., 2011. Aircraft emissions of methaneand nitrous oxide during the alternative aviation fuel experiment. Environ. Sci.Technol 45, 7075e7082.
Sapkota, A., Chelikowsky, A.P., Nachman, K.E., Cohen, A.J., Ritz, B., 2012. Exposure toparticulate matter and adverse birth outcomes: a comprehensive review andmeta-analysis. Air Qual. Atmos. Health 5, 369e381.
Sausen, R., Isaksen, I., Grewe, V., Hauglustaine, D., Lee, D.S., Myhre, G., K€ohler, M.O.,Pitari, G., Schumann, U., Stordal, F., Zerefos, C., 2005. Aviation radiative forcingin 2000: an update on IPCC (1999). Meteorol. Z. 14, 555e561.
Sch€afer, K., Emeis, S., Hoffmann, H., Jahn, C., 2006. Influence of mixing layer heightupon air pollution in urban and sub-urban area. Meteorol. Z. 15, 647e658.
Sch€afer, K., Jahn, C., Sturm, P., Lechner, B., Bacher, M., 2003. Aircraft emissionmeasurements by remote sensing methodologies at airports. Atmos. Environ.37 (37), 5261e5271.
Schindler, B.K., Weiss, T., Schütze, A., Koslitz, S., Broding, H.C., Bünger, J., Brüning, T.,2013. Occupational exposure of air crews to tricresyl phosphate isomers andorganophosphate flame retardants after fume events. Arch. Toxicol. 87,645e648.
Schlager, H., Konopka, P., Schulte, P., Schumann, U., Ziereis, H., Arnold, F., Klemm, M.,Hagen, D.E., Whitefield, P.D., Ovarlez, J., 1997. Situ observation of air trafficemission signatures in the North Atlantic flight corridor. J. Geophys. Res. 102,10739e10750.
Schneider, T., O'Gorman, P.A., Levine, X.J., 2010. Water vapor and the dynamics ofclimate changes. Rev. Geophys. 48, RG3001.
Schr€oder, F., Brock, C.A., Baumann, R., Petzold, A., Busen, R., Schulte, P., Fiebig, M.,2000. In situ studies on volatile jet exhaust particle emissions: impact of fuelsulfur content and environmental conditions on nuclei mode aerosols.J. Geophys. Res. 105 (D15), 19941e19954.
Schumann, U., 2005. Formation, properties and climatic effects of contrails. C. R.Phys. 6, 549e565.
Schumann, U., Arnold, F., Busen, R., Curtius, J., K€archer, B., Kiendler, A., Petzold, A.,Schlager, H., Schr€oder, F., Wohlfrom, K.-H., 2002. Influence of fuel sulfur on thecomposition of aircraft exhaust plumes: the experiments SULFUR 1e7.J. Geophys. Res. Atmos. 107 (D15). AAC-2.
Schumann, U., Schlager, H., Arnold, F., Ovarlez, J., Kelder, H., Hov, Ø., Hayman, G.,Isaksen, I.S.A., Staehelin, J., Whitefield, P.D., 2000. Pollution from aircraftemissions in the North Atlantic flight corridor: overview on the POLINAT pro-jects. J. Geophys. Res. Atmos. (1984e2012) 105 (D3), 3605e3631.
Schumann, U., Schlager, H., Arnold, F., Baumann, R., Haschberger, P., Klemm, O.,1998. Dilution of aircraft exhaust plumes at cruise altitudes. Atmos. Environ. 32,3097e3103.
Schumann, U., 1997. The impact of nitrogen oxides emissions from aircraft upon theatmosphere at flight altitudes 8e15 km e results from the AERONOX Project.Atmos. Environ. 31, 1723e1733.
M. Masiol, R.M. Harrison / Atmospheric Environment 95 (2014) 409e455 453
Schumann, U., 1996. On conditions for contrail formation from air craft exhausts.Meteorol. Z. 5, 4e23.
Schumann, Str€om, J., Busen, R., Baumann, R., Gierens, K., Krautstrunk, M.,Schr€oder, F.P., Stingl, J., 1996. In situ observations of particles in jet aircraftexhausts and contrails for different sulfur-containing fuels. J. Geophys. Res.Atmos. (1984e2012) 101 (D3), 6853e6869.
Shumway, L.A., 2002. Characterization of Jet Engine Exhaust Participates for theF404, F118,T64,andT58 Aircraft Engines. U.S. Navy Aircraft EnvironmentalSupport Office by the SSC San Diego Marine Environmental Quality Branch.Technical Report 1881, March 2002.
Schürmann, G., Sch€afer, K., Jahn, C., Hoffmann, H., Bauerfeind, M., Fleuti, E.,Rappenglück, B., 2007. The impact of NOx, CO and VOC emissions on the airquality of Zurich airport. Atmos. Environ. 41, 103e118.
Schwartz, J., 1997. Air pollution and hospital admissions for cardiovascular diseasein Tuscon. Epidemiology 8, 371e377.
Screpanti, A., De Marco, A., 2009. Corrosion on cultural heritage buildings in Italy: arole for ozone? Environ. Pollut 157, 1513e1520.
Seigneur, C., 2009. Current understanding of ultrafine particulate matter emittedfrom mobile sources. JAWMA 59, 3e17.
Seinfeld, J.H., Pandis, S.N., 2006. Atmospheric Chemistry and Physics, second ed.. In:From Air Pollution to Climate Change John Wiley & Sons, NewYork.
Shell, 2013. World-wide Civil Jet Fuel Grades. Webpage. Available at: http://www.shell.com/global/products-services/solutions-for-businesses/aviation/shell-aviation-fuels/fuels/types/civil-jet-fuel-grades.html#textwithimage_19 (lastaccessed: December 2013).
Sherwood, S.C., Roca, R., Weckwerth, T.M., Andronova, N.G., 2010. Troposphericwater vapor, convection, and climate. Rev. Geophys. 48, RG2001. http://dx.doi.org/10.1029/2009RG000301.
Simone, N.W., Stettler, M.E.J., Barrett, S.R.H., 2013. Rapid estimation of global civilaviation emissions with uncertainty quantification. Transp. Res. D 25, 33e41.
Slemr, F., Giehl, H., Habram, M., Slemr, J., Schlager, H., Schulte, P., Haschberger, P.,Lindermeir, E., Dopelheuer, A., Plohr, M., 2001. In-flight measurements ofaircraft CO and nonmethane hydrocarbon emission indices. J. Geophys. Res. 106,7485e7494.
Slemr, F., Giehl, H., Slemr, J., Busen, R., Schulte, P., Haschberger, P., 1998. In-flightmeasurement of aircraft non-methane hydrocarbon emission indices. Geophys.Res. Lett. 25, 321e324.
Slogar, G.A., Holder, R.C., 1976. Determination of Effects of Ambient Conditions onAircraft Engine Emissions, Engine Testing e GTCP 85 APU, Type 331 Turboprop.EPA-460/3-76-009a and b. U.S. Environmental Protection Agency, Office ofMobile Source Air Pollution Control, Ann Arbor: MI.
Smith, S.J., Aardenne, J.V., Klimont, Z., Andres, R.J., Volke, A., Delgado Arias, S., 2011.Anthropogenic sulfur dioxide emissions: 1850e2005. Atmos. Chem. Phys. 11,1101e1116.
Solbu, K., Daae, H.L., Thorud, S., Ellingsen, D.G., Lundanes, E., Molander, P., 2010.Exposure to airborne organophosphates originating from hydraulic and tur-bine oils among aviation technicians and loaders. J. Environ. Monit. 12,2259e2268.
Solomon, S., Qin, D., Manning, M., Chen, Z., Marquis, M., Averyt, K.B., Tignor, M.,Miller, H.L. (Eds.), 2007. Climate Change 2007: the Physical Science Basis.Contribution of Working Group I to the Fourth Assessment Report of theIntergovernmental Panel on Climate Change. Cambridge University Press,Cambridge, United Kingdom and NewYork, NY, USA.
Solomon, S., Rosenlof, K.H., Portmann, R.W., Daniel, J.S., Davis, S.M., Sanford, T.J.,Plattner, G.K., 2010. Contributions of stratospheric water vapor to decadalchanges in the rate of global warming. Science 327 (5970), 1219e1223.
Somnitz, H., Gleitsmann, G.G., Zellner, R., 2005. Novel rates of OH induced sulfuroxidation. Implications to the plume chemistry of jet aircraft. Meteorol. Z. 14,459e464.
Sorokin, A., Katragkou, E., Arnold, F., Busen, R., Schumann, U., 2004. Gaseous SO3
and H2SO4 in the exhaust of an aircraft gas turbine engine: measurements byCIMS and implications for fuel sulfur conversion to sulfur (VI) and conversion ofSO3 to H2SO4. Atmos. Environ. 38, 449e456.
Sorokin, A., Mirabel, P., 2001. Ion recombination in aircraft exhaust plumes. Geo-phys. Res. Lett. 28 (6), 955e958.
Spicer, C.W., Holdren, M.W., Cowen, K.A., Joseph, D.W., Satola, J., Goodwin, B.,Mayfield, H., Laskin, A., Alexander, M.L., Ortega, J.V., Newburn, M.,Kagann, R., Hashmonay, R., 2009. Rapid measurement of emissions frommilitary aircraft turbine engines by downstream extractive sampling ofaircraft on the ground: results for C-130 and F-15 aircraft. Atmos. Environ.43, 2612e2622.
Spicer, C.W., Holdren, M.W., Riggin, R.M., Lyon, T.F., 1994. Chemical composition andphotochemical reactivity of exhaust from aircraft turbine engines. Ann. Geo-phys. 12, 12,944e12,955.
Spicer, C.W., Holdren, M.W., Smith, D.L., Hughes, D.P., Smith, M.D., 1992. Chemicalcomposition of exhaust from aircraft turbine engines. J. Eng. Gas Turbines Po-wer 114, 111e115.
Spicer, C.W., Holdren, M.W., Lyon, T.F., Riggin, R.M., 1984. Composition and Photo-chemical Reactivity of Turbine Engine Exhaust. Prepared by Battelle Labora-tories, Prepared for the Air Force Engineering & Services Center.
Starik, A.M., 2008. Gaseous and particulate emissions with jet engine exhaust andatmospheric pollution. In: Research and Technology Organisation (RTO) ofNATO (Ed.), Advances on Propulsion Technology for High-Speed Aircraft,Educational Notes RTO-EN-AVT-150, Paper 15. RTO, Neuilly-sur-Seine, France.Available at: http://www.rto.nato.int (last accessed: September 2013).
Starik, A.M., Savel'ev, A.M., Titova, N.S., Loukhovitskaya, E.E., Schumann, U., 2004.Effect of aerosol precursors from gas turbine engines on the volatile sulfateaerosols and ion clusters formation in aircraft plumes. Phys. Chem. Chem. Phys.6, 3426e3436.
Starik, A.M., Savel'ev, A.M., Titova, N.S., Schumann, U., 2002. Modeling of sulfurgases and chemiions in aircraft engines. Aer. Sci. Technol. 6, 63e81.
Stettler, M.E., Boies, A.M., Petzold, A., Barrett, S.R., 2013a. Global civil aviation blackcarbon emissions. Environ. Sci. Technol 47, 10397e10404.
Stettler, M.E., Swanson, J.J., Barrett, S.R., Boies, A.M., 2013b. Updated correlationbetween aircraft smoke number and black carbon concentration. Aerosol Sci.Technol. 47, 1205e1214.
Stettler, M.E.J., Eastham, S., Barrett, S.R.H., 2011. Air quality and public health im-pacts of UK airports. Part I: emissions. Atmos. Environ. 45, 5415e5424.
Stockwell, W.R., 1994. The effect of gas-phase chemistry on aqueous-phase sulfurdioxide oxidation rates. J. Atmos. Chem. 19, 317e329.
Stockwell, W.R., Calvert, J.G., 1983. The mechanism of the HO-SO2 reaction. Atmos.Environ. 17, 2231e2235.
Sunyer, J., Atkinson, R., Ballester, F., Le Tertre, A., Ayres, J., Forastiere, F., Forsberg, B.,Vonk, J., Bisanti, L., Anderson, R., Schwartz, J., Katsouyanni, K., 2003a. Respira-tory effects of sulfur dioxide: a hierarchical multicity analysis in the APHEA 2study. Occup. Environ. Med. 60, e2.
Sunyer, J., Ballester, F., Le Tertre, A., Atkinson, R., Ayres, J.G., Forastiere, F.,Forsberg, B., Vonk, J.M., Bisanti, L., Tenias, J.M., Medina, S., Schwartz, J.,Katsouyanni, K., 2003b. The association of daily sulfur dioxide air pollutionlevels with hospital admissions for cardiovascular diseases in Europe (TheAphea-II study). Eur. Heart J. 24, 752e760.
Sutkus Jr., D.J., Baughcum, S.L., DuBois, D.P., 2001. Scheduled Civil Aircraft EmissionInventories for 1999: Database Dev. and Anal. NASA/CRm2001-211216.
Tesseraux, I., 2004. Risk factors of jet fuel combustion products. Toxicol. Lett. 149,295e300.
Thorpe, A., Harrison, R.M., 2008. Sources and properties of non-exhaust particulatematter from road traffic: a review. Sci. Tot. Environ. 400, 270e282.
Timko, M.T., Yu, Z., Onasch, T.B., Wong, H.W., Miake-Lye, R.C., Beyersdorf, A.J.,Anderson, B.E., Thornhill, K.L., Winstead, E.L., Corporan, E., DeWitt, M.J.,Klingshirn, C.D., Wey, C., Tacina, K., Liscinsky, D.S., Howard, R., Bhargava, A.,2010a. Particulate emissions of gas turbine engine combustion of a Fischere-Tropsch synthetic fuel. Energ. Fuels 24, 5883e5896.
Timko, M.T., Onasch, T.B., Northway, M.J., Jayne, J.T., Canagaratna, M.R.,Herndon, S.C., Wood, E.C., Miake-Lye, M.C., Knighton, W.B., 2010b. Gas turbineengine Emissionsdpart II: chemical properties of particulate matter. J. Eng. GasTurbines Power 132, 061505.
Timko, M.T., Herndon, S.C., Wood, E.C., Onasch, T.B., Northway, M.J., Jayne, J.T.,Canagaratna, M.R., Miake-Lye, R.C., Knighton, W.B., 2010c. Gas turbine engineemissions e part I: volatile organic compounds and nitrogen oxides. J. Eng. GasTurbines Power 132, 061504e1.
Tremmel, H.G., Schumann, U., 1999. Model simulations of fuel sulfur conversionefficiencies in an aircraft engine: dependence on reaction rate constants andinitial species mixing ratios. Aerosp. Sci. Technol. 3, 417e430.
Tremmel, H.G., Schalger, H., Konopka, P., Schulte, P., Arnold, F., Klemm, M., Droste-Franke, B., 1998. Observations and model calculations of jet aircraft exhaustproducts at cruise altitude and inferred initial OH emissions. J. Geophys. Res.103 (D9), 10803e10816.
Turgut, E.T., Usanmaz, O., Rosen, M.A., 2013. Estimation of vertical and horizontaldistribution of takeoff and climb NOx emission for commercial aircraft. Energ.Convers. Manage. 76, 121e127.
Turgut, E.T., Rosen, M.A., 2010. Assessment of emissions at busy airports. Int. J.Energ. Res. 34, 800e814.
Unal, A., Hu, Y., Chang, M.E., Odman, M.T., Russell, A.G., 2005. Airport relatedemissions and impacts on air quality: application to the Atlanta InternationalAirport. Atmos. Environ. 39, 5787e5798.
Underwood, B.Y., Walker, C.T., Peirce, M.J., 2004. Heathrow Emissions Inventory2002: Part 1. Netcen, Warrington.
Unique, 2004. Aircraft NOx-Emissions within the Operational LTO Cycle. Unique(Flughafen Zürich AG) in Cooperation with Swiss Flight Data Monitoring.Available at: http://www.zurich-airport.com/Portaldata/2/Resources/documents_unternehmen/umwelt_und_laerm/Technical_Report_Operational_Aircraft_Emissions_2004.pdf (last accessed: August 2013).
UK Statutory Instrument, 2007. Air Quality Standards Regulations 2007 SI 2007/64.US EPA (Environmental Protection Agency), 2009. Recommended Best Practice for
Quantifying Speciated Organic Gas Emissions from Aircraft Equipped withTurbofan, Turbojet, and Turboprop Engines, Version 1.0. EPA-420-R-09e901May 2009. Available at: http://www.epa.gov/nonroad/aviation/420r09901.pdf(last accessed September 2013).
Usmani, A.M., Donley, M., 2002. Aircraft-coating weathering studies by analyticalmethods. J. Appl. Polym. Sci. 86, 294e313.
Vahedpour, M., Goodarzi, M., Hajari, N., Nazari, F., 2011. Theoretical study on theatmospheric formation of sulfur trioxide as the primary agent for acid rain.J. Struct. Chem. 22, 817e822.
Valavanidis, A., Fiotakis, K., Vlachogianni, T., 2008. Airborne particulate matter andhuman health: toxicological assessment and importance of size and composi-tion of particles for oxidative damage and carcinogenic mechanisms. J. Environ.Sci. Health C 26, 339e362.
Van Netten, C., 1999. Multi-elemental analysis of jet engine lubricating oils andhydraulic fluids and their implication in aircraft air quality incidents. Sci. Tot.Environ. 229, 125e129.
M. Masiol, R.M. Harrison / Atmospheric Environment 95 (2014) 409e455454
Vander Wal, R.L., Bryg, V.M., Hays, M.D., 2010. Fingerprinting soot (towards sourceidentification): physical structure and chemical composition. J. Aerosol Sci. 41,108e117.
Vay, S.A., Anderson, B.E., Sachse, G.W., Collins Jr., J.E., Podolske, J.R., Twohy, C.H.,Gandrud, B., Chan, K.R., Baughcum, S.L., Wallio, H.A., 1998. DC-8-based obser-vations of aircraft CO, CH4, N2O, and H2O (g) emission indices during SUCCESS.Geophys. Res. Lett. 25, 1717e1720.
Viana, M., Kuhlbusch, T.A.J., Querol, X., Alastuey, A., Harrison, R.M., Hopke, P.K.,Winiwarter, W., Vallius, M., Szidat, S., Prevot, A.S.H., Hueglin, C., Bloemen, H.,Wåhlin, P., Vecchi, R., Miranda, A.I., Kasper-Giebl, A., Maenhaut, W.,Hitzenberger, R., 2008. Source apportionment of particulate matter in Europe: areview of methods and results. J. Aerosol Sci. 39, 827e849.
Wade, M.D., 2002. Aircraft/Auxiliary Power Units/Aerospace Ground SupportEquipment Emission Factors. US Air Force IERA-RS-BR-SR-2003-0002.
Wahner, A., Geller, M.A., Arnold, F., Brune, W.H., Cariolle, D.A., Douglass, A.R.,Johnson, C., Lister, D.H., Pyle, J.A., Ramaroson, R., Rind, D., Rohrer, F.,Schumann, U., Thompson, A.M., 1995. Subsonic and supersonic aircraft emis-sions. In: World Meteorological Organization, United Nations EnvironmentProgramme, National Oceanic and Atmospheric Administration, NationalAeronautics and Space Administration (Eds.), Scientific Assessment of OzoneDepletion: 1994, WMO Global Ozone Research and Monitoring Project e ReportNo. 37, Geneva (Chapter 11).
Waitz, I.A., Lukachko, S.P., Lee, J.J., 2005. Military aviation and the environment:historical trends and comparison to civil aviation. J. Aircr. 42, 329e339.
Watt, J., Tidblad, J., Kucera, V., Hamilton, R. (Eds.), 2009. The Effects of Air Pollutionon Cultural Heritage. Springer, New York, p. 306.
Watterson, J., Walker, C., Eggleston, S., 2004. Revisions to the Method of EstimatingEmissions from Aircraft in the UK Greenhouse Gas Inventory. Netcen, Oxford.Available at: http://uk-air.defra.gov.uk/reports/cat07/0504201622_GHG_Tier_3_aviation_method_%5BIssue_1.1%5D.doc (last accessed September 2013).
Wayson, R.L., Fleming, G.G., Iovinelli, R., 2009. Methodology to estimate particulatematter emissions from certified commercial aircraft engines. JAWMA 59,91e100.
Webb, S., Whitefield, P.D., Miake-Lye, R.C., Timko, M.T., Thrasher, T.G., 2008.Research Needs Associated with Particulate Emissions at Airports. ACRP Report6. Transportation Research Board, Washington, D.C.
Wei, R.P., Liao, C.M., Gao, M., 1998. A transmission electron microscopy study ofconstituent-particle-induced corrosion in 7075-T6 and 2024-T3 aluminum al-loys. Metall. Mater. Trans. A 29, 1153e1160.
Weinmayr, G., Romeo, E., De Sario, M., Weiland, S.K., Forastiere, F., 2010. Short-termeffects of PM10 and NO2 on respiratory health among children with asthma orasthma-like symptoms: a systematic review and meta-analysis. Environ. HealthPerspect. 118, 449e457.
Westerdahl, D., Fruin, S.A., Fine, P.L., Sioutas, C., 2008. The Los Angeles InternationalAirport as a source of ultrafine particles and other pollutants to nearby com-munities. Atmos. Environ. 42, 3143e3155.
Wey, C.C., Anderson, B.E., Hudgins, C.H., Wey, C., Li-Jones, X., Winstead, E.,Thornhill, L., Lobo, P., Hagen, D., Whitefield, P.D., Yelvington, P.E., Herndon, S.C.,Onasch, T.B., Miake-Lye, R.C., Wormhoudt, J., Knighton, B., Howard, R.,Bryant, D., Corporan, E., Moses, C., Holve, D., Dodds, W., 2006. Aircraft ParticleEmissions eXperiment (APEX). NASA/TM-2006-214382, 2006, ARL-TR-3903.
Wey, C.C., Anderson, B.E., Wey, C., Miake-Lye, R.C., Whitefield, P.D., Howard, R., 2007.Overview of the aircraft particle emissions experiment. J. Propul. Power 23,898e905.
Wheeler, S.E., Schaefer III, H.F., 2009. Thermochemistry of the HOSO radical, a keyintermediate in fossil fuel combustion. J. Phys. Chem. A 113, 6779e6788.
Whitefield, P.D., Lobo, P., Hagen, D.E., Timko, M.T., Miake-Lye, R.C., Taylo, C.,Ratliff, G., Lukachko, S., Sequeira, C., Hileman, J., Waitz, I., Webb, S.,Thrasher, T.G., Ohsfeldt, M.R., Kaing, H.K., Essama, S.C., 2008. Summarizing andInterpreting Aircraft Gaseous and Particulate Emissions Data. ACRP Report 9.Transportation Research Board, Washington, D.C.
Whitt, D.B., Jacobson, M.Z., Wilkerson, J.T., Naiman, A.D., Lele, S.K., 2011. Verticalmixing of commercial aviation emissions from cruise altitude to the surface.J. Geophys. Res. 116, D14109. http://dx.doi.org/10.1029/2010JD015532.
WHO (World Health Organization), 2000. Air Quality Guidelines for Europe, seconded. WHO, Regional Office for Europe, Copenhagen.
Whyte, R.B., 1982. Alternative Jet Fuels, vol. 2, p. 174. AGARD 476 Advisory ReportNo. 181.
Wiesen, P.J., Kleffmann, J., Kurtenbach, R., Becker, K., 1994. Nitrous oxide andmethane emissions from aero engines. Geophys. Res. Lett. 21, 2027e2030.
Wilcox, L.J., Shine, K.P., Hoskins, B.J., 2012. Radiative forcing due to aviation watervapour emissions. Atmos. Environ. 63, 1e13.
Wilkerson, J.T., Jacobson, M.Z., Malwitz, A., Balasubramanian, S., Wayson, R.,Fleming, G., Naiman, A.D., Lele, S.K., 2010. Analysis of emission data from globalcommercial aviation: 2004 and 2006. Atmos. Chem. Phys. 10, 6391e6408.
Williams, R.C., Lee, J.B., 1985. Effects of Alternate Fuels on APUs. Wright-PattersonAir Force Base, OH: U.S. Air Force Wright Aeronautical Laboratories. AFWALTR-85e2083.
Williams, P.I., Allan, J.D., Lobo, P., Coe, H., Christie, S., Wilson, C., Hagen, D.,Whitefield, P., Raper, D., Rye, L., 2012. Impact of alternative fuels on emissionscharacteristics of a gas turbine engine e part 2: volatile and semivolatile par-ticulate matter emissions. Environ. Sci. Technol. 46, 10812e10819.
Wilson, C.W., Petzold, A., Nyeki, S., Schumann, U., Zellner, R., 2004. Measurementand prediction of emissions of aerosols and gaseous precursors from gas tur-bine engines (PartEmis): an overview. Aerosol Sci. Technol. 8, 131e143.
Winder, C., Balouet, J.C., 2002. The toxicity of commercial jet oils. Environ. Res. 89,146e164.
Wong, H.W., Yelvington, P.E., Timko, M.T., Onasch, T.B., Miake-Lye, R.C., Zhang, J.,Waitz, I.A., 2008. Microphysical modeling of ground-level aircraft-emittedaerosol formation: roles of sulfur-containing species. J. Propul. Power 24,590e602.
Wong, H.-W., Yu, Z., Timko, M.T., Herndon, S.C., de la Rosa Blanco, E., Miake-Lye, R.C.,Howard, R.P., 2011. Design parameters for an aircraft engine exit plane particlesampling system. J. Eng. Gas Turbines Power 133, 021501.
Wood, E., Herndon, S., Miake-Lye, R.C., Nelson, D., Seeley, M., 2008a. Aircraft andAirport-Related Hazardous Air Pollutants: Research Needs and Analysis. ACRPReport 7. Transportation Research Board, Washington, D.C.
Wood, E.C., Herndon, S.C., Timko, M.T., Yelvington, P.E., Miake-Lye, R.C., 2008b.Speciation and chemical evolution of nitrogen oxides in aircraft exhaust nearairports. Environ. Sci. Tecnol. 42, 1884e1891.
Woody, M.C., Arunachalam, S., 2013. Secondary organic aerosol produced fromaircraft emissions at the Atlanta Airport: an advanced diagnostic investigationusing process analysis. Atmos. Environ. 79, 101e109.
Wormhoudt, J., Herndon, S.C., Yelvington, P.E., Lye-Miake, R.C., Wey, C., 2007. Ni-trogen oxide (NO/NO2/HONO) emissions measurements in aircraft exhausts.J. Propul. Power 23, 906e911.
Wuebbles, D., Gupta, M., Ko, M., 2007. Evaluating the impacts of aviation on climatechange. EOS Trans. AGU 88, 157e160.
Yang, W., Omaye, S.T., 2009. Air pollutants, oxidative stress and human health.Mutat. Res. 674, 45e54.
Yelvington, P.E., Herndon, S.C., Wormhoudt, J.C., Jayne, J.T., Miake-Lye, R.C.,Knighton, W.B., Wey, C., 2007. Chemical speciation of hydrocarbon emissionsfrom a commercial aircraft engine. J. Propul. Power 23, 912e918.
Yilmaz, A., Hindiyarti, L., Jensen, A.D., Glarborg, P., Marshall, P., 2006. Thermaldissociation of SO3 at 1000e1400 K. J. Phys. Chem. A 110, 6654e6659.
Yim, S.H.L., Stettler, M.E.J., Barrett, S.R.H., 2013. Air quality and public health impactsof UK airports. Part II: impacts and policy assessment. Atmos. Environ. 67,184e192.
Yu, F., Turco, R.P., 1997. The role of ions in the formation and evolution of particles inaircraft plumes. Geophys. Res. Lett. 24, 1927e1930.
Yu, Z., Herndon, S.C., Ziemba, L.D., Timko, M.T., Liscinsky, D.S., Anderson, B.E.,Miake-Lye, R.C., 2012. Identification of lubrication oil in the particulate matteremissions from engine exhaust of in-service commercial aircraft. Environ. Sci.Tecnol. 46, 9630e9637.
Yu, Z., Liscinsky, D.S., Winstead, E.L., True, B.S., Timko, M.T., Bhargava, A.,Herdon, S.C., Miake-Lye, R., Anderson, B.E., 2010. Characterization of lubricationoil emissions from aircraft engines. Environ. Sci. Technol. 44, 9530e9534.
Yu, K.N., Cheung, Y.P., Chueng, T., Henry, R.C., 2004. Identifying the impact of largeurban airports on local air quality by nonparametric regression. Atmos. Envi-ron.. 38, 4501e4507.
Zhang, Y., Tao, S., 2009. Global atmospheric emission inventory of polycyclic aro-matic hydrocarbons (PAHs) for 2004. Atmos. Environ. 43, 812e819.
Zhu, Y., Fanning, E., Yu, R.C., Zhang, Q., Froines, J.R., 2011. Aircraft emissions and localair quality impacts from takeoff activities at a large International Airport.Atmos. Environ. 45, 65.
Zielinska, B., Sagebiel, J., McDonald, J.D., Whitney, K., Lawson, D.R., 2004. Emissionrates and comparative chemical composition from selected in-use diesel andgasoline-fueled vehicles. JAWMA 54, 1138e1150.
M. Masiol, R.M. Harrison / Atmospheric Environment 95 (2014) 409e455 455


![Brochure Exhaust Emissions Reduction en 21A1006397[1]](https://img.pdfslide.net/doc/110x75/577d34f71a28ab3a6b8f4414/brochure-exhaust-emissions-reduction-en-21a10063971.jpg)
![[Flip-Side] 7. IC Engine Exhaust Emissions](https://img.pdfslide.net/doc/110x75/56d6c06d1a28ab30169a58cc/flip-side-7-ic-engine-exhaust-emissions.jpg)