Embed Size (px)
Citation preview

The Office of the State Demographer is responsible for interpreting and communicating information on demographic and socioeconomic issues for the State of Texas to the public and the legislature.
Texas has been attracting people from other parts of the country since the 19th century. Americans escaping debt or simply looking for greener pastures would emigrate to Texas (at the time Texas was still a part of Mexico) and use the phrase “Gone to Texas” or GTT to indicate their destination. Although this phrase is no longer used, migration flows of U.S. residents continue to tell a similar story. Texas has experienced unprecedented population growth in the early 21st century, adding more than six million residents since 2000 (U.S. Census 2011; 2015a). In Figure 1, we see that Texas led the nation in annual population growth from 2005 through 2013. Population growth occurs through two processes: natural
increase (the excess of births over deaths) and net migration (the difference between in-migration and out-migration). The robust population growth in Texas has been fueled by both of these processes. As seen in Figure 2, natural increase added 208,391 persons to the state’s population between 2013 and 2014. During the same time period Texas gained an additional 239,104 persons from net migration. With this, natural increase comprised 46.6 percent of the state’s 2013-14 population gain and net migration contributed 53.4 percent to this growth. For comparison, 65.9 percent of California’s growth was due to natural increase while net migration made up 90.1 percent of Florida’s 2013-14 growth. In contrast, Texas’ growth has been characterized by an almost equal balance between natural increase and net migration.
Included in this Brief:
Domestic migration is a key source of Texas’ recent population growth.
Selectivity in domestic migration affects the state’s population composition.
Recent trends in domestic migration suggest a more diverse population in Texas’ future.
Authors : Steve White Lloyd B. Potter, Ph.D. Helen You, Ph.D. Lila Valencia, Ph.D. Jeffrey A. Jordan , Ph.D. Beverly Pecotte
April 2016
Figure 1: Average Annual Growth for the Top Five Growth States, 2005-2013
Sources: U.S. Census Bureau 2011; 2015a
Introduction to Texas
Domestic Migration
Texas460,251
California
315,043
Florida213,512
North Carolina143,085
Georgia133,303

2
In Figure 2, net migration includes migrants who came from other countries (i.e., international migrants) and migrants who came from other states (i.e., domestic migrants). In Figure 3, international and domestic net migration are examined separately. Figure 3 provides an example of population loss through migration. California lost 32,090 people through negative domestic migration between 2013 and 2014. In other words those moving out of the state outnumbered those moving into the state from other parts of the U.S. By contrast, Texas gained 154,467 residents from domestic migration which represents about 35 percent of the state’s total growth in 2013-2014.
The remainder of this brief focuses on how domestic migration is affecting the size and composition of the Texas population. International migration is included in this brief as a point of reference but is not discussed in detail. For more information on international migration to Texas, interested readers can refer to a previous brief on international migrants (White et al, 2015). In the next section, we describe recent migration flow patterns. After that, we examine the origins and destinations of domestic migrants to Texas. Then, we investigate the demographic characteristics of these migrants. Finally, we discuss the future implications of these migration trends.
Figure 2: Components of Population Change for the Top Five Growth States, 2013-14
Source: U.S. Census Bureau 2015a
208,391 250,116
27,465 53,832 35,120
239,104 129,228
250,852
46,924 56,209
Texas California Florida Georgia Arizona
Natural Increase Net Migration
138,546
154,467
-32,090
41,975
22,106
112,306
84,637
161,318
14,234
24,818
Florida
Texas
California
Arizona
Georgia
Domestic Migration International Migration
Figure 3: Domestic and International Net Migration for the Top Five Growth States, 2013-14
Source: U.S. Census Bureau 2015a

3
Recent Domestic Migration Patterns
In recent years, domestic migration has been an important source of growth for Texas. Referring to Figure 4, we see that Texas led the nation in net domestic migration from 2005 through 2013. During this time, the state gained an average of 125,778 persons per year from net domestic migration. However, the average number of persons moving to Texas each year was much higher than that. Net migration is the difference between in-migration and out-migration. This relationship is illustrated in Table 1 and Figure 5. These data show that an average of more than 500,000 persons moved to Texas each year from 2005 through 2013. At the same time, around 400,000 Texans moved to other states each year. So, to measure net population growth from migration, we have to subtract the out-migrants from the in-migrants. Thus, in the 2005-2013 time period, the Texas population grew by about 1.1 million persons due to net domestic migration. Table 1 and Figure 5 also suggest that in-migration and out-migration flows tend to increase and decrease proportionately. For example, during 2005-2013, the average ratio of in-migrants to out-migrants (i.e., migration ratio) was 1.31. That is, 1.31 persons moved into Texas for each person that moved out of Texas. For seven of the nine years in the time series, the migration ratio was between 1.28 and 1.35, or less than +/- 0.05 from the 1.31 average. The two exceptions were:
2006, the year of greatest net in-migration, when the ratio was 1.37; and, 2010, the year of least net migration, when the ratio was 1.20. These two years also coincide with significant drivers of migration: 2006 is the year after hurricane Katrina displaced around 85,0001 Louisiana residents to Texas, and 2010 was the year after the end of the ‘great recession’ when many people sought employment opportunities outside their home state.
Figure 4: The 10 U.S. States with the Largest Average Annual Net Domestic Migration by Rank, 2005-2013
Source: U.S. Census Bureau ACS 1-Year PUMS 2005-2013
Table 1: Texas Domestic Migration Flows, 2005-2013
In-Migrants
Out- Migrants
Net Migrants
Migration Ratio
Year
2005 501,108 386,021 115,087 1.30
2006 628,514 459,110 169,404 1.37
2007 560,921 415,249 145,672 1.35
2008 552,260 418,500 133,760 1.32
2009 499,416 375,245 124,171 1.33
2010 483,162 401,885 81,277 1.20
2011 527,306 408,782 118,524 1.29
2012 499,428 389,073 110,355 1.28
2013 545,715 411,966 133,749 1.32
Total 4,797,830 3,665,831 1,131,999 1.31
Mean 533,092 407,315 125,778 1.31
Source: U.S. Census Bureau ACS 1-Year PUMS, 2005-2013
125,778
69,801
67,501
53,863
48,050
38,189
33,504
27,763
25,422
24,684
Texas
Florida
North Carolina
Arizona
Georgia
South Carolina
Colorado
Washington
Oregon
Tennessee

4
net domestic migration with Colorado and Oklahoma. In other words, Texas lost more migrants to Colorado and Oklahoma than it gained from these two states.
Origins of Domestic Migrants to Texas
In the previous section, we showed that about 1.3 persons moved into Texas for each person that moved out of Texas. Here, we describe the origins of Texas’ domestic migrants. We also touch upon the destinations of these migrants within the state. A forthcoming brief on county and metropolitan migration patterns in Texas examines migrant destinations in greater detail. Table 2 presents the top 10 sending and receiving states for Texas in 2013. California was the largest sender and receiver for Texas’ domestic migrants. The other top senders and receivers tend to be states with large populations and states that are geographically near Texas. Figure 6 examines in-migration and out-migration together using gross migration flows – the sum of the in-migration to Texas plus the out-migration from Texas. The 10 states in Figure 6 represent the majority (51.0 percent) of the gross migration between Texas and the other 49 states. The largest gross flow in 2013 was between California and Texas. With this, there were about two Californians moving to Texas for each Texan that moved to California. Also, we find that, among these top 10 gross migration states, Texas experienced negative
501,108
628,514
560,921
552,260
499,416
483,162
527,306
499,428
545,715
386,021
459,110
415,249
418,500
375,245
401,885
408,782
389,073
411,966
115,087
169,404
145,672
133,760
124,171
81,277
118,524
110,355
133,749
2005
2006
2007
2008
2009
2010
2011
2012
2013
Out-Migrants In-Migrants
Figure 5: Domestic In-Migration, Out-Migration, and Net Migration for Texas, 2005-2013
Source: U.S. Census Bureau ACS 1-Year PUMS 2005-2013
Table 2: Top 10 Sending and Receiving States for Texas Domestic Migrants Flows, 2013
Sending States Receiving States
Rank
In-Migrants To Texas
Out-Migrants From Texas
1 California California
2 Florida Oklahoma
3 Illinois Colorado
4 Oklahoma Louisiana
5 Louisiana Florida
6 New Mexico Arizona
7 New York Washington
8 Arizona New Mexico
9 Colorado Arkansas
10 Georgia New York
Source: U.S. Census Bureau ACS 1-Year PUMS, 2013

5
Next, we examine the primary destination counties within Texas for domestic migrants. Figure 7 presents the top 10 counties for domestic in-migration to Texas during 2009-2013. Please note that these are county-to-county flows between states and, as such, do not include county-to-county flows within Texas. A more detailed analysis of county and metropolitan migration will be the focus of a forthcoming brief. Figure 7 shows the domestic migration patterns of the top 10 destination counties in Texas. These counties are also among the state’s most populated and, taken together, account for more than half of the total Texas population. Harris County, the state’s most populous county, is also the top Texas county for domestic migration. According to the 2009-2013 5-Year ACS Summary File2, Harris County experienced net domestic migration of 21,693 persons which was 2.3 times greater than Bexar County’s 9,477, the second highest net domestic migration county in Texas. Also noteworthy are Dallas and El Paso counties which experienced both
high in-migration and high out-migration but had low net domestic migration in spite of their high migration flows. The primary origin counties for domestic migrants to Texas are among the nation’s largest urbanized areas. In descending order, Los Angeles County (Los Angeles, CA), Maricopa County (Phoenix, AZ), Cook County (Chicago, IL), Orange County (Santa Ana, CA), and San Diego County (San Diego, CA) represent the top five origin counties during 2009-2013, accounting for around 11.0 percent of the domestic in-migration to Texas (U.S. Census 2015b). As for domestic out-migrants from Texas, the top five sending counties (in descending order) were Harris, Dallas, Bexar, Tarrant, and El Paso. For the state as a whole, the top five destination counties (in descending order) were Maricopa County (Phoenix, AZ), Oklahoma County (Oklahoma City, OK), Los Angeles County (Los Angeles, CA), San Diego County (San Diego, CA), and Clark County (Las Vegas, NV) (U.S. Census 2015b).
Figure 6: Top 10 Gross Migration States for Domestic Migration to Texas, 2013
Source: U.S. Census Bureau ACS 1-Year PUMS, 2013
62,386
28,906
33,321
28,457
30,672
19,139
19,451
22,049
21,129
18,924
31,499
29,051
19,988
22,259
12,719
23,141
18,428
15,504
14,803
14,715
California
Oklahoma
Florida
Louisiana
Illinois
Colorado
Arizona
New Mexico
New York
Georgia
Out-Migrants From Texas In-Migrants to Texas

6
Phoenix, and Las Vegas are among the principal U.S. cities linked to Texas cities such as Houston, Dallas, and San Antonio through strong migration flows and counterflows.
In general, we see a pattern where the primary inflows and outflows of interstate domestic migrants originate in counties with large metropolitan populations. Within those, Los Angeles, San Diego,
74,661
42,472
40,259
37,521
30,340
24,540
21,653
20,687
17,351
14,693
52,968
32,995
37,448
28,556
21,309
23,990
17,669
16,100
12,351
6,042
Net Migration=21,693
Net Migration=9,477
Net Migration=2,811
Net Migration=8,965
Net Migration=9,031
Net Migration=550
Net Migration=3,984
Net Migration=4,587
Net Migration=5,000
Net Migration=8,651
Harris
Bexar
Dallas
Tarrant
Travis
El Paso
Bell
Collin
Denton
Williamson
Domestic Out-Migration Domestic In-Migration
Figure 7: Top 10 Destination Counties for Interstate Domestic Migration to Texas, 2009-2013
Source: U.S. Census Bureau ACS 5-Year Summary Data, 2009-2013
Characteristics of Domestic Migrants
Earlier, it was noted that from 2005 through 2013, net domestic migration has added over a million persons to the Texas population. Beyond affecting the size of the population, migration also can affect the composition of a population. In this section, the population characteristics of Texas’ domestic migrants are described.
Age and Sex.
Migration tends to be selective with particular population characteristics. This is especially true for age. Figure 8 presents the 2005-2013 mean age distributions for domestic migrants and the total Texas population. We see that the 18-44 year old age group accounts for the majority of domestic migration to and from Texas. For example, where 58.0 percent of out-migrants are in this age group, the 18-44 year old group accounts for only 39.4 percent of the total Texas population. This pattern reverses in the older age groups. For example, the
65 years and older group accounts for 4.5 percent of domestic out-migrants even though this age group makes up 10.5 percent of the total Texas population, indicating the lower likelihood of those in the older age categories moving into or out of Texas. For the 2005 through 2013 time period, Texas experienced positive net domestic migration in all four age groups. This is shown in Figure 9 which presents the average numbers of domestic In-migrants and out-migrants for 2005-2013. Again, the 18-44 year old age group is predominant, having the greatest numbers of in-migrants, out-migrants, and net migrants. Also, as before, the 65 years and older group has the least domestic migration. When in-migration and out-migration are compared, there are some differences among the age groups. Using the migration ratio (i.e., the ratio of in-migration to out-migration), we see that the predominant migration group, those 18-44 years old, has the lowest ratio, at 1.26. That is, there were 1.26

7
contrast, the oldest migration group, those 65 years and older, has the highest migration ratio, at 1.52. Thus, the oldest age category has relatively more people moving into the state than people moving out of the state and this suggests that Texas is to some extent a destination state for retirees.
in-migrants for each out-migrant. The 18-44 year old age group includes people starting and establishing careers. Their low migration ratio likely reflects this group’s higher propensity to move into and out of the state based on employment opportunities. By
23.8%
55.9%
15.1%
5.2%
22.4%
58.0%
15.1%
4.5%
26.3%
39.4%
23.8%
10.5%
Under 18
18-44
45-64
65 and Older
All Texans Domestic Out-Migration Domestic In-Migration
Figure 8: Mean Age Percent Distribution for Domestic Migrants and the Total Population in Texas, 2005-2013
Source: U.S. Census Bureau ACS 1-Year PUMS 2005-2013
126,947
298,082
80,464
27,598
91,218
236,094
61,573
18,430
1.39
1.261.31
1.52
0.00
0.20
0.40
0.60
0.80
1.00
1.20
1.40
1.60
-
50,000
100,000
150,000
200,000
250,000
300,000
350,000
400,000
450,000
Under 18 18-44 45-64 65 and Older
In-Migrants Out-Migrants Ratio of In-Migrants to Out-Migrants
Figure 9: Mean Age Size Distribution and Migration Ratio for Domestic Migrants in Texas, 2005-2013
Source: U.S. Census Bureau ACS 1-Year PUMS 2005-2013

8
Table 3 and Figure 10 examine the age and sex of 2013 domestic migrants. As seen in the 2005-2013 trend data, 18-44 year olds again are the primary domestic migrants while the 65 years and older group has the lowest domestic in-migration rates. These general patterns hold for both males and females. However, the data suggest migration selectivity based on sex as well as age. For all of the age categories except 65 years and older, there are more male than female net domestic migrants. In the 65 years and older age group, we find that
females predominate domestic migration. This occurs in large part because there are numerically more females than males in the 65 years and over age group. Additionally, females in the 65 years and over age group have higher migration rates than males. The higher female migration rates in this age group could reflect sex-related health and disability differences. Overall, though, Table 3 shows that males had higher in-migration, out-migration, and net migration rates than females in Texas for 2013.
17,291
52,202
9,344
576
14,863
30,691
5,176
3,606
Under 18
18-44
45-64
65 and Older
Female Male
Figure 10: Net Domestic Migration to Texas by Age and Sex, 2013
Source: U.S. Census Bureau ACS 1-Year PUMS, 2013
Table 3: Age by Sex Domestic Migration Rates per 1,000 Persons in Texas, 2013
Male Female
In-Migration Out-Migration Net Migration In-Migration Out-Migration Net Migration
Under 18 17.41 12.35 5.05 17.20 12.64 4.56
18-44 34.16 24.00 10.16 28.67 22.53 6.14
45-64 13.69 10.67 3.02 12.72 11.11 1.61
65 and Older 8.77 8.33 0.44 10.01 7.83 2.18
All 22.29 16.16 6.13 19.56 15.42 4.14
Source: U.S. Census Bureau ACS 1-Year PUMS 2013

9
Race/Ethnicity.
Next, the race/ethnicity composition of Texas’ domestic migrants is examined. Figure 11 has the 2005-2013 average percent distributions of domestic migrants by race/ethnicity. With these nine years of data, we see that non-Hispanic Anglos (henceforth referred to as Anglos) were the predominant race/ethnicity group for Texas’ domestic migration. Anglos accounted for more than half of the state’s domestic in-migrants and out-migrants. Also, the Anglo share of domestic migration was greater than its share of the total state population. From 2005 through 2013, Anglos comprised 54.3 percent of all domestic in-migrants but only 46.2 percent of the Texas population. Hispanics made up the second largest group of domestic migrants in Texas. However, unlike Anglos, the 22.4 percent Hispanic share of domestic in-migration was less than this group’s 36.8 percent share of the total Texas population. As with Anglos, the non-Hispanic Black population (henceforth, Black) had more than proportional domestic in-migration. Blacks represented 14.9 percent of all domestic in-migration while accounting for only 11.4 percent of the total Texas population.
Non-Hispanic Asians (henceforth, Asian) also had more than proportional domestic in-migration. Asians represented 3.6 percent of the total state population and 5.5 percent of the domestic in-migrants to Texas. Finally, the non-Hispanic Other3 group (henceforth, Other) also had more than proportional domestic in-migration. From 2005 through 2013, Others represented 3.0 percent of all domestic in-migrants but only 1.7 percent of the total Texas population. Thus, among the five race/ethnicity groups, only Hispanics had domestic migration shares that were less than proportional to their overall population share. Yet, even with this, the Hispanic population in Texas grew by 29.6 percent between 2005 and 2013. This growth was much higher than the 19.3 percent increase in the state’s total population. There are two reasons for this apparent paradox. First, international migration contributes to the growth of the Hispanic population in Texas. A second reason is natural increase: Hispanics in Texas are a relatively young population and, consequently, are experiencing considerably more births than deaths.
Figure 11: Mean Race/Ethnicity Percent Distribution for Domestic Migrants and the Total Population in Texas, 2005-2013
Source: U.S. Census Bureau ACS 1-Year PUMS 2005-2013
54.3%
14.9%
22.4%
5.5%
3.0%
58.4%
12.3%
20.8%
4.8%
3.8%
46.4%
11.4%
36.8%
3.6%
1.7%
Anglo, Non-Hispanic
Black, Non-Hispanic
Hispanic
Asian, Non-Hispanic
Other, Non-Hispanic
All Texans Domestic Out-Migratiion Domestic In-Migration

10
Table 4 examines the mean 2005-2013 domestic migration rates of race/ethnicity groups in Texas. Here, we see that Hispanics had the lowest domestic in-migration and out-migration rates of any group. Even so, this group’s net migration rate was 3.9 persons per 1,000. This occurs because Hispanics had around 1.41 persons moving to Texas for each person who moved out of the state. Table 4 also shows that the Other group had the highest rates of in-migration and out-migration but the smallest net migration rate. This happened because this group’s migration ratio was almost flat at 1.01 persons moving into Texas for each person moving out. Asians and Blacks had the highest net migration rates with each group adding 10.9 persons per 1,000 through net domestic migration. Asians had a
migration ratio of 1.51 while the Black ratio was the highest at 1.59. By comparison, Anglos experienced a net migration rate of 4.6 persons per 1,000 even though this group had much higher in- and out-migration rates than Hispanics. The reason is that Anglos had a lower migration ratio with 1.22 persons moving to Figure 12 has the single year domestic migration for 2013. Generally, the 2013 data reflect the same race/ethnicity trends found in the 2005-2013 time series. Anglos dominate the overall domestic migration flows in Texas with 54,128 net migrants. In spite of a relatively low net migration rate, Hispanics have the second highest level at 31,721. This occurs because of a large Hispanic base population and this group’s relatively high migration ratio.
Table 4: Mean Domestic Migration Rates per 1,000 Residents by Race/ Ethnicity Group in Texas, 2005-2013
In- Migration Out-Migration Net Migration Migration Ratio
Anglo, Non-Hispanic 25.7 21.1 4.6 1.22
Black, Non-Hispanic 29.0 18.1 10.9 1.59
Hispanic 13.4 9.5 3.9 1.41
Asian, Non-Hispanic 33.3 22.3 10.9 1.51
Other, Non-Hispanic 37.5 37.5 0.0 1.01
All Race/Ethnicity Groups 22.0 16.8 5.2 1.31
Source: U.S. Census Bureau ACS 1-Year PUMS 2005-2013
291,288
78,776
117,997
36,992
20,662
237,160
49,023
86,276
24,650
14,857
54,128
29,753
31,721
12,342
5,805
Anglo, Non-Hispanic
Black, Non-Hispanic
Hispanic
Asian, Non-Hispanic
Other, Non-Hispanic
Net Migration Domestic Out-Migratiion Domestic In-Migration
Figure 12: Number of Texas Domestic Migration by Race/Ethnicity, 2013
Source: U.S. Census Bureau ACS 1-Year PUMS, 2013
11
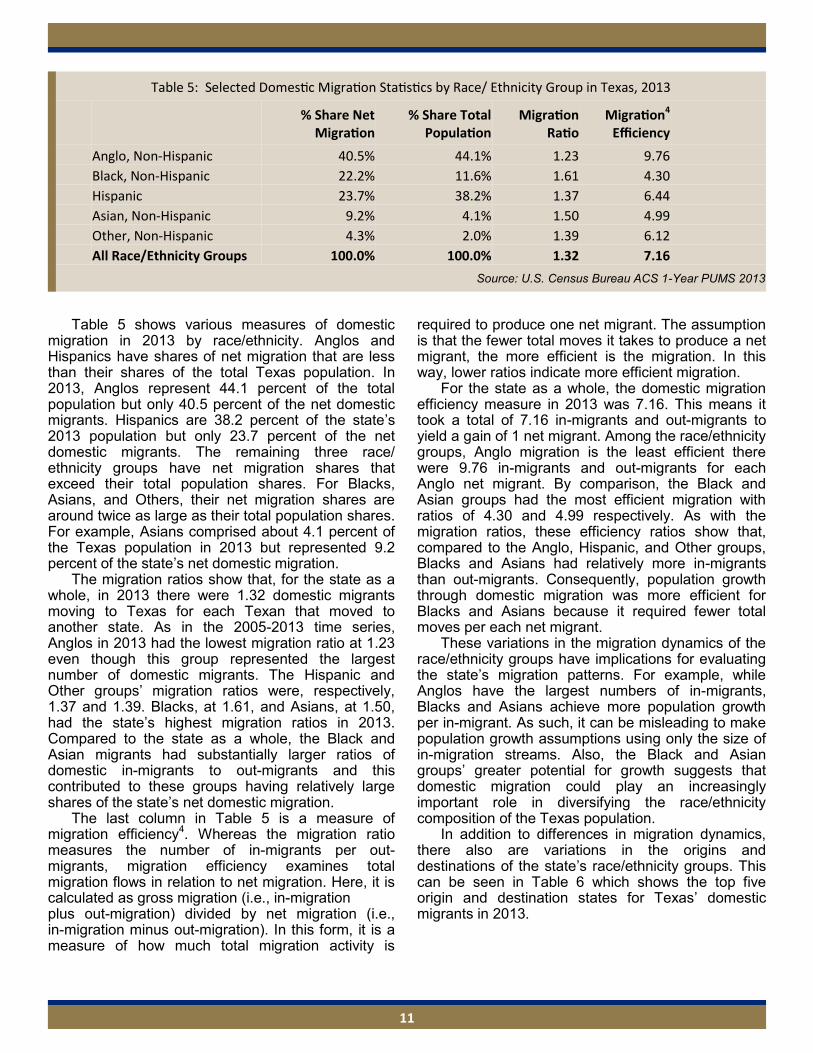
Table 5 shows various measures of domestic migration in 2013 by race/ethnicity. Anglos and Hispanics have shares of net migration that are less than their shares of the total Texas population. In 2013, Anglos represent 44.1 percent of the total population but only 40.5 percent of the net domestic migrants. Hispanics are 38.2 percent of the state’s 2013 population but only 23.7 percent of the net domestic migrants. The remaining three race/ethnicity groups have net migration shares that exceed their total population shares. For Blacks, Asians, and Others, their net migration shares are around twice as large as their total population shares. For example, Asians comprised about 4.1 percent of the Texas population in 2013 but represented 9.2 percent of the state’s net domestic migration. The migration ratios show that, for the state as a whole, in 2013 there were 1.32 domestic migrants moving to Texas for each Texan that moved to another state. As in the 2005-2013 time series, Anglos in 2013 had the lowest migration ratio at 1.23 even though this group represented the largest number of domestic migrants. The Hispanic and Other groups’ migration ratios were, respectively, 1.37 and 1.39. Blacks, at 1.61, and Asians, at 1.50, had the state’s highest migration ratios in 2013. Compared to the state as a whole, the Black and Asian migrants had substantially larger ratios of domestic in-migrants to out-migrants and this contributed to these groups having relatively large shares of the state’s net domestic migration. The last column in Table 5 is a measure of migration efficiency4. Whereas the migration ratio measures the number of in-migrants per out-migrants, migration efficiency examines total migration flows in relation to net migration. Here, it is calculated as gross migration (i.e., in-migration plus out-migration) divided by net migration (i.e., in-migration minus out-migration). In this form, it is a measure of how much total migration activity is
required to produce one net migrant. The assumption is that the fewer total moves it takes to produce a net migrant, the more efficient is the migration. In this way, lower ratios indicate more efficient migration. For the state as a whole, the domestic migration efficiency measure in 2013 was 7.16. This means it took a total of 7.16 in-migrants and out-migrants to yield a gain of 1 net migrant. Among the race/ethnicity groups, Anglo migration is the least efficient there were 9.76 in-migrants and out-migrants for each Anglo net migrant. By comparison, the Black and Asian groups had the most efficient migration with ratios of 4.30 and 4.99 respectively. As with the migration ratios, these efficiency ratios show that, compared to the Anglo, Hispanic, and Other groups, Blacks and Asians had relatively more in-migrants than out-migrants. Consequently, population growth through domestic migration was more efficient for Blacks and Asians because it required fewer total moves per each net migrant. These variations in the migration dynamics of the race/ethnicity groups have implications for evaluating the state’s migration patterns. For example, while Anglos have the largest numbers of in-migrants, Blacks and Asians achieve more population growth per in-migrant. As such, it can be misleading to make population growth assumptions using only the size of in-migration streams. Also, the Black and Asian groups’ greater potential for growth suggests that domestic migration could play an increasingly important role in diversifying the race/ethnicity composition of the Texas population. In addition to differences in migration dynamics, there also are variations in the origins and destinations of the state’s race/ethnicity groups. This can be seen in Table 6 which shows the top five origin and destination states for Texas’ domestic migrants in 2013.
Table 5: Selected Domestic Migration Statistics by Race/ Ethnicity Group in Texas, 2013
% Share Net Migration
% Share Total Population
Migration Ratio
Migration4 Efficiency
Anglo, Non-Hispanic 40.5% 44.1% 1.23 9.76
Black, Non-Hispanic 22.2% 11.6% 1.61 4.30
Hispanic 23.7% 38.2% 1.37 6.44
Asian, Non-Hispanic 9.2% 4.1% 1.50 4.99
Other, Non-Hispanic 4.3% 2.0% 1.39 6.12
All Race/Ethnicity Groups 100.0% 100.0% 1.32 7.16
Source: U.S. Census Bureau ACS 1-Year PUMS 2013

12
As for origins, California is the number one sender for all groups except Blacks who are most likely to move to Texas from Louisiana. We see more variation in the second tier of sending states: Florida is the number two sender of Anglos, Illinois is number two for Blacks, New Mexico is number two for Hispanics, and New York is the number two sender for both Asians and Others. Compared to the top tier of origin states, the number one destinations for Texas outmigrants are more varied. California is the top destination for only two groups: Hispanics and Asians. Oklahoma is the number one destination for Anglos and Others. For Black domestic migrants, Louisiana is the number one destination state. Thus, while the primary domestic origins tend to be more distant states, the primary destinations tend be adjacent states. There is some overlap between the origins and destinations of the groups, suggesting a pattern of state-specific flows and counterflows for particular groups. As noted earlier, Louisiana is the number one origin and destination state for Texas’ Black domestic migrants. Similarly, for both Hispanics and Asians, California is the number one origin and number one destination state. However, this pattern of migration flows and counterflows is not consistent across all the race/ethnicity groups. For both Anglos and Others, California is the number one origin and Oklahoma is
the number one destination. Earlier we noted there are variations in the migration dynamics of the different race/ethnicity groups. Table 6 has shown there also is selectivity in the origins and destinations of these migrants. These are two examples of how the aggregate migration data can mask underlying trends. For example, the 2005-2013 data showed an overall net migration rate of 5.2 persons per 1,000 but when this was disaggregated by race/ethnicity in Table 4, the rate ranged from 0.0 to 10.9 persons per 1,000. Similarly, while California is the number one origin state for the overall domestic migrant population, disaggregation showed that Louisiana was the number one origin state for domestic Black migrants. One further characteristic is useful when examining the race/ethnicity of domestic migrants to Texas. This characteristic is nativity which distinguishes whether a person was born in the United States. The nativity of domestic migrants helps to understand race/ethnicity in the context of international migration (i.e., immigration). That is, immigrants initially can settle in a particular state and later move to another state at which point they become domestic migrants. Figure 13 shows the nativity and race/ethnicity of Texas’ domestic migrants in 2013.
Table 6: Top Five Origin and Destination States for Texas Domestic Migrants by Race/Ethnicity, 2013
Origins of Domestic In-Migrants
Anglo
Non-Hispanic
Black Non-Hispanic
Hispanic Asian
Non-Hispanic
Other Non-Hispanic
Rank Name Freq. Name Freq. Name Freq. Name Freq. Name Freq.
1 California 26,092 Louisiana 10,453 California 18,395 California 9,844 California 3,751
2 Florida 19,044 Illinois 6,548 New Mexico 11,758 New York 2,325 New York 2,029
3 Oklahoma 17,778 Michigan 4,603 Florida 8,466 Ohio 2,071 Oklahoma 1,827
4 Illinois 14,861 Georgia 4,567 Illinois 7,112 Illinois 1,980 Virginia 1,802
5 New York 12,736 California 4,304 Arizona 5,234 Florida 1,834 North Carolina 1,438
Destinations of Domestic Out-Migrants
Anglo
Non-Hispanic
Black Non-Hispanic
Hispanic Asian
Non-Hispanic
Other Non-Hispanic
Rank Name Freq. Name Freq. Name Freq. Name Freq. Name Freq.
1 Oklahoma 19,376 Louisiana 5,767 California 8,210 California 4,637 Oklahoma 1,699
2 California 15,494 Georgia 4,603 New Mexico 7,111 Florida 2,062 Georgia 1,689
3 Colorado 13,929 Kentucky 3,995 Oklahoma 5,899 Washington 1,471 California 1,501
4 Florida 11,583 Pennsylvania 2,993 New York 5,331 New York 1,349 Colorado 1,154
5 Arizona 11,511 Virginia 2,782 Colorado 5,319 Colorado 1,208 Louisiana 896
Source: U.S. Census Bureau ACS 1-Year PUMS 2013

13
while the average age of native-born Asians was 17.4 years old – a 25.2 year age gap. By comparison, the average age for native-born Anglos in Texas was 41.0 years compared to 45.6 years for foreign-born Anglos - an age gap of only 4.6 years. The large age gap between foreign- and native-born Asians suggests that many of these native-born Asians are first generation children of immigrants. Thus, in addition to its impact on the state’s recent population growth, the Asian group’s large percentage of foreign-born and first-generation American domestic migrants is adding to the population diversity of Texas. In summary, recent domestic migration to Texas has been characterized by both geographic and demographic selectivity. Because of such selectivity, domestic migration is affecting not only the size but also the distribution and composition of the Texas population.
Figure 13 shows that among the race/ethnicity groups, Anglos have the largest percentages of native-born for both domestic migrants and the total Texas population. For example, 96.1 percent of Anglo domestic in-migrants are native-born. This is followed by Blacks (91.7 percent), Others (84.3 percent), Hispanics (70.3 percent), and Asians (29.5 percent). Thus, for Anglos, only about 4 percent of the domestic in-migrants were foreign-born compared to around 70 percent for Asians. Because foreign-born, domestic migrants were initially immigrants, the low percentage of native-born migrants for Asians indicates the ‘newness’ of this group to the both the United States and Texas. The relative newness of Asian domestic migrants to Texas becomes more apparent when we examine the age structure of race/ethnicity groups in Texas. Table 7 shows that, in 2013, the average age of foreign-born Asians in Texas was 42.6 years old
Figure 13: Percent Native-Born by Race/Ethnicity and Domestic Migration Status in Texas, 2013
Source: U.S. Census Bureau ACS 1-Year PUMS, 2013
Table 7: Average Age in Years of Race/Ethnicity Groups in Texas by Nativity, 2013
Race/Ethnicity Foreign-Born Native-Born Age Gap
Anglo, Non-Hispanic 45.6 41.0 4.6
Black, Non-Hispanic 38.2 34.1 4.1
Hispanic 41.1 25.6 15.5
Asian, Non-Hispanic 42.6 17.4 25.2
Other, Non-Hispanic 40.4 26.6 13.7
Source: U.S. Census Bureau ACS 1-Year PUMS 2013
96.1%
91.7%
70.3%
29.5%
84.3%
96.7%
94.4%
73.7%
33.0%
93.8%
96.9%
94.5%
69.7%
28.9%
90.7%
Anglo, Non-Hispanic
Black, Non-Hispanic
Hispanic
Asian, Non-Hispanic
Other, Non-Hispanic
All Texans Out-Migrant In-Migrant
14
more population growth per migrant. For example, in 2013, Anglos required 9.76 total migrants for each net migrant compared to the Black group which had 4.30 total migrants for each net migrant and Asians with 4.99 migrants per net migrant.
For overall domestic migration, California was the predominant sender and receiver of Texas migrants. But this aggregate pattern did not apply to all race/ethnicity groups: Louisiana was the number one origin and destination state for the Black group; Oklahoma was the number one destination state for Texas’ Anglos and Others; and New Mexico was the number two origin and destination state for Texas Hispanics.
As a whole, more than 80.0 percent of domestic migrants to Texas were native-born. When disaggregated by race/ethnicity, this ranged from around 30.0 percent native born for Asians to more than 96.0 percent for Anglos.
Migration selectivity such as that described above suggests that it can be misleading to make population growth assumptions based only on the size of the in-migration stream to Texas. Migration in-flows occur alongside out-flows and these flows tend be selective both geographically and demographically. For example, an in-migration surge might add to the state’s overall population size but the impact of this growth would occur in a handful of large urbanized areas. Similarly, we have shown that the number of net migrants per in-migrant varies substantially among race/ethnicity groups. As a result, the net population impact of a given in-migration flow to Texas depends not just on its size but also on its race/ethnicity composition. Texas continues to attract large numbers of people from the rest of the United States. Some of these states are quite distant while others share a common border with Texas. The range of distances of these sending states suggests that people are moving to Texas for a variety of reasons. Migration research finds that more distant moves tend to be employment-related while shorter distance moves tend to involve housing choices and family relations (Ihrke 2014). Whatever the reasons, this movement of people into Texas is not only helping to grow our population, it also is adding to our population diversity. In this respect, much of the state’s future is being shaped by today’s patterns of domestic migration.
Summary and Conclusions
This brief described how domestic migration is affecting the size and composition of the Texas population. In recent years, Texas has been the number one destination for the nation’s domestic migrants. Between 2005 and 2013, 4.8 million people moved to Texas from other states. During this same time period, the state’s population grew by an average of 125,778 persons per year due to net domestic migration. Compared to the state’s total population, domestic migrants to Texas are younger, more likely to be male, and less likely to be Hispanic. In recent years, domestic migration has become a pervasive part of the state’s population dynamics. Though an ubiquitous part of Texas’ growth, this migration tends to be geographically and demographically selective. As such, aggregate measures such as overall net migration can mask underlying trends. For example, by disaggregating the data we found:
Recent migration between Texas and the rest of the U.S. involved all of the other 49 states. However, the majority of domestic migrants to Texas came from just 10 states: Arizona, California, Colorado, Florida, Georgia, Illinois, Louisiana, New Mexico, New York, and Oklahoma.
Recent interstate domestic migration occurred in 251 of the state’s 254 counties. However, most of these migration flows originated or ended in a handful of the nation’s most populous counties. For example, 48.6 percent of recent domestic in-migration to Texas occurred in six Texas counties: Bexar, Dallas, El Paso, Harris, Tarrant, and Travis.
The 18-44 year old age group comprises 39.4 percent of the Texas population but accounts for more than half of the state’s domestic migration.
Males have higher net domestic migration rates than females for all age groups except the 65 years and older group.
The state’s race/ethnicity groups differ in their migration dynamics. For 2005-2013, the state’s nine year average net domestic migration rate was 5.2 per 1,000 but when disaggregated by race/ethnicity, this rate ranged from 0.0 per 1,000 (for the Other group) to 10.9 per 1,000 (for the Black and Asian groups).
Hispanics comprised 36.8 percent of the state’s total population but accounted for around only 20.0 percent of domestic migration in Texas. The other four race/ethnicity groups (Anglo, Black, Asian, and Other) had migration shares that exceeded their population shares.
Though Anglos have the largest number of domestic in-migrants, Blacks and Asians achieve
15
3 The Other, Non-Hispanic group consists of people who are not of Spanish/Hispanic/Latino origin and are in the following Census-designated race/ethnicity groups: American Indian alone; Alaska Native alone; American Indian and Alaska Native tribes specified or American Indian or Alaska Native, not specified and no other races; Native Hawaiian and Other Pacific Islander alone; Some Other Race alone; and, Two or More Races. 4 The typical formula for migration efficiency is: (Net Migration) / (Gross Migration) * 100. In this form, it expresses net migration as a percentage of total migration such that higher percentages suggest greater efficiency. In this report, we use a variation: (Gross Migration) / (Net Migration) to estimate how many total moves are need to produce 1 net migrant. With this, the lower the number the more efficient the migration.
Notes 1
In the Census Bureau’s surveys, migrants are persons whose current residence is different than their residence one year ago. Based on the ACS PUMS survey, Texas had an average of 30,625 in-migrants from Louisiana for the years 2007-2013. In 2006, 116,112 people moved to Texas from Louisiana and this is around 85,000 more than the 2007-2013 average. 2 The 2013 5-Year ACS Summary File covers the 2009-2013 time period. With this, five years of data are accumulated on a continuous basis. This is done to increase the sample size which improves the survey’s accuracy and permits the inclusion of geographic areas with populations of less than 20,000 persons. Conceptually, these period surveys measure the average characteristics of a geographic area over five years (U.S. Census Bureau 2008).
References
Ihrke, David. 2014. “Reason for Moving: 2012 to 2013.” Current Population Reports, Series P20-574, U.S. Census Bureau (Available: https://www.census.gov/prod/2014pubs/p20-574.pdf 11/16/2015).
U.S. Census Bureau. 2015a. Estimates of the Components of Resident Population Change: April 1, 2010 to July 1, 2013: 2013 Population Estimates (NST-EST2013-01). (Available: http://factfinder.census.gov/faces/tableservices/jsf/pages/productview.xhtml?src=bkmk 03/10/2016)
_________________. 2015b. “County-to-County Migration Flows: 2009-2013 ACS.” (Available: https://www.census.gov/hhes/migration/files/acs/county-to-county/2009-2013/County-to-County%202009-2013%20-%20Ins%20Outs%20Nets%20Gross.xlsx 03/10/2016)
_________________. 2014. “2007-2011 ACS County-to-County Migration Files Documentation.” (Available: http://www.census.gov/hhes/migration/files/acs/county-to-county/2007-2011/2007-2011%20Migration%20Flows%20Documentation.pdf 07/14/2014)
_________________. 2011. “Intercensal Estimates of the Resident Population for the United States, Regions, States, and Puerto Rico: April 1, 2000 to July 1, 2010 (ST-EST00INT-01). (Available: http://www.census.gov/popest/data/intercensal/state/tables/ST-EST00INT-01.xls, 07-21-2014)
_________________. 2008. “A Compass for Understanding and Using American Community Survey Data: What General Data Users Need to Know.” (Available: https://www.census.gov/content/dam/Census/library/publications/2008/acs/ACSGeneralHandbook.pdf, 03/03/2016)
________________. (various years). American Community Survey (ACS): One-Year Public Use Microdata Sample (PUMS). (Available: http://www.census.gov/programs-surveys/acs/data/pums.html 09/03/2015).
________________. (various years). American Community Survey (ACS): Five-Year Summary Data. (Available: http://factfinder.census.gov/faces/nav/jsf/pages/index.xhtml 09/03/2015).
White, Steve, Lloyd B. Potter, Helen You, Lila Valencia, Jeffrey A. Jordan, and Beverly Pecotte. 2015. “Origins of Immigrants to Texas.” Office of the State Demographer. (Available: http://osd.state.tx.us/Publications/2015_05_Origins.pdf 06/25/2015).

16
P.O. Box 13455 Austin, TX 78701 Ph: 512-463-8390 Fax: 512-463-7632
http://osd.texas.gov
Email: [email protected]
501 West Cesar E. Chavez Blvd. San Antonio, TX 78207-4415
Ph: 210-458-6543 Fax: 210-458-6541
http://txsdc.utsa.edu
Email: [email protected]