Embed Size (px)
Citation preview
ABN 78 087 649 929
46TH ANNUAL REPORT 2015


CAPE - Customer Owned Banking ABN 78 087 649 929
46th Annual Report 2015

A N N U A L R E P O R T
2015CONTENTS
CHAIRMAN’S REPORT 6
DIRECTORS’ REPORT 8
AUDITOR’S INDEPENDENCE DECLARATION 13
INDEPENDENT AUDITOR’S REPORT 14
DIRECTOR’S DECLARATION 16
STATEMENT OF PROFIT AND LOSS AND OTHER COMPREHENSIVE INCOME 17
STATEMENT OF CHANGES IN MEMBER EQUITY 18
STATEMENT OF FINANCIAL POSITION 19
STATEMENT OF CASH FLOWS 20
TABLE OF OTHER NOTES TO ACCOUNTS 21
NOTES TO ACCOUNTS 22
1. STATEMENT OF SIGNIFICANT ACCOUNTING POLICIES 22
2. STATEMENT OF PROFIT AND LOSS AND OTHER COMPREHENSIVE INCOME 31
3. INCOME TAX EXPENSE 33
4. CASH AND CASH EQUIVALENTS 33
5. LIQUID INVESTMENTS 34
6. RECEIVABLES 34
7. LOANS TO MEMBERS 34
8. PROVISION ON IMPAIRED LOANS 36
9. AVAILABLE FOR SALE INVESTMENTS 38
10. PROPERTY, PLANT AND EQUIPMENT 38
11. TAXATION ASSETS 39

12. INTANGIBLE ASSETS 39
13. DEPOSITS FROM MEMBERS 40
14. CREDITOR ACCRUALS AND SETTLEMENT ACCOUNTS 41
15. TAXATION LIABILITIES 41
16. PROVISIONS 41
17. GENERAL RESERVE FOR CREDIT LOSSES 41
18. FINANCIAL RISK MANAGEMENT OBJECTIVES AND POLICIES 42
19. CATEGORIES OF FINANCIAL INSTRUMENTS 54
20. MATURITY PROFILE OF FINANCIAL ASSETS AND LIABILITIES 56
21. CURRENT AND NON-CURRENT DISSECTION OF FINANCIAL ASSETS AND LIABILITIES 58
22. INTEREST RATE CHANGE PROFILE OF FINANCIAL ASSETS AND LIABILITIES 60
23. FAIR VALUE OF FINANCIAL ASSETS AND LIABILITIES 62
24. FINANCIAL COMMITMENTS 64
25. STANDBY BORROWING FACILITIES 65
26. CONTINGENT LIABILITIES 65
27. DISCLOSURES ON DIRECTORS AND OTHER KEY MANAGEMENT PERSONNEL 66
28. OUTSOURCING ARRANGEMENTS 68
29. SUPERANNUATION LIABILITIES 69
30. NOTES TO STATEMENT OF CASH FLOWS 69
31. CORPORATE INFORMATION 70
32. POST BALANCE SHEET EVENTS 70
ANNUAL GENERAL MEETING 71
6 ANNUAL REPORT 2015
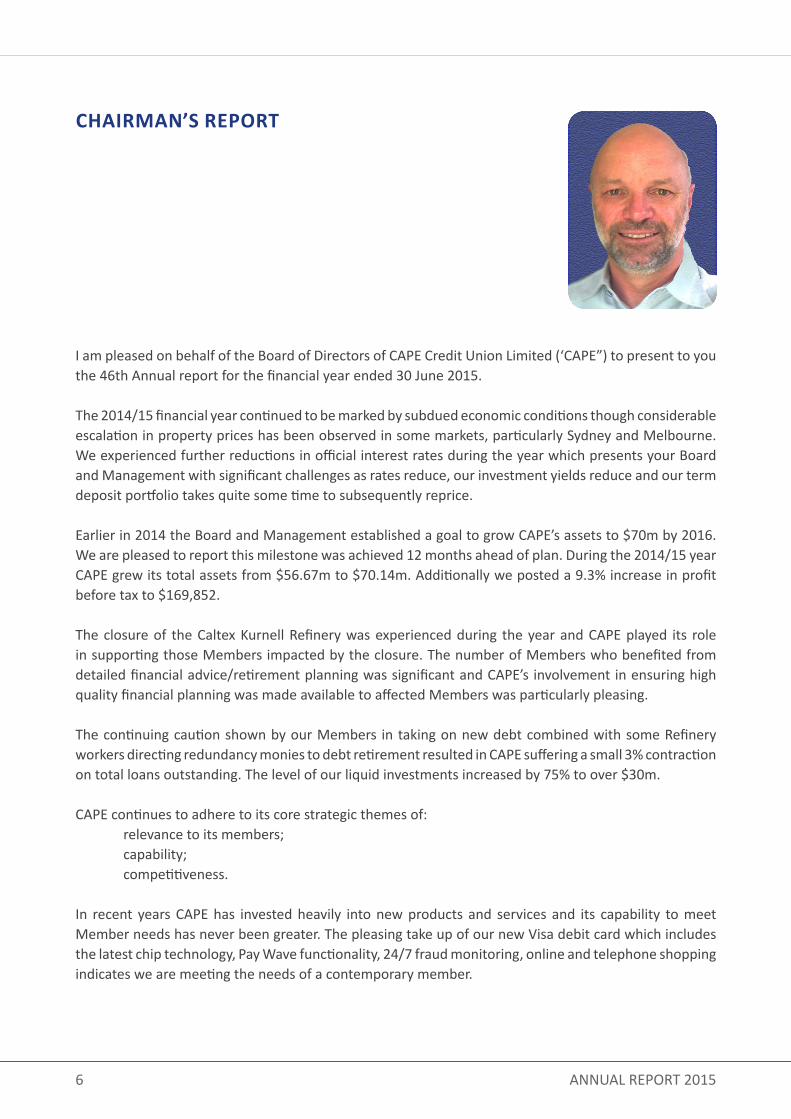
I am pleased on behalf of the Board of Directors of CAPE Credit Union Limited (‘CAPE”) to present to you the 46th Annual report for the financial year ended 30 June 2015.
The 2014/15 financial year continued to be marked by subdued economic conditions though considerable escalation in property prices has been observed in some markets, particularly Sydney and Melbourne. We experienced further reductions in official interest rates during the year which presents your Board and Management with significant challenges as rates reduce, our investment yields reduce and our term deposit portfolio takes quite some time to subsequently reprice.
Earlier in 2014 the Board and Management established a goal to grow CAPE’s assets to $70m by 2016. We are pleased to report this milestone was achieved 12 months ahead of plan. During the 2014/15 year CAPE grew its total assets from $56.67m to $70.14m. Additionally we posted a 9.3% increase in profit before tax to $169,852.
The closure of the Caltex Kurnell Refinery was experienced during the year and CAPE played its role in supporting those Members impacted by the closure. The number of Members who benefited from detailed financial advice/retirement planning was significant and CAPE’s involvement in ensuring high quality financial planning was made available to affected Members was particularly pleasing.
The continuing caution shown by our Members in taking on new debt combined with some Refinery workers directing redundancy monies to debt retirement resulted in CAPE suffering a small 3% contraction on total loans outstanding. The level of our liquid investments increased by 75% to over $30m.
CAPE continues to adhere to its core strategic themes of: relevance to its members; capability; competitiveness.
In recent years CAPE has invested heavily into new products and services and its capability to meet Member needs has never been greater. The pleasing take up of our new Visa debit card which includes the latest chip technology, Pay Wave functionality, 24/7 fraud monitoring, online and telephone shopping indicates we are meeting the needs of a contemporary member.
CHAIRMAN’S REPORT
7CAPE - Customer Owned Banking
CAPE remains very well capitalised and enjoys a sound relationship with our regulator (The Australian Prudential Regulation Authority – “APRA”) and continues to comfortably meet all the prevailing prudential standards. Our Risk and Compliance framework is particularly robust and positions us effectively to address and deal will the challenges and risks that we continue to face.
We expect the coming year to again provide another challenging operating environment. However, the Board is confident that with our focus on organic growth, a strong team of people working with us and our effective risk management will see CAPE remain in a sound financial position.
During the year one of our long-serving directors and Deputy Chairman, Wayne Meredith, stood down for personal reasons. Wayne served on the CAPE Board for approximately 30 years which is an incredible feat. He was a dedicated servant to CAPE and its members. We acknowledge and thank Wayne for the significant contribution he made to our Credit Union.
Finally, I would like to thank my fellow directors, management and staff of CAPE for their hard work and commitment to ensuring we have a successful and viable Credit Union.
I would like to commend this report to members on behalf of the Board of Directors and thank every Member for their continuing patronage and support.
William RankineChairman
8 ANNUAL REPORT 2015
DIRECTORS’ REPORT
INFORMATION ON DIRECTORSYour Directors present their report on CAPE Credit Union Limited (CAPE) for the financial year ended 30 June 2015. CAPE is a company registered under the Corporations Act 2001. The names of the Directors in office at any time during or since the end of the year are:
BILL RANKINE - CHAIRMANQualifications: Member of Australasian Mutuals Institute. Master of Business Administration – Deakin University, Graduate Diploma of Business (Finance) – Edith Cowan University, Diploma in Corporate Management – Institute of Chartered Secretaries, Certificate in Accounting – TAFE.Experience: Formerly an employee of Caltex for 33 years, Member of Board of Directors since January 2007, current Member of the Executive, Audit, Risk, Nominations and Remuneration Committees.
Wayne Meredith - Deputy ChairmanExperience: Formerly IT Project Leader and employee of Caltex for 33 years, Member of Board of Directors since 1984, Member of Executive Committee and the Nominations and Remuneration Committee. Resigned 25 February 2015.
Gordon GoodacreExperience: 39 years experience within mutual Credit Unions holding senior roles at Landmark CU, Reliance CU and Gateway CU. Introduced to CAPE to fill vacant CEO position until fulltime replacement during 2008. Member of Board of Directors since 2008, current member of Nominations and Remuneration Committee. Past Chair of the Audit and Risk Committee.
Cecil Riley - Chairman Nominations and Remuneration CommitteeQualifications: Member of Australasian Mutuals Institute. Experience: Formerly supervisor and employee of Caltex for 40 years; Member of Board of Directors since 1980, current member of Executive Committee and past Board Chair.
Rebecca Murray - Chairperson of Strategic Planning CommitteeQualifications: Bachelor of Science (Hons) Australian National University, MBA Macquarie University, GAICD.Experience: Financial services executive and management consultant with 22 years experience. Senior financial services roles at Zurich, Ipac Securities, Colonial First State, Financial Planning Association and The Australian Retail Credit Association (ARCA). Member of Board of Directors since 2010.

9CAPE - Customer Owned Banking
John McNally - Chairman Audit Committee and Risk CommitteeQualifications: SPQ (Uni NSW), Grad Dip AppSc (Uni NSW), MAppSc (Uni NSW). Member of the Australasian Mutuals Institute.Experience: Principal and Director of LKR Consulting Pty Ltd. Formerly Operational Excellence Manager and employee of Caltex for 36 years. Member of the Board of Directors since 1993, past Board Chair, current Chair of the Audit Committee and Risk Committee, member of the Executive and Strategic Planning Committees.
Robert Norris Experience: Accountant Corporate Finance, employee of AGL/Jemena for 33 years. Director of First Gas Credit Union (AGL) from 1992 – 2003. Alternate Director since August 2003. Member of Board of Directors since 2005, current Member of the Audit Committee and Risk Committee.
Jeanette BrooksQualifications: Bachelor Business (Mgmt & Info Sys) CSU, Graduate Certificate Management UOW, Company Director Diploma, Australian Institute of Company DirectorsExperience: Director Learning Links, Regional General Manager at Australian Unity, formally Chief Executive The INS Group. Over 21 years’ experience in ICT development and operations. Member of Board of Directors since 2012, current Member of the Strategic Planning Committee.
Directors were in office from the beginning of the financial year, unless otherwise stated.
COMPANY SECRETARYThe following person held the position of company secretary during the financial year:
Richard NowakowskiQualifications: Member of Financial Services Institute of Australasia (Fellow), Accountancy Certificate, Six Sigma / TQM. Experience: Chief Risk Officer and Company Secretary at CAPE since January 2012 Previous - 37 years in the financial sector (Big 4 Bank) in Customer Interface; Operational Risk Management; Sales; Lending; Operations; Audit; Compliance; Change, Project & Knowledge Management: 25 years in Senior and National roles.
10 ANNUAL REPORT 2015
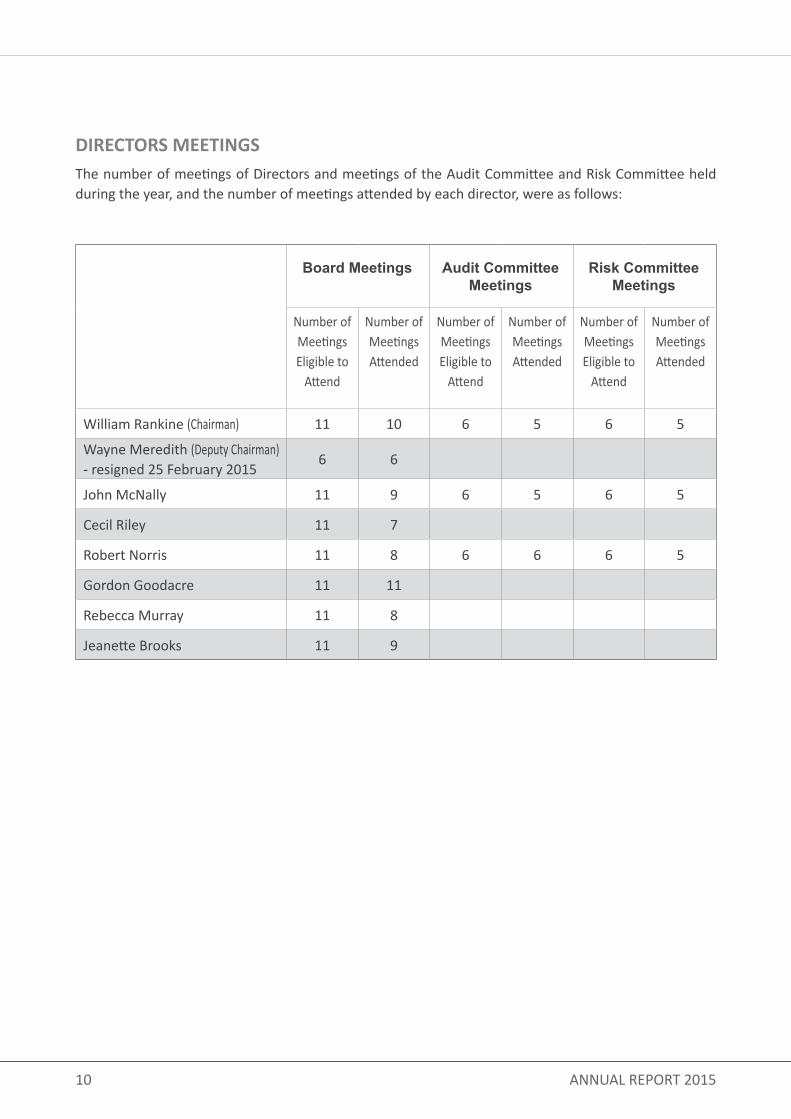
DIRECTORS MEETINGSThe number of meetings of Directors and meetings of the Audit Committee and Risk Committee held during the year, and the number of meetings attended by each director, were as follows:
Board Meetings Audit Committee Meetings
Risk Committee Meetings
Number of Meetings Eligible to
Attend
Number of Meetings Attended
Number of Meetings Eligible to
Attend
Number of Meetings Attended
Number of Meetings Eligible to
Attend
Number of Meetings Attended
William Rankine (Chairman) 11 10 6 5 6 5
Wayne Meredith (Deputy Chairman)- resigned 25 February 2015
6 6
John McNally 11 9 6 5 6 5
Cecil Riley 11 7
Robert Norris 11 8 6 6 6 5
Gordon Goodacre 11 11
Rebecca Murray 11 8
Jeanette Brooks 11 9
11CAPE - Customer Owned Banking
DIRECTORS’ BENEFITSOther than any benefit that may have been derived from loans and deposits provided by, and to, the Credit Union, no Directors have, during the financial year and the period to the date of this report, become entitled to receive any benefit by reason of a contract made by CAPE with:• a related entity with the director; or• a firm of which the director is a member; or• an entity in which the director has a substantial financial interest.
A total amount of $58,000 was paid to the Board of Directors for allocation amongst the individual Board members, at their discretion, as approved by the members at the 2014 Annual General Meeting.
No director has received or become entitled to receive during, or since the financial year, any other benefit because of a contract made by CAPE, controlled credit union, or a related body corporate with a director, a firm of which a director is a member or a credit union in which a director has a substantial financial interest, other than that disclosed in Note 27 of the financial report.
INDEMNIFYING OFFICER OR AUDITORInsurance premiums have been paid to insure each of the Directors and officers of CAPE against any costs and expenses incurred by them in defending any legal proceeding arising out of their conduct while acting in their capacity as an officer of CAPE. In accordance with normal commercial practice, disclosure of the premium amount and the nature of the insured liabilities is prohibited by a confidentiality clause in the contract.
No insurance cover has been provided for the benefit of the auditors of CAPE.
PRINCIPAL ACTIVITIESThe principal activities of CAPE during the year were the provision of retail financial services to members in the form of taking deposits and giving financial accommodation as prescribed by the Constitution.
No significant changes in the nature of these activities occurred during the year.
OPERATING RESULTSThe net profit of CAPE for the year after providing for income tax was $124,955, (2014 $119,678).
DIVIDENDSNo dividends have been paid or declared since the end of the financial year and no dividends have been recommended or provided for by the Directors of CAPE.
12 ANNUAL REPORT 2015
REVIEW OF OPERATIONSCAPE’s activities centre around the provision of financial services to its members. The results for the financial year 2014/15 were consistent with its normal activities and did not change significantly from the previous year.
SIGNIFICANT CHANGES IN STATE OF AFFAIRSThere were no significant changes in the state of the affairs of CAPE during the year.
EVENTS OCCURRING AFTER BALANCE DATE No other matters or circumstances have arisen since the end of the financial year which significantly affected or may significantly affect the operations, or state of affairs of CAPE in subsequent financial years.
LIKELY DEVELOPMENTS AND RESULTSNo other matter, circumstance or likely development in the operations has arisen since the end of the financial year that has significantly affected or may significantly affect:
(i) The operations of CAPE;(ii) The results of those operations; or(iii) The state of affairs of CAPE
In the financial years subsequent to this financial year.
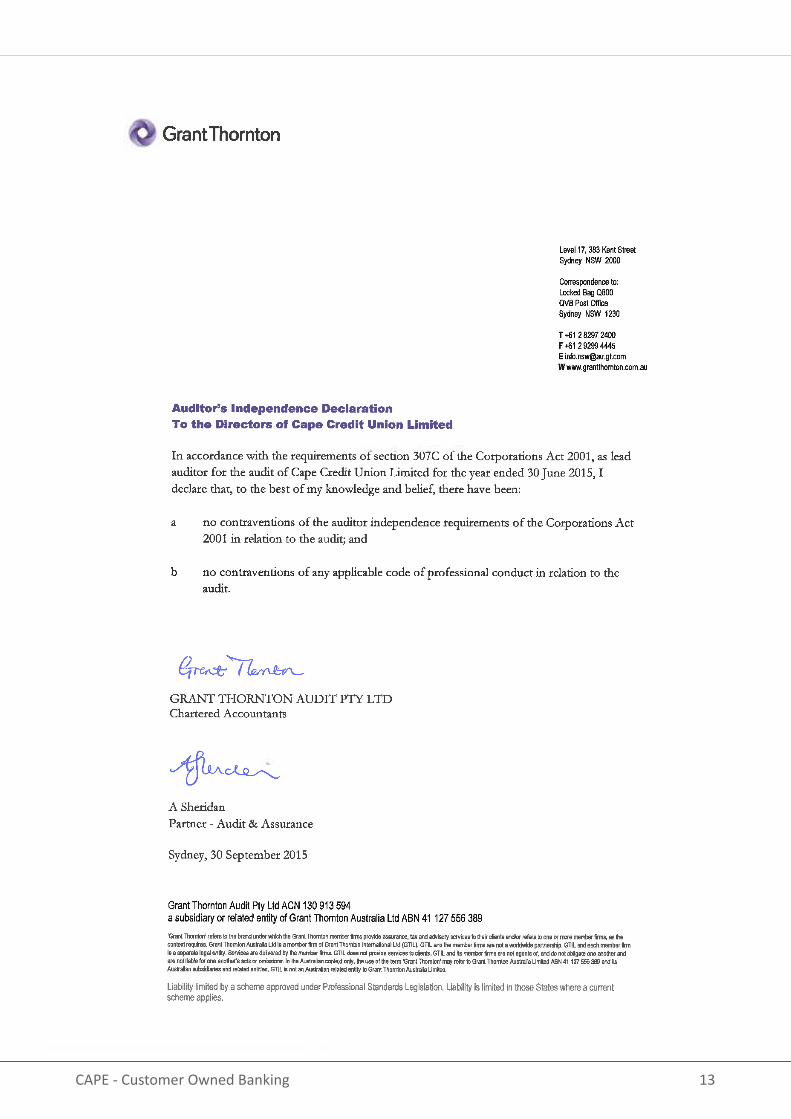
AUDITORS’ INDEPENDENCEThe auditors have provided the declaration of independence to the Board as prescribed by the Corporations Act 2001 as set out on Page 13.
This report is made in accordance with a resolution of the Board of Directors and is signed for and on behalf of the Directors by:
13CAPE - Customer Owned Banking
14 ANNUAL REPORT 2015
15CAPE - Customer Owned Banking
16 ANNUAL REPORT 2015
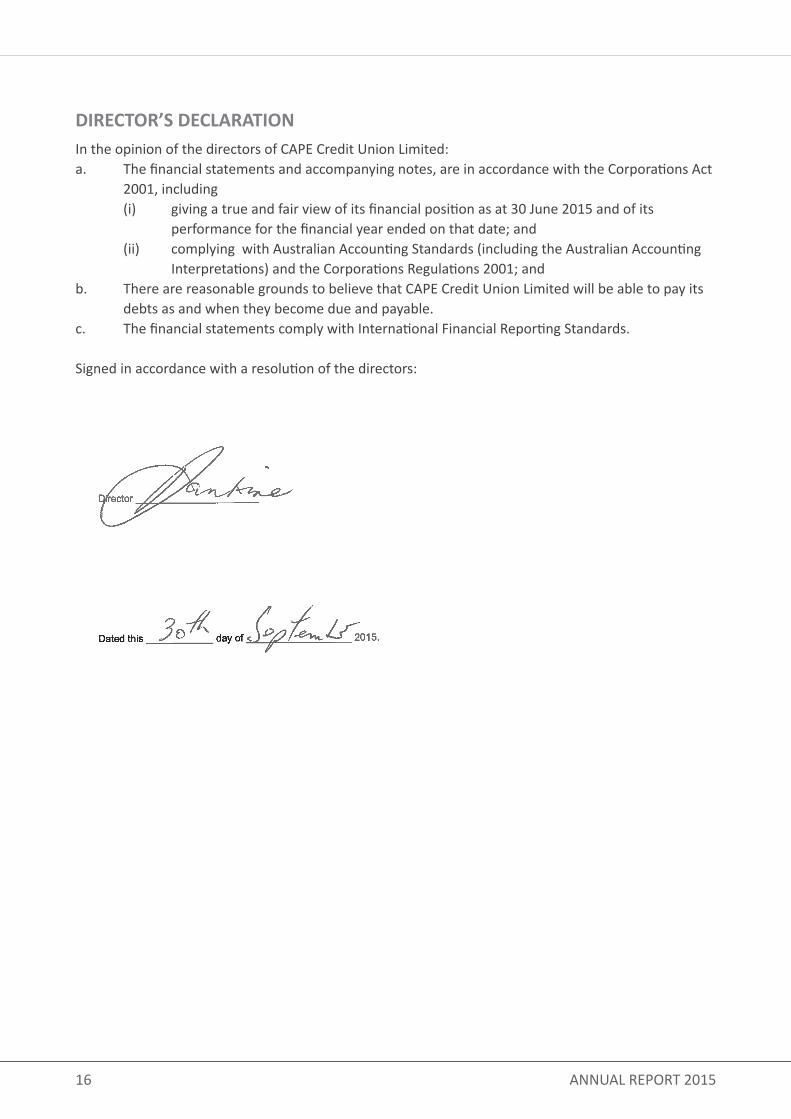
DIRECTOR’S DECLARATION In the opinion of the directors of CAPE Credit Union Limited:a. The financial statements and accompanying notes, are in accordance with the Corporations Act 2001, including (i) giving a true and fair view of its financial position as at 30 June 2015 and of its performance for the financial year ended on that date; and (ii) complying with Australian Accounting Standards (including the Australian Accounting Interpretations) and the Corporations Regulations 2001; andb. There are reasonable grounds to believe that CAPE Credit Union Limited will be able to pay its debts as and when they become due and payable.c. The financial statements comply with International Financial Reporting Standards.
Signed in accordance with a resolution of the directors:
17CAPE - Customer Owned Banking
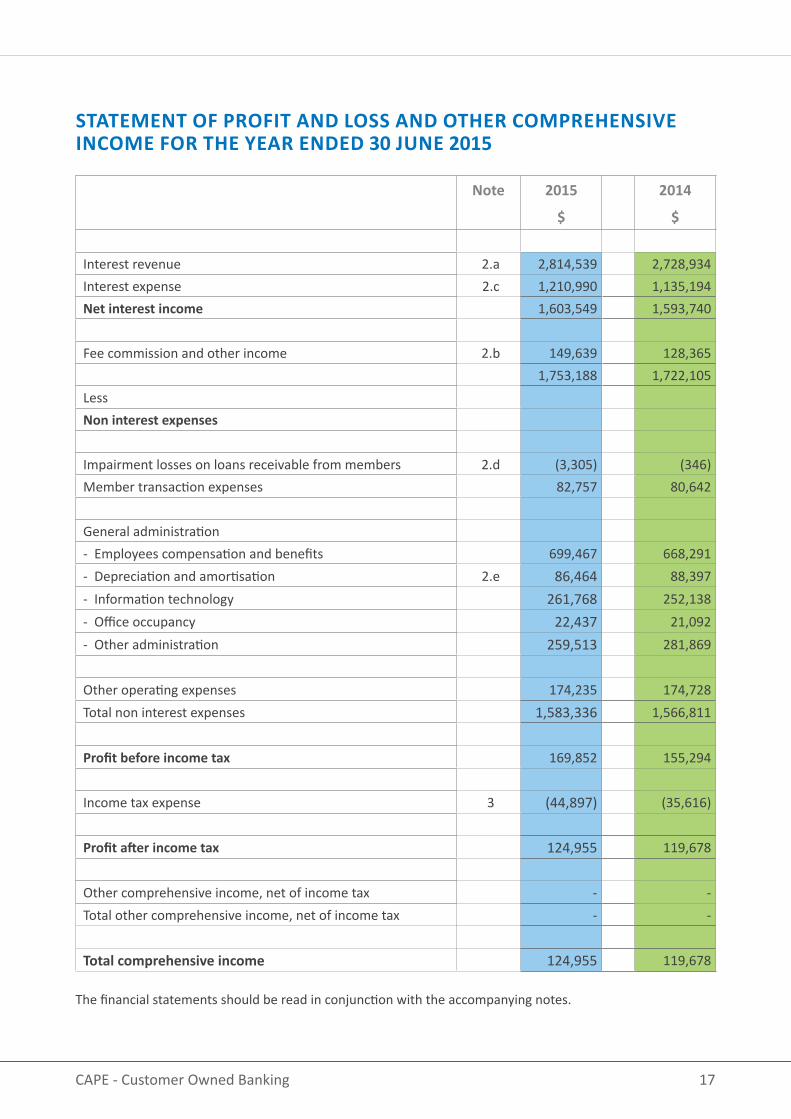
Note 2015
$
2014
$
Interest revenue 2.a 2,814,539 2,728,934Interest expense 2.c 1,210,990 1,135,194Net interest income 1,603,549 1,593,740
Fee commission and other income 2.b 149,639 128,365 1,753,188 1,722,105LessNon interest expenses
Impairment losses on loans receivable from members 2.d (3,305) (346)Member transaction expenses 82,757 80,642
General administration- Employees compensation and benefits 699,467 668,291- Depreciation and amortisation 2.e 86,464 88,397- Information technology 261,768 252,138- Office occupancy 22,437 21,092- Other administration 259,513 281,869
Other operating expenses 174,235 174,728Total non interest expenses 1,583,336 1,566,811
Profit before income tax 169,852 155,294
Income tax expense 3 (44,897) (35,616)
Profit after income tax 124,955 119,678
Other comprehensive income, net of income tax - -Total other comprehensive income, net of income tax - -
Total comprehensive income 124,955 119,678
STATEMENT OF PROFIT AND LOSS AND OTHER COMPREHENSIVE INCOME FOR THE YEAR ENDED 30 JUNE 2015
The financial statements should be read in conjunction with the accompanying notes.

18 ANNUAL REPORT 2015
STATEMENT OF CHANGES IN MEMBER EQUITY FOR THE YEAR ENDED 30 JUNE 2015
Capital Reserve
General Reserve
for Credit Losses
Retained Earnings
Total
$ $ $ $Note 17Total at 30 June 2013 26,988 346,904 5,180,778 5,554,670
Profit for the year - - 119,678 119, 678Transfer to capital account 1,982 - (1, 982) -General Reserve for credit losses - 4,610 (4,610) -Total as at 30 June 2014 28,970 351,514 5,293,864 5,674,348
Profit for the year - - 124,955 124,955Transfer to capital account 1,970 - (1,970) -General Reserve for credit losses - (10,414) 10,414 -Total as at 30 June 2015 30,940 341,100 5,427,263 5,799,303
The financial statements should be read in conjunction with the accompanying notes.
We believe in an equal share and an equal vote for every customer
19CAPE - Customer Owned Banking
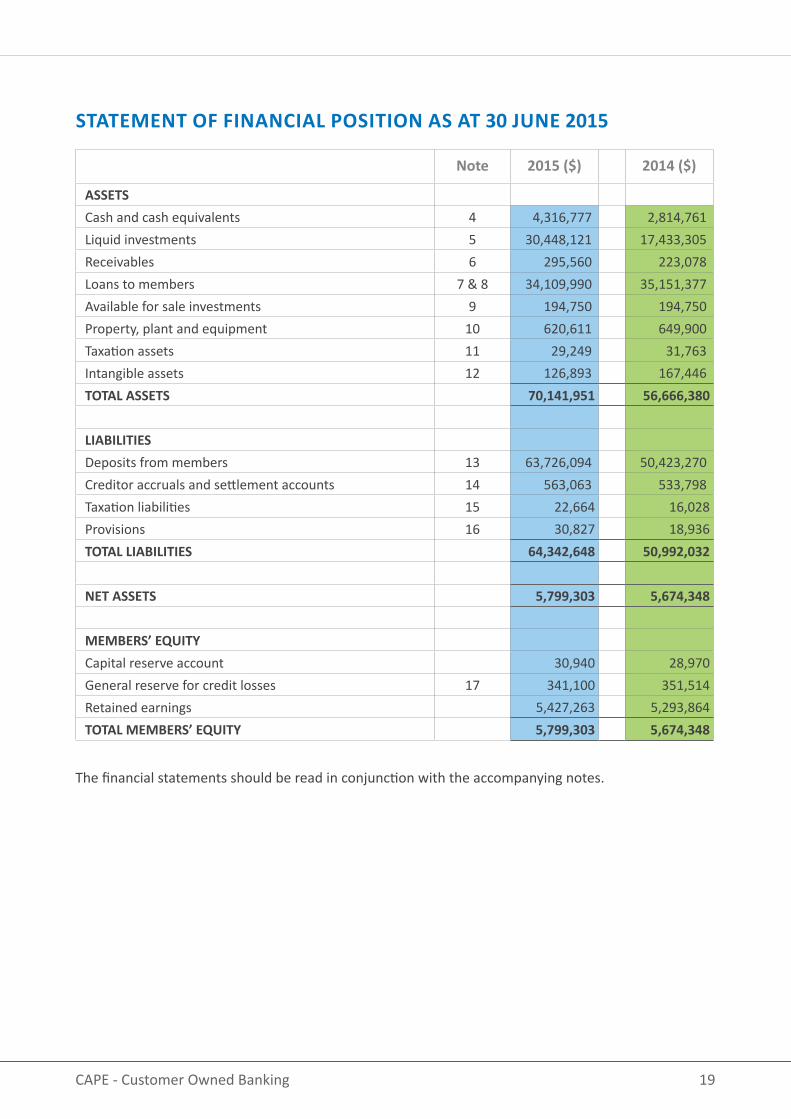
Note 2015 ($) 2014 ($)
ASSETSCash and cash equivalents 4 4,316,777 2,814,761Liquid investments 5 30,448,121 17,433,305Receivables 6 295,560 223,078Loans to members 7 & 8 34,109,990 35,151,377Available for sale investments 9 194,750 194,750Property, plant and equipment 10 620,611 649,900Taxation assets 11 29,249 31,763Intangible assets 12 126,893 167,446TOTAL ASSETS 70,141,951 56,666,380
LIABILITIESDeposits from members 13 63,726,094 50,423,270Creditor accruals and settlement accounts 14 563,063 533,798Taxation liabilities 15 22,664 16,028Provisions 16 30,827 18,936TOTAL LIABILITIES 64,342,648 50,992,032
NET ASSETS 5,799,303 5,674,348
MEMBERS’ EQUITYCapital reserve account 30,940 28,970General reserve for credit losses 17 341,100 351,514Retained earnings 5,427,263 5,293,864TOTAL MEMBERS’ EQUITY 5,799,303 5,674,348
The financial statements should be read in conjunction with the accompanying notes.
STATEMENT OF FINANCIAL POSITION AS AT 30 JUNE 2015
20 ANNUAL REPORT 2015
Note 2015 ($) 2014 ($)
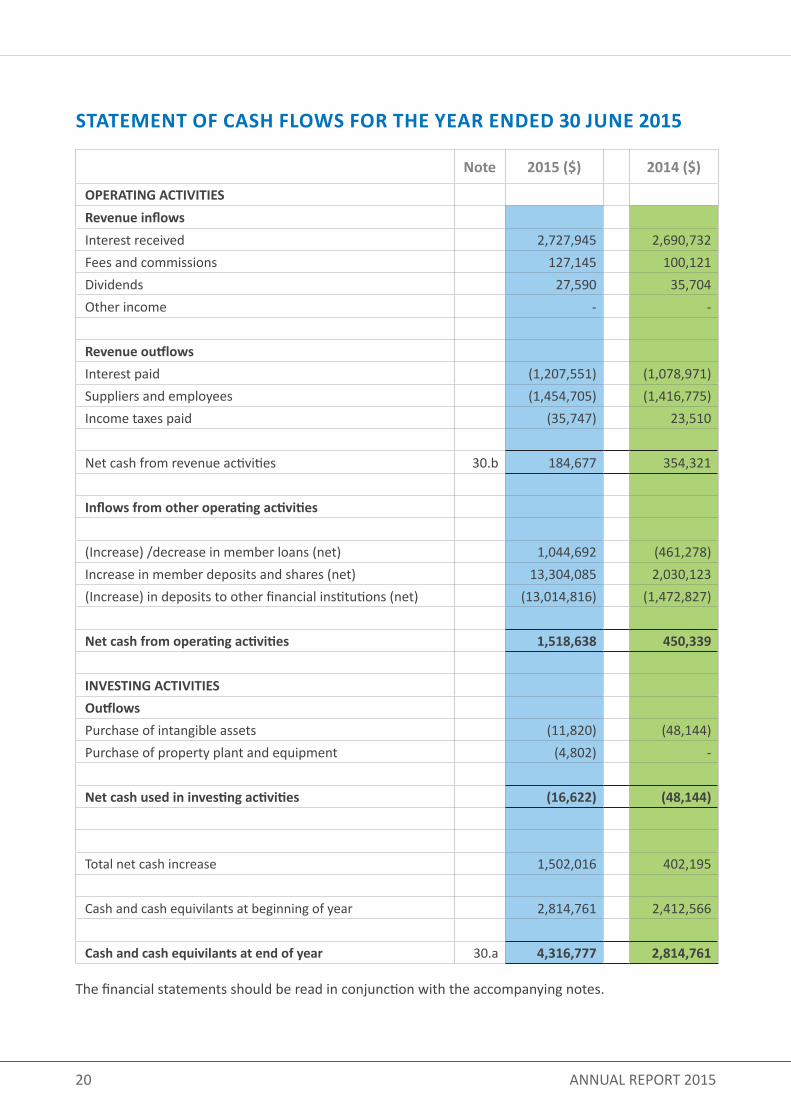
OPERATING ACTIVITIESRevenue inflowsInterest received 2,727,945 2,690,732Fees and commissions 127,145 100,121Dividends 27,590 35,704Other income - -
Revenue outflowsInterest paid (1,207,551) (1,078,971)Suppliers and employees (1,454,705) (1,416,775)Income taxes paid (35,747) 23,510
Net cash from revenue activities 30.b 184,677 354,321
Inflows from other operating activities
(Increase) /decrease in member loans (net) 1,044,692 (461,278)Increase in member deposits and shares (net) 13,304,085 2,030,123(Increase) in deposits to other financial institutions (net) (13,014,816) (1,472,827)
Net cash from operating activities 1,518,638 450,339
INVESTING ACTIVITIESOutflowsPurchase of intangible assets (11,820) (48,144)Purchase of property plant and equipment (4,802) -
Net cash used in investing activities (16,622) (48,144)
Total net cash increase 1,502,016 402,195
Cash and cash equivilants at beginning of year 2,814,761 2,412,566
Cash and cash equivilants at end of year 30.a 4,316,777 2,814,761
The financial statements should be read in conjunction with the accompanying notes.
STATEMENT OF CASH FLOWS FOR THE YEAR ENDED 30 JUNE 2015
21CAPE - Customer Owned Banking
TABLE OF OTHER NOTES TO ACCOUNTS
18 Financial risk management objectives and policies 19 Categories of financial instruments20 Maturity profile of financial assets and liabilities21 Current and non current dissection of financial assets and liabilities22 Interest rate change profile of financials assets and liabilities 23 Fair value of financial assets and liabilities24 Financial commitments25 Standby borrowing facilities26 Contingent liabilities27 Disclosures on Directors and other key management personnel28 Outsourcing Arrangements29 Superannuation liabilities30 Notes to statement of cash flows31 Corporate information32 Post balance sheet events
We believe in Principle before Profit
22 ANNUAL REPORT 2015
NOTES TO ACCOUNTS FOR THE YEAR ENDED 30 JUNE 2015
1. STATEMENT OF SIGNIFICANT ACCOUNTING POLICIES
This financial report is prepared for CAPE Credit Union Limited (CAPE) as a single credit union, for the year ended 30 June 2015. The report was authorised for issue on 30 September 2015 in accordance with a resolution of the Board of Directors. The financial report is presented in Australian dollars.
The financial report is a general purpose financial report which has been prepared in accordance with the requirements of the Corporations Act 2001, Australian Accounting Standards and other authoritative pronouncements of the Australian Accounting Standards Board. Compliance with Australian Accounting Standards ensures compliance with the International Financial Reporting Standards (IFRSs) as issued by the International Accounting Standards Board (IASB). CAPE is a for profit entity for the purpose of preparing the financial statements.
A. BASIS OF MEASUREMENTThe financial statements have been prepared on an accruals basis, and are based on historical costs, which do not take into account changing money values or current values of non current assets, except for available for sale investments which are stated at fair value. The accounting policies are consistent with the prior year unless otherwise stated.
B. CLASSIFICATION AND SUBSEQUENT MEASUREMENT OF FINANCIAL ASSETS AND FINANCIAL LIABILITIESFinancial assets and financial liabilities are recognised when CAPE becomes a party to the contractual provisions of the financial instrument, and are measured initially at fair value adjusted by transaction costs. Subsequent measurement of financial assets and financial liabilities are described below.
Financial assets are derecognised when the contractual rights to the cash flows from the financial assets expire, or when the financial asset and all substantial risks and rewards are transferred. A financial liability is derecognised when it is extinguished, discharged, cancelled or expires.
Classification And Subsequent Measurement Of Financial AssetsFor the purpose of subsequent measurement, financial assets are classified into the following categories upon initial recognition:
• loans and receivables• held-to-maturity (HTM) investments• available-for-sale (AFS) financial assets
The category determines subsequent measurement and whether any resulting income and expense is recognised in profit or loss or in other comprehensive income.All financial assets are subject to review for impairment at least at each reporting date to identify whether
23CAPE - Customer Owned Banking
there is any objective evidence that a financial asset or a group of financial assets is impaired. Different criteria to determine impairment are applied for each category of financial assets, which are described below.
All income and expenses relating to financial assets that are recognised in the Statement of Profit or Loss and Other Comprehensive Income are presented within net interest income, except for impairment of loans and receivables which are presented within non interest expenses.
Loans and ReceivablesLoans and receivables are non-derivative financial assets with fixed and determinable payments that are not quoted in an active market. After initial recognition, these are measured at amortised cost using the effective interest method, less provision for impairment. CAPE’s liquid investments, trade and most other receivables fall into this category of financial instruments.
Individually significant receivables are considered for impairment when they are past due or when other objective evidence is received that a specific counterparty will default. Receivables that are not considered to be individually impaired are reviewed for impairment and are determined by reference to the industry and region of a counterparty and other shared credit risk characteristics.
HTM InvestmentsHTM investments are non-derivative financial assets with fixed or determinable payments and fixed maturity other than loans and receivables. Investments are classified as HTM if CAPE has the intention and ability to hold them until maturity. CAPE currently holds Term Deposits, Negotiable Certificates of Deposit and Floating Rate Notes in this category. If more than an insignificant portion of these assets are sold or redeemed early then the asset class will be reclassified as Available for Sale financial assets.
HTM investments are measured subsequently at amortised cost using the effective interest method. If there is objective evidence that the investment is impaired, determined by reference to external credit ratings, the financial asset is measured at the present value of estimated future cash flows. Any changes to the carrying amount of the investment, including impairment losses, are recognised in profit and loss.
Available For Sale (AFS) Financial AssetsAFS financial assets are non-derivative financial assets that are either designated to this category or do not qualify for inclusion in any of the other categories of financial assets. CAPE’s AFS financial assets is the equity investment in Cuscal Limited.
The equity investment in Cuscal Limited is measured at cost less any impairment charges, as its fair value cannot currently be estimated reliably. Impairment charges are recognised in profit and loss.
1. STATEMENT OF SIGNIFICANT ACCOUNTING POLICIES continued
24 ANNUAL REPORT 2015
Classification And Subsequent Measurement Of Financial LiabilitiesCAPE’s financial liabilities include borrowings and trade and other payables. Financial liabilities are measured subsequently at amortised cost using the effective interest method.
C. LOAN TO MEMBERS(i) Basis of recognitionAll loans are initially recognised at fair value, net of loan origination fees and inclusive of transaction costs incurred. Loans are subsequently measured at amortised cost. Any difference between the proceeds and the redemption amount is recognised in the Statement of Profit or Loss and Other Comprehensive Income over the period of the loans using the effective interest method.
Loans to members are reported at their recoverable amount representing the aggregate amount of principal and unpaid interest owing to CAPE at balance date, less any allowance or provision against impairment for debts considered doubtful. A loan is classified as impaired where recovery of the debt is considered unlikely as determined by the Board of Directors.
(ii) Interest earnedTerm loans - interest is calculated on the basis of the daily balance outstanding and is charged in arrears to a members account on the last day of each month.
Overdrafts – interest is calculated initially on the basis of the daily balance outstanding and is charged in arrears to a members account on the last day of the month.
Non accrual loan interest – while still legally recoverable, interest is not brought to account as income where CAPE is informed that the member has deceased, or, where a loan is impaired.
(iii) Loan origination fees and discountsLoan establishment fees and discounts are initially deferred as part of the loan balance, and are brought to account as income over the expected life of the loan as interest revenue.
(iv) Transaction costsTransaction costs are expenses which are direct and incremental to the establishment of the loan. These costs are initially deferred as part of the loan balance, and are brought to account as a reduction to income over the expected life of the loan, and included as part of interest revenue.
(v) Fees on loansThe fees charged on loans after origination of the loan are recognised as income when the service is provided or costs are incurred.
(vi) Net gains and lossesNet gains and losses on loans to members to the extent that they arise from the partial transfer of
1. STATEMENT OF SIGNIFICANT ACCOUNTING POLICIES continued

25CAPE - Customer Owned Banking
business or on securitisation, do not include impairment write downs or reversals of impairment write downs.
D. LOAN IMPAIRMENT(i) Specific and collective provision for impairmentA provision for losses on impaired loans is recognised when there is objective evidence that the impairment of a loan has occurred. Estimated impairment losses are calculated on either a portfolio basis for loans of similar characteristics, or on an individual basis. The amount provided is determined by management and the Board to recognise the probability of loan amounts not being collected in accordance with terms of the loan agreement. The critical assumptions used in the calculation are as set out in Note 8. Note 18 details the credit risk management approach for loans.
The APRA Prudential Standards require a minimum provision to be maintained, based on specific percentages on the loan balance which are contingent upon the length of time the repayments are in arrears. This approach is used to assess the collective provisions for impairment.
An assessment is made at each statement of financial position date to determine whether there is objective evidence that a specific financial asset or a group of financial assets is impaired. Evidence of impairment may include indications that the borrower has defaulted, is experiencing significant financial difficulty, or where the debt has been restructured to reduce the burden to the borrower.
(ii) Reserve for credit lossesIn addition to the above specific provision, the Board has recognised the need to make an allocation from retained earnings to ensure there is adequate protection for members against the prospect that some members will experience loan repayment difficulties in the future. The reserve is based on estimation of potential risk in the loan portfolio based upon:• the level of security taken as collateral; and• the concentration of loans taken by employment type.
(iii) Renegotiated loansLoans which are subject to renegotiated terms which would have otherwise been impaired do not have the repayment arrears diminished and interest continues to accrue to income. Each renegotiated loan is retained at the full arrears position until the normal repayments are reinstated and brought up to date and maintained for a period of 6 months.
E. BAD DEBTS WRITTEN OFF (DIRECT REDUCTION IN LOAN BALANCE)Bad debts are written off from time to time as determined by management and the Board of Directors when it is reasonable to expect that the recovery of the debt is unlikely. Bad debts are written off against the provisions for impairment, if a provision for impairment had previously been recognised. If no provision had been recognised, the write offs are recognised as expenses in the profit and loss.

26 ANNUAL REPORT 2015
F. PROPERTY, PLANT AND EQUIPMENTLand and buildings are measured at cost less accumulated depreciation. Property, plant and equipment, with the exception of freehold land, are depreciated on a straight line basis so as to write off the net cost of each asset over its expected useful life to CAPE.
The useful lives are adjusted if appropriate at each reporting date. Estimated useful lives as at the balance date are as follows:• Buildings - 40 years• Plant and equipment - 3 to 7 years• Assets less than $300 are not capitalised
G. RECEIVABLES FROM OTHER FINANCIAL INSTITUTIONSTerm Deposits, Floating Rate Notes and Negotiable Certificates of Deposit with other financial institutions are unsecured and have a carrying amount equal to their principal amount. Interest on Term Deposits and Negotiable Certificates of Deposit is paid on the daily balance at maturity. Interest on Floating Rate Notes is paid quarterly. All deposits are in Australian currency.
The accrual for interest receivable is calculated on a proportional basis of the unexpired period of the term of the investment or interest rate reset term. Interest receivable is included in the amount of receivables in the statement of financial position.
H. EQUITY INVESTMENTS AND OTHER SECURITIESInvestments in sharesInvestments in shares are classified as available for sale financial assets where they do not qualify for classification as loans and receivables, or investments held for trading.
Investments in shares which do not have a ready market and are not capable of being reliably valued are recorded at the lower of cost or recoverable amount.
All investments are in Australian currency.
I. MEMBER DEPOSITSi) Basis for measurementMember savings and term investments are quoted at the aggregate amount of money owing to depositors.
(ii) Interest payableInterest on savings is calculated on the daily balance and posted to the accounts periodically, or on maturity of the term deposit. Interest on savings is brought to account on the amount of money owing to depositors on an accrual basis in accordance with the interest rate terms and conditions of each savings and term deposit account as varied from time to time. The amount of the accrual is shown as part of amounts payable.
1. STATEMENT OF SIGNIFICANT ACCOUNTING POLICIES continued
27CAPE - Customer Owned Banking
J. PROVISION FOR EMPLOYEE BENEFITSProvision is made for CAPE’s liability for employee benefits arising from services rendered by employees to balance date.
Short-term employee benefits expected to be settled within one year, have been measured at the undiscounted amount that CAPE expects to pay as a result of the unused entitlement.
Annual leave is discounted when calculating the leave liability when CAPE does not expect all annual leave for all employees to be used wholly within 12 months of the end of the reporting period. Annual leave liability is still presented as a current liability for presentation purposes under AASB101 Presentation of Financial Statements.
Other employee benefits payable later than one year have been measured at the present value of the estimated future cash outflows to be made for those benefits discounted using national government bond rates.
Provision for long service leave is on a pro-rata basis from commencement of employment with CAPE based on the present value of its estimated future cash flows.
Annual leave is accrued in respect of all employees on pro-rata entitlement for part years of service and leave entitlement due but not taken at balance date. Annual leave is reflected as part of the creditor accruals and settlement accounts.
Contributions are made by CAPE to an employee’s superannuation fund and are charged to profit and loss as incurred.
K. LEASEHOLD ON PREMISESLeases where the lessor retains substantially all the risks and rewards of ownership of the net asset are classified as operating leases. Payments made under operating leases (net of incentives received from the lessor) are charged to the Statement of Profit or Loss and Other Comprehensive Income on a straight-line basis over the period of the lease.
L. INCOME TAXThe income tax expense shown in the Statement of Profit or Loss and Other Comprehensive Income is based on the profit before income tax adjusted for any non tax deductible, or non assessable items between accounting profit and taxable income. Deferred tax assets and liabilities are recognised using the Statement of Financial Position liability method in respect of temporary differences arising between the tax bases of assets or liabilities and their carrying amounts in the financial statements. Current and deferred tax balances relating to amounts recognised directly in equity are also recognised directly in equity.
28 ANNUAL REPORT 2015
Deferred tax assets and liabilities are recognised for all temporary differences between carrying amounts of assets and liabilities for financial reporting purposes and their respective tax bases at the rate of income tax applicable to the period in which the benefit will be received or the liability will become payable. These differences are presently assessed at 30%.
Deferred tax assets are only brought to account if it is probable that future taxable amounts will be available to utilise those temporary differences. The recognition of these benefits is based on the assumption that no adverse change will occur in income tax legislation; and the anticipation that CAPE will derive sufficient future assessable income and comply with the conditions of deductibility imposed by the law to permit an income tax benefit to be obtained.
M. INTANGIBLE ASSETSItems of computer software which are not integral to the computer hardware owned by CAPE are classified as intangible assets. Computer software is amortised over the expected useful life of the software. These lives range from 2 to 5 years.
N. GOODS AND SERVICES TAXAs a financial institution CAPE is input taxed on all income except for income from commissions and some fees. An input taxed supply is not subject to GST collection, and similarly the GST paid on related or apportioned purchases cannot be recovered. As some income is charged GST, the GST on purchases are generally recovered on a proportionate basis. In addition certain prescribed purchases are subject to reduced input tax credits (RITC), of which 75% of the GST paid is recoverable.
Revenue, expenses and assets are recognised net of the amount of goods and services tax (GST). To the extent that the full amount of the GST incurred is not recoverable from the Australian Tax Office (ATO), the GST is recognised as part of the cost of acquisition of the asset or as part of an item of the expense.
Receivables and payables are stated with the amount of GST included. The net amount of GST recoverable from, or payable to, the ATO is included as a current asset or current liability in the statement of financial position. Cash flows are included in the cash flow statement on a gross basis. The GST components of cash flows arising from investing and financing activities which are recoverable from, or payable to, the Australian Taxation Office are classified as operating cash flows.
O. CASH AND CASH EQUIVALENTSCash comprises cash on hand and demand deposits. Cash equivalents are short-term, highly liquid investments that are readily convertible to known amounts of cash and which are subject to an insignificant risk of changes in value.
P. IMPAIRMENT OF ASSETSAt each reporting date CAPE assesses whether there is any indication that individual assets are impaired. Where impairment indicators exist, recoverable amount is determined and impairment losses are
1. STATEMENT OF SIGNIFICANT ACCOUNTING POLICIES continued
29CAPE - Customer Owned Banking
recognised in the profit and loss where the asset’s carrying value exceeds its recoverable amount. Recoverable amount is the higher of an asset’s fair value less costs to sell and value in use. For the purpose of assessing value in use, the estimated future cash flows are discounted to their present value using a pre-tax discount rate that reflects current market assessments of the time value of money and the risks specific to the asset. Where it is not possible to estimate recoverable amount for an individual asset, recoverable amount is determined for the cash-generating unit to which the asset belongs.
Q. ACCOUNTING ESTIMATES AND JUDGEMENTSManagement have made critical accounting estimates when applying CAPE’s accounting policies with respect to the impairment provisions for loans - refer Note 8.
R. NEW STANDARDS APPLICABLE FOR THE CURRENT YEARThere were no new or revised accounting standards applicable for the financial year commencing from 1 July 2014 that had any significant impact on the financial statements of CAPE.
S. NEW OR EMERGING STANDARDS NOT YET MANDATORYCertain new accounting standards and interpretations have been published that are not mandatory for 30 June 2015 reporting periods. CAPE’s assessment of the impact of these new standards and interpretations is set out below. Changes that are not likely to impact the financial report of CAPE have not been reported.
We believe we do banking differently

30 ANNUAL REPORT 2015
AASB Reference Nature of Change Application Date
Impact on Initial Application
AASB 9 Financial Instruments
(December 2014)
AASB 9 amends the requirements for classification and measurement of financial assets.
The following requirements have generally been carried forward unchanged from AASB 139 Financial Instruments: Recognition and Measurement into AASB 9. These include the requirements relating to: Classification and measurement of financial liabilities; and Derecognition requirements for financial assets and liabilities.
However, AASB 9 states that:(a) financial assets can be designated and measured at fair value through profit or loss at initial recognition if doing so eliminates or significantly reduces a measurement or recognition inconsistency that would arise from measuring assets or liabilities, or recognising the gains and losses on them, on different bases.
(b) Where the fair value option is used for financial liabilities the change in fair value is to be accounted for as follows:• The change attributable to changes
in credit risk are presented in other comprehensive income; and
• The remaining change is presented in profit and loss.
Periods beginning on or after 1 January 2018
CAPE has not yet assessed the full impact of AASB 9 as this standard does not apply mandatorily before 1 January 2018 and the revised Standard is not permitted to be early adopted until at least the year ended 30 June 2016.
However based upon a preliminary assessment, the Standard is not expected to have a material impact upon the transactions and balances recognised when it is first adopted.
AASB 15 Revenue from Contracts with Customers
Revenue from financial instruments is not covered by this new Standard, but AASB 15 establishes a new revenue recognition model for other types of revenue.
Periods beginning on or after 1 January 2017
CAPE is yet to make a detailed assessment of the impact of AASB 15. However, based upon a preliminary assessment, the Standard is not expected to have a material impact upon the transactions and balances recognised when it is first adopted.
31CAPE - Customer Owned Banking
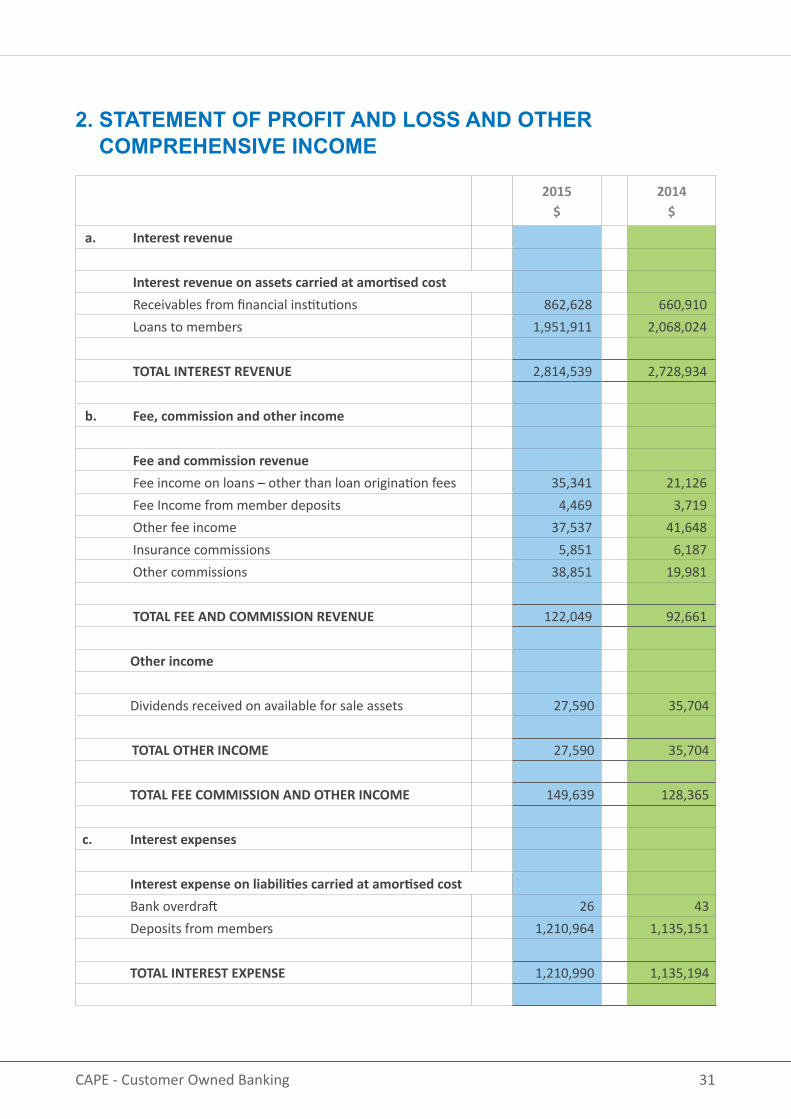
2015$
2014$
a. Interest revenue
Interest revenue on assets carried at amortised cost Receivables from financial institutions 862,628 660,910 Loans to members 1,951,911 2,068,024
TOTAL INTEREST REVENUE 2,814,539 2,728,934
b. Fee, commission and other income
Fee and commission revenue Fee income on loans – other than loan origination fees 35,341 21,126 Fee Income from member deposits 4,469 3,719 Other fee income 37,537 41,648 Insurance commissions 5,851 6,187 Other commissions 38,851 19,981
TOTAL FEE AND COMMISSION REVENUE 122,049 92,661
Other income Dividends received on available for sale assets 27,590 35,704
TOTAL OTHER INCOME 27,590 35,704
TOTAL FEE COMMISSION AND OTHER INCOME 149,639 128,365
c. Interest expenses
Interest expense on liabilities carried at amortised cost Bank overdraft 26 43 Deposits from members 1,210,964 1,135,151
TOTAL INTEREST EXPENSE 1,210,990 1,135,194
2. STATEMENT OF PROFIT AND LOSS AND OTHER COMPREHENSIVE INCOME
32 ANNUAL REPORT 2015
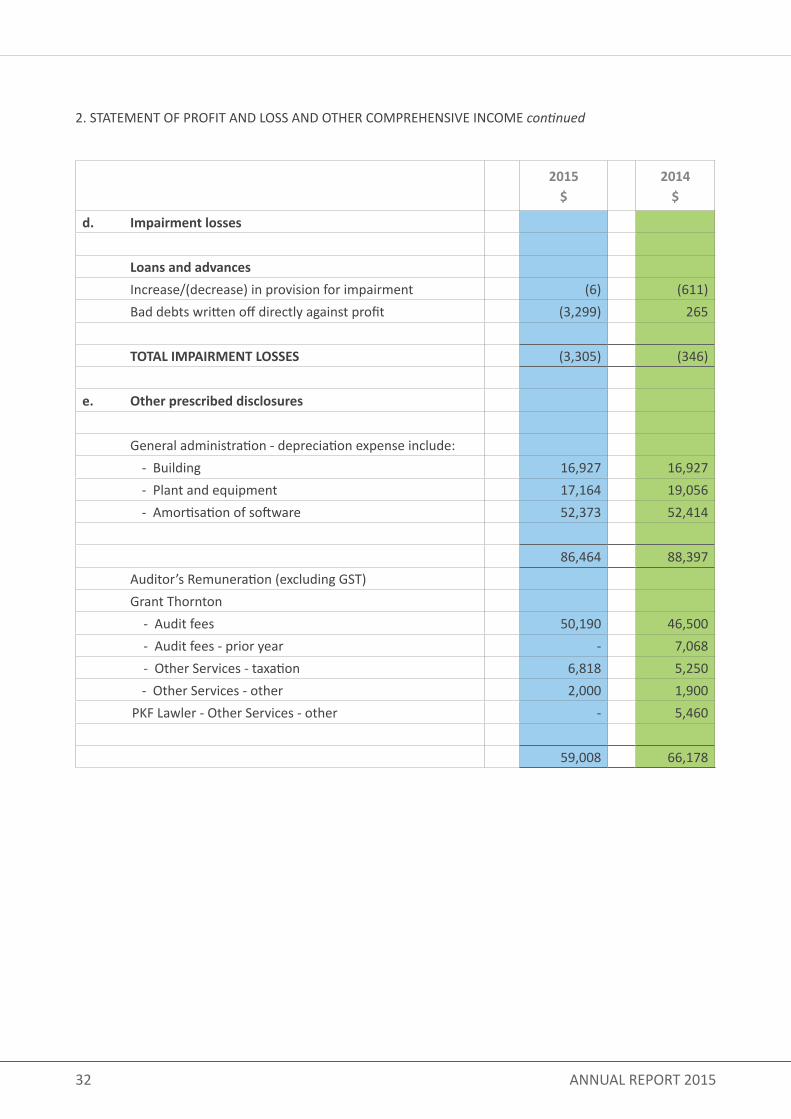
2015$
2014$
d. Impairment losses
Loans and advances Increase/(decrease) in provision for impairment (6) (611) Bad debts written off directly against profit (3,299) 265
TOTAL IMPAIRMENT LOSSES (3,305) (346)
e. Other prescribed disclosures
General administration - depreciation expense include: - Building 16,927 16,927 - Plant and equipment 17,164 19,056 - Amortisation of software 52,373 52,414
86,464 88,397 Auditor’s Remuneration (excluding GST) Grant Thornton - Audit fees 50,190 46,500 - Audit fees - prior year - 7,068 - Other Services - taxation 6,818 5,250 - Other Services - other 2,000 1,900 PKF Lawler - Other Services - other - 5,460
59,008 66,178
2. STATEMENT OF PROFIT AND LOSS AND OTHER COMPREHENSIVE INCOME continued

33CAPE - Customer Owned Banking
2015$
2014$
a. The income tax expense comprises amounts set aside as:-
Current tax charge 43,873 37,775 Deferred tax charge 2,515 (2,175) Adjustments for previous years (1,491) 16 Total income tax expense in income statement 44,897 35,616
b. The prima facie tax payable on profit is reconciled to the income tax expense in the accounts as follows: Profit 169,852 155,294
Prima facie tax payable on profit before income tax at 30% 50,956 46,588 Add tax effect of other assessable income 3,896 2,433 Non-deductible expenses 1,869 1,897
Less - Franking rebate (11,824) (15,302)
- Adjustment for transitional tax rate provision - -
Income tax expense attributable to current year profit 44,897 35,616
(c) Franking credits
Franking credits held by CAPE after adjusting for franking credits that will arise from the payment of income tax payable as at the end of the financial year is:
1,216,225 1,181,737
3. INCOME TAX EXPENSE
4. CASH AND CASH EQUIVALENTS2015
$2014
$
Cash on hand 54,859 71,161 Deposits at call 4,261,918 2,743,600
4,316,777 2,814,761
34 ANNUAL REPORT 2015
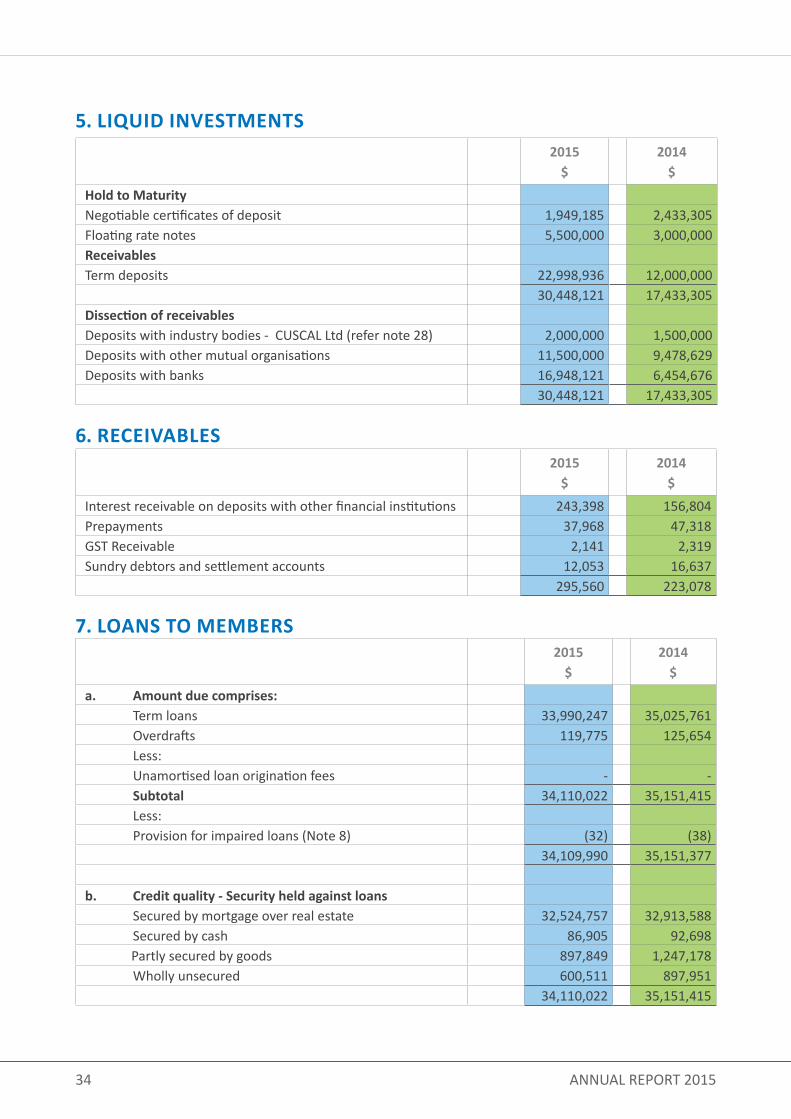
2015$
2014$
a. Amount due comprises: Term loans 33,990,247 35,025,761 Overdrafts 119,775 125,654 Less: Unamortised loan origination fees - - Subtotal 34,110,022 35,151,415 Less: Provision for impaired loans (Note 8) (32) (38) 34,109,990 35,151,377
b. Credit quality - Security held against loans Secured by mortgage over real estate 32,524,757 32,913,588 Secured by cash 86,905 92,698 Partly secured by goods 897,849 1,247,178 Wholly unsecured 600,511 897,951
34,110,022 35,151,415
5. LIQUID INVESTMENTS
6. RECEIVABLES
7. LOANS TO MEMBERS
2015$
2014$
Hold to MaturityNegotiable certificates of deposit 1,949,185 2,433,305Floating rate notes 5,500,000 3,000,000ReceivablesTerm deposits 22,998,936 12,000,000
30,448,121 17,433,305Dissection of receivablesDeposits with industry bodies - CUSCAL Ltd (refer note 28) 2,000,000 1,500,000Deposits with other mutual organisations 11,500,000 9,478,629Deposits with banks 16,948,121 6,454,676
30,448,121 17,433,305
2015$
2014$
Interest receivable on deposits with other financial institutions 243,398 156,804Prepayments 37,968 47,318GST Receivable 2,141 2,319Sundry debtors and settlement accounts 12,053 16,637
295,560 223,078
35CAPE - Customer Owned Banking
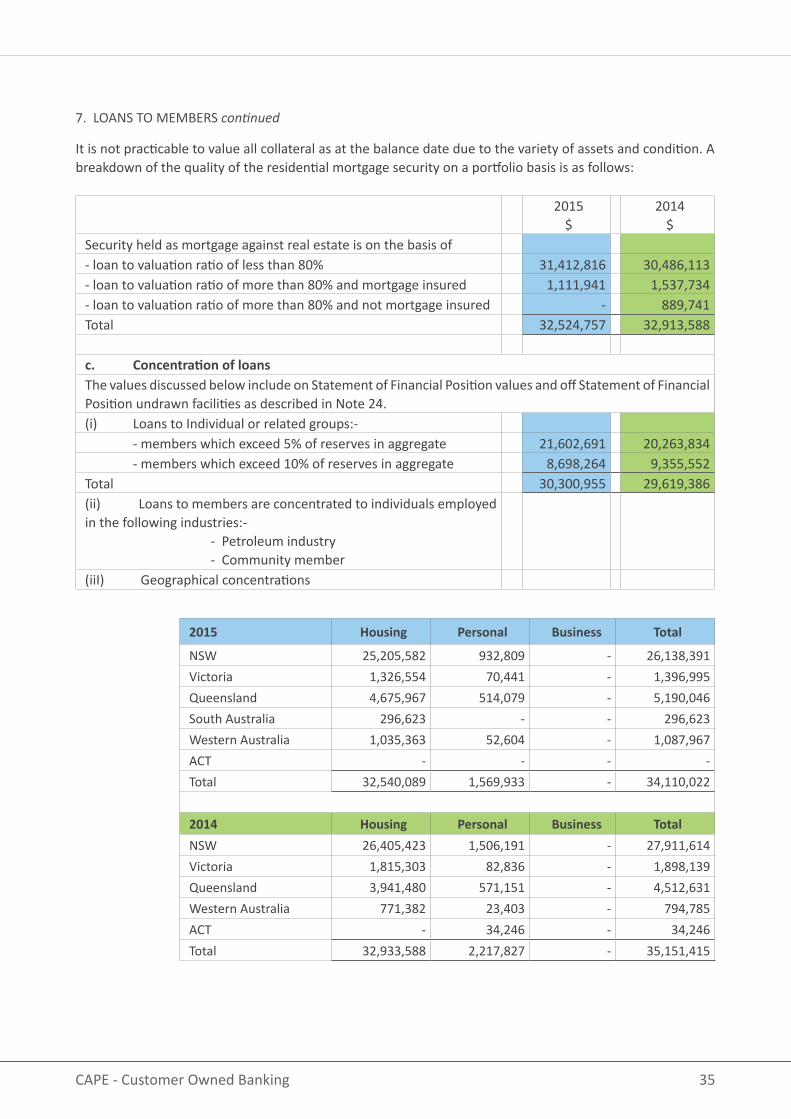
It is not practicable to value all collateral as at the balance date due to the variety of assets and condition. A breakdown of the quality of the residential mortgage security on a portfolio basis is as follows:
2015$
2014$
Security held as mortgage against real estate is on the basis of - loan to valuation ratio of less than 80% 31,412,816 30,486,113- loan to valuation ratio of more than 80% and mortgage insured 1,111,941 1,537,734- loan to valuation ratio of more than 80% and not mortgage insured - 889,741Total 32,524,757 32,913,588
c. Concentration of loans The values discussed below include on Statement of Financial Position values and off Statement of Financial Position undrawn facilities as described in Note 24.(i) Loans to Individual or related groups:- - members which exceed 5% of reserves in aggregate 21,602,691 20,263,834 - members which exceed 10% of reserves in aggregate 8,698,264 9,355,552Total 30,300,955 29,619,386(ii) Loans to members are concentrated to individuals employed in the following industries:- - Petroleum industry - Community member(iiI) Geographical concentrations
2015 Housing Personal Business Total
NSW 25,205,582 932,809 - 26,138,391Victoria 1,326,554 70,441 - 1,396,995Queensland 4,675,967 514,079 - 5,190,046South Australia 296,623 - - 296,623Western Australia 1,035,363 52,604 - 1,087,967ACT - - - -Total 32,540,089 1,569,933 - 34,110,022
2014 Housing Personal Business Total NSW 26,405,423 1,506,191 - 27,911,614Victoria 1,815,303 82,836 - 1,898,139Queensland 3,941,480 571,151 - 4,512,631Western Australia 771,382 23,403 - 794,785ACT - 34,246 - 34,246Total 32,933,588 2,217,827 - 35,151,415
7. LOANS TO MEMBERS continued
36 ANNUAL REPORT 2015
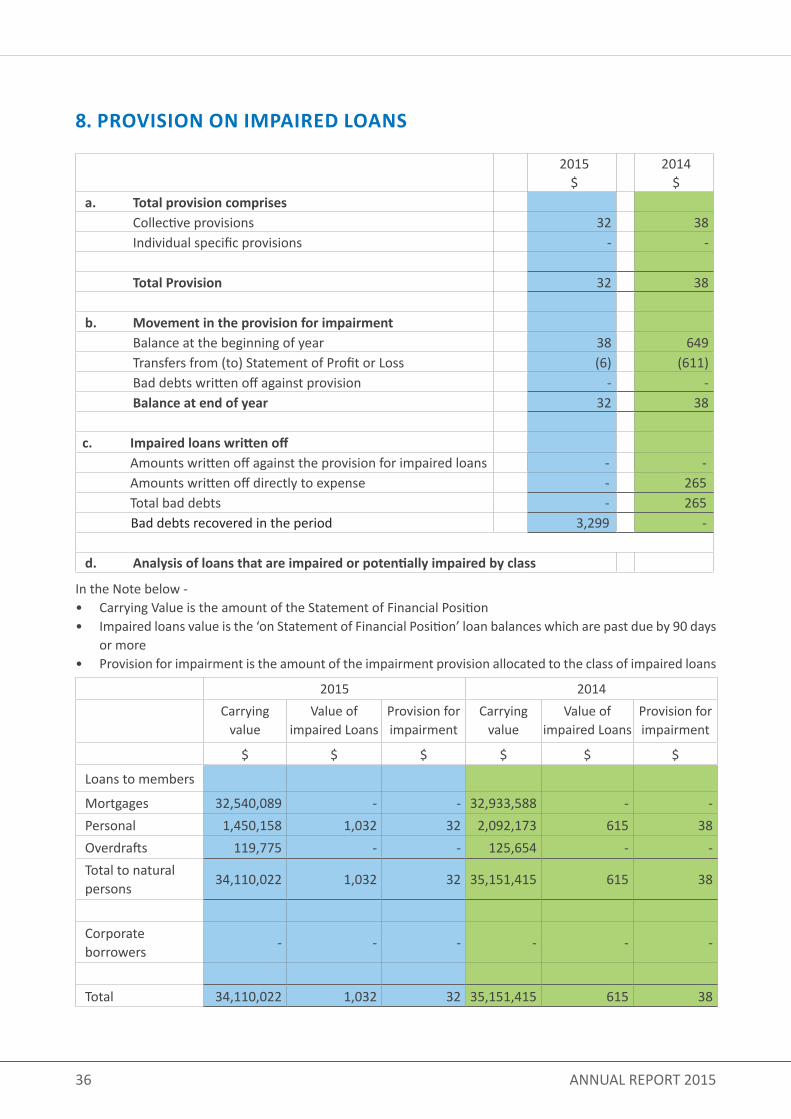
2015$
2014$
a. Total provision comprises Collective provisions 32 38 Individual specific provisions - -
Total Provision 32 38
b. Movement in the provision for impairment Balance at the beginning of year 38 649 Transfers from (to) Statement of Profit or Loss (6) (611) Bad debts written off against provision - - Balance at end of year 32 38
c. Impaired loans written off Amounts written off against the provision for impaired loans - - Amounts written off directly to expense - 265 Total bad debts - 265 Bad debts recovered in the period 3,299 -
d. Analysis of loans that are impaired or potentially impaired by class
2015 2014Carrying
valueValue of
impaired LoansProvision for impairment
Carrying value
Value of impaired Loans
Provision for impairment
$ $ $ $ $ $
Loans to members
Mortgages 32,540,089 - - 32,933,588 - -Personal 1,450,158 1,032 32 2,092,173 615 38Overdrafts 119,775 - - 125,654 - -Total to natural persons
34,110,022 1,032 32 35,151,415 615 38
Corporate borrowers
- - - - - -
Total 34,110,022 1,032 32 35,151,415 615 38
8. PROVISION ON IMPAIRED LOANS
In the Note below - • Carrying Value is the amount of the Statement of Financial Position • Impaired loans value is the ‘on Statement of Financial Position’ loan balances which are past due by 90 days
or more• Provision for impairment is the amount of the impairment provision allocated to the class of impaired loans

37CAPE - Customer Owned Banking
e. Analysis of loans that are impaired or potentially impaired based on age of repayments outstanding 2015 2014
Carrying Value
ProvisionCarrying
ValueProvision
Non impaired $ $ $ $up to 30 days in arrears - - 2,611,451 -30 to 90 days in arrears 217,241 - -Impaired -30 to 90 days in arrears 1,427 - - -90 to 180 days in arrears - - - -180 to 270 days in arrears - - - -270 to 365 days in arrears - - - -Over 365 days in arrears - - -
Overlimit facilities over 14 days 1,032 32 615 38Total in arrears 219,700 32 2,612,066 38Total loans not in arrears 33,890,322 - 32,539,349 -Total 34,110,022 32 35,151,415 38Loans with repayments past due but not impaired are not considered to be impaired as the value of related security over residential property is in excess of the loan due.
f. Loans renegotiatedThere were no loans that were previously past due or impaired which have been renegotiated by CAPE and are no longer regarded as impaired.
g. Key assumptions in determining the provision for impairmentIn the course of the preparation of the annual report CAPE has determined the likely impairment loss on loans which have not maintained the loan repayments in accordance with the loan contract, or where there is other evidence of potential impairment such as industrial restructuring, job losses or economic circumstances. In identifying the impairment likely from these events CAPE is required to estimate the potential impairment using the length of time the loan is in arrears and the historical losses arising in past years. Given the relatively small number of impairedloans, the circumstances may vary for each loan over time resulting in higher or lower impairment losses.
An estimate is based on the period of impairment as is shown in this table:
It is not practicable to determine the fair value of all collateral as at the balance date due to the variety of assets and conditions.
Period of impairment % of Balance
Up to 90 days 090 days to 181 days 40
181 days to 270 days 60270 days to 265 days 80
Over 365 days 100
38 ANNUAL REPORT 2015
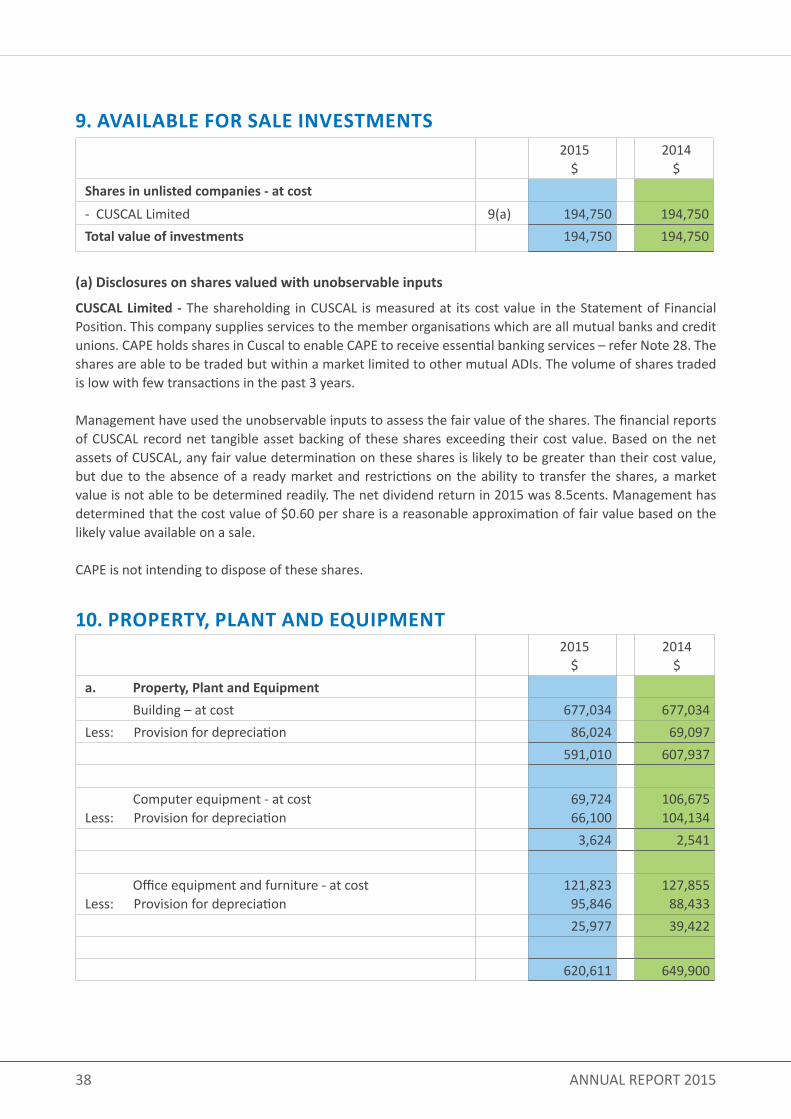
2015$
2014$
Shares in unlisted companies - at cost- CUSCAL Limited 9(a) 194,750 194,750Total value of investments 194,750 194,750
(a) Disclosures on shares valued with unobservable inputs
CUSCAL Limited - The shareholding in CUSCAL is measured at its cost value in the Statement of Financial Position. This company supplies services to the member organisations which are all mutual banks and credit unions. CAPE holds shares in Cuscal to enable CAPE to receive essential banking services – refer Note 28. The shares are able to be traded but within a market limited to other mutual ADIs. The volume of shares traded is low with few transactions in the past 3 years.
Management have used the unobservable inputs to assess the fair value of the shares. The financial reports of CUSCAL record net tangible asset backing of these shares exceeding their cost value. Based on the net assets of CUSCAL, any fair value determination on these shares is likely to be greater than their cost value, but due to the absence of a ready market and restrictions on the ability to transfer the shares, a market value is not able to be determined readily. The net dividend return in 2015 was 8.5cents. Management has determined that the cost value of $0.60 per share is a reasonable approximation of fair value based on the likely value available on a sale.
CAPE is not intending to dispose of these shares.
10. PROPERTY, PLANT AND EQUIPMENT2015
$2014
$a. Property, Plant and Equipment Building – at cost 677,034 677,034Less: Provision for depreciation 86,024 69,097
591,010 607,937
Computer equipment - at costLess: Provision for depreciation
69,72466,100
106,675104,134
3,624 2,541
Office equipment and furniture - at costLess: Provision for depreciation
121,82395,846
127,85588,433
25,977 39,422
620,611 649,900
9. AVAILABLE FOR SALE INVESTMENTS

39CAPE - Customer Owned Banking
2015$
2014$
Deferred Tax Assets 29,249 31,763
Deferred tax assets comprise: Provisions 22,327 18,152 Accrued expenses 27,003 21,548 Others (20,081) (7,937) 29,249 31,763
2015$
2014$
Computer software 375,258 363,439 Less provision for amortisation (248,365) (195,993)
126,893 167,446
Movement in the assets balances during the year were : Opening balance 167,446 171,716 Purchases 11,820 48,144 Less Amortisation charge (52,373) (52,414) Balance at the end of the year 126,893 167,446
11. TAXATION ASSETS
12. INTANGIBLE ASSETS
b. Movement in the assets balances during the year were :2015 2014
BuildingPlant and
EquipmentTotal Building
Plant and Equipment
Total
$ $ $ $ $ $
Opening Balance 607,937 41,963 649,900 624,864 61,019 685,883
Purchases in the year - 4,801 4,801 - - -LessNet Value of assets disposed - - - - - -Depreciation charge 16,927 17,164 34,090 16,927 19,056 35,983Balance at the end of the year 591,010 29,601 620,611 607,937 41,963 649,900
10. PROPERTY, PLANT AND EQUIPMENT continued
40 ANNUAL REPORT 2015
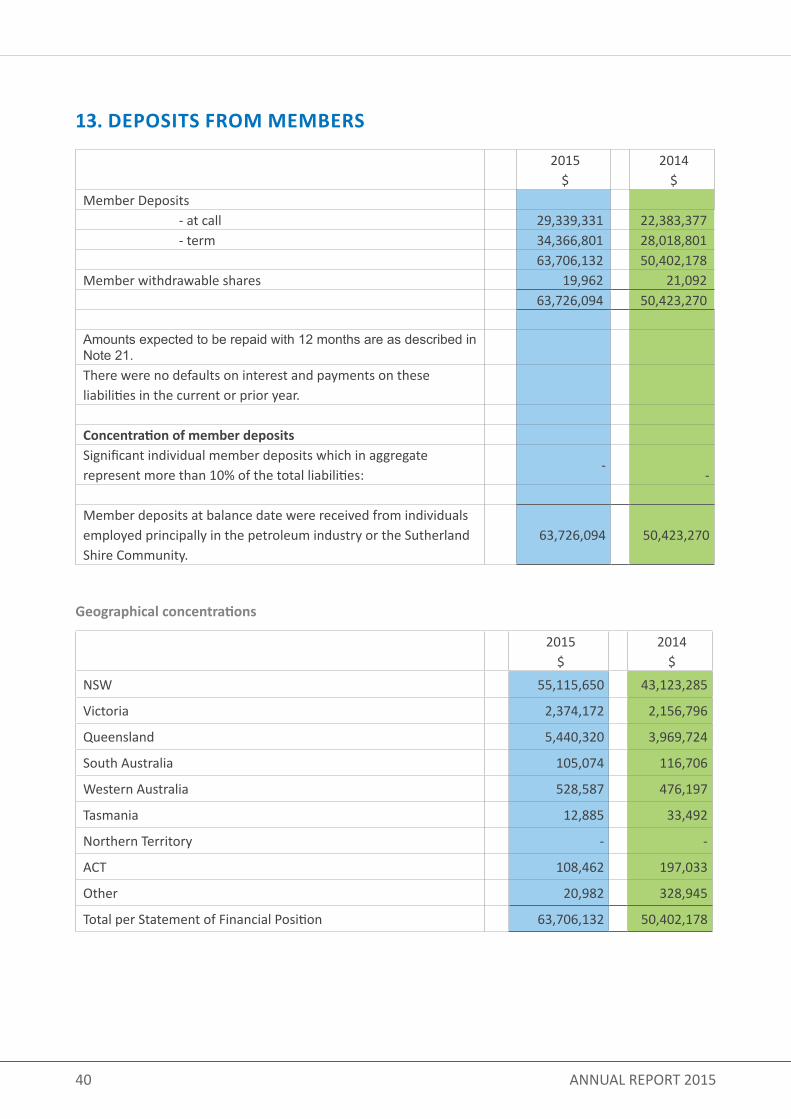
13. DEPOSITS FROM MEMBERS
2015
$2014
$Member Deposits - at call 29,339,331 22,383,377 - term 34,366,801 28,018,801
63,706,132 50,402,178Member withdrawable shares 19,962 21,092 63,726,094 50,423,270
Amounts expected to be repaid with 12 months are as described in Note 21. There were no defaults on interest and payments on these liabilities in the current or prior year.
Concentration of member depositsSignificant individual member deposits which in aggregate represent more than 10% of the total liabilities:
--
Member deposits at balance date were received from individuals employed principally in the petroleum industry or the Sutherland Shire Community.
63,726,094 50,423,270
Geographical concentrations
2015$
2014$
NSW 55,115,650 43,123,285
Victoria 2,374,172 2,156,796
Queensland 5,440,320 3,969,724
South Australia 105,074 116,706
Western Australia 528,587 476,197
Tasmania 12,885 33,492
Northern Territory - -
ACT 108,462 197,033
Other 20,982 328,945
Total per Statement of Financial Position 63,706,132 50,402,178

41CAPE - Customer Owned Banking
14. CREDITOR ACCRUALS AND SETTLEMENT ACCOUNTS2015
$2014
$ Annual leave 43,577 41,534 Creditors and accruals 11,027 9,698 Interest payable 326,246 322,807 Accrual for other tax liabilities 586 142 Sundry creditors 181,627 159,617 563,063 533,798
15. TAXATION LIABILITIES2015
$2014
$ Current income tax liability / (asset) 22,664 16,028
Current income tax liability comprises: Balance – previous year 16,028 (42,389) Less refund/(paid) (14,537) 42,373 Over statement/(under statement) in prior year (1,491) 16 Carried forward from previous year - - Liability for income tax in current year 43,875 34,891 Less instalments paid in current year 21,211 18,863 Balance – current year 22,664 16,028
16. PROVISIONS2015
$2014
$
Long service leave 30,827 18,936
17. GENERAL RESERVE FOR CREDIT LOSSES2015
$2014
$
General reserve for credit losses 341,100 351,514
General reserve for credit losses
This reserve records amounts maintained to comply with the Prudential Standards set down by APRA Balance at beginning of year 351,514 346,904 Increase transferred from retained earnings (10,414) 4,610 Balance at end of year 341,100 351,514
42 ANNUAL REPORT 2015
18. FINANCIAL RISK MANAGEMENT OBJECTIVES AND POLICIES
IntroductionThe Board has endorsed a policy of compliance and risk management to support the risk profile of CAPE.
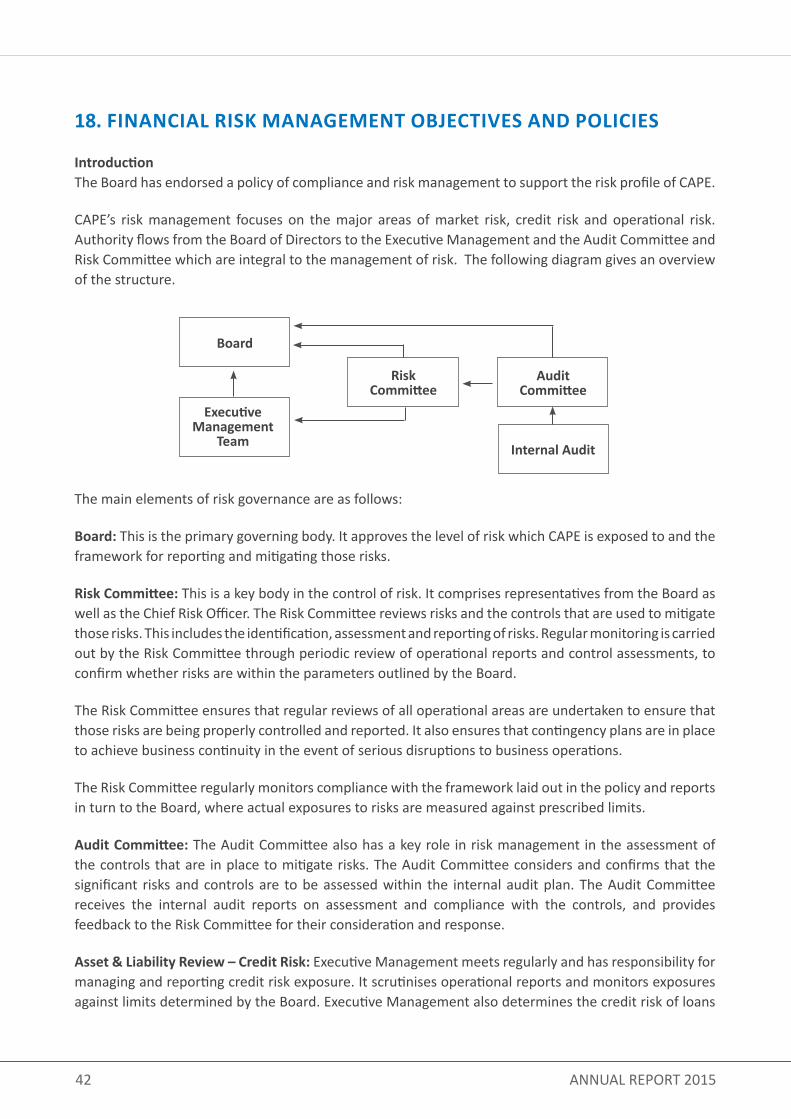
CAPE’s risk management focuses on the major areas of market risk, credit risk and operational risk. Authority flows from the Board of Directors to the Executive Management and the Audit Committee and Risk Committee which are integral to the management of risk. The following diagram gives an overview of the structure.
The main elements of risk governance are as follows:
Board: This is the primary governing body. It approves the level of risk which CAPE is exposed to and the framework for reporting and mitigating those risks.
Risk Committee: This is a key body in the control of risk. It comprises representatives from the Board as well as the Chief Risk Officer. The Risk Committee reviews risks and the controls that are used to mitigate those risks. This includes the identification, assessment and reporting of risks. Regular monitoring is carried out by the Risk Committee through periodic review of operational reports and control assessments, to confirm whether risks are within the parameters outlined by the Board.
The Risk Committee ensures that regular reviews of all operational areas are undertaken to ensure that those risks are being properly controlled and reported. It also ensures that contingency plans are in place to achieve business continuity in the event of serious disruptions to business operations.
The Risk Committee regularly monitors compliance with the framework laid out in the policy and reports in turn to the Board, where actual exposures to risks are measured against prescribed limits.
Audit Committee: The Audit Committee also has a key role in risk management in the assessment of the controls that are in place to mitigate risks. The Audit Committee considers and confirms that the significant risks and controls are to be assessed within the internal audit plan. The Audit Committee receives the internal audit reports on assessment and compliance with the controls, and provides feedback to the Risk Committee for their consideration and response.
Asset & Liability Review – Credit Risk: Executive Management meets regularly and has responsibility for managing and reporting credit risk exposure. It scrutinises operational reports and monitors exposures against limits determined by the Board. Executive Management also determines the credit risk of loans
Board
Executive Management
Team
Risk Committee
Internal Audit
Audit Committee
43CAPE - Customer Owned Banking
in the banking book, ensures provisioning is accurate and determines controls that need to be put in place regarding the authorisation of new loans.
Executive Management has responsibility for implementing policies to ensure that all large credit exposures are properly pre-approved, measured and controlled. Details concerning a prospective borrower are subject to a criteria-based decision-making process and strictly within the Delegations of Authority approved by the Board. Criteria used for this assessment include: credit references, loan-to-value ratio on security and borrower’s capacity to repay which vary according to the value of the loan or facility.
All large credit exposure facilities above policy limits are approved by the Board. All exposures are checked daily against approved limits.
All loans are managed weekly through the monitoring of the scheduled repayments. Accounts where the arrears are over 90 days or overdrawn/overlimit facilities over 14 days have collective provisions charged against them. Other provisions are taken up on accounts considered doubtful and the status of these loans is reported to the Board.
Arrears are strictly controlled. The size of the loan book is such that it is possible to monitor each individual exposure to evaluate whether specific provisions are necessary and adequate. The Officer responsible for credit control reports to the General Manager and implements CAPE’s credit risk policy. Additionally, a collective provision is held to cover any losses where there is objective evidence that losses are present in components of the loans and advances portfolio at the Statement of Financial Position date.
Asset and Liability Review - Market Risk: Executive Management meets regularly and has responsibility for managing interest rate risk exposures, and ensuring that the treasury and finance functions adhere to exposure limits as outlined in the policies for interest rate GAP. The weekly scrutiny of market risk reports is intended to prevent any exposure breaches prior to the monthly review by the Board.
Chief Risk Officer: has responsibility for both liaising with the operational function to ensure timely production of information for the Board and ensuring that instructions passed down from the Board via the Risk Committee are implemented.
Internal Audit: Internal audit has responsibility for implementing the controls testing and assessment as required by the Audit Committee.
CAPE’s risk management policies encompassed in the overall risk management framework include both core and non core risks including:
• Market and Interest rate risk • Liquidity management• Credit risk management• Operations risk management including data risk management
CAPE has undertaken the following strategies to minimise the risks arising from financial instruments.
44 ANNUAL REPORT 2015
A. MARKET RISK POLICYThe objective of CAPE’s market risk management is to manage and control market risk exposures in order to optimise and minimise risk.
Market risk is the risk that changes in interest rates, foreign exchange rates or other prices and volatilities will have an adverse effect on CAPE’s financial condition or results. CAPE is not exposed to currency risk, and other significant price risk. CAPE does not trade in the financial instruments it holds on its books. CAPE is exposed only to interest rate risk arising from changes in market interest rates.
The management of market risk is the responsibility of the Risk Committee, which reports directly to the Board.
(i) INTEREST RATE RISK
Interest rate risk is the risk of variability of the fair value or future cash flows arising from financial instruments due to the changes in interest rates.
Most banks are exposed to interest rate risk within its Treasury operations. CAPE does not have a treasury operation and does not trade in financial instruments.
Interest Rate Risk In The Banking BookCAPE is exposed to interest rate risk in its banking book due to mismatches between the repricing dates of assets and liabilities.
The interest rate risk on the banking book is monitored by the Manager Finance and Accounting and reported to the General Manager and reported to the Board monthly.
In the banking book the most common risk CAPE faces arises from fixed rate assets and liabilities. This exposes CAPE to the risk of sensitivity should interest rates change.
The level of mismatch on the banking book is set out in Note 22 below. The table set out at Note 22 displays the period that each asset and liability will reprice as at the balance date. This risk is not considered significant to warrant the use of derivatives to mitigate this risk.
Method Of Managing Risk CAPE manages its interest rate risk by the use of interest rate sensitivity analysis, the detail and assumptions used are set out below.
Interest Rate Sensitivity CAPE’s exposure to market risk is measured and monitored using interest rate sensitivity models. The policy of CAPE to manage the risk is to maintain a balanced ‘on book’ strategy by ensuring the net interest rate gaps between assets and liabilities are not excessive. The Gap is measured regularly to
18. FINANCIAL RISK MANAGEMENT OBJECTIVES AND POLICIES continued
45CAPE - Customer Owned Banking
identify any large exposures to interest rate movements and to rectify the excess through targeted fixed rate interest products available through investment assets, and term deposit liabilities to rectify the imbalance to within acceptable levels. The policy of CAPE is not to undertake derivatives to match the interest rate risks. CAPE’s exposure to interest rate risk is set out in Note 22.
Based on the calculations as at 30 June 2015, the net profit impact for a 1% decrease movement in interest rates would be a reduction in net interest income of $174,579 (2014: $212,123). The net profit impact for a 1% increase movement in interest rates would be an improvement in net interest income of $174,579 (2014: $212,123).
CAPE performs a sensitivity analysis to measure market risk exposures.
The method used in determining the sensitivity was to evaluate the profit based on the timing of the interest repricing on the banking book of CAPE for the next 12 months. In doing the calculation the assumptions applied were that:
- the interest rate change would be applied equally over to the loan products, term deposits and investments; - the rate change would be as at the beginning of the 12 month period and no other rate changes would be effective during the period; - the term deposits would all reprice to the new interest rate at the term maturity, or be replaced by deposits with similar terms and rates applicable; - fixed rate loans would all reprice to the new interest rate at the contracted date and treated as variable loans from that point; - mortgage loans all reprice to the new interest rate within 28 days; - personal loans all reprice to the new interest rate within 28 days; - all loans would be repaid in accordance with the current average repayment rate (or contractual repayment terms); - the value and mix of call savings to term deposits will be unchanged; and - the value and mix of personal loans to mortgage loans will be unchanged.
There has been no change to CAPE’s exposure to market risk or the way CAPE manages and measures market risk in the reporting period.
B. LIQUIDITY RISKLiquidity risk is the risk that CAPE may encounter difficulties raising funds to meet commitments associated with financial instruments, e.g. borrowing repayments or member withdrawal demands. It is the policy of the Board of Directors that CAPE maintains adequate cash reserves and committed credit facilities so as to meet the member withdrawal demands when requested.
CAPE manages liquidity risk by:• Continuously monitoring actual daily cash flows and longer term forecasted cash flows;
46 ANNUAL REPORT 2015
• Monitoring the maturity profiles of financial assets and liabilities;• Maintaining adequate reserves, liquidity support facilities and reserve borrowing facilities; and• Monitoring the prudential liquidity ratio daily.
CAPE has a long standing arrangement with the industry liquidity support entity Credit Union Financial Support Services (CUFSS) which can access industry funds to provide support to CAPE should it be necessary at short notice.
CAPE is a member of the Austraclear “system” as an Associate participant. Austraclear provides clearing and settlement services in relation to security transactions entered into by CAPE. Additionally CAPE also now enjoys membership of the Reserve Bank Information and Transfer System (RITS) which is Australia’s high-value payments system, used by banks and other approved institutions to settle their payment obligations on a real-time gross settlement (RTGS) basis.
RITS membership also facilitates CAPE’s participation in the Reserve Bank’s domestic market operations whereby the Reserve Bank will purchase, if required, securities held by CAPE to assist in liquidity risk management.
CAPE is required to maintain at least 9% of total adjusted liabilities as liquid assets capable of being converted into cash within 24 hours under the APRA Prudential standards. CAPE policy is to ensure a minimum of 13% of total adjusted liabilities is held as liquid assets to maintain adequate funds for meeting member withdrawal requests. The ratio is checked daily. Should the liquidity ratio fall below this level the management and Board are to address the matter and ensure that the liquid funds are obtained from new deposits, or borrowing facilities available. Note 25 describes the borrowing facilities as at the balance date. These facilities are in addition to the support from CUFSS.
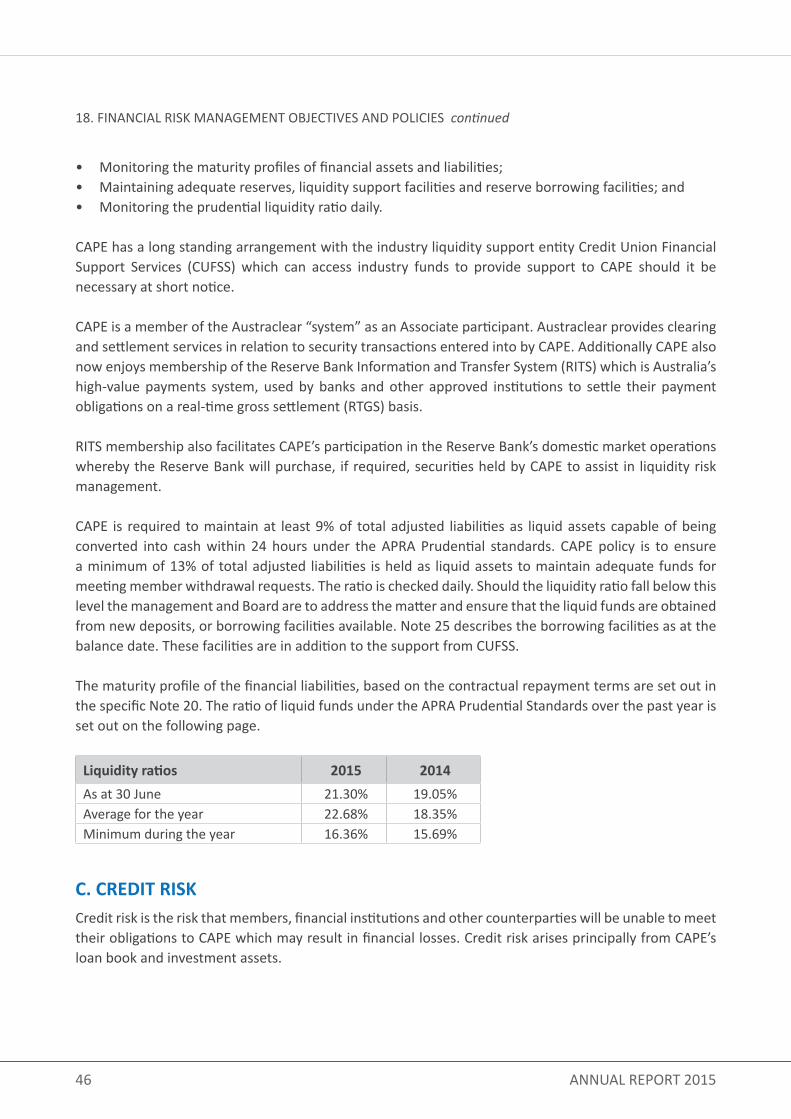
The maturity profile of the financial liabilities, based on the contractual repayment terms are set out in the specific Note 20. The ratio of liquid funds under the APRA Prudential Standards over the past year is set out on the following page.
Liquidity ratios 2015 2014As at 30 June 21.30% 19.05%Average for the year 22.68% 18.35%Minimum during the year 16.36% 15.69%
C. CREDIT RISKCredit risk is the risk that members, financial institutions and other counterparties will be unable to meet their obligations to CAPE which may result in financial losses. Credit risk arises principally from CAPE’s loan book and investment assets.
18. FINANCIAL RISK MANAGEMENT OBJECTIVES AND POLICIES continued
47CAPE - Customer Owned Banking
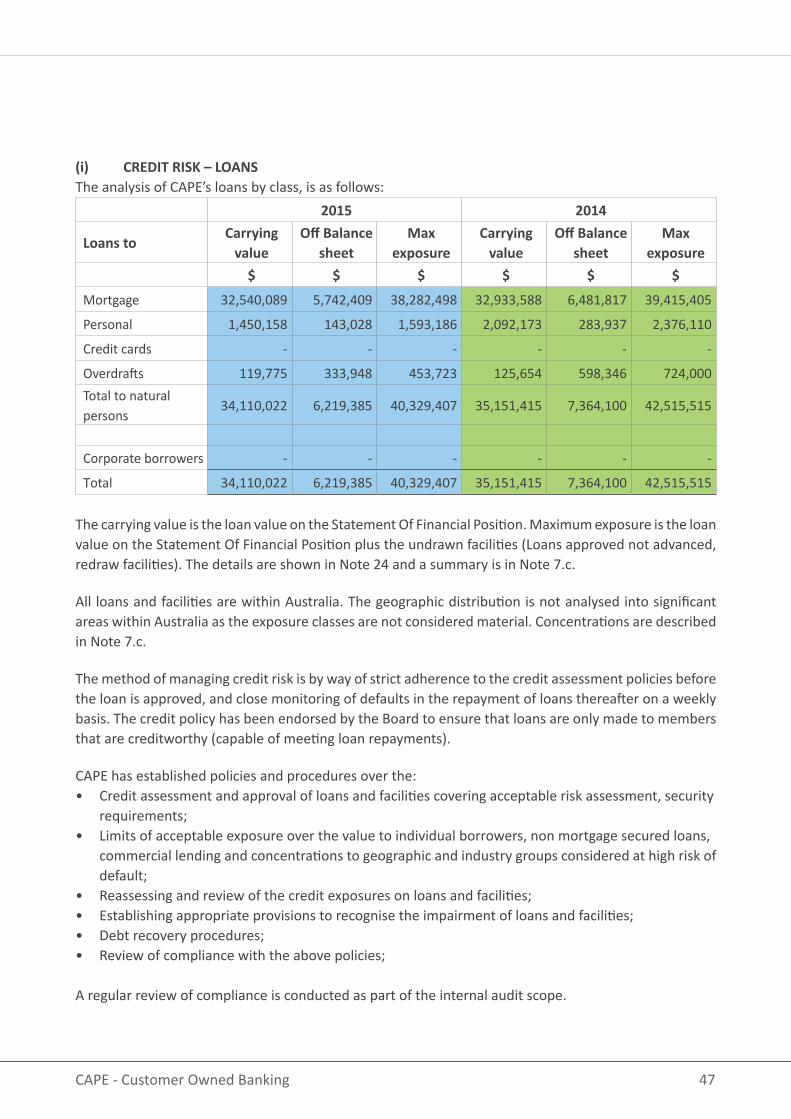
(i) CREDIT RISK – LOANSThe analysis of CAPE’s loans by class, is as follows:
2015 2014
Loans to Carrying
valueOff Balance
sheetMax
exposureCarrying
valueOff Balance
sheetMax
exposure$ $ $ $ $ $
Mortgage 32,540,089 5,742,409 38,282,498 32,933,588 6,481,817 39,415,405
Personal 1,450,158 143,028 1,593,186 2,092,173 283,937 2,376,110
Credit cards - - - - - -
Overdrafts 119,775 333,948 453,723 125,654 598,346 724,000Total to natural persons
34,110,022 6,219,385 40,329,407 35,151,415 7,364,100 42,515,515
Corporate borrowers - - - - - -
Total 34,110,022 6,219,385 40,329,407 35,151,415 7,364,100 42,515,515
The carrying value is the loan value on the Statement Of Financial Position. Maximum exposure is the loan value on the Statement Of Financial Position plus the undrawn facilities (Loans approved not advanced, redraw facilities). The details are shown in Note 24 and a summary is in Note 7.c.
All loans and facilities are within Australia. The geographic distribution is not analysed into significant areas within Australia as the exposure classes are not considered material. Concentrations are described in Note 7.c.
The method of managing credit risk is by way of strict adherence to the credit assessment policies before the loan is approved, and close monitoring of defaults in the repayment of loans thereafter on a weekly basis. The credit policy has been endorsed by the Board to ensure that loans are only made to members that are creditworthy (capable of meeting loan repayments).
CAPE has established policies and procedures over the:• Credit assessment and approval of loans and facilities covering acceptable risk assessment, security
requirements;• Limits of acceptable exposure over the value to individual borrowers, non mortgage secured loans,
commercial lending and concentrations to geographic and industry groups considered at high risk of default;
• Reassessing and review of the credit exposures on loans and facilities; • Establishing appropriate provisions to recognise the impairment of loans and facilities;• Debt recovery procedures;• Review of compliance with the above policies;
A regular review of compliance is conducted as part of the internal audit scope.
48 ANNUAL REPORT 2015
Past Due And Impaired
A financial asset is past due when the counterparty has failed to make a payment when contractually due. As an example, a member enters into a lending agreement with CAPE that requires interest and a portion of the principal to be paid every month. On the first day of the next month, if the agreed repayment amount has not been paid, the loan is past due. Past due does not mean that a counterparty will never pay, but it can trigger various actions such as renegotiation, enforcement of covenants, or legal proceedings. Once the past due exceeds 90 days the loan is regarded as impaired, unless other factors indicate the impairment should be recognised sooner.
Daily reports monitor the loan repayments to detect delays in repayments and recovery action is undertaken after 7 days. For loans where repayments are doubtful, external consultants may be engaged to conduct recovery action once the loan is over 90 days in arrears. The exposures to losses arise predominantly in the personal loans and facilities not secured by registered mortgages over real estate.
If such evidence exists, the estimated recoverable amount of that asset is determined and any impairment loss, based on the net present value of future anticipated cash flows, is recognised in the Statement of Profit or Loss. In estimating these cash flows, management makes judgements about a counterparty’s financial situation and the net realisable value of any underlying collateral.
In addition to specific provisions against individually significant financial assets, CAPE makes collective assessments for each financial asset portfolio segmented by similar risk characteristics.
Statement of Financial Position provisions are maintained at a level that management deems sufficient to absorb probable incurred losses in CAPE’s loan portfolio from homogenous portfolios of assets and individually identified loans.
A provision for incurred losses is established on all past due loans after a specified period of repayment default where it is probable that some of the capital will not be repaid or recovered. Specific loans and portfolios of assets are provided against depending on a number of factors including deterioration in the general economy, changes in a counterparties industry, and technological developments, as well as identified structural weaknesses or deterioration in cash flows.
The provisions for impaired and past due exposures relate to the loans to members. Past due value is the on Statement of Financial Position loan balances which are past due by 90 days or more. Details are as set out in Note 8.
Bad Debts
Amounts are written off when collection of the loan or advance is considered to be remote. All write offs are on a case by case basis, taking account of the exposure at the date of the write off.
18. FINANCIAL RISK MANAGEMENT OBJECTIVES AND POLICIES continued
49CAPE - Customer Owned Banking
On secured loans, the write off takes place on ultimate realisation of collateral value, or from claims on any lenders mortgage insurance. A reconciliation in the movement of both past due and impaired exposure provisions is provided in Note 8.
Collateral Securing Loans
A sizeable portfolio of the loan book is secured by residential property in Australia. Therefore, CAPE is exposed to risks in the reduction of the Loan to Value (LVR) cover should the property market be subject to a decline. The risk of losses from the loans undertaken is primarily reduced by the nature and quality of the security taken.
Concentration Risk – Individuals
Concentration risk is a measurement of CAPE’s exposure to an individual counterparty (or group of related parties). If prudential limits are exceeded as a proportion of CAPE’s regulatory capital (10%) a large exposure is considered to exist. No capital is required to be held against these but APRA must be informed. APRA may impose additional capital requirements if it considers the aggregate exposure to all loans over the 10% capital benchmark, to be higher than acceptable.
The aggregate value of large exposure loans are set out in Note 7. Concentration exposures to counterparties are closely monitored with annual reviews being prepared for all exposures over 5% of the capital base.
Concentration Risk – Industry
There is no concentration of credit risk with respect to loans and receivables as CAPE has a large number of customers dispersed in areas of employment.
CAPE has a concentration in the retail lending for members who comprise employees and family in the petroleum industry. This concentration is considered acceptable on the basis that CAPE was formed to service these members, and the employment concentration is not exclusive. Should members leave the industry the loans continue and other employment opportunities are available to the members to facilitate the repayment of the loans. The details of the geographical and industry concentrations are set out in Note 7.
(ii) CREDIT RISK – LIQUID INVESTMENTS
Credit risk is the risk that the other party to a financial instrument will fail to discharge their obligation resulting in CAPE incurring a financial loss. This usually occurs when debtors fail to settle their obligations owing to CAPE.

50 ANNUAL REPORT 2015
There is a concentration of credit risk with respect to investment receivables with the placement of investments in CUSCAL. The credit policy is that investments are only made to institutions that are credit worthy. Directors have established policies that limit the level of funds that can be invested with any one financial institution at a time. CAPE is also bound by the APRA standard APS-221 Large Exposures. This standard limits any single investment with a counter party to 50% of the capital held by CAPE.
The risk of losses from the liquid investments undertaken is reduced by the nature and quality of the independent rating of the investment body and the limits to concentration on one credit union. Also the relative size of CAPE as compared to the industry is relatively low such that the risk of loss is reduced. Under the liquidity support scheme at least 3.2% of the total assets must be invested in CUSCAL to allow the scheme to have adequate resources to meet its obligations if needed. The Board policy is to maintain a minimum investment holding in CUSCAL Limited, a company set up to support the member credit unions and which has an A+ rating.
18. FINANCIAL RISK MANAGEMENT OBJECTIVES AND POLICIES continued
We believe our Customer’s interests always
override our interests
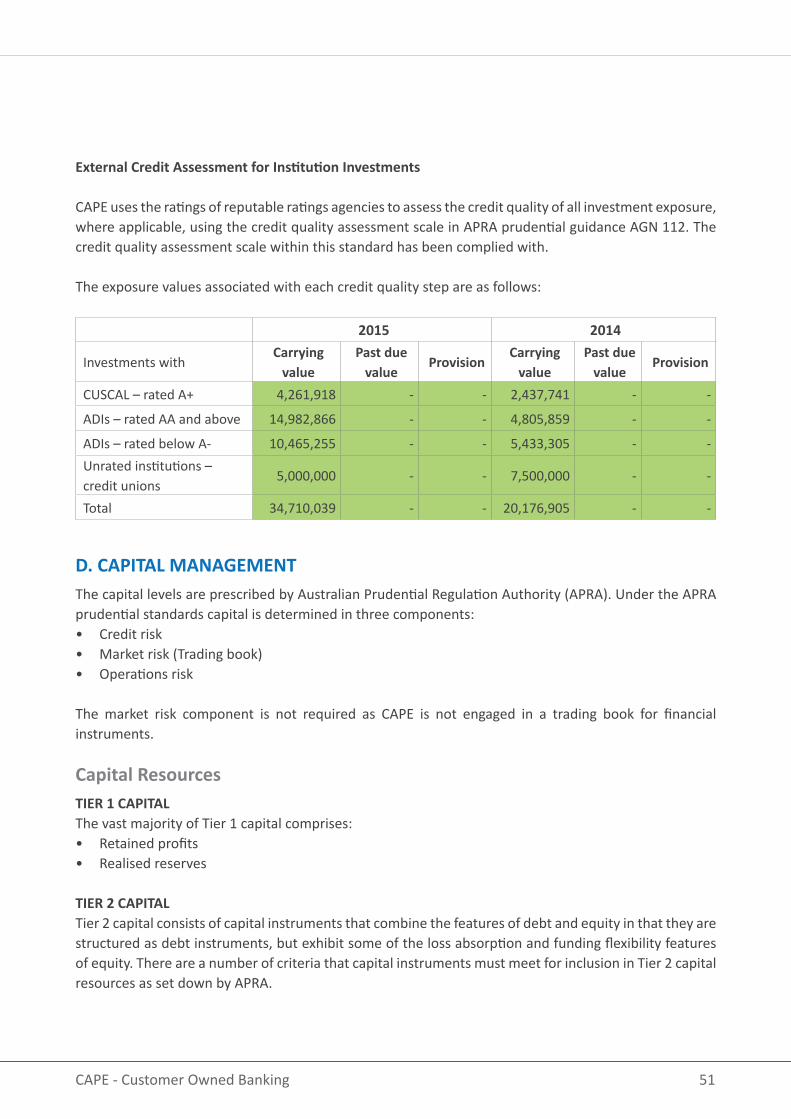
51CAPE - Customer Owned Banking
External Credit Assessment for Institution Investments
CAPE uses the ratings of reputable ratings agencies to assess the credit quality of all investment exposure, where applicable, using the credit quality assessment scale in APRA prudential guidance AGN 112. The credit quality assessment scale within this standard has been complied with.
The exposure values associated with each credit quality step are as follows:
2015 2014
Investments withCarrying
valuePast due
valueProvision
Carrying value
Past due value
Provision
CUSCAL – rated A+ 4,261,918 - - 2,437,741 - -
ADIs – rated AA and above 14,982,866 - - 4,805,859 - -
ADIs – rated below A- 10,465,255 - - 5,433,305 - -Unrated institutions – credit unions
5,000,000 - - 7,500,000 - -
Total 34,710,039 - - 20,176,905 - -
D. CAPITAL MANAGEMENT The capital levels are prescribed by Australian Prudential Regulation Authority (APRA). Under the APRA prudential standards capital is determined in three components:• Credit risk • Market risk (Trading book) • Operations risk
The market risk component is not required as CAPE is not engaged in a trading book for financial instruments.
Capital ResourcesTIER 1 CAPITALThe vast majority of Tier 1 capital comprises:• Retained profits • Realised reserves
TIER 2 CAPITALTier 2 capital consists of capital instruments that combine the features of debt and equity in that they are structured as debt instruments, but exhibit some of the loss absorption and funding flexibility features of equity. There are a number of criteria that capital instruments must meet for inclusion in Tier 2 capital resources as set down by APRA.
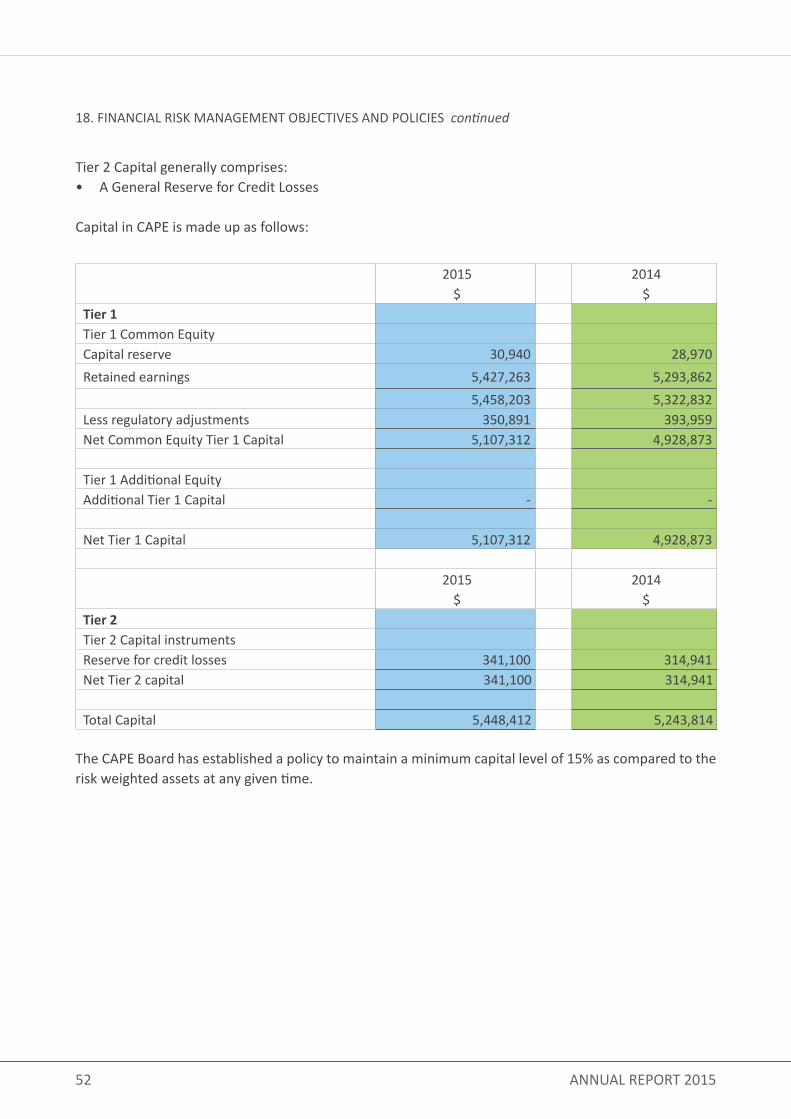
52 ANNUAL REPORT 2015
Tier 2 Capital generally comprises: • A General Reserve for Credit Losses
Capital in CAPE is made up as follows:
2015$
2014$
Tier 1Tier 1 Common EquityCapital reserve 30,940 28,970Retained earnings 5,427,263 5,293,862
5,458,203 5,322,832Less regulatory adjustments 350,891 393,959Net Common Equity Tier 1 Capital 5,107,312 4,928,873
Tier 1 Additional EquityAdditional Tier 1 Capital - -
Net Tier 1 Capital 5,107,312 4,928,873
2015$
2014$
Tier 2Tier 2 Capital instrumentsReserve for credit losses 341,100 314,941Net Tier 2 capital 341,100 314,941
Total Capital 5,448,412 5,243,814
The CAPE Board has established a policy to maintain a minimum capital level of 15% as compared to the risk weighted assets at any given time.
18. FINANCIAL RISK MANAGEMENT OBJECTIVES AND POLICIES continued
53CAPE - Customer Owned Banking
The capital ratio as at the end of the financial year over the past 4 years is as follows:
2015 2014 2013 2012
BASEL III BASEL III BASEL II BASEL II
17.00% 18.61% 19.16% 20.40%
The level of capital ratio can be affected by growth in assets relative to growth in reserves and by changes in the mix of assets.
To manage CAPE’s capital, CAPE reviews the ratio monthly and monitors major movements in the asset levels. Policies have been implemented to require reporting to the Board and the regulator if the capital ratio falls below 15%. Further a 3 year capital budget projection of the capital levels is maintained annually to address how strategic decisions or trends may impact on the capital level.
Capital on Operational Risk
This capital component was introduced as from 1 January 2012 and coincided with changes in the asset risk weightings for specified loans and liquid investments. Previously no operational charge was prescribed.
CAPE uses the Standardised approach which is considered to be most suitable for its business given the small number of distinct transaction streams. The Operational Risk Capital Requirement is calculated by mapping CAPE’s three year average net interest income and net non-interest income to CAPE’s various business lines.
Based on this approach, CAPE’s operational risk requirement is as follows:
Operational risk capital: $270,603 (2014: $239,029).
It is considered that the Standardised approach accurately reflects CAPE’s operational risk other than for the specific items set out below.
Internal Capital Adequacy Management
CAPE manages its internal capital levels for both current and future activities through a combination of the various committees. The outputs of the individual committees are reviewed by the Board in its capacity as the primary governing body. The capital required for any change in CAPE’s forecasts for asset growth, or unforeseen circumstances, are assessed by the Board. The Manager Finance and Accounting updates the forecast capital resources models produced and the impact upon the overall capital position of CAPE is reassessed.
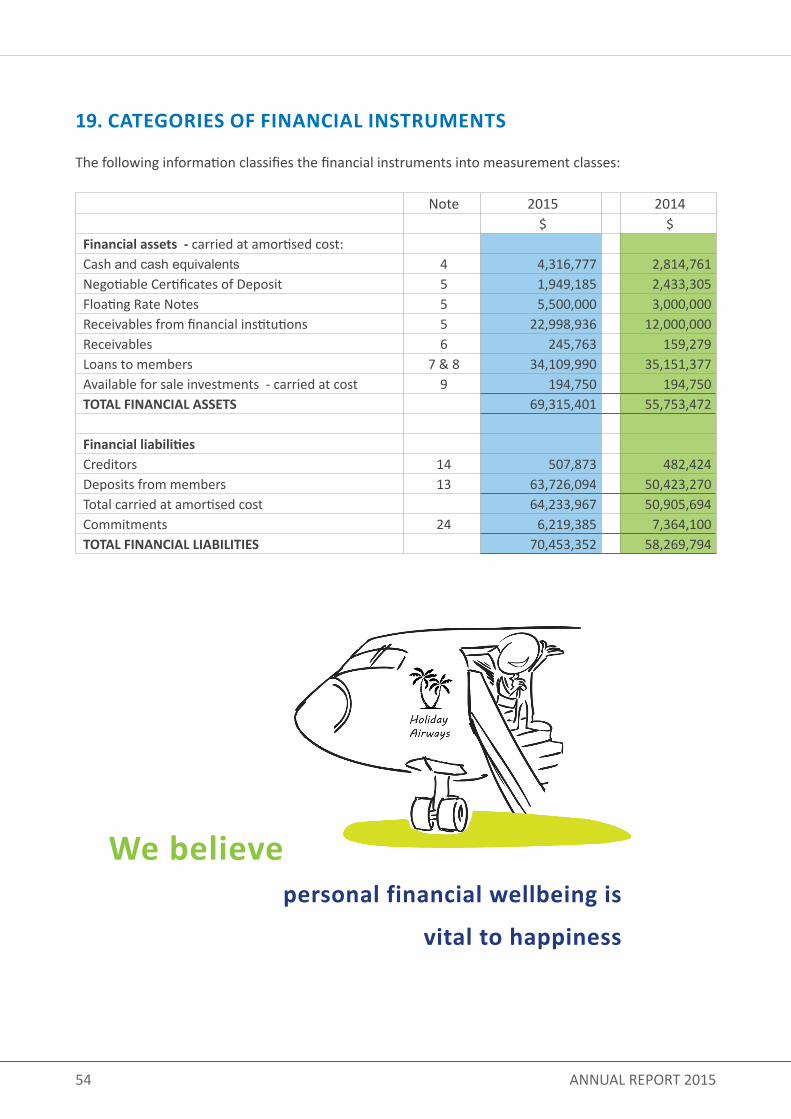
54 ANNUAL REPORT 2015
19. CATEGORIES OF FINANCIAL INSTRUMENTS
The following information classifies the financial instruments into measurement classes:
Note 2015 2014$ $
Financial assets - carried at amortised cost:Cash and cash equivalents 4 4,316,777 2,814,761Negotiable Certificates of Deposit 5 1,949,185 2,433,305Floating Rate Notes 5 5,500,000 3,000,000Receivables from financial institutions 5 22,998,936 12,000,000Receivables 6 245,763 159,279Loans to members 7 & 8 34,109,990 35,151,377Available for sale investments - carried at cost 9 194,750 194,750TOTAL FINANCIAL ASSETS 69,315,401 55,753,472
Financial liabilities Creditors 14 507,873 482,424Deposits from members 13 63,726,094 50,423,270Total carried at amortised cost 64,233,967 50,905,694Commitments 24 6,219,385 7,364,100TOTAL FINANCIAL LIABILITIES 70,453,352 58,269,794
We believe personal financial wellbeing is
vital to happiness
55CAPE - Customer Owned Banking
CAPE has been redefining the meaning
of ‘Customer’ for over 40 years with
revolutionary Customer-Owned Banking.
Because CAPE is owned by its customers,
for its customers,
the profits are returned back to you.

56 ANNUAL REPORT 2015
20. MATURITY PROFILE OF FINANCIAL ASSETS AND LIABILITIES
Monetary assets and liabilities have differing maturity profiles depending on the contractual term, and in the case of loans the repayment amount and frequency. The table below shows the period in which different monetary assets and liabilities held will mature and be eligible for renegotiation or withdrawal. In the case of loans, the table shows the period over which the principal outstanding will be repaid based on the remaining period to the repayment date assuming contractual repayments are maintained,
2015
Within 1 month 1 to 3 months 3 to 12 months 1 to 5 years Greater than 5 years No maturity Total Balance Sheet
ASSETSCash and cash equivalents 4,261,918 - - - - 54,859 4,316,777 4,316,777Receivables - - - - - 2,364 2,364 245,763Receivables from FI’s 4,548,786 10,599,587 12,229,975 3,908,235 - - 31,286,583 30,448,121Loans to members 262,981 556,040 2,305,163 10,761,873 41,296,618 - 55,182,675 34,109,990Available for sale investments - - - - - 194,750 194,750 194,750Total financial assets 9,073,685 11,155,627 14,535,138 14,670,108 41,296,618 251,973 90,983,149 69,315,401
LIABILITIES
Deposits from members 34,688,859 12,019,434 16,357,566 1,305,637 - - 64,371,496 63,726,094Creditors - - - - - 182,213 182,213 507,873On Balance sheet 34,688,859 12,019,434 16,357,566 1,305,637 - 182,213 64,553,709 64,233,967Commitments 6,219,385 - - - - - 6,219,385 -Total Financial Liabilities 40,908,244 12,019,434 16,357,566 1,305,637 - 182,213 70,773,094 64,233,967
2014
Within 1 month 1 to 3 months 3 to 12 months 1 to 5 years Greater than 5 years No maturity Total Balance Sheet
ASSETSCash and cash equivalents 2,743,600 - - - - 71,161 2,814,761 2,814,761Receivables - - - - - 2,475 2,475 159,279Receivables from FI’s 2,553,282 4,540,165 7,622,437 3,129,908 - - 17,845,792 17,433,305Loans to members 337,805 626,383 2,732,706 12,202,055 43,379,806 - 59,278,755 35,151,377Available for sale investments - - - - - 194,750 194,750 194,750Total financial assets 5,634,687 5,166,548 10,355,143 15,331,963 43,379,806 268,386 80,136,534 55,753,472
LIABILITIES
Deposits from members 27,082,325 10,401,494 12,817,725 718,979 - - 51,020,523 50,423,270Creditors - - - - - 482,424 482,424 482,424On Balance sheet 27,082,325 10,401,494 12,817,725 718,979 - 482,424 51,502,947 50,905,694Commitments 7,364,100 - - - - - 7,364,100 -Total Financial Liabilities 34,446,425 10,401,494 12,817,725 718,979 - 482,424 58,867,047 50,905,694
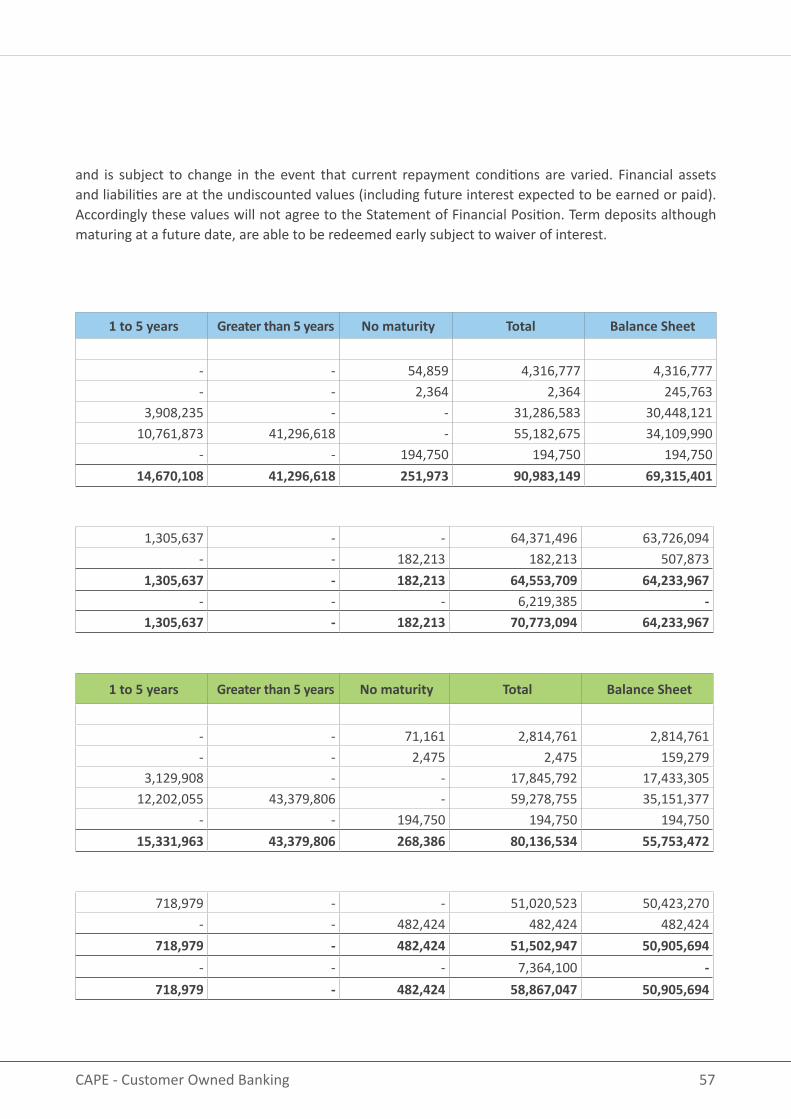
57CAPE - Customer Owned Banking
2015
Within 1 month 1 to 3 months 3 to 12 months 1 to 5 years Greater than 5 years No maturity Total Balance Sheet
ASSETSCash and cash equivalents 4,261,918 - - - - 54,859 4,316,777 4,316,777Receivables - - - - - 2,364 2,364 245,763Receivables from FI’s 4,548,786 10,599,587 12,229,975 3,908,235 - - 31,286,583 30,448,121Loans to members 262,981 556,040 2,305,163 10,761,873 41,296,618 - 55,182,675 34,109,990Available for sale investments - - - - - 194,750 194,750 194,750Total financial assets 9,073,685 11,155,627 14,535,138 14,670,108 41,296,618 251,973 90,983,149 69,315,401
LIABILITIES
Deposits from members 34,688,859 12,019,434 16,357,566 1,305,637 - - 64,371,496 63,726,094Creditors - - - - - 182,213 182,213 507,873On Balance sheet 34,688,859 12,019,434 16,357,566 1,305,637 - 182,213 64,553,709 64,233,967Commitments 6,219,385 - - - - - 6,219,385 -Total Financial Liabilities 40,908,244 12,019,434 16,357,566 1,305,637 - 182,213 70,773,094 64,233,967
2014
Within 1 month 1 to 3 months 3 to 12 months 1 to 5 years Greater than 5 years No maturity Total Balance Sheet
ASSETSCash and cash equivalents 2,743,600 - - - - 71,161 2,814,761 2,814,761Receivables - - - - - 2,475 2,475 159,279Receivables from FI’s 2,553,282 4,540,165 7,622,437 3,129,908 - - 17,845,792 17,433,305Loans to members 337,805 626,383 2,732,706 12,202,055 43,379,806 - 59,278,755 35,151,377Available for sale investments - - - - - 194,750 194,750 194,750Total financial assets 5,634,687 5,166,548 10,355,143 15,331,963 43,379,806 268,386 80,136,534 55,753,472
LIABILITIES
Deposits from members 27,082,325 10,401,494 12,817,725 718,979 - - 51,020,523 50,423,270Creditors - - - - - 482,424 482,424 482,424On Balance sheet 27,082,325 10,401,494 12,817,725 718,979 - 482,424 51,502,947 50,905,694Commitments 7,364,100 - - - - - 7,364,100 -Total Financial Liabilities 34,446,425 10,401,494 12,817,725 718,979 - 482,424 58,867,047 50,905,694
and is subject to change in the event that current repayment conditions are varied. Financial assets and liabilities are at the undiscounted values (including future interest expected to be earned or paid). Accordingly these values will not agree to the Statement of Financial Position. Term deposits although maturing at a future date, are able to be redeemed early subject to waiver of interest.
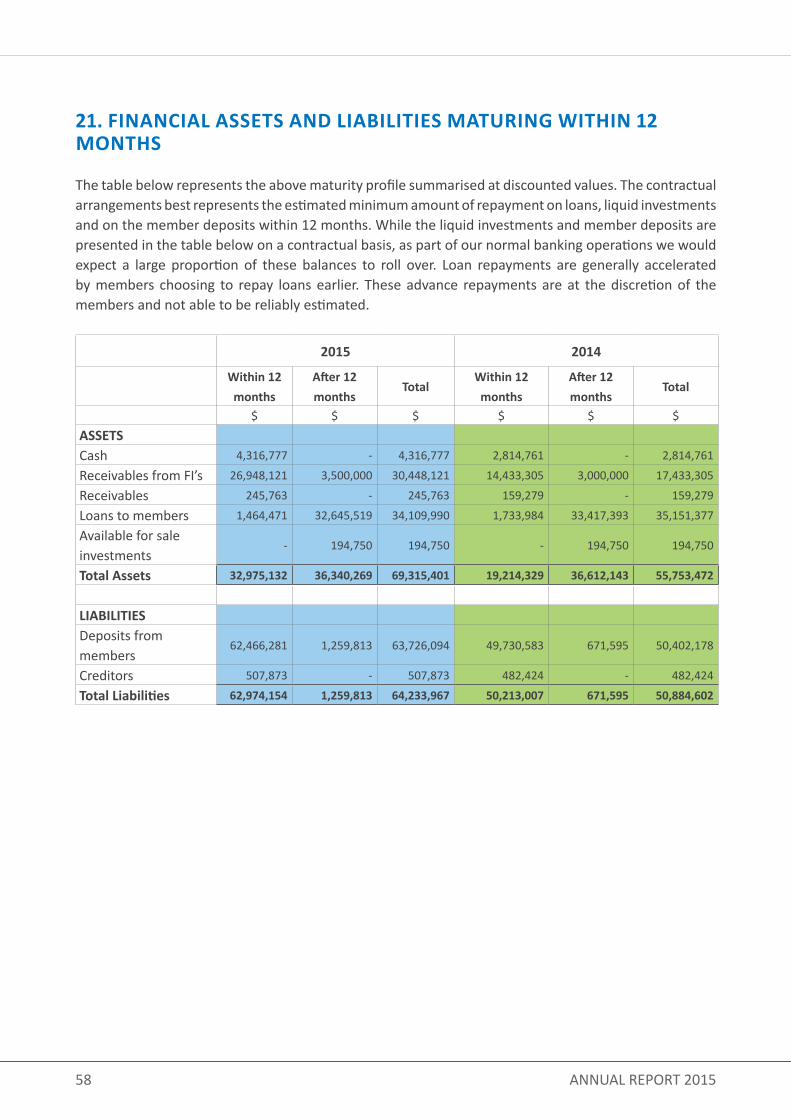
58 ANNUAL REPORT 2015
21. FINANCIAL ASSETS AND LIABILITIES MATURING WITHIN 12 MONTHS
The table below represents the above maturity profile summarised at discounted values. The contractual arrangements best represents the estimated minimum amount of repayment on loans, liquid investments and on the member deposits within 12 months. While the liquid investments and member deposits are presented in the table below on a contractual basis, as part of our normal banking operations we would expect a large proportion of these balances to roll over. Loan repayments are generally accelerated by members choosing to repay loans earlier. These advance repayments are at the discretion of the members and not able to be reliably estimated.
2015 2014
Within 12 months
After 12 months
Total Within 12 months
After 12 months
Total
$ $ $ $ $ $ASSETS
Cash 4,316,777 - 4,316,777 2,814,761 - 2,814,761
Receivables from FI’s 26,948,121 3,500,000 30,448,121 14,433,305 3,000,000 17,433,305
Receivables 245,763 - 245,763 159,279 - 159,279
Loans to members 1,464,471 32,645,519 34,109,990 1,733,984 33,417,393 35,151,377
Available for sale investments
- 194,750 194,750 - 194,750 194,750
Total Assets 32,975,132 36,340,269 69,315,401 19,214,329 36,612,143 55,753,472
LIABILITIESDeposits from members
62,466,281 1,259,813 63,726,094 49,730,583 671,595 50,402,178
Creditors 507,873 - 507,873 482,424 - 482,424
Total Liabilities 62,974,154 1,259,813 64,233,967 50,213,007 671,595 50,884,602
59CAPE - Customer Owned Banking
Looking for a new car?
Need assistance with accessing aged care?
Need to get the kids to move out?
Just wanting a new toy?

60 ANNUAL REPORT 2015
22. INTEREST RATE CHANGE PROFILE OF FINANCIAL ASSETS AND LIABILITIES
Financial assets and liabilities have conditions which allow interest rates to be amended either on maturity (term deposits and term investments) or after adequate notice is given (loans and savings). The table below shows the respective value of funds where interest rates are capable of being altered within the prescribed time bands, being the earlier of the contractual repricing date, or maturity date.
2015Avg rate Within 1 month 1 to 3 months 3 to 12 months 1 to 5 years Greater than 5 years Non interest bearing Total
ASSETSCash 1.67 4,261,918 - - - - 54,859 4,316,777Receivables from FI’s 2.96 5,488,401 14,982,868 9,976,853 - - - 30,448,121Receivables - - - - - 245,763 245,763Loans to members 5.15 28,525,803 - 1,023,019 4,561,168 - - 34,109,990Available for sale investments
- - - - - 194,750 194,750
Total Financial Assets 38,276,122 14,982,868 10,999,872 4,561,168 - 495,372 69,315,401
LIABILITIESDeposits from members 2.01 34,660,877 11,847,558 15,957,846 1,239,851 - 19,962 63,726,094Creditors - - - - - 507,873 507,873Total Financial Liabilities 34,660,877 11,847,558 15,957,846 1,239,851 - 527,835 64,233,967
2014Avg rate Within 1 month 1 to 3 months 3 to 12 months 1 to 5 years Greater than 5 years Non interest bearing Total
ASSETSCash 2.35 2,743,600 - - - - 71,161 2,814,761Receivables from FI’s 3.49 2,500,000 7,490,708 7,442,597 - - - 17,433,305Receivables - - - - - 159,279 159,279Loans to members 6.00 30,483,704 - 1,263,215 3,404,458 - - 35,151,377Available for sale investments
- - - - - - 194,750 194,750
Total Financial Assets 35,727,304 7,490,708 8,705,812 3,404,458 - 425,190 55,753,472
LIABILITIESDeposits from members 2.34 27,044,534 10,236,963 12,449,086 671,595 - 21,092 50,423,270Creditors - - - - - 482,424 482,424Total Financial Liabilities 27,044,534 10,236,963 12,449,086 671,595 - 503,516 50,905,694
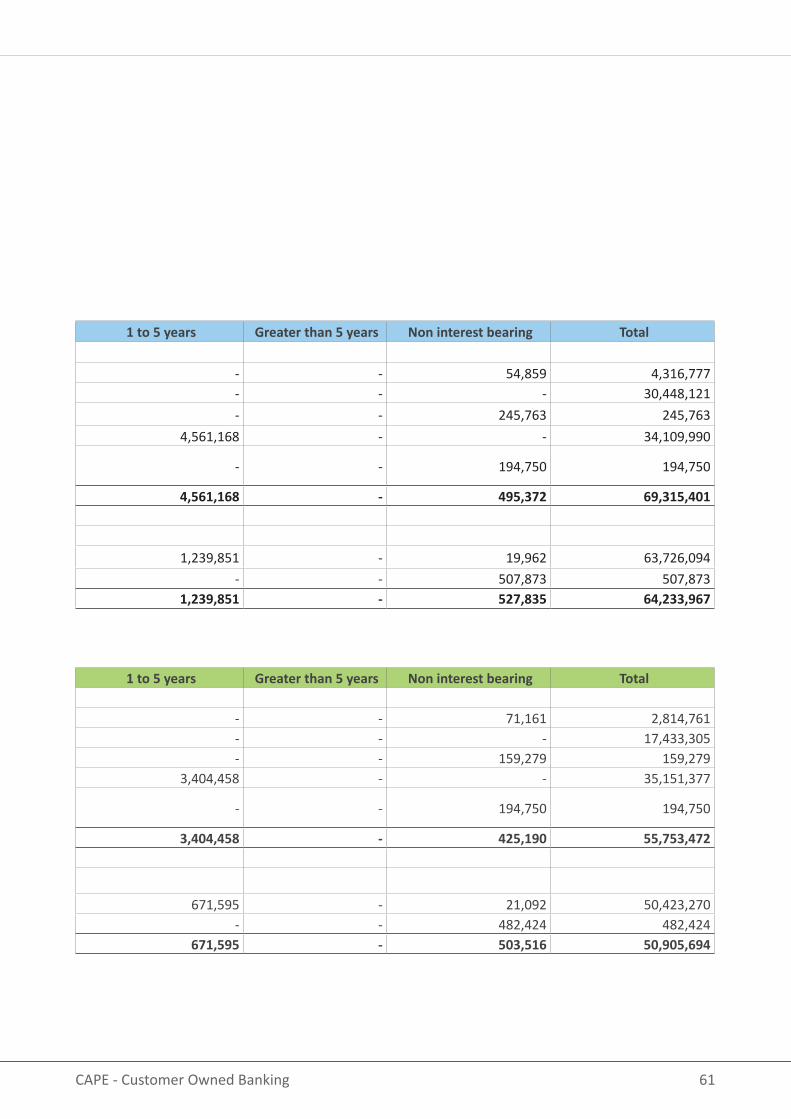
61CAPE - Customer Owned Banking
2015Avg rate Within 1 month 1 to 3 months 3 to 12 months 1 to 5 years Greater than 5 years Non interest bearing Total
ASSETSCash 1.67 4,261,918 - - - - 54,859 4,316,777Receivables from FI’s 2.96 5,488,401 14,982,868 9,976,853 - - - 30,448,121Receivables - - - - - 245,763 245,763Loans to members 5.15 28,525,803 - 1,023,019 4,561,168 - - 34,109,990Available for sale investments
- - - - - 194,750 194,750
Total Financial Assets 38,276,122 14,982,868 10,999,872 4,561,168 - 495,372 69,315,401
LIABILITIESDeposits from members 2.01 34,660,877 11,847,558 15,957,846 1,239,851 - 19,962 63,726,094Creditors - - - - - 507,873 507,873Total Financial Liabilities 34,660,877 11,847,558 15,957,846 1,239,851 - 527,835 64,233,967
2014Avg rate Within 1 month 1 to 3 months 3 to 12 months 1 to 5 years Greater than 5 years Non interest bearing Total
ASSETSCash 2.35 2,743,600 - - - - 71,161 2,814,761Receivables from FI’s 3.49 2,500,000 7,490,708 7,442,597 - - - 17,433,305Receivables - - - - - 159,279 159,279Loans to members 6.00 30,483,704 - 1,263,215 3,404,458 - - 35,151,377Available for sale investments
- - - - - - 194,750 194,750
Total Financial Assets 35,727,304 7,490,708 8,705,812 3,404,458 - 425,190 55,753,472
LIABILITIESDeposits from members 2.34 27,044,534 10,236,963 12,449,086 671,595 - 21,092 50,423,270Creditors - - - - - 482,424 482,424Total Financial Liabilities 27,044,534 10,236,963 12,449,086 671,595 - 503,516 50,905,694
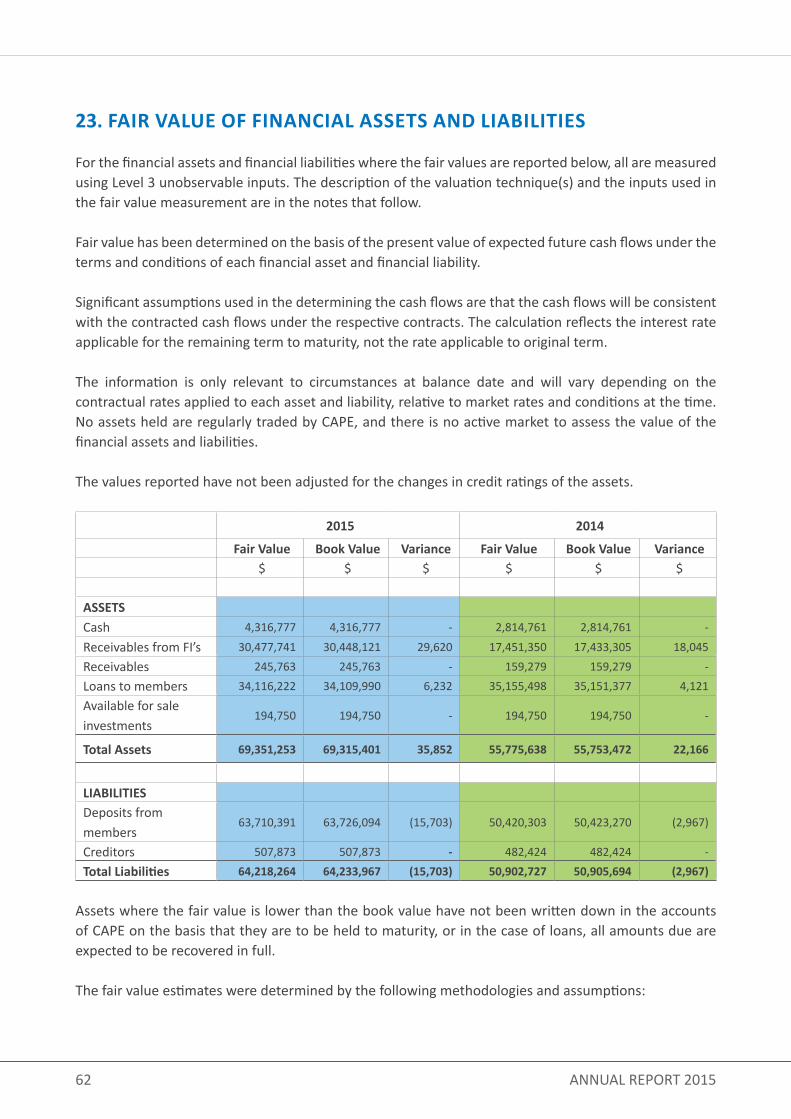
62 ANNUAL REPORT 2015
23. FAIR VALUE OF FINANCIAL ASSETS AND LIABILITIES
For the financial assets and financial liabilities where the fair values are reported below, all are measured using Level 3 unobservable inputs. The description of the valuation technique(s) and the inputs used in the fair value measurement are in the notes that follow.
Fair value has been determined on the basis of the present value of expected future cash flows under the terms and conditions of each financial asset and financial liability.
Significant assumptions used in the determining the cash flows are that the cash flows will be consistent with the contracted cash flows under the respective contracts. The calculation reflects the interest rate applicable for the remaining term to maturity, not the rate applicable to original term.
The information is only relevant to circumstances at balance date and will vary depending on the contractual rates applied to each asset and liability, relative to market rates and conditions at the time. No assets held are regularly traded by CAPE, and there is no active market to assess the value of the financial assets and liabilities.
The values reported have not been adjusted for the changes in credit ratings of the assets.
2015 2014
Fair Value Book Value Variance Fair Value Book Value Variance $ $ $ $ $ $
ASSETS Cash 4,316,777 4,316,777 - 2,814,761 2,814,761 -
Receivables from FI’s 30,477,741 30,448,121 29,620 17,451,350 17,433,305 18,045
Receivables 245,763 245,763 - 159,279 159,279 -
Loans to members 34,116,222 34,109,990 6,232 35,155,498 35,151,377 4,121
Available for sale investments
194,750 194,750 - 194,750 194,750 -
Total Assets 69,351,253 69,315,401 35,852 55,775,638 55,753,472 22,166
LIABILITIESDeposits from members
63,710,391 63,726,094 (15,703) 50,420,303 50,423,270 (2,967)
Creditors 507,873 507,873 - 482,424 482,424 -
Total Liabilities 64,218,264 64,233,967 (15,703) 50,902,727 50,905,694 (2,967)
Assets where the fair value is lower than the book value have not been written down in the accounts of CAPE on the basis that they are to be held to maturity, or in the case of loans, all amounts due are expected to be recovered in full.
The fair value estimates were determined by the following methodologies and assumptions:
63CAPE - Customer Owned Banking
LIQUID ASSETS AND RECEIVABLES FROM OTHER FINANCIAL INSTITUTIONS
The carrying values of cash and liquid assets and receivables due from other financial institutions redeemable within 12 months approximate their fair value as they are short term in nature or are receivable on demand. The fair value of receivables due from other financial institutions over 12 months is determined by direct reference to published quotes in an active market.
LOANS AND ADVANCES
The carrying value of loans and advances are net of unearned income and both general and specific provisions for doubtful debts.
For variable rate loans, (excluding impaired loans) the amount shown in the Statement Of Financial Position is considered to be a reasonable estimate of fair value. The fair value for fixed rate loans is calculated by utilising discounted cash flow models (i.e. the net present value of the portfolio future principal and interest cash flows), based on the period to maturity of the loans. The discount rates applied were based on the current applicable rate offered for the average remaining term of the portfolio.
The fair value of impaired loans was calculated by discounting expected cash flows using a rate which includes a premium for the uncertainty of the flows.
DEPOSITS FROM MEMBERS
The fair value of call and variable rate deposits, and fixed rate deposits repricing within 12 months, is the amount shown in the Statement Of Financial Position. Discounted cash flows were used to calculate the fair value of other term deposits, based upon the deposit type and the rate applicable to its related period maturity.
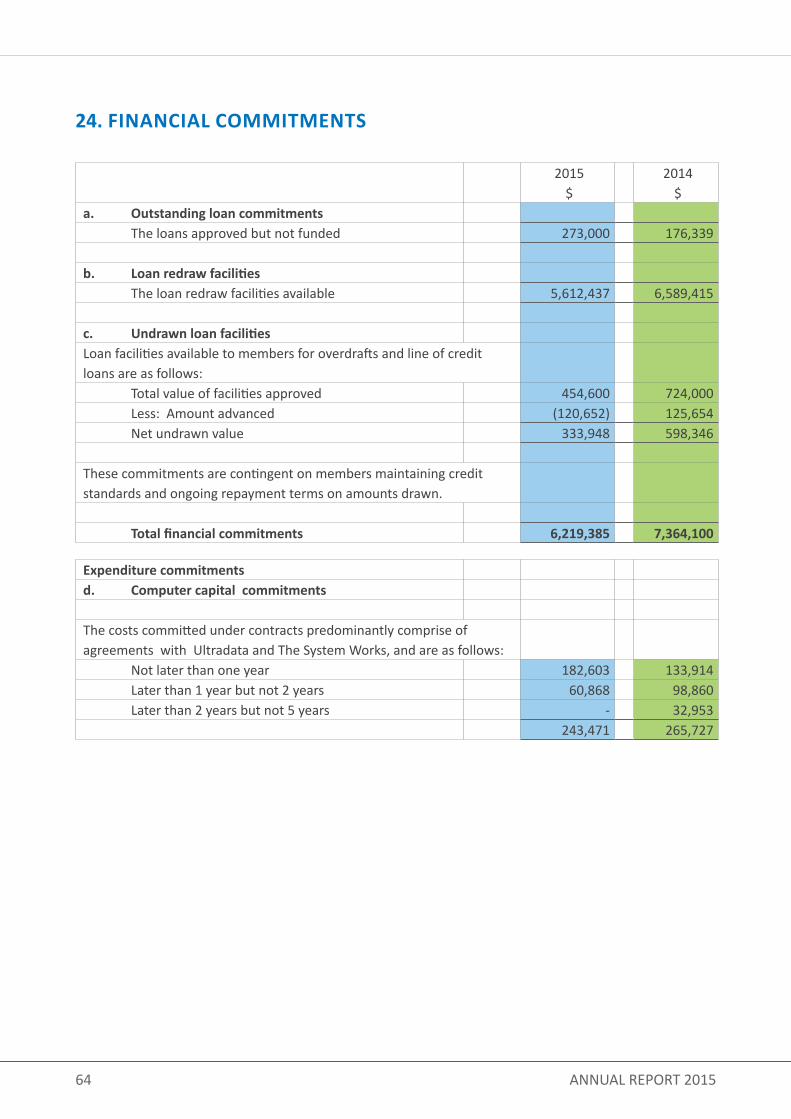
64 ANNUAL REPORT 2015
2015$
2014$
a. Outstanding loan commitments The loans approved but not funded 273,000 176,339
b. Loan redraw facilities The loan redraw facilities available 5,612,437 6,589,415
c. Undrawn loan facilitiesLoan facilities available to members for overdrafts and line of credit loans are as follows: Total value of facilities approved 454,600 724,000 Less: Amount advanced (120,652) 125,654 Net undrawn value 333,948 598,346
These commitments are contingent on members maintaining credit standards and ongoing repayment terms on amounts drawn.
Total financial commitments 6,219,385 7,364,100
Expenditure commitments d. Computer capital commitments The costs committed under contracts predominantly comprise of agreements with Ultradata and The System Works, and are as follows: Not later than one year 182,603 133,914 Later than 1 year but not 2 years 60,868 98,860 Later than 2 years but not 5 years - 32,953
243,471 265,727
24. FINANCIAL COMMITMENTS
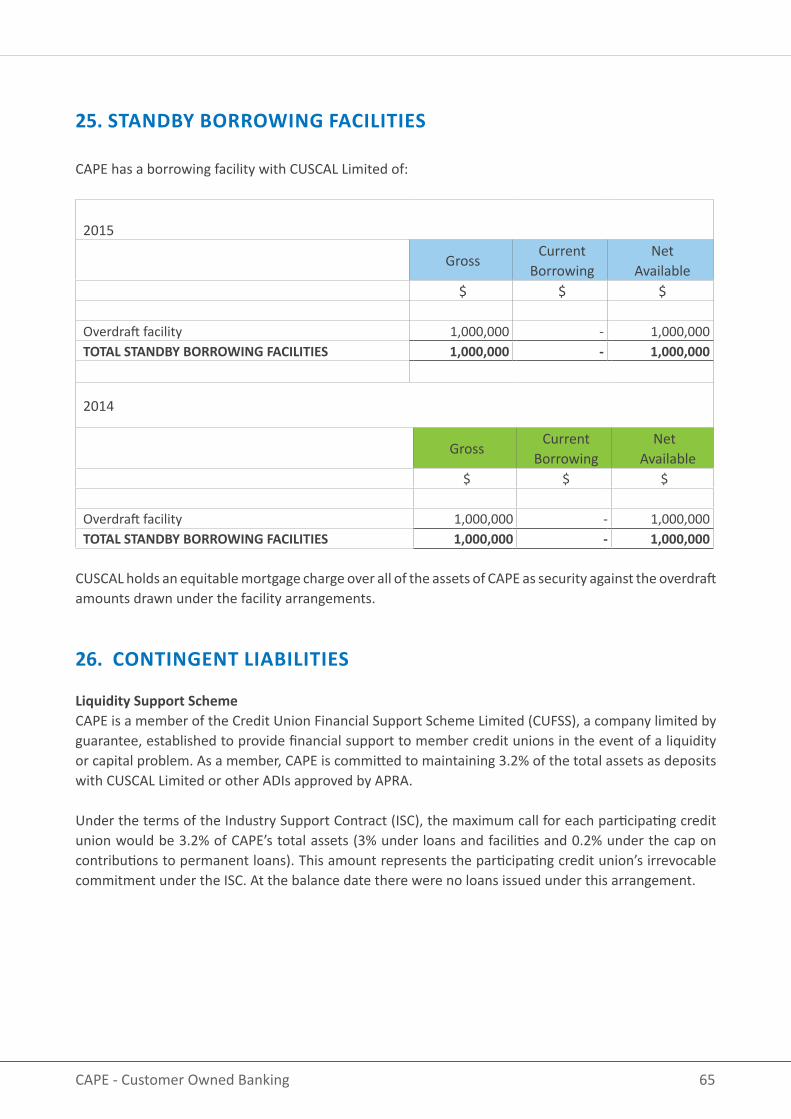
65CAPE - Customer Owned Banking
25. STANDBY BORROWING FACILITIES
CAPE has a borrowing facility with CUSCAL Limited of:
2015
GrossCurrent
BorrowingNet
Available$ $ $
Overdraft facility 1,000,000 - 1,000,000TOTAL STANDBY BORROWING FACILITIES 1,000,000 - 1,000,000
2014
GrossCurrent
BorrowingNet
Available $ $ $
Overdraft facility 1,000,000 - 1,000,000TOTAL STANDBY BORROWING FACILITIES 1,000,000 - 1,000,000
CUSCAL holds an equitable mortgage charge over all of the assets of CAPE as security against the overdraft amounts drawn under the facility arrangements.
26. CONTINGENT LIABILITIES
Liquidity Support SchemeCAPE is a member of the Credit Union Financial Support Scheme Limited (CUFSS), a company limited by guarantee, established to provide financial support to member credit unions in the event of a liquidity or capital problem. As a member, CAPE is committed to maintaining 3.2% of the total assets as deposits with CUSCAL Limited or other ADIs approved by APRA.
Under the terms of the Industry Support Contract (ISC), the maximum call for each participating credit union would be 3.2% of CAPE’s total assets (3% under loans and facilities and 0.2% under the cap on contributions to permanent loans). This amount represents the participating credit union’s irrevocable commitment under the ISC. At the balance date there were no loans issued under this arrangement.
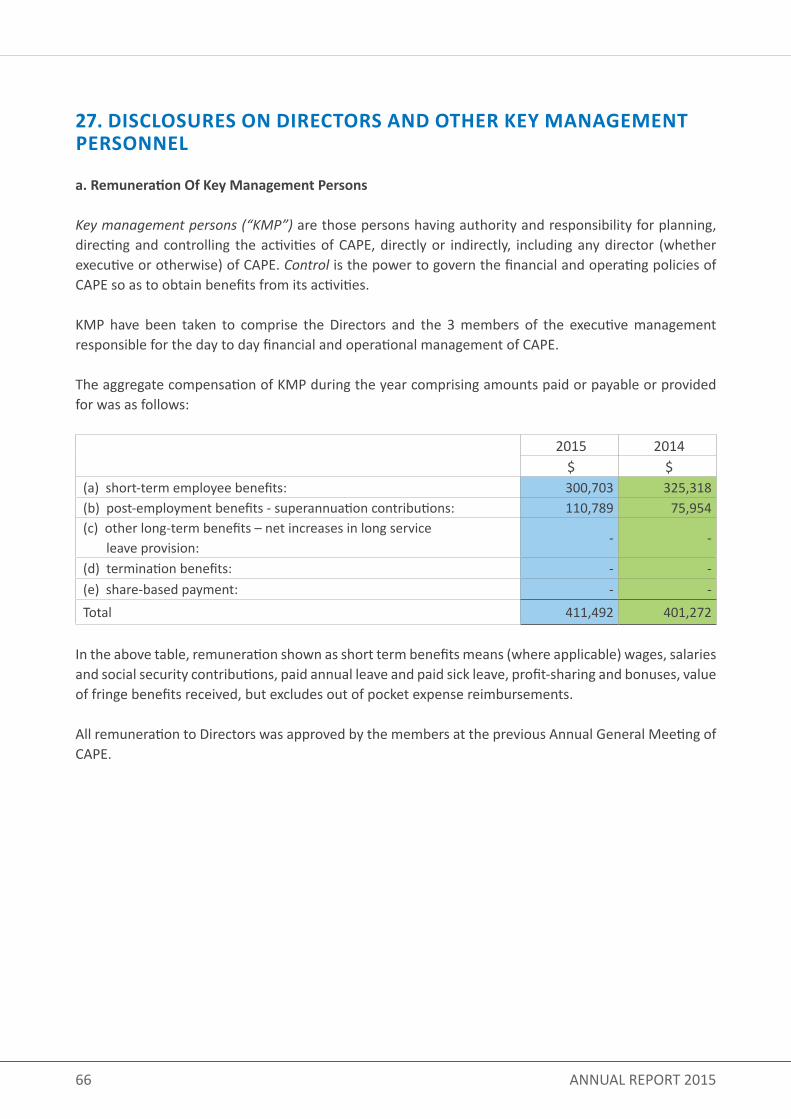
66 ANNUAL REPORT 2015
27. DISCLOSURES ON DIRECTORS AND OTHER KEY MANAGEMENT PERSONNEL
a. Remuneration Of Key Management Persons
Key management persons (“KMP”) are those persons having authority and responsibility for planning, directing and controlling the activities of CAPE, directly or indirectly, including any director (whether executive or otherwise) of CAPE. Control is the power to govern the financial and operating policies of CAPE so as to obtain benefits from its activities.
KMP have been taken to comprise the Directors and the 3 members of the executive management responsible for the day to day financial and operational management of CAPE.
The aggregate compensation of KMP during the year comprising amounts paid or payable or provided for was as follows:
2015 2014$ $
(a) short-term employee benefits: 300,703 325,318(b) post-employment benefits - superannuation contributions: 110,789 75,954(c) other long-term benefits – net increases in long service leave provision:
- -
(d) termination benefits: - -(e) share-based payment: - -Total 411,492 401,272
In the above table, remuneration shown as short term benefits means (where applicable) wages, salaries and social security contributions, paid annual leave and paid sick leave, profit-sharing and bonuses, value of fringe benefits received, but excludes out of pocket expense reimbursements.
All remuneration to Directors was approved by the members at the previous Annual General Meeting of CAPE.
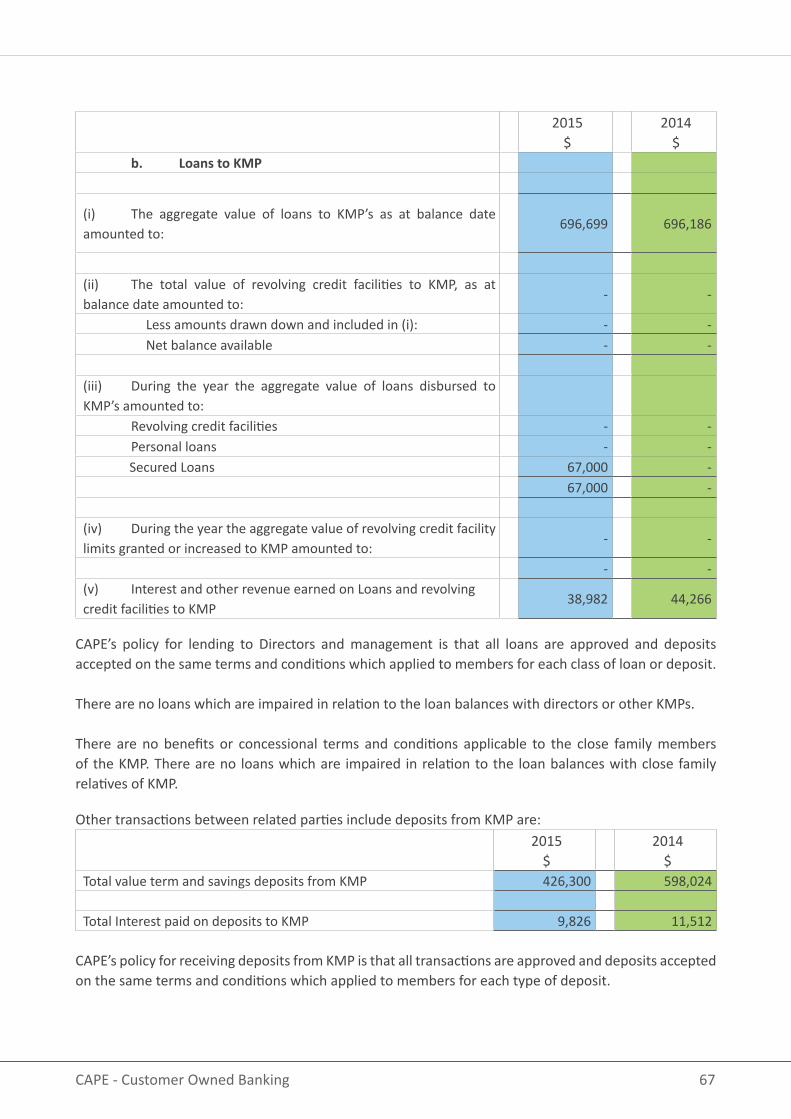
67CAPE - Customer Owned Banking
2015$
2014$
b. Loans to KMP
(i) The aggregate value of loans to KMP’s as at balance date amounted to:
696,699
696,186
(ii) The total value of revolving credit facilities to KMP, as at balance date amounted to:
- -
Less amounts drawn down and included in (i): - - Net balance available - -
(iii) During the year the aggregate value of loans disbursed to KMP’s amounted to: Revolving credit facilities - - Personal loans - - Secured Loans 67,000 -
67,000 -
(iv) During the year the aggregate value of revolving credit facility limits granted or increased to KMP amounted to:
- -
- -(v) Interest and other revenue earned on Loans and revolving credit facilities to KMP
38,982 44,266
CAPE’s policy for lending to Directors and management is that all loans are approved and deposits accepted on the same terms and conditions which applied to members for each class of loan or deposit.
There are no loans which are impaired in relation to the loan balances with directors or other KMPs.
There are no benefits or concessional terms and conditions applicable to the close family members of the KMP. There are no loans which are impaired in relation to the loan balances with close family relatives of KMP.
Other transactions between related parties include deposits from KMP are: 2015
$2014
$Total value term and savings deposits from KMP 426,300 598,024
Total Interest paid on deposits to KMP 9,826 11,512
CAPE’s policy for receiving deposits from KMP is that all transactions are approved and deposits accepted on the same terms and conditions which applied to members for each type of deposit.
68 ANNUAL REPORT 2015
c. Transactions with Other Related PartiesOther transactions between related parties include deposits from director related entities or close family members of KMP.
CAPE’s policy for receiving deposits from related parties is that all transactions are approved and deposits accepted on the same terms and conditions which applied to members for each type of deposit.
There are no benefits paid or payable to the close family members of the KMP.
There are no service contracts to which KMP or their close family members are an interested party.
28. OUTSOURCING ARRANGEMENTS
CAPE has an arrangement with other organisations to facilitate the supply of services to members.
a. CUSCAL Limited CUSCAL is an Approved Deposit Taking Institution registered under the Corporations Act 2001 and the Banking Act. CAPE has equity in this organisation. This organisation:
(i) provides the license rights to Visa Card in Australia and settlement of other institutions for ATM, Visa card and cheque transactions, direct entry transactions, as well as the production of Visa and Redicards for use by members;
(ii) provides treasury and money market facilities to CAPE. CAPE invests a part of its liquid assets with CUSCAL to maximise return on funds, and to comply with the Liquidity Support Scheme requirements;
(iii) This organisation operates the computer network used to link Redicards and Visa cards operated through RediATMs and other approved ATM suppliers to CAPE’s EDP Systems.
b. Ultradata Australia Pty LimitedProvides and maintains the application software utilised by CAPE.
c. The System Works Pty LimitedThis company operates the principal computer facility on behalf of CAPE in conjunction with other credit unions. CAPE has a management contract with the company to supply computer support staff and services to meet the day to day needs of CAPE and compliance with the relevant Prudential Standards.
27. DISCLOSURES ON DIRECTORS AND OTHER KEY MANAGEMENT PERSONNEL continued
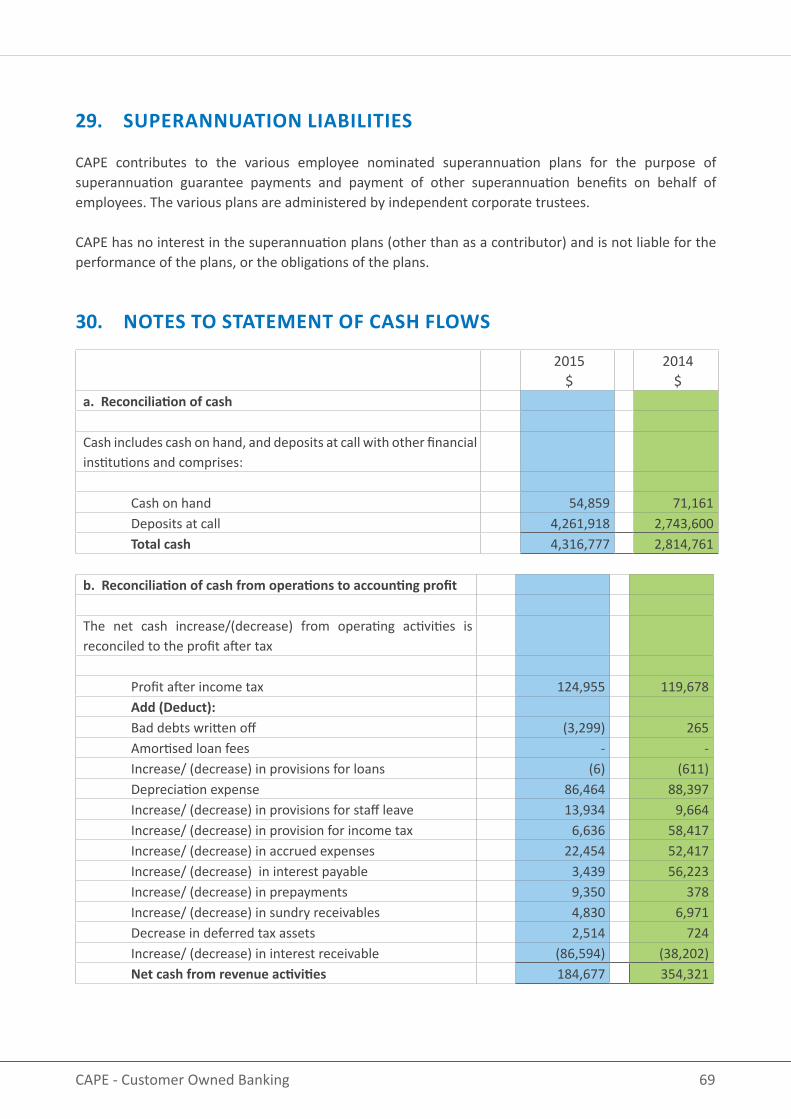
69CAPE - Customer Owned Banking
29. SUPERANNUATION LIABILITIES
CAPE contributes to the various employee nominated superannuation plans for the purpose of superannuation guarantee payments and payment of other superannuation benefits on behalf of employees. The various plans are administered by independent corporate trustees.
CAPE has no interest in the superannuation plans (other than as a contributor) and is not liable for the performance of the plans, or the obligations of the plans.
30. NOTES TO STATEMENT OF CASH FLOWS
2015$
2014$
a. Reconciliation of cash
Cash includes cash on hand, and deposits at call with other financial institutions and comprises:
Cash on hand 54,859 71,161 Deposits at call 4,261,918 2,743,600 Total cash 4,316,777 2,814,761
b. Reconciliation of cash from operations to accounting profit
The net cash increase/(decrease) from operating activities is reconciled to the profit after tax
Profit after income tax 124,955 119,678 Add (Deduct): Bad debts written off (3,299) 265 Amortised loan fees - - Increase/ (decrease) in provisions for loans (6) (611) Depreciation expense 86,464 88,397 Increase/ (decrease) in provisions for staff leave 13,934 9,664 Increase/ (decrease) in provision for income tax 6,636 58,417 Increase/ (decrease) in accrued expenses 22,454 52,417 Increase/ (decrease) in interest payable 3,439 56,223 Increase/ (decrease) in prepayments 9,350 378 Increase/ (decrease) in sundry receivables 4,830 6,971 Decrease in deferred tax assets 2,514 724 Increase/ (decrease) in interest receivable (86,594) (38,202) Net cash from revenue activities 184,677 354,321
70 ANNUAL REPORT 2015
31. CORPORATE INFORMATION
CAPE is a company limited by shares, and is registered under the Corporations Act 2001.
The address of the registered office and principal place of address is Suite 109, 28-32 The Kingsway, Cronulla, NSW 2230.
The nature of the operations and its principal activities are the provision of deposit taking facilities and loan facilities to the members of CAPE.
32. POST BALANCE SHEET EVENTS
There were no other subsequent events to the year end that require disclosure other than those matters referred to elsewhere in this report.
2015$
2014$
Add (Deduct) non revenue operations: Decrease/(increase) in member loans 1,044,692 (461,278) Increase/(decrease) in member deposits 13,304,085 2,030,123 (Increase)/decrease in deposits to financial institutions (13,014,816) (1,472,827) Net Cash from operating activities 1,518,638 450,339
Celebrating 46 years of looking after
our Customers’ savings!
ANNUAL GENERAL MEETING
Notice is hereby given that the 46th Annual General Meeting of CAPE Credit Union Limited (ABN 78 087 649 929) will be held on Wednesday, 25 November 2015 at Hazelhurst Regional Gallery and Art Centre, 782 Kingsway Gymea, commencing at 5.30pm.
Directors * Bill Rankine (Chairman) John McNally Gordon Goodacre Robert Norris Cecil Riley Rebecca Murray Jeanette Brooks
Chief Executive Officer * Executive Management*Greg Spencer Richard Nowakowski (Chief Risk Officer & Secretary) Kerrie Goddard – Manager Finance & Accounting
Staff - NSW * Staff - Lytton Refinery, QLD * Fiona Boylan Karen Williams Julie Fisher Karen Foster-McLean Megan Baratta Fiona Lawson
Auditor - External Auditor - InternalGrant Thornton Audit Pty Ltd Step Ahead Business Solutions - John Cottee
Bankers Solicitors Cuscal Limited with National Australia Bank Kathryn O’Sullivan
* Credit Union Directors / staff current at 30 June 2015
CAPE CREDIT UNION LIMITED
A.C.N. 087 649 929AFSL: 225336
Incorporated in Australia
Registered Office:Suite 109
28-32 The KingswayCronulla NSW 2230
Ph: 1300 330 056www.capecu.com.au