Embed Size (px)
Citation preview
Robertson, A.H.F., Emeis, K.-C., Richter, C., and Camerlenghi, A. (Eds.), 1998Proceedings of the Ocean Drilling Program, Scientific Results, Vol. 160
47. SOME CLUES ABOUT THE NAPOLI AND MILANO MUD VOLCANOES FROM AN INTEGRATED LOG-CORE APPROACH1
María José Jurado-Rodríguez2 and Francisca Martínez-Ruiz3
ABSTRACT
A full set of conventional logging data and Formation MicroScanner (FMS) data were acquired on the flanks of the Milanomud volcano and the Napoli mud volcano on the Mediterranean Ridge, and provide a complete and continuous record of thepetrophysical and geological features of these structures. On the basis of the logging data, and of mineralogical and geochemi-cal sample analyses, the composition, sedimentation, and internal sedimentary and structural features of the mud volcanoeswere studied. Conventional logging data indicate composition and/or texture-related variations and indicate different sedimen-tation episodes. These changes are also recognizable on FMS images. Layered intervals are identified at different depths withinboth mud volcanoes. Most features that are recognized, possible bedding surfaces, dip to the west to northwest in the Milanomud volcano and to the north-northwest and north-northeast in the Napoli mud volcano. The dip of the beds is consistent withgravitational deposition and the present-day morphology of the Napoli mud volcano. The dip and strike of inferred bedding fea-tures at the Milano mud volcano suggest either the existence of a depositional slope and a source of gravitational flows to theeast, or tilting of the bedding surfaces by subsidence after deposition. Steeply dipping planes (>45°) that dip north-northwest atNapoli are likely to represent fractures. These features are recognized as electrically resistive features indicating that they arefilled with a nonconductive material, possibly either halite or gas. The results of core sample analysis indicate that diageneticmineralogical transformations have not affected the mud volcano material, that the clay minerals are of detrital origin, and thatFe-Al-rich smectites are predominant.
INTRODUCTION
The Mediterranean Ridge mud volcanoes occur within the accre-tionary prism associated with ongoing subduction between the Afri-can and the Eurasian plates. This geological setting is characterizedby thrusting and folding (Cita et al., 1996). Mud volcanism in theMediterranean Ridge has been intensively studied in recent years (Ci-ta et al., 1981; Cita and Camerlenghi, 1992; Limonov et al., 1994).Drilling >200 m into the Milano (conical) and Napoli (flat) structureswas a major scientific achievement of Ocean Drilling Program(ODP) Leg 160. Successful drilling, coring, and logging wereachieved at the Milano mud volcano (Site 970) and the active Napolimud volcano (Site 971; Fig. 1; Emeis, Robertson, Richter, et al.,1996; Robertson et al., 1996). The surficial material extruded at theMilano and Napoli mud volcanoes, mainly a mud breccia with lithicclasts of centimetric size, was the main component recovered bydrilling (Emeis, Robertson, Richter, et al., 1996; Robertson et al.,1996). At Site 970, layers of pelagic host sediments were also recov-ered (Emeis, Robertson, Richter, et al., 1996) and were interbeddedwith mud breccia. The layering indicates that the structure is a mudvolcano, rather than a diapir (Emeis, Robertson, Richter, et al., 1996).
Holes were drilled at a depth of about 2000 m on the crestal areasand across the flanks of the mud volcanoes and onto adjacent deep-sea sediments. One hole in the flank of each structure at each of the
1Robertson, A.H.F., Emeis, K.-C., Richter, C., and Camerlenghi, A. (Eds.), 1998.Proc. ODP, Sci. Results, 160: College Station, TX (Ocean Drilling Program).
2Geophysikalisches Institut, Universität Fridericiana Karlsruhe, Hertzstrasse 76187 Karlsruhe, Federal Republic of Germany. Now at Instituto de Ciencias dTierra, Lluis Solé Sabarís s/n, 08028 Barcelona, Spain. [email protected]
3Instituto de Ciencias de la Tierra CSIC–Universidad de Granada, Spain.
two sites was geophysically logged (Holes 970A and 971B). Loggingdata constitute the most continuous record of the sedimentation at theNapoli and Milano mud volcanoes. Core recovery was poor (25.1%in Hole 970A and 31.5% in Hole 971B).
The first results of Leg 160 (Robertson et al., 1996) shed light onmany of the aspects of the history and evolution of the mud struc-tures. The Milano mud volcano is at least 1.75 m.y. old and is nowdormant. The Napoli mud volcano began before (or during) 1.5−1.2Ma and is currently active. The age and character of the clasts areconsistent with derivation from a relatively shallow underlying suc-cession that includes Miocene sediments, although vitrinite reflec-tance data from organic matter indicate ranges of depth of mobiliza-tion from 4900 to 7500 m (Schulz et al. 1997). Pore fluids indicatethe presence of halite of presumed latest Miocene age beneath thevolcanoes. Hydrocarbon gas is venting from the crest of the Milanomud volcano. Methane hydrates (clathrates) are also inferred to existbeneath the crest of the Milano mud volcano (De Lange and Brum-sack, Chapter 44, this volume).
Other hypotheses were also formulated based on the Leg 160 re-sults. It was suggested that the extruding Miocene sediments clastscould have come either from the downgoing slab or from the overly-ing forearc basin, and that the higher hydrocarbons could haveflowed laterally from great depths within the accretionary wedge(Robertson et al., 1996).
Some questions still remain and require more detailed work. Theobjective here is to provide a more complete picture of the mud vol-canoes from a multidisciplinary approach, combining the analysis ofconventional and Formation MicroScanner (FMS) log data, and min-eralogical and geochemical analyses.
The main focus is the deeper parts of the mud structures, notreached by shallow coring, but satisfactorily recorded by logging
16,e la
607
M.J. JURADO-RODRÍGUEZ, F. MARTÍNEZ-RUIZ
966965967
968
969
970
963
974
973
972
IONIANBASIN
Mediterranean Ridge
Levantine Basin
EratosthenesSeamount
Europe
Asia
Africa
42 N
38
34
3012 E 20 28 36
Mediterranean Ridge971
Crete Cyprus
Sicily
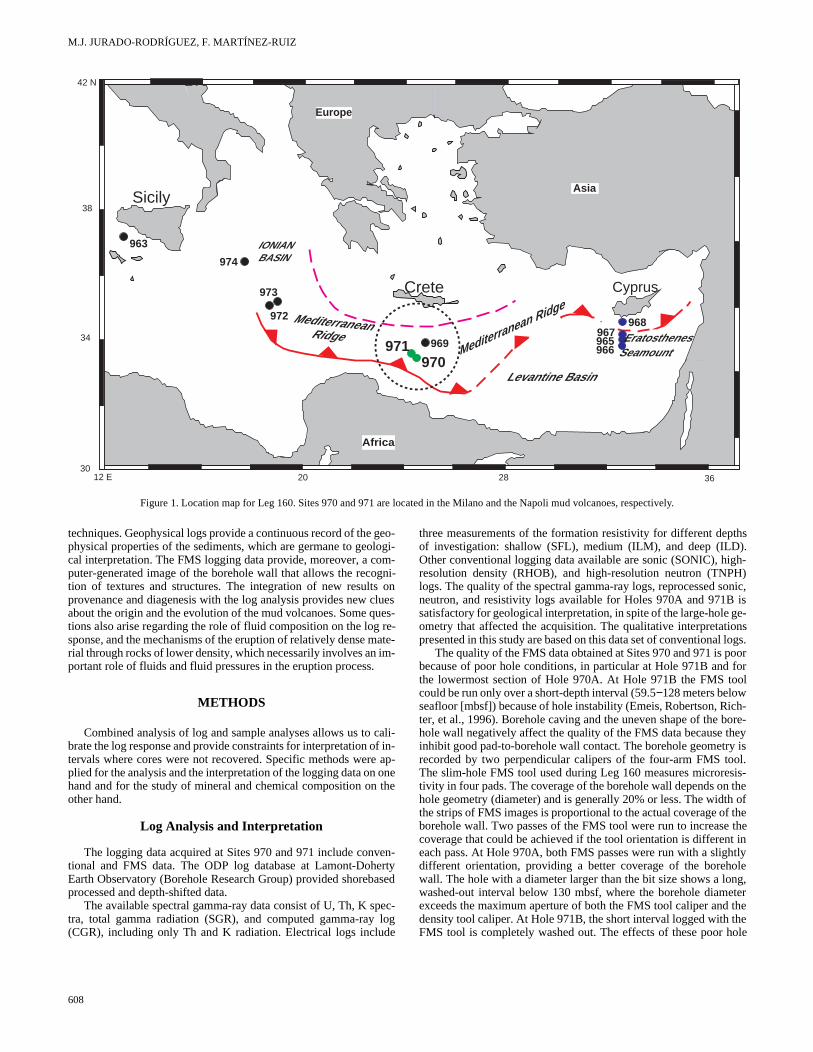
Figure 1. Location map for Leg 160. Sites 970 and 971 are located in the Milano and the Napoli mud volcanoes, respectively.
techniques. Geophysical logs provide a continuous record of the geo-physical properties of the sediments, which are germane to geologi-cal interpretation. The FMS logging data provide, moreover, a com-puter-generated image of the borehole wall that allows the recogni-tion of textures and structures. The integration of new results onprovenance and diagenesis with the log analysis provides new cluesabout the origin and the evolution of the mud volcanoes. Some ques-tions also arise regarding the role of fluid composition on the log re-sponse, and the mechanisms of the eruption of relatively dense mate-rial through rocks of lower density, which necessarily involves an im-portant role of fluids and fluid pressures in the eruption process.
METHODS
Combined analysis of log and sample analyses allows us to cali-brate the log response and provide constraints for interpretation of in-tervals where cores were not recovered. Specific methods were ap-plied for the analysis and the interpretation of the logging data on onehand and for the study of mineral and chemical composition on theother hand.
Log Analysis and Interpretation
The logging data acquired at Sites 970 and 971 include conven-tional and FMS data. The ODP log database at Lamont-DohertyEarth Observatory (Borehole Research Group) provided shorebasedprocessed and depth-shifted data.
The available spectral gamma-ray data consist of U, Th, K spec-tra, total gamma radiation (SGR), and computed gamma-ray log(CGR), including only Th and K radiation. Electrical logs include
608
three measurements of the formation resistivity for different depthsof investigation: shallow (SFL), medium (ILM), and deep (ILD).Other conventional logging data available are sonic (SONIC), high-resolution density (RHOB), and high-resolution neutron (TNPH)logs. The quality of the spectral gamma-ray logs, reprocessed sonic,neutron, and resistivity logs available for Holes 970A and 971B issatisfactory for geological interpretation, in spite of the large-hole ge-ometry that affected the acquisition. The qualitative interpretationspresented in this study are based on this data set of conventional logs.
The quality of the FMS data obtained at Sites 970 and 971 is poorbecause of poor hole conditions, in particular at Hole 971B and forthe lowermost section of Hole 970A. At Hole 971B the FMS toolcould be run only over a short-depth interval (59.5−128 meters belowseafloor [mbsf]) because of hole instability (Emeis, Robertson, Rich-ter, et al., 1996). Borehole caving and the uneven shape of the bore-hole wall negatively affect the quality of the FMS data because theyinhibit good pad-to-borehole wall contact. The borehole geometry isrecorded by two perpendicular calipers of the four-arm FMS tool.The slim-hole FMS tool used during Leg 160 measures microresis-tivity in four pads. The coverage of the borehole wall depends on thehole geometry (diameter) and is generally 20% or less. The width ofthe strips of FMS images is proportional to the actual coverage of theborehole wall. Two passes of the FMS tool were run to increase thecoverage that could be achieved if the tool orientation is different ineach pass. At Hole 970A, both FMS passes were run with a slightlydifferent orientation, providing a better coverage of the boreholewall. The hole with a diameter larger than the bit size shows a long,washed-out interval below 130 mbsf, where the borehole diameterexceeds the maximum aperture of both the FMS tool caliper and thedensity tool caliper. At Hole 971B, the short interval logged with theFMS tool is completely washed out. The effects of these poor hole
INTEGRATED LOG-CORE APPROACH
tri-eda-l-h
cu-ol-,c--a
edralm-talÅ,in-an-
repsn)y-
conditions on the images are easily recognizable by poor-quality andlow-definition images. In spite of the overall poor pad contact, pro-cessing of the data has allowed us to enhance the features recorded bythe FMS tool.
All procedures, from the acquisition of electrical microresistivityusing the FMS tool to the interpretation of the images, were done ac-cording to standard processing methods (Ekstrom et al., 1987;Bourke, 1989; Harker et al., 1990; Rider, 1996). Processing of theFMS data, including static and dynamic normalization, was per-formed to obtain enhanced images. The static normalization providedan image in which the actual contrast in resistivities is preservedthroughout the interval chosen (in this study, the complete hole run).The dynamic normalization processing provided better contrast be-tween the features recorded by the FMS microresistivity sensors;however, the resistivity and the color image are not representative ofthe actual resistivity contrast. Both processed images have been usedin the interpretation; the figures included in this study correspond tostatic normalized FMS images. The interpretation was also per-formed on both pass 1 and pass 2 of each hole to allow better cover-age of the borehole wall.
The main objectives of the FMS interpretation were the observa-tion of sedimentary textures and structures and the measurement ofdip and azimuth of planar features. Horizontal features appear flat onthe FMS images, whereas dipping events appear as sine waves. Theamplitude of the sine wave gives the dip of the plane, and the dip az-imuth is calculated at the low point of the wave. The FMS files con-tain the information necessary to calculate the orientation of the fea-tures interpreted. Fitting of the sine waves was achieved interactivelyusing a workstation. More details on the FMS processing and inter-pretation procedures can be found in Jurado and Brudy (Chapter 41,this volume).
Sample AnalysesX-ray Diffraction
Samples were dried at room temperature and ground in an agatemortar to <2 mm in size. A homogeneous, representative part was
ground to <0.0053 mm and this was used for the mineralogical study(bulk mineralogy). Samples were packed in Al sample holders for X-ray diffraction (XRD). Another portion was used for clay mineralstudies after the carbonate fraction was removed by acetic acid, start-ing the reaction at a very low acid concentration (0.1 N), and increas-ing this concentration up to 1 N. The <2 µm was separated by cenfuging at 9000 rpm during 1.5 min. The clay fraction was smearonto glass slides for XRD. Separation of the clay fraction and prepration of the samples for diffractometric studies were performed folowing the international recommendations compiled by Kisc(1991). XRD diffractograms were performed using a Phillips PW1710 diffractometer with Cu-Kα radiation and automatic silt. Scanswere run from 2° to 64° 2θ for bulk sample diffractograms and claypreparation without any treatment, and from 2° to 30° 2θ for glyco-lated and heated clay mineral samples. The reflecting factors callated for this equipment and its instrumental conditions were the flowing: (1) for powder diffractograms: phyllosilicates, 0.09; quartz1.43; calcite, 1.05; feldspar, 1.03; and (2) for oriented sample diffratograms: illite, 0.36; chlorite, kaolinite, 0.98; mixed-layer illite/smectite, 0.65. Diffractograms were visually interpreted with the help of computerized search.
Semiquantitative analyses were performed utilizing the integratpeak area with the aid of a computer program. The clay mineamount was estimated on the diffractograms of the glycolated saples. The 10-Å peak was used for illite. The 7-Å peak gives the toamount of chlorite + kaolinite, using the peaks at 3.54 Å and 3.58 respectively, to differentiate and identify the presence of these merals. The 17-Å peak was used for smectites. The estimate semiqutitative analysis error for bulk mineralogy absolute values is ±5%, forclay mineral amount, ranging from 5% to 10%.
Transmission Electron Microscopy
Quantitative geochemical microanalyses of the smectites weobtained by transmission electron microscopy (TEM) using a PhilliCM-20 (Instrumental Services of the University of Granada, Spaiequipped with an EDAX microanalysis system. Quantitative anal
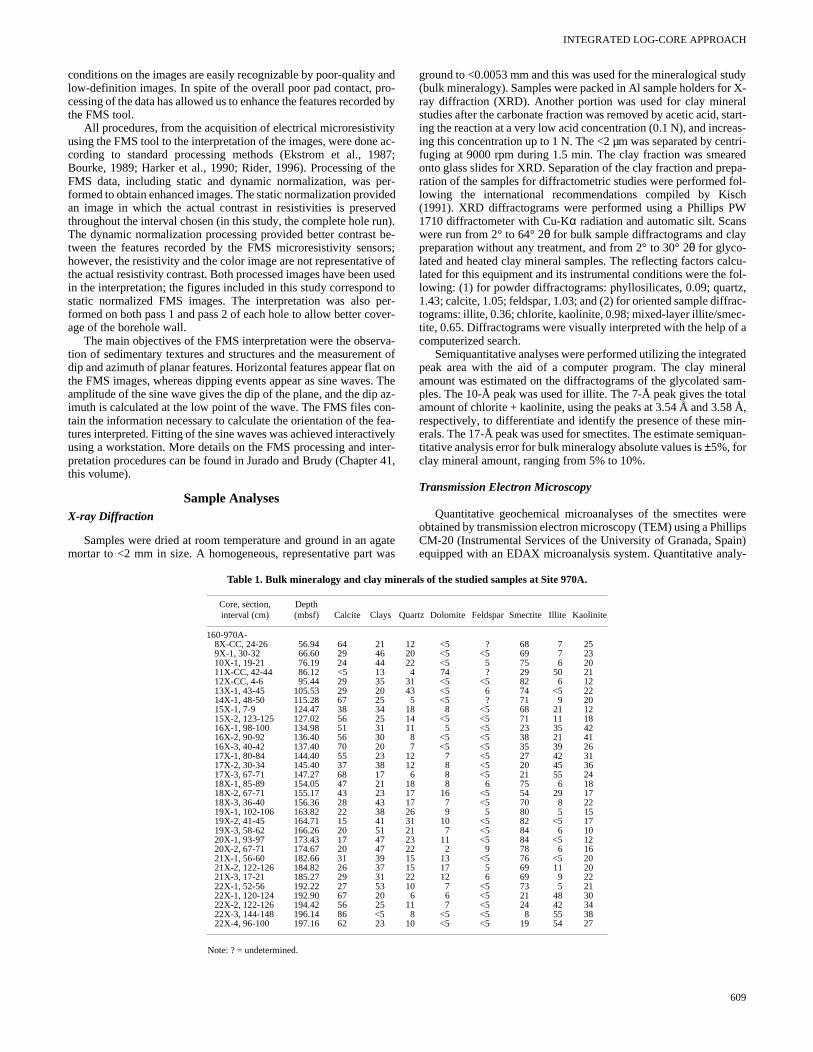
Table 1. Bulk mineralogy and clay minerals of the studied samples at Site 970A.
Note: ? = undetermined.
Core, section, interval (cm)
Depth (mbsf) Calcite Clays Quartz Dolomite Feldspar Smectite Illite Kaolinite
160-970A-8X-CC, 24-26 56.94 64 21 12 <5 ? 68 7 259X-1, 30-32 66.60 29 46 20 <5 <5 69 7 2310X-1, 19-21 76.19 24 44 22 <5 5 75 6 2011X-CC, 42-44 86.12 <5 13 4 74 ? 29 50 2112X-CC, 4-6 95.44 29 35 31 <5 <5 82 6 1213X-1, 43-45 105.53 29 20 43 <5 6 74 <5 2214X-1, 48-50 115.28 67 25 5 <5 ? 71 9 2015X-1, 7-9 124.47 38 34 18 8 <5 68 21 1215X-2, 123-125 127.02 56 25 14 <5 <5 71 11 1816X-1, 98-100 134.98 51 31 11 5 <5 23 35 4216X-2, 90-92 136.40 56 30 8 <5 <5 38 21 4116X-3, 40-42 137.40 70 20 7 <5 <5 35 39 2617X-1, 80-84 144.40 55 23 12 7 <5 27 42 3117X-2, 30-34 145.40 37 38 12 8 <5 20 45 3617X-3, 67-71 147.27 68 17 6 8 <5 21 55 2418X-1, 85-89 154.05 47 21 18 8 6 75 6 1818X-2, 67-71 155.17 43 23 17 16 <5 54 29 1718X-3, 36-40 156.36 28 43 17 7 <5 70 8 2219X-1, 102-106 163.82 22 38 26 9 5 80 5 1519X-2, 41-45 164.71 15 41 31 10 <5 82 <5 1719X-3, 58-62 166.26 20 51 21 7 <5 84 6 1020X-1, 93-97 173.43 17 47 23 11 <5 84 <5 1220X-2, 67-71 174.67 20 47 22 2 9 78 6 1621X-1, 56-60 182.66 31 39 15 13 <5 76 <5 2021X-2, 122-126 184.82 26 37 15 17 5 69 11 2021X-3, 17-21 185.27 29 31 22 12 6 69 9 2222X-1, 52-56 192.22 27 53 10 7 <5 73 5 2122X-1, 120-124 192.90 67 20 6 6 <5 21 48 3022X-2, 122-126 194.42 56 25 11 7 <5 24 42 3422X-3, 144-148 196.14 86 <5 8 <5 <5 8 55 3822X-4, 96-100 197.16 62 23 10 <5 <5 19 54 27
609
M.J. JURADO-RODRÍGUEZ, F. MARTÍNEZ-RUIZ
610
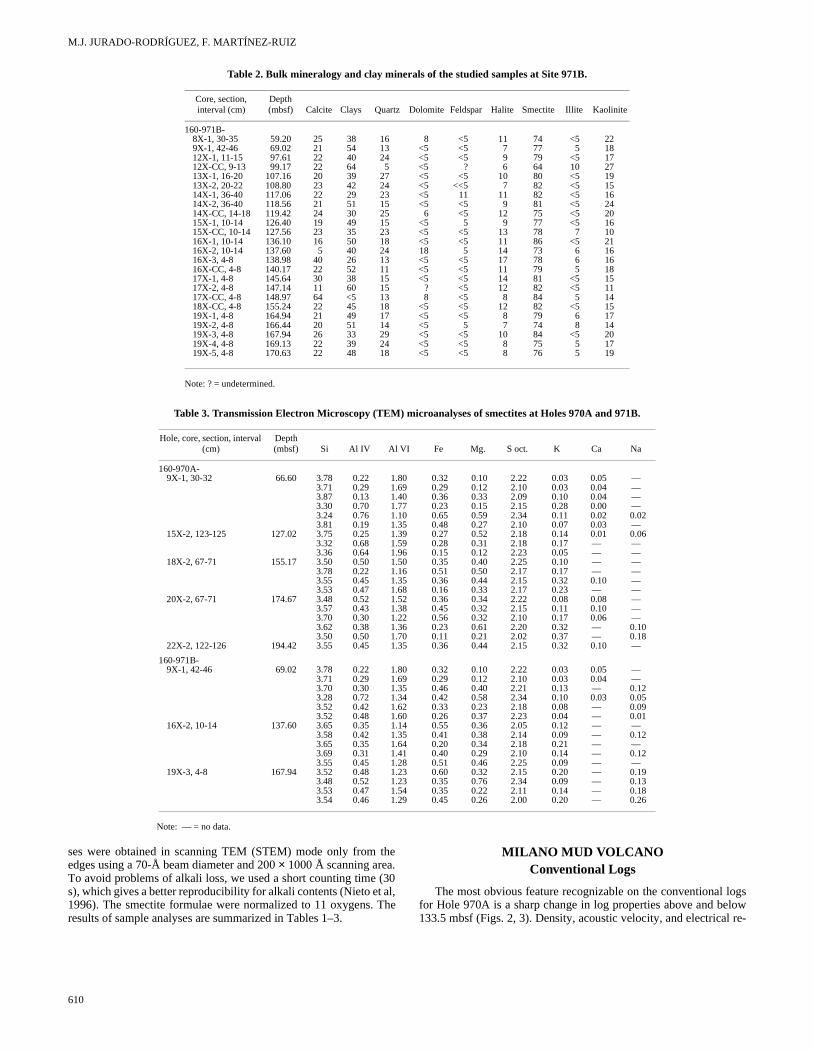
Table 2. Bulk mineralogy and clay minerals of the studied samples at Site 971B.
Note: ? = undetermined.
Core, section, interval (cm)
Depth (mbsf) Calcite Clays Quartz Dolomite Feldspar Halite Smectite Illite Kaolinite
160-971B-8X-1, 30-35 59.20 25 38 16 8 <5 11 74 <5 229X-1, 42-46 69.02 21 54 13 <5 <5 7 77 5 1812X-1, 11-15 97.61 22 40 24 <5 <5 9 79 <5 1712X-CC, 9-13 99.17 22 64 5 <5 ? 6 64 10 2713X-1, 16-20 107.16 20 39 27 <5 <5 10 80 <5 1913X-2, 20-22 108.80 23 42 24 <5 <<5 7 82 <5 1514X-1, 36-40 117.06 22 29 23 <5 11 11 82 <5 1614X-2, 36-40 118.56 21 51 15 <5 <5 9 81 <5 2414X-CC, 14-18 119.42 24 30 25 6 <5 12 75 <5 2015X-1, 10-14 126.40 19 49 15 <5 5 9 77 <5 1615X-CC, 10-14 127.56 23 35 23 <5 <5 13 78 7 1016X-1, 10-14 136.10 16 50 18 <5 <5 11 86 <5 2116X-2, 10-14 137.60 5 40 24 18 5 14 73 6 1616X-3, 4-8 138.98 40 26 13 <5 <5 17 78 6 1616X-CC, 4-8 140.17 22 52 11 <5 <5 11 79 5 1817X-1, 4-8 145.64 30 38 15 <5 <5 14 81 <5 1517X-2, 4-8 147.14 11 60 15 ? <5 12 82 <5 1117X-CC, 4-8 148.97 64 <5 13 8 <5 8 84 5 1418X-CC, 4-8 155.24 22 45 18 <5 <5 12 82 <5 1519X-1, 4-8 164.94 21 49 17 <5 <5 8 79 6 1719X-2, 4-8 166.44 20 51 14 <5 5 7 74 8 1419X-3, 4-8 167.94 26 33 29 <5 <5 10 84 <5 2019X-4, 4-8 169.13 22 39 24 <5 <5 8 75 5 1719X-5, 4-8 170.63 22 48 18 <5 <5 8 76 5 19
Table 3. Transmission Electron Microscopy (TEM) microanalyses of smectites at Holes 970A and 971B.
Note: — = no data.
Hole, core, section, interval (cm)
Depth (mbsf) Si Al IV Al VI Fe Mg. S oct. K Ca Na
160-970A-9X-1, 30-32 66.60 3.78 0.22 1.80 0.32 0.10 2.22 0.03 0.05 —
3.71 0.29 1.69 0.29 0.12 2.10 0.03 0.04 —3.87 0.13 1.40 0.36 0.33 2.09 0.10 0.04 —3.30 0.70 1.77 0.23 0.15 2.15 0.28 0.00 —3.24 0.76 1.10 0.65 0.59 2.34 0.11 0.02 0.023.81 0.19 1.35 0.48 0.27 2.10 0.07 0.03 —
15X-2, 123-125 127.02 3.75 0.25 1.39 0.27 0.52 2.18 0.14 0.01 0.063.32 0.68 1.59 0.28 0.31 2.18 0.17 — —3.36 0.64 1.96 0.15 0.12 2.23 0.05 — —
18X-2, 67-71 155.17 3.50 0.50 1.50 0.35 0.40 2.25 0.10 — —3.78 0.22 1.16 0.51 0.50 2.17 0.17 — —3.55 0.45 1.35 0.36 0.44 2.15 0.32 0.10 —3.53 0.47 1.68 0.16 0.33 2.17 0.23 — —
20X-2, 67-71 174.67 3.48 0.52 1.52 0.36 0.34 2.22 0.08 0.08 —3.57 0.43 1.38 0.45 0.32 2.15 0.11 0.10 —3.70 0.30 1.22 0.56 0.32 2.10 0.17 0.06 —3.62 0.38 1.36 0.23 0.61 2.20 0.32 — 0.103.50 0.50 1.70 0.11 0.21 2.02 0.37 — 0.18
22X-2, 122-126 194.42 3.55 0.45 1.35 0.36 0.44 2.15 0.32 0.10 —
160-971B-9X-1, 42-46 69.02 3.78 0.22 1.80 0.32 0.10 2.22 0.03 0.05 —
3.71 0.29 1.69 0.29 0.12 2.10 0.03 0.04 —3.70 0.30 1.35 0.46 0.40 2.21 0.13 — 0.123.28 0.72 1.34 0.42 0.58 2.34 0.10 0.03 0.053.52 0.42 1.62 0.33 0.23 2.18 0.08 — 0.093.52 0.48 1.60 0.26 0.37 2.23 0.04 — 0.01
16X-2, 10-14 137.60 3.65 0.35 1.14 0.55 0.36 2.05 0.12 — —3.58 0.42 1.35 0.41 0.38 2.14 0.09 — 0.123.65 0.35 1.64 0.20 0.34 2.18 0.21 — —3.69 0.31 1.41 0.40 0.29 2.10 0.14 — 0.123.55 0.45 1.28 0.51 0.46 2.25 0.09 — —
19X-3, 4-8 167.94 3.52 0.48 1.23 0.60 0.32 2.15 0.20 — 0.193.48 0.52 1.23 0.35 0.76 2.34 0.09 — 0.133.53 0.47 1.54 0.35 0.22 2.11 0.14 — 0.183.54 0.46 1.29 0.45 0.26 2.00 0.20 — 0.26
. ( aT
gslowre-
ses were obtained in scanning TEM (STEM) mode only from theedges using a 70-Å beam diameter and 200 × 1000 Å scanning areaTo avoid problems of alkali loss, we used a short counting times), which gives a better reproducibility for alkali contents (Nieto et1996). The smectite formulae were normalized to 11 oxygens. results of sample analyses are summarized in Tables 1–3.
30l,he
MILANO MUD VOLCANOConventional Logs
The most obvious feature recognizable on the conventional lofor Hole 970A is a sharp change in log properties above and be133.5 mbsf (Figs. 2, 3). Density, acoustic velocity, and electrical
INTEGRATED LOG-CORE APPROACH
in
l-y
s
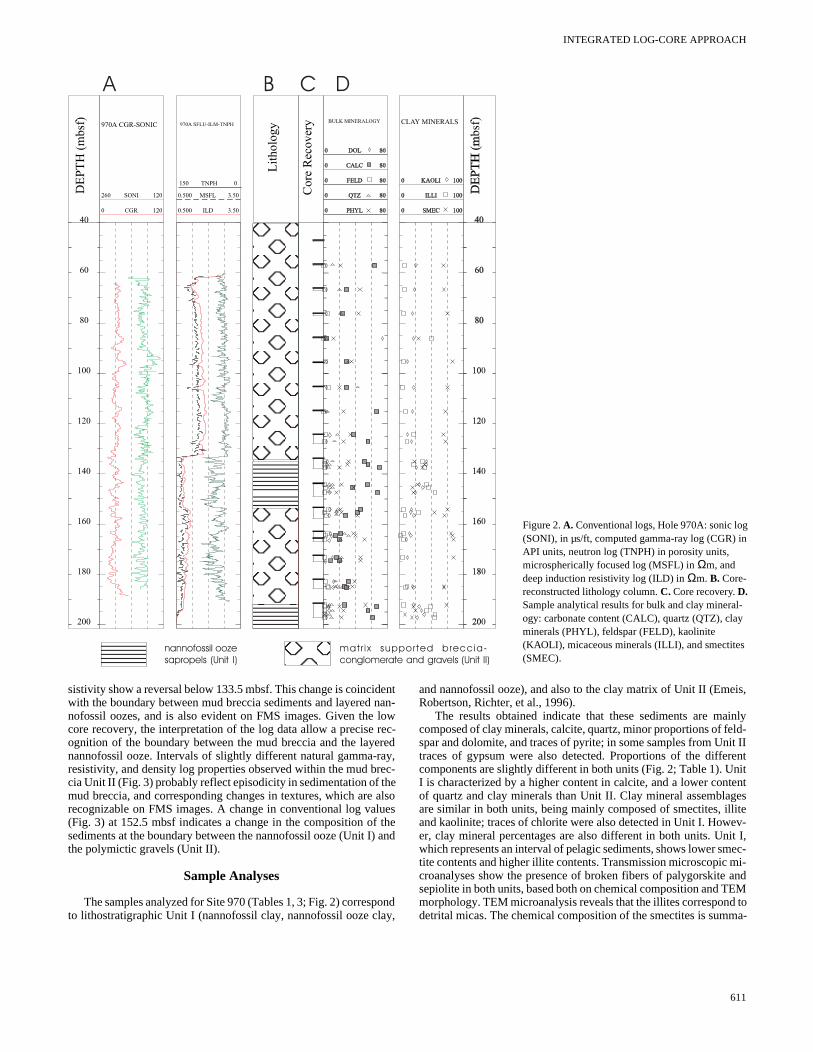
Figure 2. A. Conventional logs, Hole 970A: sonic log (SONI), in µs/ft, computed gamma-ray log (CGR) API units, neutron log (TNPH) in porosity units, microspherically focused log (MSFL) in Ωm, and deep induction resistivity log (ILD) in Ωm. B. Core-reconstructed lithology column. C. Core recovery. D. Sample analytical results for bulk and clay mineraogy: carbonate content (CALC), quartz (QTZ), claminerals (PHYL), feldspar (FELD), kaolinite (KAOLI), micaceous minerals (ILLI), and smectite(SMEC).
sistivity show a reversal below 133.5 mbsf. This change is coincidentwith the boundary between mud breccia sediments and layered nan-nofossil oozes, and is also evident on FMS images. Given the lowcore recovery, the interpretation of the log data allow a precise rec-ognition of the boundary between the mud breccia and the layerednannofossil ooze. Intervals of slightly different natural gamma-ray,resistivity, and density log properties observed within the mud brec-cia Unit II (Fig. 3) probably reflect episodicity in sedimentation of themud breccia, and corresponding changes in textures, which are alsorecognizable on FMS images. A change in conventional log values(Fig. 3) at 152.5 mbsf indicates a change in the composition of thesediments at the boundary between the nannofossil ooze (Unit I) andthe polymictic gravels (Unit II).
Sample Analyses
The samples analyzed for Site 970 (Tables 1, 3; Fig. 2) correspondto lithostratigraphic Unit I (nannofossil clay, nannofossil ooze clay,
and nannofossil ooze), and also to the clay matrix of Unit II (Emeis,Robertson, Richter, et al., 1996).
The results obtained indicate that these sediments are mainlycomposed of clay minerals, calcite, quartz, minor proportions of feld-spar and dolomite, and traces of pyrite; in some samples from Unit IItraces of gypsum were also detected. Proportions of the differentcomponents are slightly different in both units (Fig. 2; Table 1). UnitI is characterized by a higher content in calcite, and a lower contentof quartz and clay minerals than Unit II. Clay mineral assemblagesare similar in both units, being mainly composed of smectites, illiteand kaolinite; traces of chlorite were also detected in Unit I. Howev-er, clay mineral percentages are also different in both units. Unit I,which represents an interval of pelagic sediments, shows lower smec-tite contents and higher illite contents. Transmission microscopic mi-croanalyses show the presence of broken fibers of palygorskite andsepiolite in both units, based both on chemical composition and TEMmorphology. TEM microanalysis reveals that the illites correspond todetrital micas. The chemical composition of the smectites is summa-
611
M.J. JURADO-RODRÍGUEZ, F. MARTÍNEZ-RUIZ
matrix supported breccia-conglomerate and gravels (Unit II)
D
nannofossil ooze,sapropels (Unit I)
DE
PTH
(m
bsf)
Tadp
ole
PlotLogs
SGR0
90
60
30
90
60
30
50
100
150
200
112
133.5
152.5
180
10 20 30 40 60 90
HTNP0 100
ILD0 2
A B C
Cor
e D
ata
Lith
olog
y
Uni
t IU
nit I
IU
nit I
Uni
t II
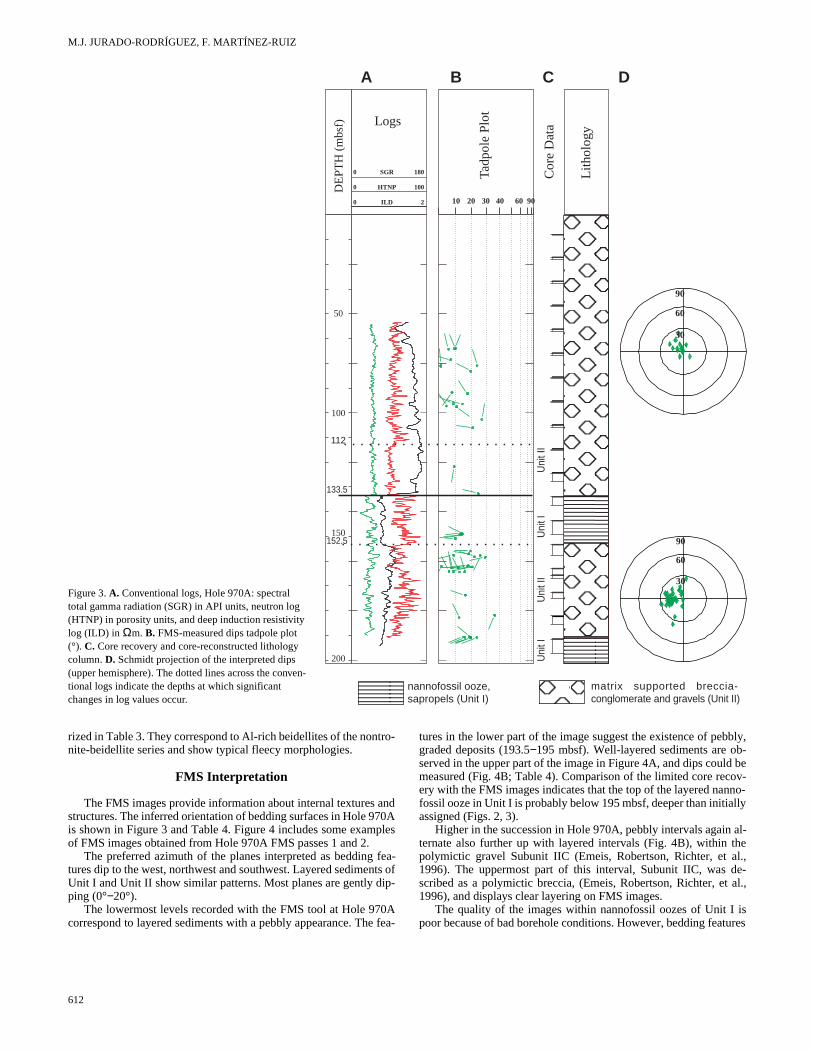
Figure 3. A. Conventional logs, Hole 970A: spectral total gamma radiation (SGR) in API units, neutron log (HTNP) in porosity units, and deep induction resistivity log (ILD) in Ωm. B. FMS-measured dips tadpole plot (°). C. Core recovery and core-reconstructed lithology column. D. Schmidt projection of the interpreted dips (upper hemisphere). The dotted lines across the conven-tional logs indicate the depths at which significant changes in log values occur.
matrix supported breccia-conglomerate and gravels (Unit II)
D
nannofossil ooze,sapropels (Unit I)
DE
PTH
(m
bsf)
Tadp
ole
PlotLogs
SGR0
90
60
30
90
60
30
50
100
150
200
112
133.5
152.5
180
10 20 30 40 60 90
HTNP0 100
ILD0 2
A B C
Cor
e D
ata
Lith
olog
y
Uni
t IU
nit I
IU
nit I
Uni
t II
0
bly,- bev-
no-ly
al-el.,e-al.,
isres
rized in Table 3. They correspond to Al-rich beidellites of the nontro-nite-beidellite series and show typical fleecy morphologies.
FMS Interpretation
The FMS images provide information about internal textures andstructures. The inferred orientation of bedding surfaces in Hole 970Ais shown in Figure 3 and Table 4. Figure 4 includes some examplesof FMS images obtained from Hole 970A FMS passes 1 and 2.
The preferred azimuth of the planes interpreted as bedding fea-tures dip to the west, northwest and southwest. Layered sediments ofUnit I and Unit II show similar patterns. Most planes are gently dip-ping (0°−20°).
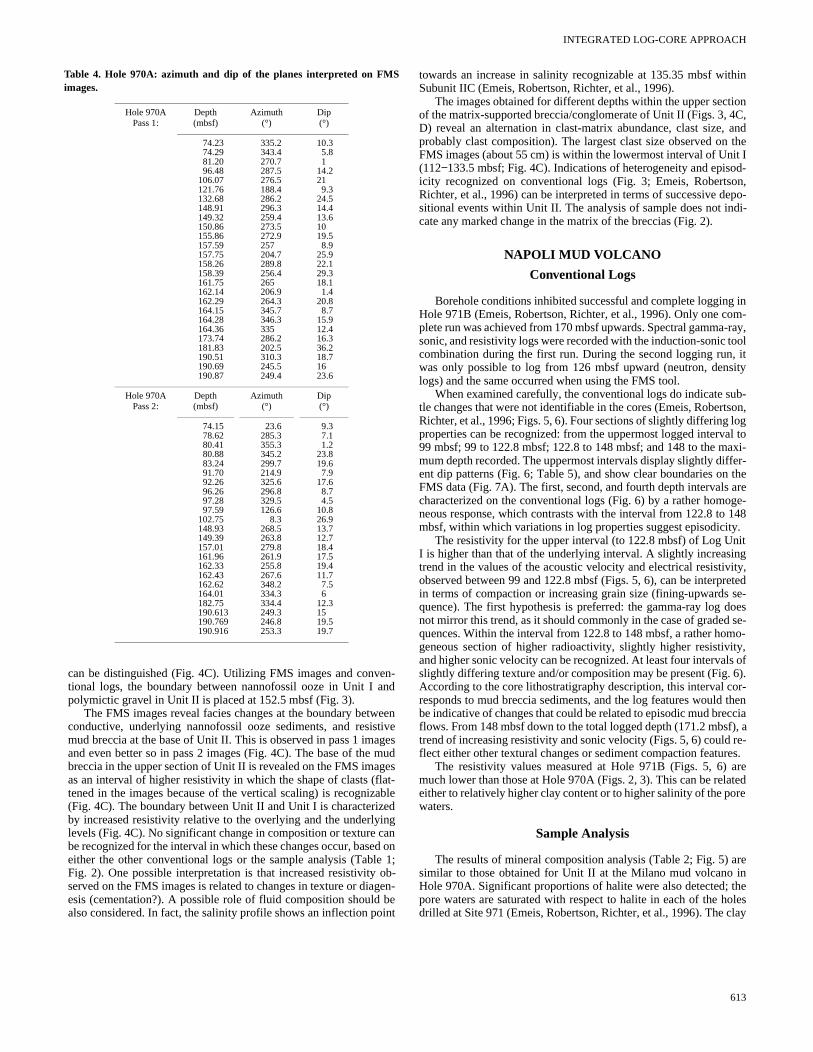
The lowermost levels recorded with the FMS tool at Hole 97correspond to layered sediments with a pebbly appearance. The
612
A fea-
tures in the lower part of the image suggest the existence of pebgraded deposits (193.5−195 mbsf). Well-layered sediments are observed in the upper part of the image in Figure 4A, and dips couldmeasured (Fig. 4B; Table 4). Comparison of the limited core recoery with the FMS images indicates that the top of the layered nanfossil ooze in Unit I is probably below 195 mbsf, deeper than initialassigned (Figs. 2, 3).
Higher in the succession in Hole 970A, pebbly intervals again ternate also further up with layered intervals (Fig. 4B), within thpolymictic gravel Subunit IIC (Emeis, Robertson, Richter, et a1996). The uppermost part of this interval, Subunit IIC, was dscribed as a polymictic breccia, (Emeis, Robertson, Richter, et 1996), and displays clear layering on FMS images.
The quality of the images within nannofossil oozes of Unit I poor because of bad borehole conditions. However, bedding featu
INTEGRATED LOG-CORE APPROACH
can be distinguished (Fig. 4C). Utilizing FMS images and conven-tional logs, the boundary between nannofossil ooze in Unit I andpolymictic gravel in Unit II is placed at 152.5 mbsf (Fig. 3).
The FMS images reveal facies changes at the boundary betweenconductive, underlying nannofossil ooze sediments, and resistivemud breccia at the base of Unit II. This is observed in pass 1 imagesand even better so in pass 2 images (Fig. 4C). The base of the mudbreccia in the upper section of Unit II is revealed on the FMS imagesas an interval of higher resistivity in which the shape of clasts (flat-tened in the images because of the vertical scaling) is recognizable(Fig. 4C). The boundary between Unit II and Unit I is characterizedby increased resistivity relative to the overlying and the underlyinglevels (Fig. 4C). No significant change in composition or texture canbe recognized for the interval in which these changes occur, based oneither the other conventional logs or the sample analysis (Table 1;Fig. 2). One possible interpretation is that increased resistivity ob-served on the FMS images is related to changes in texture or diagen-esis (cementation?). A possible role of fluid composition should bealso considered. In fact, the salinity profile shows an inflection point
Table 4. Hole 970A: azimuth and dip of the planes interpreted on FMSimages.
Hole 970APass 1:
Depth(mbsf)
Azimuth(°)
Dip(°)
74.23 335.2 10.374.29 343.4 5.881.20 270.7 196.48 287.5 14.2
106.07 276.5 21121.76 188.4 9.3132.68 286.2 24.5148.91 296.3 14.4149.32 259.4 13.6150.86 273.5 10155.86 272.9 19.5157.59 257 8.9157.75 204.7 25.9158.26 289.8 22.1158.39 256.4 29.3161.75 265 18.1162.14 206.9 1.4162.29 264.3 20.8164.15 345.7 8.7164.28 346.3 15.9164.36 335 12.4173.74 286.2 16.3181.83 202.5 36.2190.51 310.3 18.7190.69 245.5 16190.87 249.4 23.6
Hole 970APass 2:
Depth(mbsf)
Azimuth(°)
Dip(°)
74.15 23.6 9.378.62 285.3 7.180.41 355.3 1.280.88 345.2 23.883.24 299.7 19.691.70 214.9 7.992.26 325.6 17.696.26 296.8 8.797.28 329.5 4.597.59 126.6 10.8
102.75 8.3 26.9148.93 268.5 13.7149.39 263.8 12.7157.01 279.8 18.4161.96 261.9 17.5162.33 255.8 19.4162.43 267.6 11.7162.62 348.2 7.5164.01 334.3 6182.75 334.4 12.3190.613 249.3 15190.769 246.8 19.5190.916 253.3 19.7
towards an increase in salinity recognizable at 135.35 mbsf withinSubunit IIC (Emeis, Robertson, Richter, et al., 1996).
The images obtained for different depths within the upper sectionof the matrix-supported breccia/conglomerate of Unit II (Figs. 3, 4C,D) reveal an alternation in clast-matrix abundance, clast size, andprobably clast composition). The largest clast size observed on theFMS images (about 55 cm) is within the lowermost interval of Unit I(112−133.5 mbsf; Fig. 4C). Indications of heterogeneity and episod-icity recognized on conventional logs (Fig. 3; Emeis, Robertson,Richter, et al., 1996) can be interpreted in terms of successive depo-sitional events within Unit II. The analysis of sample does not indi-cate any marked change in the matrix of the breccias (Fig. 2).
NAPOLI MUD VOLCANO
Conventional Logs
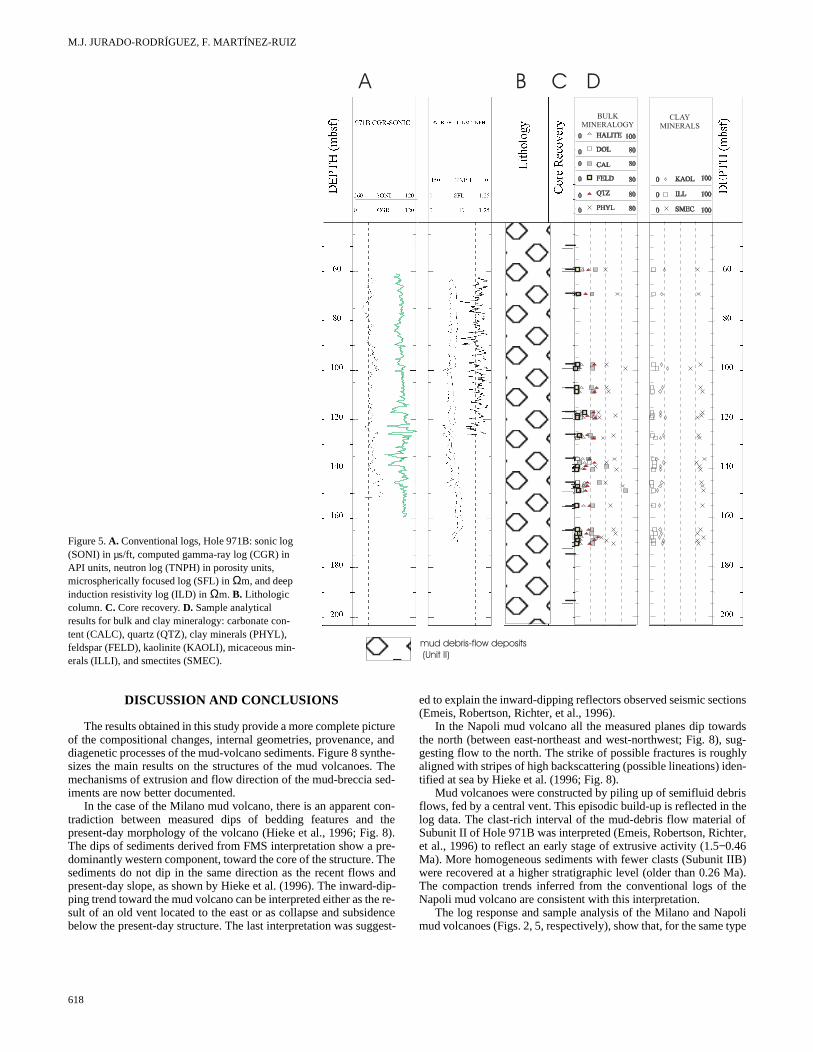
Borehole conditions inhibited successful and complete logging inHole 971B (Emeis, Robertson, Richter, et al., 1996). Only one com-plete run was achieved from 170 mbsf upwards. Spectral gamma-ray,sonic, and resistivity logs were recorded with the induction-sonic toolcombination during the first run. During the second logging run, itwas only possible to log from 126 mbsf upward (neutron, densitylogs) and the same occurred when using the FMS tool.
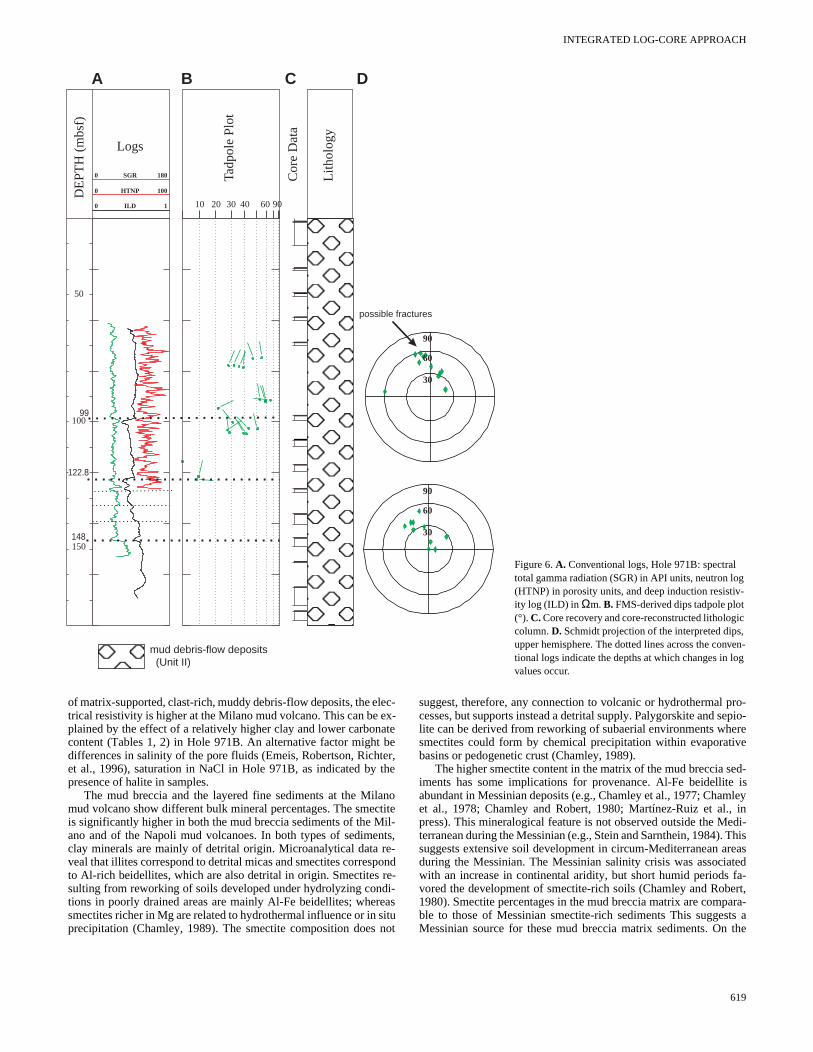
When examined carefully, the conventional logs do indicate sub-tle changes that were not identifiable in the cores (Emeis, Robertson,Richter, et al., 1996; Figs. 5, 6). Four sections of slightly differing logproperties can be recognized: from the uppermost logged interval to99 mbsf; 99 to 122.8 mbsf; 122.8 to 148 mbsf; and 148 to the maxi-mum depth recorded. The uppermost intervals display slightly differ-ent dip patterns (Fig. 6; Table 5), and show clear boundaries on theFMS data (Fig. 7A). The first, second, and fourth depth intervals arecharacterized on the conventional logs (Fig. 6) by a rather homoge-neous response, which contrasts with the interval from 122.8 to 148mbsf, within which variations in log properties suggest episodicity.
The resistivity for the upper interval (to 122.8 mbsf) of Log UnitI is higher than that of the underlying interval. A slightly increasingtrend in the values of the acoustic velocity and electrical resistivity,observed between 99 and 122.8 mbsf (Figs. 5, 6), can be interpretedin terms of compaction or increasing grain size (fining-upwards se-quence). The first hypothesis is preferred: the gamma-ray log doesnot mirror this trend, as it should commonly in the case of graded se-quences. Within the interval from 122.8 to 148 mbsf, a rather homo-geneous section of higher radioactivity, slightly higher resistivity,and higher sonic velocity can be recognized. At least four intervals ofslightly differing texture and/or composition may be present (Fig. 6).According to the core lithostratigraphy description, this interval cor-responds to mud breccia sediments, and the log features would thenbe indicative of changes that could be related to episodic mud brecciaflows. From 148 mbsf down to the total logged depth (171.2 mbsf), atrend of increasing resistivity and sonic velocity (Figs. 5, 6) could re-flect either other textural changes or sediment compaction features.
The resistivity values measured at Hole 971B (Figs. 5, 6) aremuch lower than those at Hole 970A (Figs. 2, 3). This can be relatedeither to relatively higher clay content or to higher salinity of the porewaters.
Sample Analysis
The results of mineral composition analysis (Table 2; Fig. 5) aresimilar to those obtained for Unit II at the Milano mud volcano inHole 970A. Significant proportions of halite were also detected; thepore waters are saturated with respect to halite in each of the holesdrilled at Site 971 (Emeis, Robertson, Richter, et al., 1996). The clay
613
M.J. JURADO-RODRÍGUEZ, F. MARTÍNEZ-RUIZ
overy
191
192
193
194
195
N E S W
Hole 970AD
EP
TH
(m
bsf)
polymictic gravel
pebbles
pebbles
layering
Cor
e re
c.
Lit
holo
gy
?
A
Figure 4. Hole 970A borehole wall FMS images (0° to 360°). Static normalization enhanced images. Light color indicates higher resistivity. Vertical scalingresults in flattening of features. A. Pebbly sediments of Unit II, larger size in the lower part of the polymictic gravel; layering in the upper part. Core recand lithostratigraphic column (Emeis, Robertson, Richter, et al., 1996) on the right-hand side. The boundary between the polymictic gravel and the nannofossilooze indicated in the lithostratigraphic column does not correspond to the features recognizable on FMS images and is probably below the depth shown in thefigure. (Continued next page.)
adinghendandescon-ncea-
psteep
minerals are dominated by smectites (Table 3), showing the samecomposition as in Site 970 (i.e., Al-rich beidellites with fleecy mor-phologies). TEM analysis again indicates that the illite correspondsto detrital mica. Illite layers in the smectite (calculated according toReynolds and Hower, 1970) yield low values at both volcanoes, andthere is no evidence of increase in illite layers downhole or uphole, orany evidence of clay mineral diagenesis.
FMS Interpretation
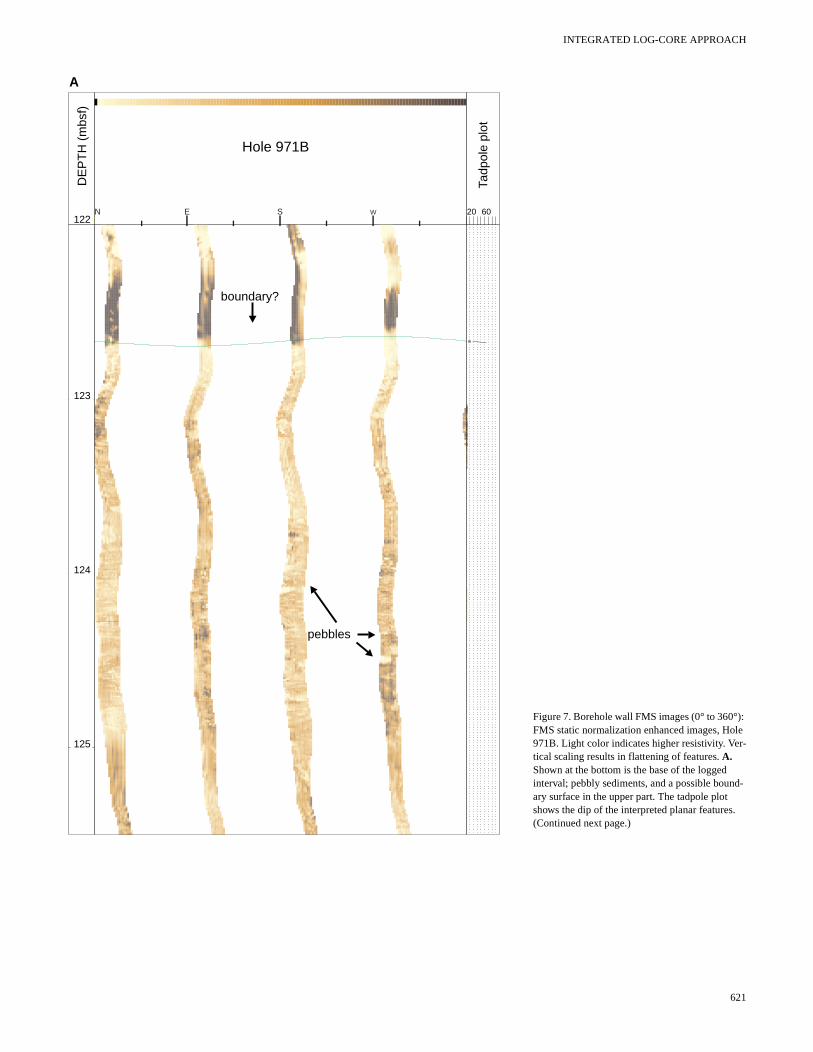
The enhanced FMS images provide additional evidence of sedi-mentary layering and grading within the mud breccia. The base of theFMS logged interval (Fig. 7A) corresponds to a pebbly material.
614
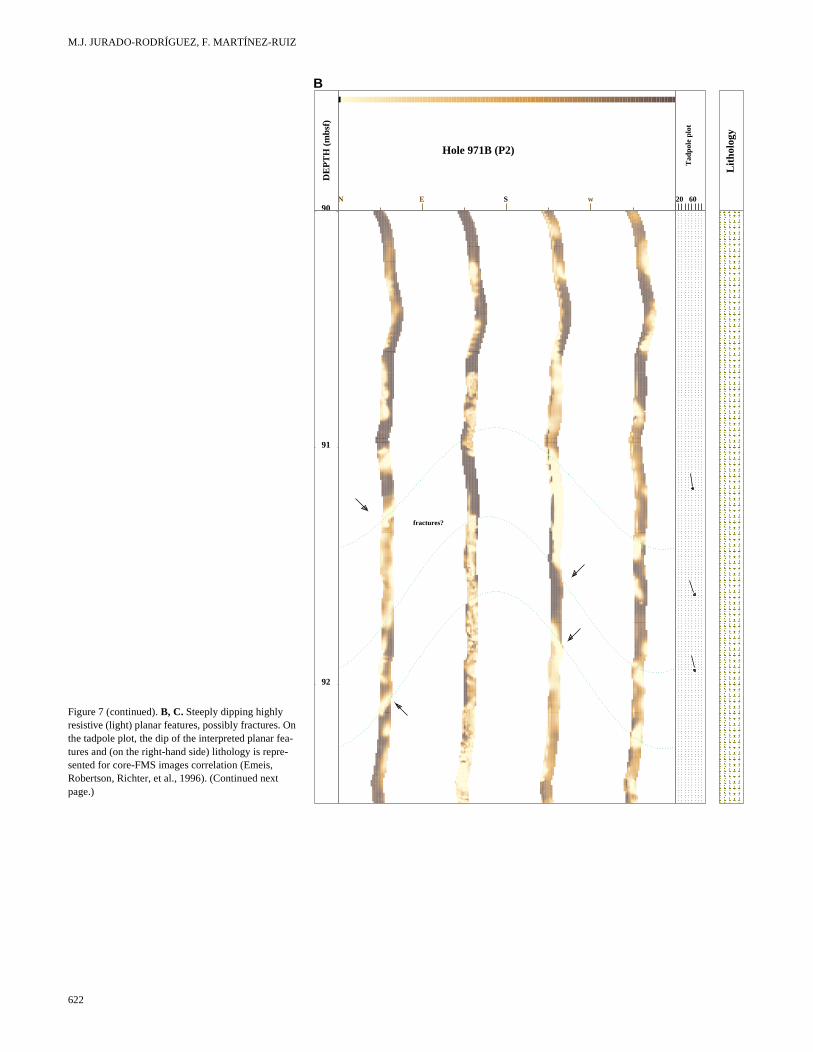
“Ghosts” of pebbles can be recognized over intervals of poor pcontact. The presence of steeply dipping features (>45°) intersectthe hole could be interpreted as intersecting fractures (Figs. 6, 7). Tstrike of these steeply dipping planes varies from 340º to 353° ahas been recognized at two different depth intervals between 74 102 mbsf (Figs. 7B, 7C; Table 4). Most of the steeply dipping planappear on the FMS images as resistive features and show good trast relative to the host sediment. This suggests either the preseof a resistive fluid (gas?) along these planes or a highly resistive mterial cementing the high-angle planes (could be halite).
A major difference detected relative to Hole 970A is that the diof the planes, interpreted as sedimentary features, are rather s(Fig. 6; Table 5).
INTEGRATED LOG-CORE APPROACH
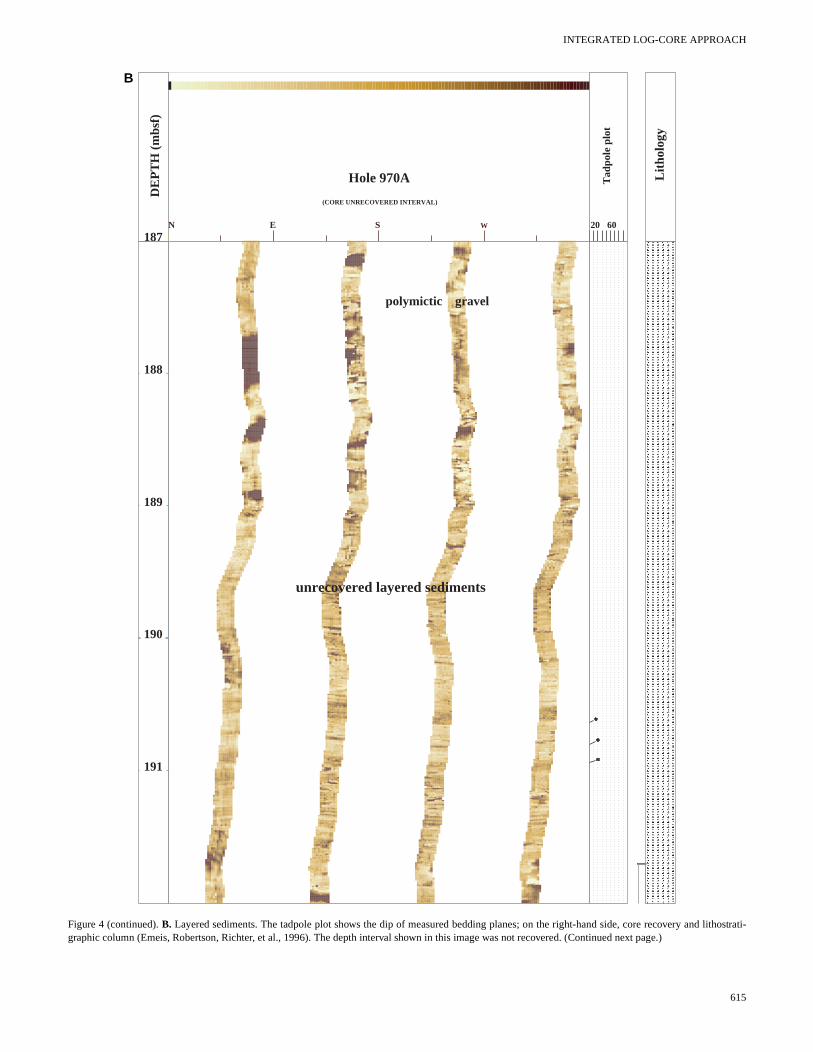
187
188
189
190
191
N E S W 20 60
Hole 970A
(CORE UNRECOVERED INTERVAL)
DE
PT
H (
mbs
f)
Tad
pole
plo
t
Lit
holo
gy
polymictic gravel
unrecovered layered sediments
B
Figure 4 (continued). B. Layered sediments. The tadpole plot shows the dip of measured bedding planes; on the right-hand side, core recovery and lithostrati-graphic column (Emeis, Robertson, Richter, et al., 1996). The depth interval shown in this image was not recovered. (Continued next page.)
615
M.J. JURADO-RODRÍGUEZ, F. MARTÍNEZ-RUIZ
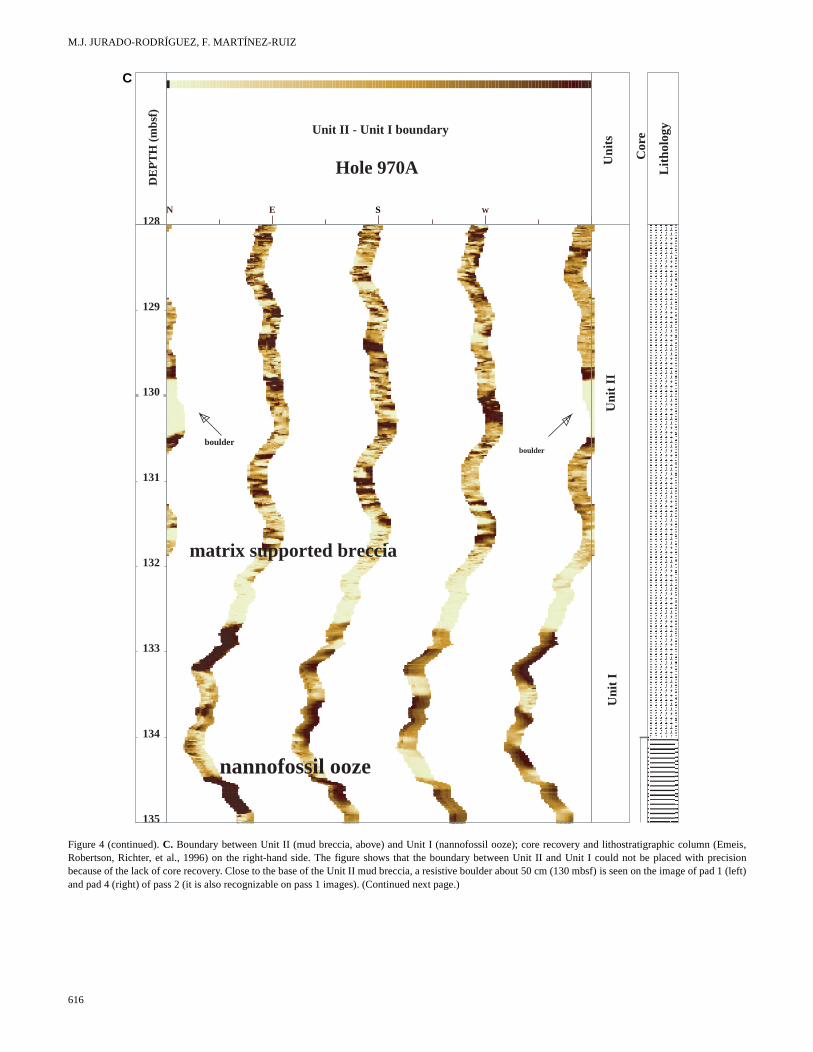
128
129
130
131
132
133
134
135
N E S W
Hole 970A
matrix supported breccia
nannofossil ooze
boulderboulder
Unit II - Unit I boundary
Uni
t I
Uni
t II
Uni
ts
DE
PT
H (
mbs
f)
Cor
e
Lit
holo
gy
C
Figure 4 (continued). C. Boundary between Unit II (mud breccia, above) and Unit I (nannofossil ooze); core recovery and lithostratigraphic column (Emeis,Robertson, Richter, et al., 1996) on the right-hand side. The figure shows that the boundary between Unit II and Unit I could not be placed with precisionbecause of the lack of core recovery. Close to the base of the Unit II mud breccia, a resistive boulder about 50 cm (130 mbsf) is seen on the image of pad 1 (left)and pad 4 (right) of pass 2 (it is also recognizable on pass 1 images). (Continued next page.)
616
INTEGRATED LOG-CORE APPROACH
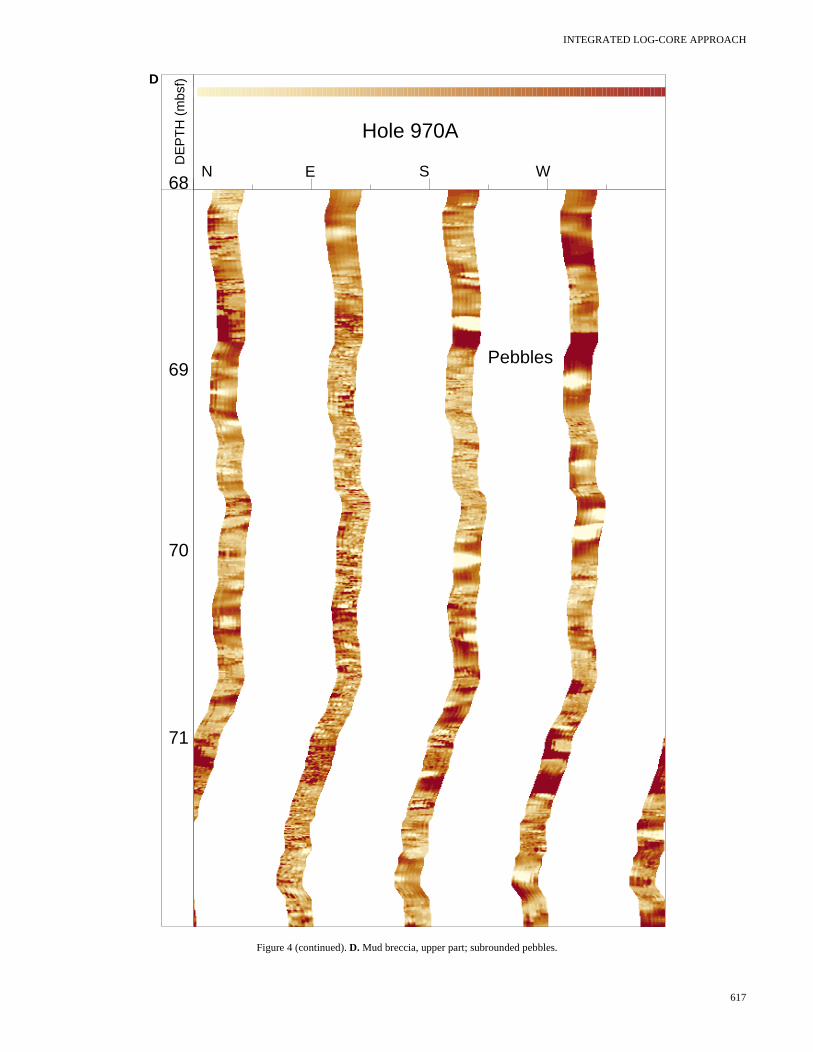
N E S W68
69
70
71
Hole 970A
DE
PT
H (
mbs
f)
Pebbles
D
Figure 4 (continued). D. Mud breccia, upper part; subrounded pebbles.
617
M.J. JURADO-RODRÍGUEZ, F. MARTÍNEZ-RUIZ
Figure 5. A. Conventional logs, Hole 971B: sonic log (SONI) in µs/ft, computed gamma-ray log (CGR) in API units, neutron log (TNPH) in porosity units, microspherically focused log (SFL) in Ωm, and deep induction resistivity log (ILD) in Ωm. B. Lithologic column. C. Core recovery. D. Sample analytical results for bulk and clay mineralogy: carbonate con-tent (CALC), quartz (QTZ), clay minerals (PHYL), feldspar (FELD), kaolinite (KAOLI), micaceous min-erals (ILLI), and smectites (SMEC).
DISCUSSION AND CONCLUSIONS
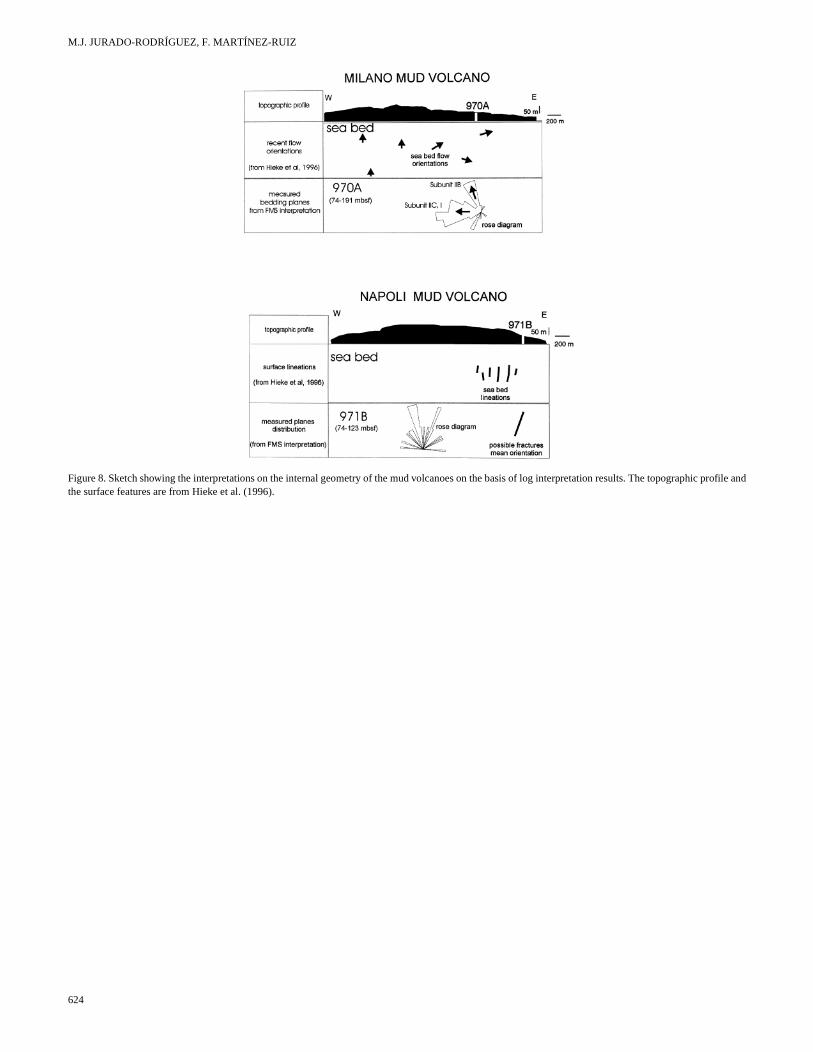
The results obtained in this study provide a more complete pictureof the compositional changes, internal geometries, provenance, anddiagenetic processes of the mud-volcano sediments. Figure 8 synthe-sizes the main results on the structures of the mud volcanoes. Themechanisms of extrusion and flow direction of the mud-breccia sed-iments are now better documented.
In the case of the Milano mud volcano, there is an apparent con-tradiction between measured dips of bedding features and thepresent-day morphology of the volcano (Hieke et al., 1996; Fig. 8).The dips of sediments derived from FMS interpretation show a pre-dominantly western component, toward the core of the structure. Thesediments do not dip in the same direction as the recent flows andpresent-day slope, as shown by Hieke et al. (1996). The inward-dip-ping trend toward the mud volcano can be interpreted either as the re-sult of an old vent located to the east or as collapse and subsidencebelow the present-day structure. The last interpretation was suggest-
618
ed to explain the inward-dipping reflectors observed seismic sections(Emeis, Robertson, Richter, et al., 1996).
In the Napoli mud volcano all the measured planes dip towardsthe north (between east-northeast and west-northwest; Fig. 8), sug-gesting flow to the north. The strike of possible fractures is roughlyaligned with stripes of high backscattering (possible lineations) iden-tified at sea by Hieke et al. (1996; Fig. 8).
Mud volcanoes were constructed by piling up of semifluid debrisflows, fed by a central vent. This episodic build-up is reflected in thelog data. The clast-rich interval of the mud-debris flow material ofSubunit II of Hole 971B was interpreted (Emeis, Robertson, Richter,et al., 1996) to reflect an early stage of extrusive activity (1.5−0.46Ma). More homogeneous sediments with fewer clasts (Subunit IIB)were recovered at a higher stratigraphic level (older than 0.26 Ma).The compaction trends inferred from the conventional logs of theNapoli mud volcano are consistent with this interpretation.
The log response and sample analysis of the Milano and Napolimud volcanoes (Figs. 2, 5, respectively), show that, for the same type
INTEGRATED LOG-CORE APPROACH
c en-g
D
possible fractures
mud debris-flow deposits (Unit II)
DE
PTH
(m
bsf)
Tadp
ole
Plot
Logs
SGR
HTNP
ILD
0
90
60
30
90
60
30
10
50
100
150
122.8
148
99
20 30 40 60 90
0
0
180
100
1
A B C
Cor
e D
ata
Lith
olog
y
Figure 6. A. Conventional logs, Hole 971B: spectral total gamma radiation (SGR) in API units, neutron log (HTNP) in porosity units, and deep induction resistiv-ity log (ILD) in Ωm. B. FMS-derived dips tadpole plot (°). C. Core recovery and core-reconstructed lithologicolumn. D. Schmidt projection of the interpreted dips,upper hemisphere. The dotted lines across the convtional logs indicate the depths at which changes in lovalues occur.
inedi-Thisreastedfa-ert,ara-ts a the
of matrix-supported, clast-rich, muddy debris-flow deposits, the elec-trical resistivity is higher at the Milano mud volcano. This can be ex-plained by the effect of a relatively higher clay and lower carbonatecontent (Tables 1, 2) in Hole 971B. An alternative factor might bedifferences in salinity of the pore fluids (Emeis, Robertson, Richter,et al., 1996), saturation in NaCl in Hole 971B, as indicated by thepresence of halite in samples.
The mud breccia and the layered fine sediments at the Milanomud volcano show different bulk mineral percentages. The smectiteis significantly higher in both the mud breccia sediments of the Mil-ano and of the Napoli mud volcanoes. In both types of sediments,clay minerals are mainly of detrital origin. Microanalytical data re-veal that illites correspond to detrital micas and smectites correspondto Al-rich beidellites, which are also detrital in origin. Smectites re-sulting from reworking of soils developed under hydrolyzing condi-tions in poorly drained areas are mainly Al-Fe beidellites; whereassmectites richer in Mg are related to hydrothermal influence or in situprecipitation (Chamley, 1989). The smectite composition does not
suggest, therefore, any connection to volcanic or hydrothermal pro-cesses, but supports instead a detrital supply. Palygorskite and sepio-lite can be derived from reworking of subaerial environments wheresmectites could form by chemical precipitation within evaporativebasins or pedogenetic crust (Chamley, 1989).
The higher smectite content in the matrix of the mud breccia sed-iments has some implications for provenance. Al-Fe beidellite isabundant in Messinian deposits (e.g., Chamley et al., 1977; Chamleyet al., 1978; Chamley and Robert, 1980; Martínez-Ruiz et al.,press). This mineralogical feature is not observed outside the Mterranean during the Messinian (e.g., Stein and Sarnthein, 1984). suggests extensive soil development in circum-Mediterranean aduring the Messinian. The Messinian salinity crisis was associawith an increase in continental aridity, but short humid periods vored the development of smectite-rich soils (Chamley and Rob1980). Smectite percentages in the mud breccia matrix are compble to those of Messinian smectite-rich sediments This suggesMessinian source for these mud breccia matrix sediments. On
619
M.J. JURADO-RODRÍGUEZ, F. MARTÍNEZ-RUIZ
at
i
.
m
ti
ge
an
or-
ol-d
of
ra-
e
er-lisis
ns976
lu-a-
in
-.,.,
za-.,
of
e-o:
gra-
other hand, the absence of diagenetic changes in the clay minerals isindicative of and absence of deep burial diagenesis.
ACKNOWLEDGMENTS
We thank Alastair Robertson and Michael Underwood for helpfulreviews of the manuscript. Miriam Kastner is acknowledged for theuse of analytical facilities at Scripps Institution of Oceanography, LaJolla, CA. The research of Jurado-Rodríguez was supported by ropean Union HCM (ERB4001GT933623) grant and that of Marez-Ruiz by a research grant of the Junta de Andalucía ReseGroup RNM-0179. The German ODP agency is acknowledgedproviding postcruise meeting travel funds to the first author.
REFERENCES
Bourke, L.T., 1989. Recognizing artifact images on the Formation Micros-canner. SPWLA 30th Ann. Logging Symp., pap. II: 1−25.
Caillère, S., Henin, S., and Rautureau, M, 1982. Minèralogie des Argiles, 2:Classification et Nomenclature: Paris (Masson).
Camerlenghi, A., Cita, M.B., Della Vedova, B., Fusi, N., Mirabile, L., andPellis, G., 1995. Geophysical evidence of mud diapirism on the Mediter-ranean Ridge accretionary complex. Mar. Geophys. Res., 17:115−141.
Chamley, H., 1989. Clay Sedimentology: Berlin (Springer-Verlag).Chamley, H., Dunoyer de Segonzac, G., and Mélières, F., 1978. Clay m
als in Messinian sediments of the Mediterranean area. In Hsü, K.J., Mon-tadert, L., et al., Init. Repts. DSDP, 42 (Pt. 1): Washington (U.S. GovtPrinting Office), 389−395.
Chamley, H., Giroud d’Argoud, G., and Robert, C., 1977. Genèse de setites messiniennes de Sicile, implications paléoclimatiques. Geol. Medi-terr., 4:371−378.
Chamley, H., and Robert, C., 1980. Sédimentation argileuse au Tersupérieur dans le domain méditerranéen. Geol. Mediterr., 7:25−34
Cita, M.B., and Camerlenghi, A., 1992. The Mediterranean Ridge asaccretionary prism in collision context. Mem. Soc. Geol. Ital., 45:463−480.
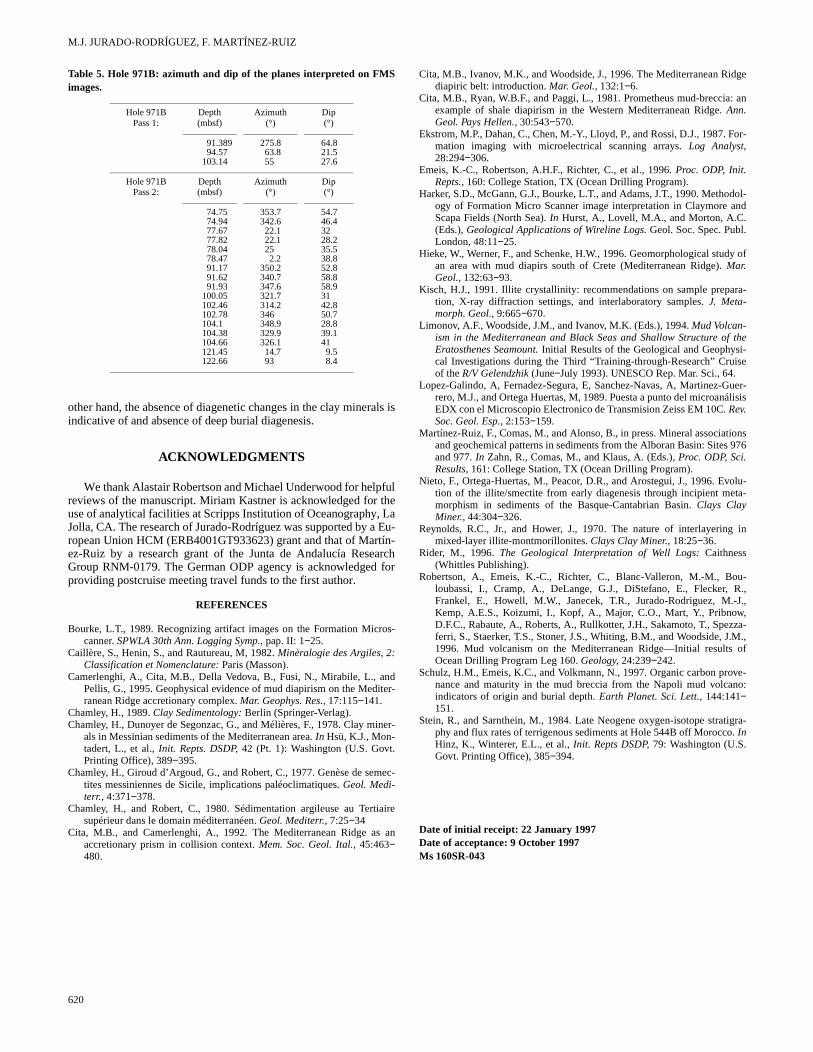
Table 5. Hole 971B: azimuth and dip of the planes interpreted on FMSimages.
Hole 971BPass 1:
Depth(mbsf)
Azimuth(°)
Dip(°)
91.389 275.8 64.894.57 63.8 21.5
103.14 55 27.6
Hole 971B Pass 2:
Depth(mbsf)
Azimuth(°)
Dip(°)
74.75 353.7 54.774.94 342.6 46.477.67 22.1 3277.82 22.1 28.278.04 25 35.578.47 2.2 38.891.17 350.2 52.891.62 340.7 58.891.93 347.6 58.9
100.05 321.7 31102.46 314.2 42.8102.78 346 50.7104.1 348.9 28.8104.38 329.9 39.1104.66 326.1 41121.45 14.7 9.5122.66 93 8.4
620
Eu-ín-archfor
ner-
ec-
aire
an
Cita, M.B., Ivanov, M.K., and Woodside, J., 1996. The Mediterranean Riddiapiric belt: introduction. Mar. Geol., 132:1−6.
Cita, M.B., Ryan, W.B.F., and Paggi, L., 1981. Prometheus mud-breccia:example of shale diapirism in the Western Mediterranean Ridge. Ann.Geol. Pays Hellen., 30:543−570.
Ekstrom, M.P., Dahan, C., Chen, M.-Y., Lloyd, P., and Rossi, D.J., 1987. Fmation imaging with microelectrical scanning arrays. Log Analyst,28:294−306.
Emeis, K.-C., Robertson, A.H.F., Richter, C., et al., 1996. Proc. ODP, Init.Repts., 160: College Station, TX (Ocean Drilling Program).
Harker, S.D., McGann, G.J., Bourke, L.T., and Adams, J.T., 1990. Methodogy of Formation Micro Scanner image interpretation in Claymore anScapa Fields (North Sea). In Hurst, A., Lovell, M.A., and Morton, A.C.(Eds.), Geological Applications of Wireline Logs. Geol. Soc. Spec. Publ.London, 48:11−25.
Hieke, W., Werner, F., and Schenke, H.W., 1996. Geomorphological studyan area with mud diapirs south of Crete (Mediterranean Ridge). Mar.Geol., 132:63−93.
Kisch, H.J., 1991. Illite crystallinity: recommendations on sample prepation, X-ray diffraction settings, and interlaboratory samples. J. Meta-morph. Geol., 9:665−670.
Limonov, A.F., Woodside, J.M., and Ivanov, M.K. (Eds.), 1994. Mud Volcan-ism in the Mediterranean and Black Seas and Shallow Structure of theEratosthenes Seamount. Initial Results of the Geological and Geophysi-cal Investigations during the Third “Training-through-Research” Cruisof the R/V Gelendzhik (June−July 1993). UNESCO Rep. Mar. Sci., 64.
Lopez-Galindo, A, Fernadez-Segura, E, Sanchez-Navas, A, Martinez-Gurero, M.J., and Ortega Huertas, M, 1989. Puesta a punto del microanáEDX con el Microscopio Electronico de Transmision Zeiss EM 10C. Rev.Soc. Geol. Esp., 2:153−159.
Martínez-Ruiz, F., Comas, M., and Alonso, B., in press. Mineral associatioand geochemical patterns in sediments from the Alboran Basin: Sites and 977. In Zahn, R., Comas, M., and Klaus, A. (Eds.), Proc. ODP, Sci.Results, 161: College Station, TX (Ocean Drilling Program).
Nieto, F., Ortega-Huertas, M., Peacor, D.R., and Arostegui, J., 1996. Evotion of the illite/smectite from early diagenesis through incipient metmorphism in sediments of the Basque-Cantabrian Basin. Clays ClayMiner., 44:304−326.
Reynolds, R.C., Jr., and Hower, J., 1970. The nature of interlayeringmixed-layer illite-montmorillonites. Clays Clay Miner., 18:25−36.
Rider, M., 1996. The Geological Interpretation of Well Logs: Caithness(Whittles Publishing).
Robertson, A., Emeis, K.-C., Richter, C., Blanc-Valleron, M.-M., Bouloubassi, I., Cramp, A., DeLange, G.J., DiStefano, E., Flecker, RFrankel, E., Howell, M.W., Janecek, T.R., Jurado-Rodriguez, M.-JKemp, A.E.S., Koizumi, I., Kopf, A., Major, C.O., Mart, Y., Pribnow,D.F.C., Rabaute, A., Roberts, A., Rullkotter, J.H., Sakamoto, T., Spezferri, S., Staerker, T.S., Stoner, J.S., Whiting, B.M., and Woodside, J.M1996. Mud volcanism on the Mediterranean Ridge—Initial results Ocean Drilling Program Leg 160. Geology, 24:239−242.
Schulz, H.M., Emeis, K.C., and Volkmann, N., 1997. Organic carbon provnance and maturity in the mud breccia from the Napoli mud volcanindicators of origin and burial depth. Earth Planet. Sci. Lett., 144:141−151.
Stein, R., and Sarnthein, M., 1984. Late Neogene oxygen-isotope stratiphy and flux rates of terrigenous sediments at Hole 544B off Morocco.InHinz, K., Winterer, E.L., et al., Init. Repts DSDP, 79: Washington (U.S.Govt. Printing Office), 385−394.
Date of initial receipt: 22 January 1997Date of acceptance: 9 October 1997Ms 160SR-043
INTEGRATED LOG-CORE APPROACH
-
Hole 971B
DE
PT
H (
mbs
f)
Tadp
ole
plot
pebbles
boundary?
122
123
124
125
N E S W 20 60
A
Figure 7. Borehole wall FMS images (0° to 360°): FMS static normalization enhanced images, Hole971B. Light color indicates higher resistivity. Ver-tical scaling results in flattening of features. A. Shown at the bottom is the base of the logged interval; pebbly sediments, and a possible boundary surface in the upper part. The tadpole plot shows the dip of the interpreted planar features. (Continued next page.)
621
M.J. JURADO-RODRÍGUEZ, F. MARTÍNEZ-RUIZ
90
91
92
N E S W 20 60
Hole 971B (P2)
DE
PT
H (
mbs
f)
Tad
pole
plo
t
Lit
holo
gy
fractures?
B
Figure 7 (continued). B, C. Steeply dipping highly resistive (light) planar features, possibly fractures. On the tadpole plot, the dip of the interpreted planar fea-tures and (on the right-hand side) lithology is repre-sented for core-FMS images correlation (Emeis, Robertson, Richter, et al., 1996). (Continued next page.)
622
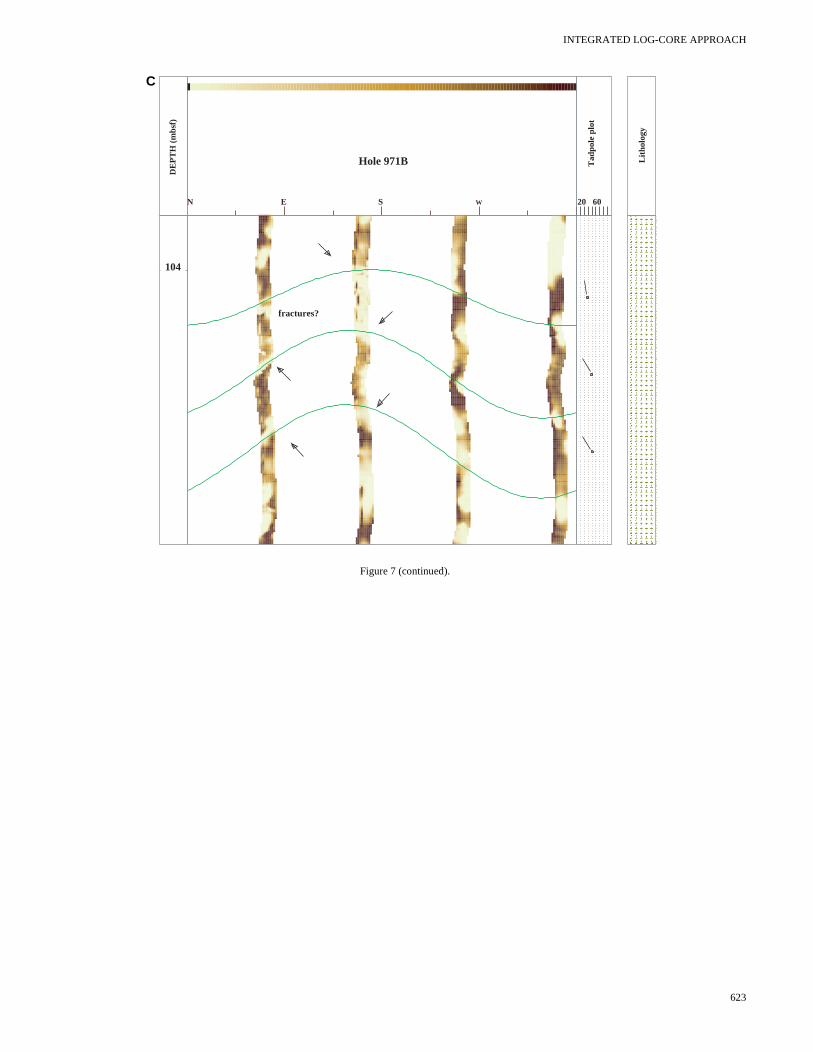
INTEGRATED LOG-CORE APPROACH
104
N E S W 20 60
Hole 971B
fractures?
DE
PT
H (
mbs
f)
Tad
pole
plo
t
Lit
holo
gy
C
Figure 7 (continued).
623
M.J. JURADO-RODRÍGUEZ, F. MARTÍNEZ-RUIZ
Figure 8. Sketch showing the interpretations on the internal geometry of the mud volcanoes on the basis of log interpretation results. The topographic profile andthe surface features are from Hieke et al. (1996).
624