Embed Size (px)
Citation preview
Dynamic energy-consumption indicators for domestic appliances:environment, behaviour and design
G. Wood*, M. NewboroughSchool of Engineering and Physical Sciences, Heriot-Watt University, Edinburgh, Scotland EH14 4AS, UK
Received 30 May 2002; received in revised form 21 October 2002; accepted 17 November 2002
Abstract
The literature concerning the application of information-feedback methods for saving energy in the home is reviewed. Particular attention is
given to electronic feedback via smart meters and displays, or ‘‘energy-consumption indicators’’ (ECI). Previous studies have not focused on
individual appliances, but this paper presents the findings of a UK field study involving 44 households which considered domestic cooking: it
compares the effectiveness of providing paper-based energy-use/saving information with electronic feedback of energy-consumption via
ECIs designed specifically for this investigation. Twelve Control Group households were monitored for a period of at least 12 months and this
revealed an average daily consumption for electric cooking of 1.30 kWh. Subsequently across a minimum monitoring period of 2 months, 14
out of 31 households achieved energy savings of greater than 10% and six of these achieved savings of greater than 20%. The average
reduction for households employing an ECI was 15%, whereas those given antecedent information alone reduced their electricity
consumption, on average, by only 3%. The associated behavioural changes and the importance of providing regular feedback during
use are identified. It is recommended that further attention be given to optimising the design and assessing the use of energy-consumption
indicators in the home, in order to maximise the associated energy-saving potential.
# 2002 Elsevier Science B.V. All rights reserved.
Keywords: Energy-consumption indicators; Home automation; Energy-saving potential
1. Introduction and background
Energy use in the home accounts for significant propor-
tions of total energy-consumption both in industrialised
and developing countries. The operation of most types of
domestic appliance, lighting and air conditioning relies
upon electricity and this results in substantial carbon dioxide
emissions per household. In the UK, domestic energy use
produces approximately 1.9 t C per annum per household
[1]. In order to stabilise atmospheric carbon dioxide con-
centrations, recent studies [2–5] have called for large
changes in the annual rates of CO2 emission associated with
energy use (e.g. by �60% between 2000 and 2050). To
achieve such targets wide-ranging action will be required
with respect to research, development and implementation
(i.e. some combination of technological change, fuel switch-
ing and behaviour modification). Reducing carbon depen-
dency by reducing energy-consumption per capita, or per
activity, is a particularly important method [4].
Simplistically, in the residential sector, there are three
general routes for reducing rates of energy-consumption
(and thereby CO2 emissions):
(i) replace the existing housing stock with low-energy
buildings designed primarily to minimise heating and
cooling loads;
(ii) develop, and achieve widespread replication for, low-
energy domestic equipment (e.g. appliances, lighting
and IT); and
(iii) promote and achieve ‘‘energy-conscious’’ behaviour
among end users.
Within the UK housing stock, rates of demolition, new-
build and refurbishment are very low (e.g. <1% per annum)
and so it will take several decades to achieve nationally-
significant energy savings. By comparison, most types of
Energy and Buildings 35 (2003) 821–841
Abbreviations: DEFRA, Department for the Environment, Food and
Rural Affairs; ECI, energy-consumption indicator; EU, European Union;
GHG, greenhouse gas; IPCC, Intergovernmental Panel on Climate Change;
ISO, International Organisation of Standardisation; LCD, liquid crystal
display; LCU, local collector unit; NVE, Norwegian Water and Power
Authority; OECD, Organisation for Economic Co-operation and Devel-
opment; PC, personal computer; PIU, performance and innovation unit;
PPD, peak power demand; TV, television; VCR, video recorder* Corresponding author. Tel.: þ44-131-451-8311;
fax: þ44-131-451-3129.
E-mail address: [email protected] (G. Wood).
0378-7788/02/$ – see front matter # 2002 Elsevier Science B.V. All rights reserved.
doi:10.1016/S0378-7788(02)00241-4
domestic equipment are replaced relatively frequently, but
raising the end-use efficiencies of new appliances and
upgrading the stock of household equipment is still quite
a slow process. Individuals often prefer to buy cheaper less-
efficient models, because there is usually a price increase
associated with the highest efficiency equipment [6], while
appliance manufacturers need to achieve high production
rates if sales prices are to be minimised. The application of
appliance energy labels is helping to raise interest in energy
performance at the points-of-sale, but once a decision has
been made to buy a new appliance, the energy-consumption
of the associated activity (e.g. home laundry or cooking) is to
a large extent pre-destined until such time that a replacement
appliance is purchased. For these reasons, it is considered
that alternative methods of reducing energy-consumption at
the points-of-use need to be researched, and new routes
established for realising behavioural change.
Household energy-consumption is transient and rates of
energy use vary dramatically with time of day and time of
year. Although one domestic appliance may use less than
1 kWh per day, appliance usage in general results in large
demands for electricity at peak times [7]. When demands
from several appliances occur at the same time they can
produce a peak demand of several kilowatts. The appliances,
which cause the largest peaks in demand within the home are
electric cookers/ranges. A cooking event can produce a peak
of up to 10 kW, while kettles, ovens and tumble dryers create
individual peak demands of only 2–2.5 kW (see Fig. 1). In
the UK, the peak power demand placed on the National Grid
grew by 33% from 37.7 GW in 1968 to 50.1 GW in 2000 and
domestic electricity use has been a major causal factor. It is
therefore desirable for the domestic sector to achieve a
smoother electrical demand profile in order to maximise
the overall efficiency of the electricity system [7].
The components of electricity consumption in the home
may be classified in broad terms as ‘‘predictable’’, ‘‘mod-
erately predictable’’ and ‘‘unpredictable’’. The former occur
when the building is unoccupied or the occupants are asleep
(small cyclic loads for example from refrigeration appli-
ances and steady loads from security lighting and items
on standby such as TVs, and VCRs). The remaining con-
sumption is affected by both occupancy and external influ-
ences (e.g. seasonal/weather variations). The ‘‘moderately
predictable’’ consumption relates to the habitual behaviour
patterns of the residents. For example, many people watch
TV programmes at regular times each day/week and switch
lights on/off each weekday morning as they rise and
then leave for work. Lastly ‘‘unpredictable’’ consumption
Fig. 1. Example of an electricity demand profile from an individual household recorded on a 1-min time base [7].
822 G. Wood, M. Newborough / Energy and Buildings 35 (2003) 821–841
describes the majority of domestic energy use; it tends to be
irregular occurring at the users discretion, for example when
the occupant wants to cook food or operate the clothes- or
dish-washing machine.
These three types of consumption may be found in most
households, but this simple classification cannot explain
why energy-consumption and electrical load profiles are
so different between otherwise similar households. Varia-
tions between households are considered to result from
variations in micro-level activities, e.g. differences in the
length of time taken to do each activity, in cooking and home
laundry habits as well as in the availability of appliances [8].
Fechner [9] showed that up to a 50% variation in electricity
consumption occurred between six chefs, all cooking the
same meal with the same equipment. Studies in the United
States, the Netherlands and the UK have estimated that 26–
36% of in-home energy use is due to residents behaviour
[10–12]. Stern [6] argues that energy-consumption can be
reduced by providing the consumer with a more informed
choice about their energy-using practises. In general, chan-
ging energy-using behaviour has a promising potential for
energy conservation [13].
The population is a diverse group of people each having
distinct histories, attitudes, and socio-cultural demographics
(age, sex, education and wealth/income). People also show
differences in their physical/mental health, relationships
with family/friends and amounts of free time, which affect
their energy-using behaviour. Mansouri-Azar [14] estimates
that some 64% of the variation in household energy-con-
sumption can be attributed to socio-economic factors. How-
ever, this scale of variation will always exist in a population
and some causal factors will be very difficult to change. So
methods for reducing the population’s energy-consumption
must account for, and function effectively irrespective of,
these differences. Differences in lifestyle and behaviour can
occur in a relatively short period, compared with the life
expectancy of a domestic appliance, but ‘‘old habits die
hard’’.
To promote energy-conscious behaviour effectively
throughout the population requires a better understanding
of the interface between people and the equipment they use.
Thus, this paper considers (at the individual household level)
how we can reduce energy-consumption with existing end-
use equipment in the residential sector, rather than why
socio-cultural population demographics currently causes
substantial differences in rates of energy use. A particular
focus is placed on the interactive activity of home cooking.
1.1. Behavioural change
Given the diversity of people in the UK population, it
is almost certain that different households have different
levels of knowledge, about energy saving, different attitudes
and different energy-using/saving practices. There is also a
difference in the ability of consumers to carry out proven
energy-saving techniques. Kaiser et al. [15] identifies three
situations in which even though a person has a positive
attitude towards an ecological behaviour, they are prevented
from carrying out this behaviour. For example, people may
be economically constrained—one person may be able to
afford to replace an existing appliance prior to it failing with
a new low-energy version, while another may not and
instead opt for an old second-hand appliance. People may
also have the intent to carry out an ecological behaviour but
may be socially pressurised by other family members or
friends not to do so. Lastly people may be restricted by a lack
of opportunity to carry out an ecological behaviour (e.g. a
person may separate glass bottles from their general waste
but not have a means of transporting them to a bottle bank).
It therefore can be easier for one person or one household to
save energy relative to another. Because of these variations
in energy-saving potential and in energy-saving actions, it is
fundamentally difficult to both predict energy savings in a
given household and to optimise advice as to how best to
reduce energy-consumption. Hence, there is a danger of
over-generalising advice and being too prescriptive, and this
may decrease (rather than increase) interest in energy-saving
among consumers.
Energy consumers may be influenced by antecedent
(general) and consequence (feedback) information. Ante-
cedent information describes practical ways for reducing
energy-consumption and could be in the form of pamphlets
posted through the door, notices, TV programmes or Internet
sites. Consequence information relates directly to a con-
sumer’s behaviour, i.e. it is feedback that provides a user
with information about the action he/she has carried out (or,
more succinctly, knowledge of results) [16–18]. Within the
context of a household, feedback can be for an individual or
for the household as a whole.
2. Antecedent information
Dennis et al. [19] reports that significant energy savings
can be made by providing antecedent information about
methods of energy conservation and cites a 60% reduction in
unnecessary lighting use by putting signs near light
switches. Winnett et al. [20] also reports a 10% reduction
in energy-consumption after subjects had seen a 20-min TV
programme about energy saving. However, an adverse effect
often occurs in antecedent information studies: the Fallback
effect. Defined by Wilhite and Ling [21] as ‘‘the phenom-
enon in which newness of a change causes people to react,
but then that reaction diminishes as the newness wears off’’.
Hayes and Cone [22] found that information alone (a poster
which described ways to reduce electricity consumption
and the energy-consumptions of individual domestic appli-
ances) had a temporary effect in reducing electricity
consumption. Initially after the poster was distributed in
one unit of a student-housing complex, there was a 30%
reduction in electricity usage, but in a subsequent week the
savings had fallen to 9%.
G. Wood, M. Newborough / Energy and Buildings 35 (2003) 821–841 823
Another common problem is that subjects may behave
differently because they know they are being studied. This is
known as the Hawthorne effect [23]. Stern [24] suggests that
the conclusions of research on the responsiveness of con-
sumers to general energy-saving information, is heavily
effected by the Hawthorne effect. Indeed in both of the
studies of Winnett et al. [20] and Dennis et al. [19] all
participants were fully aware that they were being observed
for their energy-saving habits. Thus, in any human study
where useful information is provided, care needs to be taken
to account for the Fallback and Hawthorne effect.
3. Feedback information
Feedback is the alternative way to inform people about
their energy using/saving techniques. Van Houwelingen and
Van Raaij [13] outlined three main functions of feedback.
1. Feedback has a learning function—subjects learn about
the connection between the amount of energy they use
and energy consuming behaviour.
2. Habit formation—subjects put the information they have
learnt into practice and may develop a change in a
routine habit.
3. Internalisation of behaviour—when people develop new
habits after a while they change their attitudes to suit
that new behaviour.
Several studies have considered feedback information, in
which the Hawthorne effect could also have played a large
part in generating reductions in energy-consumption. For
example, Seligman and Darley [25] carried out an early
study in New Jersey, USA in which feedback was tested as a
means of decreasing residential electricity consumption
across a period of 1 month. All subjects were aware that
they were taking part in an energy study. The experiment
was carried out on 29 physically identical three-bedroomed
houses, where the energy-using devices were powered by
electricity (except the hot water, cooker and clothes dryer).
In the 15 feedback group households, information was given
in the form of daily feedback of percentage of predicted
electricity use for that day. Predicted electricity use per
house was based on one previous months temperature-
corrected electricity meter readings. Thus, if the home-
owner’s predicted consumption rate was to use 10 units of
electricity and the household actually used 8 units, then the
display would read 80%. The percentage was displayed on a
board outside the kitchen window. A 10.5% average reduc-
tion in electricity usage was found in the groups that were
exposed to this feedback.
More recent feedback studies have concentrated on giving
informative feedback about actual energy-consumption on
an energy bill. Wilhite and Ling [21] carried out a 3-year
billing study in Oslo, to find out if graphics and increased
actual use billing (rather than averaged billing as used
with direct debits) would reduce electricity consumption.
One thousand two hundred and eighty-six participants
were assigned to one of four groups: a Control Group
who received bills as normal and three information groups.
The latter groups were identified as (1) receiving actual use
bills bi-monthly, (2) receiving graphic bills with ‘‘this year’’
and ‘‘last year’’ information on a bi-monthly basis, and (3) as
for Group 2 plus energy-saving tips on the bill. The base line
for this study lasted for 1 year where all experimental groups
were billed bi-monthly. It was then in the second year that
Groups 2 and 3 received graphical information and graphical
information plus tips, respectively. The average reduction in
electricity consumption for all experimental groups was
10% in the first year and 7.5% in the second year compared
to the Control Group. There were no statistical differences in
consumption between the experimental groups. Since this
study was undertaken, the Norwegian Water and Power
Authority have adopted new billing guidelines requiring
the incorporation of graphical historical feedback plus actual
use bills four times per year [26].
Darby [27] suggests that disseminating energy informa-
tion in a written format such as a bill is not an ideal solution
for reducing the energy-consumption of the UK population.
Firstly it may exclude large numbers of the population, as
approximately 20%1 of the adult UK population has diffi-
culties with basic reading and maths [28]. Also the use of
bills as a method of paying for electricity is becoming
unpopular as other more convenient payment methods
emerge such as direct debits, standing orders, etc. [21].
These tend to be payments in advance, rather than payments
after receiving a service and thus are potentially counter-
productive to stimulating the widespread development of
more energy-efficient practices.
Further studies have employed reinforcement techniques
such as monetary payments and social commendation to
improve feedback results. For example, Seaver and Patter-
son [29] hypothesised that providing information to con-
sumers specifically about their personal fuel–oil for home
heating would lead to lower fuel consumption. They also
considered that commendation, as well as personal feed-
back, would achieve a further reduction in fuel consumption.
The feedback was in the form of a feedback slip, which was
issued every time oil was delivered (see Fig. 2). The
commendation given was a label with the words ‘‘we are
saving oil’’ in red block letters. One hundred and twenty-two
households participated in a 4-month study, 42 of which
formed the Control Group and received no feedback. The
other 80 were split into two groups, one group (35) with just
the feedback and the other (45) with feedback and com-
mendation. The Control Group used 0.146 gal per day. The
Feedback-Only Group showed little reduction in oil usage
using 0.143 gal per day, but the Feedback-and-Commenda-
tion Group showed a significantly reduced consumption of
1 The International Adult Literacy Survey 1994–1998 states that 20% of
16–65-year-old in the UK would have difficulty determining the correct
amount of medicine to give a child from information printed on a package.
824 G. Wood, M. Newborough / Energy and Buildings 35 (2003) 821–841
0.129 gal per day. Seaver and Patterson [29] suggested that
these savings are due to the social recognition of efforts to
save energy.
By studying the effects of different types of information
feedback, conclusions can be reached about which type of
feedback would be the most effective (even if all groups
were affected by the Hawthorne effect). Hayes and Cone
[30] carried out an experiment on four units of an 80 person
student-housing complex in West Virginia, USA. The
experiment tested which would be the most effective method
of reducing energy usage; monetary payments (which
increased in relation to the proportion saved), energy infor-
mation, or daily feedback on consumption. The experiment
lasted 90 days, the first 20 days being used to generate a
comparative baseline. In the remaining time, each of the
units was exposed to various experimental conditions in 1-
week periods. Payments produced immediate and lasting
reductions in consumption, the average reduction being
33%. Feedback also produced an average reduction of
18%. However, when subjects were given information alone,
there was an initial 30% reduction but this fell to a 9%
reduction after 2 weeks. This indicates that feedback is more
effective than antecedent information alone.
It can be seen from these examples that even with
infrequent written feedback, significant energy savings tend
to be achieved. Better results could conceivably be attained
with feedback that is immediate [31]. Importantly Ammons
[32] and Van Raaij and Verhallen [31] state that the most
effective feedback is that which more immediately follows
an action. Stern [24] also argues that it is not the time
difference between days, weeks and months that is impor-
tant, but that the feedback appears immediately after an
action, which attempts to save energy.
3.1. Electronic feedback
All homes have an electricity meter, which is effectively a
continuous energy-consumption indicator (ECI). Generally,
these meters are used by utility companies to measure
consumption and they have not traditionally been designed
as displays to encourage customers to view/monitor their
own energy-consumption. Conventional meters have rela-
tively crude displays, which tend to dissuade householders
from using them as energy-saving tools. A survey carried out
by Meyel [33] indicated the lack of knowledge and under-
standing people have about their energy meters. More than
50% did not know where their gas or electricity meters were
and 45% could not read them. Modern digital metering and
display technology offers a route for displaying energy-
consumption information in a much more understandable
form.
Although the majority of electricity meters are traditional
induction meters (as used for approximately 100 years in the
UK), ‘smart’ metering technologies have been developed
since the 1980s. A smart meter is fully electronic and
permits a variety of functions and displays. Their availability
has increased the potential of using utility meters for envir-
onmental applications [34]. The two smart meter predeces-
sors were the electromechanical Ferraris meter and the
electronic meter. Both meter types have a standard display
of current, power or energy (kWh) usage for the dwelling
and provide consumers with very limited functions and
information about their personal electricity usage [35].
An example of a smart metering technology being applied
to improve understanding of appliance usage patterns is the
POEM metering system, which measures the electricity
consumptions of up to 16 appliances within a home [36].
Data is transferred from the appliance to a main local
collector unit (LCU) using radio waves. Each LCU stores
a meter identity number and the current meter reading and
the central POEM unit collects data from the LCU. The data
is then sent down the telephone line for analysis elsewhere,
when the phone is not in use. This system is purely a data
collection system and the presentation of energy information
to the customer is not its primary function. Brandon and Day
[37] and Marvin et al. [34] suggest that smart meter tech-
nologies could potentially help consumers to use their
energy more effectively. The UK Smart Meter Working
Group concur that the application of smart metering tech-
nologies in-homes has potential to reduce gas and electricity
consumption and carbon emissions as well as domestic fuel
bills [38].
Fig. 2. The feedback slip given to oil consumers at time of oil delivery from Seaver and Patterson [29].
G. Wood, M. Newborough / Energy and Buildings 35 (2003) 821–841 825
With appropriate display technology, it is feasible to
provide visible and comprehensive information during an
energy-using event. McClelland and Cook [39] carried out
one of the earliest studies in Polks Landing, Carrboro, North
Carolina, USA, by employing an electronic device to show
consumers electricity information. Monitors were placed
inside 25 new houses, as they were built and the participating
households were observed for 11 months without the knowl-
edge of the owners. The device was named the Fitch Energy
Monitor (FEM) and measured total electricity usage (kWh)
from the homes mains supply. The electricity usage was
displayed in cents per kWh (where electricity price could be
set and reset if needed) and was displayed alternately with
the time of day. It is unclear where the display panel was
placed inside the home or how frequently the display was
updated, but it appears that it was accessible throughout the
day. McClelland and Cook [39] reported 12% less electricity
usage in households with a FEM compared with the Control
Group of 76 houses without the FEM. This result is parti-
cularly encouraging as the participants were not advised or
otherwise encouraged to save energy and so the Hawthorne
effect was minimised in this study.
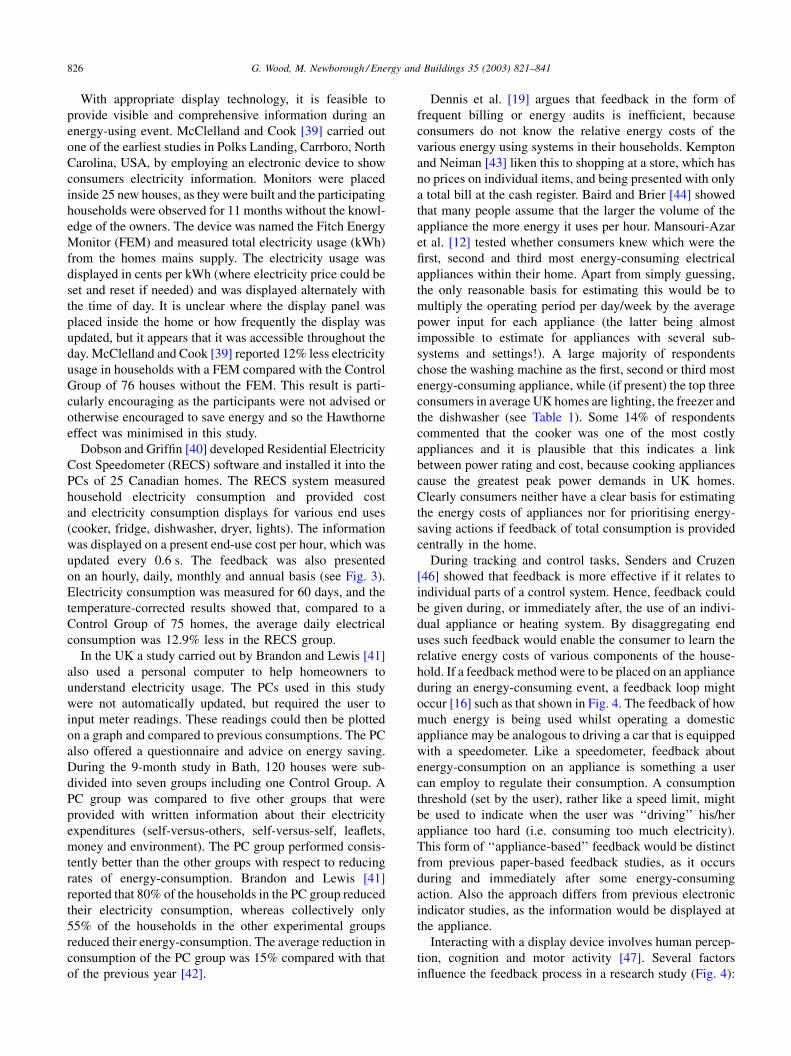
Dobson and Griffin [40] developed Residential Electricity
Cost Speedometer (RECS) software and installed it into the
PCs of 25 Canadian homes. The RECS system measured
household electricity consumption and provided cost
and electricity consumption displays for various end uses
(cooker, fridge, dishwasher, dryer, lights). The information
was displayed on a present end-use cost per hour, which was
updated every 0.6 s. The feedback was also presented
on an hourly, daily, monthly and annual basis (see Fig. 3).
Electricity consumption was measured for 60 days, and the
temperature-corrected results showed that, compared to a
Control Group of 75 homes, the average daily electrical
consumption was 12.9% less in the RECS group.
In the UK a study carried out by Brandon and Lewis [41]
also used a personal computer to help homeowners to
understand electricity usage. The PCs used in this study
were not automatically updated, but required the user to
input meter readings. These readings could then be plotted
on a graph and compared to previous consumptions. The PC
also offered a questionnaire and advice on energy saving.
During the 9-month study in Bath, 120 houses were sub-
divided into seven groups including one Control Group. A
PC group was compared to five other groups that were
provided with written information about their electricity
expenditures (self-versus-others, self-versus-self, leaflets,
money and environment). The PC group performed consis-
tently better than the other groups with respect to reducing
rates of energy-consumption. Brandon and Lewis [41]
reported that 80% of the households in the PC group reduced
their electricity consumption, whereas collectively only
55% of the households in the other experimental groups
reduced their energy-consumption. The average reduction in
consumption of the PC group was 15% compared with that
of the previous year [42].
Dennis et al. [19] argues that feedback in the form of
frequent billing or energy audits is inefficient, because
consumers do not know the relative energy costs of the
various energy using systems in their households. Kempton
and Neiman [43] liken this to shopping at a store, which has
no prices on individual items, and being presented with only
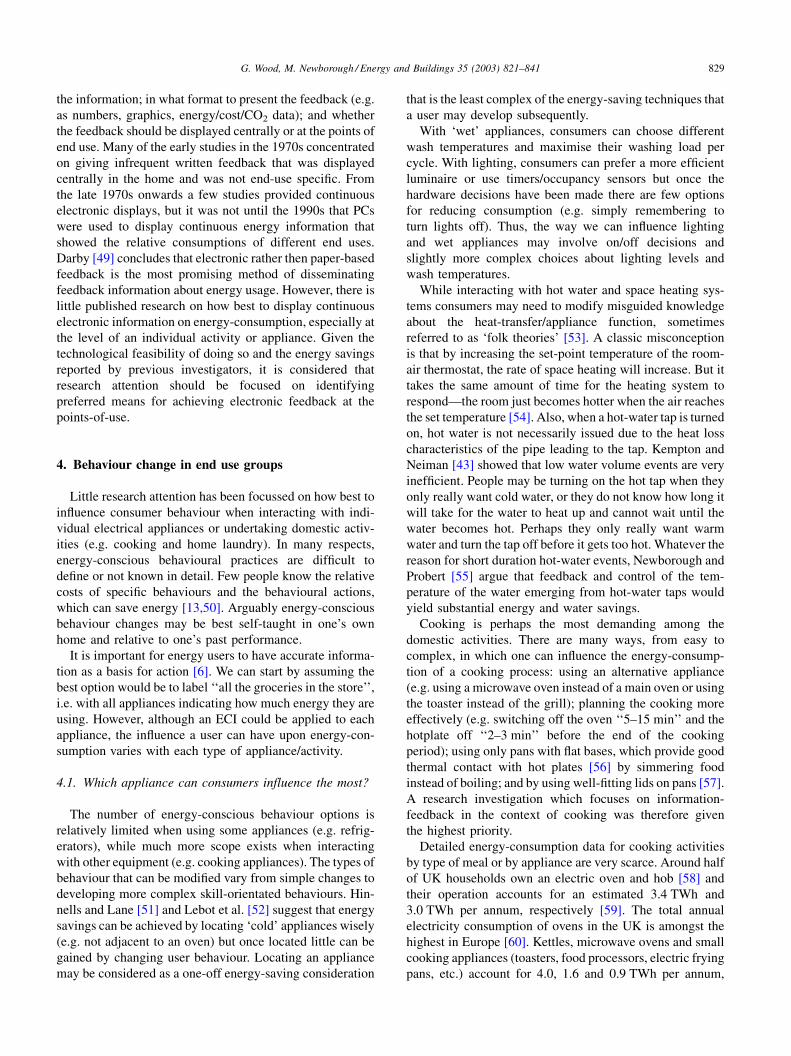
a total bill at the cash register. Baird and Brier [44] showed
that many people assume that the larger the volume of the
appliance the more energy it uses per hour. Mansouri-Azar
et al. [12] tested whether consumers knew which were the
first, second and third most energy-consuming electrical
appliances within their home. Apart from simply guessing,
the only reasonable basis for estimating this would be to
multiply the operating period per day/week by the average
power input for each appliance (the latter being almost
impossible to estimate for appliances with several sub-
systems and settings!). A large majority of respondents
chose the washing machine as the first, second or third most
energy-consuming appliance, while (if present) the top three
consumers in average UK homes are lighting, the freezer and
the dishwasher (see Table 1). Some 14% of respondents
commented that the cooker was one of the most costly
appliances and it is plausible that this indicates a link
between power rating and cost, because cooking appliances
cause the greatest peak power demands in UK homes.
Clearly consumers neither have a clear basis for estimating
the energy costs of appliances nor for prioritising energy-
saving actions if feedback of total consumption is provided
centrally in the home.
During tracking and control tasks, Senders and Cruzen
[46] showed that feedback is more effective if it relates to
individual parts of a control system. Hence, feedback could
be given during, or immediately after, the use of an indivi-
dual appliance or heating system. By disaggregating end
uses such feedback would enable the consumer to learn the
relative energy costs of various components of the house-
hold. If a feedback method were to be placed on an appliance
during an energy-consuming event, a feedback loop might
occur [16] such as that shown in Fig. 4. The feedback of how
much energy is being used whilst operating a domestic
appliance may be analogous to driving a car that is equipped
with a speedometer. Like a speedometer, feedback about
energy-consumption on an appliance is something a user
can employ to regulate their consumption. A consumption
threshold (set by the user), rather like a speed limit, might
be used to indicate when the user was ‘‘driving’’ his/her
appliance too hard (i.e. consuming too much electricity).
This form of ‘‘appliance-based’’ feedback would be distinct
from previous paper-based feedback studies, as it occurs
during and immediately after some energy-consuming
action. Also the approach differs from previous electronic
indicator studies, as the information would be displayed at
the appliance.
Interacting with a display device involves human percep-
tion, cognition and motor activity [47]. Several factors
influence the feedback process in a research study (Fig. 4):
826 G. Wood, M. Newborough / Energy and Buildings 35 (2003) 821–841
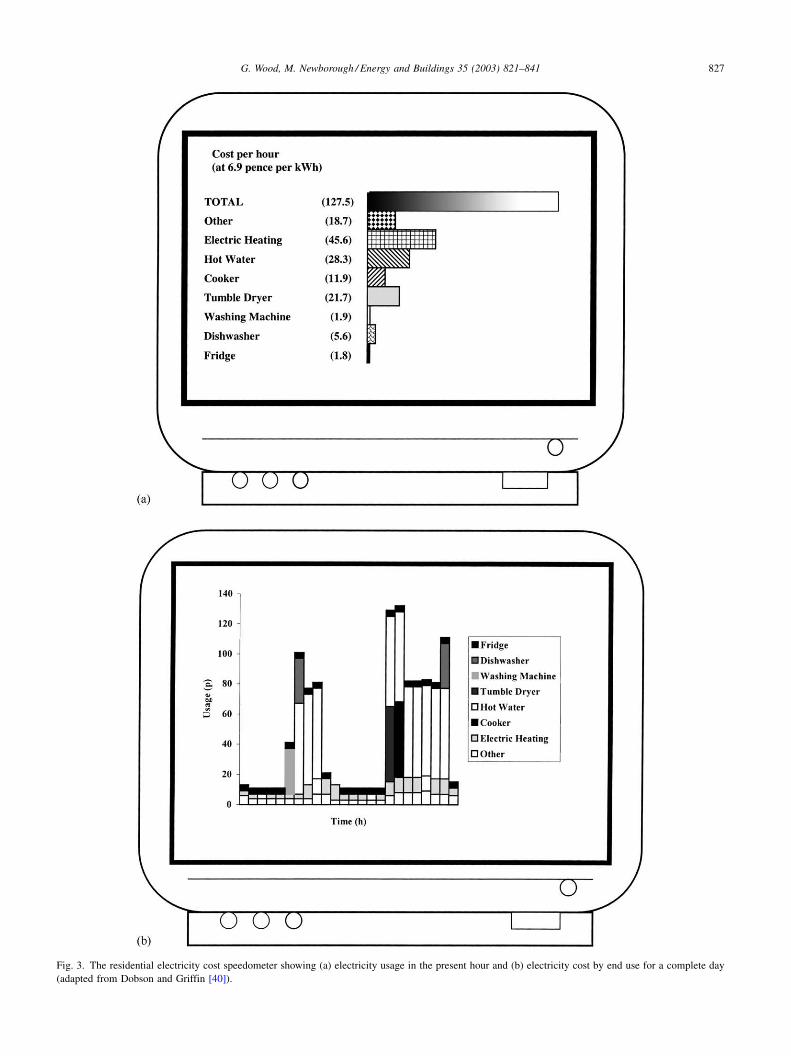
Fig. 3. The residential electricity cost speedometer showing (a) electricity usage in the present hour and (b) electricity cost by end use for a complete day
(adapted from Dobson and Griffin [40]).
G. Wood, M. Newborough / Energy and Buildings 35 (2003) 821–841 827
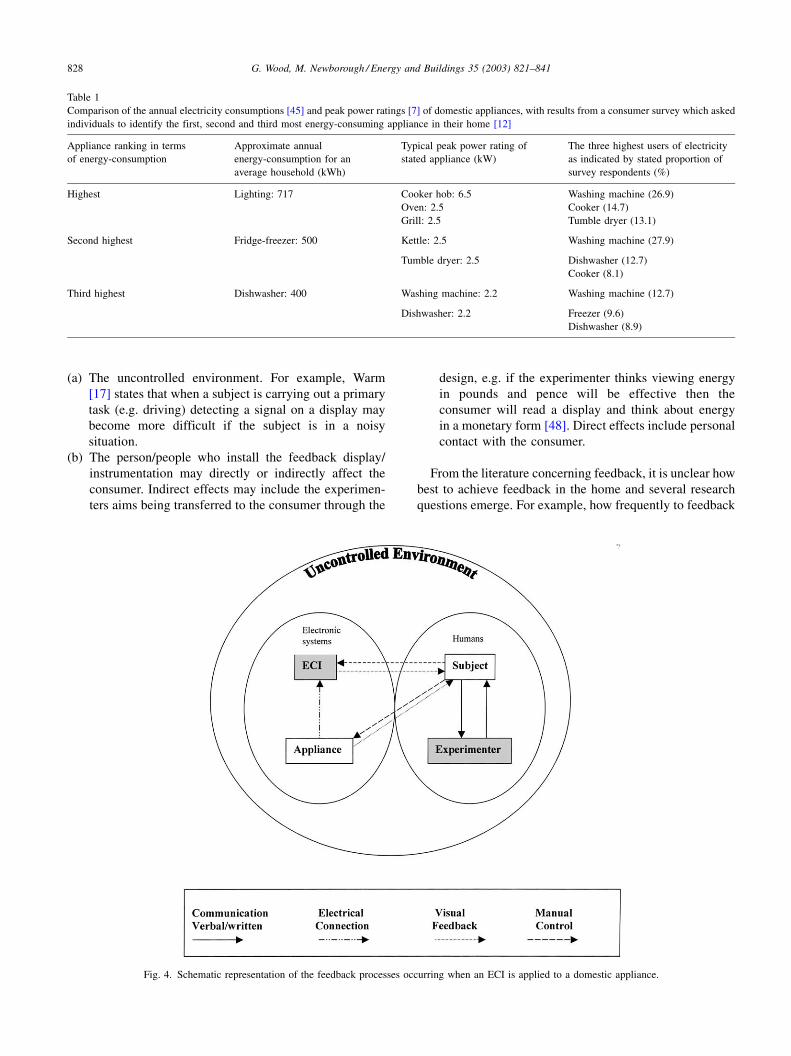
(a) The uncontrolled environment. For example, Warm
[17] states that when a subject is carrying out a primary
task (e.g. driving) detecting a signal on a display may
become more difficult if the subject is in a noisy
situation.
(b) The person/people who install the feedback display/
instrumentation may directly or indirectly affect the
consumer. Indirect effects may include the experimen-
ters aims being transferred to the consumer through the
design, e.g. if the experimenter thinks viewing energy
in pounds and pence will be effective then the
consumer will read a display and think about energy
in a monetary form [48]. Direct effects include personal
contact with the consumer.
From the literature concerning feedback, it is unclear how
best to achieve feedback in the home and several research
questions emerge. For example, how frequently to feedback
Table 1
Comparison of the annual electricity consumptions [45] and peak power ratings [7] of domestic appliances, with results from a consumer survey which asked
individuals to identify the first, second and third most energy-consuming appliance in their home [12]
Appliance ranking in terms
of energy-consumption
Approximate annual
energy-consumption for an
average household (kWh)
Typical peak power rating of
stated appliance (kW)
The three highest users of electricity
as indicated by stated proportion of
survey respondents (%)
Highest Lighting: 717 Cooker hob: 6.5 Washing machine (26.9)
Oven: 2.5 Cooker (14.7)
Grill: 2.5 Tumble dryer (13.1)
Second highest Fridge-freezer: 500 Kettle: 2.5 Washing machine (27.9)
Tumble dryer: 2.5 Dishwasher (12.7)
Cooker (8.1)
Third highest Dishwasher: 400 Washing machine: 2.2 Washing machine (12.7)
Dishwasher: 2.2 Freezer (9.6)
Dishwasher (8.9)
Fig. 4. Schematic representation of the feedback processes occurring when an ECI is applied to a domestic appliance.
828 G. Wood, M. Newborough / Energy and Buildings 35 (2003) 821–841
the information; in what format to present the feedback (e.g.
as numbers, graphics, energy/cost/CO2 data); and whether
the feedback should be displayed centrally or at the points of
end use. Many of the early studies in the 1970s concentrated
on giving infrequent written feedback that was displayed
centrally in the home and was not end-use specific. From
the late 1970s onwards a few studies provided continuous
electronic displays, but it was not until the 1990s that PCs
were used to display continuous energy information that
showed the relative consumptions of different end uses.
Darby [49] concludes that electronic rather then paper-based
feedback is the most promising method of disseminating
feedback information about energy usage. However, there is
little published research on how best to display continuous
electronic information on energy-consumption, especially at
the level of an individual activity or appliance. Given the
technological feasibility of doing so and the energy savings
reported by previous investigators, it is considered that
research attention should be focused on identifying
preferred means for achieving electronic feedback at the
points-of-use.
4. Behaviour change in end use groups
Little research attention has been focussed on how best to
influence consumer behaviour when interacting with indi-
vidual electrical appliances or undertaking domestic activ-
ities (e.g. cooking and home laundry). In many respects,
energy-conscious behavioural practices are difficult to
define or not known in detail. Few people know the relative
costs of specific behaviours and the behavioural actions,
which can save energy [13,50]. Arguably energy-conscious
behaviour changes may be best self-taught in one’s own
home and relative to one’s past performance.
It is important for energy users to have accurate informa-
tion as a basis for action [6]. We can start by assuming the
best option would be to label ‘‘all the groceries in the store’’,
i.e. with all appliances indicating how much energy they are
using. However, although an ECI could be applied to each
appliance, the influence a user can have upon energy-con-
sumption varies with each type of appliance/activity.
4.1. Which appliance can consumers influence the most?
The number of energy-conscious behaviour options is
relatively limited when using some appliances (e.g. refrig-
erators), while much more scope exists when interacting
with other equipment (e.g. cooking appliances). The types of
behaviour that can be modified vary from simple changes to
developing more complex skill-orientated behaviours. Hin-
nells and Lane [51] and Lebot et al. [52] suggest that energy
savings can be achieved by locating ‘cold’ appliances wisely
(e.g. not adjacent to an oven) but once located little can be
gained by changing user behaviour. Locating an appliance
may be considered as a one-off energy-saving consideration
that is the least complex of the energy-saving techniques that
a user may develop subsequently.
With ‘wet’ appliances, consumers can choose different
wash temperatures and maximise their washing load per
cycle. With lighting, consumers can prefer a more efficient
luminaire or use timers/occupancy sensors but once the
hardware decisions have been made there are few options
for reducing consumption (e.g. simply remembering to
turn lights off). Thus, the way we can influence lighting
and wet appliances may involve on/off decisions and
slightly more complex choices about lighting levels and
wash temperatures.
While interacting with hot water and space heating sys-
tems consumers may need to modify misguided knowledge
about the heat-transfer/appliance function, sometimes
referred to as ‘folk theories’ [53]. A classic misconception
is that by increasing the set-point temperature of the room-
air thermostat, the rate of space heating will increase. But it
takes the same amount of time for the heating system to
respond—the room just becomes hotter when the air reaches
the set temperature [54]. Also, when a hot-water tap is turned
on, hot water is not necessarily issued due to the heat loss
characteristics of the pipe leading to the tap. Kempton and
Neiman [43] showed that low water volume events are very
inefficient. People may be turning on the hot tap when they
only really want cold water, or they do not know how long it
will take for the water to heat up and cannot wait until the
water becomes hot. Perhaps they only really want warm
water and turn the tap off before it gets too hot. Whatever the
reason for short duration hot-water events, Newborough and
Probert [55] argue that feedback and control of the tem-
perature of the water emerging from hot-water taps would
yield substantial energy and water savings.
Cooking is perhaps the most demanding among the
domestic activities. There are many ways, from easy to
complex, in which one can influence the energy-consump-
tion of a cooking process: using an alternative appliance
(e.g. using a microwave oven instead of a main oven or using
the toaster instead of the grill); planning the cooking more
effectively (e.g. switching off the oven ‘‘5–15 min’’ and the
hotplate off ‘‘2–3 min’’ before the end of the cooking
period); using only pans with flat bases, which provide good
thermal contact with hot plates [56] by simmering food
instead of boiling; and by using well-fitting lids on pans [57].
A research investigation which focuses on information-
feedback in the context of cooking was therefore given
the highest priority.
Detailed energy-consumption data for cooking activities
by type of meal or by appliance are very scarce. Around half
of UK households own an electric oven and hob [58] and
their operation accounts for an estimated 3.4 TWh and
3.0 TWh per annum, respectively [59]. The total annual
electricity consumption of ovens in the UK is amongst the
highest in Europe [60]. Kettles, microwave ovens and small
cooking appliances (toasters, food processors, electric frying
pans, etc.) account for 4.0, 1.6 and 0.9 TWh per annum,
G. Wood, M. Newborough / Energy and Buildings 35 (2003) 821–841 829
respectively. Excluding small cooking appliances, a total of
around 12 TWh is used per annum by domestic electrical
cooking appliances.
5. Field investigation
A field investigation was carried out for electric cooking
to address how consumers would react to consumption
information being displayed electronically at the points-
of-use, and further whether the associated energy savings
would be significantly different from antecedent energy-
saving information [61]. The main objectives were to (i)
collect detailed energy-consumption data relating to cook-
ing behaviour; and (ii) to develop and assess three methods
of influencing end users cooking habits, namely:
(1) an appropriate paper-based ‘‘Information Pack’’;
(2) electronic ‘‘energy-consumption indicators’’ for elec-
tric cookers; and
(3) methods (1) and (2) simultaneously.
Suitable households were identified from a postal survey
of over 1000 homes. As the necessary energy monitoring
equipment could be applied relatively easily to free-standing
electric cookers, homes possessing these were identified
for further consideration. Of the 230 respondents, 44 were
willing and appropriately equipped to participate in the
study.
The participants were divided into groups of similar
number and household size and these were referred to as
(1) the Control Group, (2) the Information Pack Group, (3)
the Energy-Consumption Indicator Group, and (4) the Infor-
mation-plus-ECI Group. The monitoring phase spanned 18
calendar months. Group 1 homes were monitored across a
period of 12 months, while those in the three other groups
(associated with methods 1–3 above) were each monitored
for a minimum period of 4 months. For Groups 1–3, the
baseline consumption data was obtained across a period of 2
months prior to the introduction of the information-transfer
methods, and then monitoring was continued for a further
minimum period of 2 months.
The principal functions of Group 1 were to establish a
quantitative understanding of energy-consumption and to
provide a basis for assessing seasonal trends in electricity
use for cooking, while that of Group 2, 3 or 4 was to test an
information-transfer method. The respective groups con-
sisted of 12, 12, 10 and 10 households. Three households
with only one occupant were later excluded from Group 1, as
the electricity consumption for cooking in these three single-
person households was only 0.40 kWh per day (compared
with an average of 1.36 kWh per day for the other 9 houses)
and the number of days the cooker was not used amounted to
156 days per annum (compared with an average of 41 days
among the other nine households).
The study was designed to minimise Hawthorne effects—
the participants received no direct instructions to monitor or
save energy and were approached as little as possible at the
points of installation and downloading. Once the households
had been approached and had agreed to take part in the
monitoring programme, an initial visit was made to each
participating household with a qualified electrician. During
this, the logging equipment was installed, the resistances of
each heating circuit within the cooker were measured, and
monitoring was initiated. The electricity consumption of the
cooker was measured every 8 s, averages were logged every
3 min and the consumption data was downloaded to laptop
PC via further visits at two monthly intervals. Once the data
collection process was complete for that house, a final visit
(with the electrician) was made to return the electrical
connections to their original status.
After the data had been collected the people who had been
involved in the study were asked to comment on the study.
The two questions asked were (a) had they found the
information they received useful? and (b) how had they
reduced their energy-consumption/achieved their savings?
5.1. Design of the Information Pack
The Information Pack was based on the findings of a
literature review, a cooking behaviour questionnaire and a
laboratory evaluation to establish the typical energy require-
ments of food-preparation practices. The pack was presented
as a 17 page, laminated colour A4-sized booklet divided into
four sections.
The first section of the Information Pack concentrated on
information about the electricity consumption of cooking
appliances and how they worked. The introduction to Sec-
tion 1 described what a kWh was, how much electricity the
average household uses and what proportion of this elec-
tricity was used for cooking. Section 1 then went on to
explain in layman terms, how much energy is used by
different cooking appliances. Particular attention was given
to hotplates, electric ovens and microwave ovens. Consump-
tion information was given for various settings and cooking
times for these three appliances. Although ranges of appli-
ance power ratings were given, the reader would still have to
know the power rating of his/her appliance to estimate its
electricity consumption—the booklet could only serve as a
guide. The last part of Section 1 also mentioned briefly how
a toaster, grill, kettle, slow cooker and deep-fat fryer worked.
Section 2 was based on electricity saving tips. The tips
centred on which appliance used the least electricity (e.g.
‘‘use a toaster rather than a grill’’); ways to reduce time spent
cooking (e.g. ‘‘try switching off hotplates 2–3 min early’’);
matching the size of the food portion and the pan to the
‘ring’; not using unnecessary amounts of water in kettles and
pans; simmering food not boiling it; not opening the oven
while in use and ensuring the oven door had a good seal.
The third section identified electricity consumption values
for some typical meals/foods and tables presented kWh data
for five common types of cooking operation (roast chicken;
roast chicken, potatoes and carrots; potatoes only; chicken
830 G. Wood, M. Newborough / Energy and Buildings 35 (2003) 821–841
stew casserole and ready-made chilled foods. The tables also
facilitated comparisons where alternative methods of cook-
ing might be applied (e.g. baking in a microwave oven and
baking in a conventional oven).
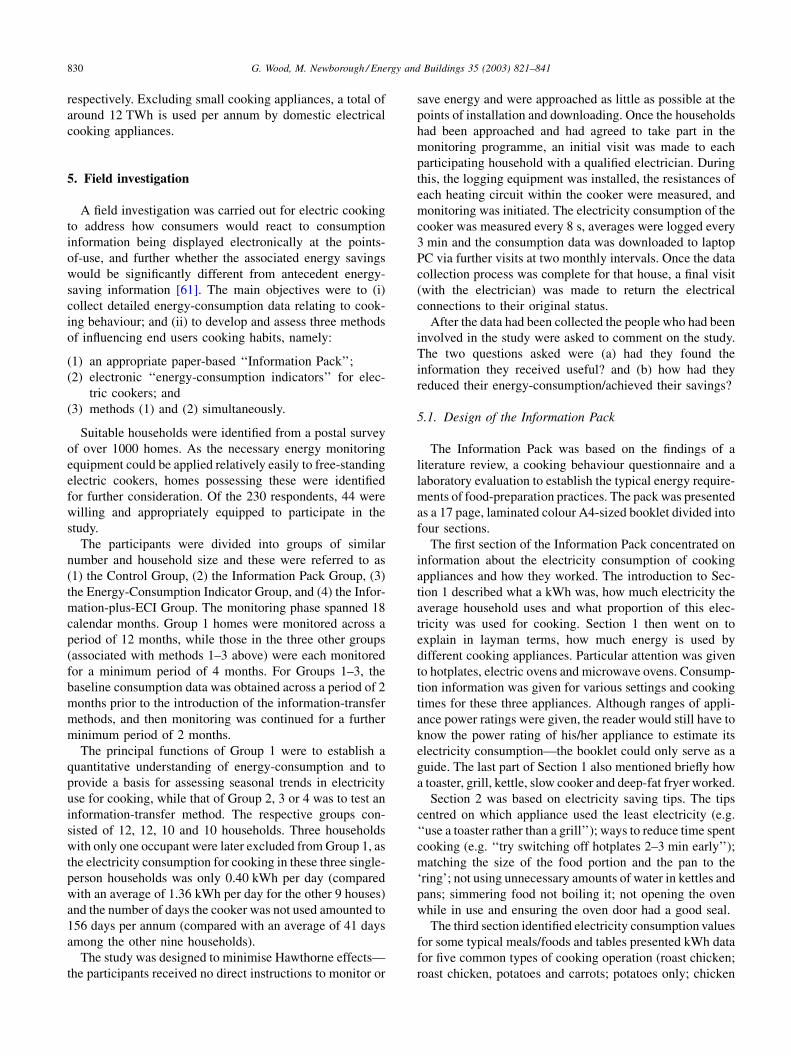
Lastly Section 4 provided a table, which gave the user
an opportunity to estimate the electricity consumption of
cooking appliances in their home. Power ratings of the
various cooking devices were shown alongside various
usage times and the corresponding electricity consumption
per operation. There was a space for subjects to make their
own estimation of total electricity consumption per week
(Table 2). (Table 2 demonstrates the difficulty in presenting
comprehensible written information about the energy-con-
sumption of various devices. Information cannot be pro-
vided that is specific to the householder’s appliance. Written
information can prompt a person to think about an energy-
using event, but there is a danger that by attempting to be
comprehensive about a single domestic activity the informa-
tion itself becomes too complex to hold the interest of the
average reader.)
5.2. Design of the energy-consumption indicator
There is a plethora of design guidelines for general
interface design much of which is based on cockpit design
[62] and PC interface design [63]. However, Lohr [64]
extracts three main principles from the available informa-
tion.
(a) Group the sections (interface elements) so that the
learner has an overall idea of what the environment is
like.
(b) Make the background and foreground distinctions clear
so that the learner will attend to the signal.
(c) Organise individual elements into comprehensible
sections.
When designing the energy-consumption indicator (ECI)
these general design objectives were considered. The display
had to be visible whilst cooking, attention grabbing and
easily comprehensible, well ordered yet practical and cost
effective. (The detailed design aspects of the ECI are
described in Appendix A.)
The most important information was expected to be the
consumption information for the current event that the
consumer was carrying out. There are perhaps three types
of interacting behaviour that consumers might adopt when
given an ECI:
1. A type of vigilance task, which occurs especially when
the user is still trying to learn or understand how the ECI
responds to his/her actions. For example, putting the
food on to cook and focusing mainly on the ECI display
to observe any changes that might occur.
2. Whilst carrying out a primary cooking task, the user
may occasionally carry out the secondary task of
glancing at the ECI.
3. Although people can for example drive and talk at the
same time it becomes very difficult to take in two stimuli
via the same sense, e.g. it is difficult to listen to two
conversations at the same time. Bainbridge [65] suggests
that it is therefore better to assume that people cannot do
two similar tasks at the same time (i.e. observe/prepare
food and watch the ECI). This might mean that some
Table 2
Section 4 of the Information Pack showing the power rating, typical usage (in min) and electricity consumption of various cooking appliances
Appliance Typical power
rating (W)
Typical usage
(min)
Electricity usage per
operation (kWh)
Electricity consumption
per operation
Typical usage in
your home per week
Your cooking electricity
consumption per week
Hot plates (ring)
Small ring 1000–1500 45 1.0
Large ring 1600–3000 15 0.6
Main oven
Low setting 1750–2500 120 1.2
High setting 90 2.0
Second/top-oven 1850–2400 60 1.5
Microwave oven
Low setting 1000–1500 15–45 0.1–0.4
High setting 10–45 0.02–0.9
Grill 1400–2900 15–30 0.4–1.5
Toaster 800–950 2–10 0.02–0.2
Electric kettle 1800–2400 3–5 0.2
Slow cooker 100–150 360–480 1.0
Deep fat fryer 1800–2000 10–30 0.8–1.5
Food processor 150–300 3–10 0.01–0.05
Electricity consumption of cooking appliances. For comparison, the approximate consumption figures, power ratings, and typical operating times for a range
of cooking appliances are given in the table above. Use this information, consider the typical usage patterns of cooking appliances in your home, and estimate
their weekly electricity consumption. The exact consumption will depend on the type of appliance, and the food being cooked.
G. Wood, M. Newborough / Energy and Buildings 35 (2003) 821–841 831

people may choose to look at the display only after the
cooking event had finished. Similarly, it is plausible that
the user may simply want an infrequent feedback option
in order to observe daily or weekly consumption when
convenient to do so, and then analyse the energy-
consumption on a more systematic ‘accounting’ basis.
To cater for behaviours (1) and (2), a frequently updated
‘This Event’ display was incorporated which showed the
current electricity consumption. To facilitate behaviour (3),
the ECI needed to enable the user to note the final energy
usage of the task and then clear the screen for the next task.
Therefore, the This Event display was designed with a reset
button. This display was positioned towards the top left
region of the ECI as this was considered the most likely to
be read first. In addition, daily and weekly consumption
information was also provided by the ECI. It was termed
‘Today–Yesterday’ and ‘This Week–Last Week’, so that the
most recent data was positioned nearest the top of the ECI
(Fig. 5). The Today display (which was the running total for
that day) was placed directly under the This Event display
and could be compared to the Yesterday display (which
showed the previous day’s totals electricity consumption).
The This Week display (which total all electricity usage for
that week excluding today) was placed to the right of
the Today display and this could be compared to the Last
Week display (which identified the total electricity usage
for the previous week). A tan coloured line also linked the
This Event, Today and This Week displays. In this way, it
was considered that the user might be drawn to look at
further comparative displays after they had looked at energy
usage for the current event.
It was decided that the ECI should display energy-con-
sumption in kWh to two decimal places (see Appendix A).
Energy values were derived from a current transformer,
which was attached to the mains supply cable to the cooker
and connected to the ECI. A mean voltage of 240 V was
assumed in the energy calculation (E ¼ VIt), although in
practice the voltage will vary with location and fluctuate
with time. (Accordingly, the potential inclusion of ‘thou-
sandths’ of 1 kWh in the display was inappropriate as this
small amount of power would be spurious.)
The final ECI display unit is shown in Fig. 5. It is a plastic
20 cm � 14 cm inch display unit, with five identical LCD
displays (of 4.5 cm � 1.75 cm) each surrounded by yellow
borders. The displays indicate energy-consumption for This
Event, This Week, Last Week, Today and Yesterday. The
This Event display is the most prominent and has an adjacent
red button for zeroing purposes.
6. Results
For Group 1 (i.e. nine non-single-person households),
taking summer consumption as the base line, the average
daily consumption (for days that the cooker was used) was
Fig. 5. The energy-consumption indicator.
832 G. Wood, M. Newborough / Energy and Buildings 35 (2003) 821–841
11, 9 and 22% higher in spring, autumn and winter, respec-
tively. The relative change in consumption with seasonal
quarter varied among the participating homes, but 8 of the 9
non-single-person households showed a significant increase
in winter.
Clearly, it is difficult to define exactly when the seasons
change and how external conditions influence users of
cooking appliances, but the average number of days per
season when the cooker was not used varied only slightly;
e.g. from 10 days (�11%) in winter to 14 days (�16%)
in summer. Overall, it appears that the average daily
energy-consumption fell into three broad categories
‘‘low’’ (July and August), ‘‘intermediate’’ (February until
June and October and November) and ‘‘high’’ (December
and January). For the intermediate level, the average daily
consumption was surprisingly consistent lying in the range
1.52–1.56 kWh for 7 of the 12 months.
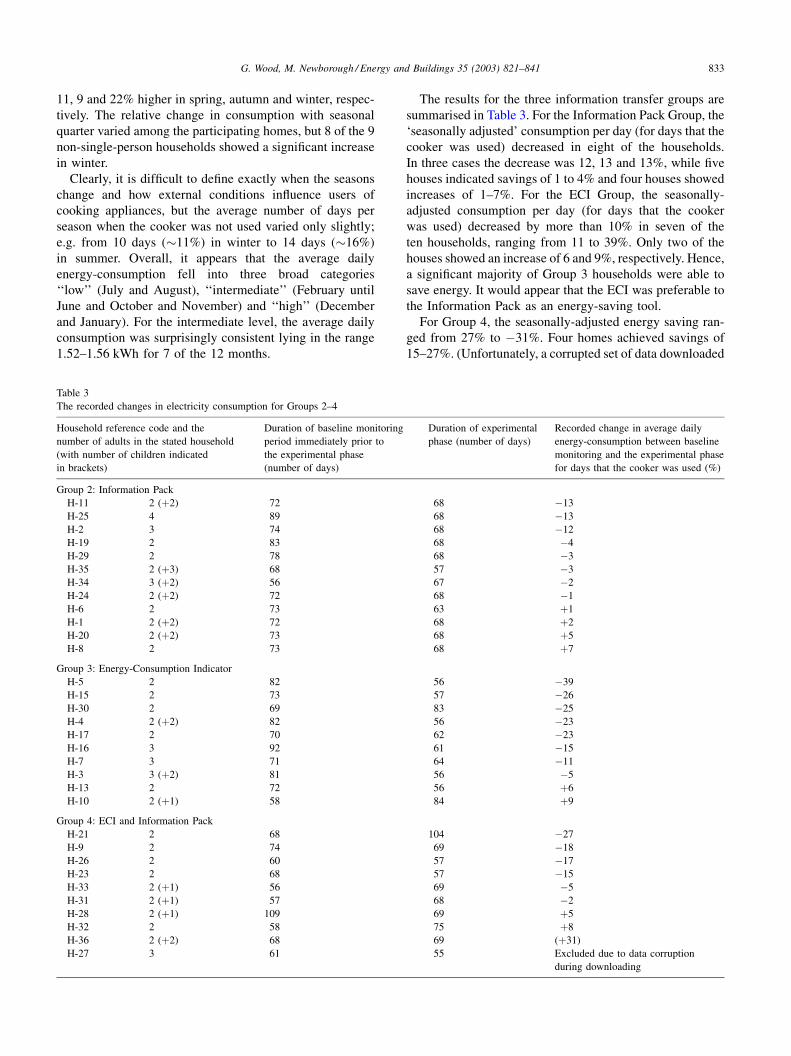
The results for the three information transfer groups are
summarised in Table 3. For the Information Pack Group, the
‘seasonally adjusted’ consumption per day (for days that the
cooker was used) decreased in eight of the households.
In three cases the decrease was 12, 13 and 13%, while five
houses indicated savings of 1 to 4% and four houses showed
increases of 1–7%. For the ECI Group, the seasonally-
adjusted consumption per day (for days that the cooker
was used) decreased by more than 10% in seven of the
ten households, ranging from 11 to 39%. Only two of the
houses showed an increase of 6 and 9%, respectively. Hence,
a significant majority of Group 3 households were able to
save energy. It would appear that the ECI was preferable to
the Information Pack as an energy-saving tool.
For Group 4, the seasonally-adjusted energy saving ran-
ged from 27% to �31%. Four homes achieved savings of
15–27%. (Unfortunately, a corrupted set of data downloaded
Table 3
The recorded changes in electricity consumption for Groups 2–4
Household reference code and the
number of adults in the stated household
(with number of children indicated
in brackets)
Duration of baseline monitoring
period immediately prior to
the experimental phase
(number of days)
Duration of experimental
phase (number of days)
Recorded change in average daily
energy-consumption between baseline
monitoring and the experimental phase
for days that the cooker was used (%)
Group 2: Information Pack
H-11 2 (þ2) 72 68 �13
H-25 4 89 68 �13
H-2 3 74 68 �12
H-19 2 83 68 �4
H-29 2 78 68 �3
H-35 2 (þ3) 68 57 �3
H-34 3 (þ2) 56 67 �2
H-24 2 (þ2) 72 68 �1
H-6 2 73 63 þ1
H-1 2 (þ2) 72 68 þ2
H-20 2 (þ2) 73 68 þ5
H-8 2 73 68 þ7
Group 3: Energy-Consumption Indicator
H-5 2 82 56 �39
H-15 2 73 57 �26
H-30 2 69 83 �25
H-4 2 (þ2) 82 56 �23
H-17 2 70 62 �23
H-16 3 92 61 �15
H-7 3 71 64 �11
H-3 3 (þ2) 81 56 �5
H-13 2 72 56 þ6
H-10 2 (þ1) 58 84 þ9
Group 4: ECI and Information Pack
H-21 2 68 104 �27
H-9 2 74 69 �18
H-26 2 60 57 �17
H-23 2 68 57 �15
H-33 2 (þ1) 56 69 �5
H-31 2 (þ1) 57 68 �2
H-28 2 (þ1) 109 69 þ5
H-32 2 58 75 þ8
H-36 2 (þ2) 68 69 (þ31)
H-27 3 61 55 Excluded due to data corruption
during downloading
G. Wood, M. Newborough / Energy and Buildings 35 (2003) 821–841 833
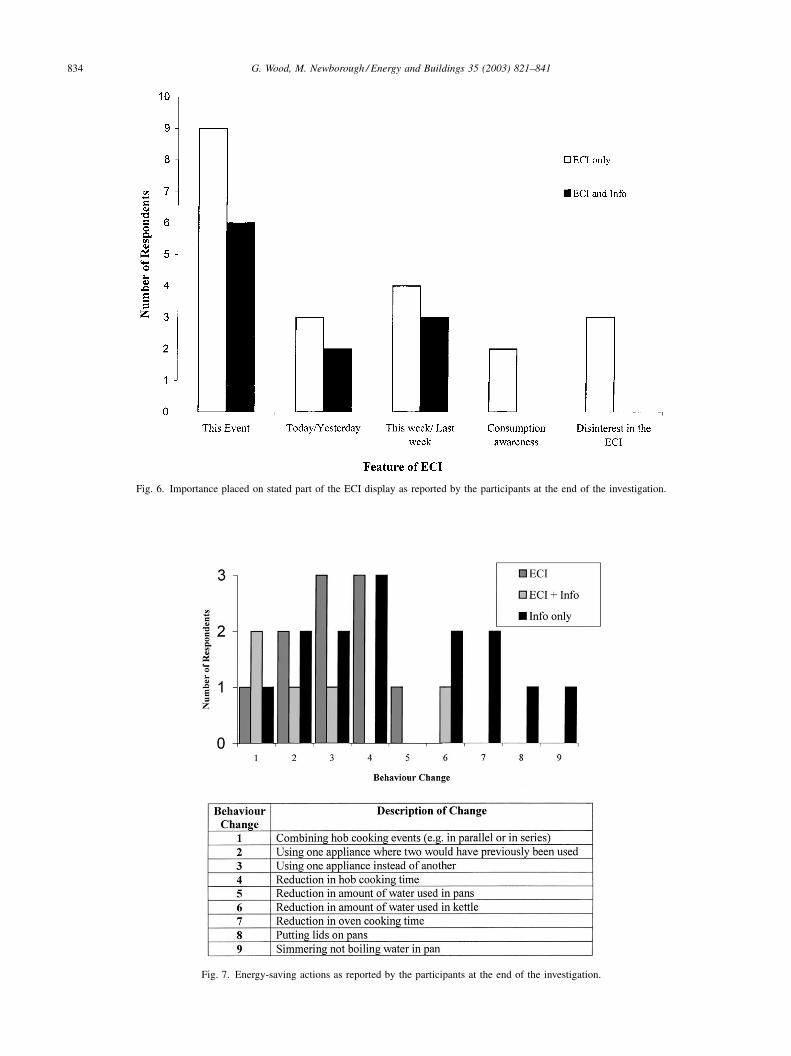
Fig. 6. Importance placed on stated part of the ECI display as reported by the participants at the end of the investigation.
Fig. 7. Energy-saving actions as reported by the participants at the end of the investigation.
834 G. Wood, M. Newborough / Energy and Buildings 35 (2003) 821–841

from one house reduced this group to nine and the total of
the surveyed information-transfer households from 32 to 31.
Also the increase in consumption of 31% in one case
should be treated with caution as this was due to a distinct
lifestyle change that occurred during monitoring.) There
does not appear to have been a compound effect from
providing both ECIs and Information Packs to households
in this group.
The post-experimental survey of the participants pro-
duced many comments. Some participants said that they
had found the study useful but did not go into any detail
about what they did with the ECI or Information Pack.
For Group 2, 80% of respondents said that they used the
energy-saving tips the most. For Group 3, Fig. 6 shows the
number of specific comments about the displays on the ECI.
It can be seen that, in the ECI and Information-plus-ECI
Groups, the This Event display was mentioned the most. If
recall of this part of the ECI was high, then this may suggest
that the participants were attracted mostly to this display
and/or the learning function was greatest from this part of
the ECI.
Figs. 7 and 8 show the types of behaviour that people said
they had modified as a result of participating in the study.
It can be seen that the ECI Group recalled five methods of
behaviour change while the Information-plus-ECI Group
recalled four. However, the Information Pack Group
recalled the maximum number, i.e. eight ways in which
they changed their behaviour. The types of behaviour
specific to Group 2 were reduction of oven cooking time,
putting lids on pans and simmering water in pans instead
of boiling it.
The Information Pack Group seemed to be aware of more
complex energy-saving behaviours as well as those beha-
viours taken up by the other two groups. However, although
this group gained greater knowledge of energy-saving tech-
niques they did not put these behaviours into practice as
much as the other groups. This suggests that the ECI
increases motivation to carry out energy-saving behaviours
compared with antecedent information alone.
7. Conclusions and further recommendations
The literature review and the field study undertaken in this
investigation indicate the potential for applying information-
feedback for reducing rates of energy-consumption in the
home. The findings concerning cooking suggest that the use
of electronic feedback indicators deserves further attention
and optimisation for this domestic activity. The study raises
several questions for further research, but also reveals some
interesting data concerning energy use in cooking.
From Group 1 data, the main parameters influencing the
annual energy-consumptions for domestic cooking appear to
be household size, the relative use of microwave ovens, the
proportion of large meals (e.g. roast dinners) prepared and
the number of days per annum that the cooking equipment is
used. The average daily demand varies with time (e.g. it was
35% greater in winter than in summer and the average
Sunday value was nearly twice that of the average weekday
value). To better understand the relative importance of the
influencing factors, it is recommended that a monitoring
programme for a larger group of households (e.g. >100) be
undertaken for a period of at least 1 year.
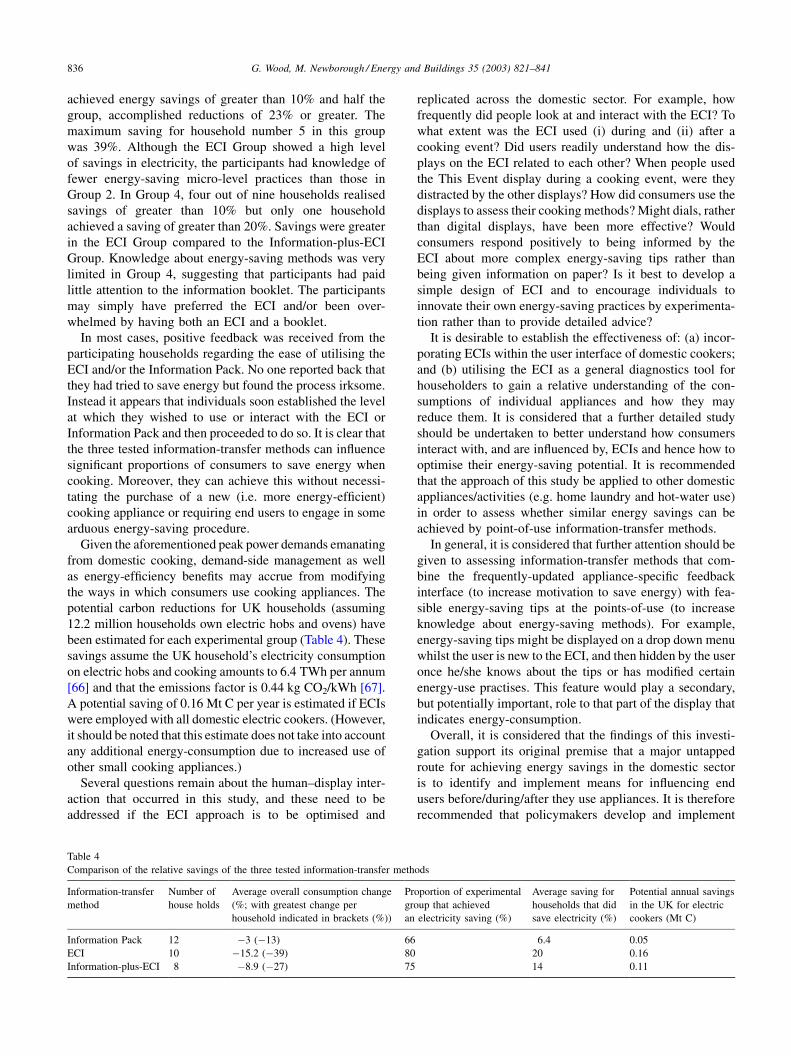
From the data associated with Groups 2–4 it is clear that
significant proportions of households were able to reduce
electricity expenditures on cooking (see Table 3). Overall,
14 out of 31 households achieved energy savings of greater
than 10%, and six of these achieved savings of greater than
20%. In Group 2, three out of 12 households achieved
savings of greater than 10% and the participating households
indicated that they had attempted to change a variety of
micro-level practices.
The ECI appears to have been much more effective than
the Information Pack. In Group 3, seven out of 10 households
Fig. 8. Indication of how frequently each digit of an LCD display would change for a domestic electric cooker, if it were designed to indicate electricity
consumption in kWh (up to three decimal places). (The maximum and minimum time values correspond to the maximum and minimum consumptions
achievable.)
G. Wood, M. Newborough / Energy and Buildings 35 (2003) 821–841 835
achieved energy savings of greater than 10% and half the
group, accomplished reductions of 23% or greater. The
maximum saving for household number 5 in this group
was 39%. Although the ECI Group showed a high level
of savings in electricity, the participants had knowledge of
fewer energy-saving micro-level practices than those in
Group 2. In Group 4, four out of nine households realised
savings of greater than 10% but only one household
achieved a saving of greater than 20%. Savings were greater
in the ECI Group compared to the Information-plus-ECI
Group. Knowledge about energy-saving methods was very
limited in Group 4, suggesting that participants had paid
little attention to the information booklet. The participants
may simply have preferred the ECI and/or been over-
whelmed by having both an ECI and a booklet.
In most cases, positive feedback was received from the
participating households regarding the ease of utilising the
ECI and/or the Information Pack. No one reported back that
they had tried to save energy but found the process irksome.
Instead it appears that individuals soon established the level
at which they wished to use or interact with the ECI or
Information Pack and then proceeded to do so. It is clear that
the three tested information-transfer methods can influence
significant proportions of consumers to save energy when
cooking. Moreover, they can achieve this without necessi-
tating the purchase of a new (i.e. more energy-efficient)
cooking appliance or requiring end users to engage in some
arduous energy-saving procedure.
Given the aforementioned peak power demands emanating
from domestic cooking, demand-side management as well
as energy-efficiency benefits may accrue from modifying
the ways in which consumers use cooking appliances. The
potential carbon reductions for UK households (assuming
12.2 million households own electric hobs and ovens) have
been estimated for each experimental group (Table 4). These
savings assume the UK household’s electricity consumption
on electric hobs and cooking amounts to 6.4 TWh per annum
[66] and that the emissions factor is 0.44 kg CO2/kWh [67].
A potential saving of 0.16 Mt C per year is estimated if ECIs
were employed with all domestic electric cookers. (However,
it should be noted that this estimate does not take into account
any additional energy-consumption due to increased use of
other small cooking appliances.)
Several questions remain about the human–display inter-
action that occurred in this study, and these need to be
addressed if the ECI approach is to be optimised and
replicated across the domestic sector. For example, how
frequently did people look at and interact with the ECI? To
what extent was the ECI used (i) during and (ii) after a
cooking event? Did users readily understand how the dis-
plays on the ECI related to each other? When people used
the This Event display during a cooking event, were they
distracted by the other displays? How did consumers use the
displays to assess their cooking methods? Might dials, rather
than digital displays, have been more effective? Would
consumers respond positively to being informed by the
ECI about more complex energy-saving tips rather than
being given information on paper? Is it best to develop a
simple design of ECI and to encourage individuals to
innovate their own energy-saving practices by experimenta-
tion rather than to provide detailed advice?
It is desirable to establish the effectiveness of: (a) incor-
porating ECIs within the user interface of domestic cookers;
and (b) utilising the ECI as a general diagnostics tool for
householders to gain a relative understanding of the con-
sumptions of individual appliances and how they may
reduce them. It is considered that a further detailed study
should be undertaken to better understand how consumers
interact with, and are influenced by, ECIs and hence how to
optimise their energy-saving potential. It is recommended
that the approach of this study be applied to other domestic
appliances/activities (e.g. home laundry and hot-water use)
in order to assess whether similar energy savings can be
achieved by point-of-use information-transfer methods.
In general, it is considered that further attention should be
given to assessing information-transfer methods that com-
bine the frequently-updated appliance-specific feedback
interface (to increase motivation to save energy) with fea-
sible energy-saving tips at the points-of-use (to increase
knowledge about energy-saving methods). For example,
energy-saving tips might be displayed on a drop down menu
whilst the user is new to the ECI, and then hidden by the user
once he/she knows about the tips or has modified certain
energy-use practises. This feature would play a secondary,
but potentially important, role to that part of the display that
indicates energy-consumption.
Overall, it is considered that the findings of this investi-
gation support its original premise that a major untapped
route for achieving energy savings in the domestic sector
is to identify and implement means for influencing end
users before/during/after they use appliances. It is therefore
recommended that policymakers develop and implement
Table 4
Comparison of the relative savings of the three tested information-transfer methods
Information-transfer
method
Number of
house holds
Average overall consumption change
(%; with greatest change per
household indicated in brackets (%))
Proportion of experimental
group that achieved
an electricity saving (%)
Average saving for
households that did
save electricity (%)
Potential annual savings
in the UK for electric
cookers (Mt C)
Information Pack 12 �3 (�13) 66 6.4 0.05
ECI 10 �15.2 (�39) 80 20 0.16
Information-plus-ECI 8 �8.9 (�27) 75 14 0.11
836 G. Wood, M. Newborough / Energy and Buildings 35 (2003) 821–841
actions specifically focussed on the points-of-use alongside
those already applied at the points-of-sale (e.g. energy
labelling and minimum efficiency standards).
Appendix A. Detailed design considerationsfor the ECI
When designing a display there are several methods of
attracting the attention of a person who is carrying out a
task. Schneider and Shiffrin [67] define selective attention as
‘‘the control of information processing so that a sensory
input is perceived or remembered in one situation rather than
another’’. The memory system has a limited capacity for
information. Thus, people must select which bits of infor-
mation are important enough to store in their active mem-
ories [67]. Broadbent [68] theorised that information could
only be attended to from one source at any given time and
that when there are many incoming information sources
attention determines what information reaches the working
memory. However, it is known that a person can process
information from more than one stimulus source and thus
can undertake two different tasks at the same time. Some of
the key aspects of attracting attention to displays may be
summarised as follows.
� We may be drawn towards an unusually large piece of
text [64]. It is also important that text or numerals in a
display are legible from a comfortable viewing distance
[69].
� Something that moves or flashes will attract attention
more than something that is stationary. This is a common
technique used extensively on the World-Wide Web [63].
However, this flashing can quickly become annoying
[70].
� Highlighting can draw the user towards the information
[71].
� Colour spots against a light grey or muted field serve to
highlight data [63]. Colour also produces shorter search
time than other modes of encoding information, e.g.
shapes or numbers [72,73]. Colour coding can be used
if particular objects on the display are to be perceived as
being related [63].
� Number of colours—a trained colourist can distinguish
between 1,000,000 colours [74]. However, too many
colours on a display can increase search time [75] and
more than 20–30 colours proves detrimental to under-
standing the information presented [74]. The maximum
number of colours suggested for air traffic control dis-
plays is six [76] and up to four colours for a PC display
[63].
Appropriately designed ECIs should attract the attention
of end users during energy-consumption events, and enable
them to obtain the information needed to modify behaviour
and so reduce energy-consumption. If the main form of
interaction is likely to be an occasionally glance at the ECI,
then attention must be attracted to salient points on the
display in order to reduce search time for relevant data.
The final design of ECI had a dark background with five
digital displays; all informational displays were highlighted
using the same bright yellow colour surround. A red colour
was chosen to highlight the reset button for the This Event
display, while less salient aspects (such as the name of the
ECI) were surrounded by a dark green colour (see Fig. 6).
The total number of colours used was four. Lastly, it was
advantageous to have digits that were of sufficient size to
attract the user to the display. Clark and Corlett [69] state
that a comfortable viewing distance for a visual display is
400–700 mm, but it was considered here that the digits on
the ECI should be readable from a distance of up to 2 m so
that the end user could observe the ECI whilst carrying out
other food-preparation activities in the kitchen. A width to
height ratio of 0.7:1 was used for the numerals as recom-
mended for optimum legibility and detection [69].
A.1. Comprehension
There were two major design aspects to consider in order
to ensure easy comprehension by the consumer. Firstly,
which would be the most understandable units that would
convey electricity consumption (e.g. kW, cumulative kWh,
pence and pounds, grams of CO2). Secondly, what was the
display symbology to be (e.g. dials, digital numbers, smiles,
flashing lights, graphics)? These were the main character-
istics that had to be considered within the constraints of
practicality and cost for the field trial.
The units that the ECI displayed were central to the user
being able to understand the display. Although saving
money is often the primary motivator, if energy were to
be displayed in pence and pounds the user may have been
dissuaded from saving energy due to the small financial
savings. For example, using a single hob for 1 h costs the
consumer only a few pence and so an energy-saving action
may well save only in the region of 1 penny/h. If the
consumer observes that they are only saving pennies per
day then they may be demotivated, rather than motivated, to
save energy. Alternatively, the display could have been in
grams of CO2 (associated with fossil-fuel derived electri-
city). However, this would be very difficult to implement
accurately, because the proportion of fossil-fuel generated
electricity and the overall system efficiency vary with time
of day and geographical location. With a conventional
electric cooker, it is feasible to simply display the power
demand (in kW). Unfortunately, initial trials indicated that
this form of display was difficult to understand, because the
user has no direct control over power during a single cooking
event. The heating elements are controlled thermostatically
or on a duty cycle, and once the desired setting has been
reached the power input will cycle. Thus, during a single
operation, zero would be displayed intermittently on the
ECI and so a kilowatt display would tend to confuse the user.
G. Wood, M. Newborough / Energy and Buildings 35 (2003) 821–841 837
By comparison, displaying kWh on a cumulative basis over-
comes most of these problems; it was therefore preferred in
this study.
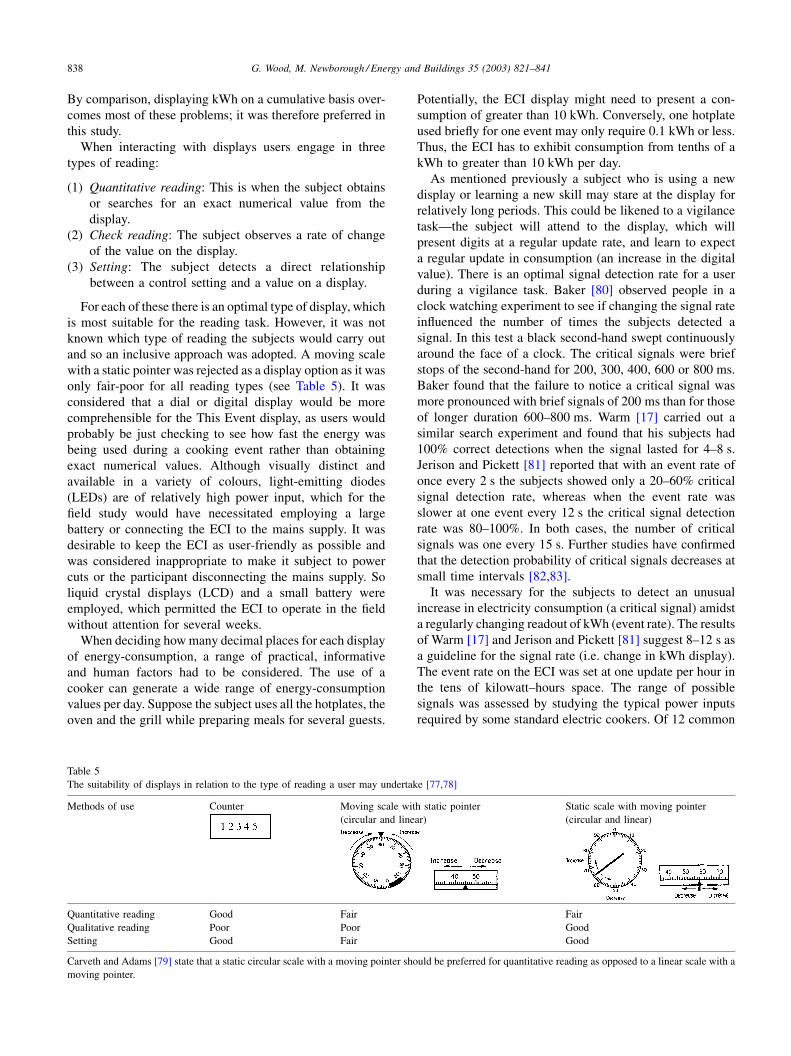
When interacting with displays users engage in three
types of reading:
(1) Quantitative reading: This is when the subject obtains
or searches for an exact numerical value from the
display.
(2) Check reading: The subject observes a rate of change
of the value on the display.
(3) Setting: The subject detects a direct relationship
between a control setting and a value on a display.
For each of these there is an optimal type of display, which
is most suitable for the reading task. However, it was not
known which type of reading the subjects would carry out
and so an inclusive approach was adopted. A moving scale
with a static pointer was rejected as a display option as it was
only fair-poor for all reading types (see Table 5). It was
considered that a dial or digital display would be more
comprehensible for the This Event display, as users would
probably be just checking to see how fast the energy was
being used during a cooking event rather than obtaining
exact numerical values. Although visually distinct and
available in a variety of colours, light-emitting diodes
(LEDs) are of relatively high power input, which for the
field study would have necessitated employing a large
battery or connecting the ECI to the mains supply. It was
desirable to keep the ECI as user-friendly as possible and
was considered inappropriate to make it subject to power
cuts or the participant disconnecting the mains supply. So
liquid crystal displays (LCD) and a small battery were
employed, which permitted the ECI to operate in the field
without attention for several weeks.
When deciding how many decimal places for each display
of energy-consumption, a range of practical, informative
and human factors had to be considered. The use of a
cooker can generate a wide range of energy-consumption
values per day. Suppose the subject uses all the hotplates, the
oven and the grill while preparing meals for several guests.
Potentially, the ECI display might need to present a con-
sumption of greater than 10 kWh. Conversely, one hotplate
used briefly for one event may only require 0.1 kWh or less.
Thus, the ECI has to exhibit consumption from tenths of a
kWh to greater than 10 kWh per day.
As mentioned previously a subject who is using a new
display or learning a new skill may stare at the display for
relatively long periods. This could be likened to a vigilance
task—the subject will attend to the display, which will
present digits at a regular update rate, and learn to expect
a regular update in consumption (an increase in the digital
value). There is an optimal signal detection rate for a user
during a vigilance task. Baker [80] observed people in a
clock watching experiment to see if changing the signal rate
influenced the number of times the subjects detected a
signal. In this test a black second-hand swept continuously
around the face of a clock. The critical signals were brief
stops of the second-hand for 200, 300, 400, 600 or 800 ms.
Baker found that the failure to notice a critical signal was
more pronounced with brief signals of 200 ms than for those
of longer duration 600–800 ms. Warm [17] carried out a
similar search experiment and found that his subjects had
100% correct detections when the signal lasted for 4–8 s.
Jerison and Pickett [81] reported that with an event rate of
once every 2 s the subjects showed only a 20–60% critical
signal detection rate, whereas when the event rate was
slower at one event every 12 s the critical signal detection
rate was 80–100%. In both cases, the number of critical
signals was one every 15 s. Further studies have confirmed
that the detection probability of critical signals decreases at
small time intervals [82,83].
It was necessary for the subjects to detect an unusual
increase in electricity consumption (a critical signal) amidst
a regularly changing readout of kWh (event rate). The results
of Warm [17] and Jerison and Pickett [81] suggest 8–12 s as
a guideline for the signal rate (i.e. change in kWh display).
The event rate on the ECI was set at one update per hour in
the tens of kilowatt–hours space. The range of possible
signals was assessed by studying the typical power inputs
required by some standard electric cookers. Of 12 common
Table 5
The suitability of displays in relation to the type of reading a user may undertake [77,78]
Methods of use Counter Moving scale with static pointer
(circular and linear)
Static scale with moving pointer
(circular and linear)
Quantitative reading Good Fair Fair
Qualitative reading Poor Poor Good
Setting Good Fair Good
Carveth and Adams [79] state that a static circular scale with a moving pointer should be preferred for quantitative reading as opposed to a linear scale with a
moving pointer.
838 G. Wood, M. Newborough / Energy and Buildings 35 (2003) 821–841
electrical cookers, the lowest average input for one hob
was 1.2 kW while the greatest was 10.9 kW for four hobs, a
grill and an oven in simultaneous use. This indicates the
range of rates that needed to be shown on the display.
With only one hotplate operating, the update rate of the
display digits will be the minimum update rates shown in
Fig. 8. With all four hobs, the oven and the grill energised
the update rates would become the maximum values shown
in Fig. 8.
Miller’s investigation in 1956 [84] is perhaps the most
quoted paper, which addresses the issue that people have
only a limited capability for storing chunks of information.
He suggests that we can store 7þ/�2 chunks of information
at a time. MacGregor [85] suggests that our working mem-
ory has a limit of four to six items. Lecompt [86] also
disagrees with Miller [84] and suggests that for interface
design a 7þ/�2 capacity is an overestimate and a poor
heuristic for design. A more useful guideline for the limit to
working memory capacity is approximately three informa-
tion bits [85]. This number of items will almost always be
remembered, even by individuals with certain types of brain
damage [87]. In order to follow the Lecompt [86] 3-bit rule,
the maximum number of changing digits that should be
allowed was three. Thus, for each display on the ECI, digit
spaces of ‘‘ones’’, ‘‘tenths’’ and ‘‘hundredths’’ of 1 kWh were
supported. The ‘‘tens’’ of kWh digit, which was normally
expected to change at intervals of several days, was also
included on the ECI but this was not considered important
in terms of the user’s working memory.
References
[1] Department of Environment Food and Rural Affairs (DEFRA)
Delivering Emission Reductions, 2002, http://www.defra.gov.uk/
environment/climatechange/cm4913/pdf/section2.pdf.
[2] Intergovernmental Panel on Climate Change (IPCC), 2002, http://
www.ipcc.ch/.
[3] Royal Commission on Environmental Pollution 22nd Report, June
2000, http://www.rcep.org.uk.
[4] Performance and Innovation Unit (PIU) Report, The Energy Review,
The Cabinet Office, February 2002, http://www.piu.gov.uk/2002/
energy/report/.
[5] Department of Trade and Industry, Inter-Departmental Analysts
Group Report, Long Term Reductions in Greenhouse Gas
Emissions in the UK, February 2002, http://www.dti.gov.uk/energy/
greenhousegas.
[6] P.C. Stern, E. Aronson, Energy Use The Human Dimension, W.H.
Freeman and Company, New York, 1984.
[7] M. Newborough, P. Augood, Demand-side management opportu-
nities for the UK domestic sector, IEE Proceedings of Generation
Transmission and Distribution 146 (3) (1999) 283–293.
[8] L. Lutzenhiser, Social and behavioural aspects of energy use, Annual
Review of Energy and Environment 18 (1993) 247–289.
[9] J.V. Fechner, Human factors in appliance energy-consumption, in:
Proceedings of the IEEE Appliance Technical Conference, Pitts-
burgh, Pennsylvania, 1977.
[10] R.C. Sonderegger, Movers and stayers: the residents contribution to
variation across houses in energy-consumption for space heating,
Energy and Buildings 1 (1978) 313–324.
[11] T.M.M. Verhallen, W.F. Van Raaij, Household behaviour and the use
of natural gas, Journal of Consumer Research 8 (1981) 253–257.
[12] I. Mansouri-Azar, M. Newborough, D. Probert, Energy-consumption
in UK domestic households: impact of domestic electrical appliances,
Applied Energy 54 (3) (1996) 211–285.
[13] J.T. Van Houwelingen, W.F. Van Raaij, The effect of goal setting and
daily electronic feedback on in-home energy use, Journal of
Consumer Research 16 (1989) 98–105.
[14] I. Mansouri-Azar, Energy-consumptions and environmental impacts
of household electrical appliances, PhD Thesis, School of Mechanical
Engineering, Cranfield University, Cranfield, April 1996.
[15] F.G. Kaiser, S. Wolfing, U. Fuhrer, Environmental attitude and
ecological behaviour, Journal of Environmental Psychology 19
(1999) 1–19.
[16] J. Annett, Feedback and Human Behaviour, Penguin, England, 1969.
[17] J.S. Warm, Sustained Attention in Human Performance, Wiley,
Chichester, 1984.
[18] D.A. Norman, The Design of Everyday Things, MIT Press, London,
2000.
[19] M.L. Dennis, E.J. Soderstrom, W.S. Koncinski, B. Cavanaugh,
Effective dissemination of energy related information, American
Psychologist 45 (10) (1990) 1109–1117.
[20] R.A. Winnett, I.N. Leckliter, D.E. Chinn, B. Stahl, Reducing energy-
consumption: the long-term effects of a single TV program, Journal
of Communication 34 (3) (1984) 37–51.
[21] H. Wilhite, R. Ling, Measured energy savings from a more
informative energy bill, Energy and Buildings 22 (2) (1995) 145–155.
[22] S.C. Hayes, J.D. Cone, Reducing residential electricity energy use:
payments, information, and feedback, Journal of Applied Behavior
Analysis 10 (1977) 425–435.
[23] S. Miller, New Essential Psychology: Experimental Design and
Statistics, Routledge, London, 1984.
[24] P. Stern, What psychology knows about energy conservation,
American Psychologist 47 (1992) 1224–1231.
[25] C. Seligman, J.M. Darley, Feedback as a means of decreasing
residential energy-consumption, Journal of Applied Psychology 62
(1977) 363–368.
[26] H. Wilhite, A. Hoivik, O. Johan-Gjemre, Advances in the use of
consumption feedback information in energy billing the experiences
of a Norwegian energy utility, in: 1999 ECEEE Summer Study
Proceedings.
[27] S. Darby, Energy Advice—what is it worth? Panel III, in: 5th ECEEE
Summer Study Proceedings, Environmental Change Unit, University
of Oxford, Oxford, 1999, http://www.eceee.org.
[28] Organisation for Economic Co-operation and Development (OECD),
Literacy in the Information Age: A Final Report of the International
Adult Literacy Survey, OECD Publications Service, Paris, 2000.
[29] W.B. Seaver, A.H. Patterson, Decreasing fuel–oil consumption
through feedback and social commendation, Journal of Applied
Behaviour Analysis 9 (1976) 147–152.
[30] S.C. Hayes, J.D. Cone, Reducing residential electricity energy use:
payments, information, and feedback, Journal of Applied Behaviour
Analysis 10 (1977) 425–435.
[31] W.F. Van Raaij, T.M.M. Verhallen, A behavioral model of residential
energy use, Journal of Economic Psychology 3 (1983) 39–63.
[32] R.B. Ammons, Effects of knowledge of performance: a survey and
tentative theoretical formula, Journal of General Psychology 54
(1956) 279–299.
[33] A. Meyel, Low Income Households and Energy Conservation:
Institutional, Behavioural and Housing Barriers to the Adoption of
Energy Conservation Measures, Built Environment Research Group
1987, Polytechnic of Central London, London.
[34] S. Marvin, H. Chappells, S. Guy, Pathways of smart metering
development: shaping environmental innovation, computers, Envir-
onment and Urban Systems 23 (1999) 109–126.
[35] Industrial Development and Investment Centre (IDIC), Ministry of
Economic Affairs, Taiwan, 2002, http://www.idic.gov.tw/esummer.html.
G. Wood, M. Newborough / Energy and Buildings 35 (2003) 821–841 839
[36] S.V. Allera, R.A. Sturges, End-use monitoring with the POEM
system, in: Proceedings of the Eighth International Conference
on Metering and Tariffs for Energy Supply IEE (Conference
Publication No. 426), Brighton, UK, 3–5 July 1996, pp. 208–
212.
[37] G. Brandon, A. Day, The impact of feedback on domestic energy-
consumption, in: Proceedings of the Sustainable Building Con-
ference, BEPAC/ESPRC, Abingdon, 1997.
[38] Department of Trade and Industry (DTI) Smart Meter Working
Group, 2001, http://www.dti.gov.uk/energy/smartmeter.
[39] L. McClelland, S. Cook, Energy Conservation effects of continuous
in-home feedback in all-electric homes, Journal of Environmental
Systems 9 (1979–1980) 169–173.
[40] J.K. Dobson, J.D. Griffin, Conservation effect of immediate
electricity cost feedback on residential consumption behaviour, in:
Proceedings of the 7th ACEEE Summer Study on Energy Efficiency
in Buildings, Washington, DC, 1992.
[41] G. Brandon, A. Lewis, Reducing household energy-consumption: a
qualitative and quantitative field study, Journal of Experimental
Psychology 19 (1999) 75–85.
[42] G. Brandon, A. Day, Making domestic energy use visible, in: A.
Warhurst (Ed.), Towards a Collaborative Environment Research
Agenda Challenges for Business and Society, Macmillan Press, New
York, 2000, pp. 58–74.
[43] W. Kempton, M. Neiman, Energy Efficiency: Perspectives on
Individual Behaviour, American Council for an Energy Efficient
Economy Series on Energy Conservation and Energy Policy,
Washington, DC, 1987.
[44] J.C. Baird, J.M. Brier, Perceptual awareness of energy requirements
of familiar objects, Journal of Applied Psychology 66 (1981)
90–96.
[45] Market Transformation Programme (MTP), 2002, http://
www.mtprog.com.
[46] J.W. Senders, M. Cruzen, Tracking Performance on Combined and
Compensatory Pursuit Tasks, Wright Air Development Center,
Wright-Patterson Air Force Base, Dayton, Ohio, 1952.
[47] J. Preece, L. Keller, Human–Computer Interaction Selected Read-
ings, Prentice-Hall, Hertfordshire, UK, 1990.
[48] C.E. Thoreson, M.J. Mahoney, Behavioural Self-Control, Holt,
Rinehart and Winston Inc., USA, 1974.
[49] S. Darby, Making it obvious: designing feedback into energy-
consumption, Effective Advice, Energy Efficiency and the Dis-
advantaged (Appendix 4), Environmental Change Institute, Oxford,
December 2000.
[50] W. Kempton, Will public environmental concern lead to action on
global warming? Annual Review of Energy and Environment 18
(1993) 217–245.
[51] M.J. Hinnells, K.B. Lane, The Relative importance of technical and
behavioural trends in electricity consumption by domestic appli-
ances, in: Proceedings of the European Council for Energy Efficient
Economy (1996) Summer Study, Panel 3, Environmental Change
Unit, University of Oxford, Oxford, http://www.eceee.org.
[52] B. Lebot, C. Lopes, P. Waidem O. Sidler, Lessons learnt
from European metering campaigns of electrical end uses in the
residential sector, in: Proceedings of the European Council for
Energy Efficient Economy Summer Study, Panel 2, ID 82, 1995, http://
www.eceee.org.
[53] W. Kempton, L. Montgomery, Folk quantification of energy, Energy
7 (1982) 817–827.
[54] W. Kempton, Two theories of home heat control, Cognitive Science
10 (1986) 75–90.
[55] M. Newborough, S.D. Probert, Intelligent rapid-response water
heater for supplementing outputs from a domestic hot water store,
BSERT 15 (1993) 141–148.
[56] M. Newborough, S.D. Probert, Energy-conscious design improve-
ments for electric hobs, Journal of Foodservice Systems 4 (1988)
233–257.
[57] G.W. Brundrett, Saucepan lids: the key to low energy cooking,
Journal of Consumer Studies and Home Economics 3 (1979)
195–204.
[58] Department of the Environment (DoE), 2001, http://www.environ-
ment.detr.gov.uk.
[59] T. Fawcett, K. Lane, B. Boardman, Low Carbon Futures for
European Households, Environmental Change Institute, University
of Oxford, March 2000.
[60] P. Kasanen (Ed.), Country specific real life energy-consumption
in ovens, in: Efficient Domestic Ovens Final Report, Helsinki, 2000.
[61] I. Mansouri-Azar, M. Newborough, Dynamics of energy use in UK
households: end-use monitoring of electric cookers, in: Proceedings
of the European Council for Energy Efficient Economy, Summer
Study, Panel III 08, 1999, http://www.eceee.org.
[62] L.F.E. Coombs, Fighting Cockpits 1914–2000 Design and Develop-
ment of Military Aircraft Cockpits, Airlife Publishing Ltd., England,
1999.
[63] B. Shneiderman, Designing the User Interface Strategies for
Effective Human–Computer Interaction, Addison-Wesley, Reading,
MA, 1992.
[64] L.L. Lohr, Designing the instructional interface, Computers in
Human Behaviour 16 (2000) 161–182.
[65] L. Bainbridge, Handbook of Aviation Human Factors, Lawrence
Elbaum Association, London, 1999.
[66] Energy Facts and Figures, 2002, http://www.energy-efficiency.gov.uk/
document/factfigs/emiss.htm.
[67] W. Schneider, R.M. Shiffrin, Controlled and automatic human
information processing. I. Detection, search, and attention, Psycho-
logical Review 84 (1977) 1–66.
[68] D. Broadbent, Perception and Communication, Pergamon Press,
London, 1958.
[69] T.S. Clark, E.N. Corlett, The Ergonomics of Workspaces and
Machines: A Design Manual, Taylor and Francis, London, 1984.
[70] D.D. Hoffman, Visual Intelligence—How We Create What We See,
W.W. Norton and Company, New York, 1998.
[71] D.L. Fisher, B.G. Coury, O.G. Tammy, S.A. Duffy, Minimizing the
time to search visual displays: the role of highlighting, Human
Factors 31 (1989) 167–182.
[72] J.E. Barmack, H.W. Sinaiko, Human Factors Problems in Computer
Generated Graphic Displays, Institute for Defense Analysis, 1966,
p. S-234.
[73] K. Gummerman, Successive processing of colour and form
from brief visual displays, Perceptual and Motor Skills 40 (1975)
31–41.
[74] E.R. Tufte, Envisioning Information, Graphics Press, London, 1990.
[75] R.C.J. Carter, Visual search and color coding, in: Proceedings of the
23rd Annual Meeting on Human Factors Society, Santa Monica, CA,
1979, pp. 369–373.
[76] G. Kinney, L. Culhane, Colour in Air Traffic Control Displays:
Review of the Literature and Design Considerations, MITRE Report
Number MTR-7728, MITRE Corporation, 1978.
[77] M.S. Sanders, E.J. McCormick, Human Factors in Engineering and
Design, McGraw-Hill, New York, 1993.
[78] W.E. Nason, C.A. Bennett, Dials versus counters: effects of precision
on quantitative reading, Ergonomics 16 (6 Nov) (1973) 749–758.
[79] J.W. Carveth, J.A. Adams, Effects of practice on dial reading, Human
Factors 6 (1964) 81–85.
[80] C.H. Baker, Signal duration as a factor of vigilance tasks, Science
141 (1963) 1196–1197(b).
[81] H.J. Jerison, R.M. Pickett, Vigilance: the importance of the elicited
observing rate, Science 143 (1964) 970–971.
[82] M. Loeb, J.R. Binford, Variation in performance on auditory and
visual monitoring tasks as a function of signal and stimulus
frequencies, Perception and Psychophysics 4 (1968) 361–367.
[83] H.A. Taub, F.H. Osborne, Effects of signal and stimulus rate on
vigilance performance, Journal of Applied Psychology 52 (1968)
133–138.
840 G. Wood, M. Newborough / Energy and Buildings 35 (2003) 821–841

[84] G.A. Miller, Some limits on our capacity for processing information,
Psychological Review 63 (1956) 81–97.
[85] J.N. MacGregor, Short-term memory capacity limitation or optimi-
zation? Psychological Review 94 (1987) 81–97.
[86] D. LeCompt, Seven plus or minus two, is too much to bear: three
or fewer is the real magic number, in: Proceedings of the 43rd
Annual Meeting on Human Factors and Ergonomics Society, 1999,
pp. 289–292.
[87] R.C. Martin, M.F. Lesch, Associations and dissociations between
language impairment and list recall implications for models for STM,
Psychology Press, Hove, UK, 1996.
G. Wood, M. Newborough / Energy and Buildings 35 (2003) 821–841 841


![Analysis of Energy Consumption Indicators for Non-OECD ... · the level of energy consumption [7]. ... This paper will adopt three parameters to empirically ... 2002 5442.925 17899.6](https://img.pdfslide.net/doc/110x75/5abf2b527f8b9ad8278e1fbc/analysis-of-energy-consumption-indicators-for-non-oecd-level-of-energy-consumption.jpg)