Embed Size (px)
Citation preview
240 Airport Boulevard, Freedom, CA 95019-2614 PHONE: 831.761.1000 FAX: 831.761.1008 WEB: www.sageinst.com
4G and 5G testing beyond Spectrum Analysis Renshou Dai, Ph.D
2017-8-25
Abstract: In this paper, we will demonstrate, with real world case examples, the
principles of using advanced 4G-LTE and 5G NB-IoT analysis features offered on Sage
8901 UCTT to solve the network optimization and interference mitigation problems.
More specifically, we will use MIB data’s built-in CRC check to precisely and
unambiguously determine the actual signal coverage area of a 4G-LTE or 5G NB-IoT
base station (part of network optimization). We will use the cell-ID scanning results
to find the in-band ICI (Inter Cell Interference from adjacent cells). We will also use
the PHICH channel to infer the uplink signal quality within a cell by decoding the
ACK/NACK data groups. For TDD-LTE, we will show case a real world example of
finding the subtle uplink and downlink synchronization problem between adjacent
sectors using the symbol power profile within an LTE frame.
1. Introduction
For all wireless network operators, the fundamental challenges are network
optimization and interference mitigation. The first step to network optimization is to
determine the actual signal coverage area of a cell. The second step is to carefully
balance the conflicting requirements of good coverage and low ICI (Inter Cell
Interference). Increasing transmit power or realign antennas or adding new cells are
easy-to-understand measures to enhance signal coverage. Yet they may also
introduce undesirable ICI at certain areas. A good field test instrument is
indispensable for these challenges.
1.1 Limitations of a Spectrum Analyzer
The most commonly used test tool is a Spectrum Analyzer (SA). However, an SA is not
a panacea and it has limitations. SA only shows the physical-layer frequency-domain
characteristics of a signal. It does not show the inner compositions of an LTE or
NB-IoT signal (such as the Reference Signals, Synchronization Signals or PBCH, PHICH
and PDSCH channels etc). Neither does it show the presence or absence of strong or
weak ICI (Inter Cell Interference). Most of the time, an interfering signal is not an
obvious spectrally-identifiable signal super-imposed above the existing LTE or NB-IoT
signal. Quite often, the interfering signals are another LTE or NB-IoT signals coming
from adjacent sectors and cells. Or even if there are spectrally-identifiable interfering
signals present, their level might be below the dominant legitimate LTE or NB-IoT
signals. In all the above cases, a Spectrum Analyzer alone is not going to help you
solve the problems. You need a tool that can dig deeper into the inner structures of
the 4G LTE or 5G NB-IoT signals.

240 Airport Boulevard, Freedom, CA 95019-2614 PHONE: 831.761.1000 FAX: 831.761.1008 WEB: www.sageinst.com
1.2 How to precisely determine the actual coverage area of a cell?
This may sound like a trivial question, but the answer is not that simple at all. The
traditional mode of thinking immediately jumps into the channel power type of
metrics such as RSSI (Received Signal Strength Indicator), RSRP (Reference Signal
Received Power), or RSRQ (Reference Signal Received Quality) etc, and there are
plenty of tools in the market that offer these simple measurements. But they are all
over rated. All these measurements are based a flawed assumption that signal
coverage (or quality) equals signal power. While this assumption might be valid for
the technologies that use strict frequency planning among adjacent cells such as the
old AMPS, TDMA and GSM, all the new technologies based on CDMA, WCDMA, LTE
and NB-IoT all use the same carrier frequency among adjacent cells and sectors. In
the latter case, a simple channel power measurement has no discriminatory ability.
At the cell boundary area, for example, the total channel power might be high
because of the strong signal overlapping from the adjacent cells, but the actual signal
coverage quality will be dismal. The simple lesson is: channel power does not equal
signal quality.
Even if we assume it’s OK to use the channel power metric as a simple gauge of the
signal coverage, we still lack the exact threshold value setting guideline. There is no
such simple scientific guideline as to how high the channel power has to be. The
reality is, signal quality (SNR) matters more than absolute signal level. High signal
level does not mean high SNR if the signal is wrong or there is strong presence of
interfering signals.
1.3 Signal Coverage Determination by MIB data decoding
The simplest and also the most effective way to determine if a location has adequate
signal coverage is by decoding the MIB data embedded in the LTE or NB-IoT signal.
MIB stands for Master Information Block. It is carried over the PBCH channel and
broadcasted on every 10ms frame. The MIB block contains crucial information that
every mobile device must decode first before it can decode any other channels. From
test and measurement point of view, our interest is not too much in the MIB data
content itself (although the decoded data can be used to verify potential
configuration setting errors), rather our interest lies in the CRC (Cyclic Redundancy
Check) error encoding part. Every MIB data block is appended with additional CRC
bits that enable the receiver to check if the received data contain errors. The
CRC-checked sequence then goes through the 1/3 tail-biting convolution encoding,
random permutation and rate-matched to the PBCH channel. The final sequence is
then scrambled by a random bit sequence controlled by the cell-ID and frame
sequence number. This bit sequence is then QPSK modulated, MIMO (transmit
diversity) processed and mapped to the appropriate resource elements associated
240 Airport Boulevard, Freedom, CA 95019-2614 PHONE: 831.761.1000 FAX: 831.761.1008 WEB: www.sageinst.com
with each antenna port. The CRC inside the MIB data provides the most natural way
of checking the data (and hence the signal) integrity without the need to know a
priori information about the data. If the MIB data contains no CRC errors, then the
data integrity is not compromised and the signal coverage is good. Otherwise, the
signal coverage is not adequate. Keep in mind that the MIB data is the first data block
that a mobile phone must decode before it can proceed any further. Therefore,
without correct MIB data, there will be absolutely no signal coverage no matter how
strong the signal is. MIB is also transmitted using MIMO transmit diversity, so its
decoding process also verifies the correct MIMO operations (such as MIMO balance
among the antenna ports).
During 4G-LTE Carrier Aggregation, it’s not only important to ensure every carrier
maintains time-wise frame synchronization with one another, it’s even more
important to ensure that every carrier maintains identical System Frame Number
(SFN) at any given moment. SFN is embedded inside MIB, and only the instrument
that can decode MIB can ensure the SFN consistency during Carrier Aggregation.
1.4 Cell-ID scanning for finding ICI
As stated before, most of the time, the interfering signals are not the simple
spectrally-identifiable signals coming from non-cellular sources. Quite often, the
interfering signals come from the adjacent cells with identical spectral shape. For
these interfering signals, you need a test feature beyond the simple Signal Analyzer. A
cell-ID scanner is a good tool for finding such ICI. An accurate cell-ID scanner will
search through all possible synchronization and reference signals, and from them,
find the cell-ID and power level of each possible interfering LTE or NB-IoT signal
coming from the adjacent cells. At any location, the ideal network should be such
that only one dominant cell-ID exists. If a location has too many or even just two but
almost equal level signals, then strong ICI exists.
1.5 Uplink signal quality inference via PHICH channel decoding
For 4G-LTE, the PHICH channel carries the ACK and NACK data groups. The base
station uses this downlink PHICH channel to inform the mobile devices in that cell
the status of the previously transmitted uplink data packets. If the uplink data packet
was received without any error, an ACK will be sent. Otherwise, a NACK will be sent.
By decoding the PHICH channel to obtain the ACK and NACK counts in a cell, one can
infer the uplink quality within that cell by monitoring the down link PHICH channel.
Ideally, you want all of the counts to be ACK. Too many NACKs (over 50%) indicate
poor up link transmission in that cell.
240 Airport Boulevard, Freedom, CA 95019-2614 PHONE: 831.761.1000 FAX: 831.761.1008 WEB: www.sageinst.com
1.6 Special TDD-LTE uplink and downlink synchronization issue
For TDD-LTE (Time-Domain-Division LTE) operators, the signal gets even more
complex than any simple Spectrum Analyzer can handle. In TDD-LTE, the uplink and
downlink both use the same carrier frequency, but occupy different timeslots. Near a
base station, the downlink signal is very strong and the uplink is very weak (the
power difference can be easily over 120 dB). You can imagine, if the strong downlink
signal from an adjacent cell spills into the weak uplink period of another cell, then
uplink call blocking will occur. So the correct frame synchronization among all
adjacent cells is vital for correct TDD-LTE operations. Also important is to ensure all
adjacent cells are using the same uplink and downlink configuration setting (7
possible settings) to make sure all the downlink among adjacent cells occur within
the same time period and do not pollute the other cell’s uplink. The signal
propagation delay effect shall be confined within the GP (Guard Period) inside the
Special Sub-frame. All these potential synchronization and configuration
mis-matching problems cannot be solved by simple Spectrum Analyzers. You need a
test feature or tool that can synchronize to the TDD-LTE signal, automatically detects
the uplink and downlink configuration setting, find the uplink and downlink periods,
and calculate and display the power of each 1 of the 140 symbols within a 10 ms
frame, and from the symbol power display, one can infer the potential
mis-synchronization issue between adjacent sectors. We will show an actual example
below.
1.7 Weaker interfering signal hidden under stronger signal
There are cases when the interfering signals are spectrally identifiable, but weaker
than the dominant legitimate signal. Under this condition, the normal SA display will
not help. However, some special trace modes, such as the min-max-real-time 3-trace
mode, and SPD (Spectral Power Density) display, will unveil the weaker interfering
signals hidden under the strong signal.
1.8 Introducing Sage 8901 UCTT
The 8901 UCTT (Universal Cellular Test Tool) from Sage Instruments is not only a
portable broad-band FFT Spectrum Analyzer, it is also an advanced vector signal
analyzer that can analyze all 2G, 3G, 4G and 5G (NB-IoT) signals. It has all the
capabilities outlined above. Particularly worth noting is that, Sage 8901 UCTT is the
only portable instrument (at the time of writing) that is capable of MIB data block
decoding for both LTE and NB-IoT signals; UCTT is the only portable instrument
capable of PHICH ACK/NACK decoding and UCTT is also the only portable instrument
that offers the complete NB-IoT test features. In the following sections, we will
describe a few real world test results obtained using this advanced UCTT tool.
240 Airport Boulevard, Freedom, CA 95019-2614 PHONE: 831.761.1000 FAX: 831.761.1008 WEB: www.sageinst.com
2 FDD-LTE test case from California
2.1 Spectral views of a 10MHz-wide FDD-LTE signal
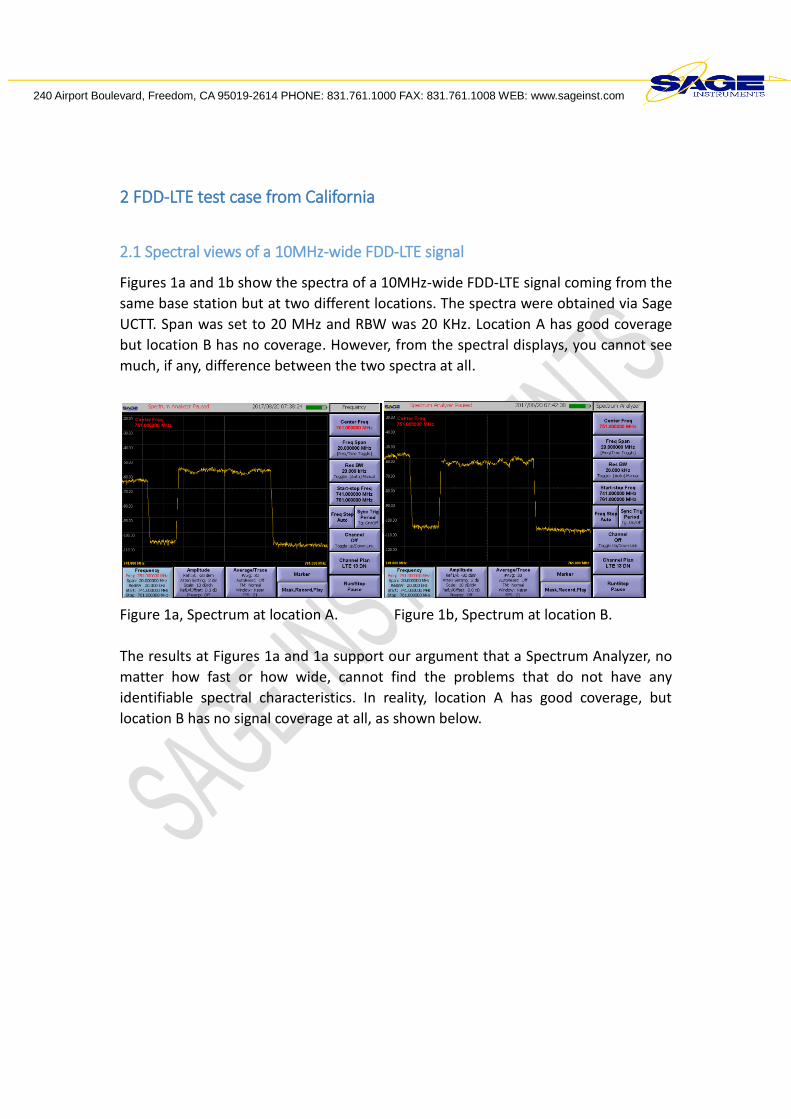
Figures 1a and 1b show the spectra of a 10MHz-wide FDD-LTE signal coming from the
same base station but at two different locations. The spectra were obtained via Sage
UCTT. Span was set to 20 MHz and RBW was 20 KHz. Location A has good coverage
but location B has no coverage. However, from the spectral displays, you cannot see
much, if any, difference between the two spectra at all.
Figure 1a, Spectrum at location A. Figure 1b, Spectrum at location B.
The results at Figures 1a and 1a support our argument that a Spectrum Analyzer, no
matter how fast or how wide, cannot find the problems that do not have any
identifiable spectral characteristics. In reality, location A has good coverage, but
location B has no signal coverage at all, as shown below.

240 Airport Boulevard, Freedom, CA 95019-2614 PHONE: 831.761.1000 FAX: 831.761.1008 WEB: www.sageinst.com
2.2 LTE Frame Summary View of the Signals
Figures 2a and 2b, on the other hand, clearly show the signal quality difference at
these two locations. What’s shown in Figures 2a and 2b are “LTE Frame Summary
View”, a useful sub-feature of the LTE analysis function implemented on Sage 8901
UCTT. This sub-feature measures the quality metrics (power level and EVM) of each
individual signal (PSS, SSS and RS) and channel (PBCH, PCFICH, PHICH, PDCCH and
PDSCH). It also shows the MIB data decoding status (if no CRC error, the decoded raw
data will be shown along with the data interpretation; if there is CRC error, then “CRC
err” will be shown), and uplink ACK and NACK counts decoded from the PHICH
channel.
Figure 2a, Frame View at location A. Figure 2b, Frame View at location B.
The LTE Frame Summary View at location A (Figure 2a) shows that the MIB data
decoding contains no CRC error, meaning there is good signal coverage here. All the
EVM (Error Vector Magnitude) measurements associated with each signal and
channel are generally low (<30%), indicating that the signal quality is indeed quite
good at this location
The test results at location B indicate that there are MIB CRC errors, hence there is
no actual signal coverage at this location. The EVM measurements are also as high as
100%, indicating signal quality is very poor in spite of the high signal level.
In fact, location A is at the center of a sector, about 1 KM away from the base station.
It has very good signal coverage.
Location B is only 100 meters away from the base station and right in the middle of
two adjacent sectors. It has no actual signal coverage.
MIB OK
MIB CRC error
Low EVM High EVM
240 Airport Boulevard, Freedom, CA 95019-2614 PHONE: 831.761.1000 FAX: 831.761.1008 WEB: www.sageinst.com
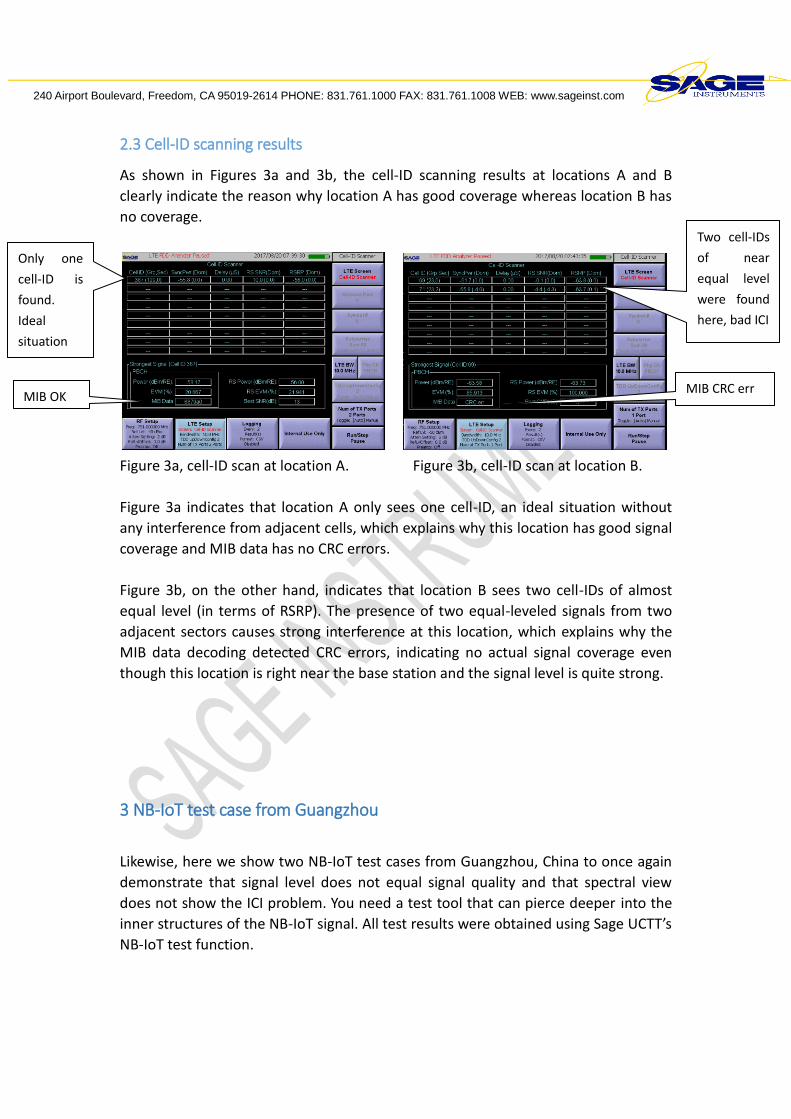
2.3 Cell-ID scanning results
As shown in Figures 3a and 3b, the cell-ID scanning results at locations A and B
clearly indicate the reason why location A has good coverage whereas location B has
no coverage.
Figure 3a, cell-ID scan at location A. Figure 3b, cell-ID scan at location B.
Figure 3a indicates that location A only sees one cell-ID, an ideal situation without
any interference from adjacent cells, which explains why this location has good signal
coverage and MIB data has no CRC errors.
Figure 3b, on the other hand, indicates that location B sees two cell-IDs of almost
equal level (in terms of RSRP). The presence of two equal-leveled signals from two
adjacent sectors causes strong interference at this location, which explains why the
MIB data decoding detected CRC errors, indicating no actual signal coverage even
though this location is right near the base station and the signal level is quite strong.
3 NB-IoT test case from Guangzhou
Likewise, here we show two NB-IoT test cases from Guangzhou, China to once again
demonstrate that signal level does not equal signal quality and that spectral view
does not show the ICI problem. You need a test tool that can pierce deeper into the
inner structures of the NB-IoT signal. All test results were obtained using Sage UCTT’s
NB-IoT test function.
Only one
cell-ID is
found.
Ideal
situation
Two cell-IDs
of near
equal level
were found
here, bad ICI
MIB OK MIB CRC err
240 Airport Boulevard, Freedom, CA 95019-2614 PHONE: 831.761.1000 FAX: 831.761.1008 WEB: www.sageinst.com
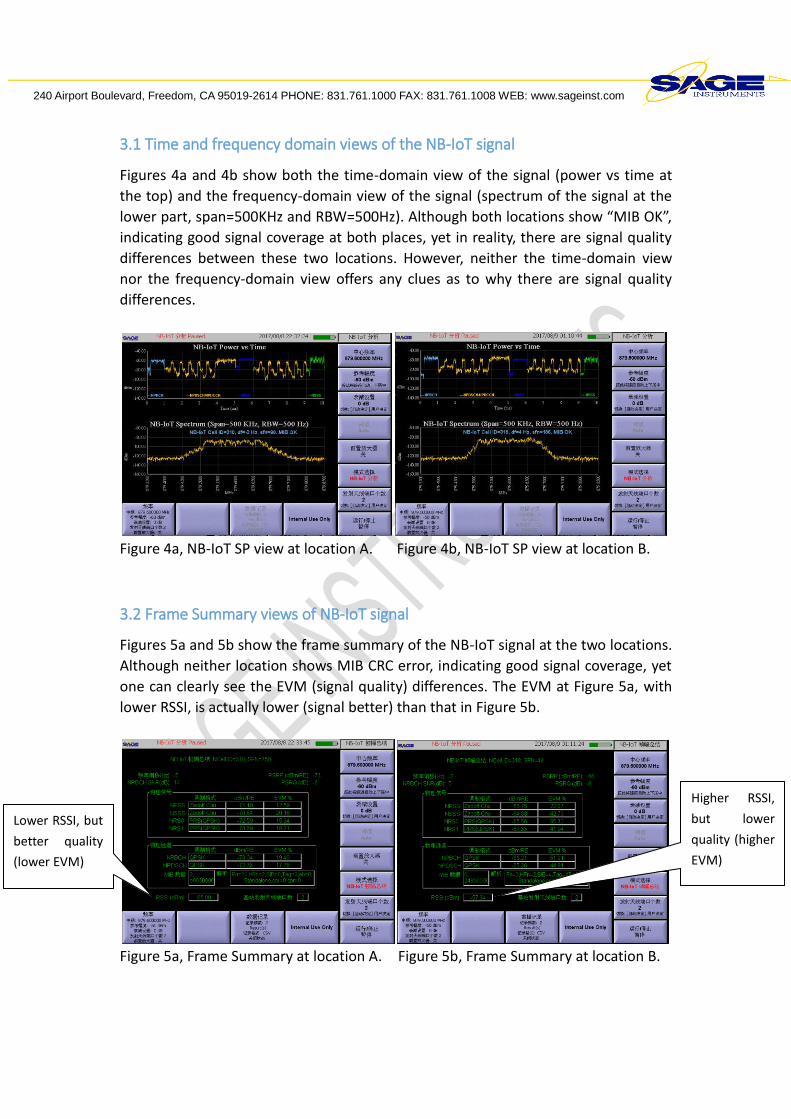
3.1 Time and frequency domain views of the NB-IoT signal
Figures 4a and 4b show both the time-domain view of the signal (power vs time at
the top) and the frequency-domain view of the signal (spectrum of the signal at the
lower part, span=500KHz and RBW=500Hz). Although both locations show “MIB OK”,
indicating good signal coverage at both places, yet in reality, there are signal quality
differences between these two locations. However, neither the time-domain view
nor the frequency-domain view offers any clues as to why there are signal quality
differences.
Figure 4a, NB-IoT SP view at location A. Figure 4b, NB-IoT SP view at location B.
3.2 Frame Summary views of NB-IoT signal
Figures 5a and 5b show the frame summary of the NB-IoT signal at the two locations.
Although neither location shows MIB CRC error, indicating good signal coverage, yet
one can clearly see the EVM (signal quality) differences. The EVM at Figure 5a, with
lower RSSI, is actually lower (signal better) than that in Figure 5b.
Figure 5a, Frame Summary at location A. Figure 5b, Frame Summary at location B.
Lower RSSI, but
better quality
(lower EVM)
Higher RSSI,
but lower
quality (higher
EVM)
240 Airport Boulevard, Freedom, CA 95019-2614 PHONE: 831.761.1000 FAX: 831.761.1008 WEB: www.sageinst.com
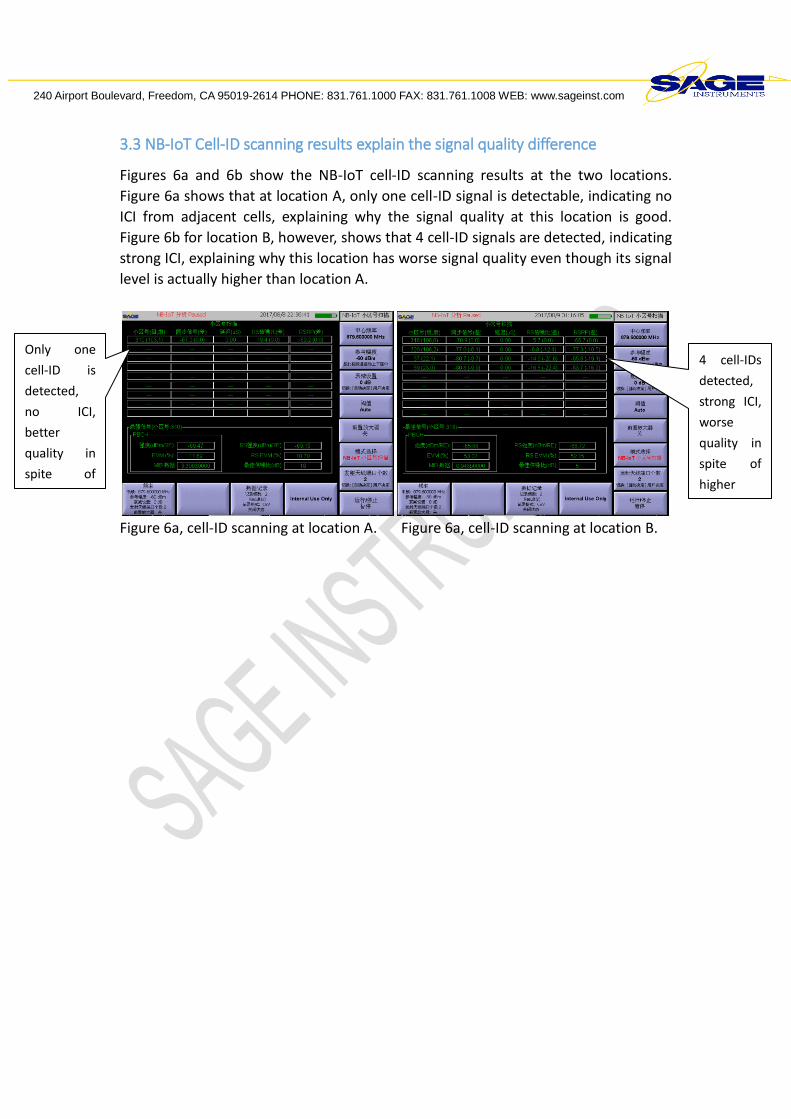
3.3 NB-IoT Cell-ID scanning results explain the signal quality difference
Figures 6a and 6b show the NB-IoT cell-ID scanning results at the two locations.
Figure 6a shows that at location A, only one cell-ID signal is detectable, indicating no
ICI from adjacent cells, explaining why the signal quality at this location is good.
Figure 6b for location B, however, shows that 4 cell-ID signals are detected, indicating
strong ICI, explaining why this location has worse signal quality even though its signal
level is actually higher than location A.
Figure 6a, cell-ID scanning at location A. Figure 6a, cell-ID scanning at location B.
Only one
cell-ID is
detected,
no ICI,
better
quality in
spite of
lower
power.
4 cell-IDs
detected,
strong ICI,
worse
quality in
spite of
higher
power.
240 Airport Boulevard, Freedom, CA 95019-2614 PHONE: 831.761.1000 FAX: 831.761.1008 WEB: www.sageinst.com
4 LTE uplink quality inference by PHICH channel decoding
Although technically only the downlink signal quality falls into the responsibility of a
mobile carrier, yet the uplink signal quality is also important for a good user
experience. The uplink signal quality issue may also indicate presence of uplink
interference, a constant headache for all network operators. Directly measuring the
uplink signal over the air with antenna is difficult, if not impossible, as the mobile
device’s uplink signal is weak, “random” and not always present. So, if there exists a
method of inferring the uplink quality by decoding the corresponding downlink signal,
that should be a wonderful news to the network operators. It turns out, such method
does exist, and Sage 8901 UCTT is the only portable instrument that offers such
method.
PHICH stands for Physical Hybrid-ARQ Indicator Channel. It carries the Hybrid ARQ
(HARQ) acknowledgements (ACK/NACK) for the uplink data transfers. Simply put, for
every error-free uplink data transfer, an ACK (encoded as bits 111 and BPSK
modulated) will be sent. By the same token, for every errored uplink data transfer, a
NACK (encoded as bits 000) will be sent. By decoding the PHICH channel and
detecting the counts of ACK (111) and NACK (000) data groups, one can infer the
uplink signal quality within that cell, and that is exactly what’s offered on Sage 8901
UCTT.
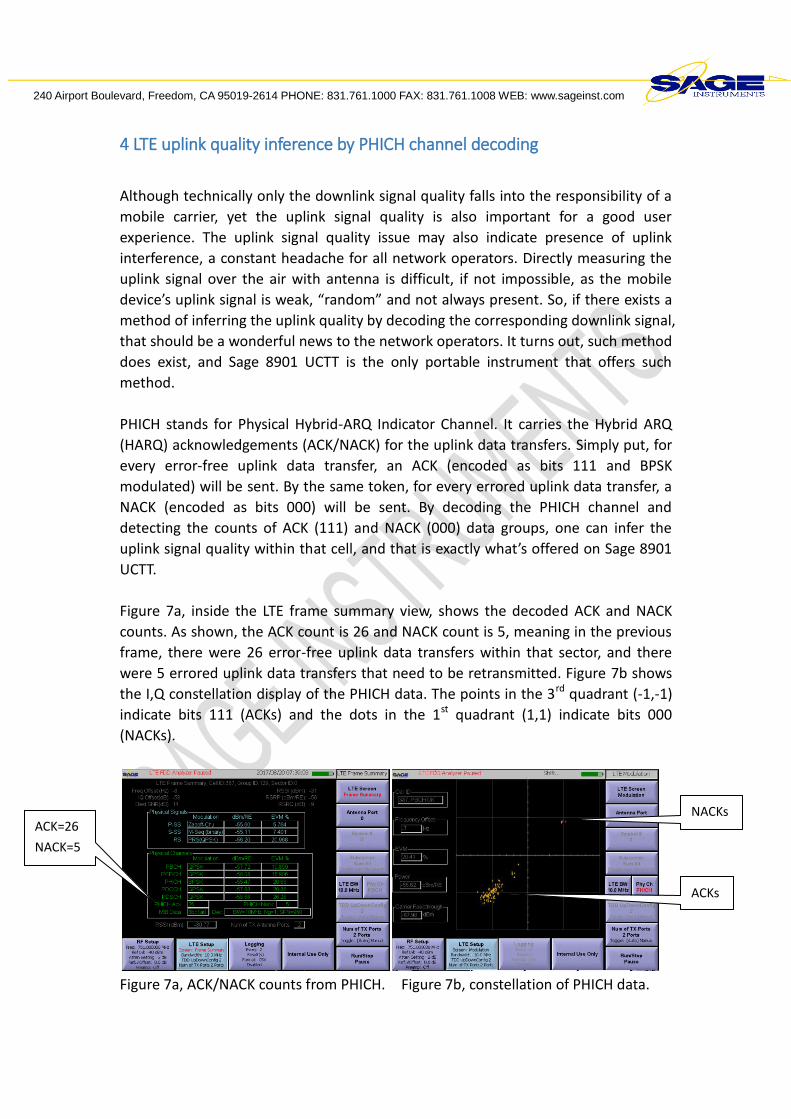
Figure 7a, inside the LTE frame summary view, shows the decoded ACK and NACK
counts. As shown, the ACK count is 26 and NACK count is 5, meaning in the previous
frame, there were 26 error-free uplink data transfers within that sector, and there
were 5 errored uplink data transfers that need to be retransmitted. Figure 7b shows
the I,Q constellation display of the PHICH data. The points in the 3rd quadrant (-1,-1)
indicate bits 111 (ACKs) and the dots in the 1st quadrant (1,1) indicate bits 000
(NACKs).
Figure 7a, ACK/NACK counts from PHICH. Figure 7b, constellation of PHICH data.
ACK=26
NACK=5
NACKs
ACKs
240 Airport Boulevard, Freedom, CA 95019-2614 PHONE: 831.761.1000 FAX: 831.761.1008 WEB: www.sageinst.com
5 TDD-LTE example, solving the up and down link synchronization issue
In TDD-LTE, the uplink and downlink both use the same frequency band, but occupy
different time slots. To avoid the situation of strong downlink signal over-powering
the weak uplink of adjacent cells, the tight synchronization of the up and down link
timeslots (or sub-frames) among adjacent cells and sectors are vital, otherwise, one
sector’s downlink will interfere the other sector’s up link, and that’s exactly what we
discovered in a densely populated coastal area in China.
Sage was invited to solve a long-standing TDD-LTE coastal area uplink interference
problem that was believed to be caused by atmospheric waveguide phenomenon,
meaning in a coastal area, the signals from base stations on far away (over 100 KM)
islands may propagate to the mainland via the “Sea-and-Air waveguide”, and due to
the “natural” long propagation delay, the downlink from the far-away islands may
interfere the uplink on the mainland. Sage engineers did not find any evidence
supporting that idea (simple signal path loss calculation will also rule out that
hypothesis), however, Sage UCTT did find the subtle synchronization issues among
base stations made by certain international manufacturer. Periodically, the two
adjacent sectors of a base station will lose sync with each other, causing one sector’s
first down link symbol to interfere the last symbol of the prior up link period of
another sector. See Figure 8.
Figure 8, TDD-LTE symbol display showing up and downlink sync problem.
Figure 8 shows one of the LTE sub-features offered on Sage UCTT. The bar graph
This uplink symbol
power (marked by
M1) is anomalously
high. It is actually
caused by the
adjacent sector’s
downlink that was
about 1 symbol
period ahead.
cid=385
240 Airport Boulevard, Freedom, CA 95019-2614 PHONE: 831.761.1000 FAX: 831.761.1008 WEB: www.sageinst.com
shows the powers of all 140 symbols within a 10ms frame. Sage UCTT automatically
detects the up and down link configuration setting, and then automatically marks the
downlink period, special sub-frame period and uplink period using different colors.
Yellow is for downlink; purple is for the transitional special sub-frame period and
blue is for the uplink. Notice that the detected cell-ID for this sector is 385.
At the time of testing, there were no measurable uplink activities, and the uplink
symbols (marked blue) should all be near the noise floor level. However, the last
symbol of the two uplink periods (one of them is marker as “M1”) is anomalously
high. After comparing with the data obtained from the adjacent sector with cell-ID
386 (shown in Figure 9), we conclude that this anomaly was caused by the downlink
of the adjacent sector. More specifically, relative to sector 385, sector 386 moved
ahead (time-wise) by about 1 symbol period (about 67 us), therefore, the first
downlink symbol of sector 386 affected the last uplink symbol of sector 385, and the
evidence is clearly shown in Figure 8.
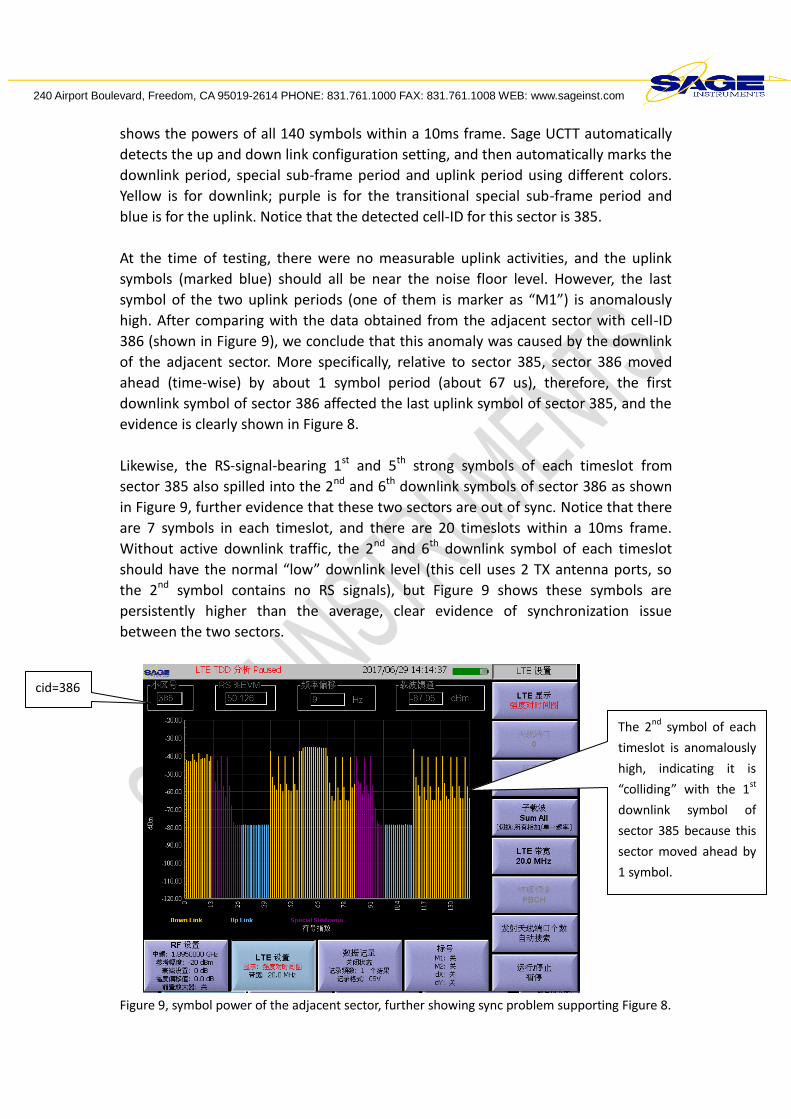
Likewise, the RS-signal-bearing 1st and 5th strong symbols of each timeslot from
sector 385 also spilled into the 2nd and 6th downlink symbols of sector 386 as shown
in Figure 9, further evidence that these two sectors are out of sync. Notice that there
are 7 symbols in each timeslot, and there are 20 timeslots within a 10ms frame.
Without active downlink traffic, the 2nd and 6th downlink symbol of each timeslot
should have the normal “low” downlink level (this cell uses 2 TX antenna ports, so
the 2nd symbol contains no RS signals), but Figure 9 shows these symbols are
persistently higher than the average, clear evidence of synchronization issue
between the two sectors.
Figure 9, symbol power of the adjacent sector, further showing sync problem supporting Figure 8.
The 2nd symbol of each
timeslot is anomalously
high, indicating it is
“colliding” with the 1st
downlink symbol of
sector 385 because this
sector moved ahead by
1 symbol.
cid=386
240 Airport Boulevard, Freedom, CA 95019-2614 PHONE: 831.761.1000 FAX: 831.761.1008 WEB: www.sageinst.com
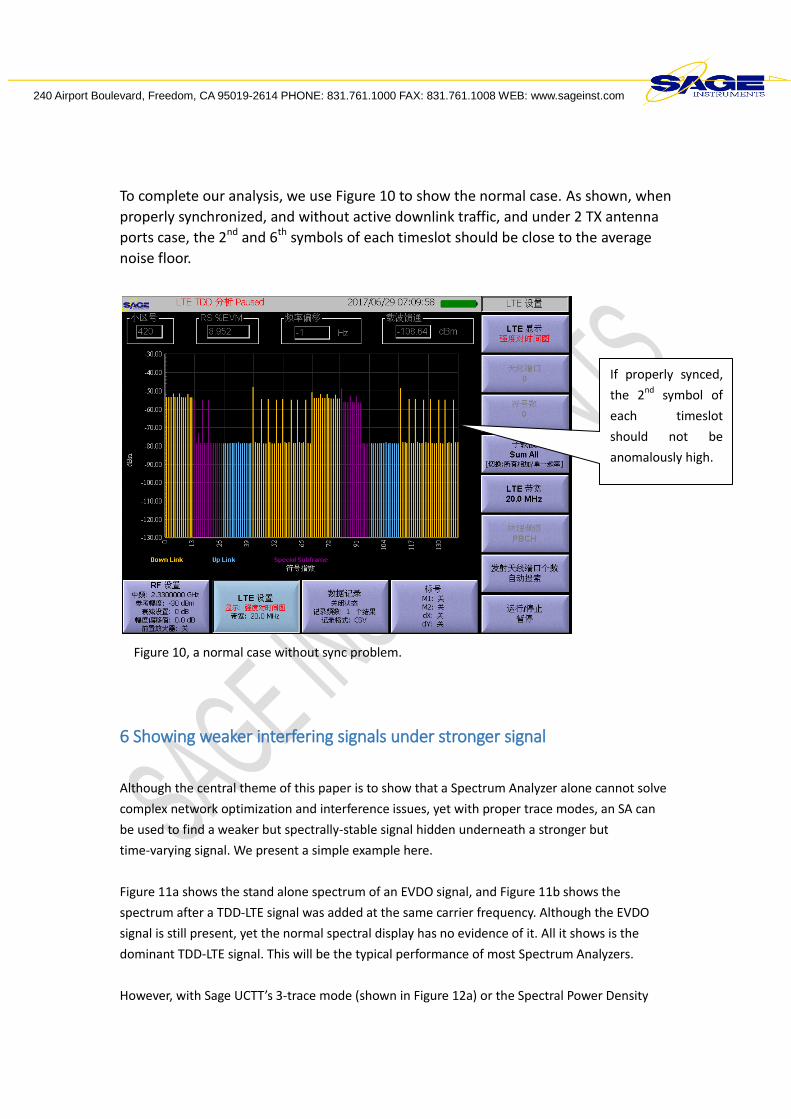
To complete our analysis, we use Figure 10 to show the normal case. As shown, when
properly synchronized, and without active downlink traffic, and under 2 TX antenna
ports case, the 2nd and 6th symbols of each timeslot should be close to the average
noise floor.
Figure 10, a normal case without sync problem.
6 Showing weaker interfering signals under stronger signal
Although the central theme of this paper is to show that a Spectrum Analyzer alone cannot solve
complex network optimization and interference issues, yet with proper trace modes, an SA can
be used to find a weaker but spectrally-stable signal hidden underneath a stronger but
time-varying signal. We present a simple example here.
Figure 11a shows the stand alone spectrum of an EVDO signal, and Figure 11b shows the
spectrum after a TDD-LTE signal was added at the same carrier frequency. Although the EVDO
signal is still present, yet the normal spectral display has no evidence of it. All it shows is the
dominant TDD-LTE signal. This will be the typical performance of most Spectrum Analyzers.
However, with Sage UCTT’s 3-trace mode (shown in Figure 12a) or the Spectral Power Density
If properly synced,
the 2nd symbol of
each timeslot
should not be
anomalously high.

240 Airport Boulevard, Freedom, CA 95019-2614 PHONE: 831.761.1000 FAX: 831.761.1008 WEB: www.sageinst.com
display (shown in Figure 12b), the presence of the weaker EVDO signal then becomes obvious.
These two trace modes are only possible on a broad-band FFT Spectrum Analyzer, which is the
case for Sage UCTT.
Figure 11a, Spectrum of an EVDO Signal. Figure 11b, Spectrum of TDD-LTE signal plus
EVDO signal. The EVDO signal is no longer
Visible.
Figure 12a, With 3-trace mode, the EVDO Figure 12b, with Spectral Power Density,
presence is obvious. the EVDO signal’s presence is obvious.
240 Airport Boulevard, Freedom, CA 95019-2614 PHONE: 831.761.1000 FAX: 831.761.1008 WEB: www.sageinst.com
7. Visualizing the Inter Cell Interference with a real case from CA
Although we have shown several cases of Inter Cell Interference (ICI) for both LTE and NB-IoT
signals and we have evidence from the EVM and cell-ID measurements to prove the existence of
ICI, yet it is still unsatisfying. It will be nicer if we can visualize the ICI using the simple Spectrum
Analysis tool. By some “random” luck, we did find such case.
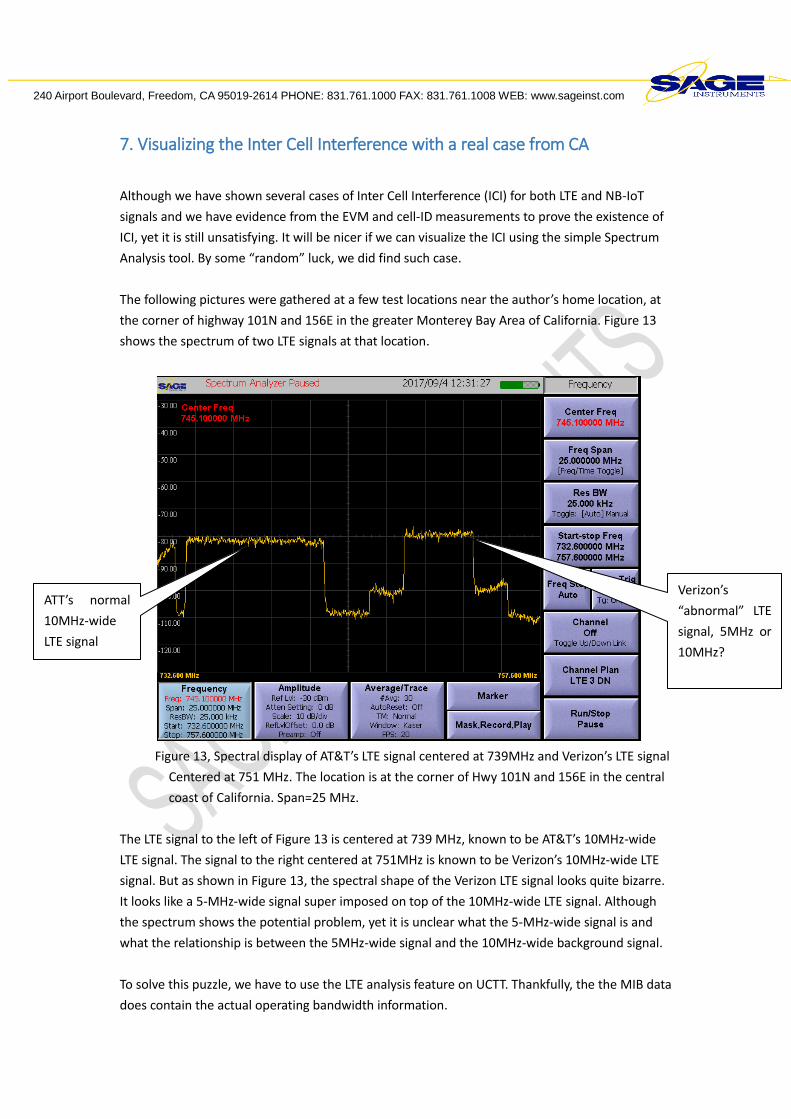
The following pictures were gathered at a few test locations near the author’s home location, at
the corner of highway 101N and 156E in the greater Monterey Bay Area of California. Figure 13
shows the spectrum of two LTE signals at that location.
Figure 13, Spectral display of AT&T’s LTE signal centered at 739MHz and Verizon’s LTE signal
Centered at 751 MHz. The location is at the corner of Hwy 101N and 156E in the central
coast of California. Span=25 MHz.
The LTE signal to the left of Figure 13 is centered at 739 MHz, known to be AT&T’s 10MHz-wide
LTE signal. The signal to the right centered at 751MHz is known to be Verizon’s 10MHz-wide LTE
signal. But as shown in Figure 13, the spectral shape of the Verizon LTE signal looks quite bizarre.
It looks like a 5-MHz-wide signal super imposed on top of the 10MHz-wide LTE signal. Although
the spectrum shows the potential problem, yet it is unclear what the 5-MHz-wide signal is and
what the relationship is between the 5MHz-wide signal and the 10MHz-wide background signal.
To solve this puzzle, we have to use the LTE analysis feature on UCTT. Thankfully, the the MIB data
does contain the actual operating bandwidth information.
ATT’s normal
10MHz-wide
LTE signal
Verizon’s
“abnormal” LTE
signal, 5MHz or
10MHz?
240 Airport Boulevard, Freedom, CA 95019-2614 PHONE: 831.761.1000 FAX: 831.761.1008 WEB: www.sageinst.com
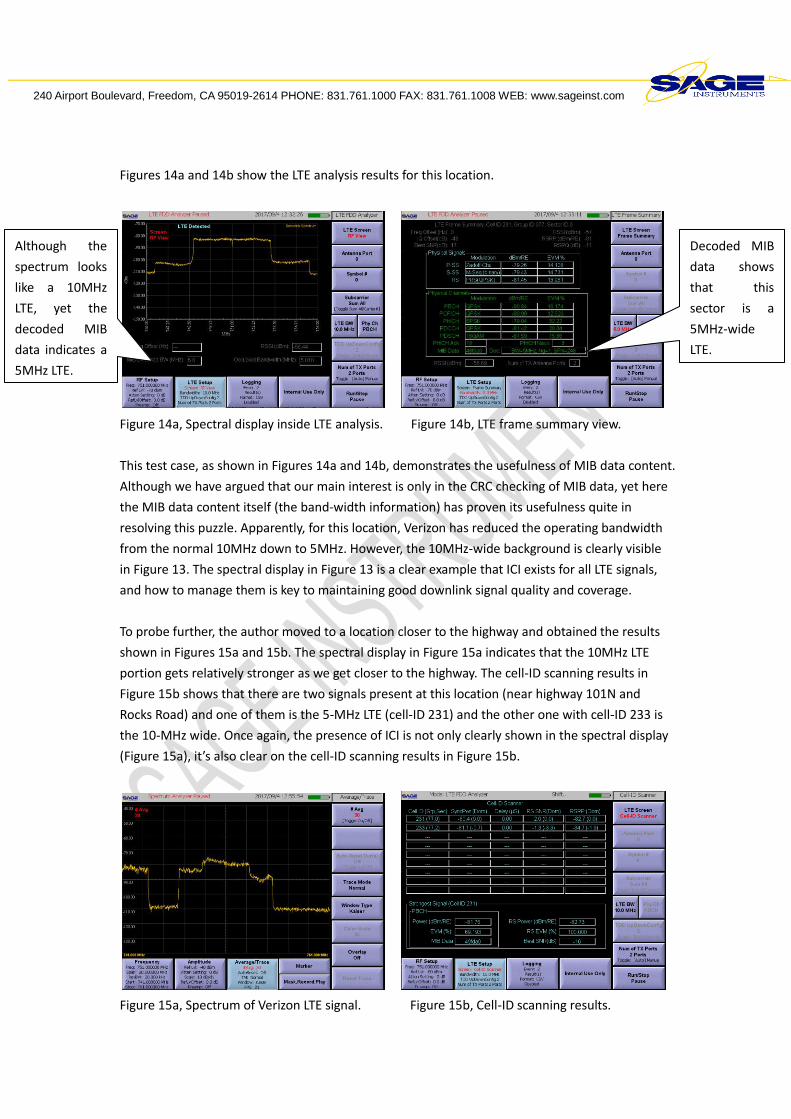
Figures 14a and 14b show the LTE analysis results for this location.
Figure 14a, Spectral display inside LTE analysis. Figure 14b, LTE frame summary view.
This test case, as shown in Figures 14a and 14b, demonstrates the usefulness of MIB data content.
Although we have argued that our main interest is only in the CRC checking of MIB data, yet here
the MIB data content itself (the band-width information) has proven its usefulness quite in
resolving this puzzle. Apparently, for this location, Verizon has reduced the operating bandwidth
from the normal 10MHz down to 5MHz. However, the 10MHz-wide background is clearly visible
in Figure 13. The spectral display in Figure 13 is a clear example that ICI exists for all LTE signals,
and how to manage them is key to maintaining good downlink signal quality and coverage.
To probe further, the author moved to a location closer to the highway and obtained the results
shown in Figures 15a and 15b. The spectral display in Figure 15a indicates that the 10MHz LTE
portion gets relatively stronger as we get closer to the highway. The cell-ID scanning results in
Figure 15b shows that there are two signals present at this location (near highway 101N and
Rocks Road) and one of them is the 5-MHz LTE (cell-ID 231) and the other one with cell-ID 233 is
the 10-MHz wide. Once again, the presence of ICI is not only clearly shown in the spectral display
(Figure 15a), it’s also clear on the cell-ID scanning results in Figure 15b.
Figure 15a, Spectrum of Verizon LTE signal. Figure 15b, Cell-ID scanning results.
Although the
spectrum looks
like a 10MHz
LTE, yet the
decoded MIB
data indicates a
5MHz LTE.
Decoded MIB
data shows
that this
sector is a
5MHz-wide
LTE.

240 Airport Boulevard, Freedom, CA 95019-2614 PHONE: 831.761.1000 FAX: 831.761.1008 WEB: www.sageinst.com
8. Conclusions
Based on the above discussions and case studies, we naturally arrive at the following conclusions:
• To meet the challenges of network optimization and interference mitigation, a Spectrum
Analyzer alone is not enough. The detailed LTE and NB-IoT analysis features offered on a
sophisticated instrument like Sage 8901 UCTT must be used.
• The MIB data decoding with CRC check provides the most effective and unambiguous way to
determine the actual signal coverage area of an LTE or NB-IoT cell.
• The ACK and NACK counts decoded from the LTE’s PHICH channel provides a simple but
effective way to infer the uplink signal quality by decoding the downlink control channel.
• The cell-ID scanners for both LTE and NB-IoT provide the best insight into the in-band ICI (Inter
Cell Interference) caused by excessive signal overlapping among adjacent cells.
• The tight frame synchronization and uplink-downlink configuration consistency among adjacent
cells are vital for correct TDD-LTE operations. The symbol power display offered on Sage UCTT,
coupled with the automatic uplink-downlink configuration detection and auto-coloring the
downlink, special sub-frame and uplink periods, provides the most intuitive and precise insight
into the subtle synchronization issues among adjacent cells.
• The 3-trace mode or Spectral Power Density view display on Sage UCTT’s Spectrum Analyzer
will be an effective way to unveil a weaker but spectrally stable signal (such as FM, AM,
CDMA/EVDO, WCDMA type of signals) hidden underneath a stronger but time-varying signal
(such as TDD-LTE, WiFi, GSM and even FDD-LTE signal).
About Sage Instruments
Sage Instruments is a leader in the telecommunications and wireless test industry, building
test sets, automated test systems, local loop test systems, and automated wireless test
systems used worldwide by leading telecom and wireless providers, manufacturers, and end
users. Each of our products provides customers with the value, performance, and reliability
demanded in the dynamic and competitive telecommunications and wireless industries. The
company offers innovative solutions for the development, installation, management and
maintenance of converged, IP fixed and mobile networks— from the core to the edge. Key
technologies supported include 2G/3G/4G/5G LTE, IMS, NB-IoT, and VoIP supporting more
than 20,000 telecom customers worldwide. For more information, please visit
www.sageinst.com.