Embed Size (px)
Citation preview
1
4November2021Version Sawah Technology「アフリカ水田農法」 (2) Background on Co-Evolution of Genetic and Ecological Technology of Sawah Rice Farming on Rice Green
Revolution in Sub Saharan Africa
Toshiyuki WAKATSUKI1, Mohammed Moro BURI2, Joseph OFORI3
and Segun Yinka ADEMILUYI4
1Emeritus Prof. Shimane University, 1-1-23-128 Saidaiji Higashimachi, Nara 631-0821, Japan
2Soil Research Institute-CSIR, Kumasi, Ghana 3Soil and Irrigation Research Center, Kpong, University of Ghana 4National Center for Agricultural Mechanization, Ilorin, Nigeria
1. Relationship between grain productivity (yield) and population growth in the past 70, 800, and 1400 years
of world history 2. Over the past 50 years, especially after 2010, paddy yields of major SSA countries have been improving
and catching-up with Asian major rice countries 3. Co-evolution of Genetic and Ecological Technologies for the Evolution of Rice Farming 4. Definition, Genesis and Evolution of Sawah System Platform and Sawah Technology 5. Science, Technology and Innovation (STI) of Asian and Latin American Green Revolution (GR) 6. What are the core technologies to realize African Green Revolution? 7. Scientific mistakes by IITA’s research top management in relation to Rice Green Revolution, which
published in IITA’s research highlights of 1987/88 8. Mean Paddy Yield of 23 Rice Cultivars in Irrigated Sawah, Rainfed Sawah and Non Sawah Platforms Under
High Input as well as Low Input Cultivation 9. Rice soil fertility in West Africa、SSA and Tropical Asia revealed Available-P increase is the best indicator
to realize the Green Revolution. SSA has 50 million ha of irrigated sawah platform potential in SSA 10. References 1. Relationship between grain productivity (yield) and population growth in the past 70, 800,
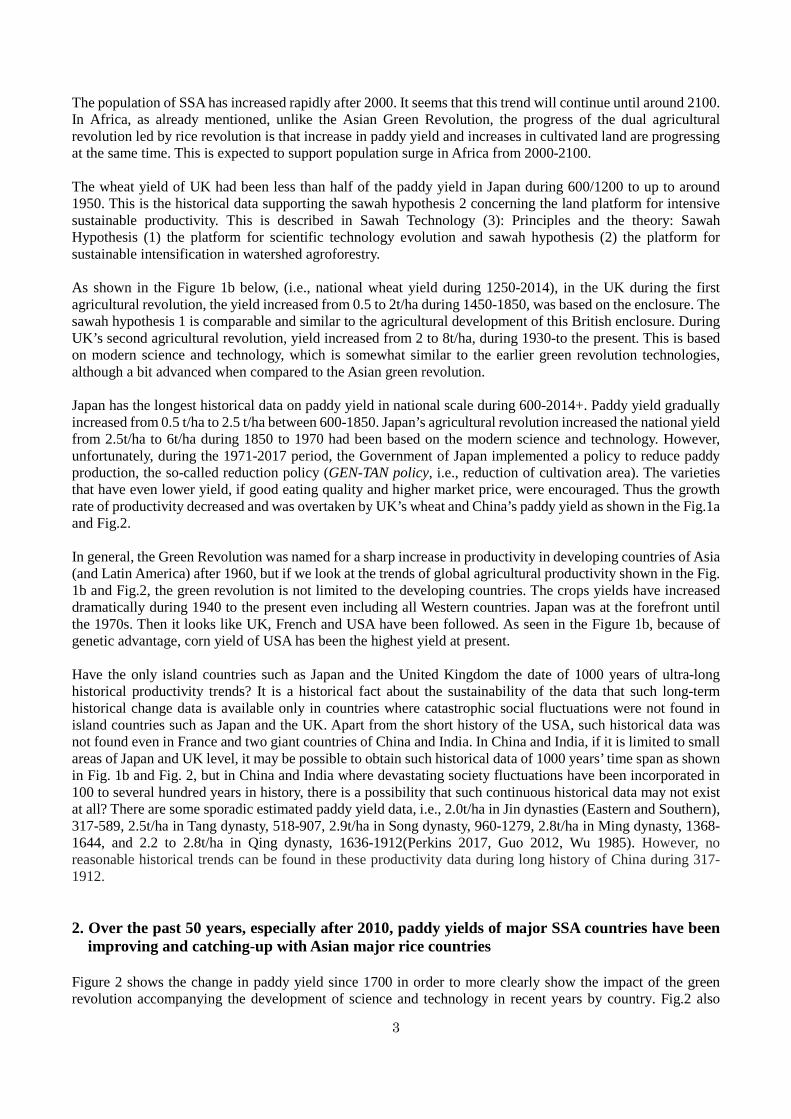
and 1400 years of world history Figure 1a shows the demographic dynamics of the major regions of the world from the 6th century to 2014, Asia, Europe, North and South Americas, Africa and Japan (UNDESA 2017, Roser 2017, Livi-Bacci 2012, Kito 2007). Figure 1b shows the historical change of paddy yield in Japan during 600-2014 (Takase and Kano 1969, Takase et al. 2003, Honma 1998, Wakatsuki 2013a and b) and the changes in wheat yields in Britain from 1250 to 2015, in France from 1820 to 2015, corn yields in the USA from 1860 to 2015 (Hopper 1976, Evans 1993, Overton 1996, Mitchell 1998, Apostolides et al. 2008, Fischer et al. 2014, Roser 2017, USDA 2017). The changes in paddy yield in China from 1950 to 2015 and the changes in paddy yields in major Asian and African countries from 1960 to 2018 are shown, too (FAOSTAT 2019). It can be seen from Figure 1a and 1b that population growth around the world clearly correlates with agricultural development, i.e., an increase in the yield of staple food crops, such as rice, wheat and corn, at the national and regional level in historical time frame. Even though it is not shown in the Fig. 1b and Fig. 2, the improvement in yield and expansion of cultivated land have progressed in a concerted manner. However, during these historic trends, short but severe food crises have occasionally occurred, such as food crises by natural disasters, wars, and migration and such food crisis will occur in future due to Malthus's trap. European population growth became evident after 1750, peaking around year 2000, but at a much slower rate than in other regions of the world. This is probably due to the massive immigration to the whole worlds, especially to North and South Americas as well as Australia, New Zealand and some areas in highland Africa. The surge in population of the Americas is estimated to be shortly after 2050, which appears separately from
2
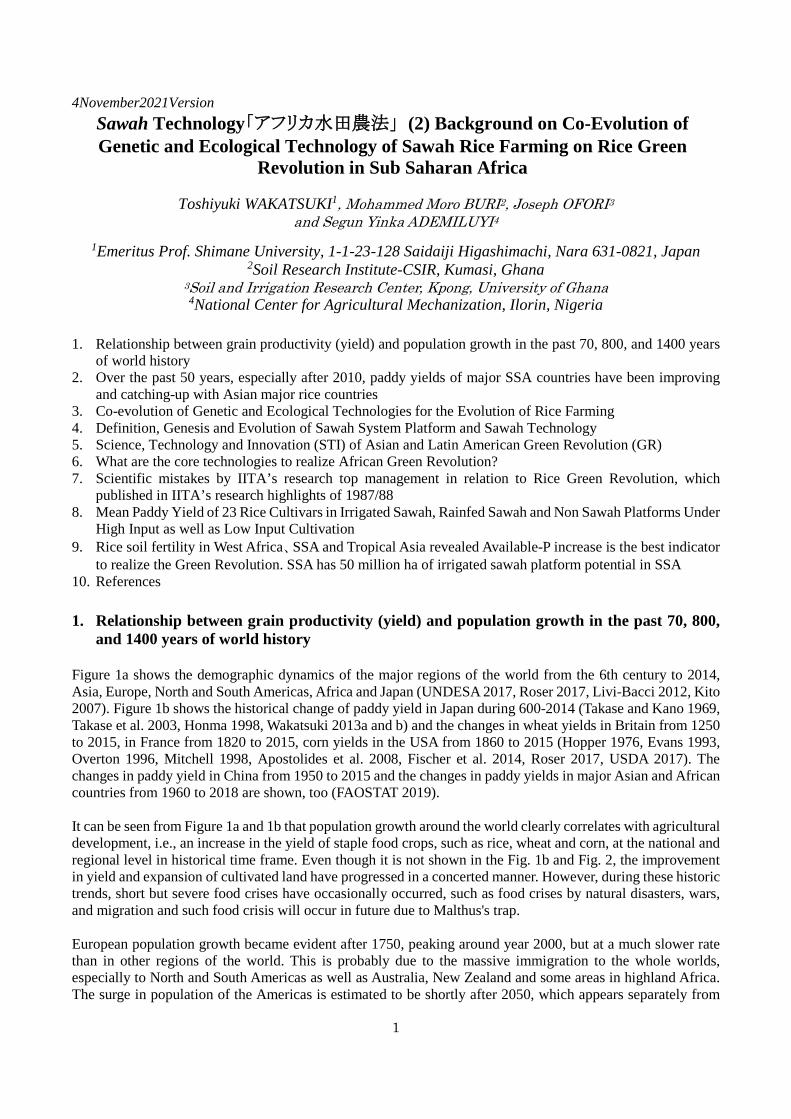
European. The peak population in Asia will be shortly before 2050, which is in coincides with the period of green revolution in the region. Africa is lagging Asia about 50 years
Figure 1b. Comparrative trends between the demographic increases and major grain yield’s incresases from the 6th century to 2018. The grains includ the changes in paddy yield in Japan since the 6th century, changes in wheat yields in the UK since 1250, changes in wheat yields in France since 1800, changes in maize yields in USA since 1860, and Changes in paddy yield in major Asian and SSA countries since 1961. The population dynamics include the region of Asia, Europe, North and South America, and Africa as well as that of Japan.
Wor
ld
Asi
a/A
fric
a
Am
eric
a/Eu
rope
Japa
n
Popu
latio
n(x1
00m
illio
n)
600 1200 1300 1400 1500 1600 1700 1800 1900 2000 2100Anno Domini (Western Year)
Fig 1a. Relationship between population and grain yield in terms of time span for 1400 years
120
90
60
30
0
60
45
30
15
16
12
8
4
1.6
1.2
0.8
0.4
Japan
North+southAmerica
Europe
Africa
World
Asia
Padd
y yi
eld(
t/ha)
exc
ept f
or U
SA, U
K a
nd F
renc
h
600 1200 1300 1400 1500 1600 1700 1800 1900 2000
11
10
9
8
7
6
5
4
3
2
1
0
UK-Wheat
French-Wheat
China
Britain(UK), National Wheat Yield during 1250 – 2014(1) The 1st Agricultural Revolution during 1450-1850
through Enclosure and the origin of science and technology : From 0.5 to 2t/ha,
(2) The 2nd Agricultural Revolution (Green revolution) through modern science & technology as well as improved land platform during1930 - 2014: From 2 to 8 t / ha
Trend of National Paddy yield in Japan during 600 – 2018(1) Gradual increase during 600-1850(2) Agricultural revolution after the Meiji Restoration by modern
science and technology during 1850-1945 mainly by chemical fertilizer technology based on the traditional sawah platform
(3) After world war 2nd 1945-1970:Land reform, sawah platform improvement for mechanization and No.1 rice farmer competition
(4) Political control of rice production during 1971-2018
Japan
India
French-Wheat
USA-Corn
Vietnam
Sierra Leone
Mali
Tanzania
Madagascar
Nigeria
Philippines
Ghana
Indonesia
Thailand
Cote d’Ivoire
Anno Domini (Western Year)
Yield=6t/ha line
Yield=2t/ha line
Yield=0.5t/ha line
3
The population of SSA has increased rapidly after 2000. It seems that this trend will continue until around 2100. In Africa, as already mentioned, unlike the Asian Green Revolution, the progress of the dual agricultural revolution led by rice revolution is that increase in paddy yield and increases in cultivated land are progressing at the same time. This is expected to support population surge in Africa from 2000-2100. The wheat yield of UK had been less than half of the paddy yield in Japan during 600/1200 to up to around 1950. This is the historical data supporting the sawah hypothesis 2 concerning the land platform for intensive sustainable productivity. This is described in Sawah Technology (3): Principles and the theory: Sawah Hypothesis (1) the platform for scientific technology evolution and sawah hypothesis (2) the platform for sustainable intensification in watershed agroforestry. As shown in the Figure 1b below, (i.e., national wheat yield during 1250-2014), in the UK during the first agricultural revolution, the yield increased from 0.5 to 2t/ha during 1450-1850, was based on the enclosure. The sawah hypothesis 1 is comparable and similar to the agricultural development of this British enclosure. During UK’s second agricultural revolution, yield increased from 2 to 8t/ha, during 1930-to the present. This is based on modern science and technology, which is somewhat similar to the earlier green revolution technologies, although a bit advanced when compared to the Asian green revolution. Japan has the longest historical data on paddy yield in national scale during 600-2014+. Paddy yield gradually increased from 0.5 t/ha to 2.5 t/ha between 600-1850. Japan’s agricultural revolution increased the national yield from 2.5t/ha to 6t/ha during 1850 to 1970 had been based on the modern science and technology. However, unfortunately, during the 1971-2017 period, the Government of Japan implemented a policy to reduce paddy production, the so-called reduction policy (GEN-TAN policy, i.e., reduction of cultivation area). The varieties that have even lower yield, if good eating quality and higher market price, were encouraged. Thus the growth rate of productivity decreased and was overtaken by UK’s wheat and China’s paddy yield as shown in the Fig.1a and Fig.2. In general, the Green Revolution was named for a sharp increase in productivity in developing countries of Asia (and Latin America) after 1960, but if we look at the trends of global agricultural productivity shown in the Fig. 1b and Fig.2, the green revolution is not limited to the developing countries. The crops yields have increased dramatically during 1940 to the present even including all Western countries. Japan was at the forefront until the 1970s. Then it looks like UK, French and USA have been followed. As seen in the Figure 1b, because of genetic advantage, corn yield of USA has been the highest yield at present. Have the only island countries such as Japan and the United Kingdom the date of 1000 years of ultra-long historical productivity trends? It is a historical fact about the sustainability of the data that such long-term historical change data is available only in countries where catastrophic social fluctuations were not found in island countries such as Japan and the UK. Apart from the short history of the USA, such historical data was not found even in France and two giant countries of China and India. In China and India, if it is limited to small areas of Japan and UK level, it may be possible to obtain such historical data of 1000 years’ time span as shown in Fig. 1b and Fig. 2, but in China and India where devastating society fluctuations have been incorporated in 100 to several hundred years in history, there is a possibility that such continuous historical data may not exist at all? There are some sporadic estimated paddy yield data, i.e., 2.0t/ha in Jin dynasties (Eastern and Southern), 317-589, 2.5t/ha in Tang dynasty, 518-907, 2.9t/ha in Song dynasty, 960-1279, 2.8t/ha in Ming dynasty, 1368-1644, and 2.2 to 2.8t/ha in Qing dynasty, 1636-1912(Perkins 2017, Guo 2012, Wu 1985). However, no reasonable historical trends can be found in these productivity data during long history of China during 317-1912. 2. Over the past 50 years, especially after 2010, paddy yields of major SSA countries have been
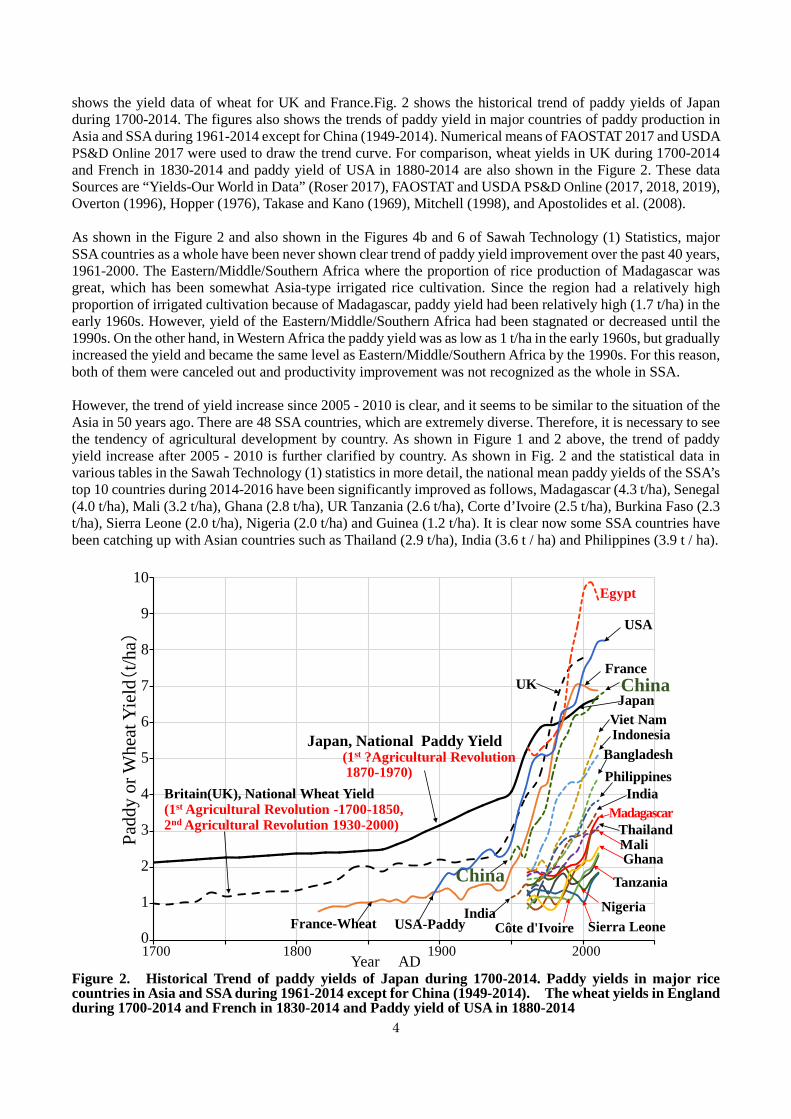
improving and catching-up with Asian major rice countries Figure 2 shows the change in paddy yield since 1700 in order to more clearly show the impact of the green revolution accompanying the development of science and technology in recent years by country. Fig.2 also
4
shows the yield data of wheat for UK and France.Fig. 2 shows the historical trend of paddy yields of Japan during 1700-2014. The figures also shows the trends of paddy yield in major countries of paddy production in Asia and SSA during 1961-2014 except for China (1949-2014). Numerical means of FAOSTAT 2017 and USDA PS&D Online 2017 were used to draw the trend curve. For comparison, wheat yields in UK during 1700-2014 and French in 1830-2014 and paddy yield of USA in 1880-2014 are also shown in the Figure 2. These data Sources are “Yields-Our World in Data” (Roser 2017), FAOSTAT and USDA PS&D Online (2017, 2018, 2019), Overton (1996), Hopper (1976), Takase and Kano (1969), Mitchell (1998), and Apostolides et al. (2008). As shown in the Figure 2 and also shown in the Figures 4b and 6 of Sawah Technology (1) Statistics, major SSA countries as a whole have been never shown clear trend of paddy yield improvement over the past 40 years, 1961-2000. The Eastern/Middle/Southern Africa where the proportion of rice production of Madagascar was great, which has been somewhat Asia-type irrigated rice cultivation. Since the region had a relatively high proportion of irrigated cultivation because of Madagascar, paddy yield had been relatively high (1.7 t/ha) in the early 1960s. However, yield of the Eastern/Middle/Southern Africa had been stagnated or decreased until the 1990s. On the other hand, in Western Africa the paddy yield was as low as 1 t/ha in the early 1960s, but gradually increased the yield and became the same level as Eastern/Middle/Southern Africa by the 1990s. For this reason, both of them were canceled out and productivity improvement was not recognized as the whole in SSA. However, the trend of yield increase since 2005 - 2010 is clear, and it seems to be similar to the situation of the Asia in 50 years ago. There are 48 SSA countries, which are extremely diverse. Therefore, it is necessary to see the tendency of agricultural development by country. As shown in Figure 1 and 2 above, the trend of paddy yield increase after 2005 - 2010 is further clarified by country. As shown in Fig. 2 and the statistical data in various tables in the Sawah Technology (1) statistics in more detail, the national mean paddy yields of the SSA’s top 10 countries during 2014-2016 have been significantly improved as follows, Madagascar (4.3 t/ha), Senegal (4.0 t/ha), Mali (3.2 t/ha), Ghana (2.8 t/ha), UR Tanzania (2.6 t/ha), Corte d’Ivoire (2.5 t/ha), Burkina Faso (2.3 t/ha), Sierra Leone (2.0 t/ha), Nigeria (2.0 t/ha) and Guinea (1.2 t/ha). It is clear now some SSA countries have been catching up with Asian countries such as Thailand (2.9 t/ha), India (3.6 t / ha) and Philippines (3.9 t / ha).
Figure 2. Historical Trend of paddy yields of Japan during 1700-2014. Paddy yields in major rice countries in Asia and SSA during 1961-2014 except for China (1949-2014). The wheat yields in England during 1700-2014 and French in 1830-2014 and Paddy yield of USA in 1880-2014
Padd
y or
Whe
atYi
eld(
t/ha)
1700 1800 1900 2000
10
9
8
7
6
5
4
3
2
1
0Year AD
Egypt
UKFrance
China
Viet NamIndonesia
BangladeshPhilippines
IndiaMadagascar
Mali
TanzaniaGhana
NigeriaSierra Leone Côte d'Ivoire
Britain(UK), National Wheat Yield(1st Agricultural Revolution -1700-1850,2nd Agricultural Revolution 1930-2000)
Japan, National Paddy Yield(1st ?Agricultural Revolution 1870-1970)
Thailand
Japan
China
IndiaFrance-Wheat
USA
USA-Paddy
5
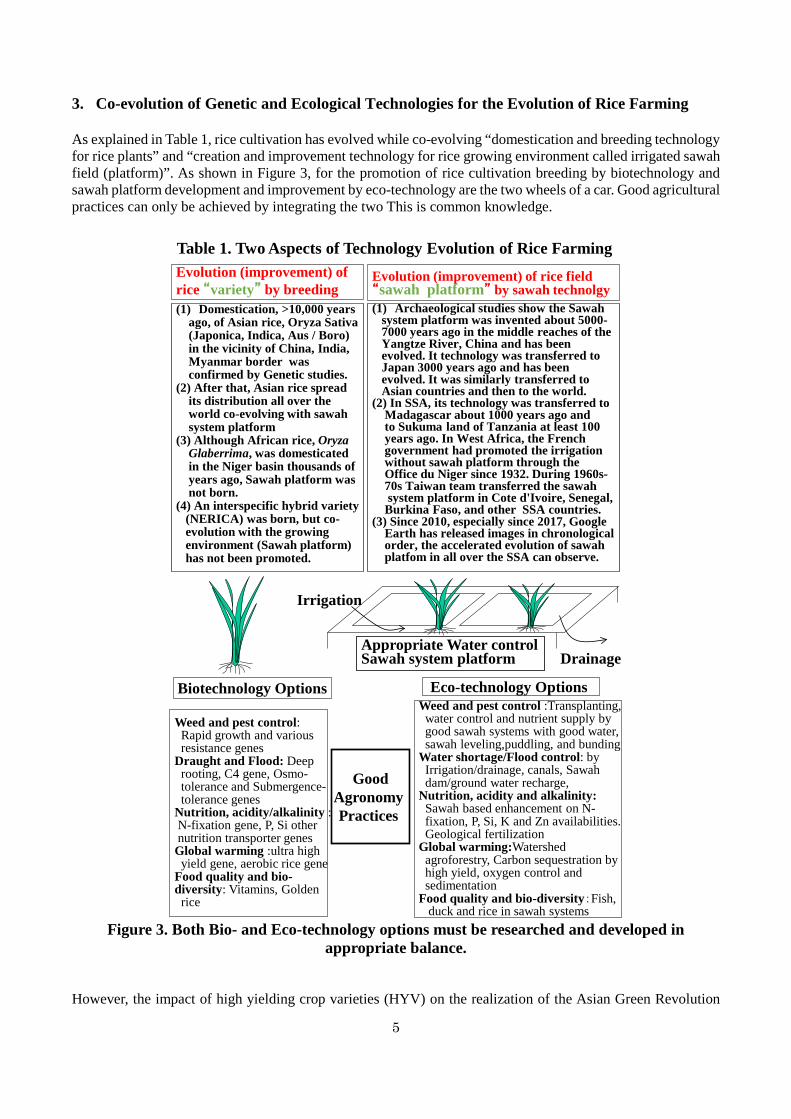
3. Co-evolution of Genetic and Ecological Technologies for the Evolution of Rice Farming As explained in Table 1, rice cultivation has evolved while co-evolving “domestication and breeding technology for rice plants” and “creation and improvement technology for rice growing environment called irrigated sawah field (platform)”. As shown in Figure 3, for the promotion of rice cultivation breeding by biotechnology and sawah platform development and improvement by eco-technology are the two wheels of a car. Good agricultural practices can only be achieved by integrating the two This is common knowledge.
Figure 3. Both Bio- and Eco-technology options must be researched and developed in
appropriate balance. However, the impact of high yielding crop varieties (HYV) on the realization of the Asian Green Revolution
Evolution (improvement) of rice “variety” by breeding(1) Domestication, >10,000 years
ago, of Asian rice, Oryza Sativa (Japonica, Indica, Aus / Boro)in the vicinity of China, India, Myanmar border was confirmed by Genetic studies.
(2) After that, Asian rice spread its distribution all over the world co-evolving with sawah system platform
(3) Although African rice, OryzaGlaberrima, was domesticated in the Niger basin thousands of years ago, Sawah platform was not born.
(4) An interspecific hybrid variety(NERICA) was born, but co-evolution with the growing environment (Sawah platform) has not been promoted.
Evolution (improvement) of rice field “sawah platform” by sawah technolgy(1) Archaeological studies show the Sawah
system platform was invented about 5000-7000 years ago in the middle reaches of the Yangtze River, China and has been evolved. It technology was transferred to Japan 3000 years ago and has been evolved. It was similarly transferred to Asian countries and then to the world.
(2) In SSA, its technology was transferred to Madagascar about 1000 years ago and to Sukuma land of Tanzania at least 100 years ago. In West Africa, the French government had promoted the irrigationwithout sawah platform through the Office du Niger since 1932. During 1960s-70s Taiwan team transferred the sawahsystem platform in Cote d'Ivoire, Senegal,
Burkina Faso, and other SSA countries.(3) Since 2010, especially since 2017, Google
Earth has released images in chronological order, the accelerated evolution of sawah platfom in all over the SSA can observe.
Table 1. Two Aspects of Technology Evolution of Rice Farming
Irrigation
Biotechnology Options
Weed and pest control: Rapid growth and various resistance genes
Draught and Flood: Deep rooting, C4 gene, Osmo-tolerance and Submergence-tolerance genes
Nutrition, acidity/alkalinity :N-fixation gene, P, Si other nutrition transporter genes
Global warming :ultra high yield gene, aerobic rice gene
Food quality and bio-diversity: Vitamins, Golden
rice
DrainageAppropriate Water controlSawah system platform
Eco-technology Options
GoodAgronomy Practices
Weed and pest control :Transplanting,water control and nutrient supply by good sawah systems with good water,sawah leveling,puddling, and bunding
Water shortage/Flood control: byIrrigation/drainage, canals, Sawahdam/ground water recharge,
Nutrition, acidity and alkalinity:Sawah based enhancement on N-fixation, P, Si, K and Zn availabilities. Geological fertilization
Global warming:Watershedagroforestry, Carbon sequestration by high yield, oxygen control and sedimentation
Food quality and bio-diversity:Fish, duck and rice in sawah systems
6
might have been overestimated. Therefore, in Sub-Saharan Africa, research strategies have been more focused with very high expectations from varietal improvement through bio-technology such as NERICA Rice, for a long time not only by SSA countries but also in international organizations such as Africa Rice Center (AfricaRice), International Institute of Tropical Agriculture (IITA) and International Rice Research Institute (IRRI) under Consultative Group for International Agricultural Research (CGIAR). In the case of rice cultivation, as described below, the growth environment of rice, which is currently known as the paddy system in English, has been invented and has been improved. The paddy system is referred to as the Sawah platform, Sawah platform, sawah system, or simply Sawah, which is described in next section of “4.Definition, Genesis and Evolution of Sawah System Platform and Sawah Technology” Based on the recent genetic studies it has been estimated that the first domesticated Asian rice, Oryza sativa, (probably the Japonica type), occurred older than 10,000 years ago, then the indica type and Aus types of rice evolved. Core ecological regions of the domestication and evolution of the Oryza sative are considered near the border areas of middle to southern China, Northeastern India and Myanmar (Huang et al. 2012, Choi et al. 2017, Mizuno et al. 2020, Zheng et al. 2016). Some report shows the Japonica and Indica types have been domesticated independently (Cheng 2019). After the domestication, the Asian rice has been spread to all over the world and evolved (Meyer and Purugganan 2013). The varietal evolution of the Asian rice have been co-evolved with the growing environment (i.e., sawah system platform). According to Khush (1997), Oryza probably originated about 130 million years ago in Gondwanaland and different species spread into different continents with the breakup of the Gondwanaland. The cultivated species originated from a common ancestor. Although the African Rice, Oryza Glaberrima, was domesticated in the Niger basin, Guinean Highlands and the Inland delta of Mali ~3000 years ago, ~6,000-7,000 years after the domestication of Asian rice (Buddenhagen and Persley 1978, Wang et al. 2014, Veltman et al. 2019). Various archaeological and genetic researches have also revealed that the origin of Sawah (paddy) based rice farming system to control both water and weeds started around 5000-6000BP years ago along Yangtze river basin (Zong et al. 2007, Gross and Zhao 2014, Liu et al. 2017, Deng et al. 2015) and the sawah based rice farming systems were dispersed and evolved in Asian countries. From about 5000 years ago, it is possible to say that co-evolution of domesticated rice seed, i.e., genetic, improvement and sawah based farming system improvement started in Asia and evolved to the present. Thus, rice farming with co-evolution of the genetic improvement and improvement of rice growing environment (i.e., sawah system improvement), spread to other parts of the whole world outside Asia, until the present. Domestication of African rice never came to invent the Sawah (paddy) based rice farming system in SSA. Probably because of shortage of time after the domestication of variety and other unknown sociohistorical and agro-ecological reasons.Thus, historically SSA farmers have no Asian type rice farming, i.e., the technology to develop Sawah system platform and the sawah based rice cultivation skills and technology. In SSA, its technology was transferred to Madagascar 1200-1300 years ago through the migrant of Austronesian language-speaking people from islands of Southeast Asia, current Malay-Indonesian area (Crowther et al. 2016). According to Carpenter (1978), the first appearance of the East African coast of Oryza sativa rice may have resulted some 2000 years ago and in 1930s, the British colonial officer noted that farmers constructed small bunds around the rice fields to control water in Sukuma land, Tanzania, south of the lake Victoria (Thornton and Allnut 1949, Meertens et al. 1999, Kato 2019). In West Africa, the French government established the Office du Niger in 1932 to develop one million hectare within 50 years to produce cotton first and later rice (Ertsen 2006). Currently about 100,000ha irrigation, the government of Mali (Wikipedia on Office du Niger 2020) has managed the scheme mainly for rice (90%) and some sugar cane (10%) currently. Since 1960, the Office du Niger has been under the control of the Government of Mali, but until the 1990s the average paddy yield had been at a low level of 2 t/ha because of no sawah system platform (details data are shown in the Table 1 of Sawah technology (3-3):Various Evolutionary Stages of Sawah System platform in SSA). During 1960s-70s Taiwan team had been transferred the Asian style sawah technology in Cote d'Ivoire, Senegal, Burkina Faso, and other SSA countries (Hsieh 2001, 2003).
4. Definition, Genesis and Evolution of Sawah System Platform and Sawah Technology
7
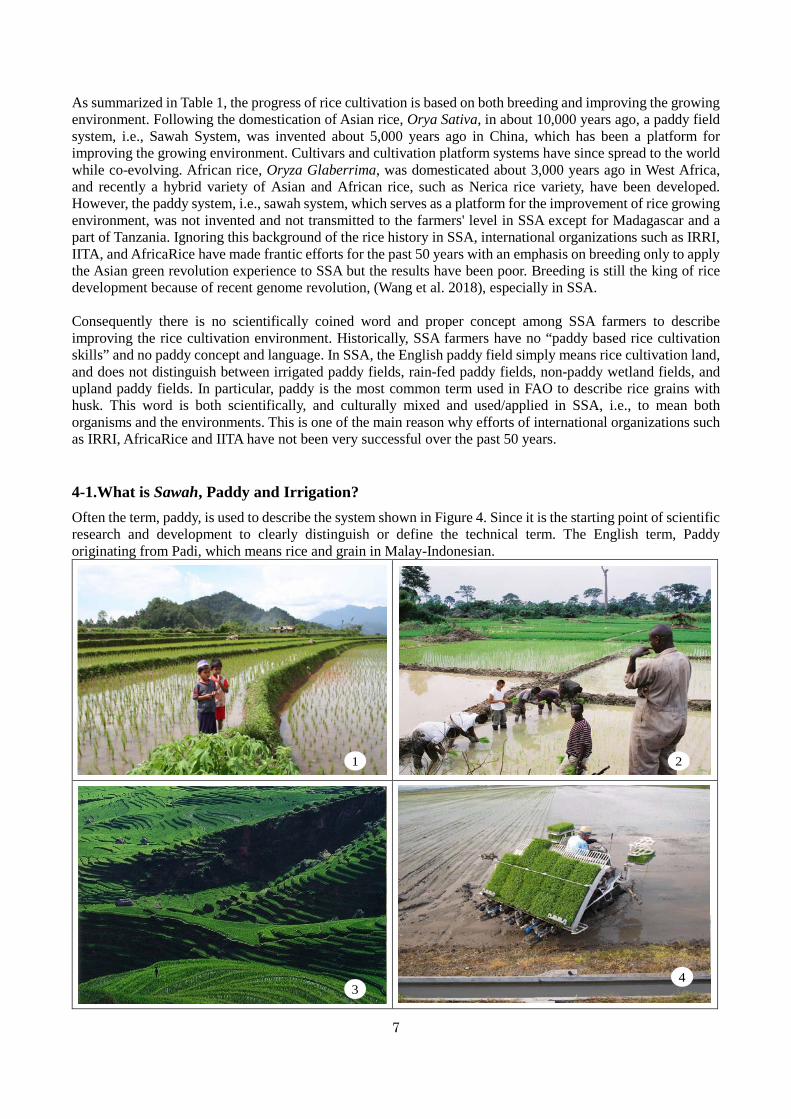
As summarized in Table 1, the progress of rice cultivation is based on both breeding and improving the growing environment. Following the domestication of Asian rice, Orya Sativa, in about 10,000 years ago, a paddy field system, i.e., Sawah System, was invented about 5,000 years ago in China, which has been a platform for improving the growing environment. Cultivars and cultivation platform systems have since spread to the world while co-evolving. African rice, Oryza Glaberrima, was domesticated about 3,000 years ago in West Africa, and recently a hybrid variety of Asian and African rice, such as Nerica rice variety, have been developed. However, the paddy system, i.e., sawah system, which serves as a platform for the improvement of rice growing environment, was not invented and not transmitted to the farmers' level in SSA except for Madagascar and a part of Tanzania. Ignoring this background of the rice history in SSA, international organizations such as IRRI, IITA, and AfricaRice have made frantic efforts for the past 50 years with an emphasis on breeding only to apply the Asian green revolution experience to SSA but the results have been poor. Breeding is still the king of rice development because of recent genome revolution, (Wang et al. 2018), especially in SSA. Consequently there is no scientifically coined word and proper concept among SSA farmers to describe improving the rice cultivation environment. Historically, SSA farmers have no “paddy based rice cultivation skills” and no paddy concept and language. In SSA, the English paddy field simply means rice cultivation land, and does not distinguish between irrigated paddy fields, rain-fed paddy fields, non-paddy wetland fields, and upland paddy fields. In particular, paddy is the most common term used in FAO to describe rice grains with husk. This word is both scientifically, and culturally mixed and used/applied in SSA, i.e., to mean both organisms and the environments. This is one of the main reason why efforts of international organizations such as IRRI, AfricaRice and IITA have not been very successful over the past 50 years. 4-1.What is Sawah, Paddy and Irrigation? Often the term, paddy, is used to describe the system shown in Figure 4. Since it is the starting point of scientific research and development to clearly distinguish or define the technical term. The English term, Paddy originating from Padi, which means rice and grain in Malay-Indonesian.
1 2
34
8
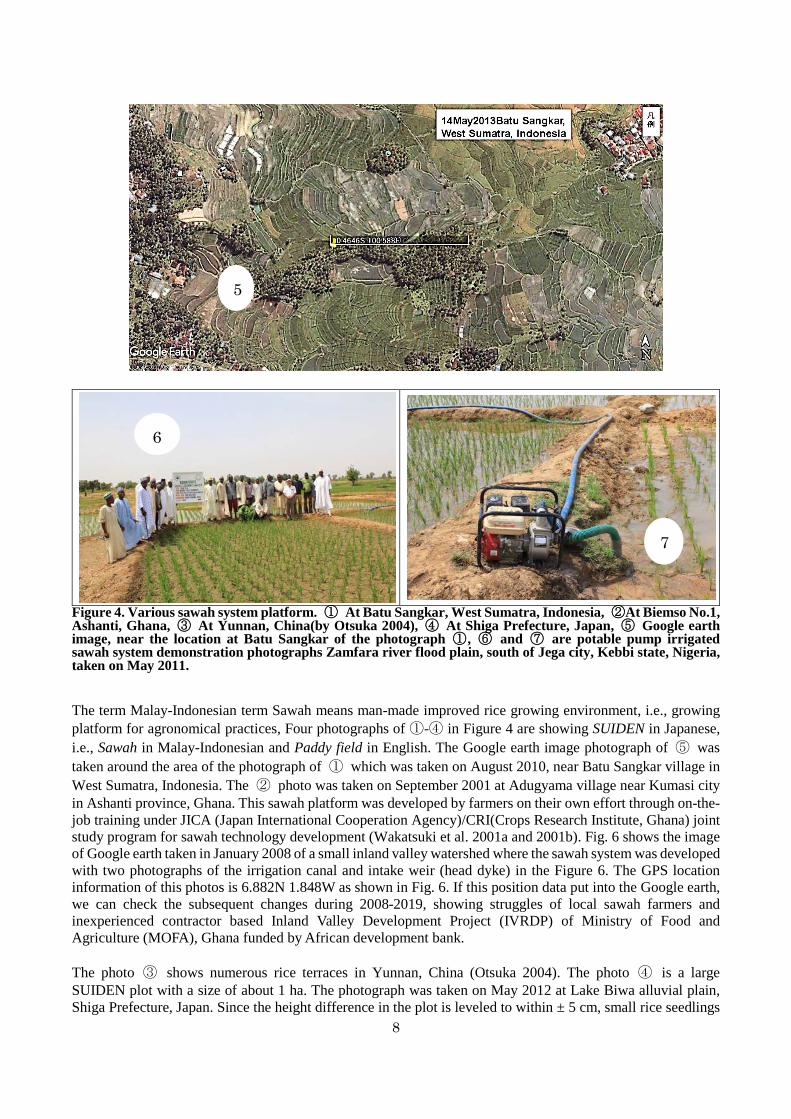
Figure 4. Various sawah system platform. ① At Batu Sangkar, West Sumatra, Indonesia, ②At Biemso No.1, Ashanti, Ghana, ③ At Yunnan, China(by Otsuka 2004), ④ At Shiga Prefecture, Japan, ⑤ Google earth image, near the location at Batu Sangkar of the photograph ①, ⑥ and ⑦ are potable pump irrigated sawah system demonstration photographs Zamfara river flood plain, south of Jega city, Kebbi state, Nigeria, taken on May 2011.
The term Malay-Indonesian term Sawah means man-made improved rice growing environment, i.e., growing platform for agronomical practices, Four photographs of ①-④ in Figure 4 are showing SUIDEN in Japanese, i.e., Sawah in Malay-Indonesian and Paddy field in English. The Google earth image photograph of ⑤ was taken around the area of the photograph of ① which was taken on August 2010, near Batu Sangkar village in West Sumatra, Indonesia. The ② photo was taken on September 2001 at Adugyama village near Kumasi city in Ashanti province, Ghana. This sawah platform was developed by farmers on their own effort through on-the-job training under JICA (Japan International Cooperation Agency)/CRI(Crops Research Institute, Ghana) joint study program for sawah technology development (Wakatsuki et al. 2001a and 2001b). Fig. 6 shows the image of Google earth taken in January 2008 of a small inland valley watershed where the sawah system was developed with two photographs of the irrigation canal and intake weir (head dyke) in the Figure 6. The GPS location information of this photos is 6.882N 1.848W as shown in Fig. 6. If this position data put into the Google earth, we can check the subsequent changes during 2008-2019, showing struggles of local sawah farmers and inexperienced contractor based Inland Valley Development Project (IVRDP) of Ministry of Food and Agriculture (MOFA), Ghana funded by African development bank. The photo ③ shows numerous rice terraces in Yunnan, China (Otsuka 2004). The photo ④ is a large SUIDEN plot with a size of about 1 ha. The photograph was taken on May 2012 at Lake Biwa alluvial plain, Shiga Prefecture, Japan. Since the height difference in the plot is leveled to within ± 5 cm, small rice seedlings
5
6
7
9
with a plant height of 15 cm or less can be transplanted with a mechanized rice trans-planter. The irrigation canal is visible in the foreground. ⑥ is a photo of the Sawah system platform for a one-ha demonstration developed by farmers on-the-job training on the Zamfara River flood plain, south of Jega, Kebbi, Nigeria. ⑦ is a small pump for irrigation and the groundwater level is shallower than 5m. Both shot in May 2011. The dry season in this area is from November to June.
4-1-1. Sawah and Sawah System (Platform) definition
As shown in the Table 2, the term of Sawah is Malay-Indonesian term to describe man-made enclosed leveled rice field by bund to facilitate water and weed control as well as soil conservation. The English word Paddy comes from the Malay-Indonesian word Padi, which means just rice plant and unhusked rice grain as FAOSTAT using paddy yield. The term padi has no meaning to describe rice growing environment and no meaning to describe eco-technological concept and term to improve rice growing fields. The basic characteristics of sawah system platform are, (1) Bunding with appropriate height, width with compaction and surface sealing to control leakage. Layouts of
bunding are normally follow topographic contour lines to minimize sawah plots leveling works. However a right-angled quadrilateral is the best shape for efficient for the operation and management of rice farming.
(2) Leveling to within 10cm height difference, i.e., ±5cm, within one sawah plot bunded, (3) Ordinary soil surface of the sawah is puddled to facilitate leveling, weed and water leakage control, (4) Ordinary sawah plots have water inlet connecting irrigation canal/pumping hose and water outlet to drainage
canal/ direct drainage to underground through soil. Sometime outlet(s) of upper sawah(s) plots are the inlet(s) of lower sawah(s) plots, and
(5) Rain-fed sawahs have no man-made irrigation and drainage facilities except for direct rainfall and natural water harvesting and drainage using topography.
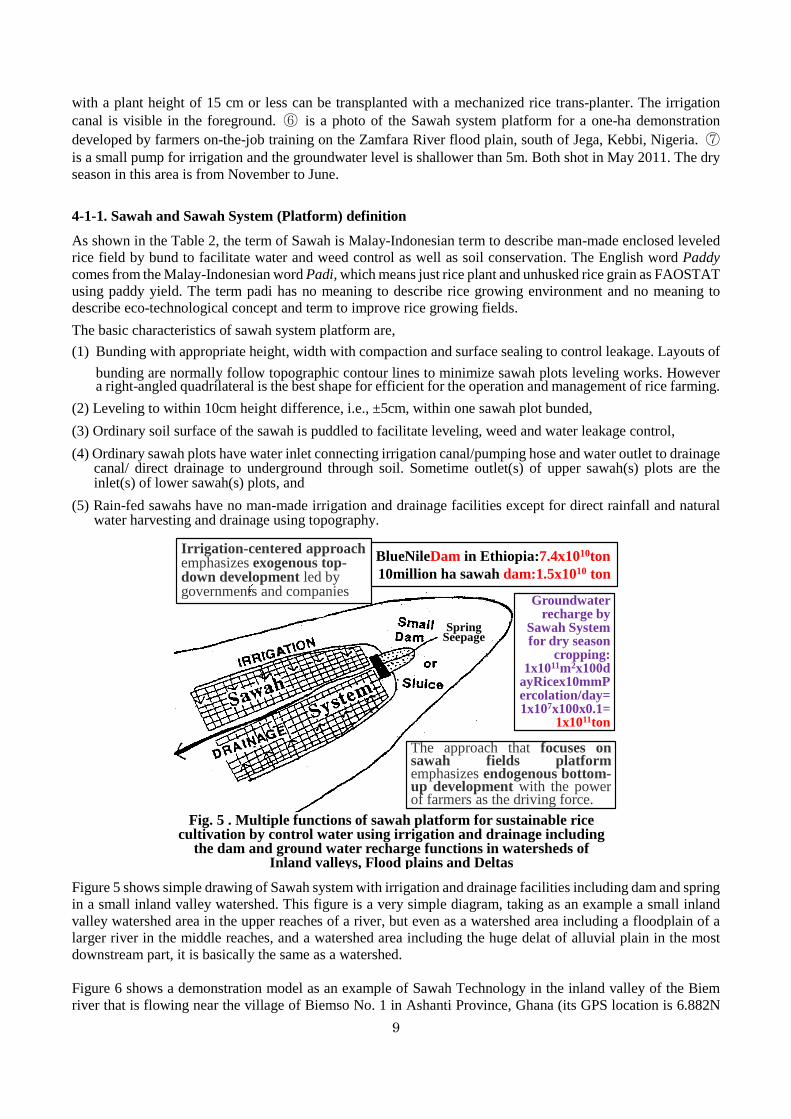
Figure 5 shows simple drawing of Sawah system with irrigation and drainage facilities including dam and spring in a small inland valley watershed. This figure is a very simple diagram, taking as an example a small inland valley watershed area in the upper reaches of a river, but even as a watershed area including a floodplain of a larger river in the middle reaches, and a watershed area including the huge delat of alluvial plain in the most downstream part, it is basically the same as a watershed. Figure 6 shows a demonstration model as an example of Sawah Technology in the inland valley of the Biem river that is flowing near the village of Biemso No. 1 in Ashanti Province, Ghana (its GPS location is 6.882N
Spring Seepage
1
Fig. 5 . Multiple functions of sawah platform for sustainable rice cultivation by control water using irrigation and drainage including
the dam and ground water recharge functions in watersheds of Inland valleys, Flood plains and Deltas
Irrigation-centered approach emphasizes exogenous top-down development led by governments and companies
The approach that focuses onsawah fields platformemphasizes endogenous bottom-up development with the powerof farmers as the driving force.
BlueNileDam in Ethiopia:7.4x10¹⁰ton10million ha sawah dam:1.5x10¹⁰ ton
Groundwater recharge by
Sawah System for dry season
cropping: 1x10¹¹m2x100d
ayRicex10mmPercolation/day=1x107x100x0.1=
1x10¹¹ton
10
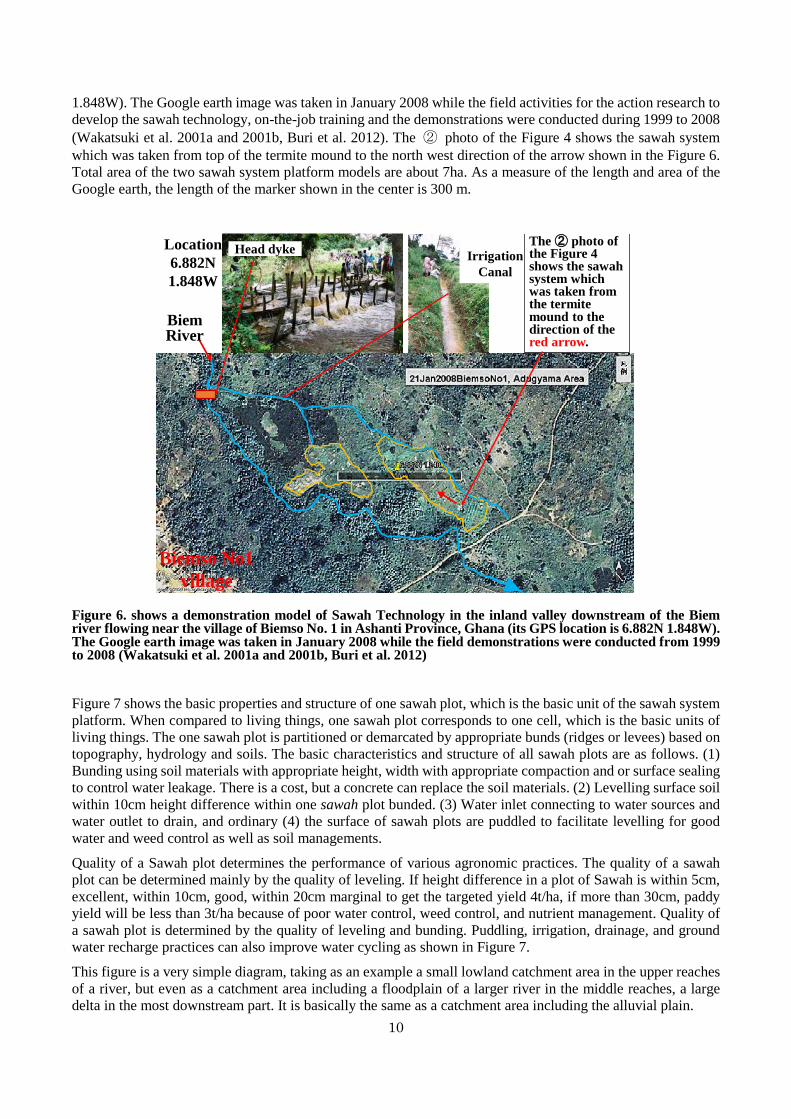
1.848W). The Google earth image was taken in January 2008 while the field activities for the action research to develop the sawah technology, on-the-job training and the demonstrations were conducted during 1999 to 2008 (Wakatsuki et al. 2001a and 2001b, Buri et al. 2012). The ② photo of the Figure 4 shows the sawah system which was taken from top of the termite mound to the north west direction of the arrow shown in the Figure 6. Total area of the two sawah system platform models are about 7ha. As a measure of the length and area of the Google earth, the length of the marker shown in the center is 300 m.
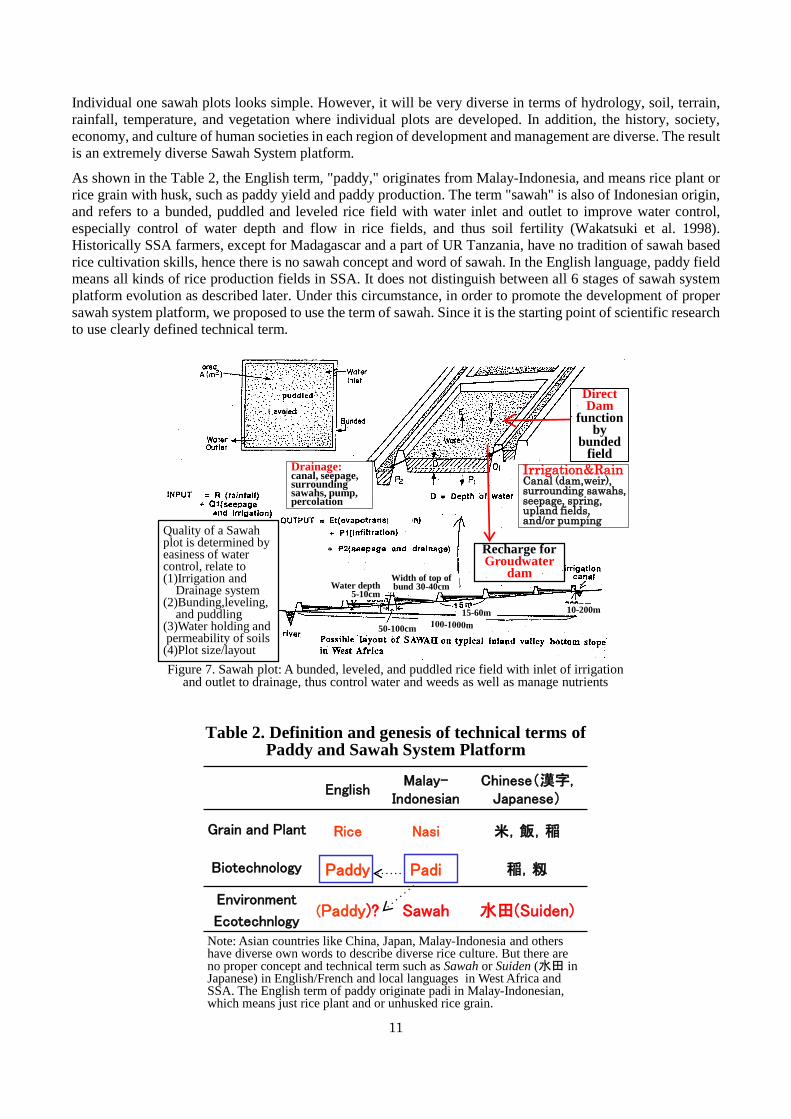
Figure 6. shows a demonstration model of Sawah Technology in the inland valley downstream of the Biem river flowing near the village of Biemso No. 1 in Ashanti Province, Ghana (its GPS location is 6.882N 1.848W). The Google earth image was taken in January 2008 while the field demonstrations were conducted from 1999 to 2008 (Wakatsuki et al. 2001a and 2001b, Buri et al. 2012) Figure 7 shows the basic properties and structure of one sawah plot, which is the basic unit of the sawah system platform. When compared to living things, one sawah plot corresponds to one cell, which is the basic units of living things. The one sawah plot is partitioned or demarcated by appropriate bunds (ridges or levees) based on topography, hydrology and soils. The basic characteristics and structure of all sawah plots are as follows. (1) Bunding using soil materials with appropriate height, width with appropriate compaction and or surface sealing to control water leakage. There is a cost, but a concrete can replace the soil materials. (2) Levelling surface soil within 10cm height difference within one sawah plot bunded. (3) Water inlet connecting to water sources and water outlet to drain, and ordinary (4) the surface of sawah plots are puddled to facilitate levelling for good water and weed control as well as soil managements.
Quality of a Sawah plot determines the performance of various agronomic practices. The quality of a sawah plot can be determined mainly by the quality of leveling. If height difference in a plot of Sawah is within 5cm, excellent, within 10cm, good, within 20cm marginal to get the targeted yield 4t/ha, if more than 30cm, paddy yield will be less than 3t/ha because of poor water control, weed control, and nutrient management. Quality of a sawah plot is determined by the quality of leveling and bunding. Puddling, irrigation, drainage, and ground water recharge practices can also improve water cycling as shown in Figure 7.
This figure is a very simple diagram, taking as an example a small lowland catchment area in the upper reaches of a river, but even as a catchment area including a floodplain of a larger river in the middle reaches, a large delta in the most downstream part. It is basically the same as a catchment area including the alluvial plain.
BiemRiver
Head dyke Irrigation Canal
The ② photo of the Figure 4 shows the sawahsystem which was taken from the termite mound to the direction of the red arrow.
Biemso No1village
Location6.882N1.848W
11
Individual one sawah plots looks simple. However, it will be very diverse in terms of hydrology, soil, terrain, rainfall, temperature, and vegetation where individual plots are developed. In addition, the history, society, economy, and culture of human societies in each region of development and management are diverse. The result is an extremely diverse Sawah System platform.
As shown in the Table 2, the English term, "paddy," originates from Malay-Indonesia, and means rice plant or rice grain with husk, such as paddy yield and paddy production. The term "sawah" is also of Indonesian origin, and refers to a bunded, puddled and leveled rice field with water inlet and outlet to improve water control, especially control of water depth and flow in rice fields, and thus soil fertility (Wakatsuki et al. 1998). Historically SSA farmers, except for Madagascar and a part of UR Tanzania, have no tradition of sawah based rice cultivation skills, hence there is no sawah concept and word of sawah. In the English language, paddy field means all kinds of rice production fields in SSA. It does not distinguish between all 6 stages of sawah system platform evolution as described later. Under this circumstance, in order to promote the development of proper sawah system platform, we proposed to use the term of sawah. Since it is the starting point of scientific research to use clearly defined technical term.
10-200m
50-100cm
2
Figure 7. Sawah plot: A bunded, leveled, and puddled rice field with inlet of irrigation and outlet to drainage, thus control water and weeds as well as manage nutrients
15-60m
Water depth5-10cm
Width of top of bund 30-40cm
Direct Dam
functionby
bundedfield
Recharge forGroudwater
dam
Quality of a Sawahplot is determined by easiness of water control, relate to (1)Irrigation and
Drainage system(2)Bunding,leveling,
and puddling(3)Water holding and permeability of soils
(4)Plot size/layout
Irrigation&RainCanal (dam,weir),surrounding sawahs, seepage, spring, upland fields, and/or pumping
Drainage: canal, seepage, surrounding sawahs, pump, percolation
EnglishMalay-
IndonesianChinese(漢字,
Japanese)
Grain and Plant Rice Nasi 米,飯,稲
Biotechnology Paddy Padi 稲,籾
Environment
Ecotechnlogy(Paddy)? Sawah 水田(Suiden)
Table 2. Definition and genesis of technical terms of Paddy and Sawah System Platform
Note: Asian countries like China, Japan, Malay-Indonesia and others have diverse own words to describe diverse rice culture. But there are no proper concept and technical term such as Sawah or Suiden (水田 in Japanese) in English/French and local languages in West Africa and SSA. The English term of paddy originate padi in Malay-Indonesian, which means just rice plant and or unhusked rice grain.
12
As shown in the Table 2, the English term, "paddy," originates from Malay-Indonesia, and means rice plant or rice grain with husk, such as paddy yield and paddy production. The term "sawah" is also of Indonesian origin, and refers to a bunded, puddled and leveled rice field with water inlet and outlet to improve water control, especially control of water depth and flow in rice fields, and thus soil fertility (Wakatsuki et al. 1998). Historically SSA farmers, except for Madagascar and a part of UR Tanzania, have no tradition of sawah based rice cultivation skills, hence there is no sawah concept and word of sawah. In the English language, paddy field means all kinds of rice production fields in SSA. It does not distinguish between all 6 stages of sawah system platform evolution as described later. Under this circumstance, in order to promote the development of proper sawah system platform, we proposed to use the term of sawah. Since it is the starting point of scientific research to use clearly defined technical term. 4-1-2. Sawah, Paddy, and Irrigation
Improve the sawah plot quality and management can improve irrigation and fertilizer use efficiency, and with a good sawah system platform, improved varieties can perform well to realize a GR in SSA. Suffice it to say that the good sawah system is the prerequisite platform or condition to be applied to realize the three GR technologies successfully (Sawah hypothesis 1). The lowland sawah can sustain rice yields higher than 4 t/ha through macro-scale natural geological fertilization from upland and micro-scale mechanisms to enhance various nutrients' supplies as described later in Sawah Technology 4 (Principles and Theory, Practices), if appropriate lowlands are selected, developed into standard sawah system platforms so that soil and water can be managed properly.
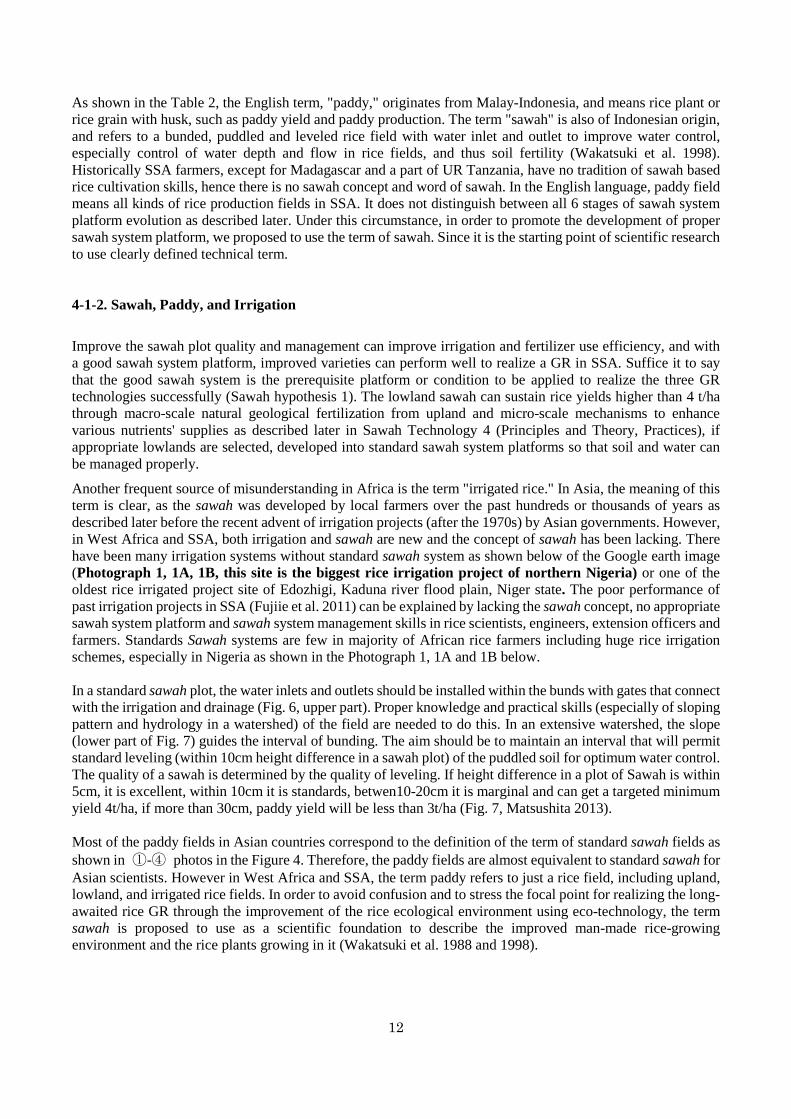
Another frequent source of misunderstanding in Africa is the term "irrigated rice." In Asia, the meaning of this term is clear, as the sawah was developed by local farmers over the past hundreds or thousands of years as described later before the recent advent of irrigation projects (after the 1970s) by Asian governments. However, in West Africa and SSA, both irrigation and sawah are new and the concept of sawah has been lacking. There have been many irrigation systems without standard sawah system as shown below of the Google earth image (Photograph 1, 1A, 1B, this site is the biggest rice irrigation project of northern Nigeria) or one of the oldest rice irrigated project site of Edozhigi, Kaduna river flood plain, Niger state. The poor performance of past irrigation projects in SSA (Fujiie et al. 2011) can be explained by lacking the sawah concept, no appropriate sawah system platform and sawah system management skills in rice scientists, engineers, extension officers and farmers. Standards Sawah systems are few in majority of African rice farmers including huge rice irrigation schemes, especially in Nigeria as shown in the Photograph 1, 1A and 1B below. In a standard sawah plot, the water inlets and outlets should be installed within the bunds with gates that connect with the irrigation and drainage (Fig. 6, upper part). Proper knowledge and practical skills (especially of sloping pattern and hydrology in a watershed) of the field are needed to do this. In an extensive watershed, the slope (lower part of Fig. 7) guides the interval of bunding. The aim should be to maintain an interval that will permit standard leveling (within 10cm height difference in a sawah plot) of the puddled soil for optimum water control. The quality of a sawah is determined by the quality of leveling. If height difference in a plot of Sawah is within 5cm, it is excellent, within 10cm it is standards, betwen10-20cm it is marginal and can get a targeted minimum yield 4t/ha, if more than 30cm, paddy yield will be less than 3t/ha (Fig. 7, Matsushita 2013). Most of the paddy fields in Asian countries correspond to the definition of the term of standard sawah fields as shown in ①-④ photos in the Figure 4. Therefore, the paddy fields are almost equivalent to standard sawah for Asian scientists. However in West Africa and SSA, the term paddy refers to just a rice field, including upland, lowland, and irrigated rice fields. In order to avoid confusion and to stress the focal point for realizing the long-awaited rice GR through the improvement of the rice ecological environment using eco-technology, the term sawah is proposed to use as a scientific foundation to describe the improved man-made rice-growing environment and the rice plants growing in it (Wakatsuki et al. 1988 and 1998).
13
Photograph 1. The whole picture of irrigation project site of Kadawa (B and C area), Kura (A area) and Tiga Dam lake, which were developed in the Kano River basin of Nigeria. The total area reaches 15000ha scale. Length of the scale maker is 20km. Expanded Google Earth of A, B, and C below are showing almost all sawah systems are micro rudimentary sawah system, evolutionary stage 3, in which three green revolution technology can not be applied effectively.
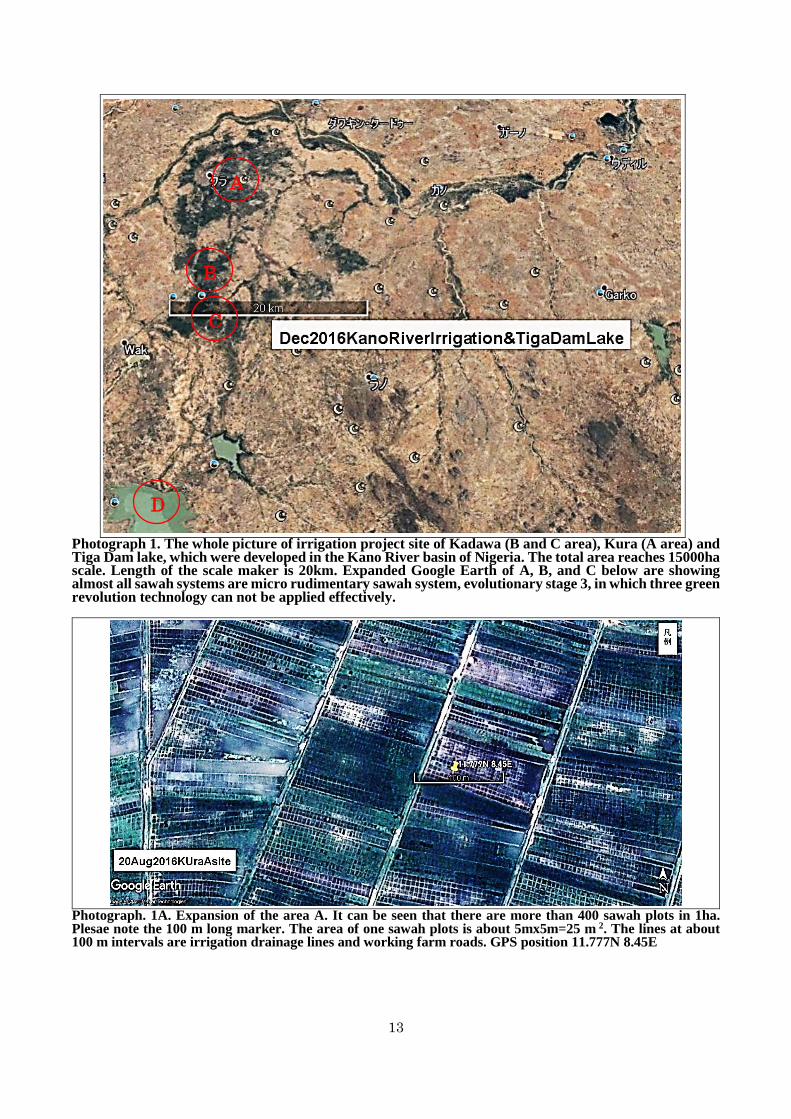
Photograph. 1A. Expansion of the area A. It can be seen that there are more than 400 sawah plots in 1ha. Plesae note the 100 m long marker. The area of one sawah plots is about 5mx5m=25 m 2. The lines at about 100 m intervals are irrigation drainage lines and working farm roads. GPS position 11.777N 8.45E
A
B
C
D
14
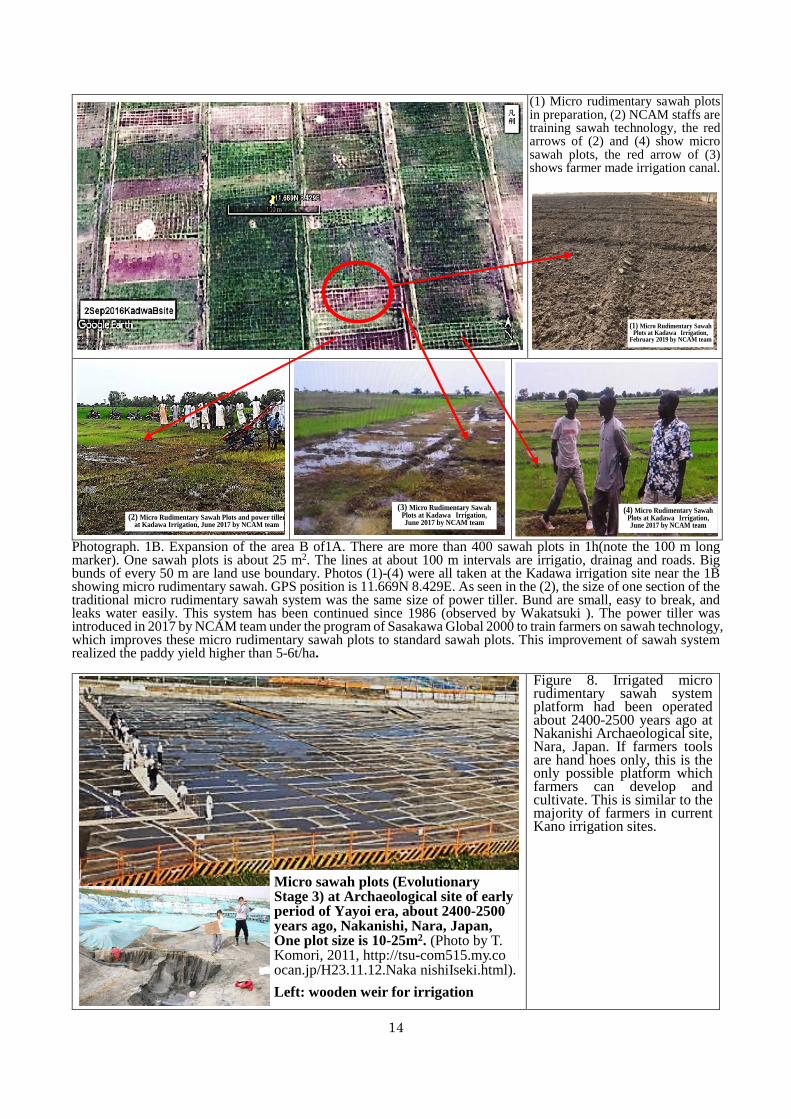
(1) Micro rudimentary sawah plots in preparation, (2) NCAM staffs are training sawah technology, the red arrows of (2) and (4) show micro sawah plots, the red arrow of (3) shows farmer made irrigation canal.
Photograph. 1B. Expansion of the area B of1A. There are more than 400 sawah plots in 1h(note the 100 m long marker). One sawah plots is about 25 m2. The lines at about 100 m intervals are irrigatio, drainag and roads. Big bunds of every 50 m are land use boundary. Photos (1)-(4) were all taken at the Kadawa irrigation site near the 1B showing micro rudimentary sawah. GPS position is 11.669N 8.429E. As seen in the (2), the size of one section of the traditional micro rudimentary sawah system was the same size of power tiller. Bund are small, easy to break, and leaks water easily. This system has been continued since 1986 (observed by Wakatsuki ). The power tiller was introduced in 2017 by NCAM team under the program of Sasakawa Global 2000 to train farmers on sawah technology, which improves these micro rudimentary sawah plots to standard sawah plots. This improvement of sawah system realized the paddy yield higher than 5-6t/ha.
Figure 8. Irrigated micro rudimentary sawah system platform had been operated about 2400-2500 years ago at Nakanishi Archaeological site, Nara, Japan. If farmers tools are hand hoes only, this is the only possible platform which farmers can develop and cultivate. This is similar to the majority of farmers in current Kano irrigation sites.
(1) Micro Rudimentary SawahPlots at Kadawa Irrigation,
February 2019 by NCAM team
(2) Micro Rudimentary Sawah Plots and power tiller at Kadawa Irrigation, June 2017 by NCAM team
(3) Micro Rudimentary SawahPlots at Kadawa Irrigation, June 2017 by NCAM team
(4) Micro Rudimentary SawahPlots at Kadawa Irrigation, June 2017 by NCAM team
Micro sawah plots (Evolutionary Stage 3) at Archaeological site of early period of Yayoi era, about 2400-2500 years ago, Nakanishi, Nara, Japan,One plot size is 10-25m2. (Photo by T. Komori, 2011, http://tsu-com515.my.co ocan.jp/H23.11.12.Naka nishiIseki.html). Left: wooden weir for irrigation
15
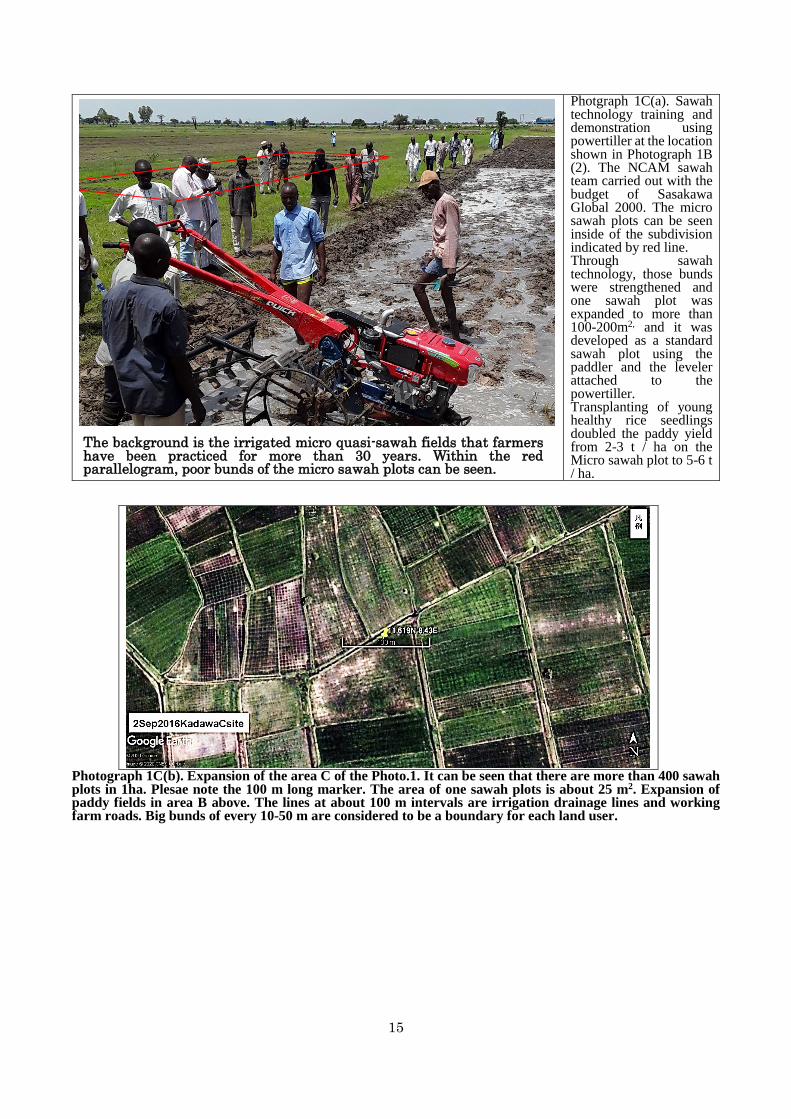
Photgraph 1C(a). Sawah technology training and demonstration using powertiller at the location shown in Photograph 1B (2). The NCAM sawah team carried out with the budget of Sasakawa Global 2000. The micro sawah plots can be seen inside of the subdivision indicated by red line. Through sawah technology, those bunds were strengthened and one sawah plot was expanded to more than 100-200m2, and it was developed as a standard sawah plot using the paddler and the leveler attached to the powertiller. Transplanting of young healthy rice seedlings doubled the paddy yield from 2-3 t / ha on the Micro sawah plot to 5-6 t / ha.
Photograph 1C(b). Expansion of the area C of the Photo.1. It can be seen that there are more than 400 sawah plots in 1ha. Plesae note the 100 m long marker. The area of one sawah plots is about 25 m2. Expansion of paddy fields in area B above. The lines at about 100 m intervals are irrigation drainage lines and working farm roads. Big bunds of every 10-50 m are considered to be a boundary for each land user.
The background is the irrigated micro quasi-sawah fields that farmers have been practiced for more than 30 years. Within the red parallelogram, poor bunds of the micro sawah plots can be seen.
16
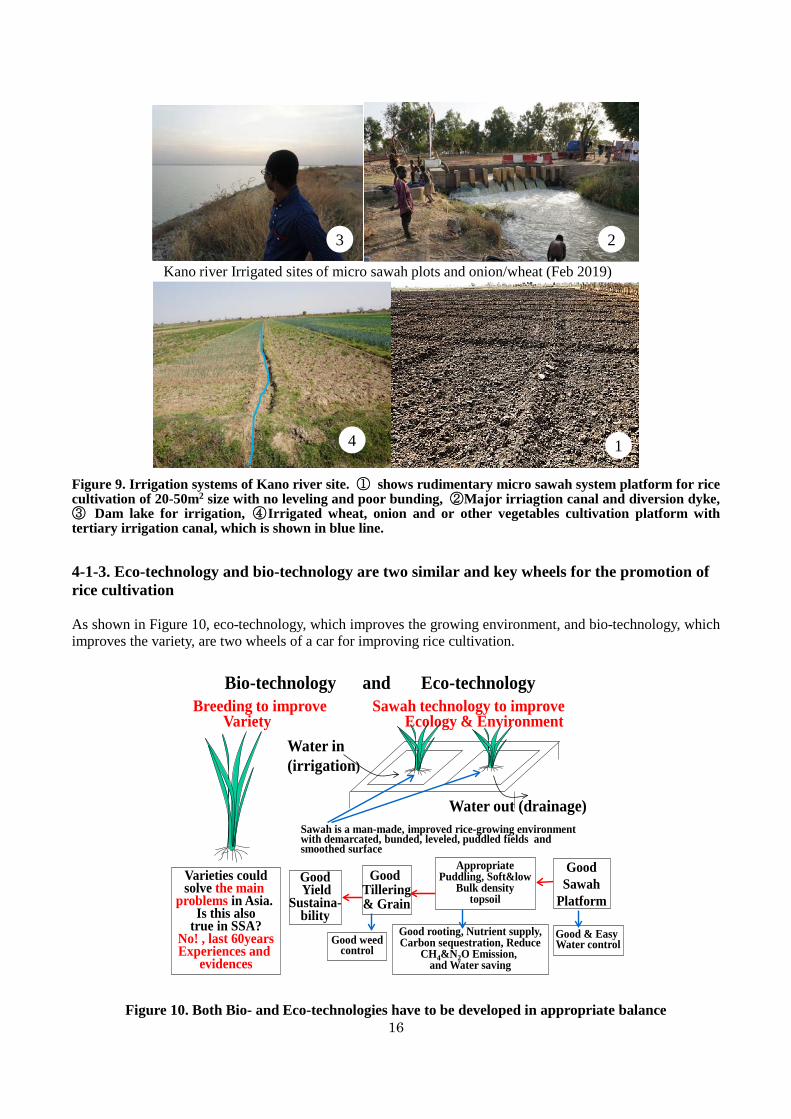
Figure 9. Irrigation systems of Kano river site. ① shows rudimentary micro sawah system platform for rice cultivation of 20-50m2 size with no leveling and poor bunding, ②Major irriagtion canal and diversion dyke, ③ Dam lake for irrigation, ④Irrigated wheat, onion and or other vegetables cultivation platform with tertiary irrigation canal, which is shown in blue line. 4-1-3. Eco-technology and bio-technology are two similar and key wheels for the promotion of rice cultivation As shown in Figure 10, eco-technology, which improves the growing environment, and bio-technology, which improves the variety, are two wheels of a car for improving rice cultivation.
Figure 10. Both Bio- and Eco-technologies have to be developed in appropriate balance
Kano river Irrigated sites of micro sawah plots and onion/wheat (Feb 2019)
1
3 2
4
Sawah is a man-made, improved rice-growing environment with demarcated, bunded, leveled, puddled fields and smoothed surface
Breeding to improve Sawah technology to improve Variety Ecology & Environment
Water in(irrigation)
Bio-technology and Eco-technology
Varieties couldsolve the main
problems in Asia. Is this also
true in SSA?No! , last 60yearsExperiences and
evidences
Water out (drainage)
GoodYield
Sustaina-bility
Good Tillering& Grain
AppropriatePuddling, Soft&low
Bulk densitytopsoil
GoodSawah
Platform
Good & Easy Water control
Good rooting, Nutrient supply,Carbon sequestration, Reduce
CH4&N2O Emission, and Water saving
Good weedcontrol
17
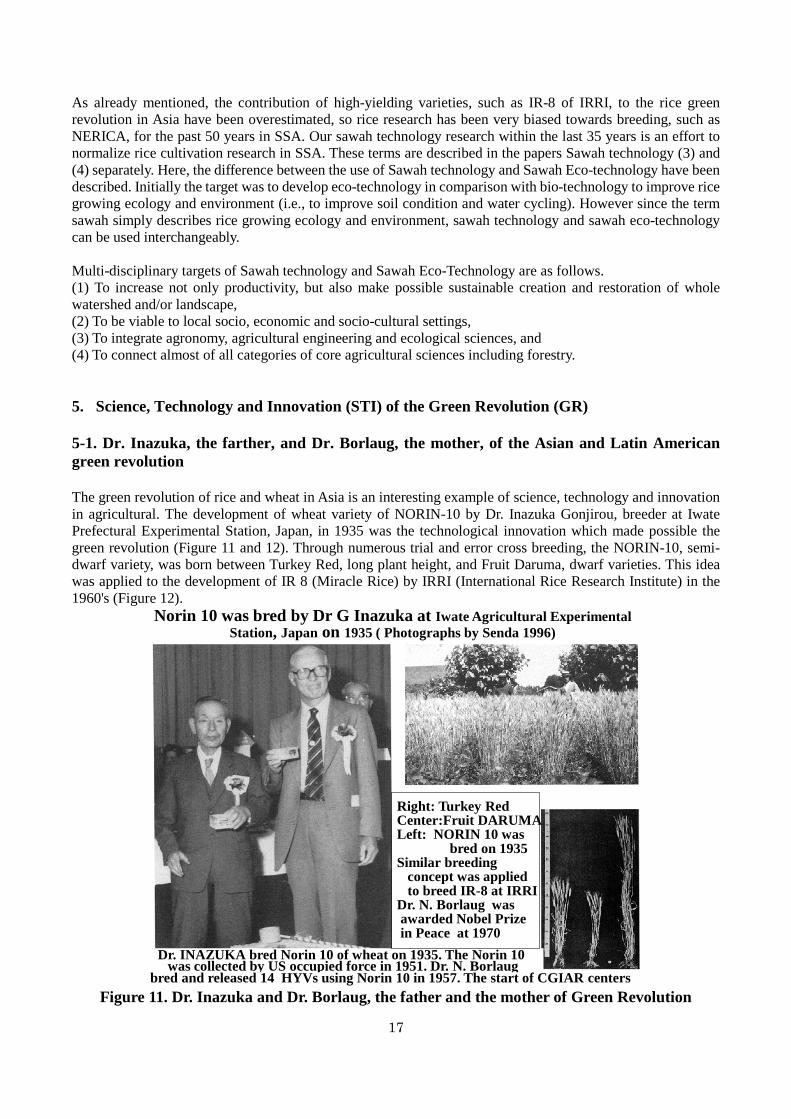
As already mentioned, the contribution of high-yielding varieties, such as IR-8 of IRRI, to the rice green revolution in Asia have been overestimated, so rice research has been very biased towards breeding, such as NERICA, for the past 50 years in SSA. Our sawah technology research within the last 35 years is an effort to normalize rice cultivation research in SSA. These terms are described in the papers Sawah technology (3) and (4) separately. Here, the difference between the use of Sawah technology and Sawah Eco-technology have been described. Initially the target was to develop eco-technology in comparison with bio-technology to improve rice growing ecology and environment (i.e., to improve soil condition and water cycling). However since the term sawah simply describes rice growing ecology and environment, sawah technology and sawah eco-technology can be used interchangeably. Multi-disciplinary targets of Sawah technology and Sawah Eco-Technology are as follows. (1) To increase not only productivity, but also make possible sustainable creation and restoration of whole watershed and/or landscape, (2) To be viable to local socio, economic and socio-cultural settings, (3) To integrate agronomy, agricultural engineering and ecological sciences, and (4) To connect almost of all categories of core agricultural sciences including forestry. 5. Science, Technology and Innovation (STI) of the Green Revolution (GR) 5-1. Dr. Inazuka, the farther, and Dr. Borlaug, the mother, of the Asian and Latin American green revolution The green revolution of rice and wheat in Asia is an interesting example of science, technology and innovation in agricultural. The development of wheat variety of NORIN-10 by Dr. Inazuka Gonjirou, breeder at Iwate Prefectural Experimental Station, Japan, in 1935 was the technological innovation which made possible the green revolution (Figure 11 and 12). Through numerous trial and error cross breeding, the NORIN-10, semi-dwarf variety, was born between Turkey Red, long plant height, and Fruit Daruma, dwarf varieties. This idea was applied to the development of IR 8 (Miracle Rice) by IRRI (International Rice Research Institute) in the 1960's (Figure 12).
Figure 11. Dr. Inazuka and Dr. Borlaug, the father and the mother of Green Revolution
Dr. INAZUKA bred Norin 10 of wheat on 1935. The Norin 10 was collected by US occupied force in 1951. Dr. N. Borlaug
Right: Turkey RedCenter:Fruit DARUMALeft: NORIN 10 was
bred on 1935Similar breeding
concept was appliedto breed IR-8 at IRRI
Dr. N. Borlaug was awarded Nobel Prizein Peace at 1970
Norin 10 was bred by Dr G Inazuka at Iwate Agricultural Experimental Station, Japan on 1935 ( Photographs by Senda 1996)
bred and released 14 HYVs using Norin 10 in 1957. The start of CGIAR centers
18
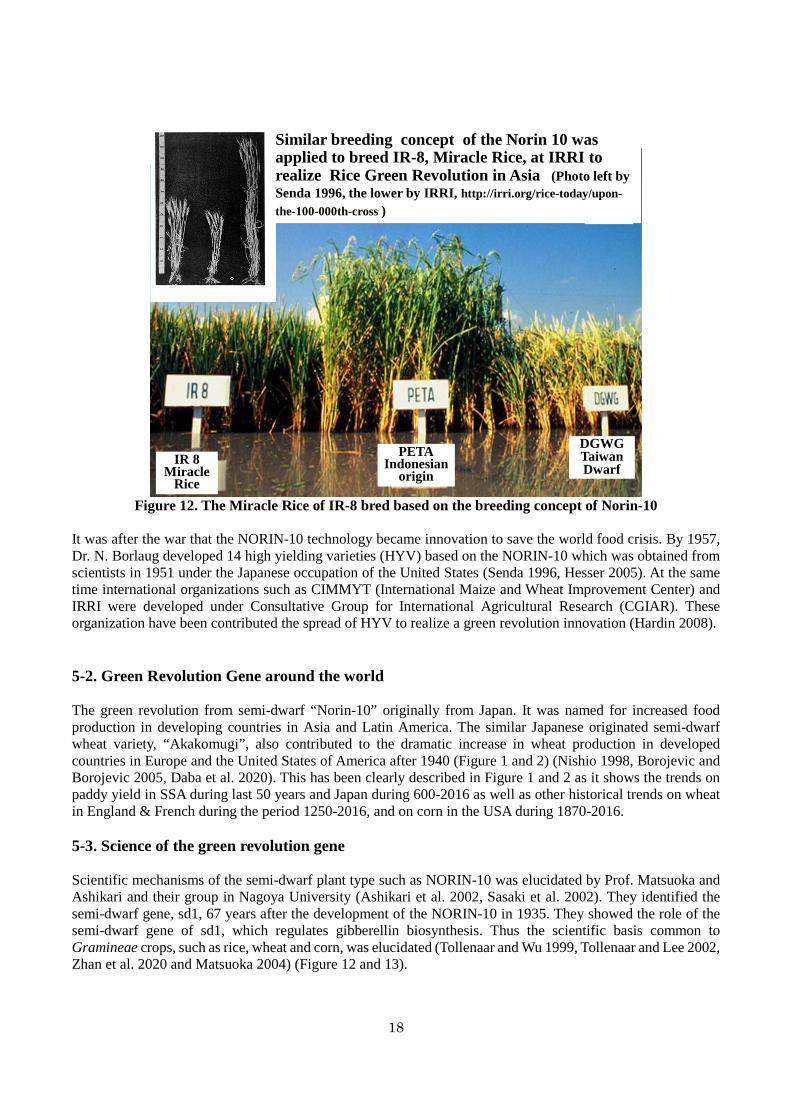
Figure 12. The Miracle Rice of IR-8 bred based on the breeding concept of Norin-10
It was after the war that the NORIN-10 technology became innovation to save the world food crisis. By 1957, Dr. N. Borlaug developed 14 high yielding varieties (HYV) based on the NORIN-10 which was obtained from scientists in 1951 under the Japanese occupation of the United States (Senda 1996, Hesser 2005). At the same time international organizations such as CIMMYT (International Maize and Wheat Improvement Center) and IRRI were developed under Consultative Group for International Agricultural Research (CGIAR). These organization have been contributed the spread of HYV to realize a green revolution innovation (Hardin 2008). 5-2. Green Revolution Gene around the world The green revolution from semi-dwarf “Norin-10” originally from Japan. It was named for increased food production in developing countries in Asia and Latin America. The similar Japanese originated semi-dwarf wheat variety, “Akakomugi”, also contributed to the dramatic increase in wheat production in developed countries in Europe and the United States of America after 1940 (Figure 1 and 2) (Nishio 1998, Borojevic and Borojevic 2005, Daba et al. 2020). This has been clearly described in Figure 1 and 2 as it shows the trends on paddy yield in SSA during last 50 years and Japan during 600-2016 as well as other historical trends on wheat in England & French during the period 1250-2016, and on corn in the USA during 1870-2016. 5-3. Science of the green revolution gene Scientific mechanisms of the semi-dwarf plant type such as NORIN-10 was elucidated by Prof. Matsuoka and Ashikari and their group in Nagoya University (Ashikari et al. 2002, Sasaki et al. 2002). They identified the semi-dwarf gene, sd1, 67 years after the development of the NORIN-10 in 1935. They showed the role of the semi-dwarf gene of sd1, which regulates gibberellin biosynthesis. Thus the scientific basis common to Gramineae crops, such as rice, wheat and corn, was elucidated (Tollenaar and Wu 1999, Tollenaar and Lee 2002, Zhan et al. 2020 and Matsuoka 2004) (Figure 12 and 13).
IRRI
DGWG TaiwanDwarf
PETAIndonesian
originIR 8
Miracle Rice
Similar breeding concept of the Norin 10 was applied to breed IR-8, Miracle Rice, at IRRI to realize Rice Green Revolution in Asia (Photo left by Senda 1996, the lower by IRRI, http://irri.org/rice-today/upon-the-100-000th-cross )
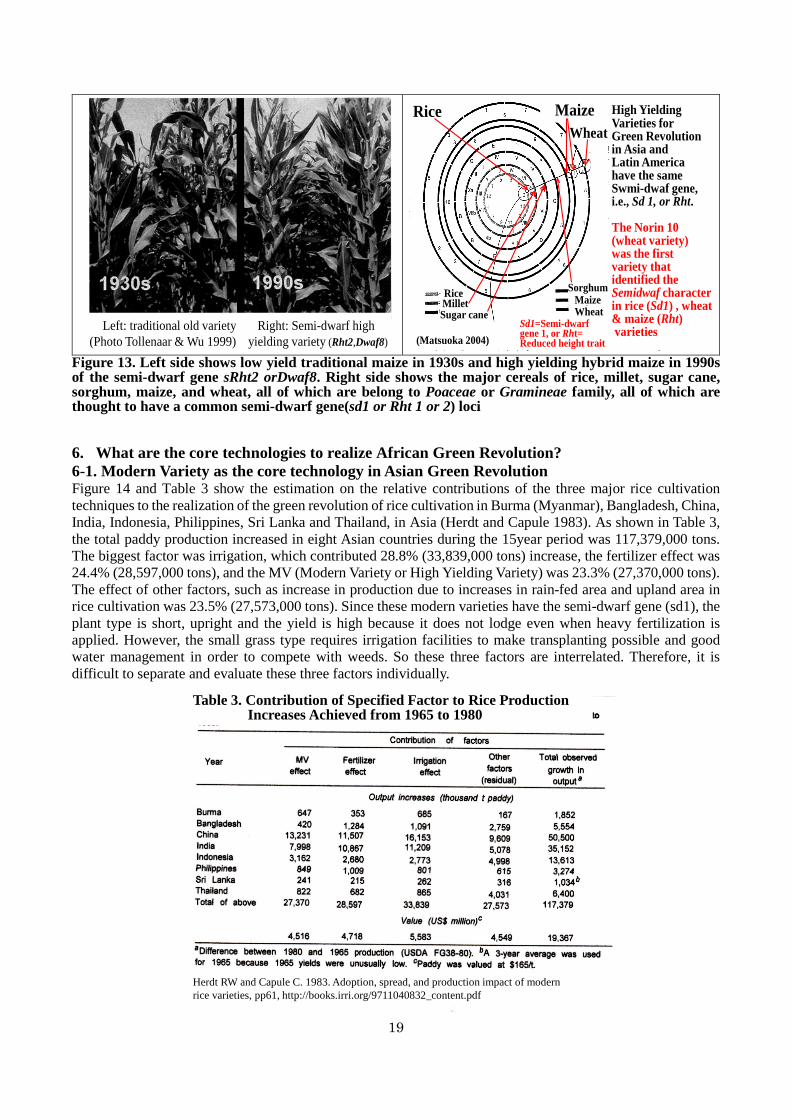
19
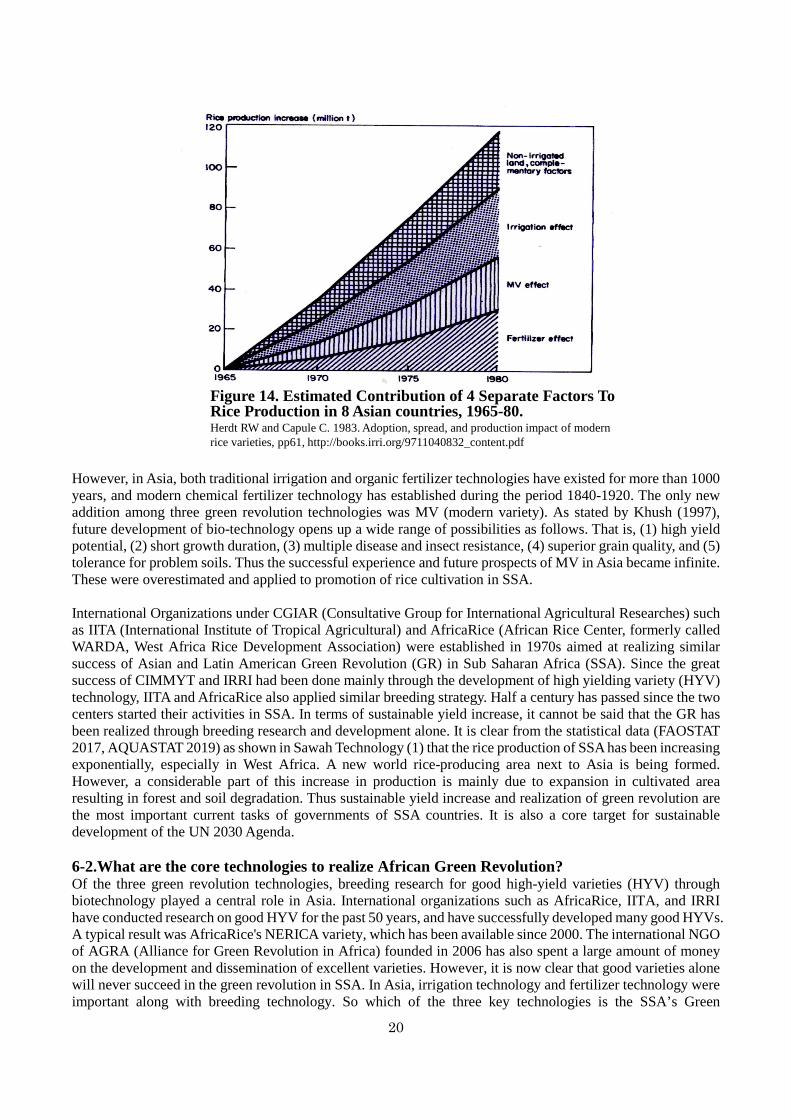
Figure 13. Left side shows low yield traditional maize in 1930s and high yielding hybrid maize in 1990s of the semi-dwarf gene sRht2 orDwaf8. Right side shows the major cereals of rice, millet, sugar cane, sorghum, maize, and wheat, all of which are belong to Poaceae or Gramineae family, all of which are thought to have a common semi-dwarf gene(sd1 or Rht 1 or 2) loci 6. What are the core technologies to realize African Green Revolution? 6-1. Modern Variety as the core technology in Asian Green Revolution Figure 14 and Table 3 show the estimation on the relative contributions of the three major rice cultivation techniques to the realization of the green revolution of rice cultivation in Burma (Myanmar), Bangladesh, China, India, Indonesia, Philippines, Sri Lanka and Thailand, in Asia (Herdt and Capule 1983). As shown in Table 3, the total paddy production increased in eight Asian countries during the 15year period was 117,379,000 tons. The biggest factor was irrigation, which contributed 28.8% (33,839,000 tons) increase, the fertilizer effect was 24.4% (28,597,000 tons), and the MV (Modern Variety or High Yielding Variety) was 23.3% (27,370,000 tons). The effect of other factors, such as increase in production due to increases in rain-fed area and upland area in rice cultivation was 23.5% (27,573,000 tons). Since these modern varieties have the semi-dwarf gene (sd1), the plant type is short, upright and the yield is high because it does not lodge even when heavy fertilization is applied. However, the small grass type requires irrigation facilities to make transplanting possible and good water management in order to compete with weeds. So these three factors are interrelated. Therefore, it is difficult to separate and evaluate these three factors individually.
Left: traditional old variety Right: Semi-dwarf high(Photo Tollenaar & Wu 1999) yielding variety (Rht2,Dwaf8)
WheatMaize
Sugar caneMillet
SorghumRiceWheatMaize
Rice
(Matsuoka 2004) Sd1=Semi-dwarfgene 1, or Rht= Reduced height trait
High YieldingVarieties forGreen Revolutionin Asia andLatin Americahave the sameSwmi-dwaf gene,i.e., Sd 1, or Rht.
The Norin 10(wheat variety)was the firstvariety thatidentified theSemidwaf characterin rice (Sd1) , wheat& maize (Rht)varieties
Herdt RW and Capule C. 1983. Adoption, spread, and production impact of modern rice varieties, pp61, http://books.irri.org/9711040832_content.pdf
Table 3. Contribution of Specified Factor to Rice Production Increases Achieved from 1965 to 1980
20
However, in Asia, both traditional irrigation and organic fertilizer technologies have existed for more than 1000 years, and modern chemical fertilizer technology has established during the period 1840-1920. The only new addition among three green revolution technologies was MV (modern variety). As stated by Khush (1997), future development of bio-technology opens up a wide range of possibilities as follows. That is, (1) high yield potential, (2) short growth duration, (3) multiple disease and insect resistance, (4) superior grain quality, and (5) tolerance for problem soils. Thus the successful experience and future prospects of MV in Asia became infinite. These were overestimated and applied to promotion of rice cultivation in SSA.
International Organizations under CGIAR (Consultative Group for International Agricultural Researches) such as IITA (International Institute of Tropical Agricultural) and AfricaRice (African Rice Center, formerly called WARDA, West Africa Rice Development Association) were established in 1970s aimed at realizing similar success of Asian and Latin American Green Revolution (GR) in Sub Saharan Africa (SSA). Since the great success of CIMMYT and IRRI had been done mainly through the development of high yielding variety (HYV) technology, IITA and AfricaRice also applied similar breeding strategy. Half a century has passed since the two centers started their activities in SSA. In terms of sustainable yield increase, it cannot be said that the GR has been realized through breeding research and development alone. It is clear from the statistical data (FAOSTAT 2017, AQUASTAT 2019) as shown in Sawah Technology (1) that the rice production of SSA has been increasing exponentially, especially in West Africa. A new world rice-producing area next to Asia is being formed. However, a considerable part of this increase in production is mainly due to expansion in cultivated area resulting in forest and soil degradation. Thus sustainable yield increase and realization of green revolution are the most important current tasks of governments of SSA countries. It is also a core target for sustainable development of the UN 2030 Agenda. 6-2.What are the core technologies to realize African Green Revolution? Of the three green revolution technologies, breeding research for good high-yield varieties (HYV) through biotechnology played a central role in Asia. International organizations such as AfricaRice, IITA, and IRRI have conducted research on good HYV for the past 50 years, and have successfully developed many good HYVs. A typical result was AfricaRice's NERICA variety, which has been available since 2000. The international NGO of AGRA (Alliance for Green Revolution in Africa) founded in 2006 has also spent a large amount of money on the development and dissemination of excellent varieties. However, it is now clear that good varieties alone will never succeed in the green revolution in SSA. In Asia, irrigation technology and fertilizer technology were important along with breeding technology. So which of the three key technologies is the SSA’s Green
Figure 14. Estimated Contribution of 4 Separate Factors To Rice Production in 8 Asian countries, 1965-80.Herdt RW and Capule C. 1983. Adoption, spread, and production impact of modern rice varieties, pp61, http://books.irri.org/9711040832_content.pdf
21
Revolution important? Or is there any other missing innovative platform that is the key for realizing the green revolution in SSA other than these three major technologies? This will be discussed in Sawah Technology 3 (Principles and theory). 7. Scientific mistakes by IITA’ top research management in relation to Rice Green Revolution,
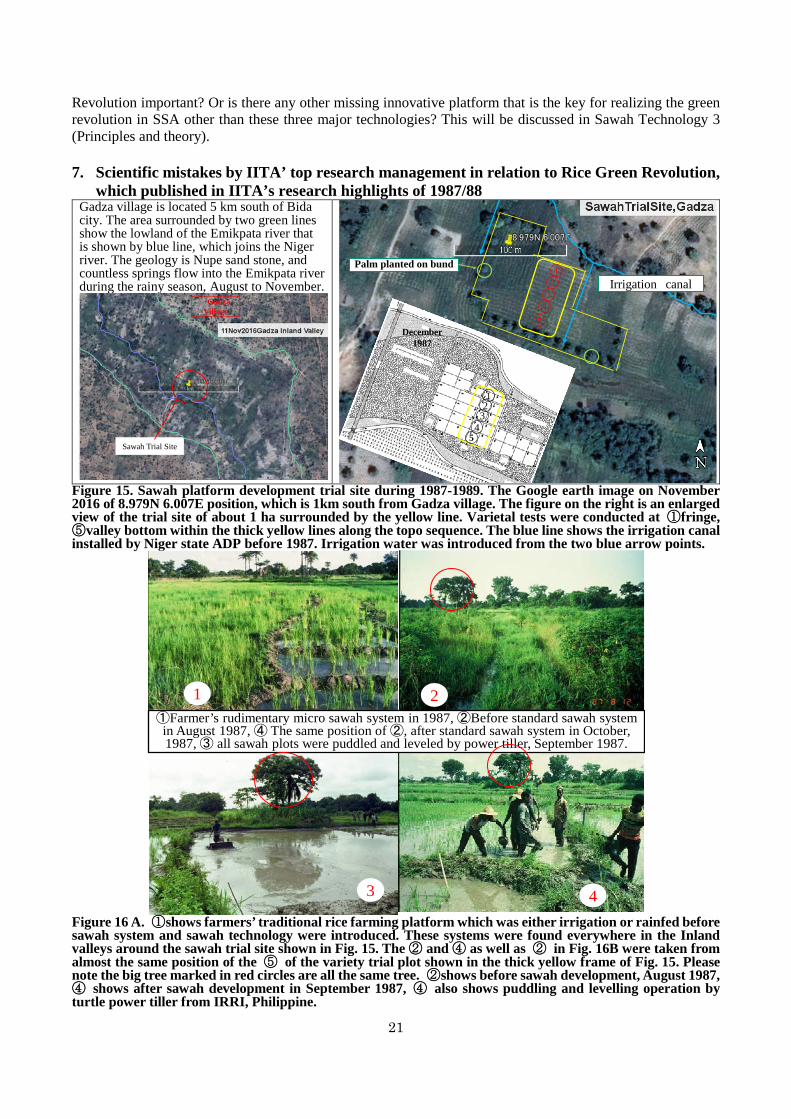
which published in IITA’s research highlights of 1987/88 Gadza village is located 5 km south of Bida city. The area surrounded by two green lines show the lowland of the Emikpata river that is shown by blue line, which joins the Niger river. The geology is Nupe sand stone, and countless springs flow into the Emikpata river during the rainy season, August to November.
Figure 15. Sawah platform development trial site during 1987-1989. The Google earth image on November 2016 of 8.979N 6.007E position, which is 1km south from Gadza village. The figure on the right is an enlarged view of the trial site of about 1 ha surrounded by the yellow line. Varietal tests were conducted at ①fringe, ⑤valley bottom within the thick yellow lines along the topo sequence. The blue line shows the irrigation canal installed by Niger state ADP before 1987. Irrigation water was introduced from the two blue arrow points.
Figure 16 A. ①shows farmers’ traditional rice farming platform which was either irrigation or rainfed before sawah system and sawah technology were introduced. These systems were found everywhere in the Inland valleys around the sawah trial site shown in Fig. 15. The ② and ④ as well as ② in Fig. 16B were taken from almost the same position of the ⑤ of the variety trial plot shown in the thick yellow frame of Fig. 15. Please note the big tree marked in red circles are all the same tree. ②shows before sawah development, August 1987, ④ shows after sawah development in September 1987, ④ also shows puddling and levelling operation by turtle power tiller from IRRI, Philippine.
GadzaVillage
Sawah Trial Site
2
December1987
12
34
5
12
34
5
Irrigation canal
Palm planted on bund
1 2
3 4
①Farmer’s rudimentary micro sawah system in 1987, ②Before standard sawah system in August 1987, ④ The same position of ②, after standard sawah system in October, 1987, ③ all sawah plots were puddled and leveled by power tiller, September 1987.
22
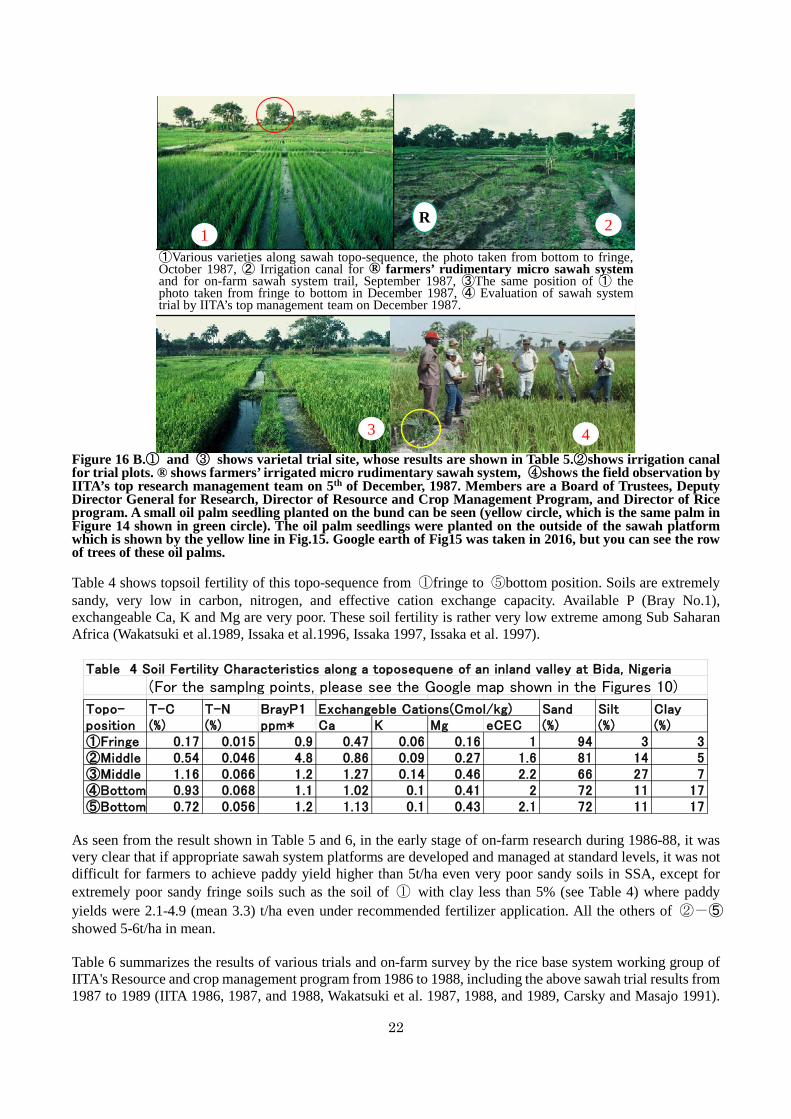
Figure 16 B.① and ③ shows varietal trial site, whose results are shown in Table 5.②shows irrigation canal for trial plots. ® shows farmers’ irrigated micro rudimentary sawah system, ④shows the field observation by IITA’s top research management team on 5th of December, 1987. Members are a Board of Trustees, Deputy Director General for Research, Director of Resource and Crop Management Program, and Director of Rice program. A small oil palm seedling planted on the bund can be seen (yellow circle, which is the same palm in Figure 14 shown in green circle). The oil palm seedlings were planted on the outside of the sawah platform which is shown by the yellow line in Fig.15. Google earth of Fig15 was taken in 2016, but you can see the row of trees of these oil palms. Table 4 shows topsoil fertility of this topo-sequence from ①fringe to ⑤bottom position. Soils are extremely sandy, very low in carbon, nitrogen, and effective cation exchange capacity. Available P (Bray No.1), exchangeable Ca, K and Mg are very poor. These soil fertility is rather very low extreme among Sub Saharan Africa (Wakatsuki et al.1989, Issaka et al.1996, Issaka 1997, Issaka et al. 1997).
As seen from the result shown in Table 5 and 6, in the early stage of on-farm research during 1986-88, it was very clear that if appropriate sawah system platforms are developed and managed at standard levels, it was not difficult for farmers to achieve paddy yield higher than 5t/ha even very poor sandy soils in SSA, except for extremely poor sandy fringe soils such as the soil of ① with clay less than 5% (see Table 4) where paddy yields were 2.1-4.9 (mean 3.3) t/ha even under recommended fertilizer application. All the others of ②-⑤ showed 5-6t/ha in mean. Table 6 summarizes the results of various trials and on-farm survey by the rice base system working group of IITA's Resource and crop management program from 1986 to 1988, including the above sawah trial results from 1987 to 1989 (IITA 1986, 1987, and 1988, Wakatsuki et al. 1987, 1988, and 1989, Carsky and Masajo 1991).
①Various varieties along sawah topo-sequence, the photo taken from bottom to fringe,October 1987, ② Irrigation canal for ® farmers’ rudimentary micro sawah systemand for on-farm sawah system trail, September 1987, ③The same position of ① thephoto taken from fringe to bottom in December 1987, ④ Evaluation of sawah systemtrial by IITA’s top management team on December 1987.
1 2
3 4
R
Table 4 Soil Fertility Characteristics along a toposequene of an inland valley at Bida, Nigeria
(For the samplng points, please see the Google map shown in the Figures 10)
Topo- T-C T-N BrayP1 Exchangeble Cations(Cmol/kg) Sand Silt Clayposition (%) (%) ppm* Ca K Mg eCEC (%) (%) (%)①Fringe 0.17 0.015 0.9 0.47 0.06 0.16 1 94 3 3②Middle 0.54 0.046 4.8 0.86 0.09 0.27 1.6 81 14 5③Middle 1.16 0.066 1.2 1.27 0.14 0.46 2.2 66 27 7④Bottom 0.93 0.068 1.1 1.02 0.1 0.41 2 72 11 17⑤Bottom 0.72 0.056 1.2 1.13 0.1 0.43 2.1 72 11 17
23
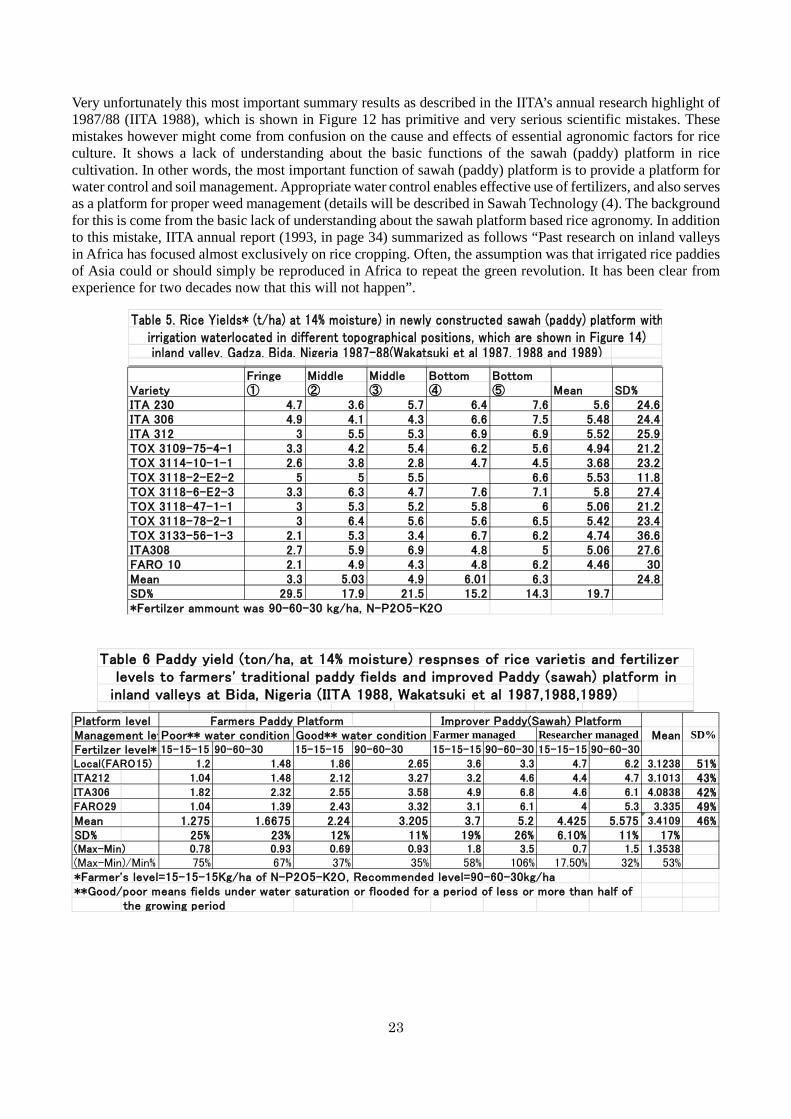
Very unfortunately this most important summary results as described in the IITA’s annual research highlight of 1987/88 (IITA 1988), which is shown in Figure 12 has primitive and very serious scientific mistakes. These mistakes however might come from confusion on the cause and effects of essential agronomic factors for rice culture. It shows a lack of understanding about the basic functions of the sawah (paddy) platform in rice cultivation. In other words, the most important function of sawah (paddy) platform is to provide a platform for water control and soil management. Appropriate water control enables effective use of fertilizers, and also serves as a platform for proper weed management (details will be described in Sawah Technology (4). The background for this is come from the basic lack of understanding about the sawah platform based rice agronomy. In addition to this mistake, IITA annual report (1993, in page 34) summarized as follows “Past research on inland valleys in Africa has focused almost exclusively on rice cropping. Often, the assumption was that irrigated rice paddies of Asia could or should simply be reproduced in Africa to repeat the green revolution. It has been clear from experience for two decades now that this will not happen”.
Table 5. Rice Yields* (t/ha) at 14% moisture) in newly constructed sawah (paddy) platform with irrigation waterlocated in different topographical positions, which are shown in Figure 14) inland valley, Gadza, Bida, Nigeria 1987-88(Wakatsuki et al 1987, 1988 and 1989)
Fringe Middle Middle Bottom BottomVariety ① ② ③ ④ ⑤ Mean SD%ITA 230 4.7 3.6 5.7 6.4 7.6 5.6 24.6ITA 306 4.9 4.1 4.3 6.6 7.5 5.48 24.4ITA 312 3 5.5 5.3 6.9 6.9 5.52 25.9TOX 3109-75-4-1 3.3 4.2 5.4 6.2 5.6 4.94 21.2TOX 3114-10-1-1 2.6 3.8 2.8 4.7 4.5 3.68 23.2TOX 3118-2-E2-2 5 5 5.5 6.6 5.53 11.8TOX 3118-6-E2-3 3.3 6.3 4.7 7.6 7.1 5.8 27.4TOX 3118-47-1-1 3 5.3 5.2 5.8 6 5.06 21.2TOX 3118-78-2-1 3 6.4 5.6 5.6 6.5 5.42 23.4TOX 3133-56-1-3 2.1 5.3 3.4 6.7 6.2 4.74 36.6ITA308 2.7 5.9 6.9 4.8 5 5.06 27.6FARO 10 2.1 4.9 4.3 4.8 6.2 4.46 30Mean 3.3 5.03 4.9 6.01 6.3 24.8SD% 29.5 17.9 21.5 15.2 14.3 19.7*Fertilzer ammount was 90-60-30 kg/ha, N-P2O5-K2O
Table 6 Paddy yield (ton/ha, at 14% moisture) respnses of rice varietis and fertilizer levels to farmers' traditional paddy fields and improved Paddy (sawah) platform in inland valleys at Bida, Nigeria (IITA 1988, Wakatsuki et al 1987,1988,1989)
Platform level Farmers Paddy Platform Improver Paddy(Sawah) PlatformManagement levPoor** water condition Good** water condition Farmer managed Researcher managed Mean SD%Fertilzer level* 15-15-15 90-60-30 15-15-15 90-60-30 15-15-15 90-60-30 15-15-15 90-60-30
Local(FARO15) 1.2 1.48 1.86 2.65 3.6 3.3 4.7 6.2 3.1238 51%ITA212 1.04 1.48 2.12 3.27 3.2 4.6 4.4 4.7 3.1013 43%ITA306 1.82 2.32 2.55 3.58 4.9 6.8 4.6 6.1 4.0838 42%FARO29 1.04 1.39 2.43 3.32 3.1 6.1 4 5.3 3.335 49%Mean 1.275 1.6675 2.24 3.205 3.7 5.2 4.425 5.575 3.4109 46%SD% 25% 23% 12% 11% 19% 26% 6.10% 11% 17%(Max-Min) 0.78 0.93 0.69 0.93 1.8 3.5 0.7 1.5 1.3538
(Max-Min)/Min% 75% 67% 37% 35% 58% 106% 17.50% 32% 53%*Farmer's level=15-15-15Kg/ha of N-P2O5-K2O, Recommended level=90-60-30kg/ha**Good/poor means fields under water saturation or flooded for a period of less or more than half of
the growing period
24
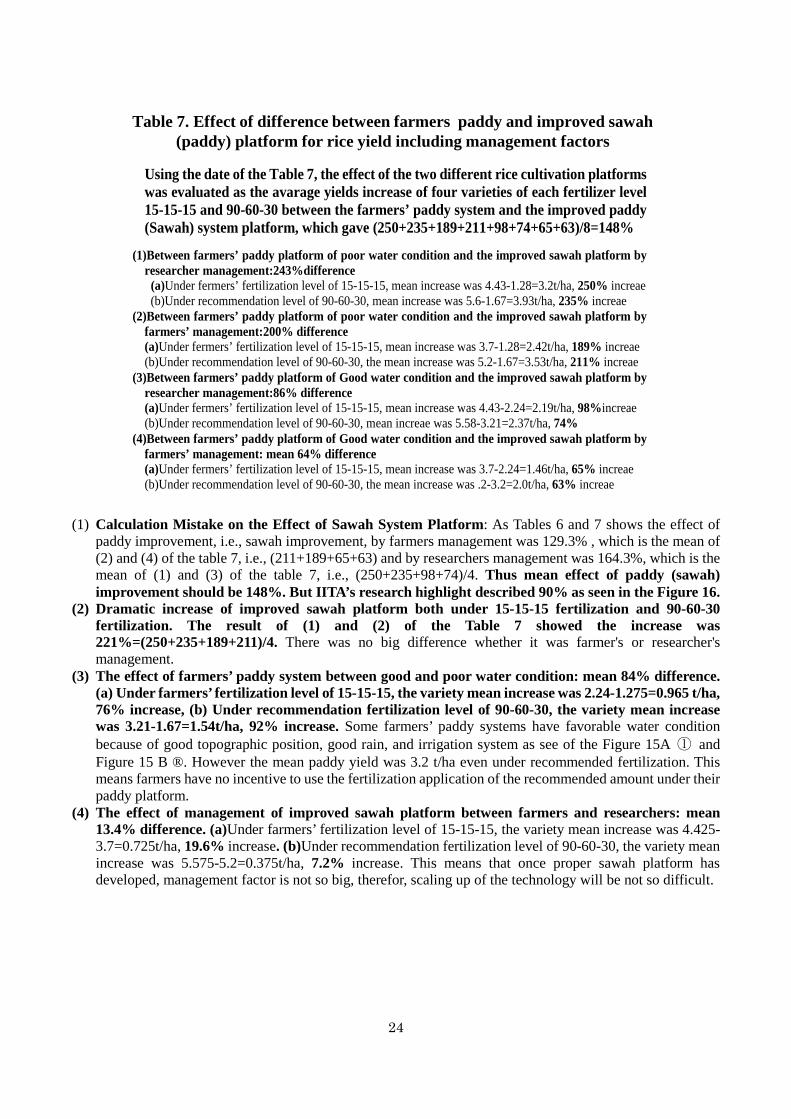
(1) Calculation Mistake on the Effect of Sawah System Platform: As Tables 6 and 7 shows the effect of paddy improvement, i.e., sawah improvement, by farmers management was 129.3% , which is the mean of (2) and (4) of the table 7, i.e., (211+189+65+63) and by researchers management was 164.3%, which is the mean of (1) and (3) of the table 7, i.e., (250+235+98+74)/4. Thus mean effect of paddy (sawah) improvement should be 148%. But IITA’s research highlight described 90% as seen in the Figure 16.
(2) Dramatic increase of improved sawah platform both under 15-15-15 fertilization and 90-60-30 fertilization. The result of (1) and (2) of the Table 7 showed the increase was 221%=(250+235+189+211)/4. There was no big difference whether it was farmer's or researcher's management.
(3) The effect of farmers’ paddy system between good and poor water condition: mean 84% difference. (a) Under farmers’ fertilization level of 15-15-15, the variety mean increase was 2.24-1.275=0.965 t/ha, 76% increase, (b) Under recommendation fertilization level of 90-60-30, the variety mean increase was 3.21-1.67=1.54t/ha, 92% increase. Some farmers’ paddy systems have favorable water condition because of good topographic position, good rain, and irrigation system as see of the Figure 15A ① and Figure 15 B ®. However the mean paddy yield was 3.2 t/ha even under recommended fertilization. This means farmers have no incentive to use the fertilization application of the recommended amount under their paddy platform.
(4) The effect of management of improved sawah platform between farmers and researchers: mean 13.4% difference. (a)Under farmers’ fertilization level of 15-15-15, the variety mean increase was 4.425-3.7=0.725t/ha, 19.6% increase. (b)Under recommendation fertilization level of 90-60-30, the variety mean increase was 5.575-5.2=0.375t/ha, 7.2% increase. This means that once proper sawah platform has developed, management factor is not so big, therefor, scaling up of the technology will be not so difficult.
Table 7. Effect of difference between farmers paddy and improved sawah(paddy) platform for rice yield including management factors
Using the date of the Table 7, the effect of the two different rice cultivation platforms was evaluated as the avarage yields increase of four varieties of each fertilizer level 15-15-15 and 90-60-30 between the farmers’ paddy system and the improved paddy (Sawah) system platform, which gave (250+235+189+211+98+74+65+63)/8=148%
(1)Between farmers’ paddy platform of poor water condition and the improved sawah platform by
researcher management:243%difference (a)Under fermers’ fertilization level of 15-15-15, mean increase was 4.43-1.28=3.2t/ha, 250% increae
(b)Under recommendation level of 90-60-30, mean increase was 5.6-1.67=3.93t/ha, 235% increae (2)Between farmers’ paddy platform of poor water condition and the improved sawah platform by
farmers’ management:200% difference (a)Under fermers’ fertilization level of 15-15-15, mean increase was 3.7-1.28=2.42t/ha, 189% increae (b)Under recommendation level of 90-60-30, the mean increase was 5.2-1.67=3.53t/ha, 211% increae (3)Between farmers’ paddy platform of Good water condition and the improved sawah platform by
researcher management:86% difference (a)Under fermers’ fertilization level of 15-15-15, mean increase was 4.43-2.24=2.19t/ha, 98%increae
(b)Under recommendation level of 90-60-30, mean increae was 5.58-3.21=2.37t/ha, 74% (4)Between farmers’ paddy platform of Good water condition and the improved sawah platform by
farmers’ management: mean 64% difference (a)Under fermers’ fertilization level of 15-15-15, mean increase was 3.7-2.24=1.46t/ha, 65% increae (b)Under recommendation level of 90-60-30, the mean increase was .2-3.2=2.0t/ha, 63% increae
25
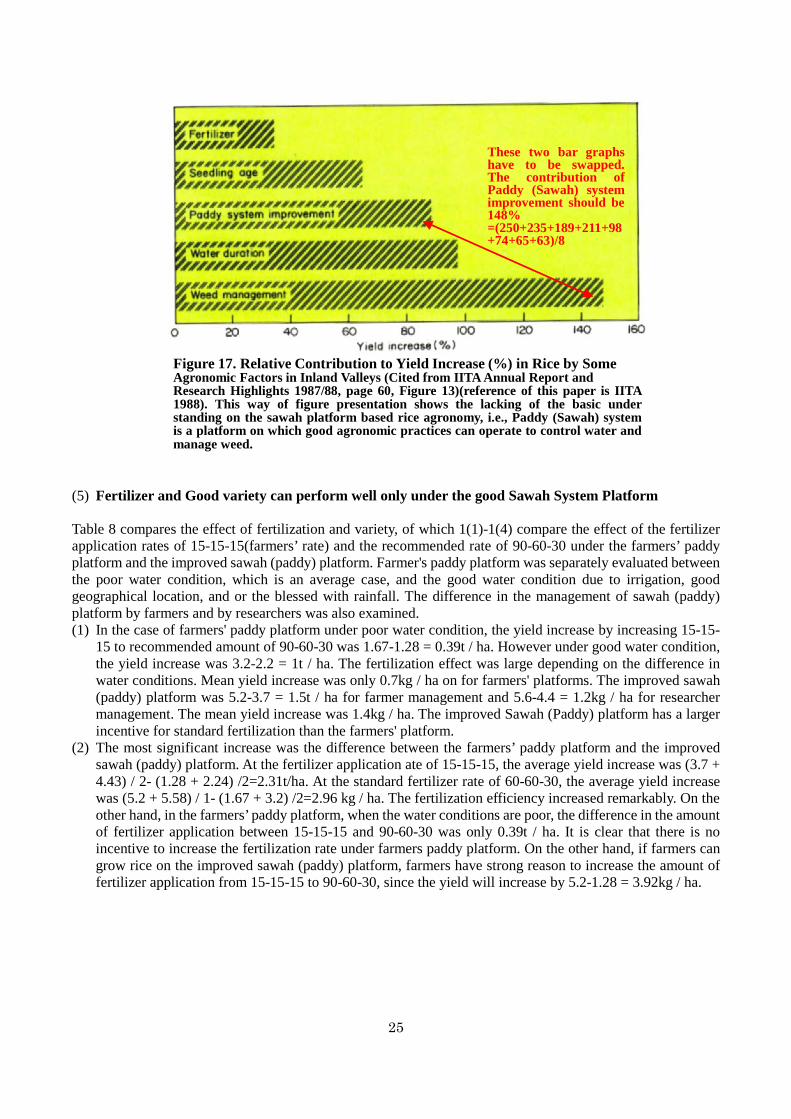
(5) Fertilizer and Good variety can perform well only under the good Sawah System Platform Table 8 compares the effect of fertilization and variety, of which 1(1)-1(4) compare the effect of the fertilizer application rates of 15-15-15(farmers’ rate) and the recommended rate of 90-60-30 under the farmers’ paddy platform and the improved sawah (paddy) platform. Farmer's paddy platform was separately evaluated between the poor water condition, which is an average case, and the good water condition due to irrigation, good geographical location, and or the blessed with rainfall. The difference in the management of sawah (paddy) platform by farmers and by researchers was also examined. (1) In the case of farmers' paddy platform under poor water condition, the yield increase by increasing 15-15-
15 to recommended amount of 90-60-30 was 1.67-1.28 = 0.39t / ha. However under good water condition, the yield increase was 3.2-2.2 = 1t / ha. The fertilization effect was large depending on the difference in water conditions. Mean yield increase was only 0.7kg / ha on for farmers' platforms. The improved sawah (paddy) platform was 5.2-3.7 = 1.5t / ha for farmer management and 5.6-4.4 = 1.2kg / ha for researcher management. The mean yield increase was 1.4kg / ha. The improved Sawah (Paddy) platform has a larger incentive for standard fertilization than the farmers' platform.
(2) The most significant increase was the difference between the farmers’ paddy platform and the improved sawah (paddy) platform. At the fertilizer application ate of 15-15-15, the average yield increase was (3.7 + 4.43) / 2- (1.28 + 2.24) /2=2.31t/ha. At the standard fertilizer rate of 60-60-30, the average yield increase was (5.2 + 5.58) / 1- (1.67 + 3.2) /2=2.96 kg / ha. The fertilization efficiency increased remarkably. On the other hand, in the farmers’ paddy platform, when the water conditions are poor, the difference in the amount of fertilizer application between 15-15-15 and 90-60-30 was only 0.39t / ha. It is clear that there is no incentive to increase the fertilization rate under farmers paddy platform. On the other hand, if farmers can grow rice on the improved sawah (paddy) platform, farmers have strong reason to increase the amount of fertilizer application from 15-15-15 to 90-60-30, since the yield will increase by 5.2-1.28 = 3.92kg / ha.
Figure 17. Relative Contribution to Yield Increase (%) in Rice by SomeAgronomic Factors in Inland Valleys (Cited from IITA Annual Report andResearch Highlights 1987/88, page 60, Figure 13)(reference of this paper is IITA1988). This way of figure presentation shows the lacking of the basic understanding on the sawah platform based rice agronomy, i.e., Paddy (Sawah) systemis a platform on which good agronomic practices can operate to control water andmanage weed.
These two bar graphshave to be swapped.The contribution ofPaddy (Sawah) systemimprovement should be148%=(250+235+189+211+98+74+65+63)/8
26
Table 8-2(1)-(4) compare the differences of 4 varieties both at 15-15-15(farmers’ rate) and the recommended rate of 90-60-30 under the farmers’ paddy platform and the improved sawah (paddy) platform. (3) In the case of farmers' paddy platform under poor water condition, the maximum yield difference under 15-
15-15 fertilization was 1.82-1.04=0.78t / ha, under 90-60-30 fertilization it was 2.32-1.39=0.93t / ha. In case of under good water condition, yield difference was 2.55-1.86= 0.69 t/ha at 15-15-15 fertilization rate, under 90-60-30 fertilization it was 3.58-2.65=0.93t/ha.
(4) In case of the improved sawah (paddy) platform under farmers’ management, it was 4.9-3.1=1.8t / ha at 15-15-15 fertilization rate and it was 6.8-3.3=3.5t/ha at 90-60-30 fertilization rate. In case of researcher management, yield difference was 4.7-4=0.7 t/ha at 15-15-15 fertilization rate, under 90-60-30 fertilization, it was 6.2-4.7=1.5t/ha.
(5) The most significant increase was the difference between the rice platforms. Under 15-15-15 fertilization mean yields of the 4 varieties were 1.28t/ha under farmers’ paddy of poor water condition, 2.24t/ha (75% increase) under farmers’ paddy of good water condition, 3.7t/ha (189% increase) under improved sawah (paddy) of farmers’ management, 4.43t/ha (246% increase). Under 90-60-30 recommended fertilization, variety difference was more clear, i.e., mean yields of the 4 varieties were 1.67t/ha under farmers’ paddy of poor water condition, 3.21t/ha (92% increase) under farmers’ paddy of good water condition, 5.2t/ha (211% increase) under improved sawah (paddy) of farmers’ management, 5.58t/ha (237% increase) under improved sawah (paddy) of researcher management.
(6) It has been long argued in the last 50 years that increasing the fertilizer application rate is the way for the green revolution in SSA. But this has not been realized. Also good high yielding varieties are the key, but this is also not true. Now it is clear that the major reason is the lack of proper agricultural platforms, such as sawah (paddy) platform in SSA.
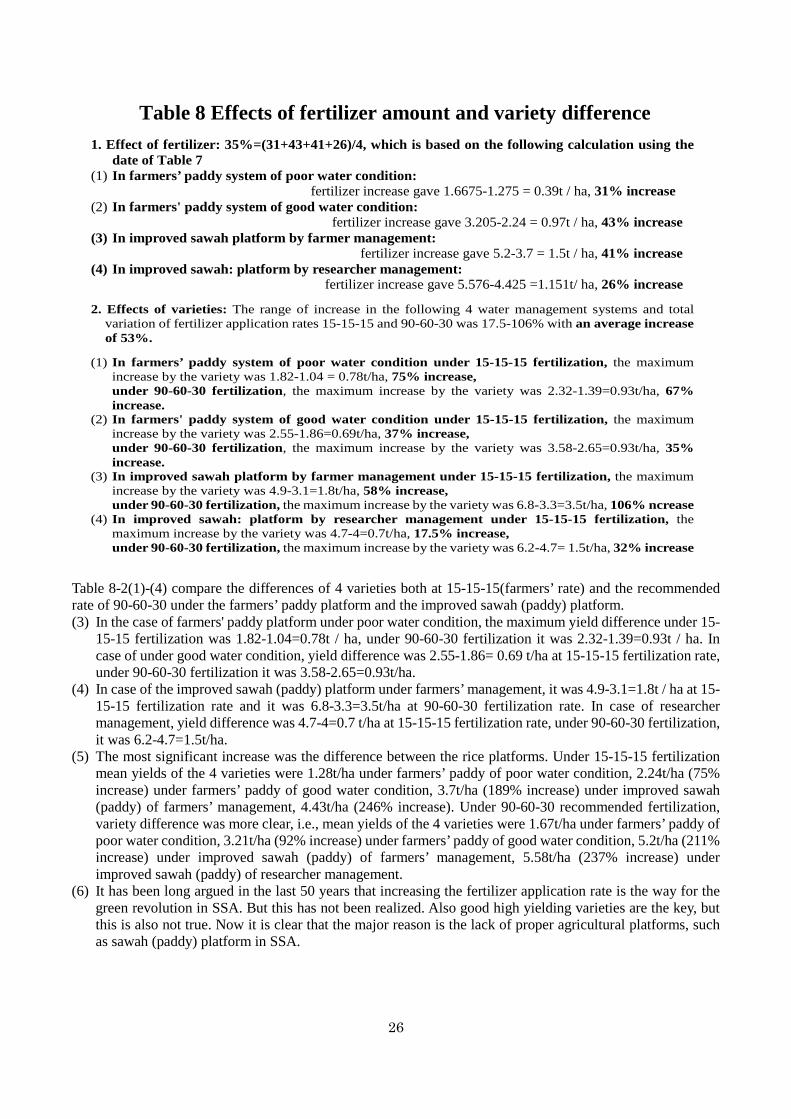
Table 8 Effects of fertilizer amount and variety difference 1. Effect of fertilizer: 35%=(31+43+41+26)/4, which is based on the following calculation using the
date of Table 7 (1) In farmers’ paddy system of poor water condition:
fertilizer increase gave 1.6675-1.275 = 0.39t / ha, 31% increase (2) In farmers' paddy system of good water condition:
fertilizer increase gave 3.205-2.24 = 0.97t / ha, 43% increase (3) In improved sawah platform by farmer management:
fertilizer increase gave 5.2-3.7 = 1.5t / ha, 41% increase (4) In improved sawah: platform by researcher management:
fertilizer increase gave 5.576-4.425 =1.151t/ ha, 26% increase
2. Effects of varieties: The range of increase in the following 4 water management systems and total variation of fertilizer application rates 15-15-15 and 90-60-30 was 17.5-106% with an average increase of 53%.
(1) In farmers’ paddy system of poor water condition under 15-15-15 fertilization, the maximum
increase by the variety was 1.82-1.04 = 0.78t/ha, 75% increase, under 90-60-30 fertilization, the maximum increase by the variety was 2.32-1.39=0.93t/ha, 67% increase.
(2) In farmers' paddy system of good water condition under 15-15-15 fertilization, the maximum increase by the variety was 2.55-1.86=0.69t/ha, 37% increase, under 90-60-30 fertilization, the maximum increase by the variety was 3.58-2.65=0.93t/ha, 35% increase.
(3) In improved sawah platform by farmer management under 15-15-15 fertilization, the maximum increase by the variety was 4.9-3.1=1.8t/ha, 58% increase, under 90-60-30 fertilization, the maximum increase by the variety was 6.8-3.3=3.5t/ha, 106% ncrease
(4) In improved sawah: platform by researcher management under 15-15-15 fertilization, the maximum increase by the variety was 4.7-4=0.7t/ha, 17.5% increase, under 90-60-30 fertilization, the maximum increase by the variety was 6.2-4.7= 1.5t/ha, 32% increase
27
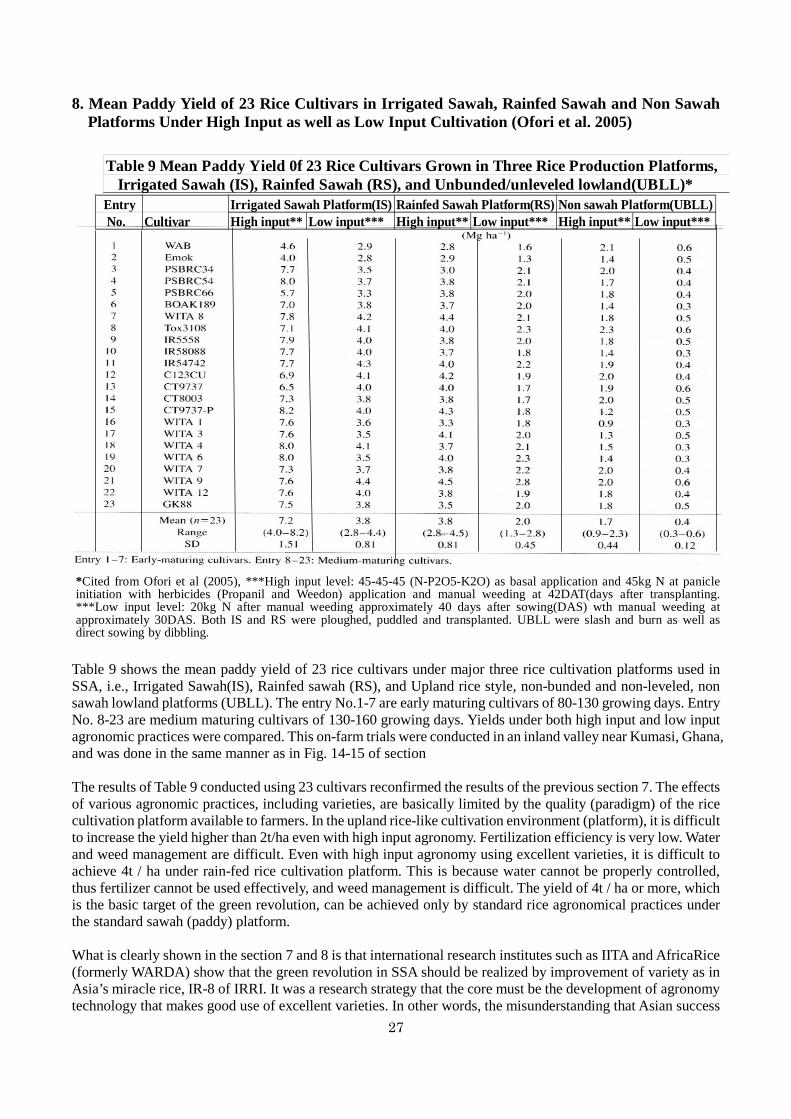
8. Mean Paddy Yield of 23 Rice Cultivars in Irrigated Sawah, Rainfed Sawah and Non Sawah Platforms Under High Input as well as Low Input Cultivation (Ofori et al. 2005)
Table 9 shows the mean paddy yield of 23 rice cultivars under major three rice cultivation platforms used in SSA, i.e., Irrigated Sawah(IS), Rainfed sawah (RS), and Upland rice style, non-bunded and non-leveled, non sawah lowland platforms (UBLL). The entry No.1-7 are early maturing cultivars of 80-130 growing days. Entry No. 8-23 are medium maturing cultivars of 130-160 growing days. Yields under both high input and low input agronomic practices were compared. This on-farm trials were conducted in an inland valley near Kumasi, Ghana, and was done in the same manner as in Fig. 14-15 of section The results of Table 9 conducted using 23 cultivars reconfirmed the results of the previous section 7. The effects of various agronomic practices, including varieties, are basically limited by the quality (paradigm) of the rice cultivation platform available to farmers. In the upland rice-like cultivation environment (platform), it is difficult to increase the yield higher than 2t/ha even with high input agronomy. Fertilization efficiency is very low. Water and weed management are difficult. Even with high input agronomy using excellent varieties, it is difficult to achieve 4t / ha under rain-fed rice cultivation platform. This is because water cannot be properly controlled, thus fertilizer cannot be used effectively, and weed management is difficult. The yield of 4t / ha or more, which is the basic target of the green revolution, can be achieved only by standard rice agronomical practices under the standard sawah (paddy) platform. What is clearly shown in the section 7 and 8 is that international research institutes such as IITA and AfricaRice (formerly WARDA) show that the green revolution in SSA should be realized by improvement of variety as in Asia’s miracle rice, IR-8 of IRRI. It was a research strategy that the core must be the development of agronomy technology that makes good use of excellent varieties. In other words, the misunderstanding that Asian success
Entry Irrigated Sawah Platform(IS) Rainfed Sawah Platform(RS) Non sawah Platform(UBLL) No. Cultivar High input** Low input*** High input** Low input*** High input** Low input***
*Cited from Ofori et al (2005), ***High input level: 45-45-45 (N-P2O5-K2O) as basal application and 45kg N at panicleinitiation with herbicides (Propanil and Weedon) application and manual weeding at 42DAT(days after transplanting.***Low input level: 20kg N after manual weeding approximately 40 days after sowing(DAS) wth manual weeding atapproximately 30DAS. Both IS and RS were ploughed, puddled and transplanted. UBLL were slash and burn as well asdirect sowing by dibbling.
Table 9 Mean Paddy Yield 0f 23 Rice Cultivars Grown in Three Rice Production Platforms, Irrigated Sawah (IS), Rainfed Sawah (RS), and Unbunded/unleveled lowland(UBLL)*
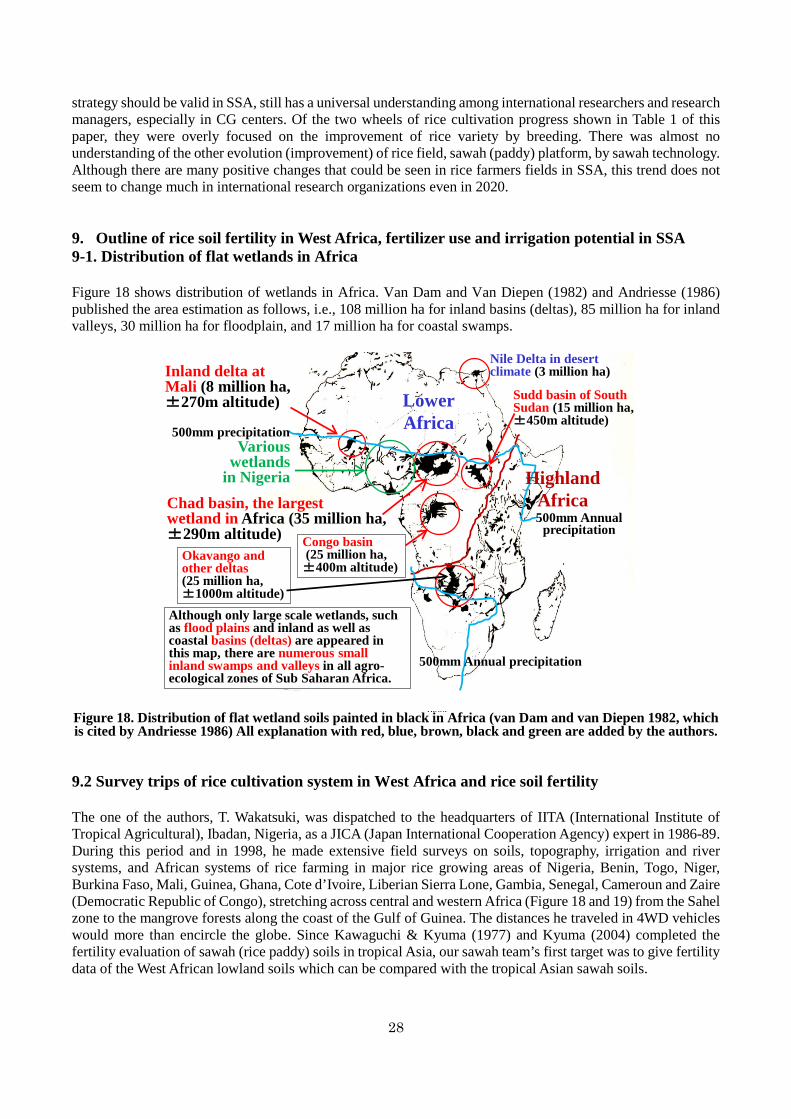
28
strategy should be valid in SSA, still has a universal understanding among international researchers and research managers, especially in CG centers. Of the two wheels of rice cultivation progress shown in Table 1 of this paper, they were overly focused on the improvement of rice variety by breeding. There was almost no understanding of the other evolution (improvement) of rice field, sawah (paddy) platform, by sawah technology. Although there are many positive changes that could be seen in rice farmers fields in SSA, this trend does not seem to change much in international research organizations even in 2020. 9. Outline of rice soil fertility in West Africa, fertilizer use and irrigation potential in SSA 9-1. Distribution of flat wetlands in Africa Figure 18 shows distribution of wetlands in Africa. Van Dam and Van Diepen (1982) and Andriesse (1986) published the area estimation as follows, i.e., 108 million ha for inland basins (deltas), 85 million ha for inland valleys, 30 million ha for floodplain, and 17 million ha for coastal swamps.
Figure 18. Distribution of flat wetland soils painted in black in Africa (van Dam and van Diepen 1982, which is cited by Andriesse 1986) All explanation with red, blue, brown, black and green are added by the authors. 9.2 Survey trips of rice cultivation system in West Africa and rice soil fertility The one of the authors, T. Wakatsuki, was dispatched to the headquarters of IITA (International Institute of Tropical Agricultural), Ibadan, Nigeria, as a JICA (Japan International Cooperation Agency) expert in 1986-89. During this period and in 1998, he made extensive field surveys on soils, topography, irrigation and river systems, and African systems of rice farming in major rice growing areas of Nigeria, Benin, Togo, Niger, Burkina Faso, Mali, Guinea, Ghana, Cote d’Ivoire, Liberian Sierra Lone, Gambia, Senegal, Cameroun and Zaire (Democratic Republic of Congo), stretching across central and western Africa (Figure 18 and 19) from the Sahel zone to the mangrove forests along the coast of the Gulf of Guinea. The distances he traveled in 4WD vehicles would more than encircle the globe. Since Kawaguchi & Kyuma (1977) and Kyuma (2004) completed the fertility evaluation of sawah (rice paddy) soils in tropical Asia, our sawah team’s first target was to give fertility data of the West African lowland soils which can be compared with the tropical Asian sawah soils.
Chad basin, the largest wetland in Africa (35 million ha, ±290m altitude)
Although only large scale wetlands, such as flood plains and inland as well as coastal basins (deltas) are appeared in this map, there are numerous small inland swamps and valleys in all agro-ecological zones of Sub Saharan Africa.
Inland delta at Mali (8 million ha, ±270m altitude)
Nile Delta in desert climate (3 million ha)
LowerAfrica
Various wetlands
in Nigeria
Fig. 2.
Sudd basin of South Sudan (15 million ha, ±450m altitude)
Congo basin(25 million ha, ±400m altitude)
Okavango and other deltas (25 million ha, ±1000m altitude)
500mm Annualprecipitation
500mm Annual precipitation
500mm precipitation
Highland Africa
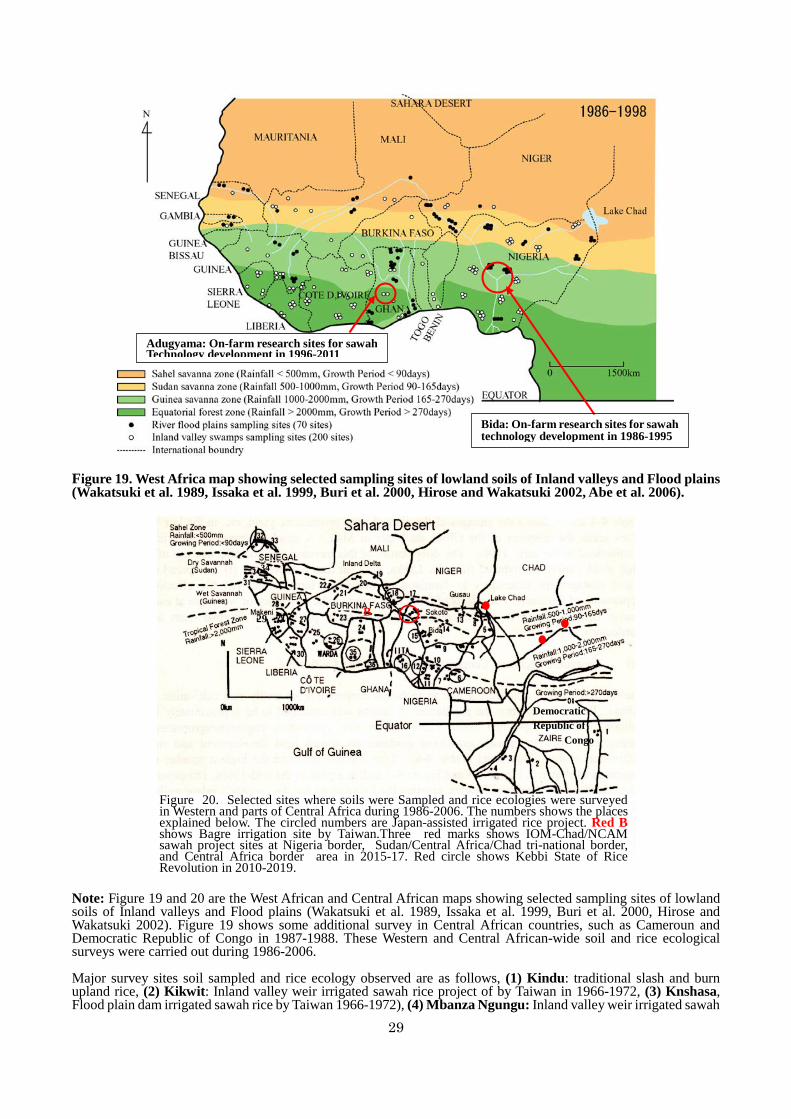
29
Figure 19. West Africa map showing selected sampling sites of lowland soils of Inland valleys and Flood plains (Wakatsuki et al. 1989, Issaka et al. 1999, Buri et al. 2000, Hirose and Wakatsuki 2002, Abe et al. 2006).
Note: Figure 19 and 20 are the West African and Central African maps showing selected sampling sites of lowland soils of Inland valleys and Flood plains (Wakatsuki et al. 1989, Issaka et al. 1999, Buri et al. 2000, Hirose and Wakatsuki 2002). Figure 19 shows some additional survey in Central African countries, such as Cameroun and Democratic Republic of Congo in 1987-1988. These Western and Central African-wide soil and rice ecological surveys were carried out during 1986-2006. Major survey sites soil sampled and rice ecology observed are as follows, (1) Kindu: traditional slash and burn upland rice, (2) Kikwit: Inland valley weir irrigated sawah rice project of by Taiwan in 1966-1972, (3) Knshasa, Flood plain dam irrigated sawah rice by Taiwan 1966-1972), (4) Mbanza Ngungu: Inland valley weir irrigated sawah
Figure 20. Selected sites where soils were Sampled and rice ecologies were surveyedin Western and parts of Central Africa during 1986-2006. The numbers shows the placesexplained below. The circled numbers are Japan-assisted irrigated rice project. Red Bshows Bagre irrigation site by Taiwan.Three red marks shows IOM-Chad/NCAMsawah project sites at Nigeria border, Sudan/Central Africa/Chad tri-national border,and Central Africa border area in 2015-17. Red circle shows Kebbi State of RiceRevolution in 2010-2019.
B29
34
DemocraticRepublic of
Congo
Bida: On-farm research sites for sawah technology development in 1986-1995
Adugyama: On-farm research sites for sawah Technology development in 1996-2011
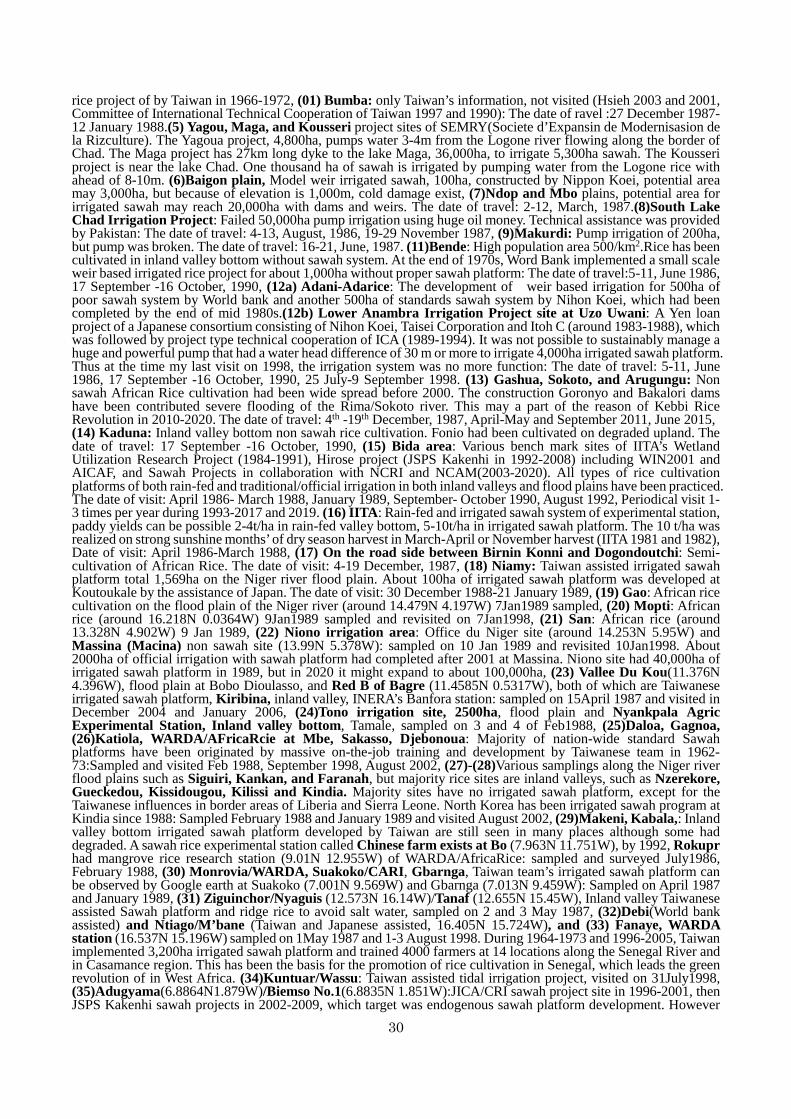
30
rice project of by Taiwan in 1966-1972, (01) Bumba: only Taiwan’s information, not visited (Hsieh 2003 and 2001, Committee of International Technical Cooperation of Taiwan 1997 and 1990): The date of ravel :27 December 1987-12 January 1988.(5) Yagou, Maga, and Kousseri project sites of SEMRY(Societe d’Expansin de Modernisasion de la Rizculture). The Yagoua project, 4,800ha, pumps water 3-4m from the Logone river flowing along the border of Chad. The Maga project has 27km long dyke to the lake Maga, 36,000ha, to irrigate 5,300ha sawah. The Kousseri project is near the lake Chad. One thousand ha of sawah is irrigated by pumping water from the Logone rice with ahead of 8-10m. (6)Baigon plain, Model weir irrigated sawah, 100ha, constructed by Nippon Koei, potential area may 3,000ha, but because of elevation is 1,000m, cold damage exist, (7)Ndop and Mbo plains, potential area for irrigated sawah may reach 20,000ha with dams and weirs. The date of travel: 2-12, March, 1987.(8)South Lake Chad Irrigation Project: Failed 50,000ha pump irrigation using huge oil money. Technical assistance was provided by Pakistan: The date of travel: 4-13, August, 1986, 19-29 November 1987, (9)Makurdi: Pump irrigation of 200ha, but pump was broken. The date of travel: 16-21, June, 1987. (11)Bende: High population area 500/km2.Rice has been cultivated in inland valley bottom without sawah system. At the end of 1970s, Word Bank implemented a small scale weir based irrigated rice project for about 1,000ha without proper sawah platform: The date of travel:5-11, June 1986, 17 September -16 October, 1990, (12a) Adani-Adarice: The development of weir based irrigation for 500ha of poor sawah system by World bank and another 500ha of standards sawah system by Nihon Koei, which had been completed by the end of mid 1980s.(12b) Lower Anambra Irrigation Project site at Uzo Uwani: A Yen loan project of a Japanese consortium consisting of Nihon Koei, Taisei Corporation and Itoh C (around 1983-1988), which was followed by project type technical cooperation of ICA (1989-1994). It was not possible to sustainably manage a huge and powerful pump that had a water head difference of 30 m or more to irrigate 4,000ha irrigated sawah platform. Thus at the time my last visit on 1998, the irrigation system was no more function: The date of travel: 5-11, June 1986, 17 September -16 October, 1990, 25 July-9 September 1998. (13) Gashua, Sokoto, and Arugungu: Non sawah African Rice cultivation had been wide spread before 2000. The construction Goronyo and Bakalori dams have been contributed severe flooding of the Rima/Sokoto river. This may a part of the reason of Kebbi Rice Revolution in 2010-2020. The date of travel: 4th -19th December, 1987, April-May and September 2011, June 2015, (14) Kaduna: Inland valley bottom non sawah rice cultivation. Fonio had been cultivated on degraded upland. The date of travel: 17 September -16 October, 1990, (15) Bida area: Various bench mark sites of IITA’s Wetland Utilization Research Project (1984-1991), Hirose project (JSPS Kakenhi in 1992-2008) including WIN2001 and AICAF, and Sawah Projects in collaboration with NCRI and NCAM(2003-2020). All types of rice cultivation platforms of both rain-fed and traditional/official irrigation in both inland valleys and flood plains have been practiced. The date of visit: April 1986- March 1988, January 1989, September- October 1990, August 1992, Periodical visit 1-3 times per year during 1993-2017 and 2019. (16) IITA: Rain-fed and irrigated sawah system of experimental station, paddy yields can be possible 2-4t/ha in rain-fed valley bottom, 5-10t/ha in irrigated sawah platform. The 10 t/ha was realized on strong sunshine months’ of dry season harvest in March-April or November harvest (IITA 1981 and 1982), Date of visit: April 1986-March 1988, (17) On the road side between Birnin Konni and Dogondoutchi: Semi-cultivation of African Rice. The date of visit: 4-19 December, 1987, (18) Niamy: Taiwan assisted irrigated sawah platform total 1,569ha on the Niger river flood plain. About 100ha of irrigated sawah platform was developed at Koutoukale by the assistance of Japan. The date of visit: 30 December 1988-21 January 1989, (19) Gao: African rice cultivation on the flood plain of the Niger river (around 14.479N 4.197W) 7Jan1989 sampled, (20) Mopti: African rice (around 16.218N 0.0364W) 9Jan1989 sampled and revisited on 7Jan1998, (21) San: African rice (around 13.328N 4.902W) 9 Jan 1989, (22) Niono irrigation area: Office du Niger site (around 14.253N 5.95W) and Massina (Macina) non sawah site (13.99N 5.378W): sampled on 10 Jan 1989 and revisited 10Jan1998. About 2000ha of official irrigation with sawah platform had completed after 2001 at Massina. Niono site had 40,000ha of irrigated sawah platform in 1989, but in 2020 it might expand to about 100,000ha, (23) Vallee Du Kou(11.376N 4.396W), flood plain at Bobo Dioulasso, and Red B of Bagre (11.4585N 0.5317W), both of which are Taiwanese irrigated sawah platform, Kiribina, inland valley, INERA’s Banfora station: sampled on 15April 1987 and visited in December 2004 and January 2006, (24)Tono irrigation site, 2500ha, flood plain and Nyankpala Agric Experimental Station, Inland valley bottom, Tamale, sampled on 3 and 4 of Feb1988, (25)Daloa, Gagnoa, (26)Katiola, WARDA/AFricaRcie at Mbe, Sakasso, Djebonoua: Majority of nation-wide standard Sawah platforms have been originated by massive on-the-job training and development by Taiwanese team in 1962-73:Sampled and visited Feb 1988, September 1998, August 2002, (27)-(28)Various samplings along the Niger river flood plains such as Siguiri, Kankan, and Faranah, but majority rice sites are inland valleys, such as Nzerekore, Gueckedou, Kissidougou, Kilissi and Kindia. Majority sites have no irrigated sawah platform, except for the Taiwanese influences in border areas of Liberia and Sierra Leone. North Korea has been irrigated sawah program at Kindia since 1988: Sampled February 1988 and January 1989 and visited August 2002, (29)Makeni, Kabala,: Inland valley bottom irrigated sawah platform developed by Taiwan are still seen in many places although some had degraded. A sawah rice experimental station called Chinese farm exists at Bo (7.963N 11.751W), by 1992, Rokupr had mangrove rice research station (9.01N 12.955W) of WARDA/AfricaRice: sampled and surveyed July1986, February 1988, (30) Monrovia/WARDA, Suakoko/CARI, Gbarnga, Taiwan team’s irrigated sawah platform can be observed by Google earth at Suakoko (7.001N 9.569W) and Gbarnga (7.013N 9.459W): Sampled on April 1987 and January 1989, (31) Ziguinchor/Nyaguis (12.573N 16.14W)/Tanaf (12.655N 15.45W), Inland valley Taiwanese assisted Sawah platform and ridge rice to avoid salt water, sampled on 2 and 3 May 1987, (32)Debi(World bank assisted) and Ntiago/M’bane (Taiwan and Japanese assisted, 16.405N 15.724W), and (33) Fanaye, WARDA station (16.537N 15.196W) sampled on 1May 1987 and 1-3 August 1998. During 1964-1973 and 1996-2005, Taiwan implemented 3,200ha irrigated sawah platform and trained 4000 farmers at 14 locations along the Senegal River and in Casamance region. This has been the basis for the promotion of rice cultivation in Senegal, which leads the green revolution of in West Africa. (34)Kuntuar/Wassu: Taiwan assisted tidal irrigation project, visited on 31July1998, (35)Adugyama(6.8864N1.879W)/Biemso No.1(6.8835N 1.851W):JICA/CRI sawah project site in 1996-2001, then JSPS Kakenhi sawah projects in 2002-2009, which target was endogenous sawah platform development. However
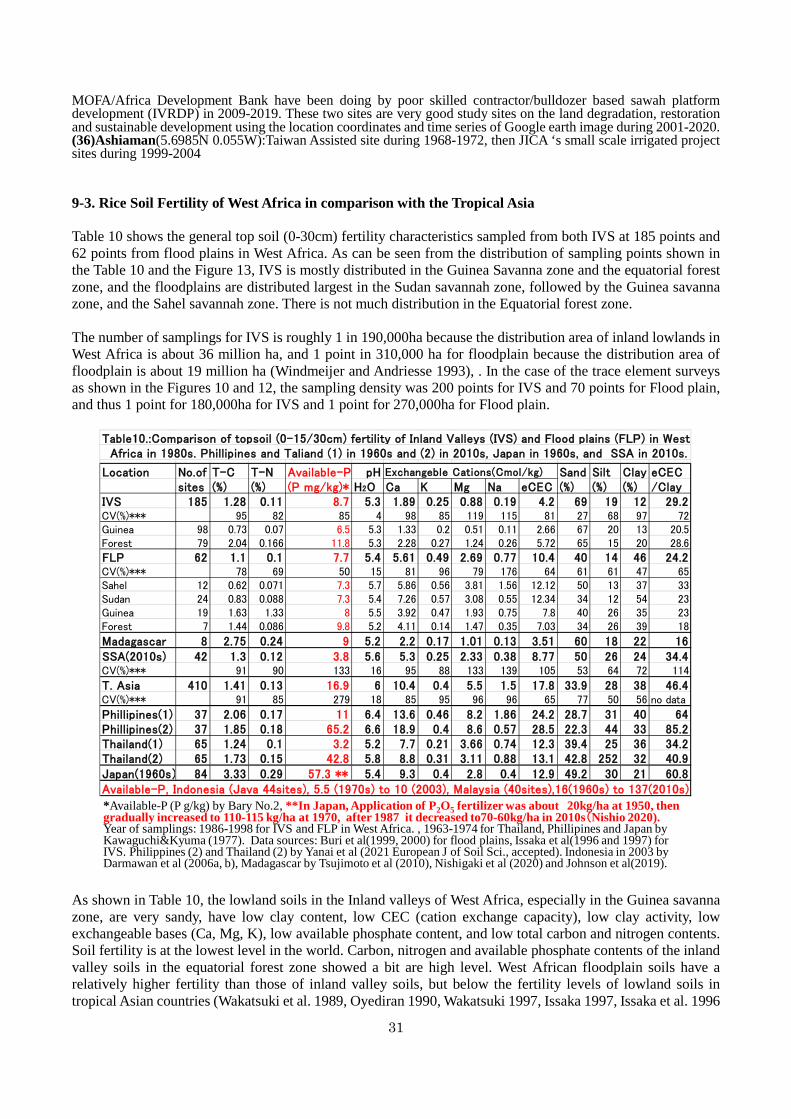
31
MOFA/Africa Development Bank have been doing by poor skilled contractor/bulldozer based sawah platform development (IVRDP) in 2009-2019. These two sites are very good study sites on the land degradation, restoration and sustainable development using the location coordinates and time series of Google earth image during 2001-2020. (36)Ashiaman(5.6985N 0.055W):Taiwan Assisted site during 1968-1972, then JICA ‘s small scale irrigated project sites during 1999-2004 9-3. Rice Soil Fertility of West Africa in comparison with the Tropical Asia Table 10 shows the general top soil (0-30cm) fertility characteristics sampled from both IVS at 185 points and 62 points from flood plains in West Africa. As can be seen from the distribution of sampling points shown in the Table 10 and the Figure 13, IVS is mostly distributed in the Guinea Savanna zone and the equatorial forest zone, and the floodplains are distributed largest in the Sudan savannah zone, followed by the Guinea savanna zone, and the Sahel savannah zone. There is not much distribution in the Equatorial forest zone. The number of samplings for IVS is roughly 1 in 190,000ha because the distribution area of inland lowlands in West Africa is about 36 million ha, and 1 point in 310,000 ha for floodplain because the distribution area of floodplain is about 19 million ha (Windmeijer and Andriesse 1993), . In the case of the trace element surveys as shown in the Figures 10 and 12, the sampling density was 200 points for IVS and 70 points for Flood plain, and thus 1 point for 180,000ha for IVS and 1 point for 270,000ha for Flood plain.
As shown in Table 10, the lowland soils in the Inland valleys of West Africa, especially in the Guinea savanna zone, are very sandy, have low clay content, low CEC (cation exchange capacity), low clay activity, low exchangeable bases (Ca, Mg, K), low available phosphate content, and low total carbon and nitrogen contents. Soil fertility is at the lowest level in the world. Carbon, nitrogen and available phosphate contents of the inland valley soils in the equatorial forest zone showed a bit are high level. West African floodplain soils have a relatively higher fertility than those of inland valley soils, but below the fertility levels of lowland soils in tropical Asian countries (Wakatsuki et al. 1989, Oyediran 1990, Wakatsuki 1997, Issaka 1997, Issaka et al. 1996
*Available-P (P g/kg) by Bary No.2, **In Japan, Application of P2O5 fertilizer was about 20kg/ha at 1950, then gradually increased to 110-115 kg/ha at 1970, after 1987 it decreased to70-60kg/ha in 2010s(Nishio 2020). Year of samplings: 1986-1998 for IVS and FLP in West Africa. , 1963-1974 for Thailand, Phillipines and Japan by Kawaguchi&Kyuma (1977). Data sources: Buri et al(1999, 2000) for flood plains, Issaka et al(1996 and 1997) for IVS. Philippines (2) and Thailand (2) by Yanai et al (2021 European J of Soil Sci., accepted). Indonesia in 2003 by Darmawan et al (2006a, b), Madagascar by Tsujimoto et al (2010), Nishigaki et al (2020) and Johnson et al(2019).
Table10.:Comparison of topsoil (0-15/30cm) fertility of Inland Valleys (IVS) and Flood plains (FLP) in West Africa in 1980s. Phillipines and Taliand (1) in 1960s and (2) in 2010s, Japan in 1960s, and SSA in 2010s.
Location No.of T-C T-N Available-P pH Exchangeble Cations(Cmol/kg) Sand Silt Clay eCECsites (%) (%) (P mg/kg)* H2O Ca K Mg Na eCEC (%) (%) (%) /Clay
IVS 185 1.28 0.11 8.7 5.3 1.89 0.25 0.88 0.19 4.2 69 19 12 29.2CV(%)*** 95 82 85 4 98 85 119 115 81 27 68 97 72Guinea 98 0.73 0.07 6.5 5.3 1.33 0.2 0.51 0.11 2.66 67 20 13 20.5Forest 79 2.04 0.166 11.8 5.3 2.28 0.27 1.24 0.26 5.72 65 15 20 28.6
FLP 62 1.1 0.1 7.7 5.4 5.61 0.49 2.69 0.77 10.4 40 14 46 24.2CV(%)*** 78 69 50 15 81 96 79 176 64 61 61 47 65Sahel 12 0.62 0.071 7.3 5.7 5.86 0.56 3.81 1.56 12.12 50 13 37 33Sudan 24 0.83 0.088 7.3 5.4 7.26 0.57 3.08 0.55 12.34 34 12 54 23Guinea 19 1.63 1.33 8 5.5 3.92 0.47 1.93 0.75 7.8 40 26 35 23Forest 7 1.44 0.086 9.8 5.2 4.11 0.14 1.47 0.35 7.03 34 26 39 18
Madagascar 8 2.75 0.24 9 5.2 2.2 0.17 1.01 0.13 3.51 60 18 22 16SSA(2010s) 42 1.3 0.12 3.8 5.6 5.3 0.25 2.33 0.38 8.77 50 26 24 34.4CV(%)*** 91 90 133 16 95 88 133 139 105 53 64 72 114
T. Asia 410 1.41 0.13 16.9 6 10.4 0.4 5.5 1.5 17.8 33.9 28 38 46.4CV(%)*** 91 85 279 18 85 95 96 96 65 77 50 56 no data
Phillipines(1) 37 2.06 0.17 11 6.4 13.6 0.46 8.2 1.86 24.2 28.7 31 40 64Phillipines(2) 37 1.85 0.18 65.2 6.6 18.9 0.4 8.6 0.57 28.5 22.3 44 33 85.2Thailand(1) 65 1.24 0.1 3.2 5.2 7.7 0.21 3.66 0.74 12.3 39.4 25 36 34.2Thailand(2) 65 1.73 0.15 42.8 5.8 8.8 0.31 3.11 0.88 13.1 42.8 252 32 40.9Japan(1960s) 84 3.33 0.29 57.3 ** 5.4 9.3 0.4 2.8 0.4 12.9 49.2 30 21 60.8Available-P, Indonesia (Java 44sites), 5.5 (1970s) to 10 (2003), Malaysia (40sites),16(1960s) to 137(2010s)
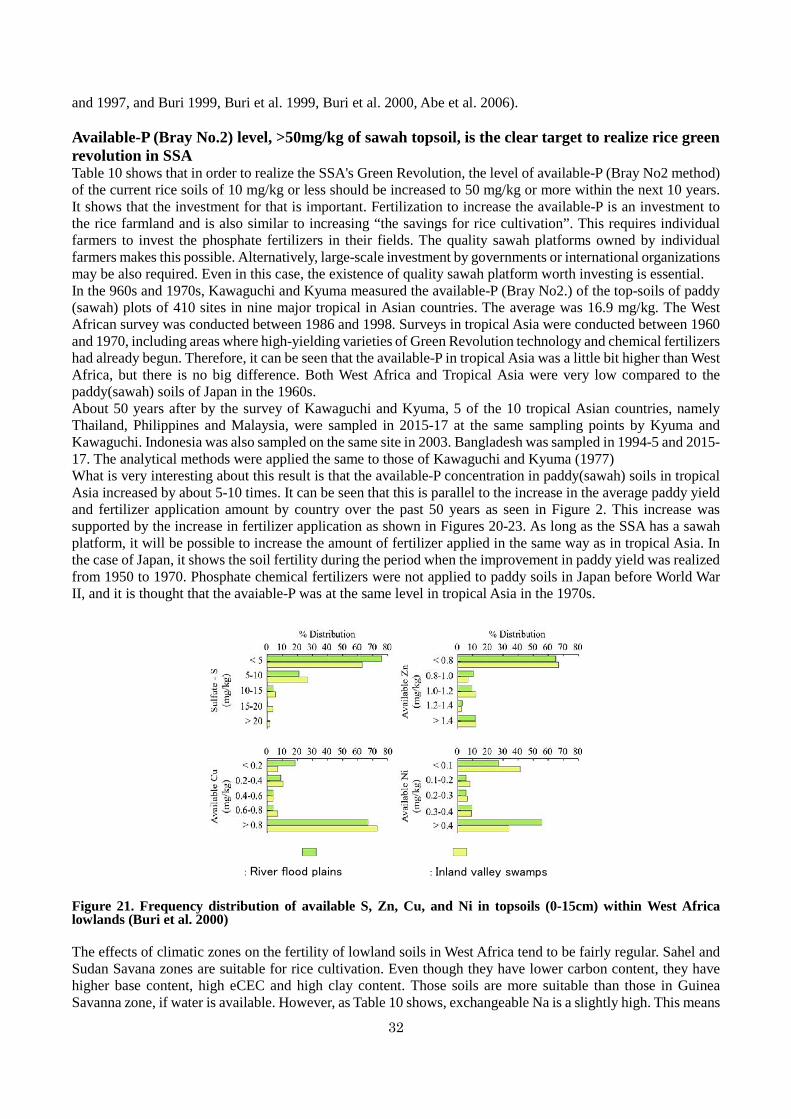
32
and 1997, and Buri 1999, Buri et al. 1999, Buri et al. 2000, Abe et al. 2006). Available-P (Bray No.2) level, >50mg/kg of sawah topsoil, is the clear target to realize rice green revolution in SSA Table 10 shows that in order to realize the SSA's Green Revolution, the level of available-P (Bray No2 method) of the current rice soils of 10 mg/kg or less should be increased to 50 mg/kg or more within the next 10 years. It shows that the investment for that is important. Fertilization to increase the available-P is an investment to the rice farmland and is also similar to increasing “the savings for rice cultivation”. This requires individual farmers to invest the phosphate fertilizers in their fields. The quality sawah platforms owned by individual farmers makes this possible. Alternatively, large-scale investment by governments or international organizations may be also required. Even in this case, the existence of quality sawah platform worth investing is essential. In the 960s and 1970s, Kawaguchi and Kyuma measured the available-P (Bray No2.) of the top-soils of paddy (sawah) plots of 410 sites in nine major tropical in Asian countries. The average was 16.9 mg/kg. The West African survey was conducted between 1986 and 1998. Surveys in tropical Asia were conducted between 1960 and 1970, including areas where high-yielding varieties of Green Revolution technology and chemical fertilizers had already begun. Therefore, it can be seen that the available-P in tropical Asia was a little bit higher than West Africa, but there is no big difference. Both West Africa and Tropical Asia were very low compared to the paddy(sawah) soils of Japan in the 1960s. About 50 years after by the survey of Kawaguchi and Kyuma, 5 of the 10 tropical Asian countries, namely Thailand, Philippines and Malaysia, were sampled in 2015-17 at the same sampling points by Kyuma and Kawaguchi. Indonesia was also sampled on the same site in 2003. Bangladesh was sampled in 1994-5 and 2015-17. The analytical methods were applied the same to those of Kawaguchi and Kyuma (1977) What is very interesting about this result is that the available-P concentration in paddy(sawah) soils in tropical Asia increased by about 5-10 times. It can be seen that this is parallel to the increase in the average paddy yield and fertilizer application amount by country over the past 50 years as seen in Figure 2. This increase was supported by the increase in fertilizer application as shown in Figures 20-23. As long as the SSA has a sawah platform, it will be possible to increase the amount of fertilizer applied in the same way as in tropical Asia. In the case of Japan, it shows the soil fertility during the period when the improvement in paddy yield was realized from 1950 to 1970. Phosphate chemical fertilizers were not applied to paddy soils in Japan before World War II, and it is thought that the avaiable-P was at the same level in tropical Asia in the 1970s.
Figure 21. Frequency distribution of available S, Zn, Cu, and Ni in topsoils (0-15cm) within West Africa lowlands (Buri et al. 2000) The effects of climatic zones on the fertility of lowland soils in West Africa tend to be fairly regular. Sahel and Sudan Savana zones are suitable for rice cultivation. Even though they have lower carbon content, they have higher base content, high eCEC and high clay content. Those soils are more suitable than those in Guinea Savanna zone, if water is available. However, as Table 10 shows, exchangeable Na is a slightly high. This means
: River flood plains : Inland valley swamps
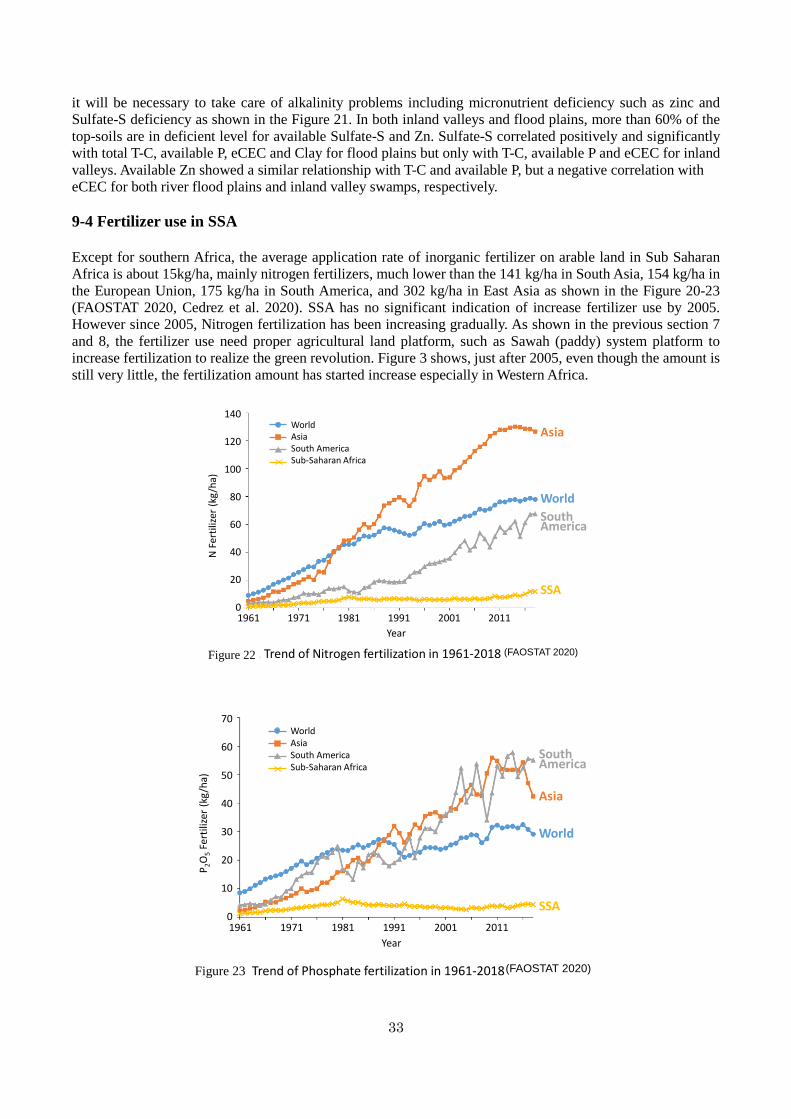
33
it will be necessary to take care of alkalinity problems including micronutrient deficiency such as zinc and Sulfate-S deficiency as shown in the Figure 21. In both inland valleys and flood plains, more than 60% of the top-soils are in deficient level for available Sulfate-S and Zn. Sulfate-S correlated positively and significantly with total T-C, available P, eCEC and Clay for flood plains but only with T-C, available P and eCEC for inland valleys. Available Zn showed a similar relationship with T-C and available P, but a negative correlation with eCEC for both river flood plains and inland valley swamps, respectively. 9-4 Fertilizer use in SSA Except for southern Africa, the average application rate of inorganic fertilizer on arable land in Sub Saharan Africa is about 15kg/ha, mainly nitrogen fertilizers, much lower than the 141 kg/ha in South Asia, 154 kg/ha in the European Union, 175 kg/ha in South America, and 302 kg/ha in East Asia as shown in the Figure 20-23 (FAOSTAT 2020, Cedrez et al. 2020). SSA has no significant indication of increase fertilizer use by 2005. However since 2005, Nitrogen fertilization has been increasing gradually. As shown in the previous section 7 and 8, the fertilizer use need proper agricultural land platform, such as Sawah (paddy) system platform to increase fertilization to realize the green revolution. Figure 3 shows, just after 2005, even though the amount is still very little, the fertilization amount has started increase especially in Western Africa.
140
120
100
80
60
40
20
0
WorldAsiaSouth AmericaSub-Saharan Africa
N F
ertil
izer (
kg/h
a)
Year1961 1971 1981 1991 2001 2011
(FAOSTAT 2020)
SSA
SouthAmerica
World
Asia
Figure 20. Trend of Nitrogen fertilization in 1961-2018Figure 22
70
60
50
40
30
20
10
0
WorldAsiaSouth AmericaSub-Saharan Africa
P 2O
5Fe
rtili
zer (
kg/h
a)
Year1961 1971 1981 1991 2001 2011
(FAOSTAT 2020)
SSA
SouthAmerica
World
Asia
Figure 21. Trend of Phosphate fertilization in 1961-2018Figure 23
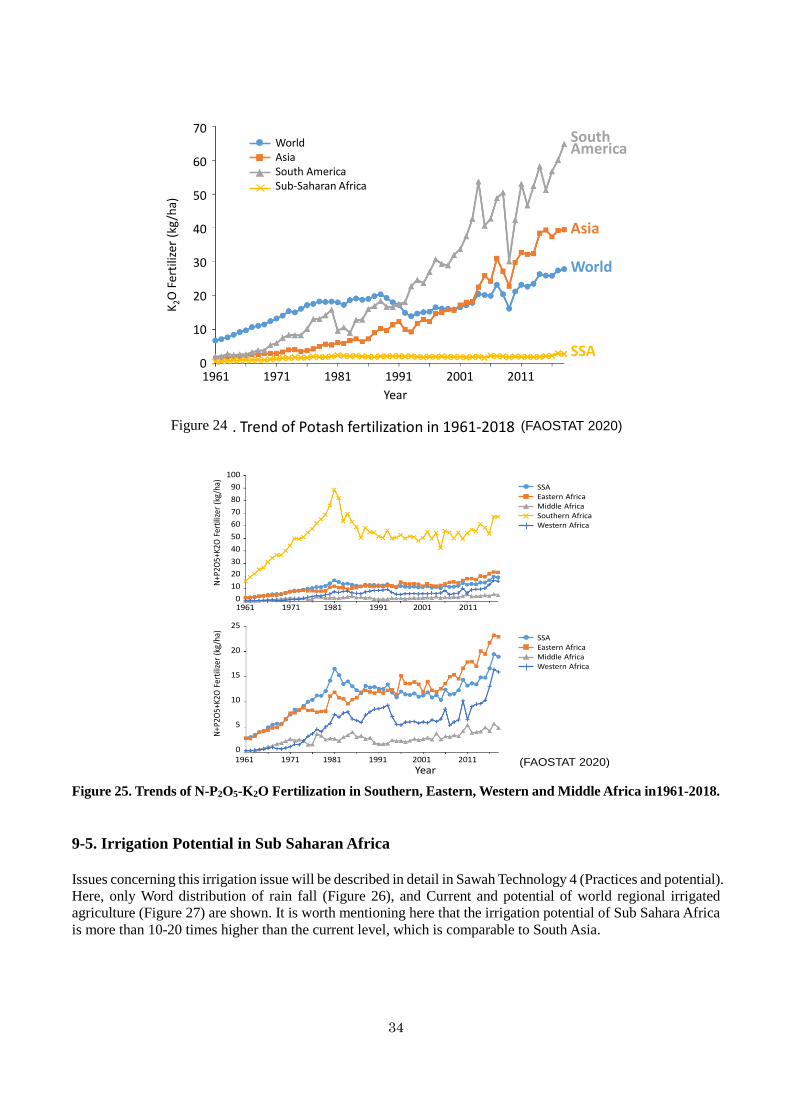
34
Figure 25. Trends of N-P2O5-K2O Fertilization in Southern, Eastern, Western and Middle Africa in1961-2018. 9-5. Irrigation Potential in Sub Saharan Africa Issues concerning this irrigation issue will be described in detail in Sawah Technology 4 (Practices and potential). Here, only Word distribution of rain fall (Figure 26), and Current and potential of world regional irrigated agriculture (Figure 27) are shown. It is worth mentioning here that the irrigation potential of Sub Sahara Africa is more than 10-20 times higher than the current level, which is comparable to South Asia.
70
60
50
40
30
20
10
0
WorldAsiaSouth AmericaSub-Saharan Africa
K 2O
Fer
tilize
r (kg
/ha)
Year1961 1971 1981 1991 2001 2011
(FAOSTAT 2020)
SSA
SouthAmerica
World
Asia
Figure 22. Trend of Potash fertilization in 1961-2018Figure 24
100908070605040302010
0
N+P2
O5+K
2OFe
rtiliz
er (k
g/ha
)
1961 1971 1981 1991 2001 2011
25
20
15
10
5
0
N+P2
O5+K
2OFe
rtiliz
er (k
g/ha
)
(FAOSTAT 2020)Year
SSAEastern AfricaMiddle AfricaSouthern AfricaWestern Africa
SSAEastern AfricaMiddle AfricaWestern Africa
1961 1971 1981 1991 2001 2011
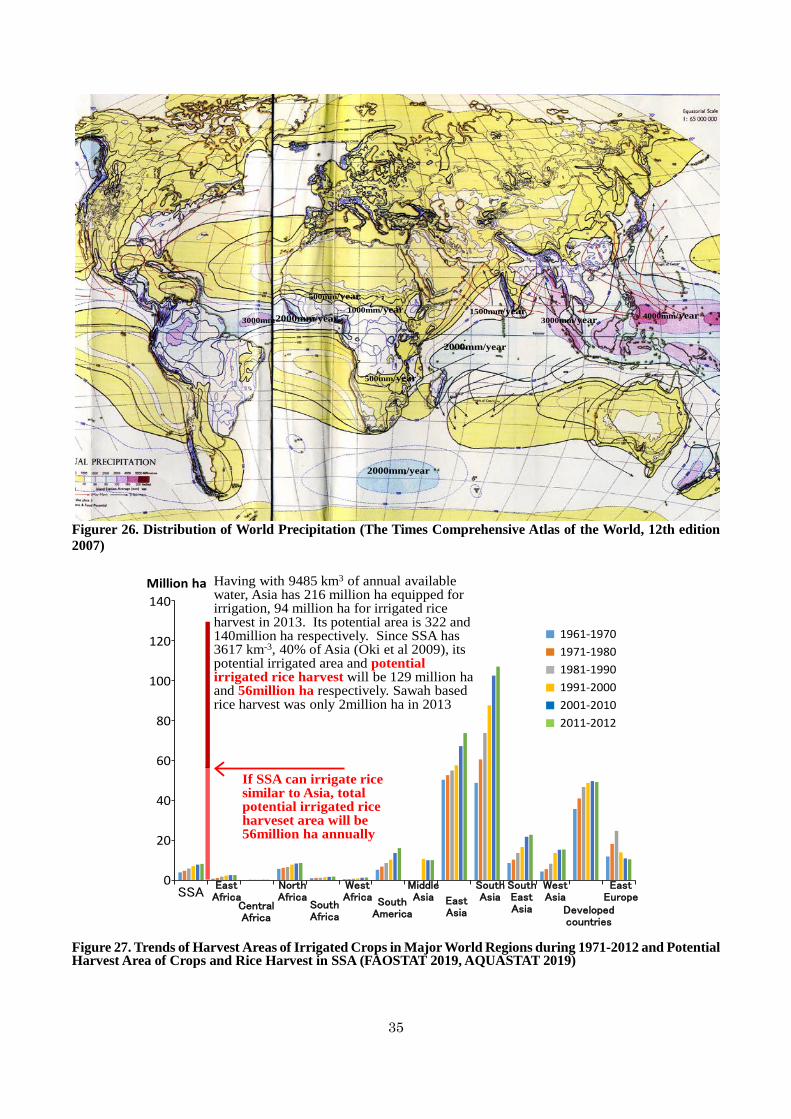
35
Figurer 26. Distribution of World Precipitation (The Times Comprehensive Atlas of the World, 12th edition 2007)
Figure 27. Trends of Harvest Areas of Irrigated Crops in Major World Regions during 1971-2012 and Potential Harvest Area of Crops and Rice Harvest in SSA (FAOSTAT 2019, AQUASTAT 2019)
2000mm/year
2000mm/year
1500mm/year1000mm/year3000mm/year 4000mm/year
500mm/year
500mm/year
2000mm/year3000mm
SSASouth
America
NorthAfrica
SouthAsiaEast
Asia Developedcountries
EastEurope
140
120
100
80
60
40
20
0
1961-19701971-19801981-19901991-20002001-20102011-2012
EastAfrica
CentralAfrica
SouthAfrica
WestAfrica
MiddleAsia
SouthEastAsia
WestAsia
Million ha Having with 9485 km3 of annual available water, Asia has 216 million ha equipped for irrigation, 94 million ha for irrigated rice harvest in 2013. Its potential area is 322 and 140million ha respectively. Since SSA has 3617 km-3, 40% of Asia (Oki et al 2009), its potential irrigated area and potential irrigated rice harvest will be 129 million ha and 56million ha respectively. Sawah based rice harvest was only 2million ha in 2013
If SSA can irrigate rice similar to Asia, total potential irrigated rice harveset area will be 56million ha annually
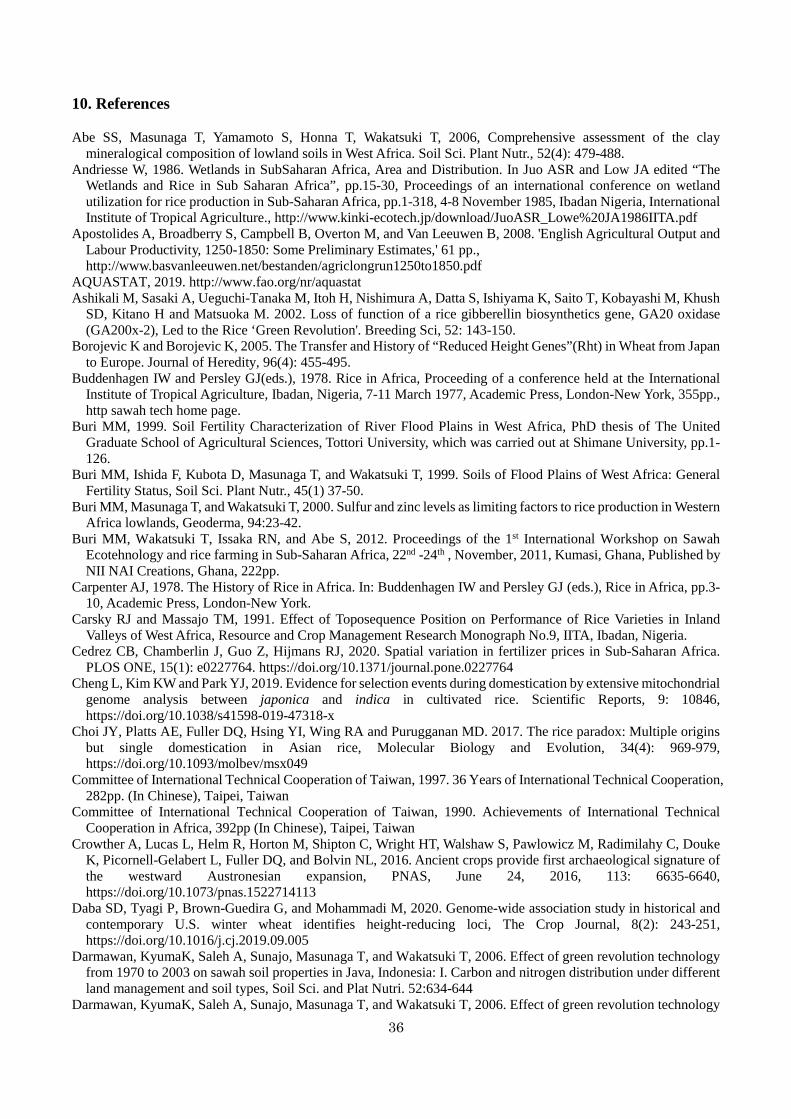
36
10. References Abe SS, Masunaga T, Yamamoto S, Honna T, Wakatsuki T, 2006, Comprehensive assessment of the clay
mineralogical composition of lowland soils in West Africa. Soil Sci. Plant Nutr., 52(4): 479-488. Andriesse W, 1986. Wetlands in SubSaharan Africa, Area and Distribution. In Juo ASR and Low JA edited “The
Wetlands and Rice in Sub Saharan Africa”, pp.15-30, Proceedings of an international conference on wetland utilization for rice production in Sub-Saharan Africa, pp.1-318, 4-8 November 1985, Ibadan Nigeria, International Institute of Tropical Agriculture., http://www.kinki-ecotech.jp/download/JuoASR_Lowe%20JA1986IITA.pdf
Apostolides A, Broadberry S, Campbell B, Overton M, and Van Leeuwen B, 2008. 'English Agricultural Output and Labour Productivity, 1250-1850: Some Preliminary Estimates,' 61 pp., http://www.basvanleeuwen.net/bestanden/agriclongrun1250to1850.pdf
AQUASTAT, 2019. http://www.fao.org/nr/aquastat Ashikali M, Sasaki A, Ueguchi-Tanaka M, Itoh H, Nishimura A, Datta S, Ishiyama K, Saito T, Kobayashi M, Khush
SD, Kitano H and Matsuoka M. 2002. Loss of function of a rice gibberellin biosynthetics gene, GA20 oxidase (GA200x-2), Led to the Rice ‘Green Revolution'. Breeding Sci, 52: 143-150.
Borojevic K and Borojevic K, 2005. The Transfer and History of “Reduced Height Genes”(Rht) in Wheat from Japan to Europe. Journal of Heredity, 96(4): 455-495.
Buddenhagen IW and Persley GJ(eds.), 1978. Rice in Africa, Proceeding of a conference held at the International Institute of Tropical Agriculture, Ibadan, Nigeria, 7-11 March 1977, Academic Press, London-New York, 355pp., http sawah tech home page.
Buri MM, 1999. Soil Fertility Characterization of River Flood Plains in West Africa, PhD thesis of The United Graduate School of Agricultural Sciences, Tottori University, which was carried out at Shimane University, pp.1-126.
Buri MM, Ishida F, Kubota D, Masunaga T, and Wakatsuki T, 1999. Soils of Flood Plains of West Africa: General Fertility Status, Soil Sci. Plant Nutr., 45(1) 37-50.
Buri MM, Masunaga T, and Wakatsuki T, 2000. Sulfur and zinc levels as limiting factors to rice production in Western Africa lowlands, Geoderma, 94:23-42.
Buri MM, Wakatsuki T, Issaka RN, and Abe S, 2012. Proceedings of the 1st International Workshop on Sawah Ecotehnology and rice farming in Sub-Saharan Africa, 22nd -24th , November, 2011, Kumasi, Ghana, Published by NII NAI Creations, Ghana, 222pp.
Carpenter AJ, 1978. The History of Rice in Africa. In: Buddenhagen IW and Persley GJ (eds.), Rice in Africa, pp.3-10, Academic Press, London-New York.
Carsky RJ and Massajo TM, 1991. Effect of Toposequence Position on Performance of Rice Varieties in Inland Valleys of West Africa, Resource and Crop Management Research Monograph No.9, IITA, Ibadan, Nigeria.
Cedrez CB, Chamberlin J, Guo Z, Hijmans RJ, 2020. Spatial variation in fertilizer prices in Sub-Saharan Africa. PLOS ONE, 15(1): e0227764. https://doi.org/10.1371/journal.pone.0227764
Cheng L, Kim KW and Park YJ, 2019. Evidence for selection events during domestication by extensive mitochondrial genome analysis between japonica and indica in cultivated rice. Scientific Reports, 9: 10846, https://doi.org/10.1038/s41598-019-47318-x
Choi JY, Platts AE, Fuller DQ, Hsing YI, Wing RA and Purugganan MD. 2017. The rice paradox: Multiple origins but single domestication in Asian rice, Molecular Biology and Evolution, 34(4): 969-979, https://doi.org/10.1093/molbev/msx049
Committee of International Technical Cooperation of Taiwan, 1997. 36 Years of International Technical Cooperation, 282pp. (In Chinese), Taipei, Taiwan
Committee of International Technical Cooperation of Taiwan, 1990. Achievements of International Technical Cooperation in Africa, 392pp (In Chinese), Taipei, Taiwan
Crowther A, Lucas L, Helm R, Horton M, Shipton C, Wright HT, Walshaw S, Pawlowicz M, Radimilahy C, Douke K, Picornell-Gelabert L, Fuller DQ, and Bolvin NL, 2016. Ancient crops provide first archaeological signature of the westward Austronesian expansion, PNAS, June 24, 2016, 113: 6635-6640, https://doi.org/10.1073/pnas.1522714113
Daba SD, Tyagi P, Brown-Guedira G, and Mohammadi M, 2020. Genome-wide association study in historical and contemporary U.S. winter wheat identifies height-reducing loci, The Crop Journal, 8(2): 243-251, https://doi.org/10.1016/j.cj.2019.09.005
Darmawan, KyumaK, Saleh A, Sunajo, Masunaga T, and Wakatsuki T, 2006. Effect of green revolution technology from 1970 to 2003 on sawah soil properties in Java, Indonesia: I. Carbon and nitrogen distribution under different land management and soil types, Soil Sci. and Plat Nutri. 52:634-644
Darmawan, KyumaK, Saleh A, Sunajo, Masunaga T, and Wakatsuki T, 2006. Effect of green revolution technology
37
from 1970 to 2003 on sawah soil properties in Java, Indonesia: II. Changes in the chemical properties of soils, Soil Sci. and Plat Nutri. 52:645-653
Deng Z, Qin L, Gao Y, Weisskopf AR, Zhang C and Fuller DQ. 2015. From early domesticated rice of the middle
Yangtze basin to millet, rice and wheat agriculture: Archaeobotanical macro-remains from Baligang, Nanyang basin, central China (6700-500BC), PLOS ONE, 10(10): e0139885. https://doi.org/10.1371/journal.pone.0139885
Ertsen MW, 2006. Colonial Irrigation: Myths of Emptiness. Landscape Research, 31(2): 147-167. https://doi.org/10.1080/01426390600638588
Evans LT, 1993. Crop Evolution, Adaptation and Yield, Cambridge Univ. Press, 500pp. FAOSTAT, 2017. http://www.fao.org/statistics/en/ FAOSTAT, 2018. http://www.fao.org/statistics/en/ FAOSTAT, 2019. http://www.fao.org/statistics/en/ FAOSTAT, 2020. http://www.fao.org/statistics/en/ Fischer RA, Byerlee D, and Edmeades G, 2014. Crop yields and global food security: will yield increase continue to
feed the world? ACIAR, Monograph No.158. Australian Centre for International Agricultural Research, Canberra. https://www.researchgate.net/publication/282713287_Crop_yields_and_global_food_security_will_yield_increase_continue_to_feed_the_world_ACIAR_Monograph_No_158_Australian_Centre_for_International_Agricultural_Research
Fujiie H, Maruyama A, Fujiie M, Takagaki M, Merry DJ, and Kikuchi M, 2011. Why invest in minor project in Sub Saharan Africa? An exploration of the scale economy and diseconomy of irrigation project, Irrig. Drainage Syst. 25: 39-60, https://doi.org/10.1007/s10795-011-9111-4
Gross BL and Zhao Z, 2014. Archaeological and genetic insights into the origins of domesticated rice, PNAS, April 29, 2014, 111(17): 6190-6197, https://doi.org/10.1073/pnas.1308942110
Guo SY, 2012. Grain production and farmer’ living standards in the Ming and Qing dynasties. Journal of the institute of history, Chinese academy of social sciences, Volume 1 (In Chinese), translated information through personal communication by Du Jiajie, Kyoto University MS student on January 2020.
Hardin LS, 2008. Meeting that changed the world, Bellagio 1969: The green revolution, Nature, 455: 470-471. Harper Collins Publishers Ltd., 2007. The Times Comprehensive Atlas of the World, 12th edition. 544pp., Collins
Reference, London. Herdt RW and Capule C, 1983. Adoption, spread and production impact of modern rice varieties in Asia, IRRI, Los
Banos, Philippines, 61pp., http://books.irri.org/9711040832_content.pdf Hesser L. 2005. The man who fed the world, Nobel peace prize laureate Norman Borlaug and his battle to end world
hunger. Durban house Publishing Company. Dallas, USA, 263 pp., ISBN1-930754-90-6. Hirose H and Wakatsuki T, 2002. Restoration of Inland Valley Ecosystems in West Africa. Norin Tokei Kyokai,
Tokyo, 600pp. Honma T, 1998. Mechanism of nation building in Japan: Relationship between Sawah (Paddy) field development
and population increase. Sankaido Publishing Co., Ltd, Tokyo, 167pp. (in Japanese). Hopper WD, 1976. Development of Agriculture in Developing Countries. Scientific American, 235(3), 196-205. Hsieh SC, 2001. Agricultural Reform in Africa-With Special Focus on Taiwan Assisted Rice Production in Africa,
Past, Present and the Future Perspective-, Tropics, 11 (1): 33-58. Hsieh SC 2003. Agricultural Technology Transfer to Developing Countries. National Pingtung University of Science
and Technology Press, pp.1-14, 165-232. Huang H, Kurata N, Wei X, Wang ZH, Wang A, Zhao Q, Liu K, Lu H, Li W, Guo Y, Zhou C, Fan D, Weng Q, Zhu
C, Huang K, Zhang L, Wang Y, Feng L, Furuumi H, Kubo T, Miyabayashi T, Yuan X, Xu Q, Dong G, Zhan Q, Li C, Fujiyama A, Toyoda A, Lu T, Qian Q, Li Jiayang, and Han B, 2012. A map of rice genome variation reveals the origin of cultivated rice, Nature, 490: 497-501+ Method, https://doi.org/10.1038/nature11532
IITA, International Institute of Tropical Agriculture, 1981. Cereal improvement program, Rice. In IITA Annual Report for 1980, pp.100-116, Ibadan, Nigeria, http://biblio1.iita.org/bitstream/handle/20.500.12478/4860/U81SerIitaAnnualNothomNodev.pdf?sequence=1&isAllowed=y
IITA, International Institute of Tropical Agriculture, 1982. Cereal improvement program, Rice. In IITA Annual Report for 1981, pp.102-125, Ibadan, Nigeria, http://biblio1.iita.org/bitstream/handle/20.500.12478/4858/U82SerIitaAnnualNothomNodev.pdf?sequence=1&isAllowed=y
IITA, 1986. IITA Resource and Crop Management Program, Annual Report 1986, pp.80-86+supplement, http://www.kinki-ecotech.jp/download/IITAAnnualReport_1986_edit17Apr2017.pdf
IITA, 1987. IITA Resource and Crop Management Program, Annual Report 1987, pp.171-191+supplement,
38
http://www.kinki-ecotech.jp/download/IITAAnnualReport_1987_edit17Apr2017.pdf IITA, International Institute of Tropical Agriculture, 1988. IITA Annual Report and Research Highlights 1987/88,
161pp., Ibadan, Nigeria, https://hdl.handle.net/20.500.12478/4744 IITA, International Institute of Tropical Agriculture, 1993. IITA Annual Report 1992, Ibadan, Nigeria,
http://biblio1.iita.org/bitstream/handle/20.500.12478/5135/U93SerIitaAnnualNothomNodev.pdf?sequence=1&isAllowed=y
IRRI, http://irri.org/rice-today/upon-the-100-000th-cross Issaka RN, 1997. Fertility Characterization of Soils of Inland Valleys in West Africa, PhD thesis of The United
Graduate School of Agricultural Sciences, Tottori University, which was carried out at Shimane University, pp.1-132.
Issaka RN, Ishida F, Kubota D, and Wakatsuki T, 1997. Geographical distribution of selected soil fertility parameters of inland valleys in West Africa, Geoderma, 75: 99-116.
Issaka RN, Masunaga T, Kosaki T, Wakatsuki T, 1996. Soils of Inland Valleys of West Africa, General Fertility Parameters, Soil Sci. Plant Nutr., 42(1): 71-80.
Johnson JM, Vandamme E, Senthikumar K, Sila A, Shepherd KD and Saito K, 2019. Near-infrared, mid-infrared or combined diffuse reflectance spectroscopy for assessing soil fertility in rice fields in sub-Saharan Africa, Geoderma, 354(2019) 113840, 10 pages
Kato F, 2019. Geographic Distribution of Indigenous Rice-cultivation Techniques and Their Expansion in Tanzania, Trop. Agr. Development, 63(1):18-26.
Kawaguchi K and Kyuma K 1977. Paddy Soils in Tropical Asia, Their Material, Nature and Fertility, University Press of Hawaii, Honolulu, 258pp.
Kito H, 2007. Historical Trends of Japanese Population (In Japanese), PHP, Tokyo, 229pp. Komori T, 2011, http://tsu-com515.my.co ocan.jp/H23.11.12.Naka nishiIseki.html Khush GS, 1997. Origin, dispersal, cultivation and variation of rice, Plant Molecular Biology, 35(1-2): 25-34. Kyuma K, 2004. Paddy Soil Science, Kyoto University Press, Kyoto, 280pp. Liu B, Wang N, Chen M, Wu X, Mo D, Liu J, Xu S and Zhuang Y, 2017. Earliest hydraulic enterprise in China,
5,100 years ago, PNAS, December 26, 2017, 114(52): 13637-13642, https://doi.org/10.1073/pnas.1710516114 Livi-Bacci M, 2012. A Concise History of World Population, 5th ed., John Willey & Sons, Ltd. MAFF, 2017. Current Circumstances surrounding fertilizers in Japan and the world, Ministry of Agriculture, Forestry
and Fishery Japan (In Japanese), https://www.maff.go.jp/j/seisan/sien/sizai/s_hiryo/attach/pdf/past-1.pdf Matsuoka M, 2004. Seeking the ideal rice, Nikkei Science, November 2004, NIKKEI SCIENCE Inc., Tokyo (In
Japanese). Matsushita A, 2013. Logical Sawah, Nikkei premium series No 196, Nikkei Business Publications Inc., Tokyo, 237pp. (In Japanese).
Meertens HCC, Ndege LJ and Lupeja PM, 1999. The cultivation of rainfed lowland rice in Sukumaland, Tanzania, Agriculture, Ecosystem and Environment, 76(1999)31-45.
Meyer RS and Purugganan MD, 2013. Evolution of crop species: genetics of domestication and diversification, Nature Review Genetics, 14: 840-852(2013)
Mitchell BR, 1998. International historical statistics: Europe 1750-1993 4th ed. xvii, 959 p., London: Macmillan, New York: Published in the United States and Canada by Stockton Press.
Mizuno H, Katagiri S, Kanamori H, Mukai Y, Sasaki T, Matsumoto T and Wu J, 2020. Evolutionary dynamics and impacts of chromosome region carrying R-gene clusters in rice, Scientific Reports, 10: 872, https://doi.org/10.1038/s41598-020-57729-w
Nishigaki T, Ikazaki K, Tsujimoto Y, Andriamanajara A, Rakotoson T, and Razafimbelo T, 2020. Soil survey of the east coast and the central highlands indicates need to update Madagascar soil map, Soil Sci, Plant Nutri, Vol.66(No.3):469-480, https://doi.org/10.1080/00380768.2020.1769452
Nishio T, 1998. Scientists innovated agricultural technologies, Ieno Hikari Kyokai, Tokyo, 301pp.(In Japanese). Nishio M, 2002. Recent Trend of Chemical Fertilyzer Consumption in Japan, Japanese J. Soil Scie. And Plant
Nutrition, Vo. 73(No.2):219-225 (in Japanese) Office du Niger, 1998, Economic survey conducted by office du Niger, which was collected by T. Wakatsuki Ofori J, Hisatomi Y, Kamidouzono A, Masunaga T, and Wakatsuki T. 2005. Performance of rice cultivars in various
sawah ecosystems developed in inland valleys, Ashanti Region, Ghana. Soil Sci. Plant Nutr., 51: 469-476, https://doi.org/10.1111/j.1747-0765.2005.tb00054.x
Oki T, Agata Y, Kanae S, Saruhashi T, Yang D, and Musiake K, 2009. Global assessment of current water resources using total runoff integrating pathways. Hydrological Sciences Journal, 46(6): 983-995, https://doi.org/10.1080/02626660109492890
Otsuka M. 2004. The Rice Terraces in China Yunnan, Photographs, text by Teruyuki Kobayashi, 94pp., Mainichi
39
Shinbun Publishing Co. Ltd., Tokyo. Overton M, 1996. Agricultural Revolution in England, The transformation of the agrarian economy 1500-1850,
Cambridge Studies in Historical Geography, Cambridge UP, pp.1-258. Oyediran GO, 1990. Genesis, Classification and Potential Productivity of Selected Wetland Soils in the Savanna
Ecosystem of Nigeria, PhD Thesis, Obafemi Awolowo University, Ile-Ife, Nigeria, pp1-335. Perkins DH. 2017. Agricultural Development in China 1368-1968, Routledge, Taylor & Francis Group, London and
New York, 395pp. Roser M, 2017. Yields-Our World in Data, https://ourworldindata.org/yields/ Sasaki A, Ashikari M, Ueguchi-Tanaka M, Itoh H, Nishimura A, Swapan D, Ishiyama K, Saito T, Kobayashi M,
Khush GS, Kitano H, and Matsuoka M, 2002. A mutant gibbrellin-systhesis gene in rice. Nature, 416: 701-702, https://doi.org/10.1038/416701a
Senda A, 1996. The man who saved the world food crisis-The life of Gonjiro Inazuka (In Japanese), Ieno Hikari Kyokai, Tokyo, 325pp.
Takase K, Emoto S and Wakatsuki T, 2003. Study on International Cooperation in Rice Farming in West Africa, Japan International Cooperation Agency (JICA), AFP/JR/03-10, Tokyo, pp.1-92+A13pp.
Takase K and Kano T, 1969. “Development Strategies on Irrigation and Drainage” In Asian Agriculture Survey, Asian Development Bank, 520pp.
Thornton D, and Allnut RB, 1949, Rice, In: Rounce NV(ed.), The Agriculture of the Cultivation Steppe of the Lake, Western and Central Province, Longmans, Green, Cape Town, pp.56-62.
Tollenaar M and Lee EA, 2002. Yield potential, yield stability and stress tolerance in maize, Field Crops Research, 75(2-3): 161-169, https://doi.org/10.1016/S0378-4290(02)00024-2
Tollenaar M and Wu J, 1999. Yield Improvement in Temperate Maize is Attributable to Greater Stress Tolerance, Crop Sci., 39: 1597-1604, https://doi.org/10.2135/cropsci1999.3961597x
Tsujimoto Y, Honma K and Shiraiwa T, 2010. The effects of soil drying and rewetting on rice growth in lowland aquatic Ferralsols in the southeastern forest region of Madagascar, Plant Soil(2010)333:219-232, DOI 10.1007/s111-010-0337-y
United Nations Department of Economics and Social Affairs(UNDESA) 2017. The World Population Prospects 2017 Revision, https://www.un.org/development/desa/publications/world-population-prospects-the-2017-revision.html
USDA, National Agricultural Statistics Service 2017. Corn Area Planted and Harvested, Yield, Production, Utilization, Price, and Value - United States: 1866-2016. In Crop Production Historical Track Records (April 2017), pp.28-38. https://www.nass.usda.gov/Publications/Todays_Reports/reports/croptr17.pdf
USDA PS&D Online, 2017. https://apps.fas.usda.gov/psdonline/app/index.html#/app/home USDA PS&D Online, 2018. https://apps.fas.usda.gov/psdonline/app/index.html#/app/home USDA PS&D Online, 2019. https://apps.fas.usda.gov/psdonline/app/index.html#/app/home van Dam AJ and van Diepen CA, 1982. The soils of the flat wetlands of the world, their distribution and their
agricultural potential, Wageningen, International Soil Museum. https://www.isric.org/sites/default/files/ISRIC_TechPap05.pdf
Veltman NA, Flowers JM, Andel TR, and Schranz ME, 2019. Origin and geographic diversification of African rice (Oryza glaberrima), PLOS ONE, 14(3): e0203508, https://doi.org/10.1371/journal.pone.0203508
Wakatsuki T, 1997. Soils, Vegetation, Geology and Topography of West Africa. In Hirose S and Wakatsuki T (eds.) “Restoration of the ecological environment and rural regeneration of the Savanna zones in West African”, Chapter 2, Section 2, pp.81-123, Norin Tokei Kyokai, Tokyo.
Wakatsuki T, 1998. Transfer of Asian Experiences on the African Development in 21 Century: Comparative study and Evaluation on the Asian Collaborated Sawah Based Rice Development Projects in West Africa, Fund for Advanced Studies on International Development, FASID, Tokyo, Ministry of Foreign Affairs commissioned research report, Japan, English 5 pages and 18 pages Japanese, http://www.kinki-ecotech.jp/download/Wakatsuki1999FASIDSurveyReport.pdf
Wakatsuki T, 2013a. Road map of the dissemination of irrigated Sawah development and Rice cultivation technology by African farmers’ self-support efforts, Research for Tropical Agriculture, 6: 43-50 (in Japanese), https://doi.org/10.11248/nettai.6.43
Wakatsuki T, 2013b. Asian African Collaboration for Sustainable African Green Revolution through Sawah and Satoyama Eco-technology to Combat Global Food and Ecological Crisis in 2025” at 11th International Conference of ESAFS, 21-24 October 2013, Bogor, Indonesia
Wakatsuki T, Chen YS, Navasero NC, Evers A, Palada MC, Fashola OO, and Musa J, 1987. IITA Resource and Crop Management Program, Annual Report 1986: Chapter IV. Wetland Production Systems, Water Management and Hydrological Studies, Bida, Nigeria, P80-86, http://www.kinki-ecotech.jp/download/IITAAnnualReport_1986_edit17Apr2017.pdf
40
Wakatsuki T, Kosaki T and Palada MM, 1989. Sawah for Sustainable Rice Farming in Inland Valley Swamps, IVSs, in West Africa, Paper presented at the 2nd West African Farming System Research Network, 28thAug-1st Sep, 1989, Accra, Ghana, http://www.kinki-ecotech.jp/download/(Paper)2ndWAFSRN1989_symposium.pdf
Wakatsuki T, Otoo E, Andah WEI, Cobbina J, Buri MM and Kubota D (eds), 2001a. Proceedings of the International Workshop on Integrated Watershed Management of Inland Valley-Ecotechnology Approach, 6th-8th February 2001, Novotel Accra, Ghana, 230pp., http://www.kinki-ecotech.jp/download/2001WorkshopProceedingsAccra/2001FebWorkshopProceedingsAccra.pdf
Wakatsuki T, Otoo E, Andah WEI, Cobbina J, Buri MM and Kubota D (eds.), 2001b. Integrated Watershed Management of Inland Valley in Ghana and West Africa: Ecotechnology Approach, Final Report on JICA/CRI joint study project, CRI, Kumasi, Ghana and JICA, Tokyo, 337pp. http://www.kinki-ecotech.jp/download/JICA-CRI_Report2001/JICA%20CRI%202001%20Contents%20and%20Summary.pdf
Wakatsuki T, Palada MC, Fashola OO, and Ashraf M, 1988. IITA Resource and Crop Management Program, Annual Report 1987: Improvement of Rice-Based Systems, Physical Characteristics of IVS in the Benchmark Research Sites, Effect pf Improving the Paddy or Sawah Systems, Cost and Return, http://www.kinki-ecotech.jp/download/IITAAnnualReport_1987_edit17Apr2017.pdf
Wakatsuki T, Shinmura Y, Otoo E and Olaniyan GO, 1998. African based sawah systems for the integrated watershed management of small inland valleys in West Africa. In FAO Water Report No. 17. Institutional and Technical Options in the Development and Management of Small Scale Irrigation. Rome, pp. 45-60.
Wang M, Yu Y, Haberer G, Marri PR, Fan C, Goicoechea JL, Zuccolo A, Song X, Kudrna D, Ammiraju JSS, Cossu RM, Maldonado C, Chen J, Lee S, Sisneros N, Bayansst K, Golser W, Wissotsk M, Kim W, Sanchez P, Ndjiondjop MN, Sanni K, Long M, Carney J, Panaud O, Wicker T, Machado CA, Chen M, Mayer KFX, Rounsley S, and Wing RA, 2014. The genome sequence of African rice (Oryza glaberrima) and evidence for independent domestication, Nature Genetics, 46(9):982-988+, https://doi.org/10.1038/ng.3044
Wang RA, Purugganan MD and Zhang Q, 2018. The rice genome revolution: from an ancient grain to Green Super Rice, Nature Reviews Genetics, 19: 505-517.
Wikipedia, 2020. Office du Niger, https://en.wikipedia.org/wiki/Office_du_Niger Windmeijer PN and Andriesse W, 1993. Inland Valley in West Africa: An Agroecological Characterization of Rice-
Growing Environment, ILRI, Wageningen, 160pp.+. Wu H, 1985. Study on grain yield per mu in Vhinese history, Beijin, Agrculture Press (In Chinese), translated
information through personal communication by Du Jiajie, Kyoto University MS student on Jan. 2020. Yanai J, Tanaka A, Nakao A, Abe S, Hirose M, Sakamoto K, Masai F, Saito H, Kajiwara N, Dejbhimon K, Sriprachote
A, Kanyawonghta P, Lattirasuvan T, Timbas N, Medina S, Paing TN, Yusoff K, Wakatsuki T, and Kyuma K, 2021. Long-term changes in paddy soil fertility in tropical Asia after 50 years of the Green Revolution, Europian J. Soil Science, accepted for publication on 28th October 2021
Zhang J, Zhang X, Chen R, Yang L, Fan K, Liu Y, Wang G, Ren Z, and Liu Y 2020. Generation of Transgene-Free Semidwarf Maize Plants by Gene Editing of Gibberellin-Oxidase20-3 Using CRISPR/Cas9. Frontiers in Plant Science, 11: 1048, https://doi.org/10.3389/fpls.2020.01048
Zheng Y, Crawford GW, Jiang L and Chen X, 2016. Rice Domestication Revealed by Reduced Shattering of Archaeological rice from the Lower Yangtze valley, Scientific Reports, 6: 28136, https://doi.org/10.1038/srep28136
Zong Y, Chen Z, Innes JB, Chen C, Wang Z and Wang H, 2007. Fire and flood management of coastal swamp enabled first rice paddy cultivation in east China, Nature, 449: 459-462+suppliment, https://doi.org/10.1038/nature06135