Embed Size (px)
Citation preview

1
4Q 2016 AND FULL YEAREARNINGS REVIEW AND
2017 OUTLOOKJanuary 26, 2017
(PRELIMINARY RESULTS)
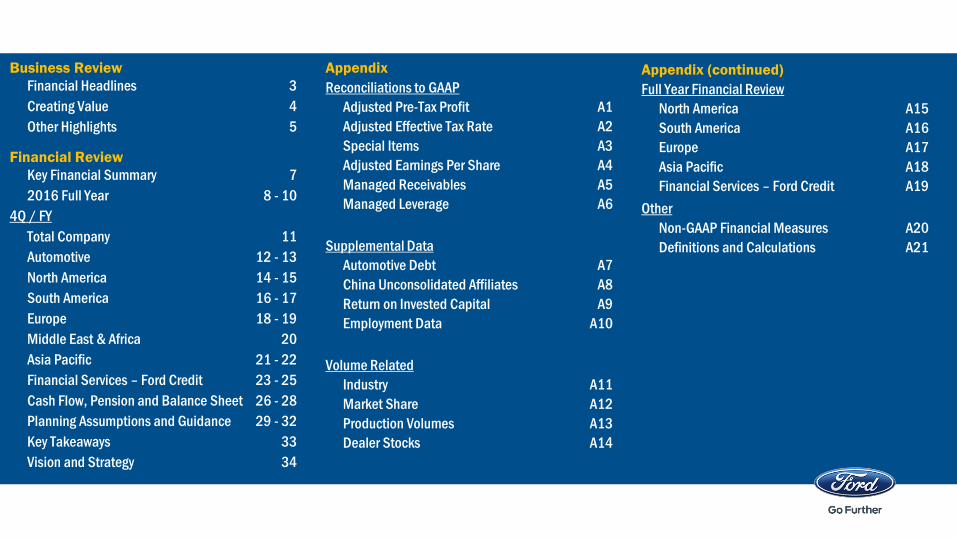
Business Review
Financial Headlines 3
Creating Value 4
Other Highlights 5
Financial Review
Key Financial Summary 7
2016 Full Year 8 - 10
4Q / FY
Total Company 11
Automotive 12 - 13
North America 14 - 15
South America 16 - 17
Europe 18 - 19
Middle East & Africa 20
Asia Pacific 21 - 22
Financial Services – Ford Credit 23 - 25
Cash Flow, Pension and Balance Sheet 26 - 28
Planning Assumptions and Guidance 29 - 32
Key Takeaways 33
Vision and Strategy 34
Appendix (continued)
Full Year Financial Review
North America A15
South America A16
Europe A17
Asia Pacific A18
Financial Services – Ford Credit A19
Other
Non-GAAP Financial Measures A20
Definitions and Calculations A21
Appendix
Reconciliations to GAAP
Adjusted Pre-Tax Profit A1
Adjusted Effective Tax Rate A2
Special Items A3
Adjusted Earnings Per Share A4
Managed Receivables A5
Managed Leverage A6
Supplemental Data
Automotive Debt A7
China Unconsolidated Affiliates A8
Return on Invested Capital A9
Employment Data A10
Volume Related
Industry A11
Market Share A12
Production Volumes A13
Dealer Stocks A14
3
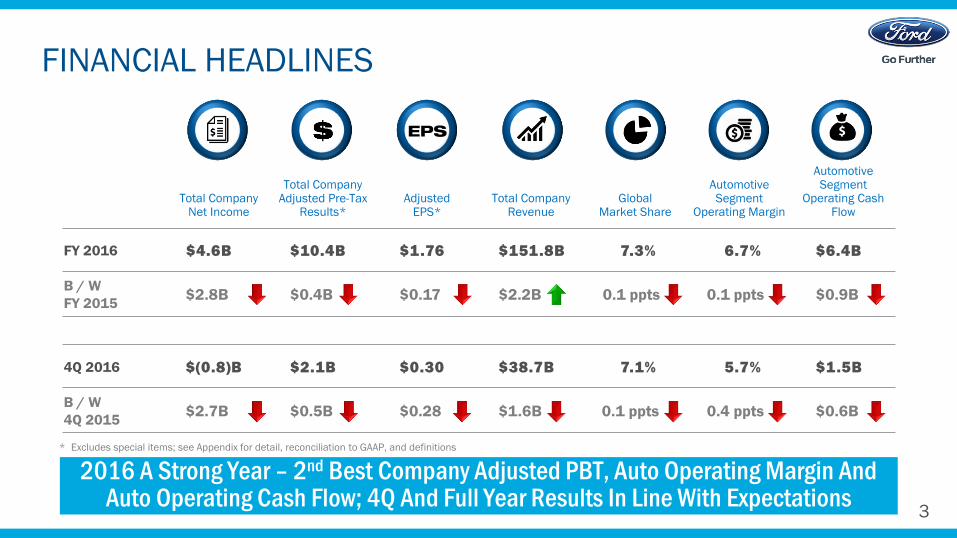
FINANCIAL HEADLINES
2016 A Strong Year – 2nd Best Company Adjusted PBT, Auto Operating Margin And Auto Operating Cash Flow; 4Q And Full Year Results In Line With Expectations
* Excludes special items; see Appendix for detail, reconciliation to GAAP, and definitions
Total CompanyNet Income
Total CompanyAdjusted Pre-Tax
Results* Adjusted
EPS*Total Company
RevenueGlobal
Market Share
AutomotiveSegment
Operating Margin
AutomotiveSegment
Operating Cash Flow
FY 2016 $4.6B $10.4B $1.76 $151.8B 7.3% 6.7% $6.4B
B / W
FY 2015$2.8B $0.4B $0.17 $2.2B 0.1 ppts 0.1 ppts $0.9B
4Q 2016 $(0.8)B $2.1B $0.30 $38.7B 7.1% 5.7% $1.5B
B / W
4Q 2015$2.7B $0.5B $0.28 $1.6B 0.1 ppts 0.4 ppts $0.6B
EPS
4
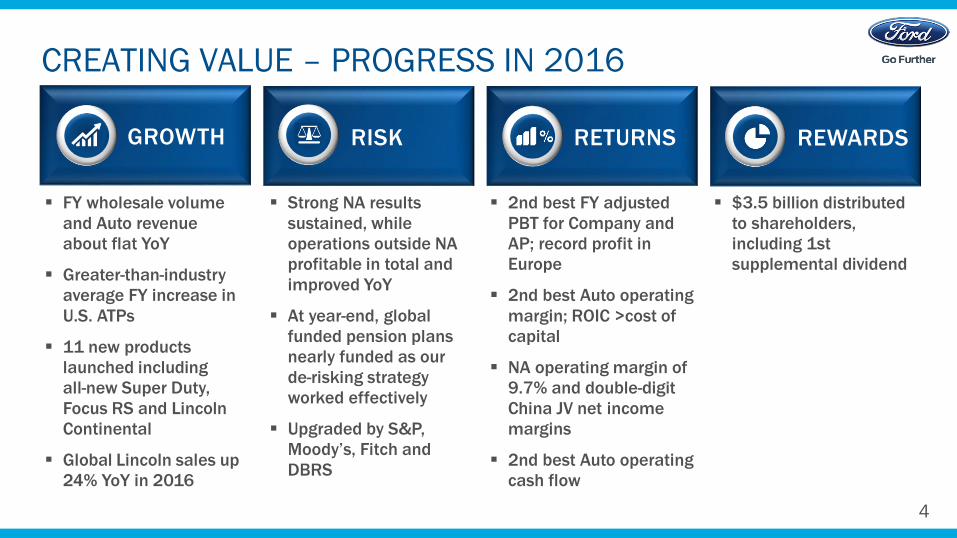
$3.5 billion distributed
to shareholders,
including 1st
supplemental dividend
CREATING VALUE – PROGRESS IN 2016
FY wholesale volume
and Auto revenue
about flat YoY
Greater-than-industry
average FY increase in
U.S. ATPs
11 new products
launched including
all-new Super Duty,
Focus RS and Lincoln
Continental
Global Lincoln sales up
24% YoY in 2016
Strong NA results
sustained, while
operations outside NA
profitable in total and
improved YoY
At year-end, global
funded pension plans
nearly funded as our
de-risking strategy
worked effectively
Upgraded by S&P,
Moody’s, Fitch and
DBRS
2nd best FY adjusted
PBT for Company and
AP; record profit in
Europe
2nd best Auto operating
margin; ROIC >cost of
capital
NA operating margin of
9.7% and double-digit
China JV net income
margins
2nd best Auto operating
cash flow
RISK RETURNSGROWTH REWARDS
5
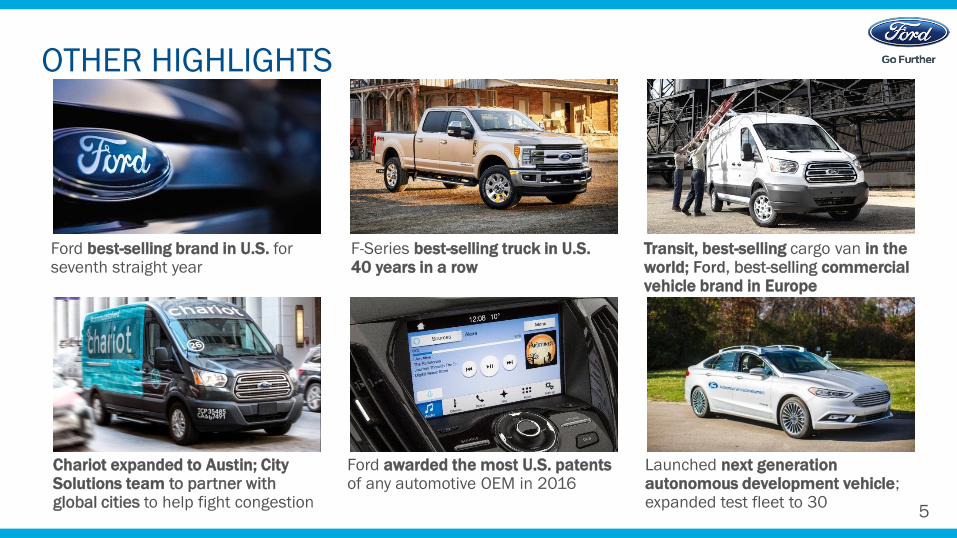
OTHER HIGHLIGHTS
F-Series best-selling truck in U.S. 40 years in a row
Transit, best-selling cargo van in the world; Ford, best-selling commercial vehicle brand in Europe
Launched next generation autonomous development vehicle; expanded test fleet to 30
Chariot expanded to Austin; City Solutions team to partner with global cities to help fight congestion
Ford awarded the most U.S. patents of any automotive OEM in 2016
Ford best-selling brand in U.S. for seventh straight year

FINANCIAL REVIEW
7
KEY FINANCIAL SUMMARY
Strong quarter and
another strong year –
2nd best FY Company
adjusted PBT
Wholesale volume and
revenue down in 4Q but
about flat in FY
4Q net income loss and
lower FY net income due to
remeasurement loss on
pension and OPEB plans
Operating cash flow and
cash balance strong
4Q FY
2016B / (W) 2015 2016
B / (W) 2015
Wholesales (000) 1,707 (68) 6,651 16
Revenue (Bils) $ 38.7 $ (1.6) 151.8 2.2
Results (Mils)
Automotive Segment $ 2,042 $ (280) $ 9,422 $ (146)
Financial Services Segment 384 (158) 1,820 (208)
All Other (294) (40) (867) (71)
Total Company adjusted pre-tax results $ 2,132 $ (478) $ 10,375 $ (425)
Special items pre-tax (3,249) (2,535) (3,579) (3,031)
Income / (Loss) before income taxes $ (1,117) $ (3,013) $ 6,796 $ (3,456)
(Provision for) / Benefit from income taxes 336 368 (2,189) 692
Net income / (loss) $ (781) $ (2,645) $ 4,607 $ (2,764)
Less: Income / (Loss) attributable to
non-controlling interests 2 6 11 13
Net income / (loss) attributable to Ford $ (783) $ (2,651) $ 4,596 $ (2,777)
Earnings per share (Diluted) $ (0.20) $ (0.67) $ 1.15 $ (0.69)
Adjusted earnings per share (Diluted) 0.30 (0.28) 1.76 (0.17)
Automotive Segment (Bils)
Operating cash flow $ 1.5 $ (0.6) $ 6.4 $ (0.9)
Cash $ 27.5 $ 3.9 $ 27.5 $ 3.9
Debt (15.9) (3.1) (15.9) (3.1)
Net cash $ 11.6 $ 0.8 $ 11.6 $ 0.8
8
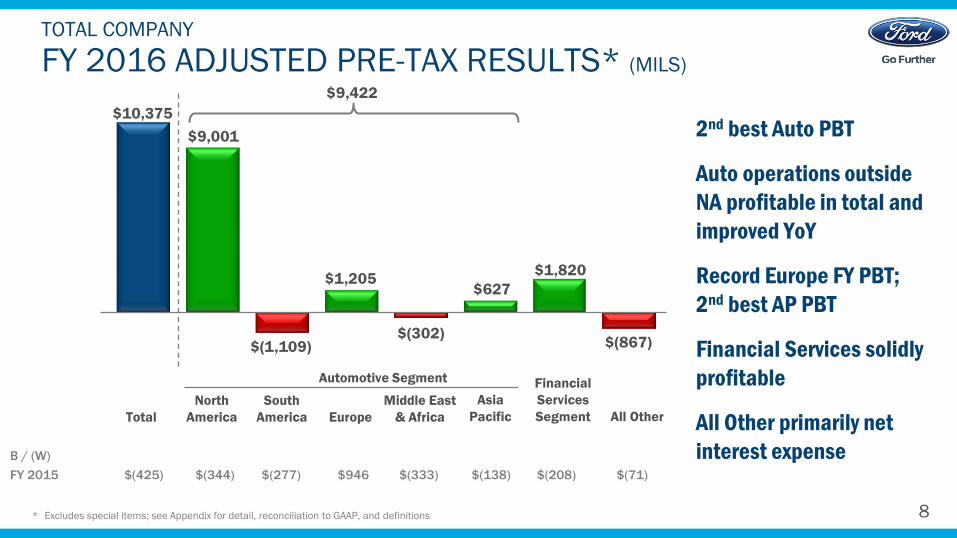
FY 2016 ADJUSTED PRE-TAX RESULTS* (MILS)
TOTAL COMPANY
2nd best Auto PBT
Auto operations outside
NA profitable in total and
improved YoY
Record Europe FY PBT;
2nd best AP PBT
Financial Services solidly
profitable
All Other primarily net
interest expense
* Excludes special items; see Appendix for detail, reconciliation to GAAP, and definitions
$10,375
$9,001
$(1,109)
$1,205
$(302)
$627
$1,820
$(867)
South
AmericaTotal
North
America All Other
Asia
PacificEurope
B / (W)
FY 2015 $(425) $(344) $(277) $946 $(333) $(138) $(208) $(71)
Middle East
& Africa
Financial
Services
Segment
Automotive Segment
$9,422
9
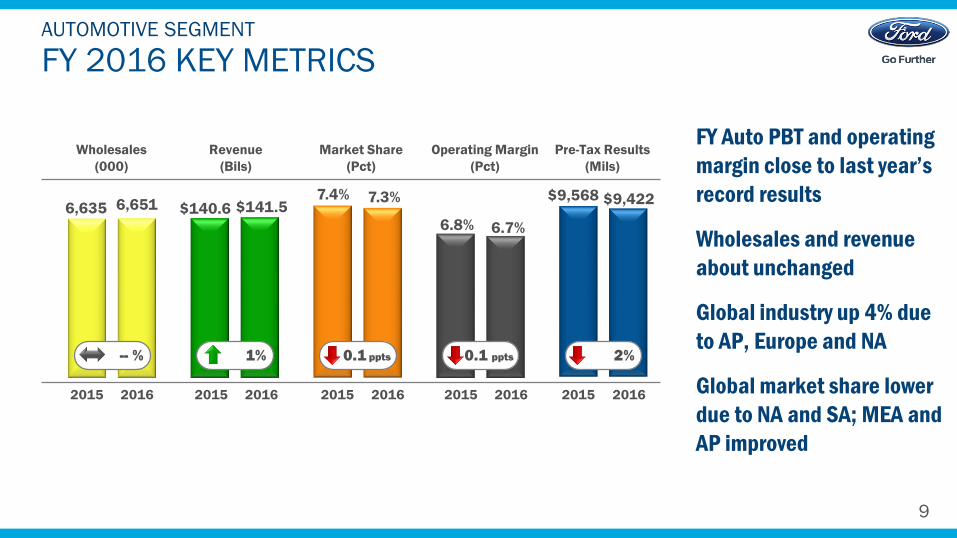
FY 2016 KEY METRICSAUTOMOTIVE SEGMENT
FY Auto PBT and operating
margin close to last year’s
record results
Wholesales and revenue
about unchanged
Global industry up 4% due
to AP, Europe and NA
Global market share lower
due to NA and SA; MEA and
AP improved
Wholesales
(000)
Revenue
(Bils)
Market Share
(Pct)
Operating Margin
(Pct)
Pre-Tax Results
(Mils)
6.7%6.8%
$9,422$9,5687.4%6,6516,635 $141.5$140.6
-- % 1% 0.1 ppts 0.1 ppts 2%
20162015 20162015 20162015 20162015 20162015
7.3%
10
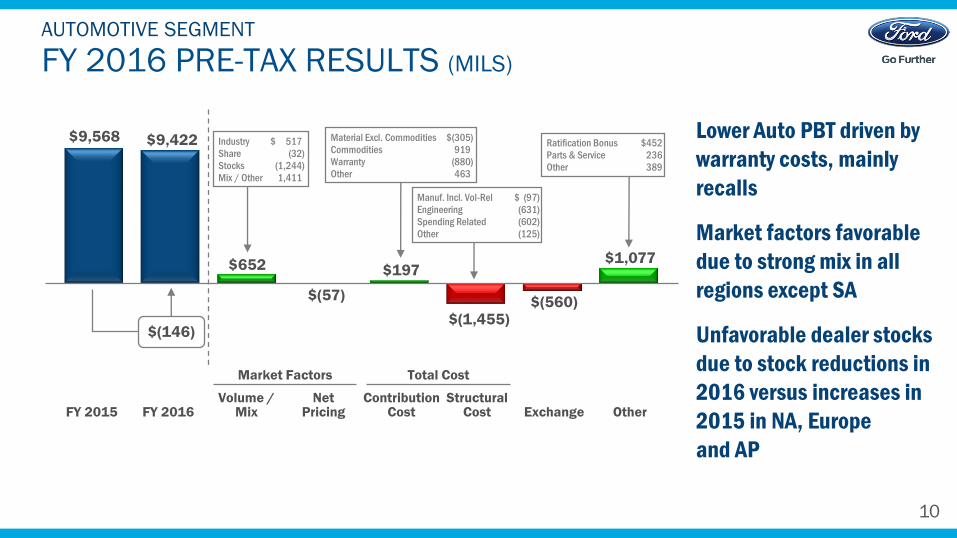
$9,568 $9,422
$652
$(57)
$197
$(1,455)$(560)
$1,077
FY 2016 PRE-TAX RESULTS (MILS)
AUTOMOTIVE SEGMENT
Lower Auto PBT driven by
warranty costs, mainly
recalls
Market factors favorable
due to strong mix in all
regions except SA
Unfavorable dealer stocks
due to stock reductions in
2016 versus increases in
2015 in NA, Europe
and AP
Market Factors Total Cost
Industry $ 517
Share (32)
Stocks (1,244)
Mix / Other 1,411
FY 2016FY 2015Volume /
MixNet
PricingStructural
Cost Exchange OtherContribution
Cost
Material Excl. Commodities $(305)
Commodities 919
Warranty (880)
Other 463
$(146)
Ratification Bonus $452
Parts & Service 236
Other 389
Manuf. Incl. Vol-Rel $ (97)
Engineering (631)
Spending Related (602)
Other (125)
11
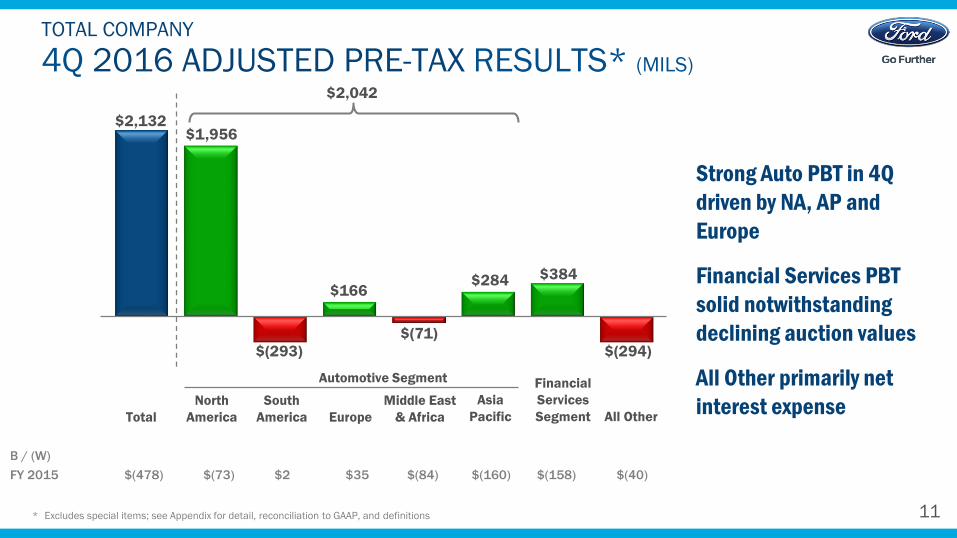
4Q 2016 ADJUSTED PRE-TAX RESULTS* (MILS)
TOTAL COMPANY
Strong Auto PBT in 4Q
driven by NA, AP and
Europe
Financial Services PBT
solid notwithstanding
declining auction values
All Other primarily net
interest expense
* Excludes special items; see Appendix for detail, reconciliation to GAAP, and definitions
$2,132 $1,956
$(293)
$166
$(71)
$284 $384
$(294)
South
AmericaTotal
North
America
Asia
PacificEurope
B / (W)
FY 2015 $(478) $(73) $2 $35 $(84) $(160) $(158) $(40)
Middle East
& Africa
Financial
Services
Segment
Automotive Segment
$2,042
All Other
12
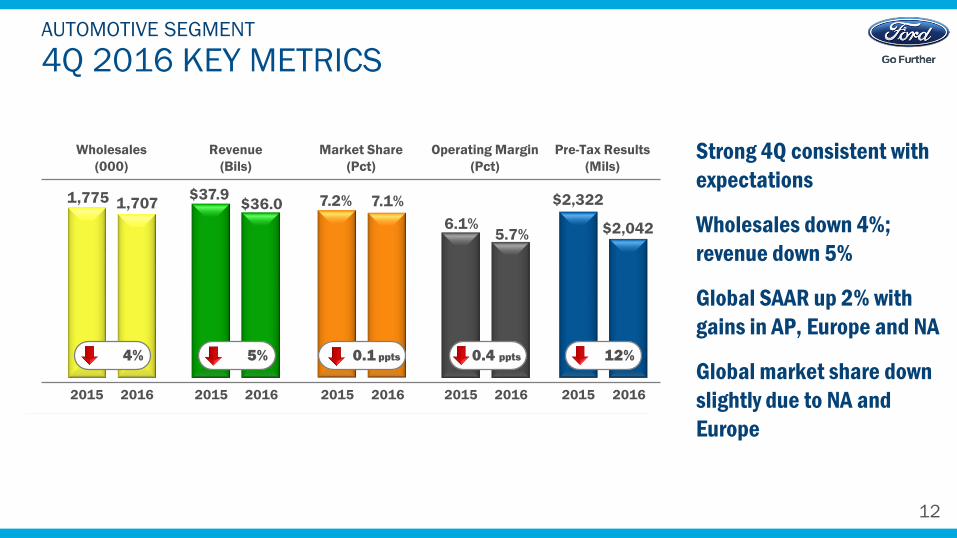
4Q 2016 KEY METRICSAUTOMOTIVE SEGMENT
Strong 4Q consistent with
expectations
Wholesales down 4%;
revenue down 5%
Global SAAR up 2% with
gains in AP, Europe and NA
Global market share down
slightly due to NA and
Europe
Wholesales
(000)
Revenue
(Bils)
Market Share
(Pct)
Operating Margin
(Pct)
Pre-Tax Results
(Mils)
5.7%6.1% $2,042
$2,3227.2%1,7071,775 $36.0$37.9
4% 5% 0.1 ppts 0.4 ppts 12%
20162015 20162015 20162015 20162015 20162015
6,635 6,651 $140.6 $141.5 7.4% 7.3% 6.8% 6.7% $9,568 $9,422
-- % 1 % 0.1 ppts 0.1 ppts 2%
FY:
7.1%
13
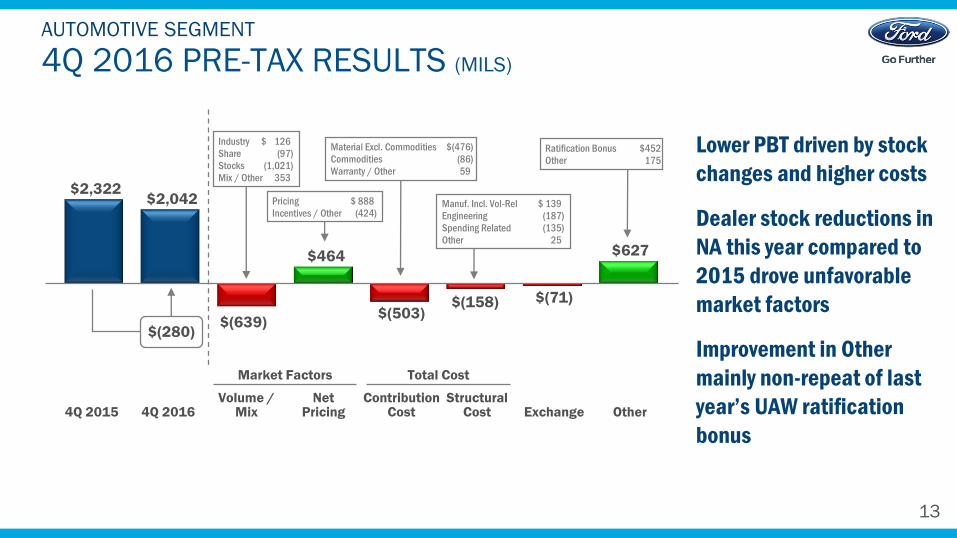
$2,322 $2,042
$(639)
$464
$(503)$(158) $(71)
$627
4Q 2016 PRE-TAX RESULTS (MILS)
AUTOMOTIVE SEGMENT
Lower PBT driven by stock
changes and higher costs
Dealer stock reductions in
NA this year compared to
2015 drove unfavorable
market factors
Improvement in Other
mainly non-repeat of last
year’s UAW ratification
bonus
Market Factors Total Cost
Manuf. Incl. Vol-Rel $ 139
Engineering (187)
Spending Related (135)
Other 25
Industry $ 126
Share (97)
Stocks (1,021)
Mix / Other 353
4Q 20164Q 2015Volume /
MixNet
PricingStructural
Cost Exchange OtherContribution
Cost
Material Excl. Commodities $(476)
Commodities (86)
Warranty / Other 59
$(280)
Pricing $ 888
Incentives / Other (424)
Ratification Bonus $452
Other 175
14
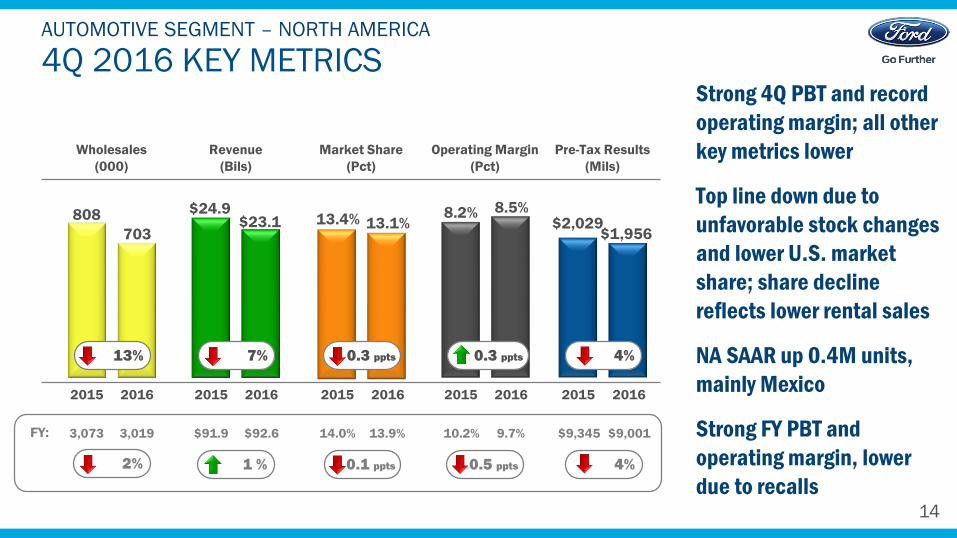
4Q 2016 KEY METRICSAUTOMOTIVE SEGMENT – NORTH AMERICA
Strong 4Q PBT and record
operating margin; all other
key metrics lower
Top line down due to
unfavorable stock changes
and lower U.S. market
share; share decline
reflects lower rental sales
NA SAAR up 0.4M units,
mainly Mexico
Strong FY PBT and
operating margin, lower
due to recalls
20162015 20162015 20162015 20162015 20162015
8.5%8.2%
$1,956$2,02913.1%13.4%
703
808$23.1
$24.9
13% 7% 0.3 ppts 0.3 ppts 4%
Wholesales
(000)
Revenue
(Bils)
Market Share
(Pct)
Operating Margin
(Pct)
Pre-Tax Results
(Mils)
3,073 3,019 $91.9 $92.6 14.0% 13.9% 10.2% 9.7% $9,345 $9,001
2% 1 % 0.1 ppts 0.5 ppts 4%
FY:
15
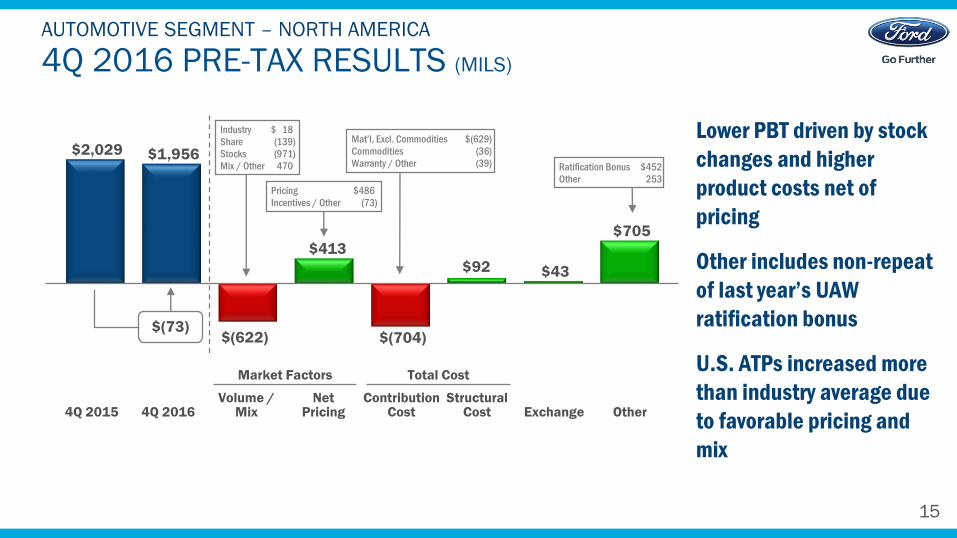
$2,029 $1,956
$(622)
$413
$(704)
$92 $43
$705
4Q 2016 PRE-TAX RESULTS (MILS)
AUTOMOTIVE SEGMENT – NORTH AMERICA
Lower PBT driven by stock
changes and higher
product costs net of
pricing
Other includes non-repeat
of last year’s UAW
ratification bonus
U.S. ATPs increased more
than industry average due
to favorable pricing and
mix
Market Factors Total Cost
Industry $ 18
Share (139)
Stocks (971)
Mix / Other 470
4Q 20164Q 2015Volume /
MixNet
PricingStructural
Cost Exchange OtherContribution
Cost
Mat’l, Excl. Commodities $(629)
Commodities (36)
Warranty / Other (39)
$(73)
Pricing $486
Incentives / Other (73)
Ratification Bonus $452
Other 253
16
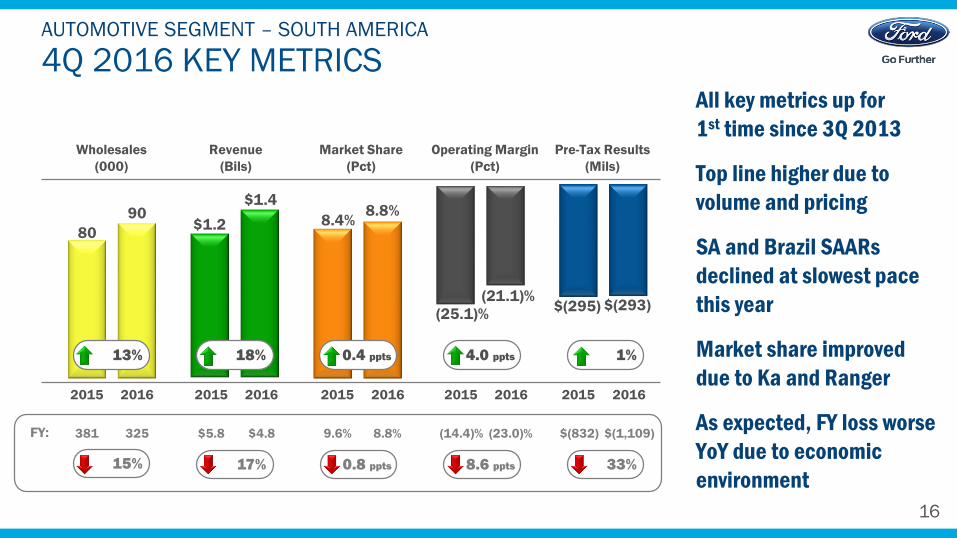
4Q 2016 KEY METRICSAUTOMOTIVE SEGMENT – SOUTH AMERICA
All key metrics up for
1st time since 3Q 2013
Top line higher due to
volume and pricing
SA and Brazil SAARs
declined at slowest pace
this year
Market share improved
due to Ka and Ranger
As expected, FY loss worse
YoY due to economic
environment
8.8%8.4%
(21.1)%
(25.1)%
90
80
$1.4
$1.2
13% 18% 4.0 ppts0.4 ppts 1%
$(295) $(293)
20162015 20162015 20162015 20162015 20162015
Wholesales
(000)
Revenue
(Bils)
Market Share
(Pct)
Operating Margin
(Pct)
Pre-Tax Results
(Mils)
381 325 $5.8 $4.8 9.6% 8.8% (14.4)% (23.0)% $(832) $(1,109)
15% 17% 0.8 ppts 8.6 ppts 33%
FY:
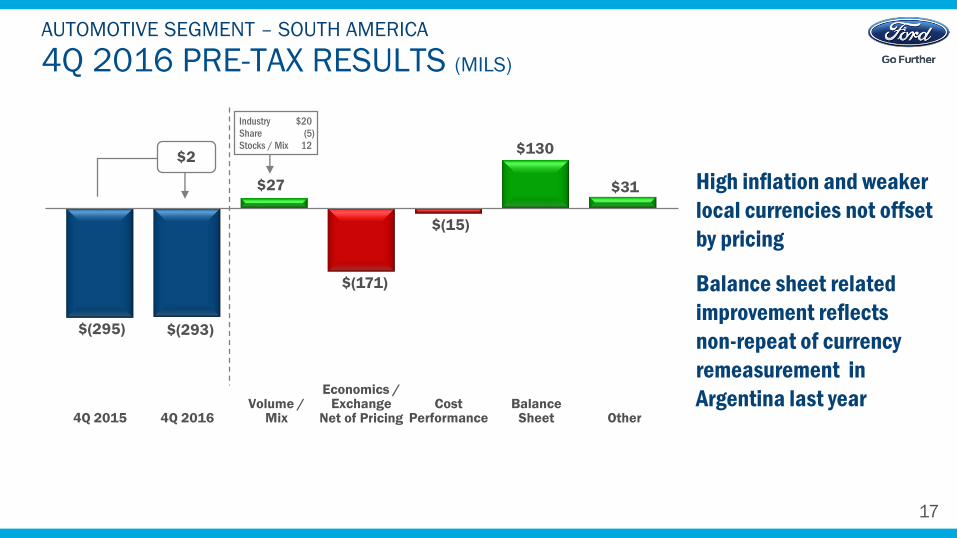
17
$(295) $(293)
$27
$(171)
$(15)
$130
$31
4Q 2016 PRE-TAX RESULTS (MILS)
AUTOMOTIVE SEGMENT – SOUTH AMERICA
High inflation and weaker
local currencies not offset
by pricing
Balance sheet related
improvement reflects
non-repeat of currency
remeasurement in
Argentina last year4Q 20164Q 2015
Volume /Mix
Economics / Exchange
Net of PricingBalance
Sheet OtherCost
Performance
$2
Industry $20
Share (5)
Stocks / Mix 12
18
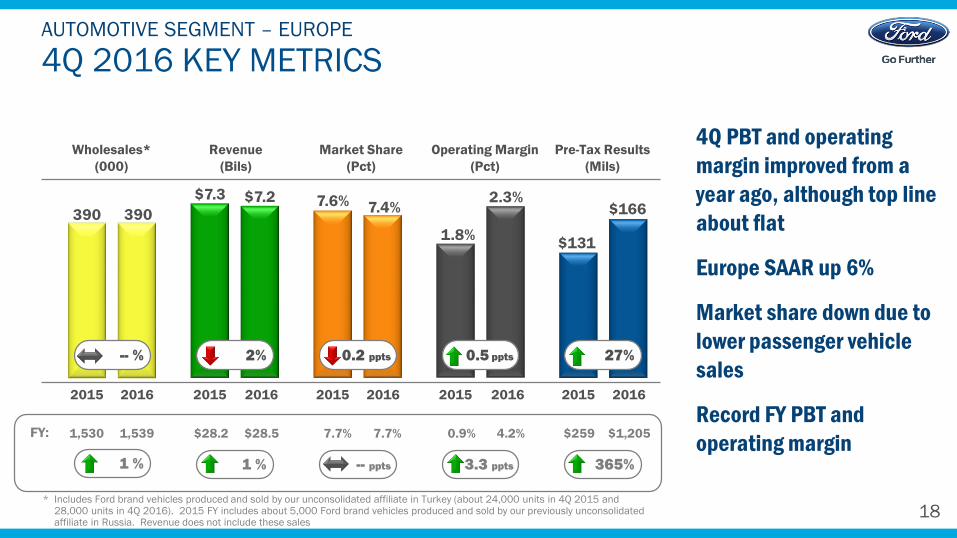
4Q 2016 KEY METRICSAUTOMOTIVE SEGMENT – EUROPE
4Q PBT and operating
margin improved from a
year ago, although top line
about flat
Europe SAAR up 6%
Market share down due to
lower passenger vehicle
sales
Record FY PBT and
operating margin
2.3%
1.8%
$166
$131
7.4%7.6%390390
$7.2$7.3
-- % 2% 0.2 ppts 0.5 ppts 27%
* Includes Ford brand vehicles produced and sold by our unconsolidated affiliate in Turkey (about 24,000 units in 4Q 2015 and 28,000 units in 4Q 2016). 2015 FY includes about 5,000 Ford brand vehicles produced and sold by our previously unconsolidated affiliate in Russia. Revenue does not include these sales
20162015 20162015 20162015 20162015 20162015
Wholesales*
(000)
Revenue
(Bils)
Market Share
(Pct)
Operating Margin
(Pct)
Pre-Tax Results
(Mils)
1,530 1,539 $28.2 $28.5 7.7% 7.7% 0.9% 4.2% $259 $1,205
1 % 1 % -- ppts 3.3 ppts 365%
FY:
19
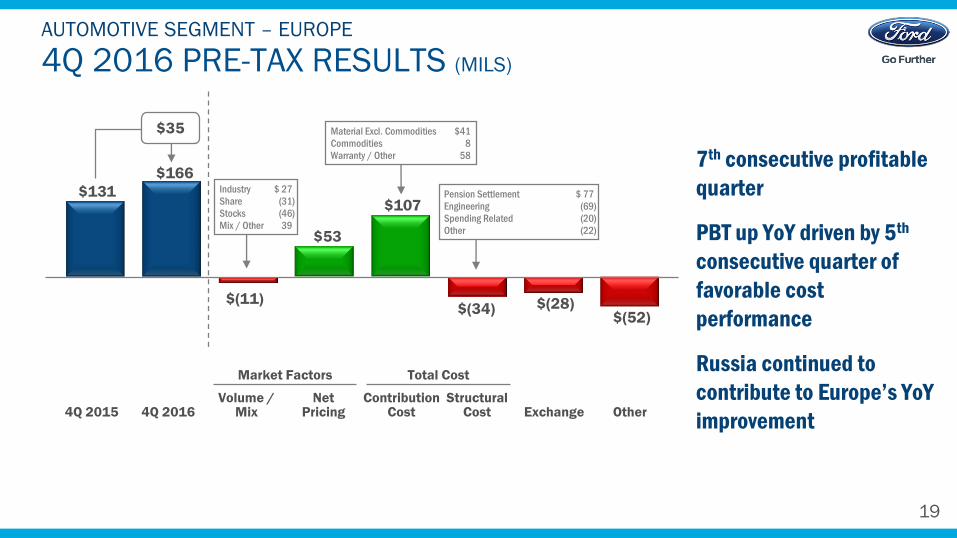
$131
$166
$(11)
$53
$107
$(34) $(28)$(52)
4Q 2016 PRE-TAX RESULTS (MILS)
AUTOMOTIVE SEGMENT – EUROPE
Market Factors Total Cost
Industry $ 27
Share (31)
Stocks (46)
Mix / Other 39
4Q 20164Q 2015Volume /
MixNet
PricingStructural
Cost Exchange OtherContribution
Cost
$35
7th consecutive profitable
quarter
PBT up YoY driven by 5th
consecutive quarter of
favorable cost
performance
Russia continued to
contribute to Europe’s YoY
improvement
Material Excl. Commodities $41
Commodities 8
Warranty / Other 58
Pension Settlement $ 77
Engineering (69)
Spending Related (20)
Other (22)

20
4Q 2016 KEY METRICSAUTOMOTIVE SEGMENT – MIDDLE EAST & AFRICA
A challenging quarter and
full year driven by external
factors and unfavorable
exchange
4Q SAAR down 22% or 1M
units, largest YoY decline
in the year
Market share higher due
to Ranger, Fiesta and
Focus in Africa
1.2%
$(71)
$134.7%4.4%
41
54
$0.9
$1.1
(7.3)%
20162015 20162015 20162015 20162015 20162015
Wholesales
(000)
Revenue
(Bils)
Market Share
(Pct)
Operating Margin
(Pct)
Pre-Tax Results
(Mils)
187 161 $4.0 $3.6 4.4% 4.5% 0.8% (8.3)% $31 $(302)FY:
24% 12% 0.3 ppts 8.5 ppts $84
14% 9% 0.1 ppts 9.1 ppts $333
21
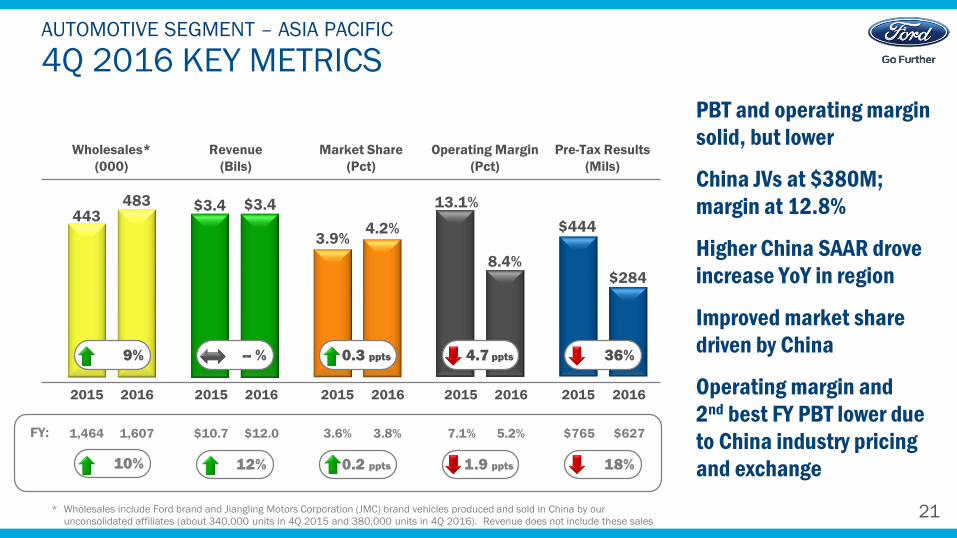
4Q 2016 KEY METRICSAUTOMOTIVE SEGMENT – ASIA PACIFIC
PBT and operating margin
solid, but lower
China JVs at $380M;
margin at 12.8%
Higher China SAAR drove
increase YoY in region
Improved market share
driven by China
Operating margin and
2nd best FY PBT lower due
to China industry pricing
and exchange
8.4%
13.1%
$284
$4444.2%3.9%
483443
$3.4$3.4
* Wholesales include Ford brand and Jiangling Motors Corporation (JMC) brand vehicles produced and sold in China by our
unconsolidated affiliates (about 340,000 units in 4Q 2015 and 380,000 units in 4Q 2016). Revenue does not include these sales
20162015 20162015 20162015 20162015 20162015
Wholesales*
(000)
Revenue
(Bils)
Market Share
(Pct)
Operating Margin
(Pct)
Pre-Tax Results
(Mils)
1,464 1,607 $10.7 $12.0 3.6% 3.8% 7.1% 5.2% $765 $627FY:
9% -- % 0.3 ppts 4.7 ppts 36%
10% 12% 0.2 ppts 1.9 ppts 18%
22
$444
$284
$90
$(101)
$108
$(125)$(95)
$(37)
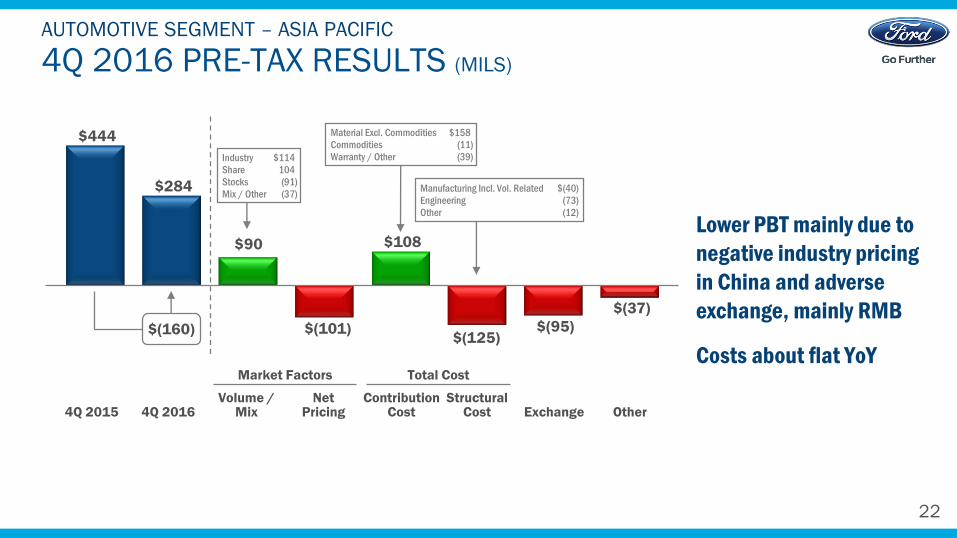
4Q 2016 PRE-TAX RESULTS (MILS)
AUTOMOTIVE SEGMENT – ASIA PACIFIC
Lower PBT mainly due to
negative industry pricing
in China and adverse
exchange, mainly RMB
Costs about flat YoYMarket Factors Total Cost
Industry $114
Share 104
Stocks (91)
Mix / Other (37)
4Q 20164Q 2015Volume /
MixNet
PricingStructural
Cost Exchange OtherContribution
Cost
Manufacturing Incl. Vol. Related $(40)
Engineering (73)
Other (12)
$(160)
Material Excl. Commodities $158
Commodities (11)
Warranty / Other (39)
23
4Q 2016 KEY METRICSFINANCIAL SERVICES SEGMENT – FORD CREDIT
4Q receivables grew as
expected; solid PBT, but
lower YoY
Portfolio performance
robust despite higher LTRs
Origination, servicing and
collection practices
disciplined and consistent
Solid FY PBT but lower YoY
due to lease residual
performance and
credit losses
20162015 20162015
Managed
Receivables*
(Bils)
Pre-Tax
Results
(Mils)
$398
$556$137
$127
8% 28%
20162015 20162015 20162015
Average
Placement
FICO
Over-60-Day
Delinquencies
(Pct)
Loss-to-Receivables
(LTR)
(Pct)
741
0.16%0.13%
3 bps 16 bps
U.S. Retail and Lease
0.59%0.43%
* See Appendix for reconciliation to GAAP
Net
Receivables
(Bils)
20162015
7%
$130$122
$2,086 $1,879 740 739 0.12% 0.15% 0.33% 0.47%FY:
10% 3 bps 14 bps1 pt
741
-- pt
24
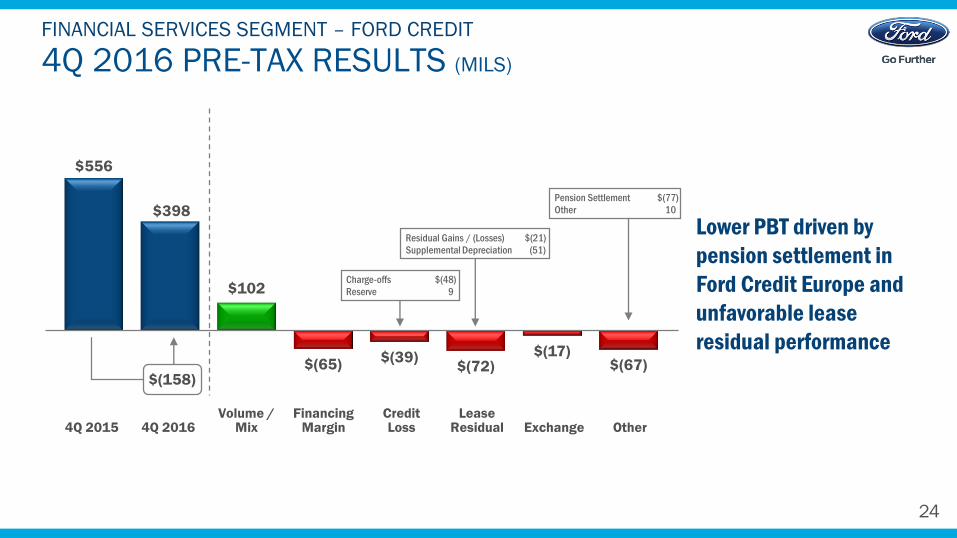
4Q 2016 PRE-TAX RESULTS (MILS)
FINANCIAL SERVICES SEGMENT – FORD CREDIT
Lower PBT driven by
pension settlement in
Ford Credit Europe and
unfavorable lease
residual performance
$556
$398
$102
$(65)$(39)
$(72)$(17)
$(67)
Residual Gains / (Losses) $(21)
Supplemental Depreciation (51)
Pension Settlement $(77)
Other 10
Charge-offs $(48)
Reserve 9
4Q 20164Q 2015Volume /
MixFinancing
MarginLease
Residual Exchange OtherCredit Loss
$(158)
25
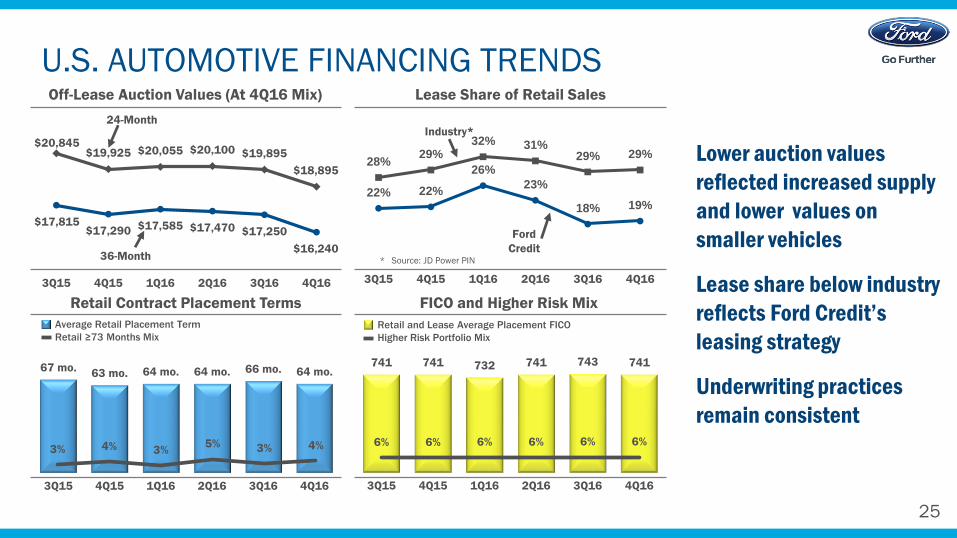
$20,845$19,925 $20,055 $20,100 $19,895
$18,895
$17,815$17,290 $17,585 $17,470 $17,250
$16,240
3Q15 4Q15 1Q16 2Q16 3Q16 4Q16
U.S. AUTOMOTIVE FINANCING TRENDS
Lower auction values
reflected increased supply
and lower values on
smaller vehicles
Lease share below industry
reflects Ford Credit’s
leasing strategy
Underwriting practices
remain consistent
67 mo.63 mo. 64 mo. 64 mo. 66 mo. 64 mo.
3Q15 4Q15 1Q16 2Q16 3Q16 4Q16
Industry*
Lease Share of Retail Sales
* Source: JD Power PIN
FICO and Higher Risk Mix
Retail and Lease Average Placement FICO
Higher Risk Portfolio Mix
22% 22%
26%
23%
18% 19%
28%29%
32% 31%29% 29%
3Q15 4Q15 1Q16 2Q16 3Q16 4Q16
741 741 732 741 743 741
6% 6% 6% 6% 6% 6%
3Q15 4Q15 1Q16 2Q16 3Q16 4Q16
Average Retail Placement Term
Retail ≥73 Months Mix
Retail Contract Placement Terms
3% 4% 3%5% 3% 4%
Off-Lease Auction Values (At 4Q16 Mix)
Ford
Credit36-Month
24-Month
26
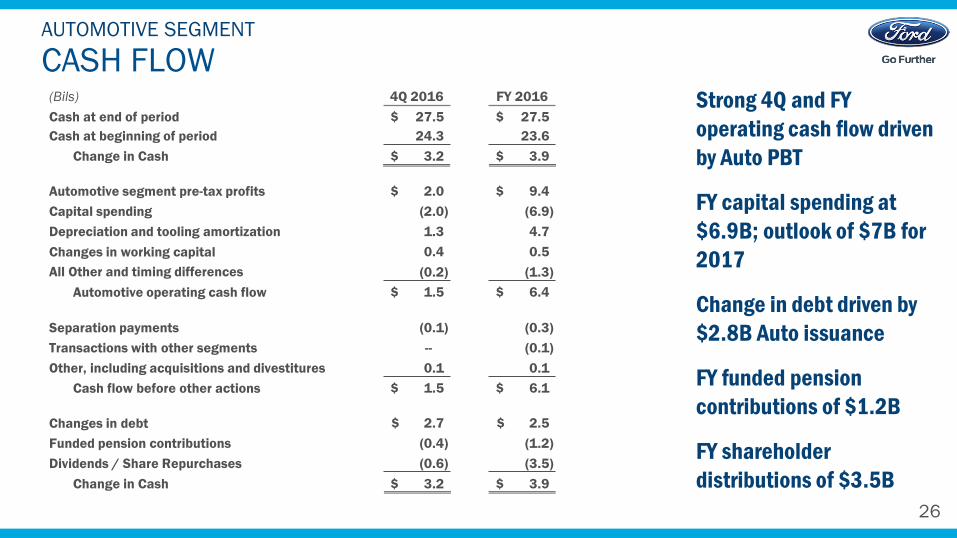
CASH FLOWAUTOMOTIVE SEGMENT
Strong 4Q and FY
operating cash flow driven
by Auto PBT
FY capital spending at
$6.9B; outlook of $7B for
2017
Change in debt driven by
$2.8B Auto issuance
FY funded pension
contributions of $1.2B
FY shareholder
distributions of $3.5B
(Bils) 4Q 2016 FY 2016
Cash at end of period $ 27.5 $ 27.5
Cash at beginning of period 24.3 23.6
Change in Cash $ 3.2 $ 3.9
Automotive segment pre-tax profits $ 2.0 $ 9.4
Capital spending (2.0) (6.9)
Depreciation and tooling amortization 1.3 4.7
Changes in working capital 0.4 0.5
All Other and timing differences (0.2) (1.3)
Automotive operating cash flow $ 1.5 $ 6.4
Separation payments (0.1) (0.3)
Transactions with other segments -- (0.1)
Other, including acquisitions and divestitures 0.1 0.1
Cash flow before other actions $ 1.5 $ 6.1
Changes in debt $ 2.7 $ 2.5
Funded pension contributions (0.4) (1.2)
Dividends / Share Repurchases (0.6) (3.5)
Change in Cash $ 3.2 $ 3.9
27
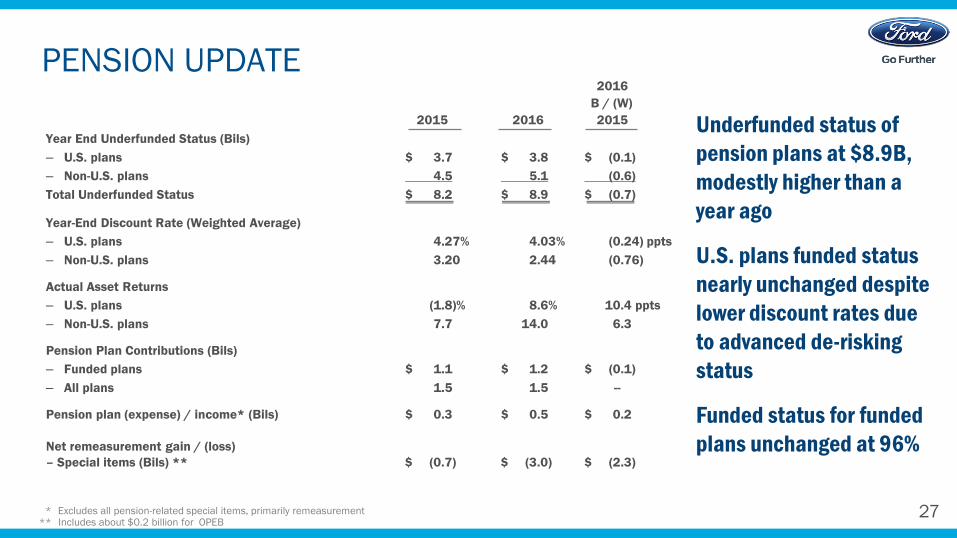
PENSION UPDATE
Underfunded status of
pension plans at $8.9B,
modestly higher than a
year ago
U.S. plans funded status
nearly unchanged despite
lower discount rates due
to advanced de-risking
status
Funded status for funded
plans unchanged at 96%
* Excludes all pension-related special items, primarily remeasurement** Includes about $0.2 billion for OPEB
2016
B / (W)
2015 2016 2015
Year End Underfunded Status (Bils)
– U.S. plans $ 3.7 $ 3.8 $ (0.1)
– Non-U.S. plans 4.5 5.1 (0.6)
Total Underfunded Status $ 8.2 $ 8.9 $ (0.7)
Year-End Discount Rate (Weighted Average)
– U.S. plans 4.27% 4.03% (0.24) ppts
– Non-U.S. plans 3.20 2.44 (0.76)
Actual Asset Returns
– U.S. plans (1.8)% 8.6% 10.4 ppts
– Non-U.S. plans 7.7 14.0 6.3
Pension Plan Contributions (Bils)
– Funded plans $ 1.1 $ 1.2 $ (0.1)
– All plans 1.5 1.5 --
Pension plan (expense) / income* (Bils) $ 0.3 $ 0.5 $ 0.2
Net remeasurement gain / (loss)
– Special items (Bils) ** $ (0.7) $ (3.0) $ (2.3)
28
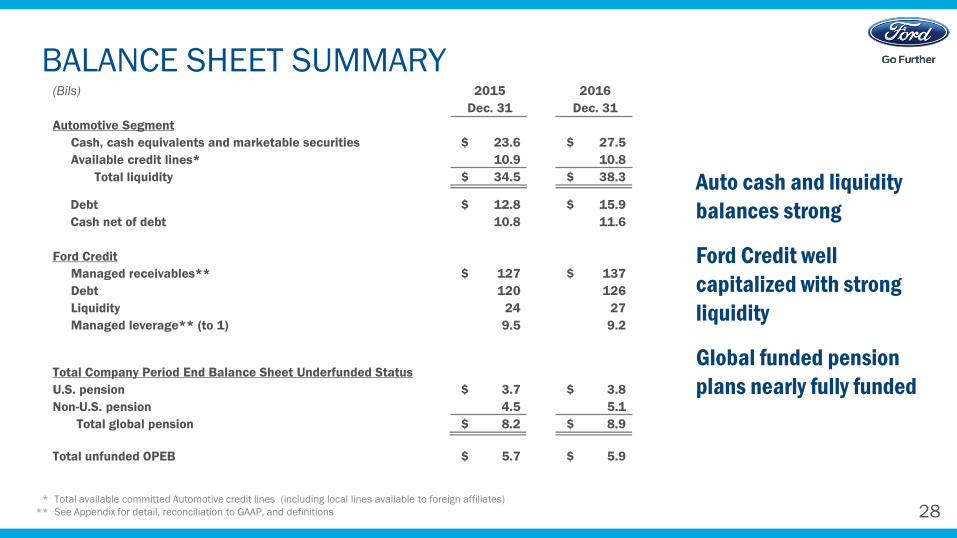
BALANCE SHEET SUMMARY
Auto cash and liquidity
balances strong
Ford Credit well
capitalized with strong
liquidity
Global funded pension
plans nearly fully funded
(Bils) 2015 2016
Dec. 31 Dec. 31
Automotive Segment
Cash, cash equivalents and marketable securities $ 23.6 $ 27.5
Available credit lines* 10.9 10.8
Total liquidity $ 34.5 $ 38.3
Debt $ 12.8 $ 15.9
Cash net of debt 10.8 11.6
Ford Credit
Managed receivables** $ 127 $ 137
Debt 120 126
Liquidity 24 27
Managed leverage** (to 1) 9.5 9.2
Total Company Period End Balance Sheet Underfunded Status
U.S. pension $ 3.7 $ 3.8
Non-U.S. pension 4.5 5.1
Total global pension $ 8.2 $ 8.9
Total unfunded OPEB $ 5.7 $ 5.9
* Total available committed Automotive credit lines (including local lines available to foreign affiliates)
** See Appendix for detail, reconciliation to GAAP, and definitions
29
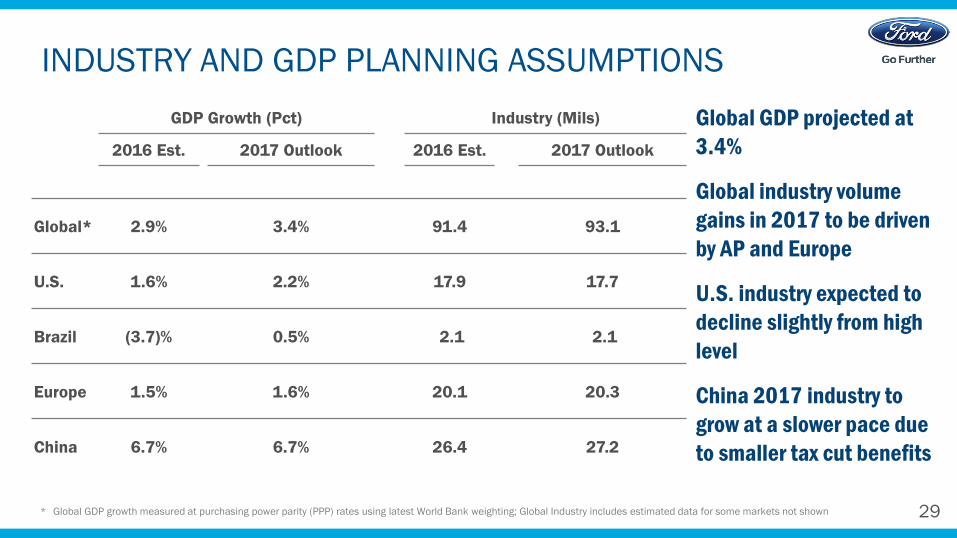
INDUSTRY AND GDP PLANNING ASSUMPTIONS
Global GDP projected at
3.4%
Global industry volume
gains in 2017 to be driven
by AP and Europe
U.S. industry expected to
decline slightly from high
level
China 2017 industry to
grow at a slower pace due
to smaller tax cut benefits
GDP Growth (Pct) Industry (Mils)
2016 Est. 2017 Outlook 2016 Est. 2017 Outlook
Global* 2.9% 3.4% 91.4 93.1
U.S. 1.6% 2.2% 17.9 17.7
Brazil (3.7)% 0.5% 2.1 2.1
Europe 1.5% 1.6% 20.1 20.3
China 6.7% 6.7% 26.4 27.2
* Global GDP growth measured at purchasing power parity (PPP) rates using latest World Bank weighting; Global Industry includes estimated data for some markets not shown
30
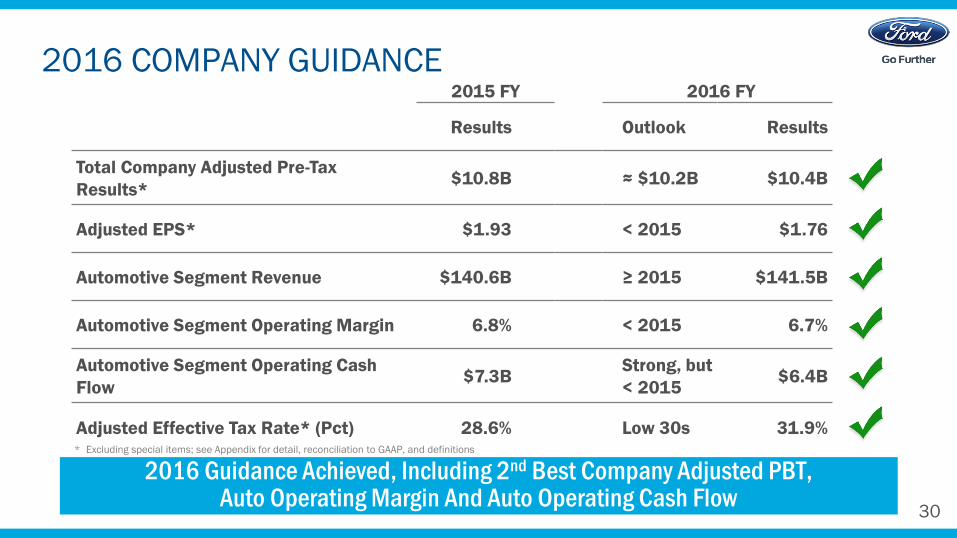
2016 COMPANY GUIDANCE
2016 Guidance Achieved, Including 2nd Best Company Adjusted PBT, Auto Operating Margin And Auto Operating Cash Flow
2015 FY 2016 FY
Results Outlook Results
Total Company Adjusted Pre-Tax
Results* $10.8B ≈ $10.2B $10.4B
Adjusted EPS* $1.93 < 2015 $1.76
Automotive Segment Revenue $140.6B ≥ 2015 $141.5B
Automotive Segment Operating Margin 6.8% < 2015 6.7%
Automotive Segment Operating Cash
Flow$7.3B
Strong, but
< 2015$6.4B
Adjusted Effective Tax Rate* (Pct) 28.6% Low 30s 31.9%* Excluding special items; see Appendix for detail, reconciliation to GAAP, and definitions
31
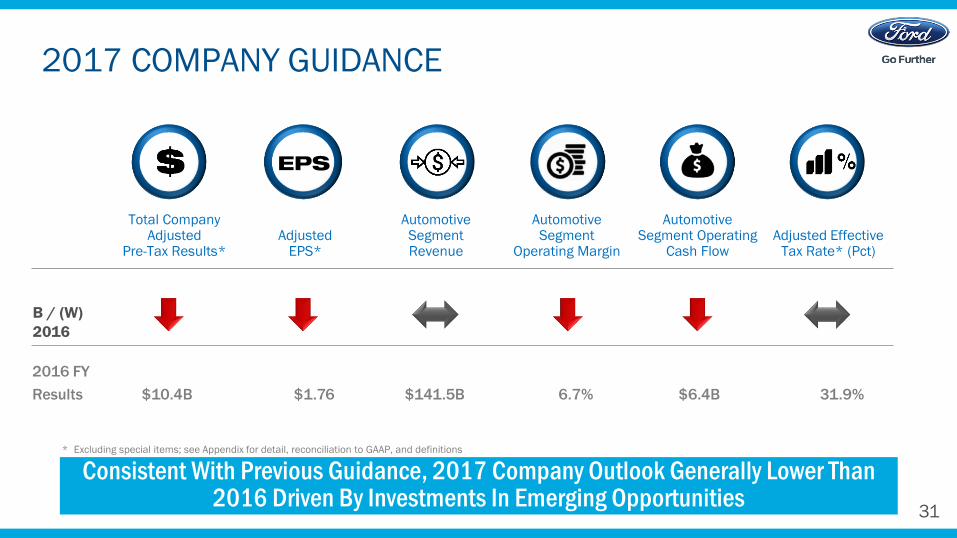
2017 COMPANY GUIDANCE
Consistent With Previous Guidance, 2017 Company Outlook Generally Lower Than 2016 Driven By Investments In Emerging Opportunities
* Excluding special items; see Appendix for detail, reconciliation to GAAP, and definitions
Total CompanyAdjusted
Pre-Tax Results*Adjusted
EPS*
AutomotiveSegment Revenue
AutomotiveSegment
Operating Margin
AutomotiveSegment Operating
Cash FlowAdjusted Effective
Tax Rate* (Pct)
B / (W)
2016
EPS
2016 FY
Results $10.4B $1.76 $141.5B 6.7% $6.4B 31.9%
32
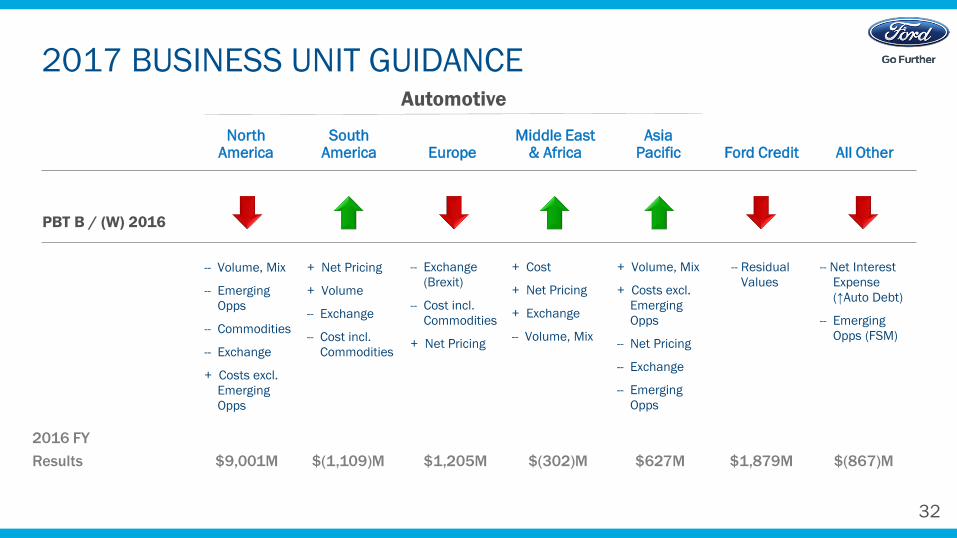
2017 BUSINESS UNIT GUIDANCEAutomotive
NorthAmerica
SouthAmerica Europe
Middle East& Africa
AsiaPacific Ford Credit All Other
PBT B / (W) 2016
-- Volume, Mix
-- Emerging
Opps
-- Commodities
-- Exchange
+ Costs excl.
Emerging
Opps
+ Net Pricing
+ Volume
-- Exchange
-- Cost incl.
Commodities
-- Exchange
(Brexit)
-- Cost incl.
Commodities
+ Net Pricing
+ Cost
+ Net Pricing
+ Exchange
-- Volume, Mix
+ Volume, Mix
+ Costs excl.
Emerging
Opps
-- Net Pricing
-- Exchange
-- Emerging
Opps
-- Residual
Values
-- Net Interest
Expense
(↑Auto Debt)
-- Emerging
Opps (FSM)
2016 FY
Results $9,001M $(1,109)M $1,205M $(302)M $627M $1,879M $(867)M
33
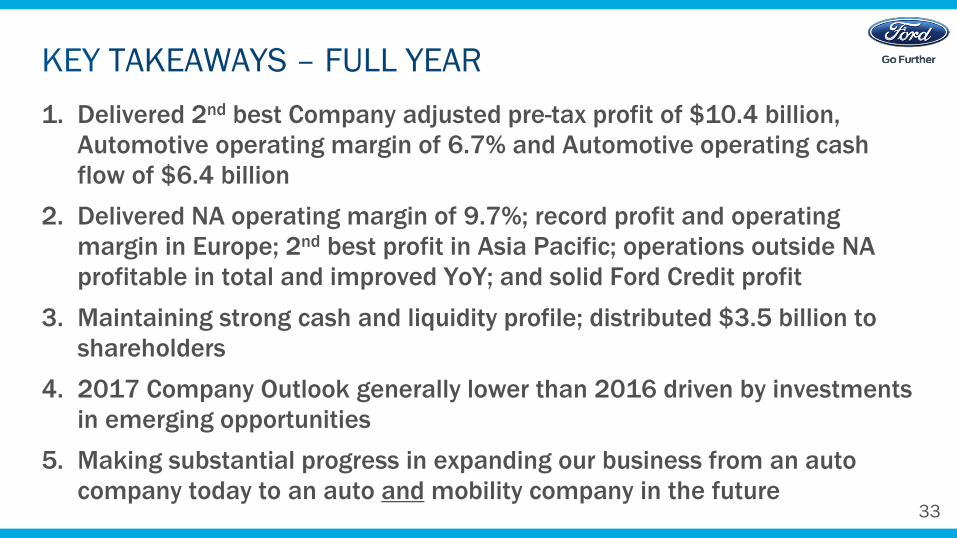
1. Delivered 2nd best Company adjusted pre-tax profit of $10.4 billion,
Automotive operating margin of 6.7% and Automotive operating cash
flow of $6.4 billion
2. Delivered NA operating margin of 9.7%; record profit and operating
margin in Europe; 2nd best profit in Asia Pacific; operations outside NA
profitable in total and improved YoY; and solid Ford Credit profit
3. Maintaining strong cash and liquidity profile; distributed $3.5 billion to
shareholders
4. 2017 Company Outlook generally lower than 2016 driven by investments
in emerging opportunities
5. Making substantial progress in expanding our business from an auto
company today to an auto and mobility company in the future
KEY TAKEAWAYS – FULL YEAR
34
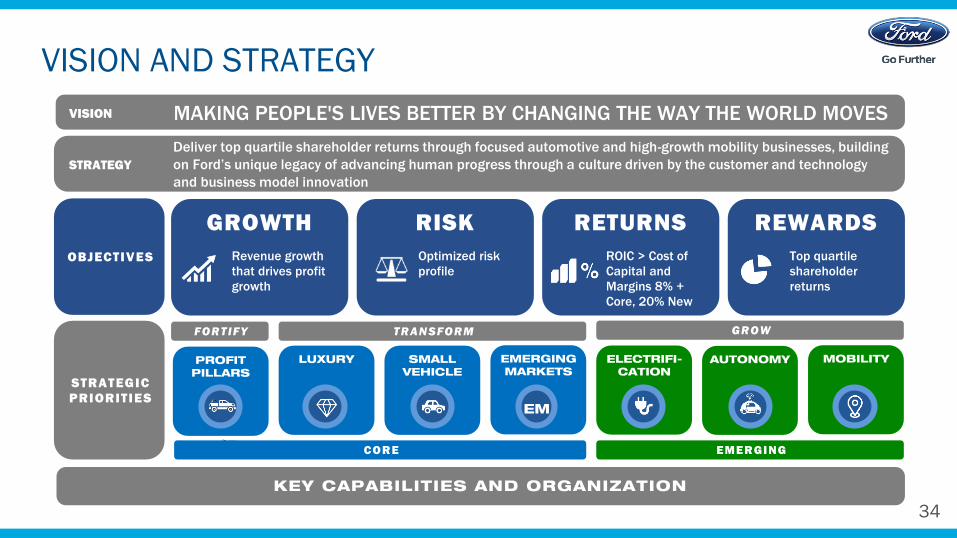
VISION AND STRATEGY
MAKING PEOPLE'S LIVES BETTER BY CHANGING THE WAY THE WORLD MOVES
GROWTH RISK RETURNS REWARDS
KEY CAPABILITIES AND ORGANIZATION
Deliver top quartile shareholder returns through focused automotive and high-growth mobility businesses, building
on Ford’s unique legacy of advancing human progress through a culture driven by the customer and technology
and business model innovation
STRATEGY
VISION
OBJECTIVES
STRATEGIC
PRIORITIES
Revenue growth
that drives profit
growth
Optimized risk
profile
ROIC > Cost of
Capital and
Margins 8% +
Core, 20% New
Top quartile
shareholder
returns
PROFIT
PILLARS
LUXURY SMALL
VEHICLE
EMERGING
MARKETS
MOBILITYELECTRIFI-
CATIONAUTONOMY
EM
CORE EMERGING
FORTIFY TRANSFORM GROW

35
Q&AJanuary 26, 2017
36
RISK FACTORSStatements included or incorporated by reference herein may constitute "forward-looking statements" within the meaning of the Private Securities Litigation Reform Act of 1995. Forward-looking statements are based on
expectations, forecasts, and assumptions by our management and involve a number of risks, uncertainties, and other factors that could cause actual results to differ materially from those stated, including, without limitation:
Decline in industry sales volume, particularly in the United States, Europe, or China due to financial crisis, recession, geopolitical events, or other factors;
Decline in Ford's market share or failure to achieve growth;
Lower-than-anticipated market acceptance of Ford's new or existing products or services;
Market shift away from sales of larger, more profitable vehicles beyond Ford's current planning assumption, particularly in the United States;
An increase in or continued volatility of fuel prices, or reduced availability of fuel;
Continued or increased price competition resulting from industry excess capacity, currency fluctuations, or other factors;
Fluctuations in foreign currency exchange rates, commodity prices, and interest rates;
Adverse effects resulting from economic, geopolitical, or other events;
Economic distress of suppliers that may require Ford to provide substantial financial support or take other measures to ensure supplies of components or materials and could increase costs, affect liquidity, or cause production
constraints or disruptions;
Work stoppages at Ford or supplier facilities or other limitations on production (whether as a result of labor disputes, natural or man-made disasters, tight credit markets or other financial distress, production constraints or
difficulties, or other factors);
Single-source supply of components or materials;
Labor or other constraints on Ford's ability to maintain competitive cost structure;
Substantial pension and postretirement health care and life insurance liabilities impairing our liquidity or financial condition;
Worse-than-assumed economic and demographic experience for postretirement benefit plans (e.g., discount rates or investment returns);
Restriction on use of tax attributes from tax law "ownership change”;
The discovery of defects in vehicles resulting in delays in new model launches, recall campaigns, or increased warranty costs;
Increased safety, emissions, fuel economy, or other regulations resulting in higher costs, cash expenditures, and / or sales restrictions;
Unusual or significant litigation, governmental investigations, or adverse publicity arising out of alleged defects in products, perceived environmental impacts, or otherwise;
A change in requirements under long-term supply arrangements committing Ford to purchase minimum or fixed quantities of certain parts, or to pay a minimum amount to the seller ("take-or-pay" contracts);
Adverse effects on results from a decrease in or cessation or clawback of government incentives related to investments;
Inherent limitations of internal controls impacting financial statements and safeguarding of assets;
Cybersecurity risks to operational systems, security systems, or infrastructure owned by Ford, Ford Credit, or a third-party vendor or supplier;
Failure of financial institutions to fulfill commitments under committed credit and liquidity facilities;
Inability of Ford Credit to access debt, securitization, or derivative markets around the world at competitive rates or in sufficient amounts, due to credit rating downgrades, market volatility, market disruption, regulatory
requirements, or other factors;
Higher-than-expected credit losses, lower-than-anticipated residual values, or higher-than-expected return volumes for leased vehicles;
Increased competition from banks, financial institutions, or other third parties seeking to increase their share of financing Ford vehicles; and
New or increased credit regulations, consumer or data protection regulations, or other regulations resulting in higher costs and / or additional financing restrictions.
We cannot be certain that any expectation, forecast, or assumption made in preparing forward-looking statements will prove accurate, or that any projection will be realized. It is to be expected that there may be differences
between projected and actual results. Our forward-looking statements speak only as of the date of their initial issuance, and we do not undertake any obligation to update or revise publicly any forward-looking statement, whether
as a result of new information, future events, or otherwise. For additional discussion, see "Item 1A. Risk Factors" in our Annual Report on Form 10-K for the year ended December 31, 2015, as updated by subsequent Quarterly
Reports on Form 10-Q and Current Reports on Form 8-K.

APPENDIX
38
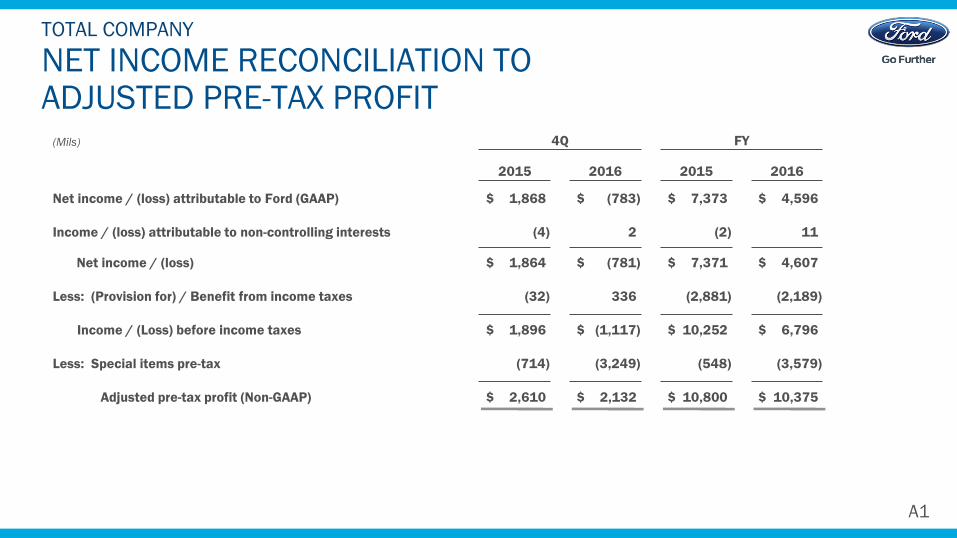
NET INCOME RECONCILIATION TO ADJUSTED PRE-TAX PROFIT
TOTAL COMPANY
A1
(Mils) 4Q FY
2015 2016 2015 2016
Net income / (loss) attributable to Ford (GAAP) $ 1,868 $ (783) $ 7,373 $ 4,596
Income / (loss) attributable to non-controlling interests (4) 2 (2) 11
Net income / (loss) $ 1,864 $ (781) $ 7,371 $ 4,607
Less: (Provision for) / Benefit from income taxes (32) 336 (2,881) (2,189)
Income / (Loss) before income taxes $ 1,896 $ (1,117) $ 10,252 $ 6,796
Less: Special items pre-tax (714) (3,249) (548) (3,579)
Adjusted pre-tax profit (Non-GAAP) $ 2,610 $ 2,132 $ 10,800 $ 10,375
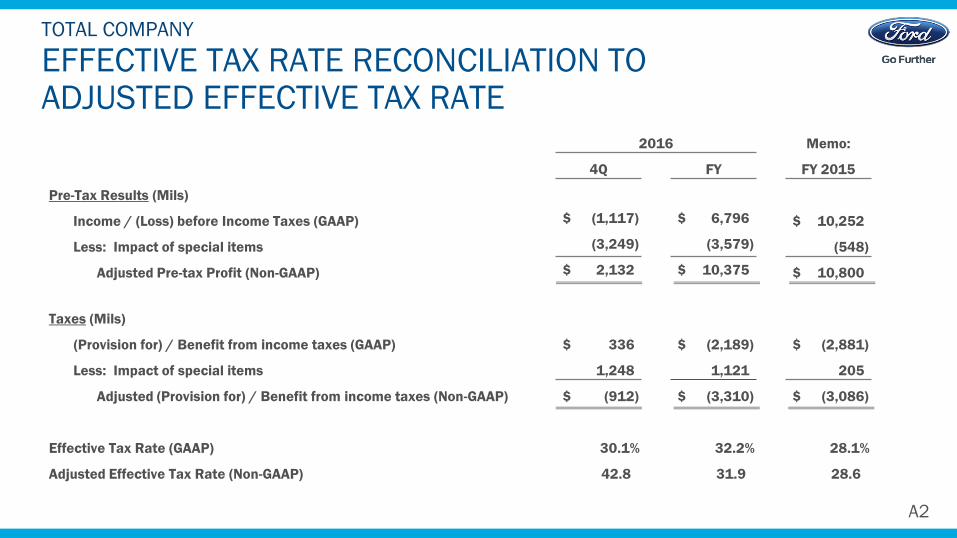
39
2016 Memo:
4Q FY FY 2015
Pre-Tax Results (Mils)
Income / (Loss) before Income Taxes (GAAP) $ (1,117) $ 6,796 $ 10,252
Less: Impact of special items (3,249) (3,579) (548)
Adjusted Pre-tax Profit (Non-GAAP) $ 2,132 $ 10,375 $ 10,800
Taxes (Mils)
(Provision for) / Benefit from income taxes (GAAP) $ 336 $ (2,189) $ (2,881)
Less: Impact of special items 1,248 1,121 205
Adjusted (Provision for) / Benefit from income taxes (Non-GAAP) $ (912) $ (3,310) $ (3,086)
Effective Tax Rate (GAAP) 30.1% 32.2% 28.1%
Adjusted Effective Tax Rate (Non-GAAP) 42.8 31.9 28.6
EFFECTIVE TAX RATE RECONCILIATION TO ADJUSTED EFFECTIVE TAX RATE
TOTAL COMPANY
A2
40
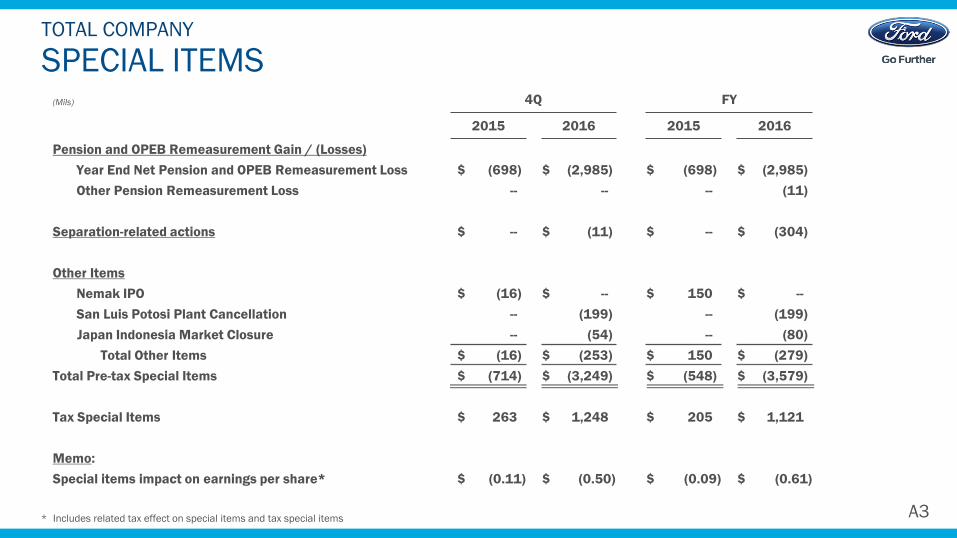
SPECIAL ITEMSTOTAL COMPANY
(Mils) 4Q FY
2015 2016 2015 2016
Pension and OPEB Remeasurement Gain / (Losses)
Year End Net Pension and OPEB Remeasurement Loss $ (698) $ (2,985) $ (698) $ (2,985)
Other Pension Remeasurement Loss -- -- -- (11)
Separation-related actions $ -- $ (11) $ -- $ (304)
Other Items
Nemak IPO $ (16) $ -- $ 150 $ --
San Luis Potosi Plant Cancellation -- (199) -- (199)
Japan Indonesia Market Closure -- (54) -- (80)
Total Other Items $ (16) $ (253) $ 150 $ (279)
Total Pre-tax Special Items $ (714) $ (3,249) $ (548) $ (3,579)
Tax Special Items $ 263 $ 1,248 $ 205 $ 1,121
Memo:
Special items impact on earnings per share* $ (0.11) $ (0.50) $ (0.09) $ (0.61)
A3* Includes related tax effect on special items and tax special items
41
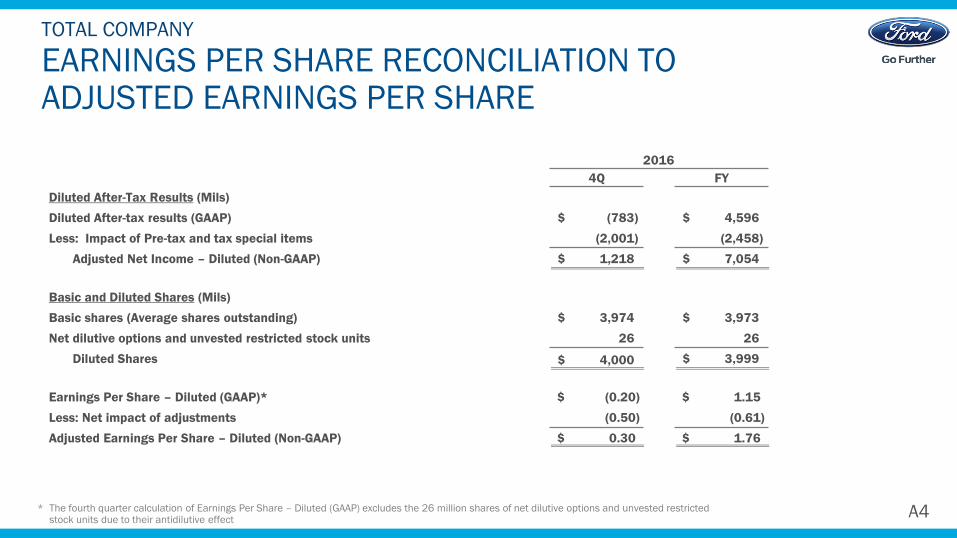
EARNINGS PER SHARE RECONCILIATION TO ADJUSTED EARNINGS PER SHARE
TOTAL COMPANY
A4
2016
4Q FY
Diluted After-Tax Results (Mils)
Diluted After-tax results (GAAP) $ (783) $ 4,596
Less: Impact of Pre-tax and tax special items (2,001) (2,458)
Adjusted Net Income – Diluted (Non-GAAP) $ 1,218 $ 7,054
Basic and Diluted Shares (Mils)
Basic shares (Average shares outstanding) $ 3,974 $ 3,973
Net dilutive options and unvested restricted stock units 26 26
Diluted Shares $ 4,000 $ 3,999
Earnings Per Share – Diluted (GAAP)* $ (0.20) $ 1.15
Less: Net impact of adjustments (0.50) (0.61)
Adjusted Earnings Per Share – Diluted (Non-GAAP) $ 0.30 $ 1.76
* The fourth quarter calculation of Earnings Per Share – Diluted (GAAP) excludes the 26 million shares of net dilutive options and unvested restricted stock units due to their antidilutive effect
42
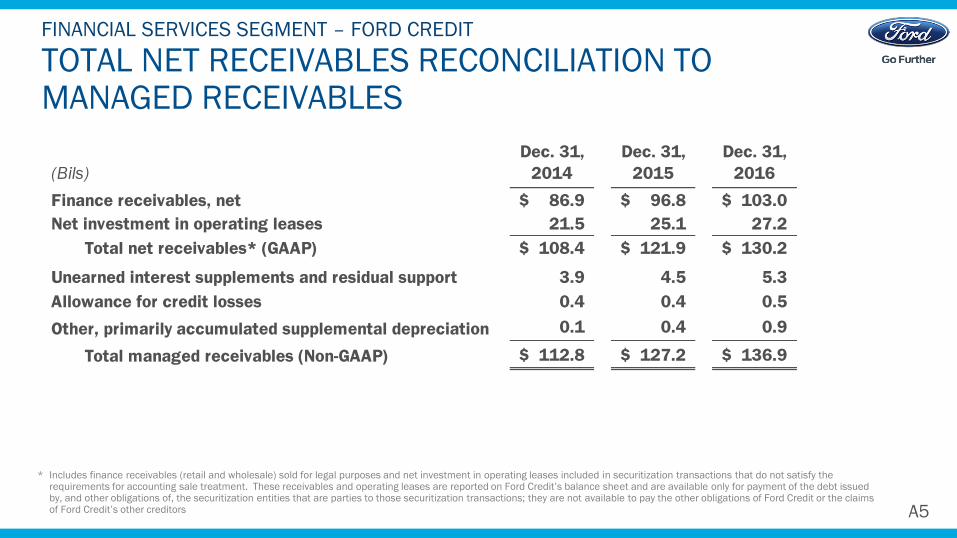
TOTAL NET RECEIVABLES RECONCILIATION TO MANAGED RECEIVABLES
FINANCIAL SERVICES SEGMENT – FORD CREDIT
A5
* Includes finance receivables (retail and wholesale) sold for legal purposes and net investment in operating leases included in securitization transactions that do not satisfy the requirements for accounting sale treatment. These receivables and operating leases are reported on Ford Credit’s balance sheet and are available only for payment of the debt issued by, and other obligations of, the securitization entities that are parties to those securitization transactions; they are not available to pay the other obligations of Ford Credit or the claims of Ford Credit’s other creditors
Dec. 31, Dec. 31, Dec. 31,
(Bils) 2014 2015 2016
Finance receivables, net 86.9$ 96.8$ 103.0$
Net investment in operating leases 21.5 25.1 27.2
Total net receivables* (GAAP) 108.4$ 121.9$ 130.2$
Unearned interest supplements and residual support 3.9 4.5 5.3
Allowance for credit losses 0.4 0.4 0.5
Other, primarily accumulated supplemental depreciation 0.1 0.4 0.9
Total managed receivables (Non-GAAP) 112.8$ 127.2$ 136.9$
43
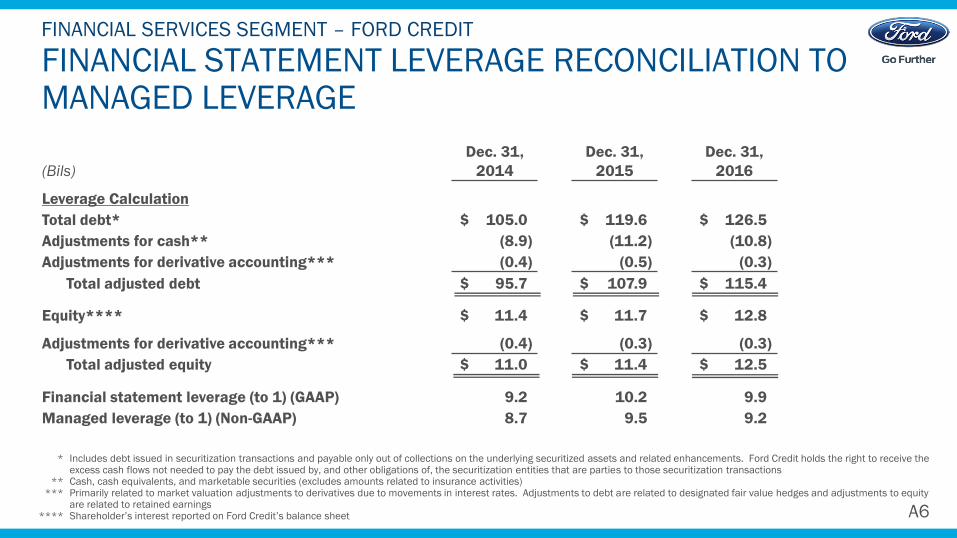
FINANCIAL STATEMENT LEVERAGE RECONCILIATION TO MANAGED LEVERAGE
FINANCIAL SERVICES SEGMENT – FORD CREDIT
A8A6
(Bils)
Dec. 31,
2014
Dec. 31,
2015
Dec. 31,
2016
Leverage Calculation
Total debt* $ 105.0 $ 119.6 $ 126.5
Adjustments for cash** (8.9) (11.2) (10.8)
Adjustments for derivative accounting*** (0.4) (0.5) (0.3)
Total adjusted debt $ 95.7 $ 107.9 $ 115.4
Equity**** $ 11.4 $ 11.7 $ 12.8
Adjustments for derivative accounting*** (0.4) (0.3) (0.3)
Total adjusted equity $ 11.0 $ 11.4 $ 12.5
Financial statement leverage (to 1) (GAAP) 9.2 10.2 9.9
Managed leverage (to 1) (Non-GAAP) 8.7 9.5 9.2
* Includes debt issued in securitization transactions and payable only out of collections on the underlying securitized assets and related enhancements. Ford Credit holds the right to receive the excess cash flows not needed to pay the debt issued by, and other obligations of, the securitization entities that are parties to those securitization transactions
** Cash, cash equivalents, and marketable securities (excludes amounts related to insurance activities)*** Primarily related to market valuation adjustments to derivatives due to movements in interest rates. Adjustments to debt are related to designated fair value hedges and adjustments to equity
are related to retained earnings**** Shareholder’s interest reported on Ford Credit’s balance sheet
44
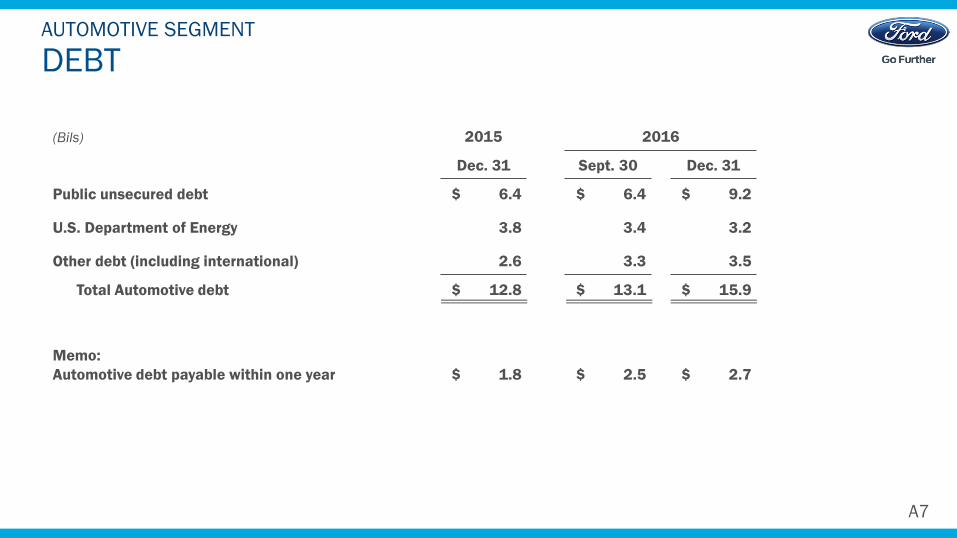
DEBTAUTOMOTIVE SEGMENT
(Bils) 2015 2016
Dec. 31 Sept. 30 Dec. 31
Public unsecured debt $ 6.4 $ 6.4 $ 9.2
U.S. Department of Energy 3.8 3.4 3.2
Other debt (including international) 2.6 3.3 3.5
Total Automotive debt $ 12.8 $ 13.1 $ 15.9
Memo:
Automotive debt payable within one year $ 1.8 $ 2.5 $ 2.7
A7
45
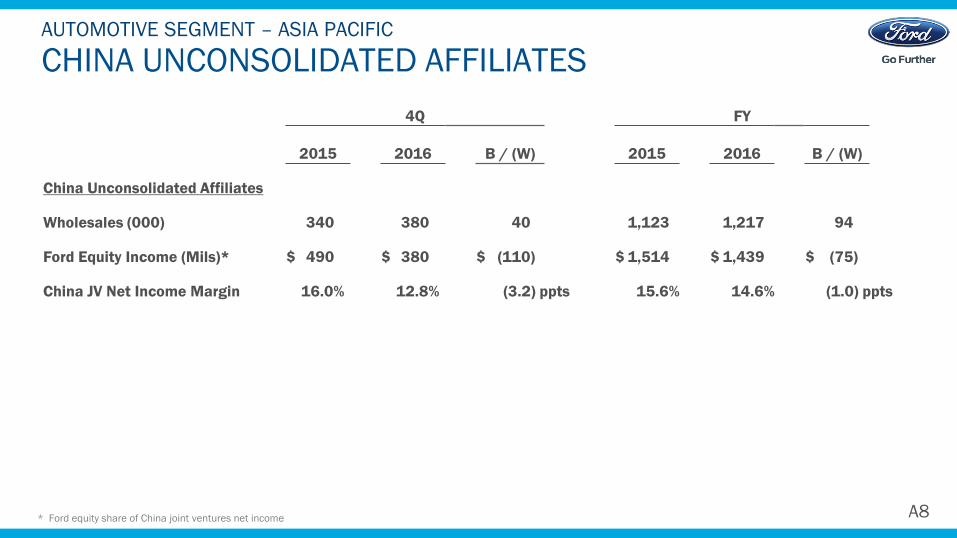
CHINA UNCONSOLIDATED AFFILIATESAUTOMOTIVE SEGMENT – ASIA PACIFIC
* Ford equity share of China joint ventures net income
4Q FY
2015 2016 B / (W) 2015 2016 B / (W)
China Unconsolidated Affiliates
Wholesales (000) 340 380 40 1,123 1,217 94
Ford Equity Income (Mils)* $ 490 $ 380 $ (110) $ 1,514 $ 1,439 $ (75)
China JV Net Income Margin 16.0% 12.8% (3.2) ppts 15.6% 14.6% (1.0) ppts
A8
46
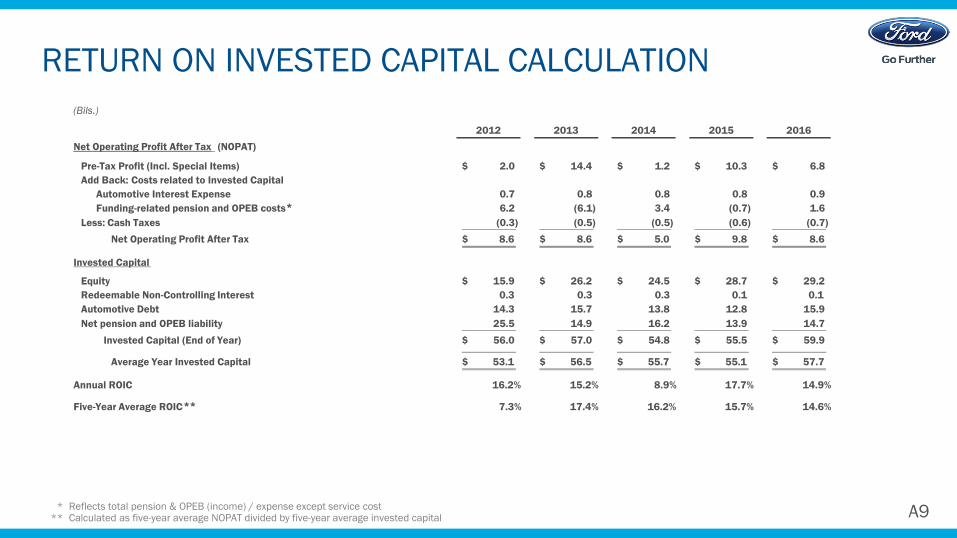
RETURN ON INVESTED CAPITAL CALCULATION
* Reflects total pension & OPEB (income) / expense except service cost ** Calculated as five-year average NOPAT divided by five-year average invested capital A9
2012 2013 2014 2015 2016
Net Operating Profit After Tax (NOPAT)
(Bils.)
Pre-Tax Profit (Incl. Special Items) 2.0$ 14.4$ 1.2$ 10.3$ 6.8$
Add Back: Costs related to Invested Capital
Automotive Interest Expense 0.7 0.8 0.8 0.8 0.9
Funding-related pension and OPEB costs 6.2 (6.1) 3.4 (0.7) 1.6
Less: Cash Taxes (0.3) (0.5) (0.5) (0.6) (0.7)
Net Operating Profit After Tax 8.6$ 8.6$ 5.0$ 9.8$ 8.6$
Invested Capital
Equity 15.9$ 26.2$ 24.5$ 28.7$ 29.2$
Redeemable Non-Controlling Interest 0.3 0.3 0.3 0.1 0.1
Automotive Debt 14.3 15.7 13.8 12.8 15.9
Net pension and OPEB liability 25.5 14.9 16.2 13.9 14.7
Invested Capital (End of Year) 56.0$ 57.0$ 54.8$ 55.5$ 59.9$
Average Year Invested Capital 53.1$ 56.5$ 55.7$ 55.1$ 57.7$
Annual ROIC 16.2% 15.2% 8.9% 17.7% 14.9%
Five-Year Average ROIC 7.3% 17.4% 16.2% 15.7% 14.6%
*
**
47
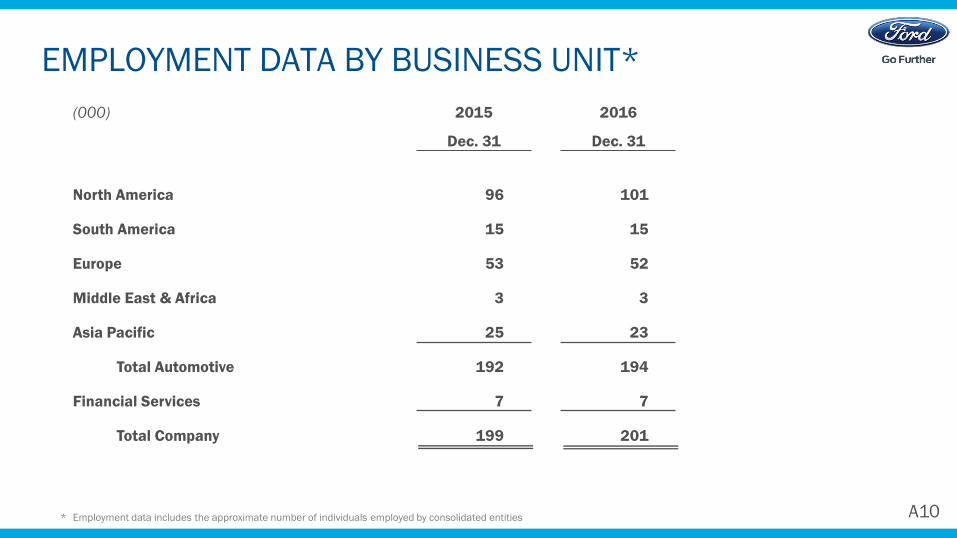
EMPLOYMENT DATA BY BUSINESS UNIT*
* Employment data includes the approximate number of individuals employed by consolidated entities
(000) 2015 2016
Dec. 31 Dec. 31
North America 96 101
South America 15 15
Europe 53 52
Middle East & Africa 3 3
Asia Pacific 25 23
Total Automotive 192 194
Financial Services 7 7
Total Company 199 201
A10
48
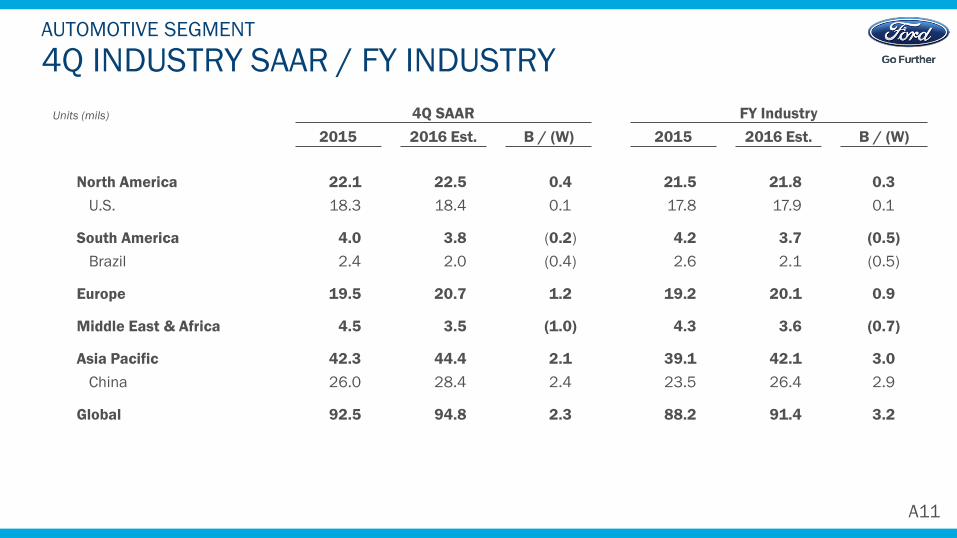
4Q INDUSTRY SAAR / FY INDUSTRYAUTOMOTIVE SEGMENT
A11
Units (mils) 4Q SAAR FY Industry
2015 2016 Est. B / (W) 2015 2016 Est. B / (W)
North America 22.1 22.5 0.4 21.5 21.8 0.3
U.S. 18.3 18.4 0.1 17.8 17.9 0.1
South America 4.0 3.8 (0.2) 4.2 3.7 (0.5)
Brazil 2.4 2.0 (0.4) 2.6 2.1 (0.5)
Europe 19.5 20.7 1.2 19.2 20.1 0.9
Middle East & Africa 4.5 3.5 (1.0) 4.3 3.6 (0.7)
Asia Pacific 42.3 44.4 2.1 39.1 42.1 3.0
China 26.0 28.4 2.4 23.5 26.4 2.9
Global 92.5 94.8 2.3 88.2 91.4 3.2
49
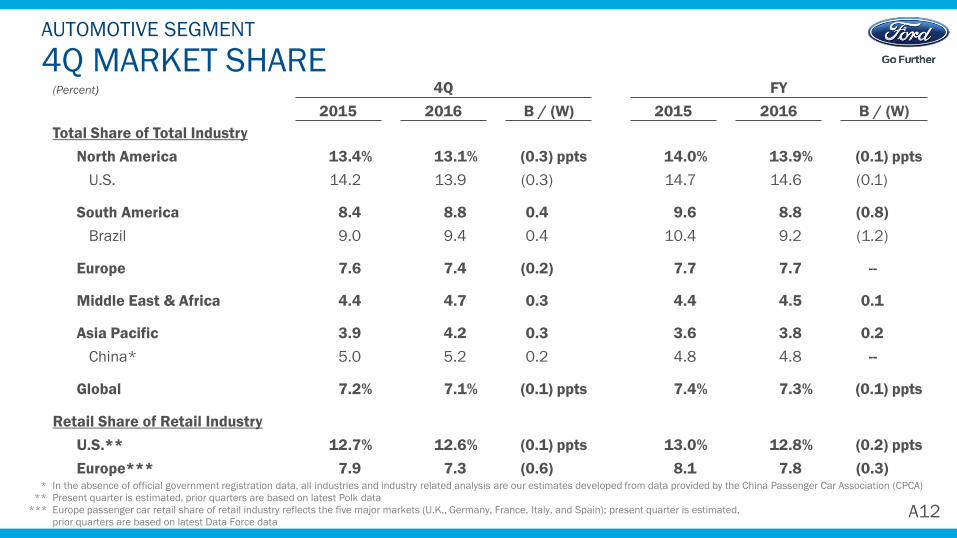
4Q MARKET SHAREAUTOMOTIVE SEGMENT
* In the absence of official government registration data, all industries and industry related analysis are our estimates developed from data provided by the China Passenger Car Association (CPCA)
** Present quarter is estimated, prior quarters are based on latest Polk data
*** Europe passenger car retail share of retail industry reflects the five major markets (U.K., Germany, France, Italy, and Spain); present quarter is estimated,
prior quarters are based on latest Data Force data
(Percent) 4Q FY
2015 2016 B / (W) 2015 2016 B / (W)
Total Share of Total Industry
North America 13.4% 13.1% (0.3) ppts 14.0% 13.9% (0.1) ppts
U.S. 14.2 13.9 (0.3) 14.7 14.6 (0.1)
South America 8.4 8.8 0.4 9.6 8.8 (0.8)
Brazil 9.0 9.4 0.4 10.4 9.2 (1.2)
Europe 7.6 7.4 (0.2) 7.7 7.7 --
Middle East & Africa 4.4 4.7 0.3 4.4 4.5 0.1
Asia Pacific 3.9 4.2 0.3 3.6 3.8 0.2
China* 5.0 5.2 0.2 4.8 4.8 --
Global 7.2% 7.1% (0.1) ppts 7.4% 7.3% (0.1) ppts
Retail Share of Retail Industry
U.S.** 12.7% 12.6% (0.1) ppts 13.0% 12.8% (0.2) ppts
Europe*** 7.9 7.3 (0.6) 8.1 7.8 (0.3)
A12
50
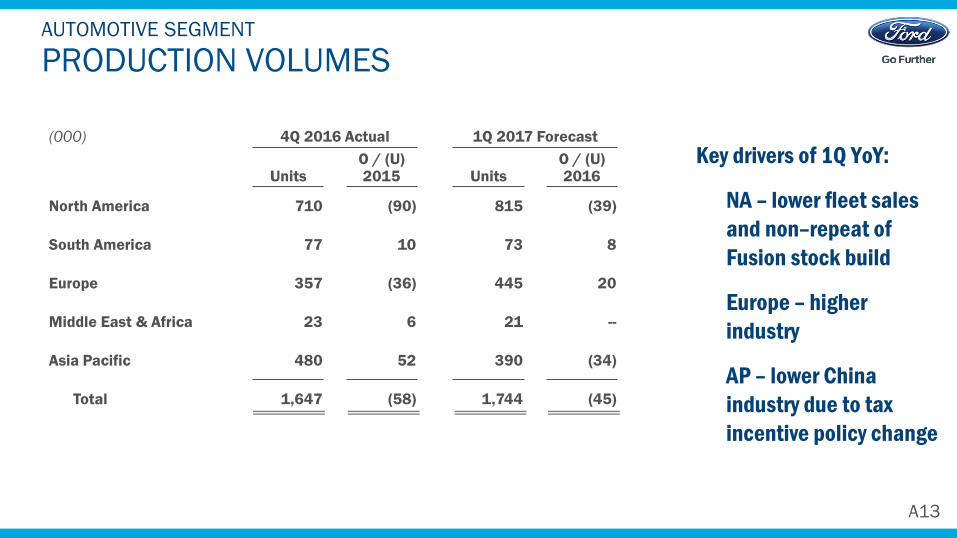
PRODUCTION VOLUMESAUTOMOTIVE SEGMENT
(000) 4Q 2016 Actual 1Q 2017 Forecast
UnitsO / (U)2015 Units
O / (U)2016
North America 710 (90) 815 (39)
South America 77 10 73 8
Europe 357 (36) 445 20
Middle East & Africa 23 6 21 --
Asia Pacific 480 52 390 (34)
Total 1,647 (58) 1,744 (45)
A13
Key drivers of 1Q YoY:
NA – lower fleet sales
and non–repeat of
Fusion stock build
Europe – higher
industry
AP – lower China
industry due to tax
incentive policy change
51
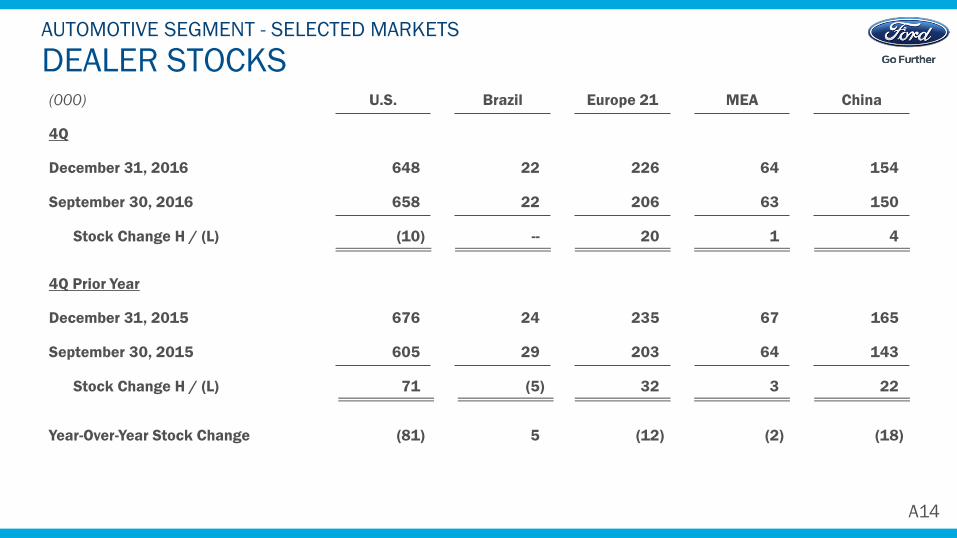
DEALER STOCKSAUTOMOTIVE SEGMENT - SELECTED MARKETS
(000) U.S. Brazil Europe 21 MEA China
4Q
648 22 226 64 154December 31, 2016
September 30, 2016 658 22 206 63 150
Stock Change H / (L) (10) -- 20 1 4
4Q Prior Year
December 31, 2015 676 24 235 67 165
September 30, 2015 605 29 203 64 143
Stock Change H / (L) 71 (5) 32 3 22
Year-Over-Year Stock Change (81) 5 (12) (2) (18)
A14
52
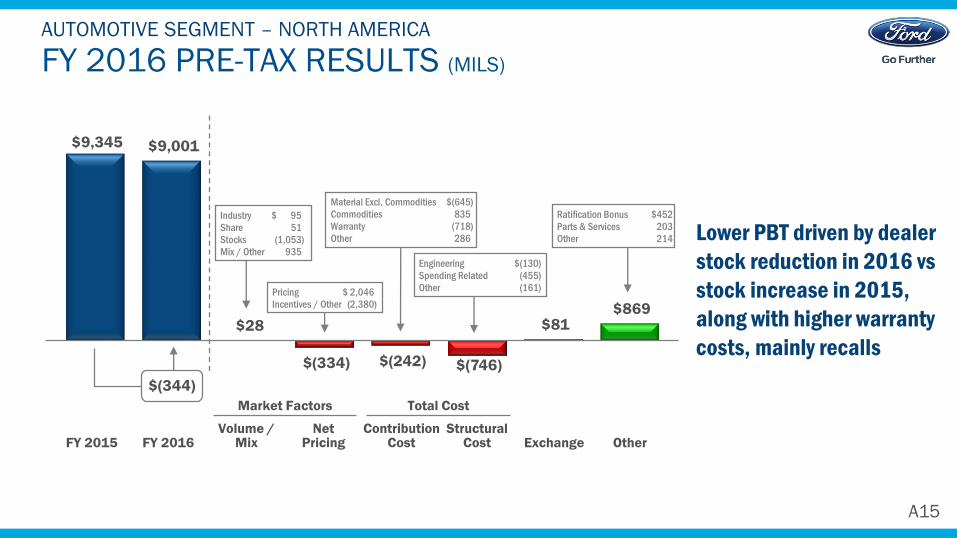
FY 2016 PRE-TAX RESULTS (MILS)
AUTOMOTIVE SEGMENT – NORTH AMERICA
Lower PBT driven by dealer
stock reduction in 2016 vs
stock increase in 2015,
along with higher warranty
costs, mainly recalls
$9,345 $9,001
$28
$(334) $(242) $(746)
$81 $869
Market Factors Total Cost
Industry $ 95
Share 51
Stocks (1,053)
Mix / Other 935
FY 2016FY 2015Volume /
MixNet
PricingStructural
Cost Exchange OtherContribution
Cost
$(344)
A15
Engineering $(130)
Spending Related (455)
Other (161)
Material Excl. Commodities $(645)
Commodities 835
Warranty (718)
Other 286
Pricing $ 2,046
Incentives / Other (2,380)
Ratification Bonus $452
Parts & Services 203
Other 214
53
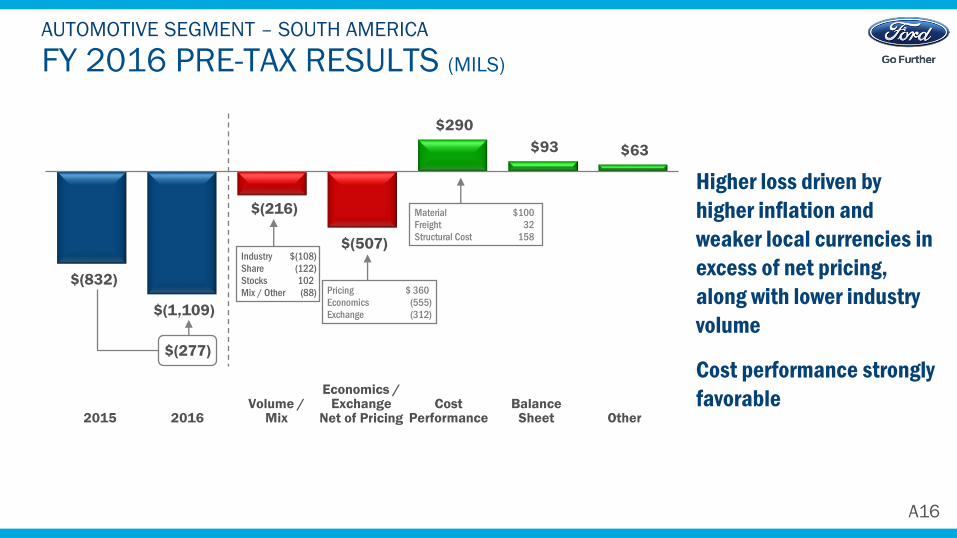
$(832)
$(1,109)
$(216)
$(507)
$290
$93 $63
FY 2016 PRE-TAX RESULTS (MILS)
AUTOMOTIVE SEGMENT – SOUTH AMERICA
Higher loss driven by
higher inflation and
weaker local currencies in
excess of net pricing,
along with lower industry
volume
Cost performance strongly
favorable20162015
Volume /Mix
Economics / Exchange
Net of PricingBalance
Sheet OtherCost
Performance
$(277)
Industry $(108)
Share (122)
Stocks 102
Mix / Other (88)
A16
Pricing $ 360
Economics (555)
Exchange (312)
Material $100
Freight 32
Structural Cost 158
54
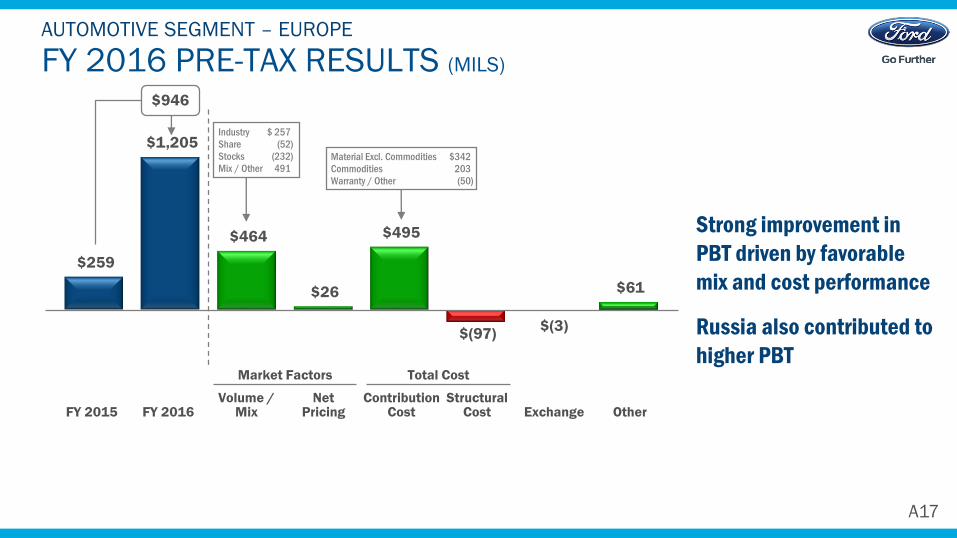
FY 2016 PRE-TAX RESULTS (MILS)
AUTOMOTIVE SEGMENT – EUROPE
Strong improvement in
PBT driven by favorable
mix and cost performance
Russia also contributed to
higher PBT
$259
$1,205
$464
$26
$495
$(97)$(3)
$61
Material Excl. Commodities $342
Commodities 203
Warranty / Other (50)
Market Factors Total Cost
Industry $ 257
Share (52)
Stocks (232)
Mix / Other 491
FY 2016FY 2015Volume /
MixNet
PricingStructural
Cost Exchange OtherContribution
Cost
$946
A17
55
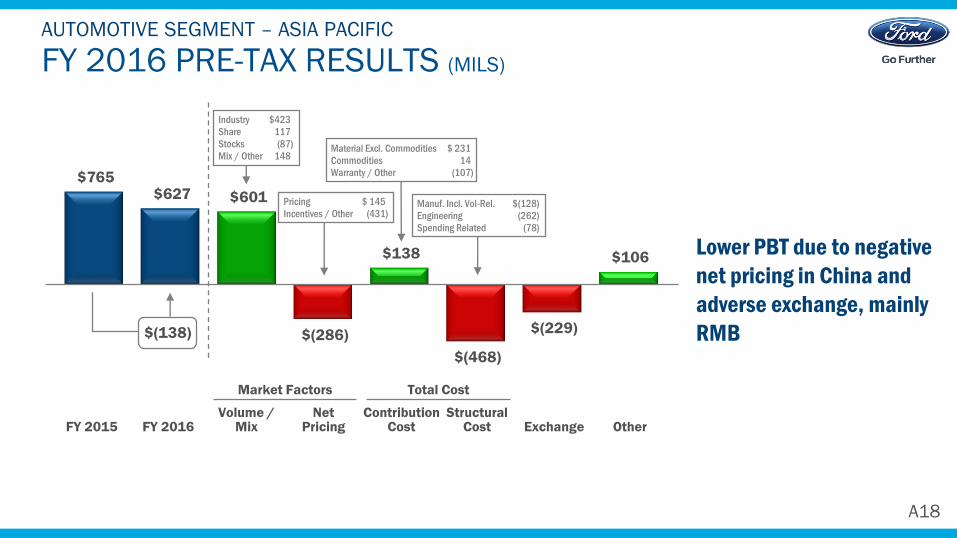
FY 2016 PRE-TAX RESULTS (MILS)
AUTOMOTIVE SEGMENT – ASIA PACIFIC
Lower PBT due to negative
net pricing in China and
adverse exchange, mainly
RMB
$765 $627 $601
$(286)
$138
$(468)
$(229)
$106
Market Factors Total Cost
Industry $423
Share 117
Stocks (87)
Mix / Other 148
FY 2016FY 2015Volume /
MixNet
PricingStructural
Cost Exchange OtherContribution
Cost
$(138)
A18
Material Excl. Commodities $ 231
Commodities 14
Warranty / Other (107)
Pricing $ 145
Incentives / Other (431)Manuf. Incl. Vol-Rel. $(128)
Engineering (262)
Spending Related (78)
56
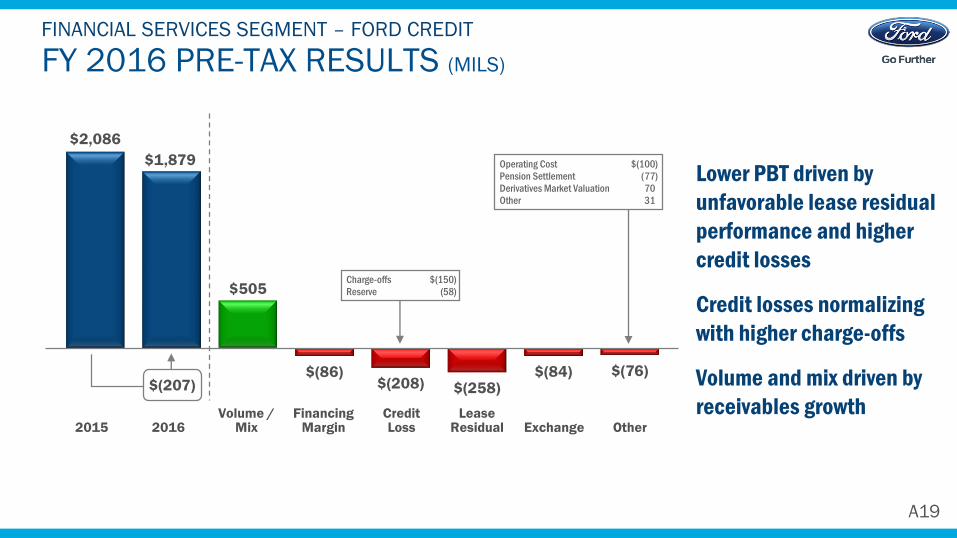
FY 2016 PRE-TAX RESULTS (MILS)
FINANCIAL SERVICES SEGMENT – FORD CREDIT
Lower PBT driven by
unfavorable lease residual
performance and higher
credit losses
Credit losses normalizing
with higher charge-offs
Volume and mix driven by
receivables growth
$2,086
$1,879
$505
$(86)$(208) $(258)
$(84) $(76)
Charge-offs $(150)
Reserve (58)
20162015Volume /
MixFinancing
MarginLease
Residual Exchange OtherCredit Loss
$(207)
Operating Cost $(100)
Pension Settlement (77)
Derivatives Market Valuation 70
Other 31
A19
57
NON-GAAP FINANCIAL MEASURES THAT SUPPLEMENT GAAP MEASURESWe use both GAAP and non-GAAP financial measures for operational and financial decision making, and to assess Company and segment business performance. The
non-GAAP measures listed below are intended to be considered by users as supplemental information to their equivalent GAAP measures, to aid investors in better
understanding our financial results. We believe that these non-GAAP measures provide useful perspective on underlying business results and trends, and a means to assess
our period-over-period results. These non-GAAP measures should not be considered as a substitute for, or superior to measures of financial performance prepared in
accordance with GAAP. These non-GAAP measures may not be the same as similarly titled measures used by other companies due to possible differences in method and in
items or events being adjusted.
Total Company Adjusted Pre-tax Profit (Most Comparable GAAP Measure: Net income attributable to Ford) – The non-GAAP measure is useful to management and investors
because it allows users to evaluate our pre-tax results excluding pre-tax special items. Pre-tax special items consist of (i) pension and OPEB remeasurement gains and losses
that are not reflective of our underlying business results, (ii) significant restructuring actions related to our efforts to match production capacity and cost structure to market
demand and changing model mix, and (iii) other items that we do not necessarily consider to be indicative of earnings from ongoing operating activities.
Adjusted Earnings Per Share (Most Comparable GAAP Measure: Earnings Per Share) – Measure of Company’s diluted net earnings per share adjusted for impact of pre-tax
special items (described above), and tax special items. The measure provides investors with useful information to evaluate performance of our business excluding items not
indicative of underlying run rate of our business.
Adjusted Effective Tax Rate (Most Comparable GAAP Measure: Effective Tax Rate) – Measure of Company’s tax rate excluding pre-tax special items (described above) and tax
special items. The measure provides an ongoing effective rate which investors find useful for historical comparisons and for forecasting.
Ford Credit Managed Receivables – (Most Comparable GAAP Measure: Net Finance Receivables plus Net Investment in Operating Leases) – Measure of Ford Credit’s Total net
receivables, excluding unearned interest supplements and residual support, allowance for credit losses, and other (primarily accumulated supplemental depreciation). The
measure is useful to management and investors as it closely approximates the customer’s outstanding balance on the receivables, which is the basis for earning revenue.
Ford Credit Managed Leverage (Most Comparable GAAP Measure: Financial Statement Leverage) – Ford Credit’s debt-to-equity ratio adjusted (i) to exclude cash, cash
equivalents, and marketable securities (other than amounts related to insurance activities), and (ii) for derivative accounting. The measure is useful to investors because it
reflects the way Ford Credit manages its business. Cash, cash equivalents, and marketable securities are deducted because they generally correspond to excess debt beyond
the amount required to support operations and on-balance sheet securitization transactions. Derivative accounting adjustments are made to asset, debt, and equity positions
to reflect the impact of interest rate instruments used with Ford Credit’s term-debt issuances and securitization transactions. Ford Credit generally repays its debt obligations
as they mature, so the interim effects of changes in market interest rates are excluded in the calculation of managed leverage.
A20
58
DEFINITIONS AND CALCULATIONSAutomotive Records
References to Automotive records for operating cash flow, operating margin and business units are since at least 2000
Wholesales and Revenue
Wholesale unit volumes include all Ford and Lincoln badged units (whether produced by Ford or by an unconsolidated affiliate) that are sold to dealerships, units manufactured by Ford that are sold to other manufacturers, units distributed by Ford for other manufacturers, and local brand units produced by our China joint venture, Jiangling Motors Corporation, Ltd. (“JMC”), that are sold to dealerships. Vehicles sold to daily rental car companies that are subject to a guaranteed repurchase option (i.e., rental repurchase), as well as other sales of finished vehicles for which the recognition of revenue is deferred (e.g., consignments), also are included in wholesale unit volumes. Revenue from certain vehicles in wholesale unit volumes (specifically, Ford badged vehicles produced and distributed by our unconsolidated affiliates, as well as JMC brand vehicles) are not included in our revenue
Automotive Segment Operating Margin
Automotive segment operating margin is defined as Automotive segment pre-tax results divided by Automotive segment revenue
Industry Volume and Market Share
Industry volume and market share are based, in part, on estimated vehicle registrations; includes medium and heavy duty trucks
SAAR
SAAR means seasonally adjusted annual rate
Automotive Cash
Automotive cash includes cash, cash equivalents, and marketable securities
Market Factors
Volume and Mix - primarily measures profit variance from changes in wholesale volumes (at prior-year average contribution margin per unit) driven by changes in industry volume, market share, and dealer stocks, as well as the profit variance resulting from changes in product mix, including mix among vehicle lines and mix of trim levels and options within a vehicle line
Net Pricing - primarily measures profit variance driven by changes in wholesale prices to dealers and marketing incentive programs such as rebate programs, low-rate financing offers, special lease offers and stock accrual adjustments on dealer inventory
A21