Embed Size (px)
Citation preview
SupportedSSA-REMS FUND
State Learning Achievement SurveyClass-VIII
2014
-201
5
State Council for EducationalResearch And Training
New Building,PSEB,E-Block,6th Floor,Phase-8,Ajitgarh,Punjab
www.scertpunjab.ac.in
rwj ividAk Koj Aqy isKlweI sMsQw
STATE COUNCIL FOR EDUCATIONAL RESEARCH AND TRAINING
State Level AchievementSurvey
Class VIII
2014-15SUPPORTED BY
SSA-REMS FUND
rwj ividAk Koj Aqy isKlweI sMsQw
STATE COUNCIL FOR EDUCATIONAL RESEARCH AND TRAINING
State Level AchievementSurvey
Class VIII
2014-15SUPPORTED BY
SSA-REMS FUND
rwj ividAk Koj Aqy isKlweI sMsQw
STATE COUNCIL FOR EDUCATIONAL RESEARCH AND TRAINING
State Level AchievementSurvey
Class VIII
2014-15SUPPORTED BY
SSA-REMS FUND
FOREWORD
Sarva Shiksha Abhiyan in Punjab is implementing a number of educationalenhancement programmes through various schemes towards achieving the critical goalin Universalization of Elementary Education (UEE). SSA focuses on providing qualityelementary education to all children bridging along the social, regional and gender gapswith active participation of the community. Punjab is a pioneer state in implementingvarious programmes like State Level Achievement Survey, Performance Indicators,Advancement of Educational Performances through Teacher Support, QualityMonitoring Tools etc.,
Education evaluation has confirmation and judgment functions concerning howwell the educational goal is realized, based on the goal originally defined. It also hasinformation gathering and application functions necessary for making decisionsregarding learners, educational methods and administrative assistance. To assess theachievement levels of children in the curricular areas and to explore areas for furtherstrengthening the academic inputs needed to improve the learning capabilities ofchildren, a state level specific assessment survey was conducted during 2013 as aninitiative of the State.
During SLAS 2014-15, in order to overcome the limitations of Classical TestTheory, Item Response Theory (IRT) has been used to compare performance over timeand to analyses the data competency wise. IRT uses a mathematical model to link astudent’s chance of answering correctly a particular item to two main factors: thestudent’s level of ability and the item’s level of difficulty. State Level AchievementSurvey (SLAS) has been conducted in 2013-14 for class III and 2014-15 for ClassesII, III and VIII in Punjab. The survey tested the competencies that ought to beattained by students in every class. Practicing teachers, teachers and DIET facultywere involved in framing the test items, testing, data gathering and discussions.
SLAS has successfully explored and analyzed all areas of strengthening thelearning outcomes among children. The report of SLAS is a diagnostic presentation ofthe existing levels of competencies among students and also throws light upon theareas which need to be improved in future. This report is need-based and givesvaluable inputs for policy making, curriculum construction, research and setting upeducational standards in Elementary Education.
Education Minister , Punjab
Dr. Daljeet Singh Cheema,
Principal Secretary, School Education Department
Sh. C. Raul, IAS,
Steering Committee
Sh. Pradeep Kumar AgrawalState Project Director
Chairperson
Sh. Balbir Singh Dhol (PCS)D.P.I (S.E.)
Member
Sh.Harbans Singh SandhuD.P.I (E.E)
Member
Sh. Sukhdev Singh KahlonDirector,SCERT
Member
Mrs. DaisyDy.Director(SDP),SCERT
Member
Dr. Maninder Singh SarkariaDy. SPD,RMSA
Academic Authority Representative
Sh. Jaswinder SinghASPD Pedagogy
State Pedagogy coordinator
Dr. Avtar SinghRetd. Prof. NCERT
State Research Advisor
Dr. Manika SharmaDEME,NCERT
Technical Consultant
Sh. P.C. AggarwalPro. R.I.E,Ajmer
Representative of R.I.E.
Dr. MeenakshiHOD,Edu.Deptt., Punjabi University
Representative of Deptt. OfEdu.,Punjabi University
Sh. Harinder Pal SinghProject Officer,P.S.E.B
Representative of P.S.E.B.
Sh. Sunil KumarTechnical Assistant,SCERT
Expert on Research and Evaluation
Sh. Vinod KumarACFA
Finance Expert
State Project Director
Sh. Pradeep Kumar Agrawal, IAS,
Director SCERT
Sh. Sukhdev Singh Kahlon
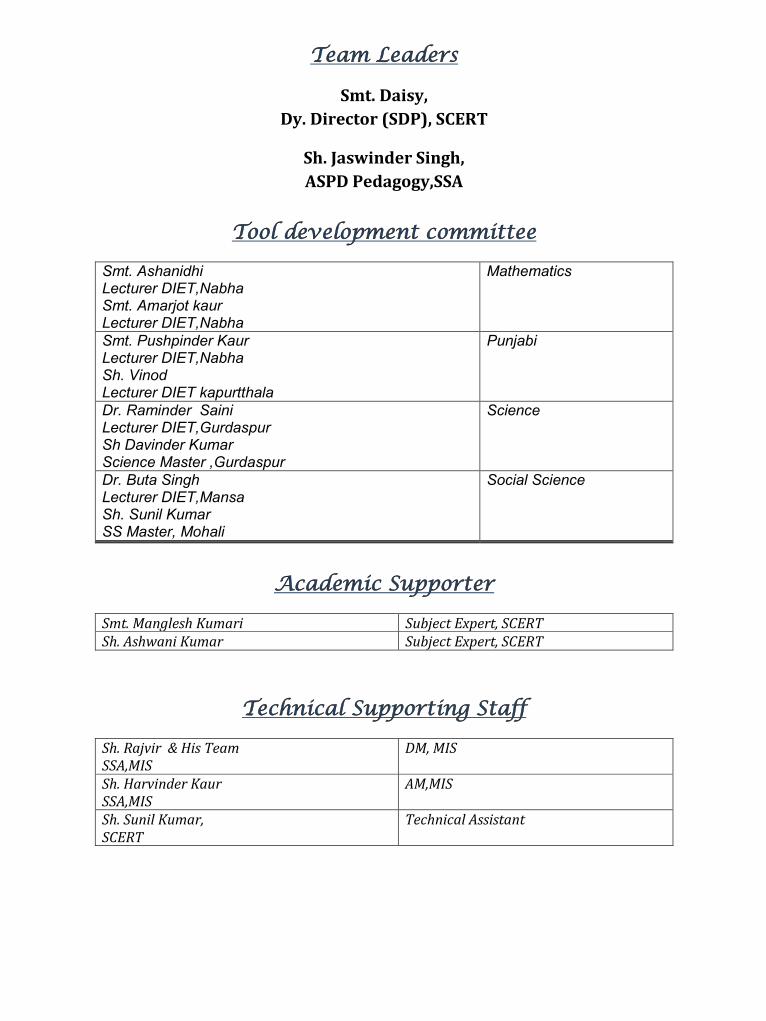
Team Leaders
Smt. Daisy,Dy. Director (SDP), SCERT
Sh. Jaswinder Singh,ASPD Pedagogy,SSA
Tool development committee
Smt. AshanidhiLecturer DIET,NabhaSmt. Amarjot kaurLecturer DIET,Nabha
Mathematics
Smt. Pushpinder KaurLecturer DIET,NabhaSh. VinodLecturer DIET kapurtthala
Punjabi
Dr. Raminder SainiLecturer DIET,GurdaspurSh Davinder KumarScience Master ,Gurdaspur
Science
Dr. Buta SinghLecturer DIET,MansaSh. Sunil KumarSS Master, Mohali
Social Science
Academic Supporter
Smt. Manglesh Kumari Subject Expert, SCERTSh. Ashwani Kumar Subject Expert, SCERT
Technical Supporting Staff
Sh. Rajvir & His TeamSSA,MIS
DM, MIS
Sh. Harvinder KaurSSA,MIS
AM,MIS
Sh. Sunil Kumar,SCERT
Technical Assistant
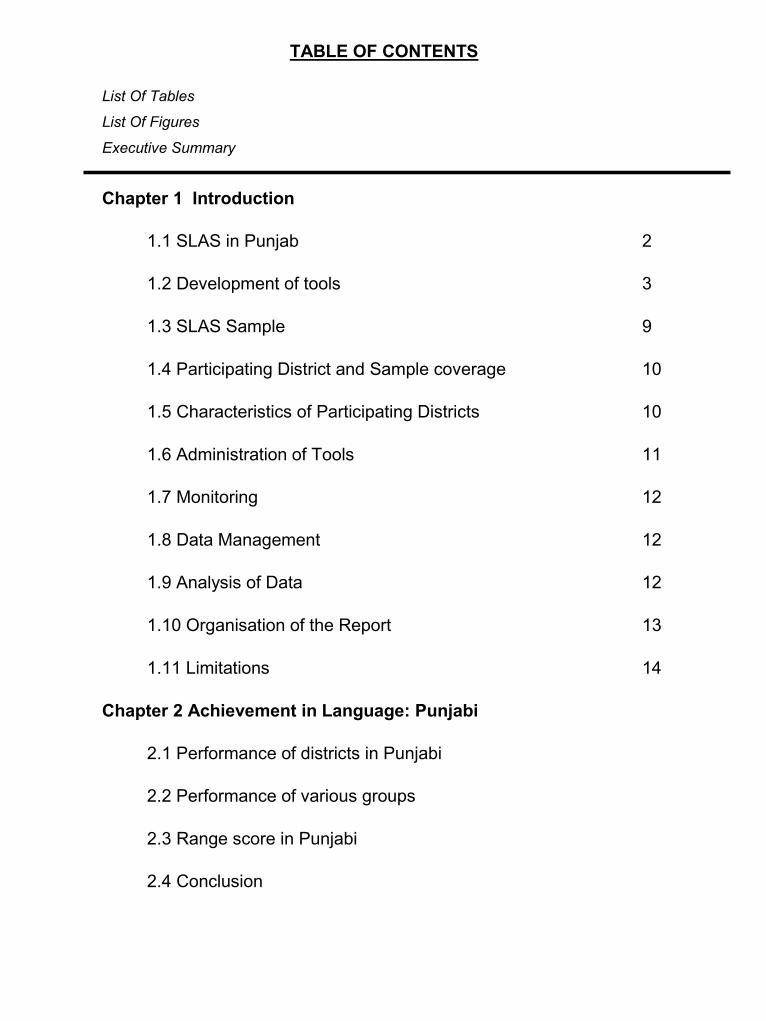
TABLE OF CONTENTS
List Of Tables
List Of Figures
Executive Summary
Chapter 1 Introduction
1.1 SLAS in Punjab 2
1.2 Development of tools 3
1.3 SLAS Sample 9
1.4 Participating District and Sample coverage 10
1.5 Characteristics of Participating Districts 10
1.6 Administration of Tools 11
1.7 Monitoring 12
1.8 Data Management 12
1.9 Analysis of Data 12
1.10 Organisation of the Report 13
1.11 Limitations 14
Chapter 2 Achievement in Language: Punjabi
2.1 Performance of districts in Punjabi
2.2 Performance of various groups
2.3 Range score in Punjabi
2.4 Conclusion
Chapter 3 What students know and can do: Punjabi
3.1 Overview of the language test: Punjabi
3.2 Sample Item
3.3 What can students do in language: Punjabi?
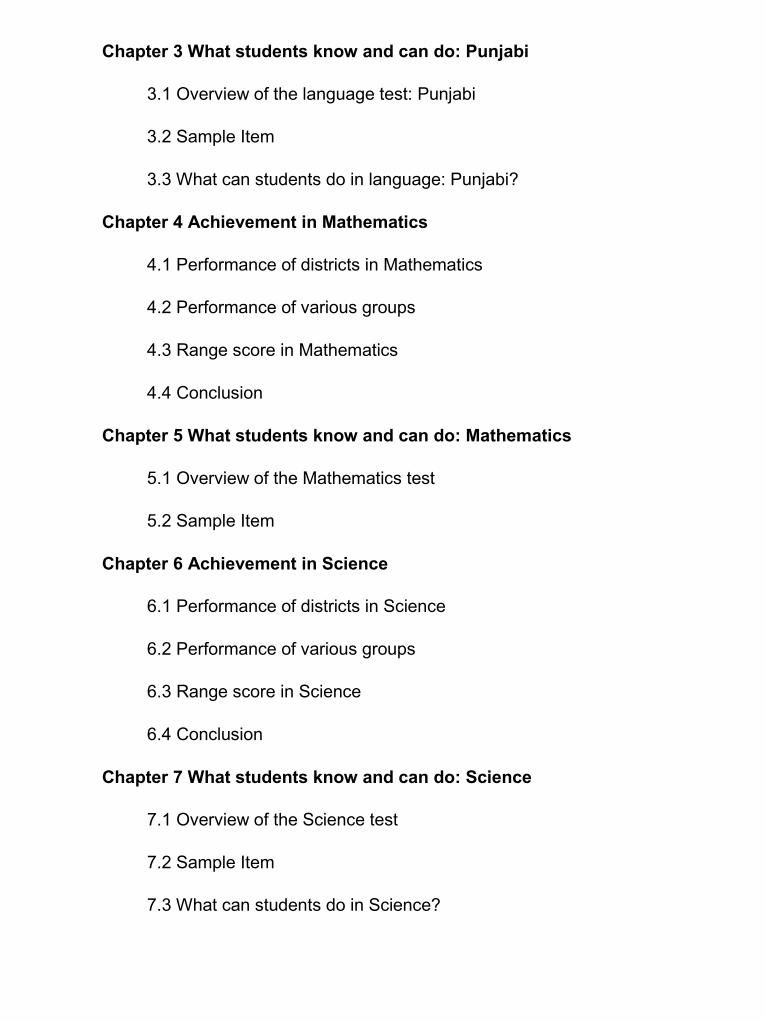
Chapter 4 Achievement in Mathematics
4.1 Performance of districts in Mathematics
4.2 Performance of various groups
4.3 Range score in Mathematics
4.4 Conclusion
Chapter 5 What students know and can do: Mathematics
5.1 Overview of the Mathematics test
5.2 Sample Item
Chapter 6 Achievement in Science
6.1 Performance of districts in Science
6.2 Performance of various groups
6.3 Range score in Science
6.4 Conclusion
Chapter 7 What students know and can do: Science
7.1 Overview of the Science test
7.2 Sample Item
7.3 What can students do in Science?
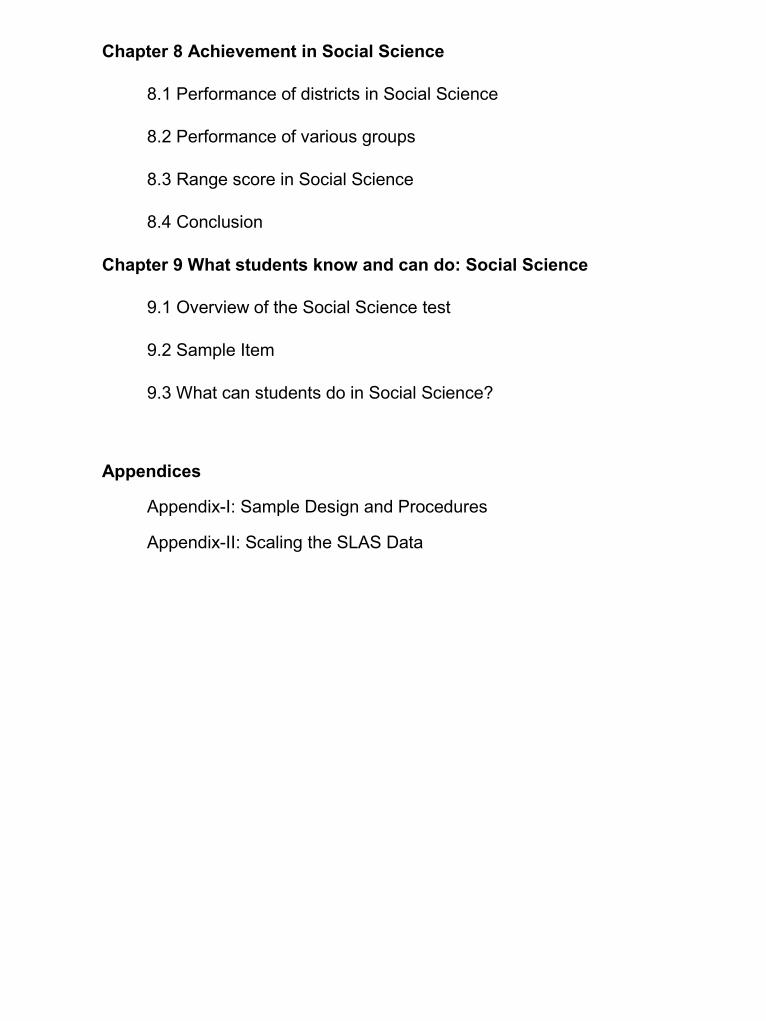
Chapter 8 Achievement in Social Science
8.1 Performance of districts in Social Science
8.2 Performance of various groups
8.3 Range score in Social Science
8.4 Conclusion
Chapter 9 What students know and can do: Social Science
9.1 Overview of the Social Science test
9.2 Sample Item
9.3 What can students do in Social Science?
Appendices
Appendix-I: Sample Design and Procedures
Appendix-II: Scaling the SLAS Data
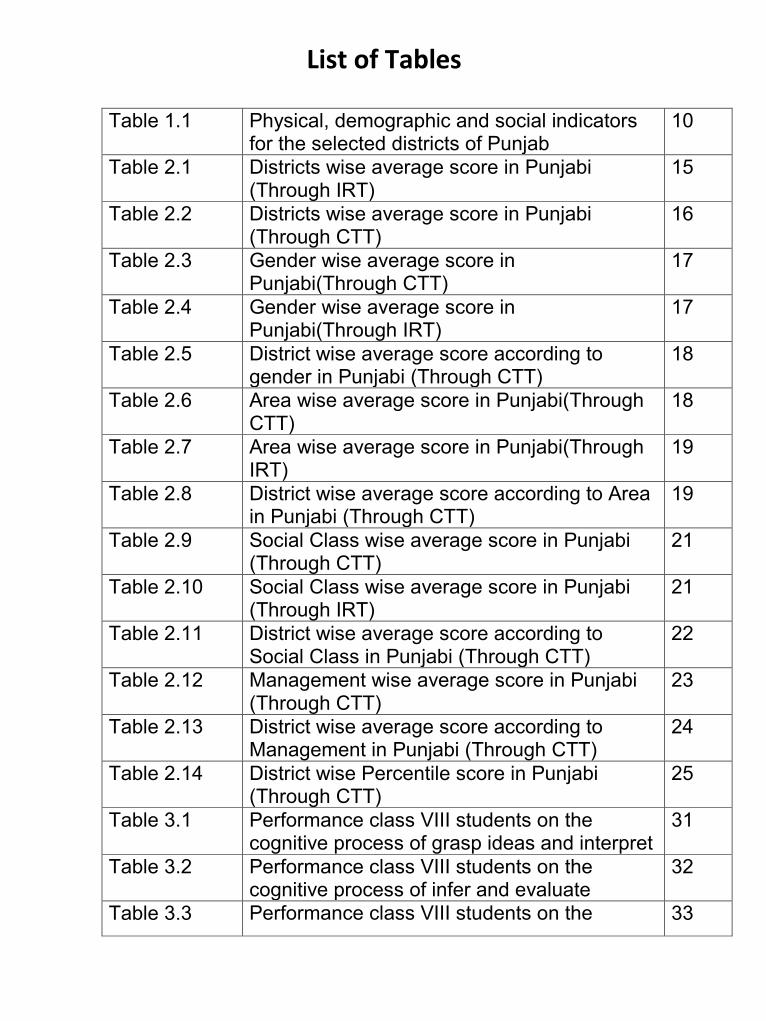
List of Tables
Table 1.1 Physical, demographic and social indicatorsfor the selected districts of Punjab
10
Table 2.1 Districts wise average score in Punjabi(Through IRT)
15
Table 2.2 Districts wise average score in Punjabi(Through CTT)
16
Table 2.3 Gender wise average score inPunjabi(Through CTT)
17
Table 2.4 Gender wise average score inPunjabi(Through IRT)
17
Table 2.5 District wise average score according togender in Punjabi (Through CTT)
18
Table 2.6 Area wise average score in Punjabi(ThroughCTT)
18
Table 2.7 Area wise average score in Punjabi(ThroughIRT)
19
Table 2.8 District wise average score according to Areain Punjabi (Through CTT)
19
Table 2.9 Social Class wise average score in Punjabi(Through CTT)
21
Table 2.10 Social Class wise average score in Punjabi(Through IRT)
21
Table 2.11 District wise average score according toSocial Class in Punjabi (Through CTT)
22
Table 2.12 Management wise average score in Punjabi(Through CTT)
23
Table 2.13 District wise average score according toManagement in Punjabi (Through CTT)
24
Table 2.14 District wise Percentile score in Punjabi(Through CTT)
25
Table 3.1 Performance class VIII students on thecognitive process of grasp ideas and interpret
31
Table 3.2 Performance class VIII students on thecognitive process of infer and evaluate
32
Table 3.3 Performance class VIII students on the 33
cognitive process of locate information
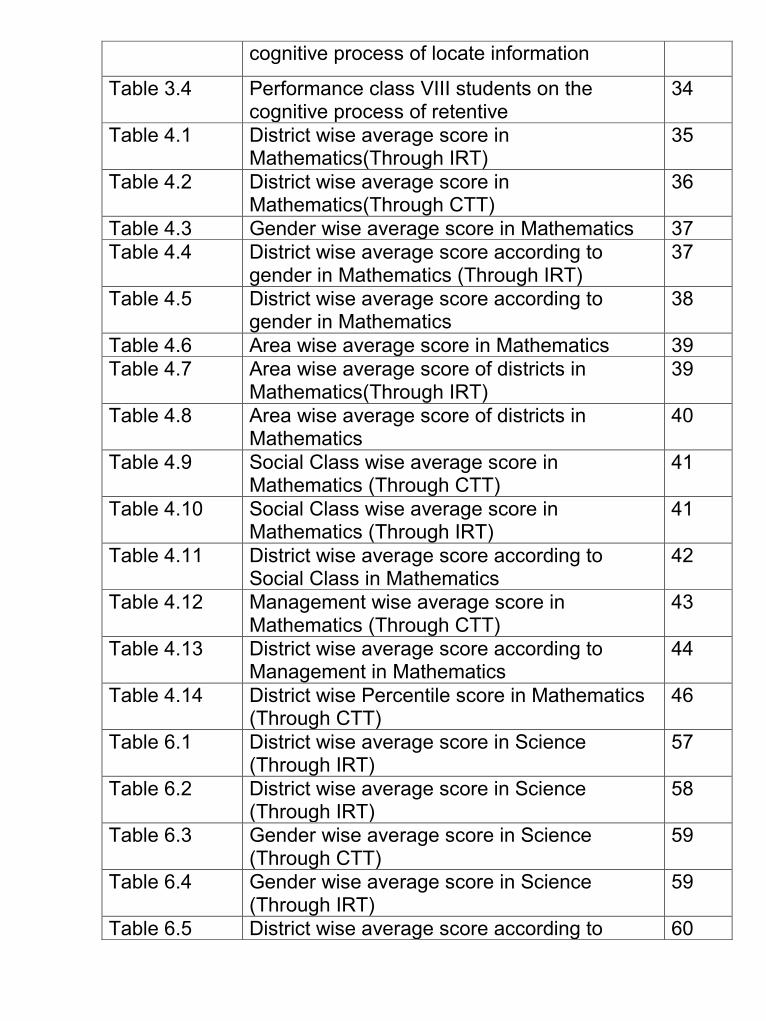
Table 3.4 Performance class VIII students on thecognitive process of retentive
34
Table 4.1 District wise average score inMathematics(Through IRT)
35
Table 4.2 District wise average score inMathematics(Through CTT)
36
Table 4.3 Gender wise average score in Mathematics 37Table 4.4 District wise average score according to
gender in Mathematics (Through IRT)37
Table 4.5 District wise average score according togender in Mathematics
38
Table 4.6 Area wise average score in Mathematics 39Table 4.7 Area wise average score of districts in
Mathematics(Through IRT)39
Table 4.8 Area wise average score of districts inMathematics
40
Table 4.9 Social Class wise average score inMathematics (Through CTT)
41
Table 4.10 Social Class wise average score inMathematics (Through IRT)
41
Table 4.11 District wise average score according toSocial Class in Mathematics
42
Table 4.12 Management wise average score inMathematics (Through CTT)
43
Table 4.13 District wise average score according toManagement in Mathematics
44
Table 4.14 District wise Percentile score in Mathematics(Through CTT)
46
Table 6.1 District wise average score in Science(Through IRT)
57
Table 6.2 District wise average score in Science(Through IRT)
58
Table 6.3 Gender wise average score in Science(Through CTT)
59
Table 6.4 Gender wise average score in Science(Through IRT)
59
Table 6.5 District wise average score according to 60
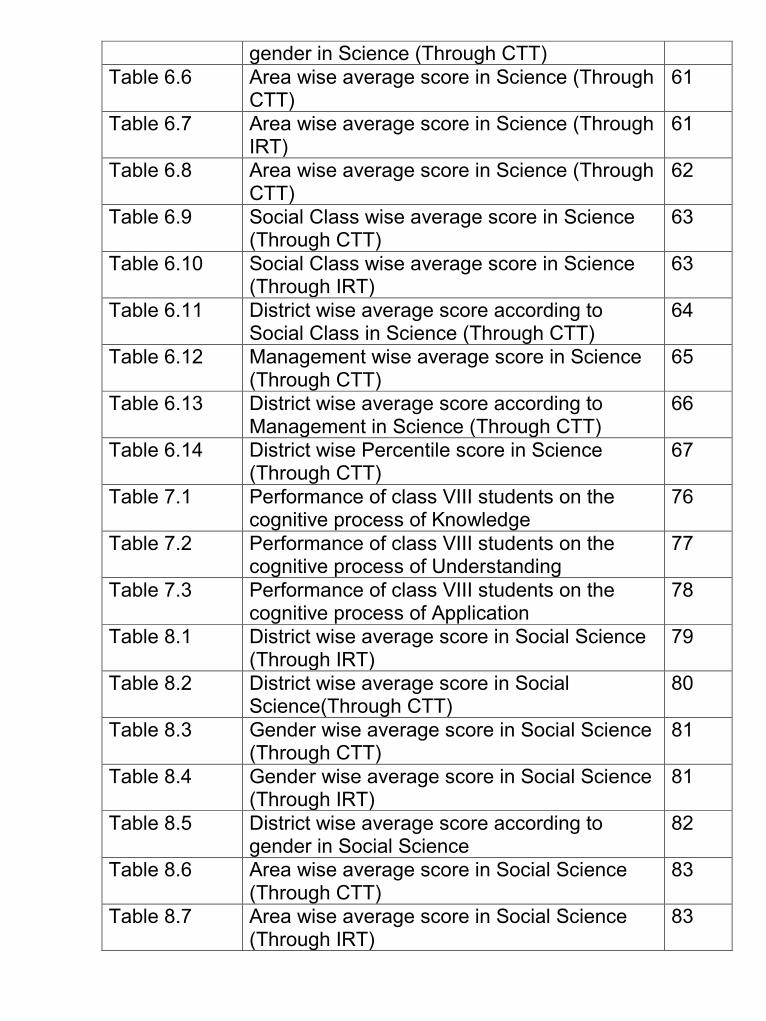
gender in Science (Through CTT)Table 6.6 Area wise average score in Science (Through
CTT)61
Table 6.7 Area wise average score in Science (ThroughIRT)
61
Table 6.8 Area wise average score in Science (ThroughCTT)
62
Table 6.9 Social Class wise average score in Science(Through CTT)
63
Table 6.10 Social Class wise average score in Science(Through IRT)
63
Table 6.11 District wise average score according toSocial Class in Science (Through CTT)
64
Table 6.12 Management wise average score in Science(Through CTT)
65
Table 6.13 District wise average score according toManagement in Science (Through CTT)
66
Table 6.14 District wise Percentile score in Science(Through CTT)
67
Table 7.1 Performance of class VIII students on thecognitive process of Knowledge
76
Table 7.2 Performance of class VIII students on thecognitive process of Understanding
77
Table 7.3 Performance of class VIII students on thecognitive process of Application
78
Table 8.1 District wise average score in Social Science(Through IRT)
79
Table 8.2 District wise average score in SocialScience(Through CTT)
80
Table 8.3 Gender wise average score in Social Science(Through CTT)
81
Table 8.4 Gender wise average score in Social Science(Through IRT)
81
Table 8.5 District wise average score according togender in Social Science
82
Table 8.6 Area wise average score in Social Science(Through CTT)
83
Table 8.7 Area wise average score in Social Science(Through IRT)
83
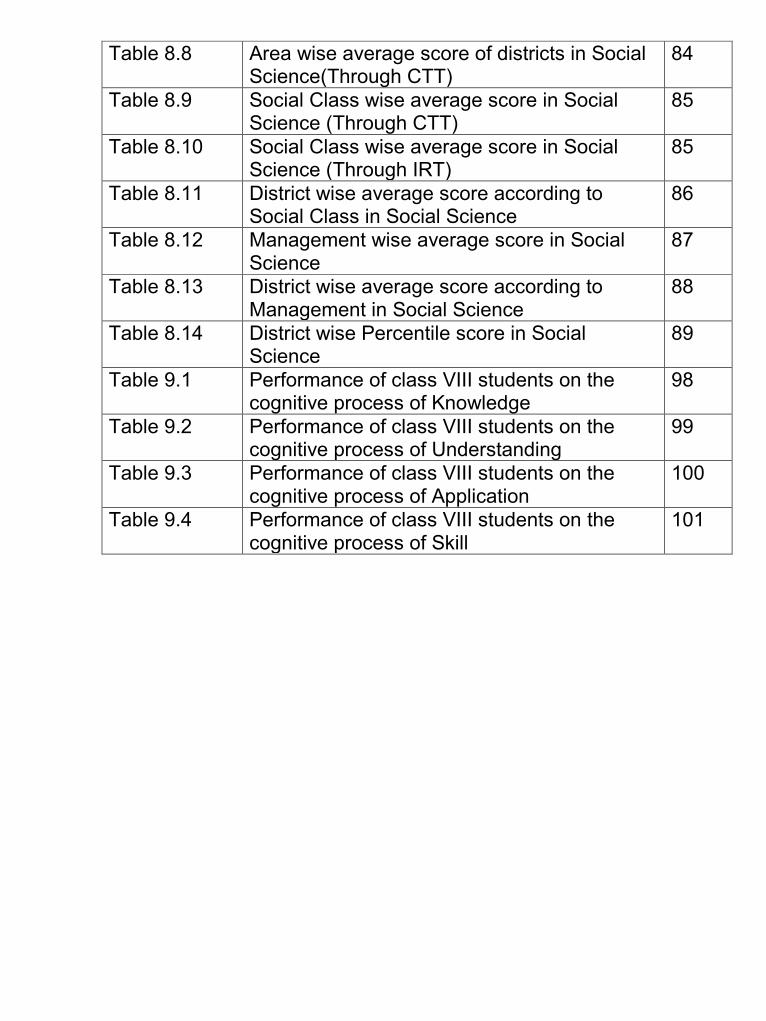
Table 8.8 Area wise average score of districts in SocialScience(Through CTT)
84
Table 8.9 Social Class wise average score in SocialScience (Through CTT)
85
Table 8.10 Social Class wise average score in SocialScience (Through IRT)
85
Table 8.11 District wise average score according toSocial Class in Social Science
86
Table 8.12 Management wise average score in SocialScience
87
Table 8.13 District wise average score according toManagement in Social Science
88
Table 8.14 District wise Percentile score in SocialScience
89
Table 9.1 Performance of class VIII students on thecognitive process of Knowledge
98
Table 9.2 Performance of class VIII students on thecognitive process of Understanding
99
Table 9.3 Performance of class VIII students on thecognitive process of Application
100
Table 9.4 Performance of class VIII students on thecognitive process of Skill
101
List of FigureFigure 2.1 Percentile scores in Punjabi for districts 26Figure 3.1 Percentage of Students Response 28Figure 3.2 Percentage of Students Response 28Figure 3.3 Percentage of Students Response 29Figure 3.4 Percentage of Students Response 30Figure 3.5 Percentage of Students Response 30Figure 4.1 Percentile scores in Mathematics for districts 48Figure 5.1 Percentage of Students Response 49Figure 5.2 Percentage of Students Response 50Figure 5.3 Percentage of Students Response 51Figure 5.4 Percentage of Students Response 52Figure 5.5 Percentage of Students Response 53Figure 5.6 Percentage of Students Response 54Figure 5.7 Percentage of Students Response 55Figure 5.8 Percentage of Students Response 56Figure 6.1 Percentile scores in Science for districts 68Figure 7.1 Percentage of Students Response 70Figure 7.2 Percentage of Students Response 71Figure 7.3 Percentage of Students Response 72Figure 7.4 Percentage of Students Response 73Figure 7.5 Percentage of Students Response 74Figure 7.6 Percentage of Students Response 75Figure 8.1 Percentile scores in Social Science for districts 90Figure 9.1 Percentage of Students Response 92Figure 9.2 Percentage of Students Response 93Figure 9.3 Percentage of Students Response 94Figure 9.4 Percentage of Students Response 95Figure 9.5 Percentage of Students Response 96Figure 9.6 Percentage of Students Response 97

Executive Summary
Introduction
The State Learning Achievement Survey (SLAS) is a process to find out hard spot
and collect relevant data regarding health of education system. It helps to make
policy for the remedial process. In the year 2013, the State Learning Achievement
Survey (SLAS) conducted by SCERT for the first time in Punjab as an independent
project, was incorporated into the Government's flagship projects Sarva Shiksha
Abhiyan(SSA). SCERT is responsible for developing tools and conducting the
surveys whilst funding is provided by the SSA under REMS.
In 2013, The SLAS of class III was conducted by the SCERT, according to the
guidelines provided by NCERT. This year NCERT direct the state to conduct a
sample survey of class II, III,& VIII. However, the importance of these surveys and
the experience gained through the first survey made it clear that this programme
should be an ongoing feature of the State education system.
Methodology
Sample Selection
For Class VIII SLAS, government and government-aided schools having Class IX
were included in the sample frame. Class IX students was selected for sample
because the survey was administer in the beginning of the session. The general
selection procedure was:
Selection of districts(Purposive and Simple random sampling)
Selection of schools (PPS within each selected districts)
Selection of students(Randomly with in selected schools)
The survey was administered to a sample of 3990 students, 133 schools and 13
districts.
Tool DevelopmentFor the survey, subject tools and three questionnaires (PQ,TQ and SQ) were
developed. The tools employed need to be simple, understandable, accessible, valid
and reliable. For the purpose a subject expert committee was made. These subject
expert were from Lecturer DIETs and teachers from schools. After formation of
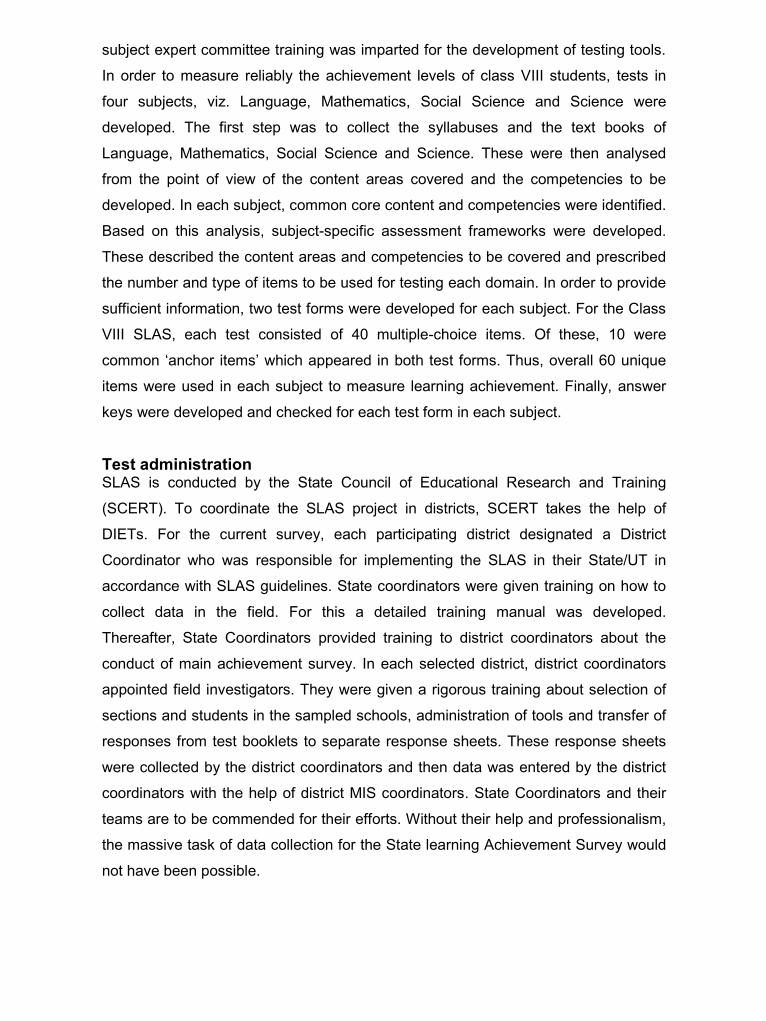
subject expert committee training was imparted for the development of testing tools.
In order to measure reliably the achievement levels of class VIII students, tests in
four subjects, viz. Language, Mathematics, Social Science and Science were
developed. The first step was to collect the syllabuses and the text books of
Language, Mathematics, Social Science and Science. These were then analysed
from the point of view of the content areas covered and the competencies to be
developed. In each subject, common core content and competencies were identified.
Based on this analysis, subject-specific assessment frameworks were developed.
These described the content areas and competencies to be covered and prescribed
the number and type of items to be used for testing each domain. In order to provide
sufficient information, two test forms were developed for each subject. For the Class
VIII SLAS, each test consisted of 40 multiple-choice items. Of these, 10 were
common ‘anchor items’ which appeared in both test forms. Thus, overall 60 unique
items were used in each subject to measure learning achievement. Finally, answer
keys were developed and checked for each test form in each subject.
Test administrationSLAS is conducted by the State Council of Educational Research and Training
(SCERT). To coordinate the SLAS project in districts, SCERT takes the help of
DIETs. For the current survey, each participating district designated a District
Coordinator who was responsible for implementing the SLAS in their State/UT in
accordance with SLAS guidelines. State coordinators were given training on how to
collect data in the field. For this a detailed training manual was developed.
Thereafter, State Coordinators provided training to district coordinators about the
conduct of main achievement survey. In each selected district, district coordinators
appointed field investigators. They were given a rigorous training about selection of
sections and students in the sampled schools, administration of tools and transfer of
responses from test booklets to separate response sheets. These response sheets
were collected by the district coordinators and then data was entered by the district
coordinators with the help of district MIS coordinators. State Coordinators and their
teams are to be commended for their efforts. Without their help and professionalism,
the massive task of data collection for the State learning Achievement Survey would
not have been possible.
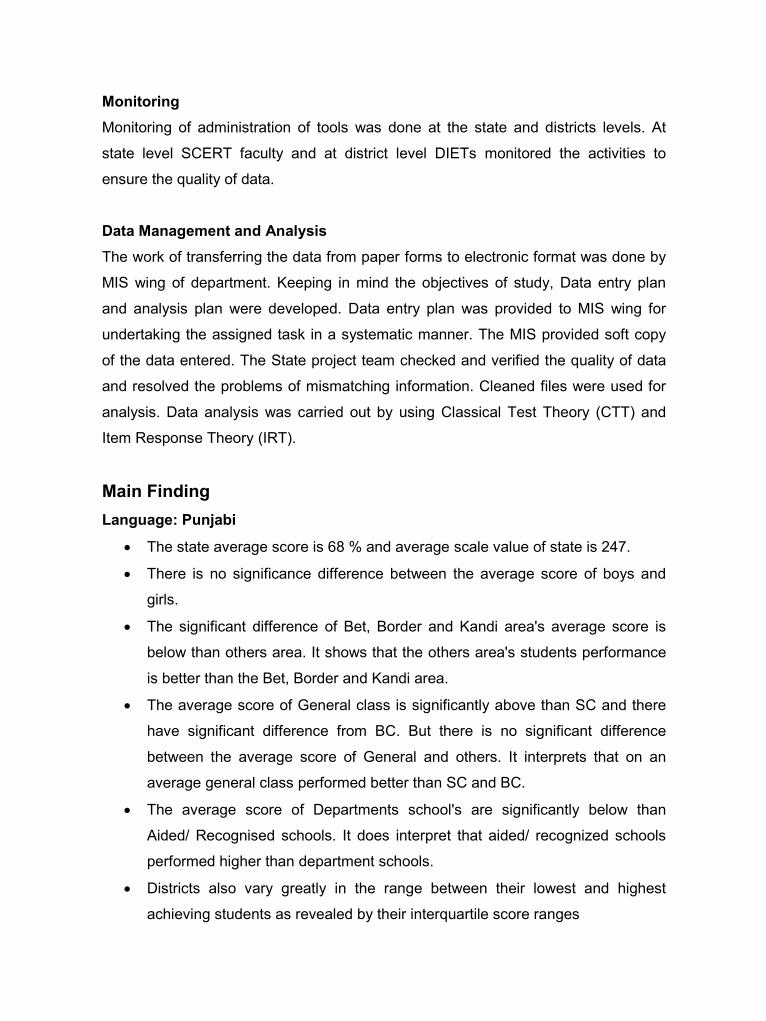
MonitoringMonitoring of administration of tools was done at the state and districts levels. At
state level SCERT faculty and at district level DIETs monitored the activities to
ensure the quality of data.
Data Management and AnalysisThe work of transferring the data from paper forms to electronic format was done by
MIS wing of department. Keeping in mind the objectives of study, Data entry plan
and analysis plan were developed. Data entry plan was provided to MIS wing for
undertaking the assigned task in a systematic manner. The MIS provided soft copy
of the data entered. The State project team checked and verified the quality of data
and resolved the problems of mismatching information. Cleaned files were used for
analysis. Data analysis was carried out by using Classical Test Theory (CTT) and
Item Response Theory (IRT).
Main FindingLanguage: Punjabi
The state average score is 68 % and average scale value of state is 247.
There is no significance difference between the average score of boys and
girls.
The significant difference of Bet, Border and Kandi area's average score is
below than others area. It shows that the others area's students performance
is better than the Bet, Border and Kandi area.
The average score of General class is significantly above than SC and there
have significant difference from BC. But there is no significant difference
between the average score of General and others. It interprets that on an
average general class performed better than SC and BC.
The average score of Departments school's are significantly below than
Aided/ Recognised schools. It does interpret that aided/ recognized schools
performed higher than department schools.
Districts also vary greatly in the range between their lowest and highest
achieving students as revealed by their interquartile score ranges
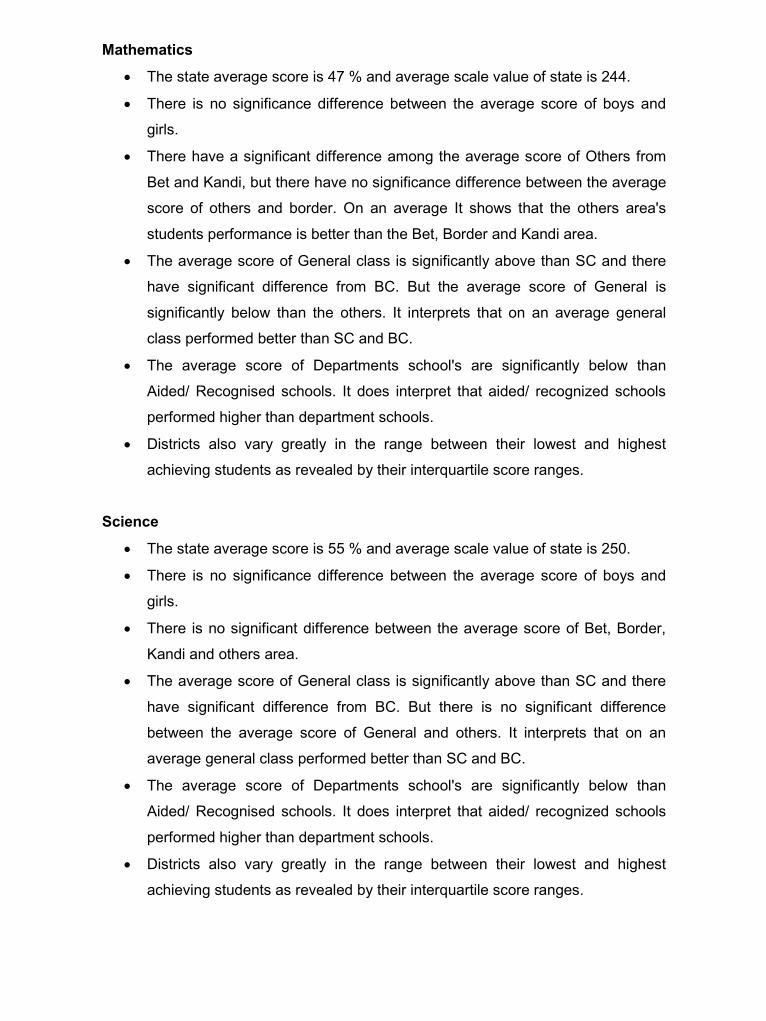
Mathematics
The state average score is 47 % and average scale value of state is 244.
There is no significance difference between the average score of boys and
girls.
There have a significant difference among the average score of Others from
Bet and Kandi, but there have no significance difference between the average
score of others and border. On an average It shows that the others area's
students performance is better than the Bet, Border and Kandi area.
The average score of General class is significantly above than SC and there
have significant difference from BC. But the average score of General is
significantly below than the others. It interprets that on an average general
class performed better than SC and BC.
The average score of Departments school's are significantly below than
Aided/ Recognised schools. It does interpret that aided/ recognized schools
performed higher than department schools.
Districts also vary greatly in the range between their lowest and highest
achieving students as revealed by their interquartile score ranges.
Science
The state average score is 55 % and average scale value of state is 250.
There is no significance difference between the average score of boys and
girls.
There is no significant difference between the average score of Bet, Border,
Kandi and others area.
The average score of General class is significantly above than SC and there
have significant difference from BC. But there is no significant difference
between the average score of General and others. It interprets that on an
average general class performed better than SC and BC.
The average score of Departments school's are significantly below than
Aided/ Recognised schools. It does interpret that aided/ recognized schools
performed higher than department schools.
Districts also vary greatly in the range between their lowest and highest
achieving students as revealed by their interquartile score ranges.
Social Science
The state average score is 56 % and average scale value of state is 247.
There is no significance difference between the average score of boys and
girls.
The average score of Bet & Border area is significantly below than Kandi &
Others.
The average score of General class is significantly above than SC and there
have significant difference from BC and Others. It interprets that on an
average general class performed better than all.
The average score of Departments school's are significantly below than
Aided/ Recognised schools. It does interpret that aided/ recognized schools
performed higher than department schools.
Districts also vary greatly in the range between their lowest and highest
achieving students as revealed by their interquartile score ranges.
LimitationsThis survey undoubtedly represents a significant step forward in the development of
education in Punjab. However, as with all such enterprises, lessons have been
learnt. In conducting the Class VIII SLAS, the following limitations have been noted
so that they may be addressed in future achievement surveys:
The survey used DISE 2013–14 data from the MIS- SSA Punjab as the
primary sample frame. Once in the field, significant discrepancies between the
DISE data and actual school enrolments were noticed.
Due to discrepancies in the sample frame, deviation from agreed sampling
procedures, and loss of information during administration, it was not possible
to estimate sample weights for the survey.
In all selected Districts, the coordinator was DIET's faculty. It was decided that
the field investigator should be chosen from the senior most class of DIET's.
On reflection, the training and hands-on practice given to these field
investigators may not have been sufficient resulting in inefficiencies in the
data collection procedure.
In order to meet the key objectives of this survey, schools and students were
sampled in a systematic fashion, meant that teachers could not be explicitly
sampled. As a result, the analysis of teacher-related variables vis-à-vis
student attainment could not be made in a comprehensive manner.
In this survey SCERT also used IRT for analysis of results. Therefore, results
are reported in terms of scale scores rather than percentage. Whilst this is an
important step towards emulating international best practice, unfamiliarity with
this approach has undoubtedly made it more difficult for the lay reader to
interpret results. It is hoped that understanding will improve of IRT with time.
Difference between the research study and exam/test is not clear to the field.
State Learning Achievement Survey,Class VIII 2014-15
Page 1
Chapter 1INTRODUCTION
This report summarises the findings of the State Learning Achievement Survey (SLAS) of
class VIII students conducted in 2014 by the State Council for Educational Research and
Training (SCERT).
punjab It is based on information gathered through test and questionnaires administered to
a sample comprising of 3930 students in 131 schools across 13 Districts of Punjab. The
subjects covered were Mathematics, Punjabi, Science and Social Science.
This survey is the latest in an ongoing programme of such studies available to all districts of
Punjab. The aim of SLAS is to provide reliable information on the achievement of the
students in the elementary sector of education in government and government
aided/recognized schools. This is achieved not only by applying standardised test to
students, but also collecting information about relevant background factors including the
school environment, instructional practices, qualification and experience of teachers, and
the home background of students. The data from SLAS gives policy makers, curriculum
specialists, researchers and most importantly school heads and teachers a 'snapshot' of
what students are achieving in key subjects at a particular point in time. By repeating such
measurement at regular intervals, trend can be explored providing an invaluable
perspective through which consider educational reform and improvement Can be mode.
It should be noted that whilst each SLAS provides achievement scores for the state, for
each participating district and for certain group (e.g. boys/girls, students in rural schools,
etc.), it does not give scores to individual students and schools.
1.1 SLAS in Punjab
The State Learning Achievement Survey (SLAS) is a process to find out hard spot and
collect relevant data regarding health of education system. It helps to make policy for the
remedial process. In the year 2013, the State Learning Achievement Survey (SLAS)
conducted by SCERT for the first time in Punjab as an independent project, was
incorporated into the Government's flagship projects Sarva Shiksha Abhiyan(SSA). SCERT
is responsible for developing tools and conducting the surveys whilst funding is provided by
the SSA under REMS.
Since 2001 National Council of Educational Research and Training (NCERT) has been
periodically conducting National Achievement Surveys(NAS).The NAS reports gave a
State Learning Achievement Survey,Class VIII 2014-15
Page 2
national and state level picture rather than scores for individual student, school or districts.
The purpose of these assessments is to obtain an overall picture of what students in
specific class, knows and can do. These findings can also be used to identify gaps and
areas that need improvement and to form policies. The finding can also be useful to invent
the interventions for the improvement of children's learning under the SSA programme. But
in 2013, the NCERT directed the state to conduct their ower State Learning Achievement
Survey (SLAS).
In 2013, The SLAS of class III was conducted by the SCERT, according to the guidelines
provided by NCERT. This year NCERT directed the state to conduct a sample survey of
class II, III,& VIII. However, the importance of these surveys and the experience gained
through the first survey made it clear that this programme should be an ongoing feature of
the State education system.
At the class II and III level, assessment was made in two subjects, i.e Mathematics and
Language (Punjabi). For class VIII, four subjects was assessed i.e. Mathematics, Language
(Punjabi), Social Science and Science. The comprehensiveness and coverage of these
surveys provide very useful data to capture the progress of the education system as well as
to enhance the quality of elementary education.
1.2 Development of toolsFor any large survey, the tools employed need to be simple, understandable, valid and
reliable. For measuring reliably the learning levels of class VIII, these tools are important.
The tests need to be pegged at the level that they measure the abilities developed in
children across the states. Therefore, before undertaking the test development, it was
necessary to know what was taught at class VIII. The first exercise, hence, was to collect
the syllabus and the textbooks of Mathematics, Language (Punjabi), Social Science and
Science. These were then analysed from the point of view of the content areas covered and
competencies acquired. The common core content and competencies were identified for
developing the tests.
Based on the analysis, assessment frameworks were developed to each subject. The
frameworks described the competencies to be covered in the tests, the number and type of
items to be used for testing each competency, the structure of the test forms and number of
tests forms to be used.
For measuring each learning outcome with sufficient precision, it was necessary to
construct multiple test forms in each subject. A three dimensional grid was prepared in each
State Learning Achievement Survey,Class VIII 2014-15
Page 3
subject indicating the content areas to be covered, skills to be tested, the difficulty level of
items under each skill along with the number of items.
Item writing workshop
General
The item writing workshop included plenary sessions on fundamental principles of test
development and subject specific workshops for writing and reviewing/editing draft items.
The general principles covered were:
Characteristics of sample-based achievement surveys
Test specifications and their role in test development
Item writing rules and guidelines
Procedures and checklists for reviewing the quality of items
Introduction to classical item statistics.
1.2.1 LanguageThere was one sub-group – Punjabi. The work was guided by the draft specifications for the
language test prepared by SRG, on the basis of text books and gidelines of NAS. The tasks
covered were:
The Working Group came to a common understanding of the main principles of item
writing and quality control.
The Working Group drafted more than 120 items.
All these items were peer reviewed.
The Working Group proposed the use of the following classification system for
Punjabi topics:
- Reading texts and questions (4-option MCQ)
- Fill in the blanks (4-option MCQ)
- General Content based question (4-option MCQ)
- Discrete items on ‘language structures’ (4-option MCQ)
Sufficient passages and discrete items prepared and reviewed to create two booklets
for pre-testing/Piloting.
The next steps undertaken were:
Entering all items, reading passages, marking keys etc. into the computer and
checking.
State Learning Achievement Survey,Class VIII 2014-15
Page 4
Selecting items for two booklets for Pre- testing.
Reviewing, checking and proof reading all booklets.
Language structure multiple-choice questions.
Checking again before ‘passing for print’ to ensure that the versions were ‘camera-
ready’
1.2.2 MathematicsThe work was guided by the draft specifications for the Mathematics test prepared by SRG,
and textbooks used in schools for Mathematics.
Activities carried out in Mathematics Group
The Working Group came to a common understanding of the main principles of item
writing and quality control.
The Working Group drafted more than 120 items.
All these items were peer reviewed.
The Working Group proposed the use of the following classification system for
Mathematics topics:
- Number System
- Computations (operations)
- Measurement
- Geometry
The mathematics items were prepared in two mediums i.e Punjabi and English.
The next steps undertaken were:
Entering all items, reading passages, marking keys etc. into the computer and
checking.
Selecting items for two booklets for Pre- testing.
Reviewing, checking and proof reading all booklets.
Language structure multiple-choice questions.
Checking again before ‘passing for print’ to ensure that the versions were ‘camera-
ready’
1.2.3 ScienceThe work was guided by the draft specifications for the Science test prepared by SRG and
text books used in schools for Science. The task covered the following activity:
State Learning Achievement Survey,Class VIII 2014-15
Page 5
The working group came to a common understanding of the main principles of item
writing and quality control.
The Working Group drafted more than 120 items.
All these items were peer reviewed.
The working group proposed the use of the following classification system for
Science subject:
- Physics
- Chemistry
- Biology
The science items were prepared in two mediums i.e Punjabi and English.
The next steps undertaken were:
Entering all items, reading passages, marking keys etc. into the computer and
checking.
Selecting items for two booklets for Pre- testing.
Reviewing, checking and proof reading all booklets.
Language structure multiple-choice questions.
Checking again before ‘passing for print’ to ensure that the versions were ‘camera-
ready’
1.2.4 Social ScienceThe work was guided by the draft specifications for the social Science test prepared by
SRG and text books used in schools for social Science. The task covered the following
activity:
The working group came to a common understanding of the main principles of item
writing and quality control.
The Working Group drafted more than 120 items.
All these items were peer reviewed.
The working group proposed the use of the following classification system for social
Science subject:
- History
- Geography
- Civics
The social science items were prepared in two mediums i.e Punjabi and English.
The next steps undertaken were:
State Learning Achievement Survey,Class VIII 2014-15
Page 6
Entering all items, reading passages, marking keys etc. into the computer and
checking.
Selecting items for two booklets for Pre- testing.
Reviewing, checking and proof reading all booklets.
Language structure multiple-choice questions.
Checking again before ‘passing for print’ to ensure that the versions were ‘camera-
ready’
1.2.5 Piloting of the test items
In order to standardise the tests, they were piloted to see how the items worked. The
difficulty level (p-value) and discrimination index (DI) were computed. Item were carefully
scrutinised to select suitable items for the final tests. By and large, the items having
difficulty indices (p-values) between 0.2 and 0.8 were selected.
1.2.6 Sampling for piloting
The following procedure was used:
1. A sampling strategy was developed based on District Information System for
Education (DISE) data for the school (2013-14).
2. The sample was not random, but was based on the statistical requirement of
having enough records for each item (for analysis) and at the same time, diversity
of the students/schools in the education system.
3. Two booklets with different competences were designed (for all the subjects).
4. Two booklets were equally distributed among the students of selected section ofthe concerned class.
5. Mohali district was selected taking into account the diversity of socio-economicbackground variables i.e. keeping in mind the strata of area from urban and rural,the schools were selected
6. Except language, all the subjects were tested in two mediums.
1.2.7 Administration of tools for piloting
For piloting, SRG developed a handout for field investigators. Field investigators were trained on the required procedure. The school (from the selected schools list) was assigned to the field Investigator.
State Learning Achievement Survey,Class VIII 2014-15
Page 7
Field investigators administered the piloting in the selected school. It took two
days for the individual to complete the test as there were four subjects to be
administered.
Students responses were transferred to data sheets by the field investigators.
The SCERT collected the data (Hard Copy) from the field investigator after the
compilation.
1.2.8 Data analysis
Data entry of the compiled data (Hard Copy)was carried out by Data EntryOperator.
Data was analysed by the outsourced consultant through IRT(Item responsetheory).
Data was also analysed by the SRG through CTT (Classical test theory). Item parameters were used to select the items in the context of National
Assessment Survey. Poorly performed and flawed items were rejected.
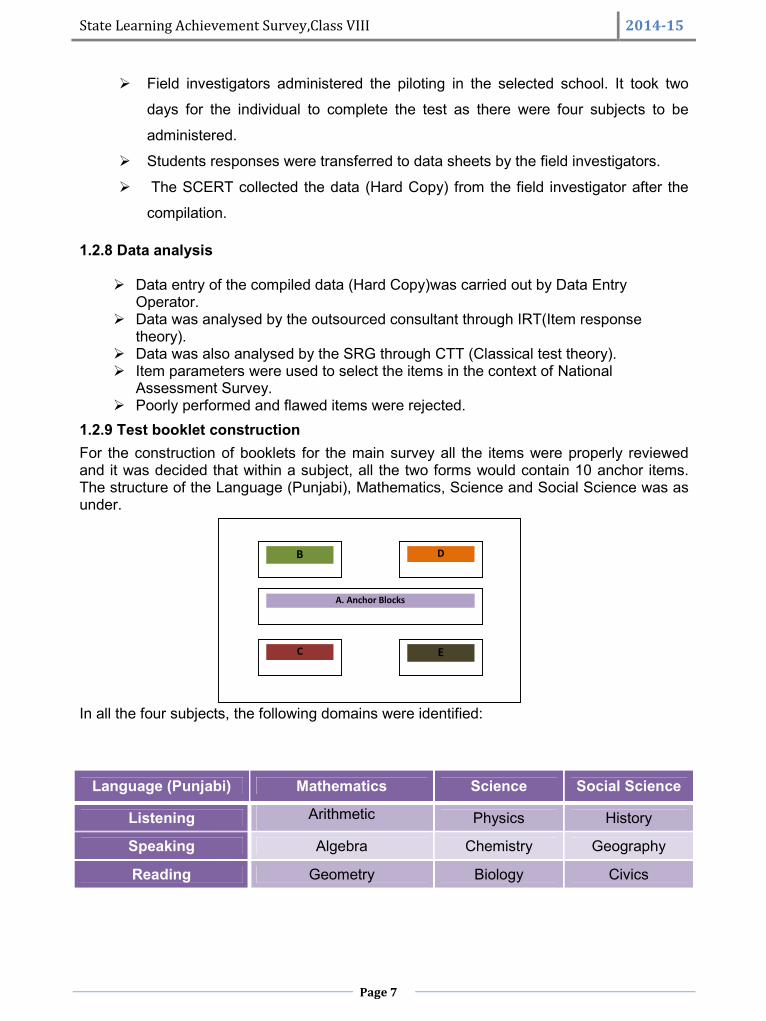
1.2.9 Test booklet constructionFor the construction of booklets for the main survey all the items were properly reviewedand it was decided that within a subject, all the two forms would contain 10 anchor items.The structure of the Language (Punjabi), Mathematics, Science and Social Science was asunder.
In all the four subjects, the following domains were identified:
Language (Punjabi) Mathematics Science Social Science
Listening Arithmetic Physics History
Speaking Algebra Chemistry Geography
Reading Geometry Biology Civics
B D
C
A. Anchor Blocks
E
State Learning Achievement Survey,Class VIII 2014-15
Page 8
In each domain, there were a number of sub-domains or topics. These items were again
vetted by subject experts. Each test was reviewed in the light of the content area
competency, appropriate language, estimated difficulty level and also the homogeneity of
distracters.
Finally, for class VIII (SLAS), each test form for Language (Punjabi),Mathematics, Science
and Social Science consisted of 40 multiple choice items. Thus, total 70 items were used in
each subject to measure learning achievement. Answer keys were also developed for each
test form.
In the cover page of the test, instructions for students and examples indicating how to
record responses and change the response in case of any mistake on the test booklet were
also prepared.
1.2.10 Questionnaires
Questionnaires for class VIII (SLAS) were developed upon experience from the earlier
SLAS and NAS surveys. For this survey, three questionnaires were developed to collect
information on
a) school,
b) teacher, and
c) pupils.
The school and teacher questionnaires were produced in English medium only, as it was
considered that school principals and teachers are proficient in this language.
The pupil questionnaire was strongly influenced by NAS. The pupil questionnaire contained
questions pertaining to the home background of students. Areas touched upon included
parents’ level of education and occupation; help available at home for studies from parents
and siblings, the study materials and resources available at home. The questionnaire also
investigated the experience of pupils in school. This included questions about class work
and homework given by teachers, and whether they liked coming to school etc.
The school questionnaire sought information on the location, enrolment and structure of the
school; the number of school days, the school’s infrastructure and environment. Other
questions related to teachers’ job satisfaction and their professional development
opportunities, curriculum transaction strategies and problems existing in schools.
The teacher questionnaire comprised questions regarding the age of teachers, academic
and professional qualifications, training programmes attended, teaching and evaluation
State Learning Achievement Survey,Class VIII 2014-15
Page 9
practices, teaching materials available to them, interaction with other teachers and the
school head, and their job satisfaction.
1.3 The SLAS Sample
The class VIII (SLAS) was designed to investigate learning achievement in the Kandi, Bet,
Border and other area at the District level. Hence, the targeted population for the survey
was all class VIII children studying in government schools and government-aided
schools/recognized schools.
In general, the three-stage cluster design for sampling which logist of a combination of two
probability sampling methods. In the first stage, districts were selected, using purposely and
random sampling principles. This means that the probability of selecting a particular district
depended on the area selected. In the second stage, the requisite number of schools were
selected in the chosen districts; for this PPS principles were used so that large schools had
a higher probability of selection than small schools. In the third stage, the required numbers
of students in each school were selected using the Simple Random Sampling (SRS)
method. In schools where class VIII had multiple sections, an extra stage of selection was
added with one section being sampled at SRS.
In the survey, PPS sampling was based on class VIII enrolment data from the DISE. SRS
sampling was conducted according to the class registers available in sampled schools.
Although the DISE data was not free from criticism, it was used because it was considered
to be the most complete and up-to-date enrolment data available at the time of sampling.
Unfortunately, due to discrepancies in the DISE data, limitations in the sampling method
and loss of information at the sampling and administration stages of the survey, it was
impossible to estimate sample weights for the survey. Appendix I provide further details
about the sampling procedures of the survey.
1.4 Participating Districts and Sample Coverage
The survey was intended to cover all 22 districts, but Barnala, Bathinda, Fatehgarh,
Faridkot, Kapurthala, Mansa, Moga, Muktsar and S.B.S. Nagar could not participate in this
endeavor because of area classification. Among the 13 participating districts, we could not
test class VIII students because of beginning of academic year. Therefore, it was decided to
test class IX children (Target Group Class VIII).
Exclusions of sub-population from the total target population of SLAS class IX was made at
the initial stage of sampling. Large scale educational surveys allow such exclusions for
State Learning Achievement Survey,Class VIII 2014-15
Page 10
reasons such as ensuring administrative efficiency, as long as the excluded population
does not critically affect the quality of the survey. For example, the exclusion of very small
schools from a target population is often accepted. In addition to the small school exclusion,
the schools having fewer than 30 students were excluded. As a result of these exclusions,
population coverage of the class IX sample varies from district to district.
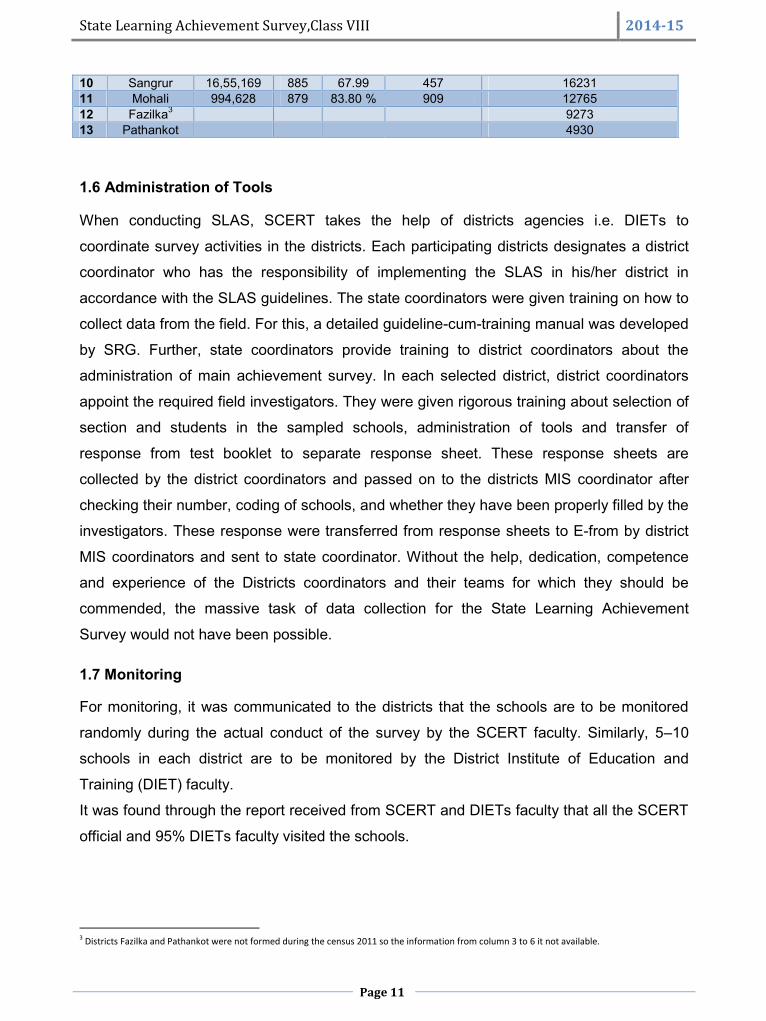
1.5 Characteristics of Participating Districts
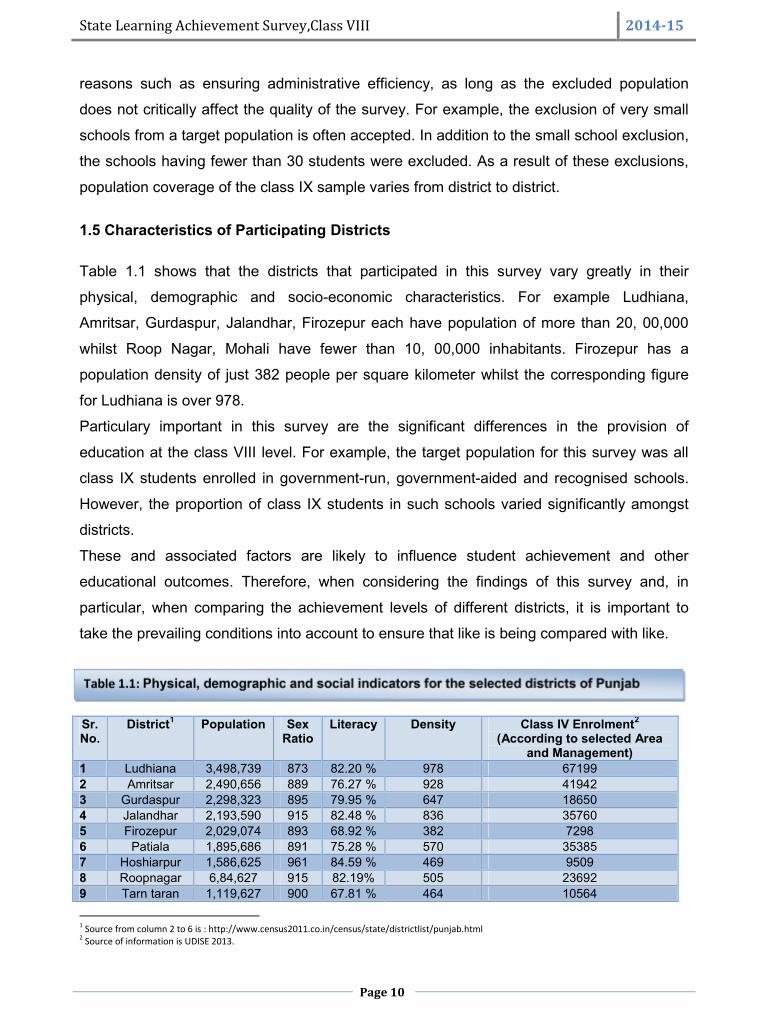
Table 1.1 shows that the districts that participated in this survey vary greatly in their
physical, demographic and socio-economic characteristics. For example Ludhiana,
Amritsar, Gurdaspur, Jalandhar, Firozepur each have population of more than 20, 00,000
whilst Roop Nagar, Mohali have fewer than 10, 00,000 inhabitants. Firozepur has a
population density of just 382 people per square kilometer whilst the corresponding figure
for Ludhiana is over 978.
Particulary important in this survey are the significant differences in the provision of
education at the class VIII level. For example, the target population for this survey was all
class IX students enrolled in government-run, government-aided and recognised schools.
However, the proportion of class IX students in such schools varied significantly amongst
districts.
These and associated factors are likely to influence student achievement and other
educational outcomes. Therefore, when considering the findings of this survey and, in
particular, when comparing the achievement levels of different districts, it is important to
take the prevailing conditions into account to ensure that like is being compared with like.
1 Source from column 2 to 6 is : http://www.census2011.co.in/census/state/districtlist/punjab.html2 Source of information is UDISE 2013.
Sr.No.
District1 Population SexRatio
Literacy Density Class IV Enrolment2
(According to selected Areaand Management)
1 Ludhiana 3,498,739 873 82.20 % 978 671992 Amritsar 2,490,656 889 76.27 % 928 419423 Gurdaspur 2,298,323 895 79.95 % 647 186504 Jalandhar 2,193,590 915 82.48 % 836 357605 Firozepur 2,029,074 893 68.92 % 382 72986 Patiala 1,895,686 891 75.28 % 570 353857 Hoshiarpur 1,586,625 961 84.59 % 469 95098 Roopnagar 6,84,627 915 82.19% 505 236929 Tarn taran 1,119,627 900 67.81 % 464 10564
Table 1.1: Physical, demographic and social indicators for the selected districts of Punjab
State Learning Achievement Survey,Class VIII 2014-15
Page 11
1.6 Administration of Tools
When conducting SLAS, SCERT takes the help of districts agencies i.e. DIETs to
coordinate survey activities in the districts. Each participating districts designates a district
coordinator who has the responsibility of implementing the SLAS in his/her district in
accordance with the SLAS guidelines. The state coordinators were given training on how to
collect data from the field. For this, a detailed guideline-cum-training manual was developed
by SRG. Further, state coordinators provide training to district coordinators about the
administration of main achievement survey. In each selected district, district coordinators
appoint the required field investigators. They were given rigorous training about selection of
section and students in the sampled schools, administration of tools and transfer of
response from test booklet to separate response sheet. These response sheets are
collected by the district coordinators and passed on to the districts MIS coordinator after
checking their number, coding of schools, and whether they have been properly filled by the
investigators. These response were transferred from response sheets to E-from by district
MIS coordinators and sent to state coordinator. Without the help, dedication, competence
and experience of the Districts coordinators and their teams for which they should be
commended, the massive task of data collection for the State Learning Achievement
Survey would not have been possible.
1.7 Monitoring
For monitoring, it was communicated to the districts that the schools are to be monitored
randomly during the actual conduct of the survey by the SCERT faculty. Similarly, 5–10
schools in each district are to be monitored by the District Institute of Education and
Training (DIET) faculty.
It was found through the report received from SCERT and DIETs faculty that all the SCERT
official and 95% DIETs faculty visited the schools.
3 Districts Fazilka and Pathankot were not formed during the census 2011 so the information from column 3 to 6 it not available.
10 Sangrur 16,55,169 885 67.99 457 1623111 Mohali 994,628 879 83.80 % 909 1276512 Fazilka3 927313 Pathankot 4930
State Learning Achievement Survey,Class VIII 2014-15
Page 12
1.8 Data Management
The transfer of data from paper forms to electronic format was done by the districts MIS
Coordinators. Data entry and data analysis plan were developed in the department keeping
in mind the objectives of the study. Both plans were provided to the State MIS Coordinators
for doing the assigned task in a systematic manner. The State MIS Coordinators provided
soft copy of the data entered. In the department, the SRG team checked and verified the
quality of the data and resolved problems of mismatching files. Files of clean data were
finalized for further analysis. Data analysis was carried out by using both Classical Test
Theory (CTT) and IRT (Item Response Theory). The analysis of data carried out is given in
next section.
1.9 Analysis of Data
In earlier surveys (By NCERT), the learning achievement data was analysed using CTT and
average scores were reported simply as the percentage of correct answers. This approach,
whilst valid, has significant limitations. In particular, the results are linked to particular tests
and groups of students so it was very difficult to use multiple tests or to link results from one
year to another. Therefore, it was decided to analyse the data for this and future surveys
using Item Response Theory (IRT) in addition to the classical approach.
As per the guidelines of the NCERT, the state has used IRT and CTT. In this survey, a
two-parameter logistic model was used (Appendix II).The main reason for administering the
tests in this study was to obtain an estimate of the overall ability of the students tested. IRT
assumes that there is a statistical connection between the difficulty of an item, the ability of
the student and the probability of being successful on the item. Students with higher ability
scale scores are more likely to succeed on any item than their peers of lower ability, while
all students are less likely to succeed on items with higher difficulty scores. In fact, a
student’s probability of success on a particular item is dependent on the difference between
the ability of the student and the difficulty of the item.
Whilst this method makes the analysis more complex than traditional method, it has many
advantages. Firstly, it places students and test items on the same numerical scale. This
enables us to produce meaningful ‘maps’ of items and students. Secondly, in IRT, the
difficulty parameter for an item does not depend on the group of test takers. This allows us
to use multiple test booklets which can be ‘linked’ or equated. This can also be used, to
State Learning Achievement Survey,Class VIII 2014-15
Page 13
compare scores from tests used in different years an essential characteristic for monitoring
progress over time.
SRG experts, after doing preliminary analyses, decided what kind of classical and IRT test
analyses would be used for the analysis of the full dataset received from 13 districts. Under
CTT, the performance of students on anchor items was carried out by computing
percentage correct scores and averages, standard deviations of test scores, and t-values
between different groups. Under IRT, a detailed analysis was carried out to determine the
scaled scores, standard errors, significant differences between the groups etc. The detail of
the IRT model used is provided in Appendix II.
1.10 Organisation of the ReportThe report contains 10 chapters and appendices.
Chapter 1 (Introduction): Chapter 1 describes the background of SLAS, Piloting, Tool
preparations, Sample and Methodology of survey etc.
Chapter 2 (Achievement in Language: Punjabi): In chapter 2 over all & district wise
achievement in Language of class VIII students is presented. In addition, information about
differences in achievement by students’ gender, school location and social category is also
provided.
Chapter 3 (What students know and can do: Punjabi): Chapter 3 describes what class
VIII students know and can do in Language (Reading Comprehension and Language
elements).
Chapter 4 (Achievement in Language: Mathematics): In chapters 4 over all & district
wise achievement in Mathematics of class VIII students is presented. In addition,
information about differences in achievement by students’ gender, school location and
social category is also provided.
Chapter 5 (What students know and can do: Mathematics): Chapter 5 describes what
class VIII students know and can do in Mathematics.
Chapter 6 (Achievement in Language: Science): In chapter 6 achievement in Science of
class VIII students is presented. Their achievement in Science is reported overall and
districts wise. In addition, information about differences in achievement by students’ gender,
school location and social category is also provided.
Chapter 7 (What students know and can do: Science): Chapter 7 describe what class
VIII students know and can do in Science.
Chapter 8 (Achievement in Language: Social Science): In chapter 8 over all & district
wise achievement in Social Science of class VIII students is presented. In addition,
State Learning Achievement Survey,Class VIII 2014-15
Page 14
information about differences in achievement by students’ gender, school location and
social category is also provided.
Chapter 9 (What students know and can do: Social Science): Chapter 9 describe what
class VIII students know and can do in Social Science.
Besides the above stated chapters, the report contains a number of appendices providing
more information about sample design and procedures, scaling the SLAS data and
estimating list of surveyed districts, schools, teachers and students, list of districts
coordinators etc.
1.11 LimitationsThis survey undoubtedly represents a significant step forward in the development of
education in Punjab. However, as with all such enterprises, lessons have been learnt. In
conducting the Class VIII SLAS, the following limitations have been noted so that they may
be addressed in future achievement surveys:
The survey used DISE 2013–14 data from the MIS- SSA Punjab as the primary
sample frame. Once in the field, significant discrepancies between the DISE data
and actual school enrolments were noticed.
Due to discrepancies in the sample frame, deviation from agreed sampling
procedures, and loss of information during administration, it was not possible to
estimate sample weights for the survey.
In all selected Districts, the coordinator was DIET's faculty. It was decided that the
field investigator should be chosen from the senior most class of DIET's. On
reflection, the training and hands-on practice given to these field investigators may
not have been sufficient resulting in inefficiencies in the data collection procedure.
In order to meet the key objectives of this survey, schools and students were
sampled in a systematic fashion, meant that teachers could not be explicitly
sampled. As a result, the analysis of teacher-related variables vis-à-vis student
attainment could not be made in a comprehensive manner.
In this survey SCERT also used IRT for analysis of results. Therefore, results are
reported in terms of scale scores rather than percentage. Whilst this is an important
step towards emulating international best practice, unfamiliarity with this approach
has undoubtedly made it more difficult for the lay reader to interpret results. It is
hoped that understanding will improve of IRT with time.
Difference between the research study and exam/test is not clear to the field.
State Learning Achievement Survey,Class VIII 2014-15
Page 15
Chapter 2Achievement in Language: Punjabi
(Keeping in mind listening, speaking, reading and writing skills):
The Language tests used in the SLAS included three categories of items ?. e reading
comprehension, ‘language-specific elements’ and grammar.
Overall achievement in language is reported for each of the participating districts. In
addition, information about differences in achievement by student gender, school location,
social category and is provided.
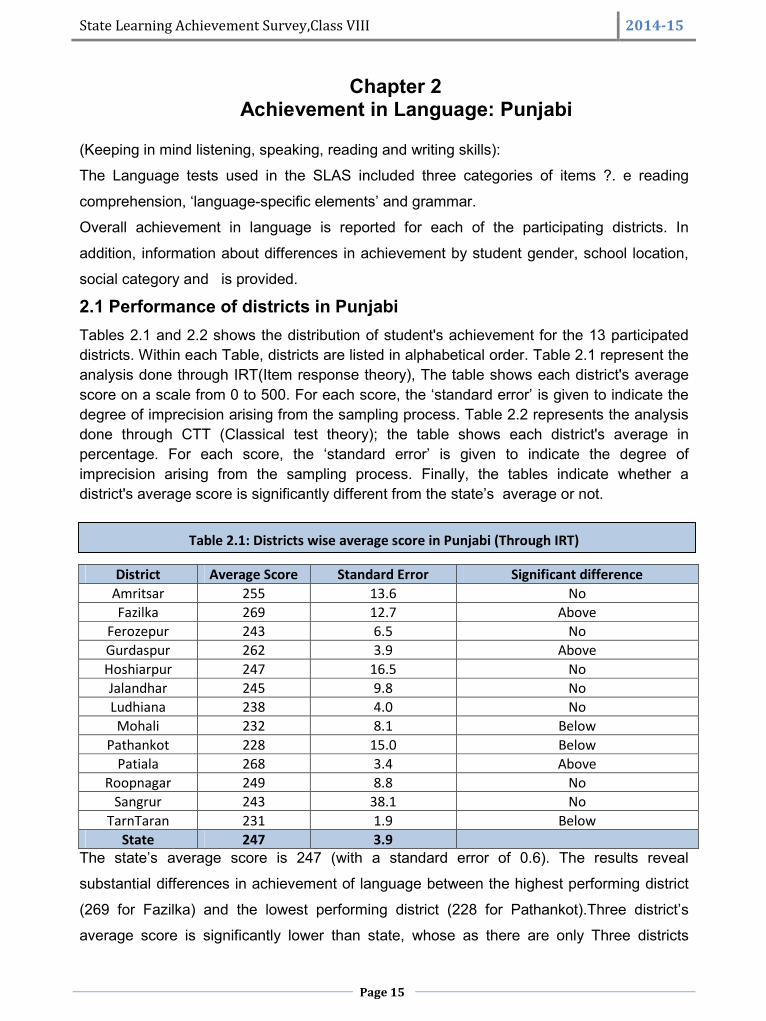
2.1 Performance of districts in PunjabiTables 2.1 and 2.2 shows the distribution of student's achievement for the 13 participateddistricts. Within each Table, districts are listed in alphabetical order. Table 2.1 represent theanalysis done through IRT(Item response theory), The table shows each district's averagescore on a scale from 0 to 500. For each score, the ‘standard error’ is given to indicate thedegree of imprecision arising from the sampling process. Table 2.2 represents the analysisdone through CTT (Classical test theory); the table shows each district's average inpercentage. For each score, the ‘standard error’ is given to indicate the degree ofimprecision arising from the sampling process. Finally, the tables indicate whether adistrict's average score is significantly different from the state’s average or not.
Table 2.1: Districts wise average score in Punjabi (Through IRT)
District Average Score Standard Error Significant differenceAmritsar 255 13.6 NoFazilka 269 12.7 Above
Ferozepur 243 6.5 NoGurdaspur 262 3.9 AboveHoshiarpur 247 16.5 NoJalandhar 245 9.8 NoLudhiana 238 4.0 NoMohali 232 8.1 Below
Pathankot 228 15.0 BelowPatiala 268 3.4 Above
Roopnagar 249 8.8 NoSangrur 243 38.1 No
TarnTaran 231 1.9 BelowState 247 3.9
The state’s average score is 247 (with a standard error of 0.6). The results reveal
substantial differences in achievement of language between the highest performing district
(269 for Fazilka) and the lowest performing district (228 for Pathankot).Three district’s
average score is significantly lower than state, whose as there are only Three districts
State Learning Achievement Survey,Class VIII 2014-15
Page 16
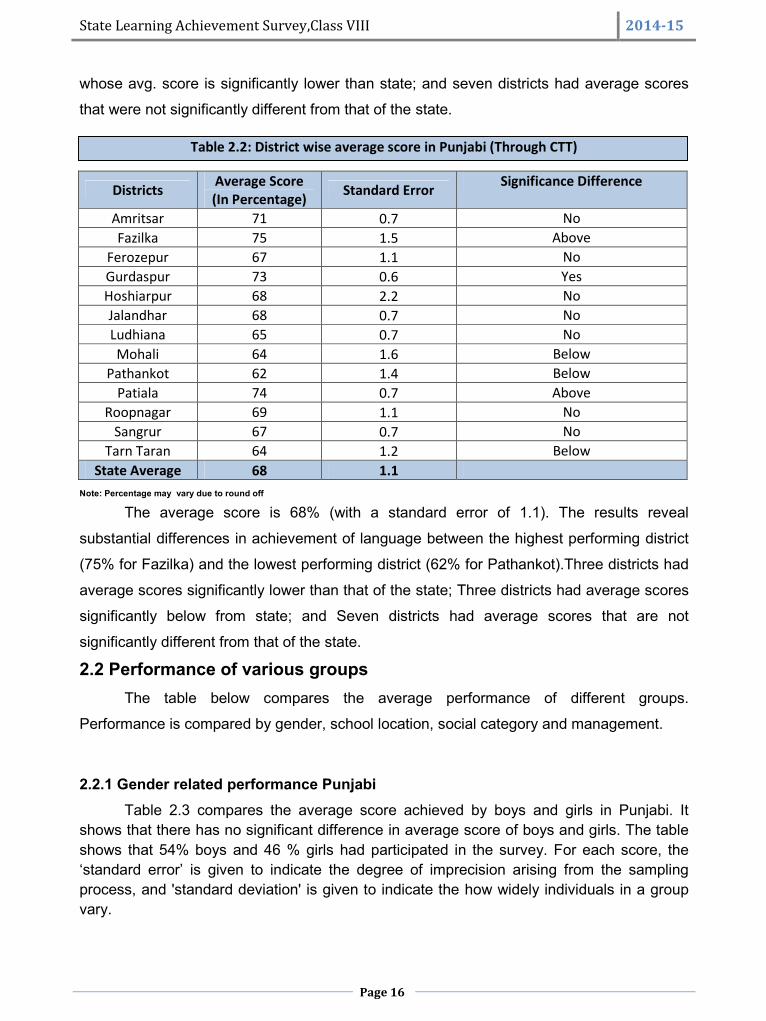
whose avg. score is significantly lower than state; and seven districts had average scores
that were not significantly different from that of the state.
Table 2.2: District wise average score in Punjabi (Through CTT)
Districts Average Score(In Percentage) Standard Error Significance Difference
Amritsar 71 0.7 NoFazilka 75 1.5 Above
Ferozepur 67 1.1 NoGurdaspur 73 0.6 YesHoshiarpur 68 2.2 NoJalandhar 68 0.7 NoLudhiana 65 0.7 NoMohali 64 1.6 Below
Pathankot 62 1.4 BelowPatiala 74 0.7 Above
Roopnagar 69 1.1 NoSangrur 67 0.7 No
Tarn Taran 64 1.2 BelowState Average 68 1.1
Note: Percentage may vary due to round off
The average score is 68% (with a standard error of 1.1). The results reveal
substantial differences in achievement of language between the highest performing district
(75% for Fazilka) and the lowest performing district (62% for Pathankot).Three districts had
average scores significantly lower than that of the state; Three districts had average scores
significantly below from state; and Seven districts had average scores that are not
significantly different from that of the state.
2.2 Performance of various groupsThe table below compares the average performance of different groups.
Performance is compared by gender, school location, social category and management.
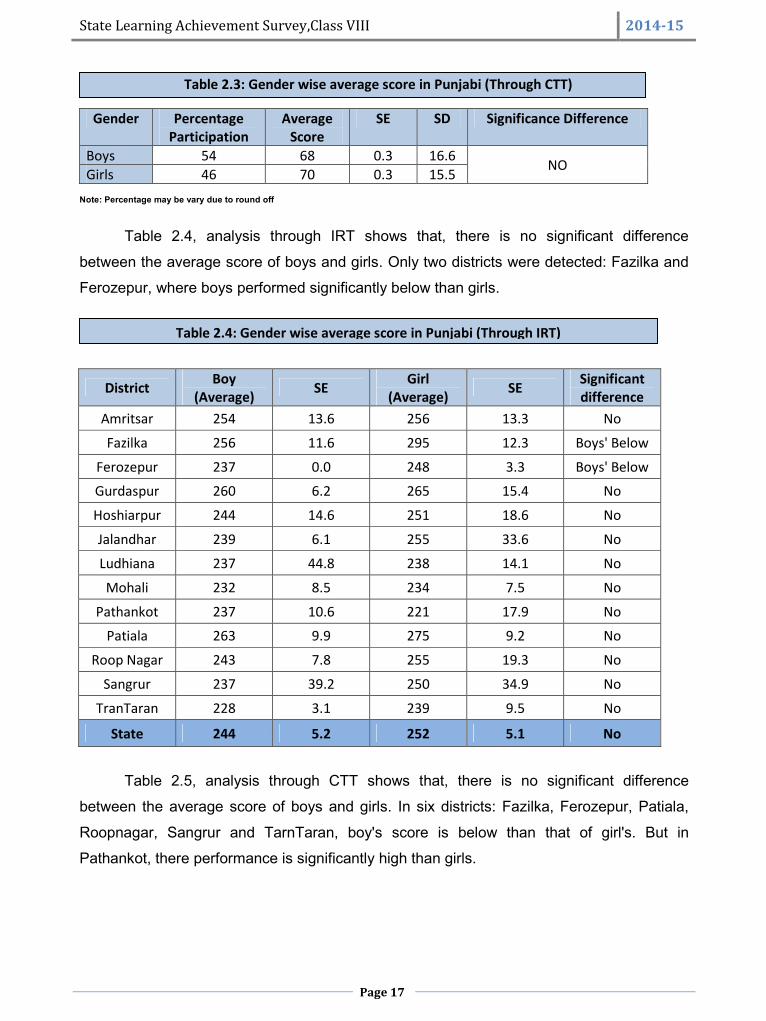
2.2.1 Gender related performance PunjabiTable 2.3 compares the average score achieved by boys and girls in Punjabi. It
shows that there has no significant difference in average score of boys and girls. The tableshows that 54% boys and 46 % girls had participated in the survey. For each score, the‘standard error’ is given to indicate the degree of imprecision arising from the samplingprocess, and 'standard deviation' is given to indicate the how widely individuals in a groupvary.
State Learning Achievement Survey,Class VIII 2014-15
Page 17
Table 2.4: Gender wise average score in Punjabi (Through IRT)
Table 2.3: Gender wise average score in Punjabi (Through CTT)
Gender PercentageParticipation
AverageScore
SE SD Significance Difference
Boys 54 68 0.3 16.6 NOGirls 46 70 0.3 15.5Note: Percentage may be vary due to round off
Table 2.4, analysis through IRT shows that, there is no significant difference
between the average score of boys and girls. Only two districts were detected: Fazilka and
Ferozepur, where boys performed significantly below than girls.
District Boy(Average) SE Girl
(Average) SE Significantdifference
Amritsar 254 13.6 256 13.3 No
Fazilka 256 11.6 295 12.3 Boys' Below
Ferozepur 237 0.0 248 3.3 Boys' Below
Gurdaspur 260 6.2 265 15.4 No
Hoshiarpur 244 14.6 251 18.6 No
Jalandhar 239 6.1 255 33.6 No
Ludhiana 237 44.8 238 14.1 No
Mohali 232 8.5 234 7.5 No
Pathankot 237 10.6 221 17.9 No
Patiala 263 9.9 275 9.2 No
Roop Nagar 243 7.8 255 19.3 No
Sangrur 237 39.2 250 34.9 No
TranTaran 228 3.1 239 9.5 No
State 244 5.2 252 5.1 No
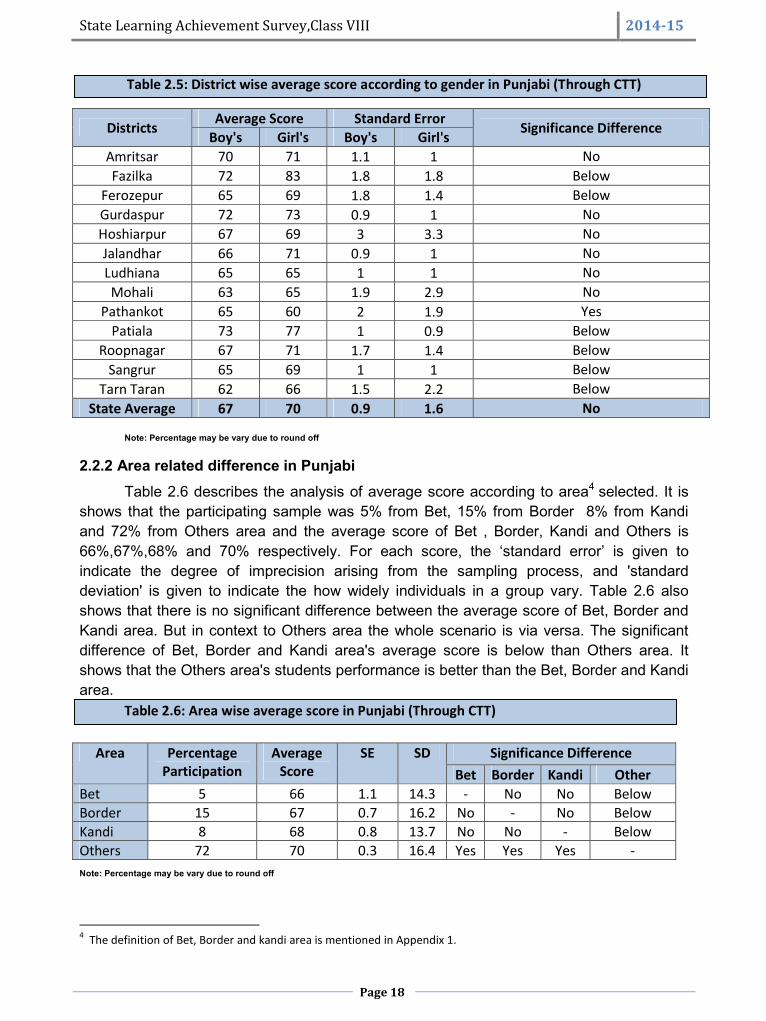
Table 2.5, analysis through CTT shows that, there is no significant difference
between the average score of boys and girls. In six districts: Fazilka, Ferozepur, Patiala,
Roopnagar, Sangrur and TarnTaran, boy's score is below than that of girl's. But in
Pathankot, there performance is significantly high than girls.
State Learning Achievement Survey,Class VIII 2014-15
Page 18
Table 2.5: District wise average score according to gender in Punjabi (Through CTT)
Districts Average Score Standard Error Significance DifferenceBoy's Girl's Boy's Girl'sAmritsar 70 71 1.1 1 NoFazilka 72 83 1.8 1.8 Below
Ferozepur 65 69 1.8 1.4 BelowGurdaspur 72 73 0.9 1 NoHoshiarpur 67 69 3 3.3 NoJalandhar 66 71 0.9 1 NoLudhiana 65 65 1 1 NoMohali 63 65 1.9 2.9 No
Pathankot 65 60 2 1.9 YesPatiala 73 77 1 0.9 Below
Roopnagar 67 71 1.7 1.4 BelowSangrur 65 69 1 1 Below
Tarn Taran 62 66 1.5 2.2 BelowState Average 67 70 0.9 1.6 No
Note: Percentage may be vary due to round off
2.2.2 Area related difference in PunjabiTable 2.6 describes the analysis of average score according to area4 selected. It is
shows that the participating sample was 5% from Bet, 15% from Border 8% from Kandiand 72% from Others area and the average score of Bet , Border, Kandi and Others is66%,67%,68% and 70% respectively. For each score, the ‘standard error’ is given toindicate the degree of imprecision arising from the sampling process, and 'standarddeviation' is given to indicate the how widely individuals in a group vary. Table 2.6 alsoshows that there is no significant difference between the average score of Bet, Border andKandi area. But in context to Others area the whole scenario is via versa. The significantdifference of Bet, Border and Kandi area's average score is below than Others area. Itshows that the Others area's students performance is better than the Bet, Border and Kandiarea.
Table 2.6: Area wise average score in Punjabi (Through CTT)
Area PercentageParticipation
AverageScore
SE SD Significance DifferenceBet Border Kandi Other
Bet 5 66 1.1 14.3 - No No BelowBorder 15 67 0.7 16.2 No - No BelowKandi 8 68 0.8 13.7 No No - BelowOthers 72 70 0.3 16.4 Yes Yes Yes -Note: Percentage may be vary due to round off
4 The definition of Bet, Border and kandi area is mentioned in Appendix 1.
State Learning Achievement Survey,Class VIII 2014-15
Page 19
Table 2.7: Area wise average score in Punjabi (Through IRT)
Table 2.8: District wise average score according to Area in Punjabi (Through CTT)
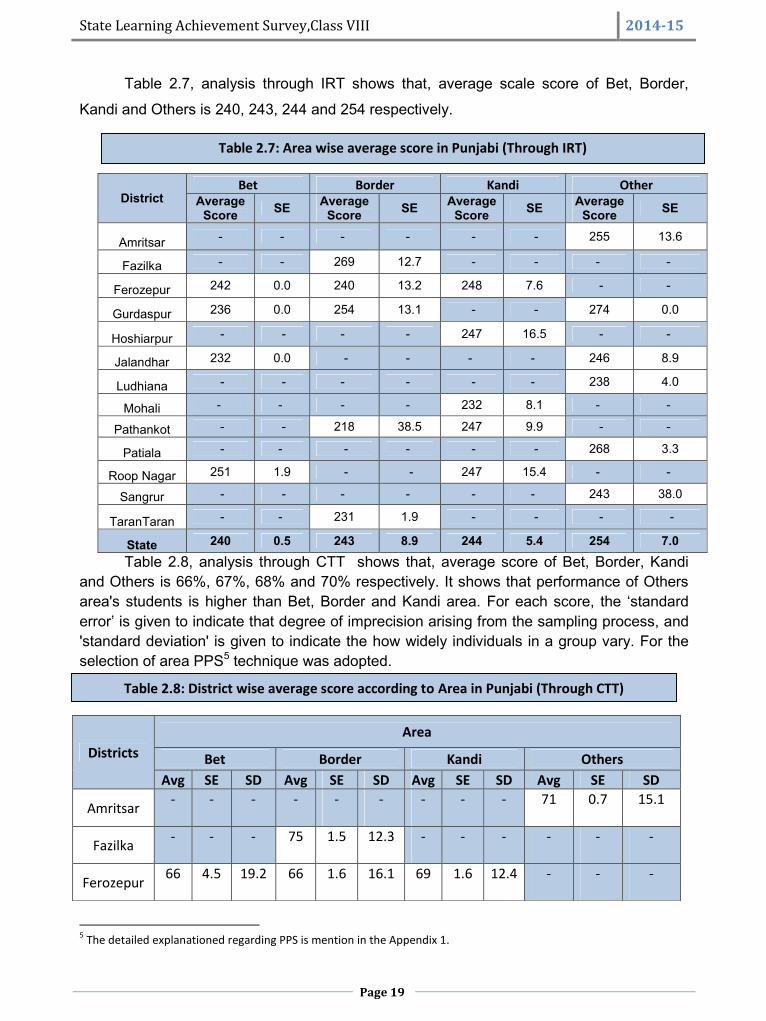
Table 2.7, analysis through IRT shows that, average scale score of Bet, Border,
Kandi and Others is 240, 243, 244 and 254 respectively.
Table 2.8, analysis through CTT shows that, average score of Bet, Border, Kandiand Others is 66%, 67%, 68% and 70% respectively. It shows that performance of Othersarea's students is higher than Bet, Border and Kandi area. For each score, the ‘standarderror’ is given to indicate that degree of imprecision arising from the sampling process, and'standard deviation' is given to indicate the how widely individuals in a group vary. For theselection of area PPS5 technique was adopted.
5 The detailed explanationed regarding PPS is mention in the Appendix 1.
DistrictBet Border Kandi Other
AverageScore SE Average
Score SE AverageScore SE Average
Score SE
Amritsar - - - - - - 255 13.6
Fazilka - - 269 12.7 - - - -
Ferozepur 242 0.0 240 13.2 248 7.6 - -
Gurdaspur 236 0.0 254 13.1 - - 274 0.0
Hoshiarpur - - - - 247 16.5 - -
Jalandhar 232 0.0 - - - - 246 8.9
Ludhiana - - - - - - 238 4.0
Mohali - - - - 232 8.1 - -
Pathankot - - 218 38.5 247 9.9 - -
Patiala - - - - - - 268 3.3
Roop Nagar 251 1.9 - - 247 15.4 - -
Sangrur - - - - - - 243 38.0
TaranTaran - - 231 1.9 - - - -
State 240 0.5 243 8.9 244 5.4 254 7.0
DistrictsArea
Bet Border Kandi OthersAvg SE SD Avg SE SD Avg SE SD Avg SE SD
Amritsar - - - - - - - - - 71 0.7 15.1
Fazilka - - - 75 1.5 12.3 - - - - - -
Ferozepur 66 4.5 19.2 66 1.6 16.1 69 1.6 12.4 - - -
State Learning Achievement Survey,Class VIII 2014-15
Page 20
Note: Percentage may be vary due to round off
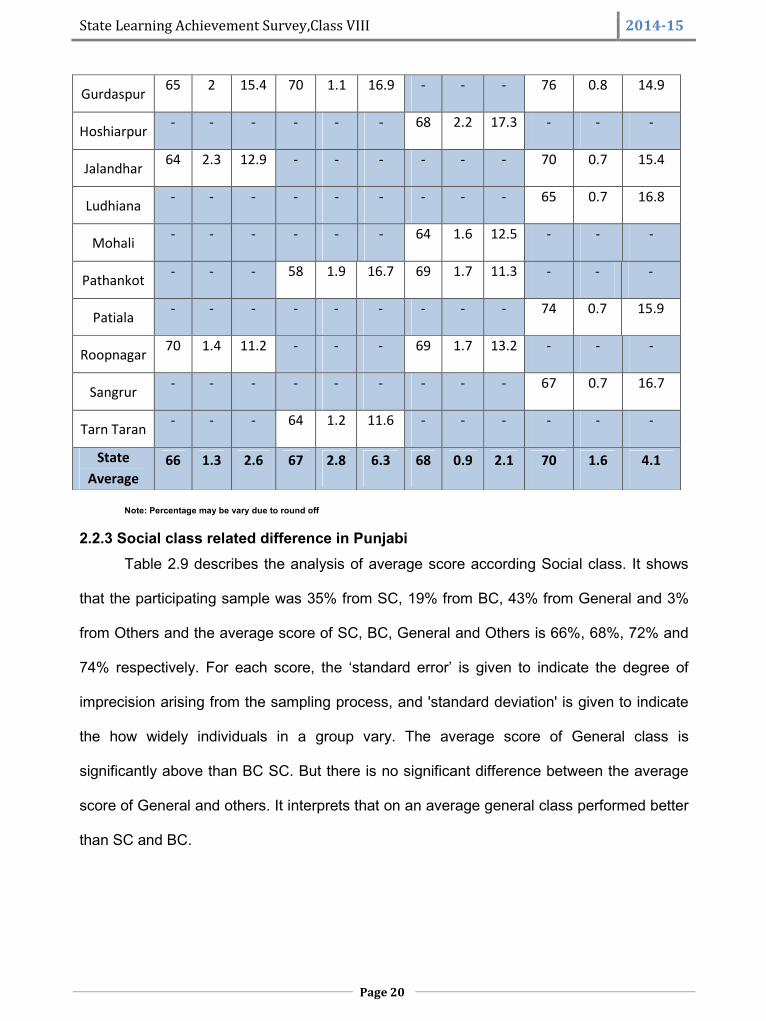
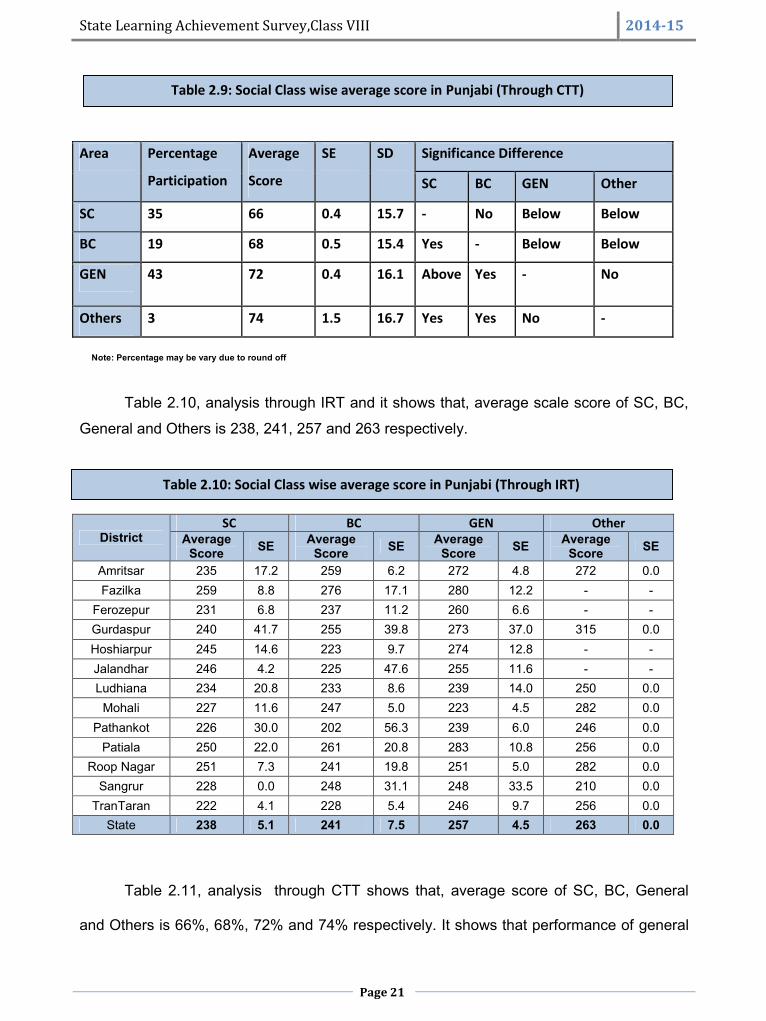
2.2.3 Social class related difference in PunjabiTable 2.9 describes the analysis of average score according Social class. It shows
that the participating sample was 35% from SC, 19% from BC, 43% from General and 3%
from Others and the average score of SC, BC, General and Others is 66%, 68%, 72% and
74% respectively. For each score, the ‘standard error’ is given to indicate the degree of
imprecision arising from the sampling process, and 'standard deviation' is given to indicate
the how widely individuals in a group vary. The average score of General class is
significantly above than BC SC. But there is no significant difference between the average
score of General and others. It interprets that on an average general class performed better
than SC and BC.
Gurdaspur 65 2 15.4 70 1.1 16.9 - - - 76 0.8 14.9
Hoshiarpur - - - - - - 68 2.2 17.3 - - -
Jalandhar 64 2.3 12.9 - - - - - - 70 0.7 15.4
Ludhiana - - - - - - - - - 65 0.7 16.8
Mohali - - - - - - 64 1.6 12.5 - - -
Pathankot - - - 58 1.9 16.7 69 1.7 11.3 - - -
Patiala - - - - - - - - - 74 0.7 15.9
Roopnagar 70 1.4 11.2 - - - 69 1.7 13.2 - - -
Sangrur - - - - - - - - - 67 0.7 16.7
Tarn Taran - - - 64 1.2 11.6 - - - - - -
StateAverage
66 1.3 2.6 67 2.8 6.3 68 0.9 2.1 70 1.6 4.1
State Learning Achievement Survey,Class VIII 2014-15
Page 21
Table 2.9: Social Class wise average score in Punjabi (Through CTT)
Note: Percentage may be vary due to round off
Table 2.10, analysis through IRT and it shows that, average scale score of SC, BC,
General and Others is 238, 241, 257 and 263 respectively.
DistrictSC BC GEN Other
AverageScore SE Average
Score SE AverageScore SE Average
Score SE
Amritsar 235 17.2 259 6.2 272 4.8 272 0.0Fazilka 259 8.8 276 17.1 280 12.2 - -
Ferozepur 231 6.8 237 11.2 260 6.6 - -Gurdaspur 240 41.7 255 39.8 273 37.0 315 0.0Hoshiarpur 245 14.6 223 9.7 274 12.8 - -Jalandhar 246 4.2 225 47.6 255 11.6 - -Ludhiana 234 20.8 233 8.6 239 14.0 250 0.0
Mohali 227 11.6 247 5.0 223 4.5 282 0.0Pathankot 226 30.0 202 56.3 239 6.0 246 0.0
Patiala 250 22.0 261 20.8 283 10.8 256 0.0Roop Nagar 251 7.3 241 19.8 251 5.0 282 0.0
Sangrur 228 0.0 248 31.1 248 33.5 210 0.0TranTaran 222 4.1 228 5.4 246 9.7 256 0.0
State 238 5.1 241 7.5 257 4.5 263 0.0
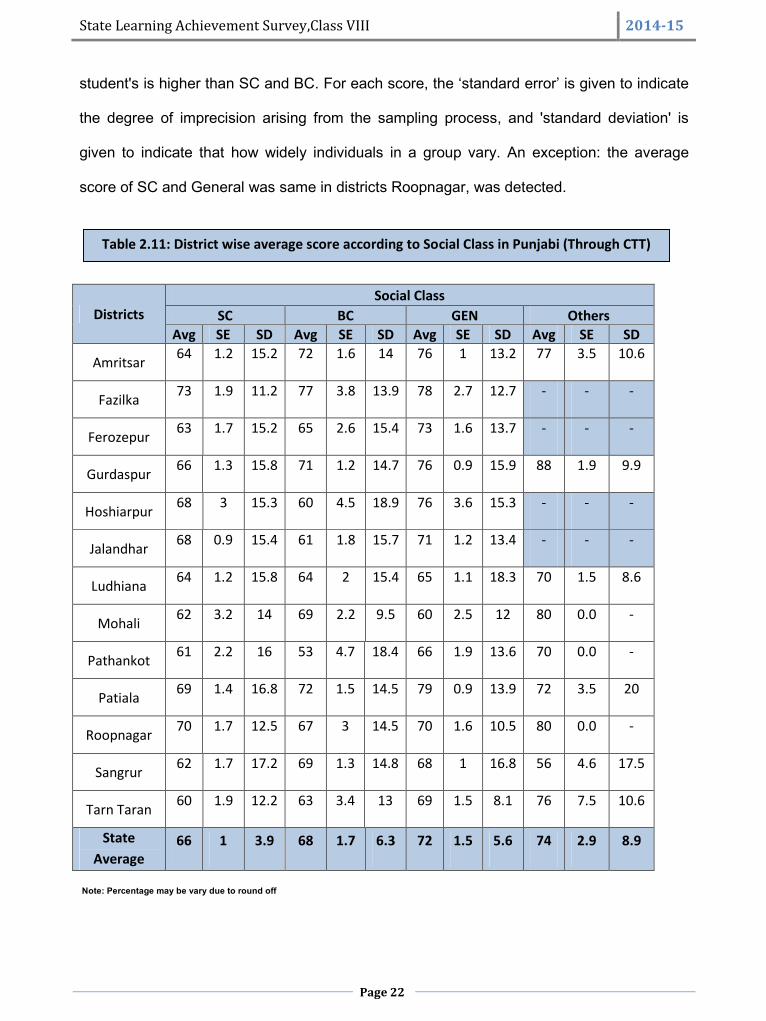
Table 2.11, analysis through CTT shows that, average score of SC, BC, General
and Others is 66%, 68%, 72% and 74% respectively. It shows that performance of general
Area Percentage
Participation
Average
Score
SE SD Significance Difference
SC BC GEN Other
SC 35 66 0.4 15.7 - No Below Below
BC 19 68 0.5 15.4 Yes - Below Below
GEN 43 72 0.4 16.1 Above Yes - No
Others 3 74 1.5 16.7 Yes Yes No -
Table 2.10: Social Class wise average score in Punjabi (Through IRT)
State Learning Achievement Survey,Class VIII 2014-15
Page 22
Table 2.11: District wise average score according to Social Class in Punjabi (Through CTT)
student's is higher than SC and BC. For each score, the ‘standard error’ is given to indicate
the degree of imprecision arising from the sampling process, and 'standard deviation' is
given to indicate that how widely individuals in a group vary. An exception: the average
score of SC and General was same in districts Roopnagar, was detected.
DistrictsSocial Class
SC BC GEN OthersAvg SE SD Avg SE SD Avg SE SD Avg SE SD
Amritsar 64 1.2 15.2 72 1.6 14 76 1 13.2 77 3.5 10.6
Fazilka 73 1.9 11.2 77 3.8 13.9 78 2.7 12.7 - - -
Ferozepur 63 1.7 15.2 65 2.6 15.4 73 1.6 13.7 - - -
Gurdaspur 66 1.3 15.8 71 1.2 14.7 76 0.9 15.9 88 1.9 9.9
Hoshiarpur 68 3 15.3 60 4.5 18.9 76 3.6 15.3 - - -
Jalandhar 68 0.9 15.4 61 1.8 15.7 71 1.2 13.4 - - -
Ludhiana 64 1.2 15.8 64 2 15.4 65 1.1 18.3 70 1.5 8.6
Mohali 62 3.2 14 69 2.2 9.5 60 2.5 12 80 0.0 -
Pathankot 61 2.2 16 53 4.7 18.4 66 1.9 13.6 70 0.0 -
Patiala 69 1.4 16.8 72 1.5 14.5 79 0.9 13.9 72 3.5 20
Roopnagar 70 1.7 12.5 67 3 14.5 70 1.6 10.5 80 0.0 -
Sangrur 62 1.7 17.2 69 1.3 14.8 68 1 16.8 56 4.6 17.5
Tarn Taran 60 1.9 12.2 63 3.4 13 69 1.5 8.1 76 7.5 10.6
StateAverage
66 1 3.9 68 1.7 6.3 72 1.5 5.6 74 2.9 8.9
Note: Percentage may be vary due to round off
State Learning Achievement Survey,Class VIII 2014-15
Page 23
Table 2.12: Management wise average score in Punjabi (Through CTT)
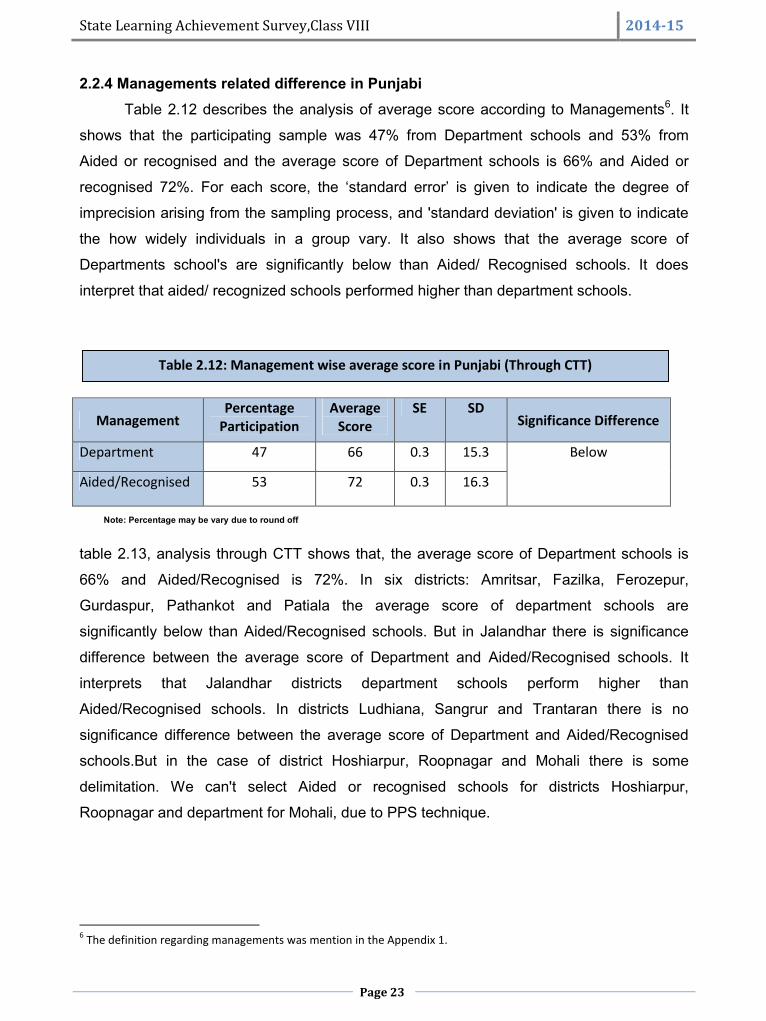
2.2.4 Managements related difference in PunjabiTable 2.12 describes the analysis of average score according to Managements6. It
shows that the participating sample was 47% from Department schools and 53% from
Aided or recognised and the average score of Department schools is 66% and Aided or
recognised 72%. For each score, the ‘standard error’ is given to indicate the degree of
imprecision arising from the sampling process, and 'standard deviation' is given to indicate
the how widely individuals in a group vary. It also shows that the average score of
Departments school's are significantly below than Aided/ Recognised schools. It does
interpret that aided/ recognized schools performed higher than department schools.
ManagementPercentage
ParticipationAverage
ScoreSE SD
Significance Difference
Department 47 66 0.3 15.3 Below
Aided/Recognised 53 72 0.3 16.3
Note: Percentage may be vary due to round off
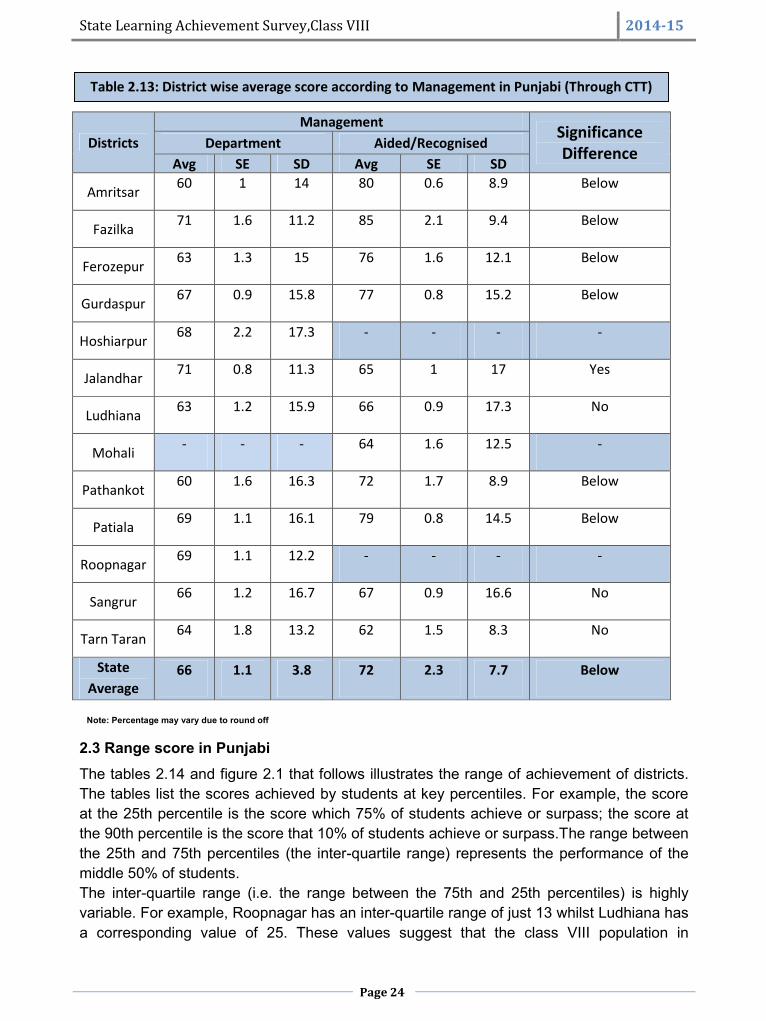
table 2.13, analysis through CTT shows that, the average score of Department schools is
66% and Aided/Recognised is 72%. In six districts: Amritsar, Fazilka, Ferozepur,
Gurdaspur, Pathankot and Patiala the average score of department schools are
significantly below than Aided/Recognised schools. But in Jalandhar there is significance
difference between the average score of Department and Aided/Recognised schools. It
interprets that Jalandhar districts department schools perform higher than
Aided/Recognised schools. In districts Ludhiana, Sangrur and Trantaran there is no
significance difference between the average score of Department and Aided/Recognised
schools.But in the case of district Hoshiarpur, Roopnagar and Mohali there is some
delimitation. We can't select Aided or recognised schools for districts Hoshiarpur,
Roopnagar and department for Mohali, due to PPS technique.
6 The definition regarding managements was mention in the Appendix 1.
State Learning Achievement Survey,Class VIII 2014-15
Page 24
Table 2.13: District wise average score according to Management in Punjabi (Through CTT)
DistrictsManagement Significance
DifferenceDepartment Aided/RecognisedAvg SE SD Avg SE SD
Amritsar 60 1 14 80 0.6 8.9 Below
Fazilka 71 1.6 11.2 85 2.1 9.4 Below
Ferozepur 63 1.3 15 76 1.6 12.1 Below
Gurdaspur 67 0.9 15.8 77 0.8 15.2 Below
Hoshiarpur 68 2.2 17.3 - - - -
Jalandhar 71 0.8 11.3 65 1 17 Yes
Ludhiana 63 1.2 15.9 66 0.9 17.3 No
Mohali - - - 64 1.6 12.5 -
Pathankot 60 1.6 16.3 72 1.7 8.9 Below
Patiala 69 1.1 16.1 79 0.8 14.5 Below
Roopnagar 69 1.1 12.2 - - - -
Sangrur 66 1.2 16.7 67 0.9 16.6 No
Tarn Taran 64 1.8 13.2 62 1.5 8.3 No
StateAverage
66 1.1 3.8 72 2.3 7.7 Below
Note: Percentage may vary due to round off
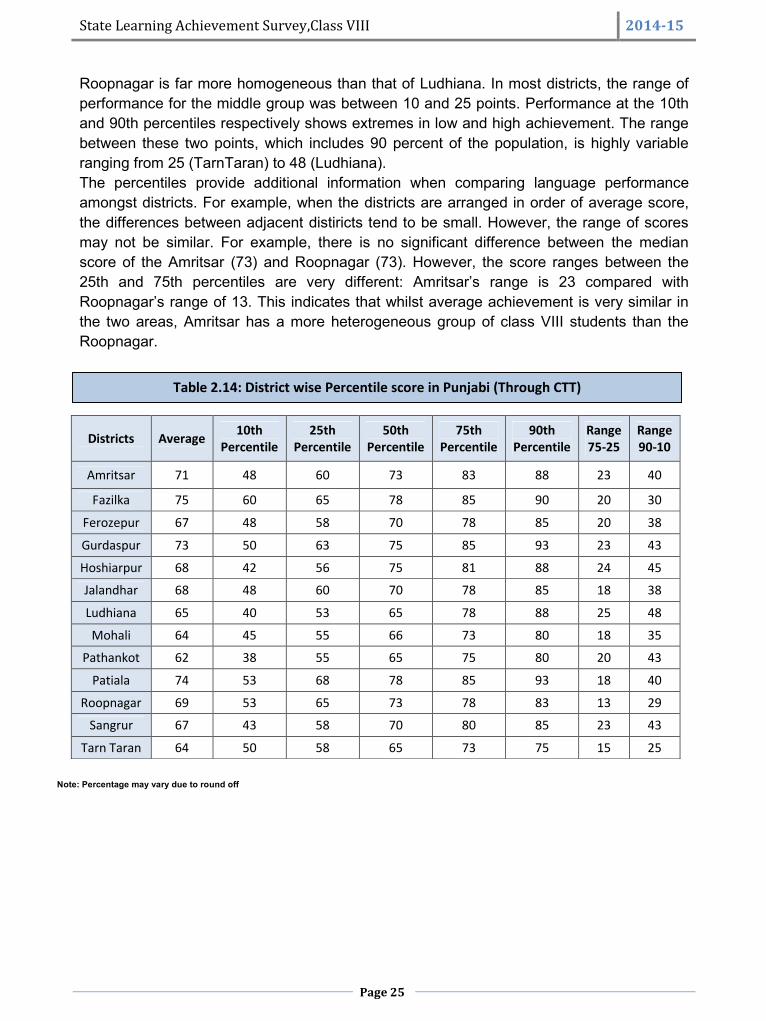
2.3 Range score in PunjabiThe tables 2.14 and figure 2.1 that follows illustrates the range of achievement of districts.The tables list the scores achieved by students at key percentiles. For example, the scoreat the 25th percentile is the score which 75% of students achieve or surpass; the score atthe 90th percentile is the score that 10% of students achieve or surpass.The range betweenthe 25th and 75th percentiles (the inter-quartile range) represents the performance of themiddle 50% of students.The inter-quartile range (i.e. the range between the 75th and 25th percentiles) is highlyvariable. For example, Roopnagar has an inter-quartile range of just 13 whilst Ludhiana hasa corresponding value of 25. These values suggest that the class VIII population in
State Learning Achievement Survey,Class VIII 2014-15
Page 25
Table 2.14: District wise Percentile score in Punjabi (Through CTT)
Roopnagar is far more homogeneous than that of Ludhiana. In most districts, the range ofperformance for the middle group was between 10 and 25 points. Performance at the 10thand 90th percentiles respectively shows extremes in low and high achievement. The rangebetween these two points, which includes 90 percent of the population, is highly variableranging from 25 (TarnTaran) to 48 (Ludhiana).The percentiles provide additional information when comparing language performanceamongst districts. For example, when the districts are arranged in order of average score,the differences between adjacent distiricts tend to be small. However, the range of scoresmay not be similar. For example, there is no significant difference between the medianscore of the Amritsar (73) and Roopnagar (73). However, the score ranges between the25th and 75th percentiles are very different: Amritsar’s range is 23 compared withRoopnagar’s range of 13. This indicates that whilst average achievement is very similar inthe two areas, Amritsar has a more heterogeneous group of class VIII students than theRoopnagar.
Note: Percentage may vary due to round off
Districts Average 10thPercentile
25thPercentile
50thPercentile
75thPercentile
90thPercentile
Range75-25
Range90-10
Amritsar 71 48 60 73 83 88 23 40
Fazilka 75 60 65 78 85 90 20 30
Ferozepur 67 48 58 70 78 85 20 38
Gurdaspur 73 50 63 75 85 93 23 43
Hoshiarpur 68 42 56 75 81 88 24 45
Jalandhar 68 48 60 70 78 85 18 38
Ludhiana 65 40 53 65 78 88 25 48
Mohali 64 45 55 66 73 80 18 35
Pathankot 62 38 55 65 75 80 20 43
Patiala 74 53 68 78 85 93 18 40
Roopnagar 69 53 65 73 78 83 13 29
Sangrur 67 43 58 70 80 85 23 43
Tarn Taran 64 50 58 65 73 75 15 25
State Learning Achievement Survey,Class VIII 2014-15
Page 26
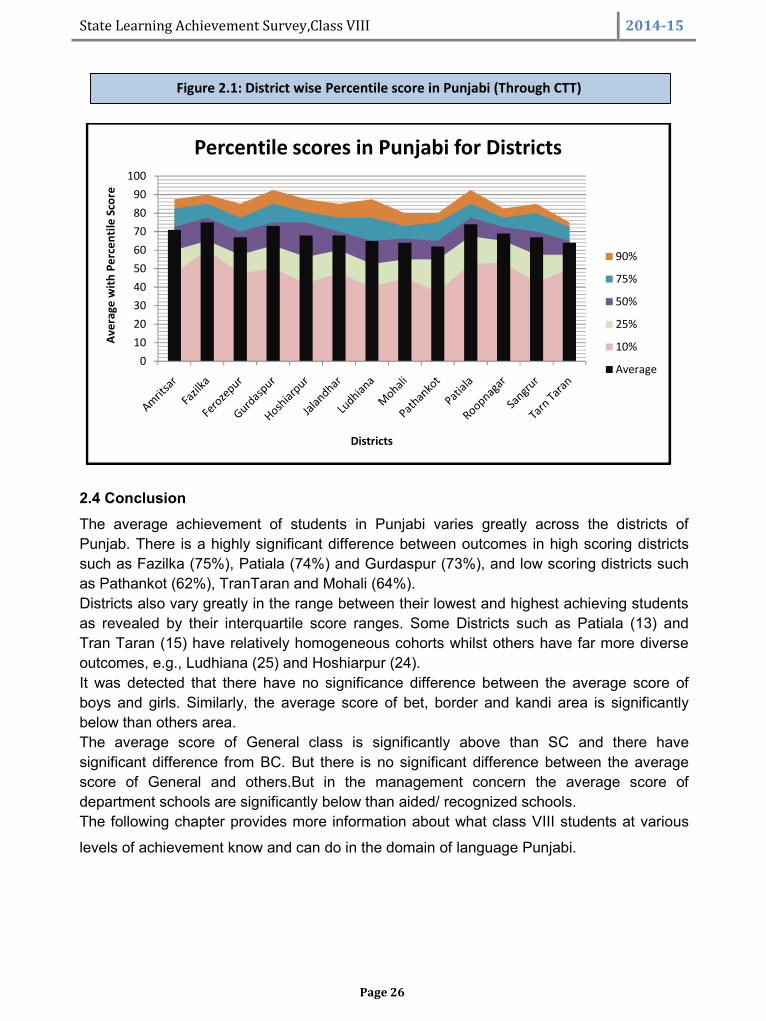
Figure 2.1: District wise Percentile score in Punjabi (Through CTT)
2.4 ConclusionThe average achievement of students in Punjabi varies greatly across the districts ofPunjab. There is a highly significant difference between outcomes in high scoring districtssuch as Fazilka (75%), Patiala (74%) and Gurdaspur (73%), and low scoring districts suchas Pathankot (62%), TranTaran and Mohali (64%).Districts also vary greatly in the range between their lowest and highest achieving studentsas revealed by their interquartile score ranges. Some Districts such as Patiala (13) andTran Taran (15) have relatively homogeneous cohorts whilst others have far more diverseoutcomes, e.g., Ludhiana (25) and Hoshiarpur (24).It was detected that there have no significance difference between the average score ofboys and girls. Similarly, the average score of bet, border and kandi area is significantlybelow than others area.The average score of General class is significantly above than SC and there havesignificant difference from BC. But there is no significant difference between the averagescore of General and others.But in the management concern the average score ofdepartment schools are significantly below than aided/ recognized schools.The following chapter provides more information about what class VIII students at various
levels of achievement know and can do in the domain of language Punjabi.
0102030405060708090
100
Aver
age
with
Per
cent
ile S
core
Districts
Percentile scores in Punjabi for Districts
90%
75%
50%
25%
10%
Average
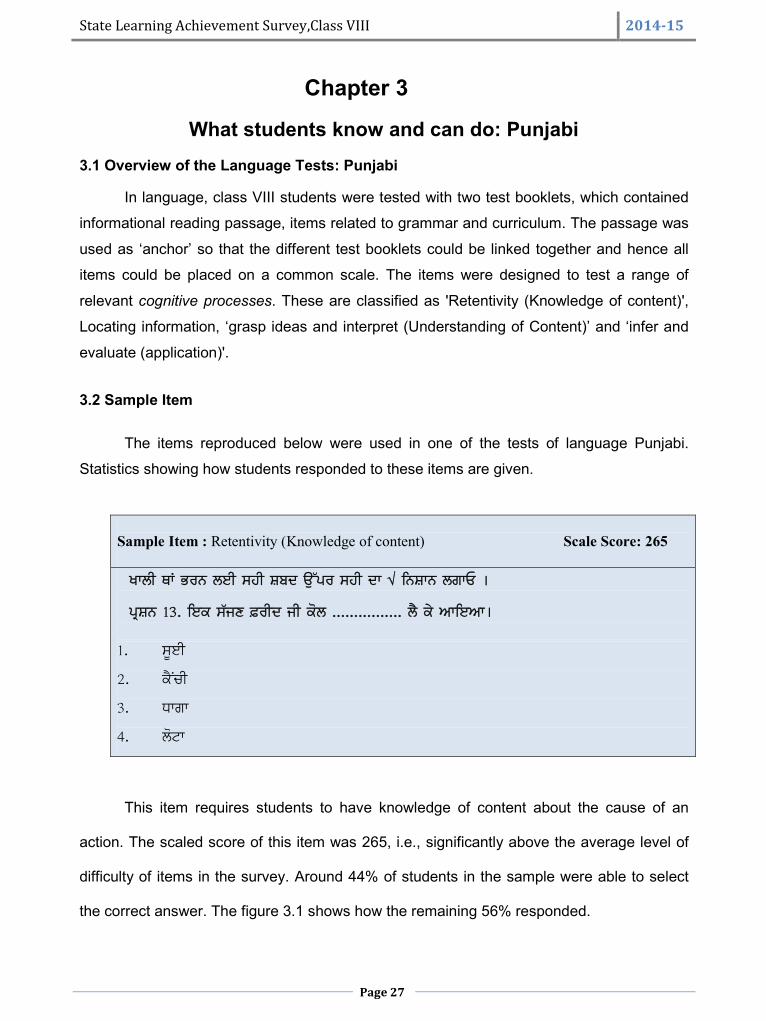
State Learning Achievement Survey,Class VIII 2014-15
Page 27
Chapter 3
What students know and can do: Punjabi3.1 Overview of the Language Tests: Punjabi
In language, class VIII students were tested with two test booklets, which contained
informational reading passage, items related to grammar and curriculum. The passage was
used as ‘anchor’ so that the different test booklets could be linked together and hence all
items could be placed on a common scale. The items were designed to test a range of
relevant cognitive processes. These are classified as 'Retentivity (Knowledge of content)',
Locating information, ‘grasp ideas and interpret (Understanding of Content)’ and ‘infer and
evaluate (application)'.
3.2 Sample Item
The items reproduced below were used in one of the tests of language Punjabi.
Statistics showing how students responded to these items are given.
This item requires students to have knowledge of content about the cause of an
action. The scaled score of this item was 265, i.e., significantly above the average level of
difficulty of items in the survey. Around 44% of students in the sample were able to select
the correct answer. The figure 3.1 shows how the remaining 56% responded.
Sample Item : Retentivity (Knowledge of content) Scale Score: 265
ykbh EK GoB bJh ;jh Ppd T[~go ;jh dk √ fBPkB brkU .
gqPB 13H fJe ;ZiD |ohd ih e'b HHHHHHHHHHHHHHHH b? e/ nkfJnk.
1H ;{Jh
2H e?Auh
3H Xkrk
4H b'Nk
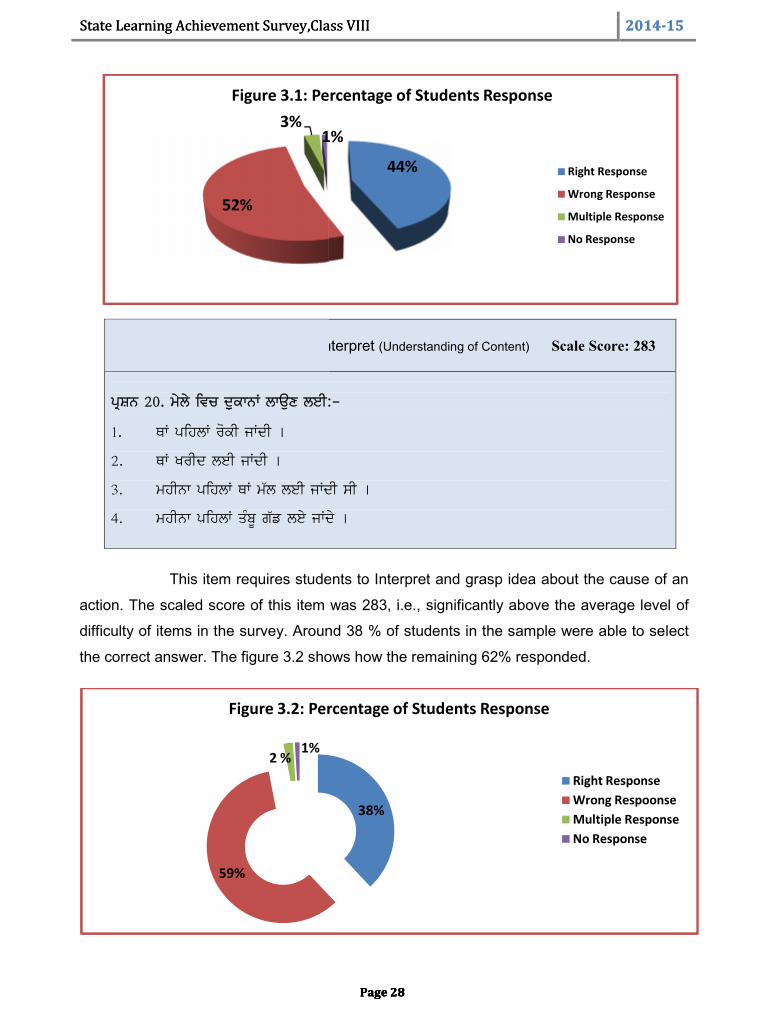
State Learning Achievement Survey,Class VIII 2014-15
Page 28
Sample Item: grasps ideas and interpret (Understanding of Content) Scale Score: 283
gqPB 20H w/b/ ftu d[[ekBK bkT[D bJhL^
1H EK gfjbK o'eh iKdh .
2H EK yohd bJh iKdh .
3H wjhBk gfjbK EK wZb bJh iKdh ;h .
4H wjhBk gfjbK szp{ rZv bJ/ iKd/ .
This item requires students to Interpret and grasp idea about the cause of an
action. The scaled score of this item was 283, i.e., significantly above the average level of
difficulty of items in the survey. Around 38 % of students in the sample were able to select
the correct answer. The figure 3.2 shows how the remaining 62% responded.
52%
3%1%
Figure 3.1: Percentage of Students Response
59%
2 %1%
Figure 3.2: Percentage of Students Response
State Learning Achievement Survey,Class VIII 2014-15
Page 28
Sample Item: grasps ideas and interpret (Understanding of Content) Scale Score: 283
gqPB 20H w/b/ ftu d[[ekBK bkT[D bJhL^
1H EK gfjbK o'eh iKdh .
2H EK yohd bJh iKdh .
3H wjhBk gfjbK EK wZb bJh iKdh ;h .
4H wjhBk gfjbK szp{ rZv bJ/ iKd/ .
This item requires students to Interpret and grasp idea about the cause of an
action. The scaled score of this item was 283, i.e., significantly above the average level of
difficulty of items in the survey. Around 38 % of students in the sample were able to select
the correct answer. The figure 3.2 shows how the remaining 62% responded.
44%
1%
Figure 3.1: Percentage of Students Response
Right Response
Wrong Response
Multiple Response
No Response
38%
Figure 3.2: Percentage of Students Response
Right ResponseWrong RespoonseMultiple ResponseNo Response
State Learning Achievement Survey,Class VIII 2014-15
Page 28
Sample Item: grasps ideas and interpret (Understanding of Content) Scale Score: 283
gqPB 20H w/b/ ftu d[[ekBK bkT[D bJhL^
1H EK gfjbK o'eh iKdh .
2H EK yohd bJh iKdh .
3H wjhBk gfjbK EK wZb bJh iKdh ;h .
4H wjhBk gfjbK szp{ rZv bJ/ iKd/ .
This item requires students to Interpret and grasp idea about the cause of an
action. The scaled score of this item was 283, i.e., significantly above the average level of
difficulty of items in the survey. Around 38 % of students in the sample were able to select
the correct answer. The figure 3.2 shows how the remaining 62% responded.
Right Response
Wrong Response
Multiple Response
No Response
Right ResponseWrong RespoonseMultiple ResponseNo Response
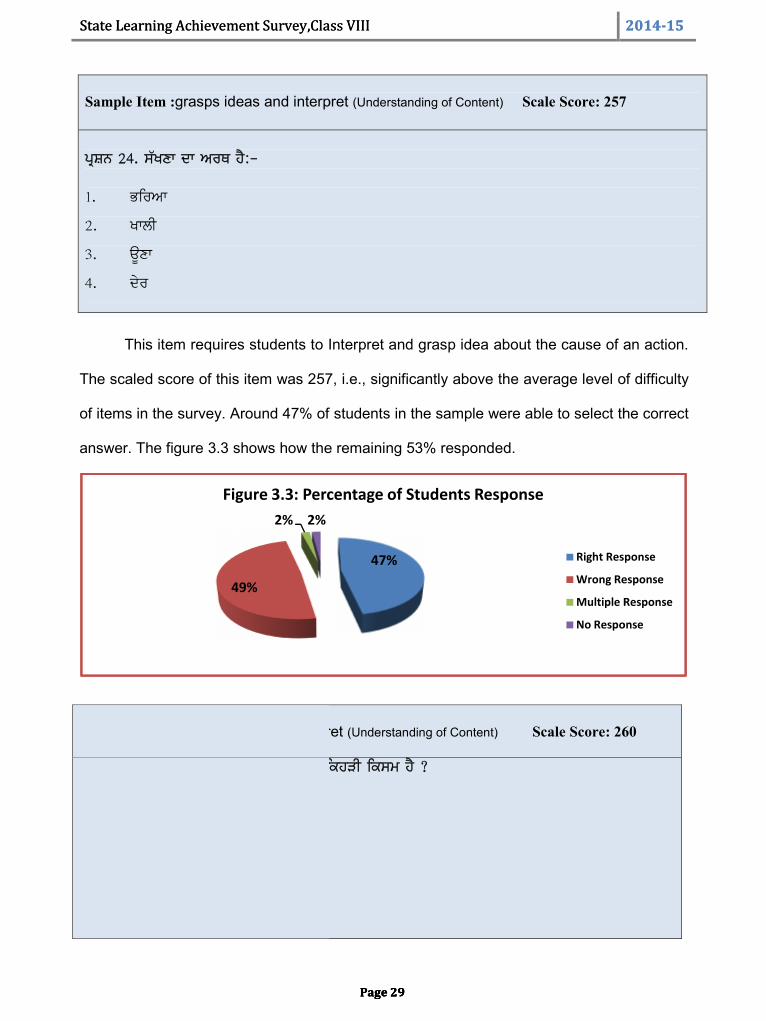
State Learning Achievement Survey,Class VIII 2014-15
Page 29
Sample Item :grasps ideas and interpret (Understanding of Content) Scale Score: 257
gqPB 24H ;ZyDk dk noE j?L^
1H Gfonk
2H ykbh
3H T{Dk
4H d/o
This item requires students to Interpret and grasp idea about the cause of an action.
The scaled score of this item was 257, i.e., significantly above the average level of difficulty
of items in the survey. Around 47% of students in the sample were able to select the correct
answer. The figure 3.3 shows how the remaining 53% responded.
49%
2% 2%
Figure 3.3: Percentage of Students Response
Sample Item :grasps ideas and interpret (Understanding of Content) Scale Score: 260
gqPB 33H j/m fby/ tke ftu gVBKt dh fejVh fe;w j? <
e'Jh rhs rk fojk j? .
1H fBZi tkue
2H nfBPu/ tkue
3H ;pzX tkue
4H fBPu/ tkue
State Learning Achievement Survey,Class VIII 2014-15
Page 29
Sample Item :grasps ideas and interpret (Understanding of Content) Scale Score: 257
gqPB 24H ;ZyDk dk noE j?L^
1H Gfonk
2H ykbh
3H T{Dk
4H d/o
This item requires students to Interpret and grasp idea about the cause of an action.
The scaled score of this item was 257, i.e., significantly above the average level of difficulty
of items in the survey. Around 47% of students in the sample were able to select the correct
answer. The figure 3.3 shows how the remaining 53% responded.
47%
2%
Figure 3.3: Percentage of Students Response
Right Response
Wrong Response
Multiple Response
No Response
Sample Item :grasps ideas and interpret (Understanding of Content) Scale Score: 260
gqPB 33H j/m fby/ tke ftu gVBKt dh fejVh fe;w j? <
e'Jh rhs rk fojk j? .
1H fBZi tkue
2H nfBPu/ tkue
3H ;pzX tkue
4H fBPu/ tkue
State Learning Achievement Survey,Class VIII 2014-15
Page 29
Sample Item :grasps ideas and interpret (Understanding of Content) Scale Score: 257
gqPB 24H ;ZyDk dk noE j?L^
1H Gfonk
2H ykbh
3H T{Dk
4H d/o
This item requires students to Interpret and grasp idea about the cause of an action.
The scaled score of this item was 257, i.e., significantly above the average level of difficulty
of items in the survey. Around 47% of students in the sample were able to select the correct
answer. The figure 3.3 shows how the remaining 53% responded.
Right Response
Wrong Response
Multiple Response
No Response
Sample Item :grasps ideas and interpret (Understanding of Content) Scale Score: 260
gqPB 33H j/m fby/ tke ftu gVBKt dh fejVh fe;w j? <
e'Jh rhs rk fojk j? .
1H fBZi tkue
2H nfBPu/ tkue
3H ;pzX tkue
4H fBPu/ tkue
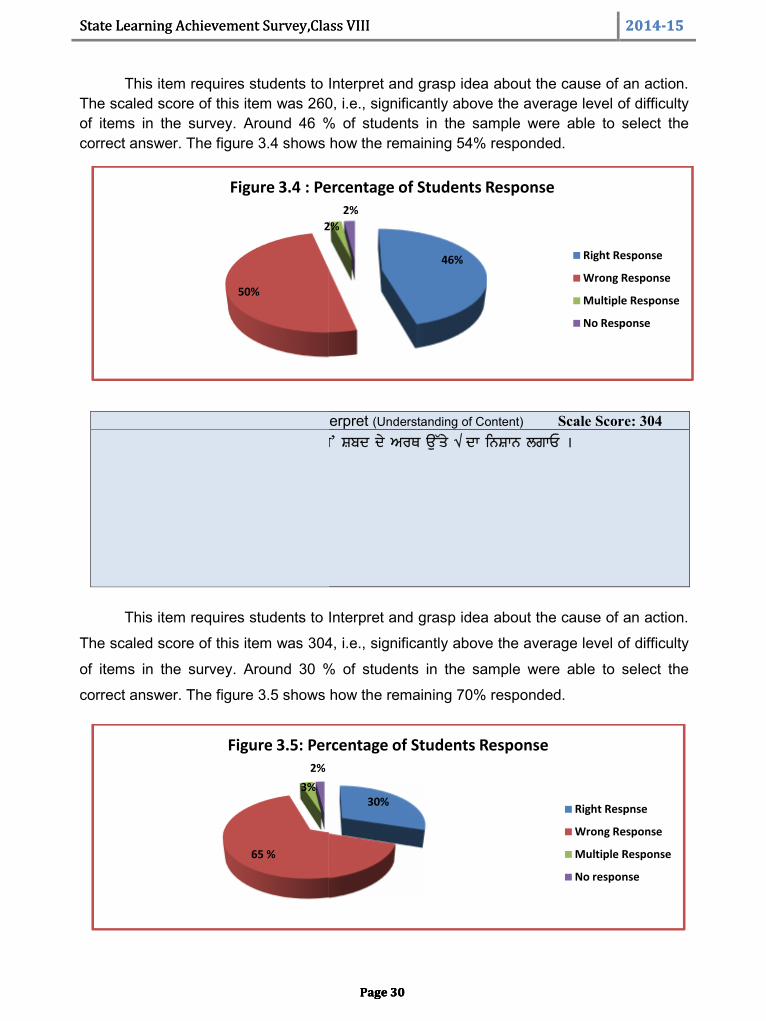
State Learning Achievement Survey,Class VIII 2014-15
Page 30
This item requires students to Interpret and grasp idea about the cause of an action.The scaled score of this item was 260, i.e., significantly above the average level of difficultyof items in the survey. Around 46 % of students in the sample were able to select thecorrect answer. The figure 3.4 shows how the remaining 54% responded.
Sample Item : grasps ideas and interpret (Understanding of Content) Scale Score: 304pRsn :- 23H j/m fbfynK ftu'A ‘Ioy/I* Ppd d/ noE T[~s/ √ dk fBPkB brkU .
1H pzio
2H o/sbh
3H gEohbh
4H T[gikT[
This item requires students to Interpret and grasp idea about the cause of an action.
The scaled score of this item was 304, i.e., significantly above the average level of difficulty
of items in the survey. Around 30 % of students in the sample were able to select the
correct answer. The figure 3.5 shows how the remaining 70% responded.
50%
2%
Figure 3.4 : Percentage of Students Response
65 %
3%2%
Figure 3.5: Percentage of Students Response
State Learning Achievement Survey,Class VIII 2014-15
Page 30
This item requires students to Interpret and grasp idea about the cause of an action.The scaled score of this item was 260, i.e., significantly above the average level of difficultyof items in the survey. Around 46 % of students in the sample were able to select thecorrect answer. The figure 3.4 shows how the remaining 54% responded.
Sample Item : grasps ideas and interpret (Understanding of Content) Scale Score: 304pRsn :- 23H j/m fbfynK ftu'A ‘Ioy/I* Ppd d/ noE T[~s/ √ dk fBPkB brkU .
1H pzio
2H o/sbh
3H gEohbh
4H T[gikT[
This item requires students to Interpret and grasp idea about the cause of an action.
The scaled score of this item was 304, i.e., significantly above the average level of difficulty
of items in the survey. Around 30 % of students in the sample were able to select the
correct answer. The figure 3.5 shows how the remaining 70% responded.
46%
2%2%
Figure 3.4 : Percentage of Students Response
Right Response
Wrong Response
Multiple Response
No Response
30%
2%
Figure 3.5: Percentage of Students Response
Right Respnse
Wrong Response
Multiple Response
No response
State Learning Achievement Survey,Class VIII 2014-15
Page 30
This item requires students to Interpret and grasp idea about the cause of an action.The scaled score of this item was 260, i.e., significantly above the average level of difficultyof items in the survey. Around 46 % of students in the sample were able to select thecorrect answer. The figure 3.4 shows how the remaining 54% responded.
Sample Item : grasps ideas and interpret (Understanding of Content) Scale Score: 304pRsn :- 23H j/m fbfynK ftu'A ‘Ioy/I* Ppd d/ noE T[~s/ √ dk fBPkB brkU .
1H pzio
2H o/sbh
3H gEohbh
4H T[gikT[
This item requires students to Interpret and grasp idea about the cause of an action.
The scaled score of this item was 304, i.e., significantly above the average level of difficulty
of items in the survey. Around 30 % of students in the sample were able to select the
correct answer. The figure 3.5 shows how the remaining 70% responded.
Right Response
Wrong Response
Multiple Response
No Response
Right Respnse
Wrong Response
Multiple Response
No response
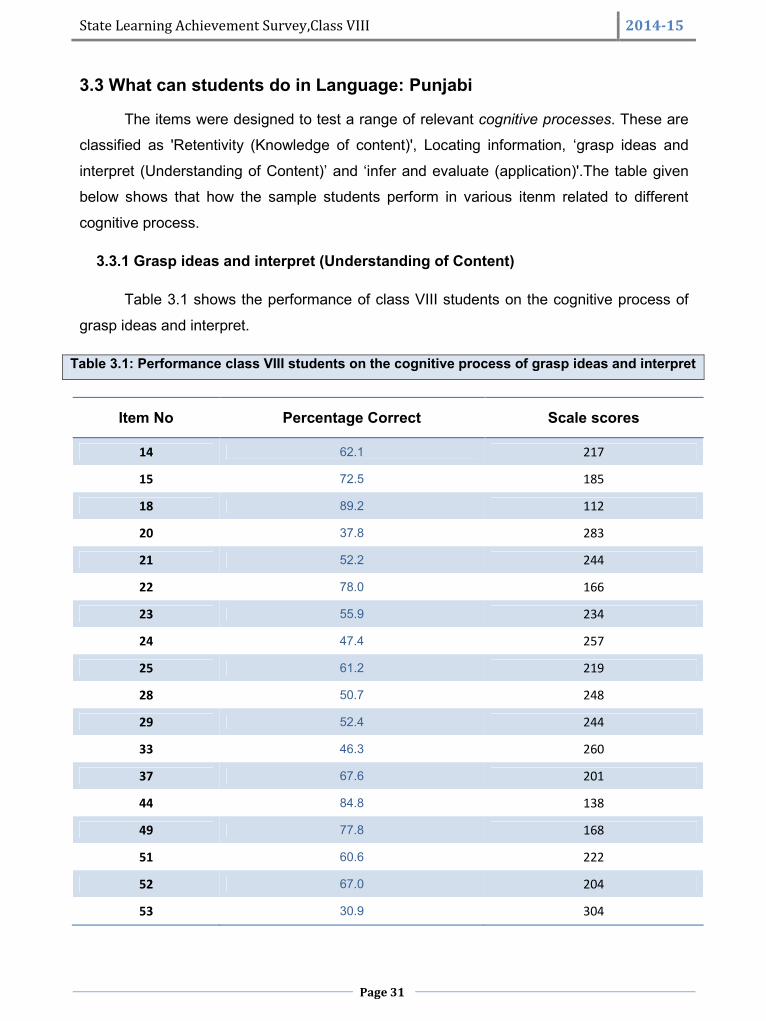
State Learning Achievement Survey,Class VIII 2014-15
Page 31
3.3 What can students do in Language: Punjabi
The items were designed to test a range of relevant cognitive processes. These are
classified as 'Retentivity (Knowledge of content)', Locating information, ‘grasp ideas and
interpret (Understanding of Content)’ and ‘infer and evaluate (application)'.The table given
below shows that how the sample students perform in various itenm related to different
cognitive process.
3.3.1 Grasp ideas and interpret (Understanding of Content)
Table 3.1 shows the performance of class VIII students on the cognitive process of
grasp ideas and interpret.
Table 3.1: Performance class VIII students on the cognitive process of grasp ideas and interpret
Item No Percentage Correct Scale scores
14 62.1 217
15 72.5 185
18 89.2 112
20 37.8 283
21 52.2 244
22 78.0 166
23 55.9 234
24 47.4 257
25 61.2 219
28 50.7 248
29 52.4 244
33 46.3 260
37 67.6 201
44 84.8 138
49 77.8 168
51 60.6 222
52 67.0 204
53 30.9 304
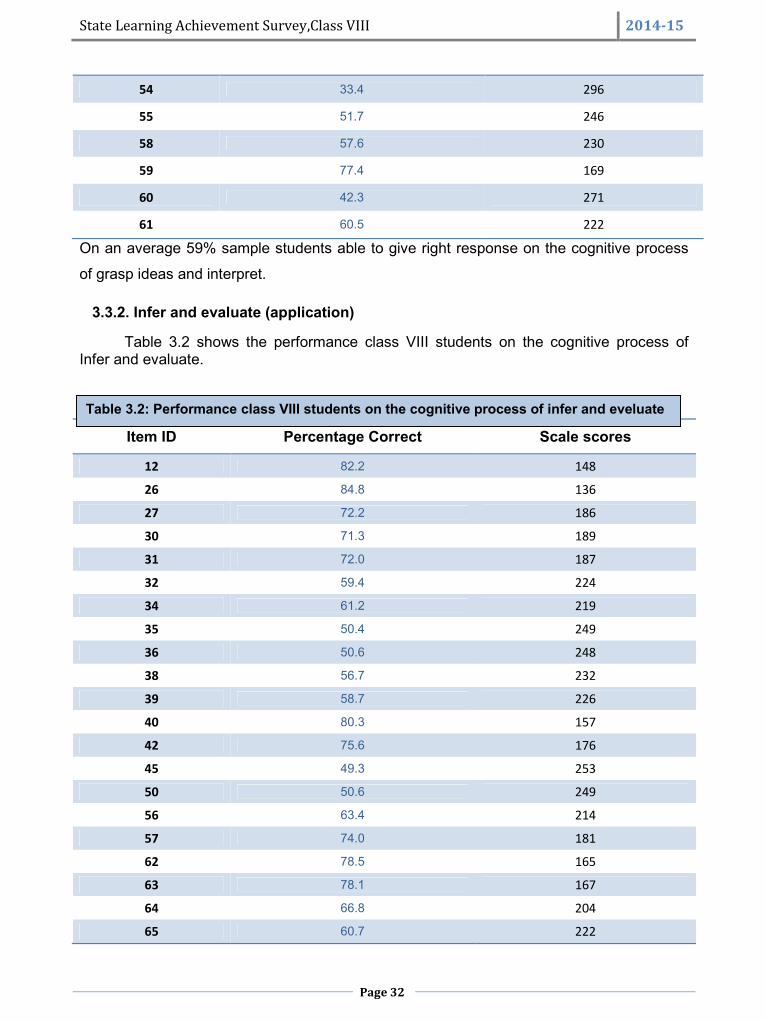
State Learning Achievement Survey,Class VIII 2014-15
Page 32
54 33.4 296
55 51.7 246
58 57.6 230
59 77.4 169
60 42.3 271
61 60.5 222
On an average 59% sample students able to give right response on the cognitive process
of grasp ideas and interpret.
3.3.2. Infer and evaluate (application)
Table 3.2 shows the performance class VIII students on the cognitive process ofInfer and evaluate.
Item ID Percentage Correct Scale scores
12 82.2 148
26 84.8 136
27 72.2 186
30 71.3 189
31 72.0 187
32 59.4 224
34 61.2 219
35 50.4 249
36 50.6 248
38 56.7 232
39 58.7 226
40 80.3 157
42 75.6 176
45 49.3 253
50 50.6 249
56 63.4 214
57 74.0 181
62 78.5 165
63 78.1 167
64 66.8 204
65 60.7 222
Table 3.2: Performance class VIII students on the cognitive process of infer and eveluate
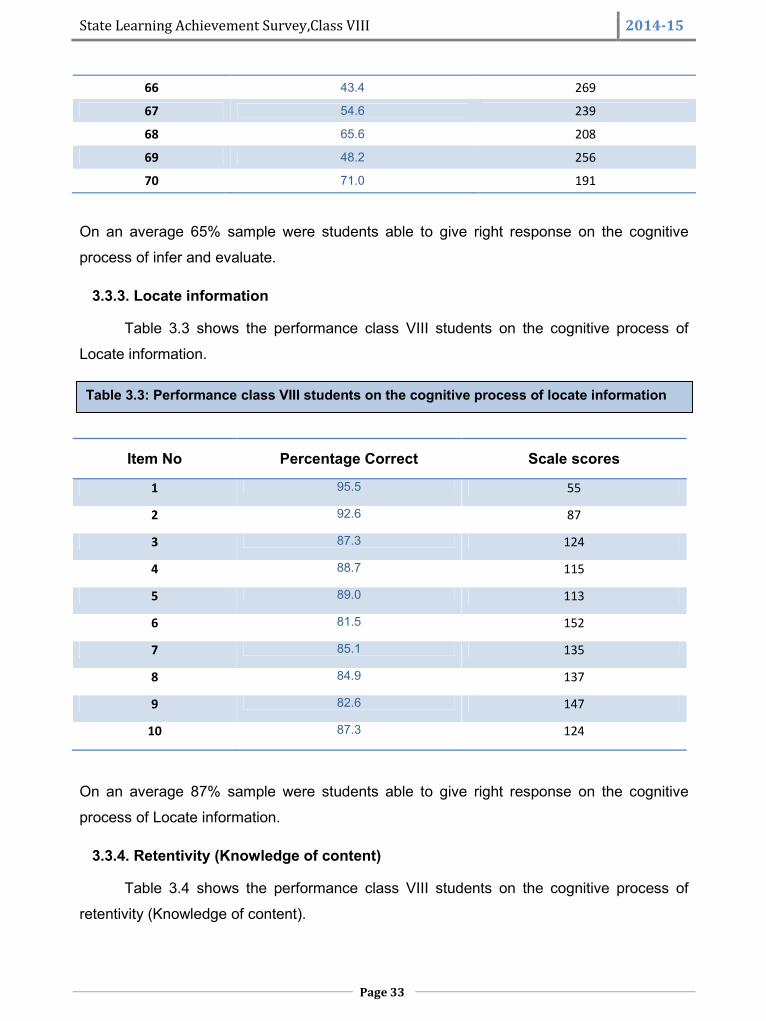
State Learning Achievement Survey,Class VIII 2014-15
Page 33
66 43.4 269
67 54.6 239
68 65.6 208
69 48.2 256
70 71.0 191
On an average 65% sample were students able to give right response on the cognitive
process of infer and evaluate.
3.3.3. Locate information
Table 3.3 shows the performance class VIII students on the cognitive process of
Locate information.
Item No Percentage Correct Scale scores
1 95.5 55
2 92.6 87
3 87.3 124
4 88.7 115
5 89.0 113
6 81.5 152
7 85.1 135
8 84.9 137
9 82.6 147
10 87.3 124
On an average 87% sample were students able to give right response on the cognitive
process of Locate information.
3.3.4. Retentivity (Knowledge of content)
Table 3.4 shows the performance class VIII students on the cognitive process of
retentivity (Knowledge of content).
Table 3.3: Performance class VIII students on the cognitive process of locate information

State Learning Achievement Survey,Class VIII 2014-15
Page 34
Item No Percentage Correct Scale scores
11 55.6 235
13 44.4 265
16 76.7 171
17 63.6 213
19 92.2 89
41 64.8 210
43 62.6 216
46 69.9 195
47 80.8 156
48 61.9 219
On an average, 67% sample were students able to give right response on the cognitive
process of retentivity (Knowledge of content).
Table 3.4: Performance class VIII students on the cognitive process of retentivity
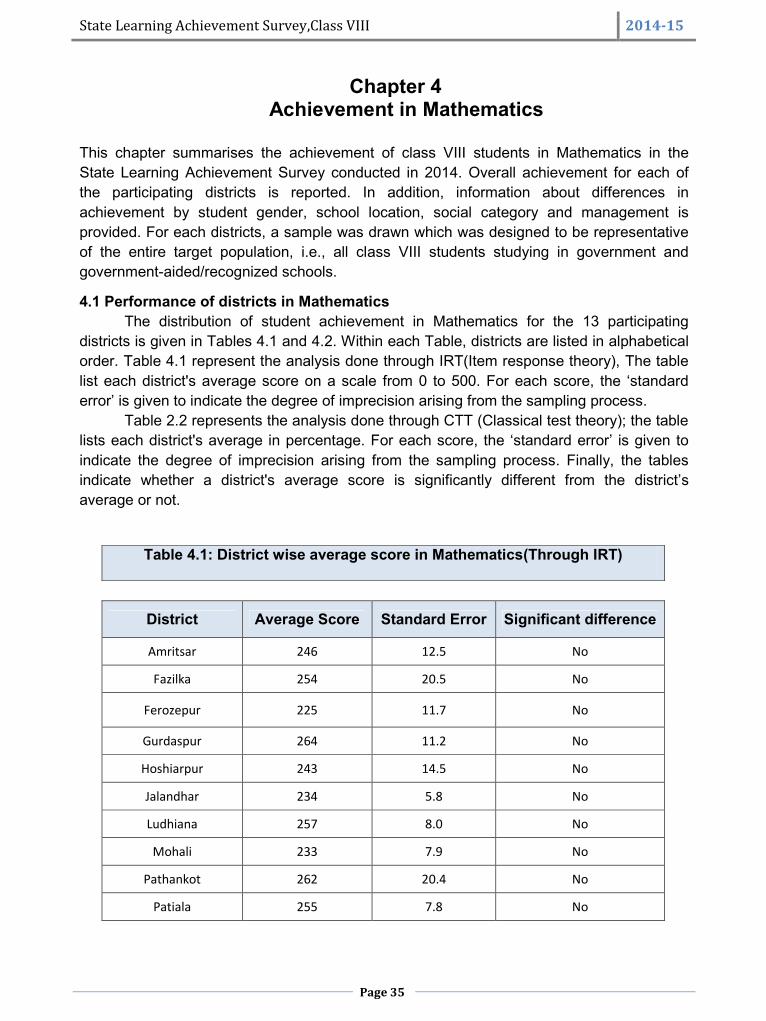
State Learning Achievement Survey,Class VIII 2014-15
Page 35
Chapter 4Achievement in Mathematics
This chapter summarises the achievement of class VIII students in Mathematics in theState Learning Achievement Survey conducted in 2014. Overall achievement for each ofthe participating districts is reported. In addition, information about differences inachievement by student gender, school location, social category and management isprovided. For each districts, a sample was drawn which was designed to be representativeof the entire target population, i.e., all class VIII students studying in government andgovernment-aided/recognized schools.
4.1 Performance of districts in MathematicsThe distribution of student achievement in Mathematics for the 13 participating
districts is given in Tables 4.1 and 4.2. Within each Table, districts are listed in alphabeticalorder. Table 4.1 represent the analysis done through IRT(Item response theory), The tablelist each district's average score on a scale from 0 to 500. For each score, the ‘standarderror’ is given to indicate the degree of imprecision arising from the sampling process.
Table 2.2 represents the analysis done through CTT (Classical test theory); the tablelists each district's average in percentage. For each score, the ‘standard error’ is given toindicate the degree of imprecision arising from the sampling process. Finally, the tablesindicate whether a district's average score is significantly different from the district’saverage or not.
Table 4.1: District wise average score in Mathematics(Through IRT)
District Average Score Standard Error Significant difference
Amritsar 246 12.5 No
Fazilka 254 20.5 No
Ferozepur 225 11.7 No
Gurdaspur 264 11.2 No
Hoshiarpur 243 14.5 No
Jalandhar 234 5.8 No
Ludhiana 257 8.0 No
Mohali 233 7.9 No
Pathankot 262 20.4 No
Patiala 255 7.8 No
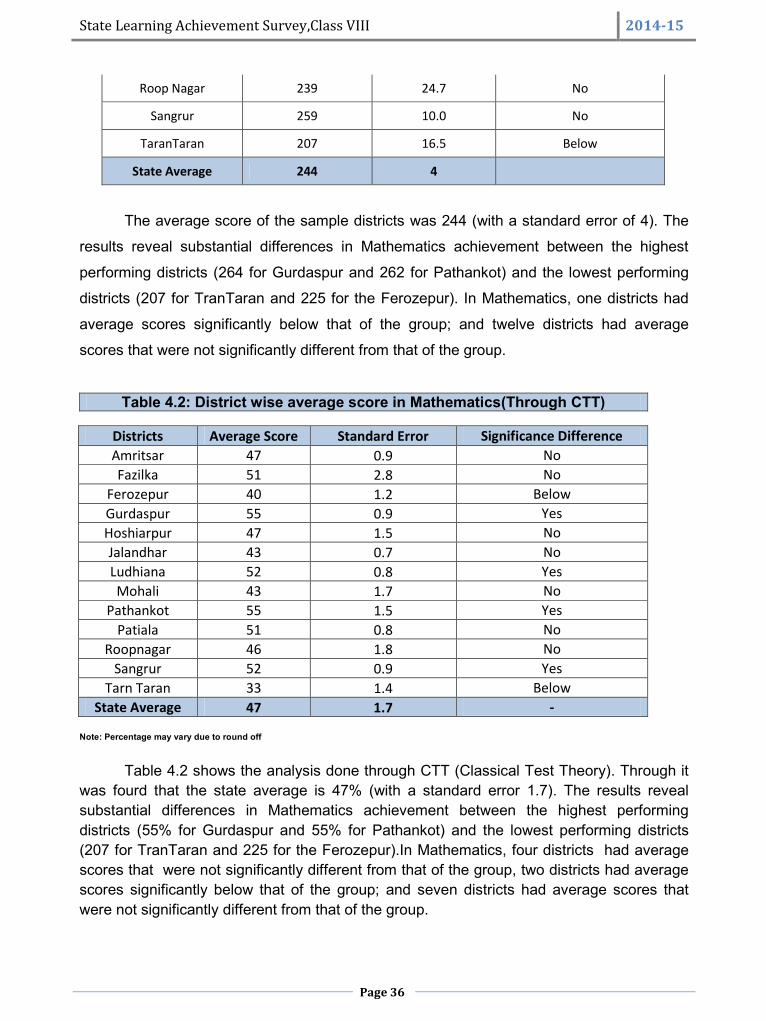
State Learning Achievement Survey,Class VIII 2014-15
Page 36
Roop Nagar 239 24.7 No
Sangrur 259 10.0 No
TaranTaran 207 16.5 Below
State Average 244 4
The average score of the sample districts was 244 (with a standard error of 4). The
results reveal substantial differences in Mathematics achievement between the highest
performing districts (264 for Gurdaspur and 262 for Pathankot) and the lowest performing
districts (207 for TranTaran and 225 for the Ferozepur). In Mathematics, one districts had
average scores significantly below that of the group; and twelve districts had average
scores that were not significantly different from that of the group.
Table 4.2: District wise average score in Mathematics(Through CTT)
Districts Average Score Standard Error Significance DifferenceAmritsar 47 0.9 NoFazilka 51 2.8 No
Ferozepur 40 1.2 BelowGurdaspur 55 0.9 YesHoshiarpur 47 1.5 NoJalandhar 43 0.7 NoLudhiana 52 0.8 YesMohali 43 1.7 No
Pathankot 55 1.5 YesPatiala 51 0.8 No
Roopnagar 46 1.8 NoSangrur 52 0.9 Yes
Tarn Taran 33 1.4 BelowState Average 47 1.7 -
Note: Percentage may vary due to round off
Table 4.2 shows the analysis done through CTT (Classical Test Theory). Through itwas fourd that the state average is 47% (with a standard error 1.7). The results revealsubstantial differences in Mathematics achievement between the highest performingdistricts (55% for Gurdaspur and 55% for Pathankot) and the lowest performing districts(207 for TranTaran and 225 for the Ferozepur).In Mathematics, four districts had averagescores that were not significantly different from that of the group, two districts had averagescores significantly below that of the group; and seven districts had average scores thatwere not significantly different from that of the group.
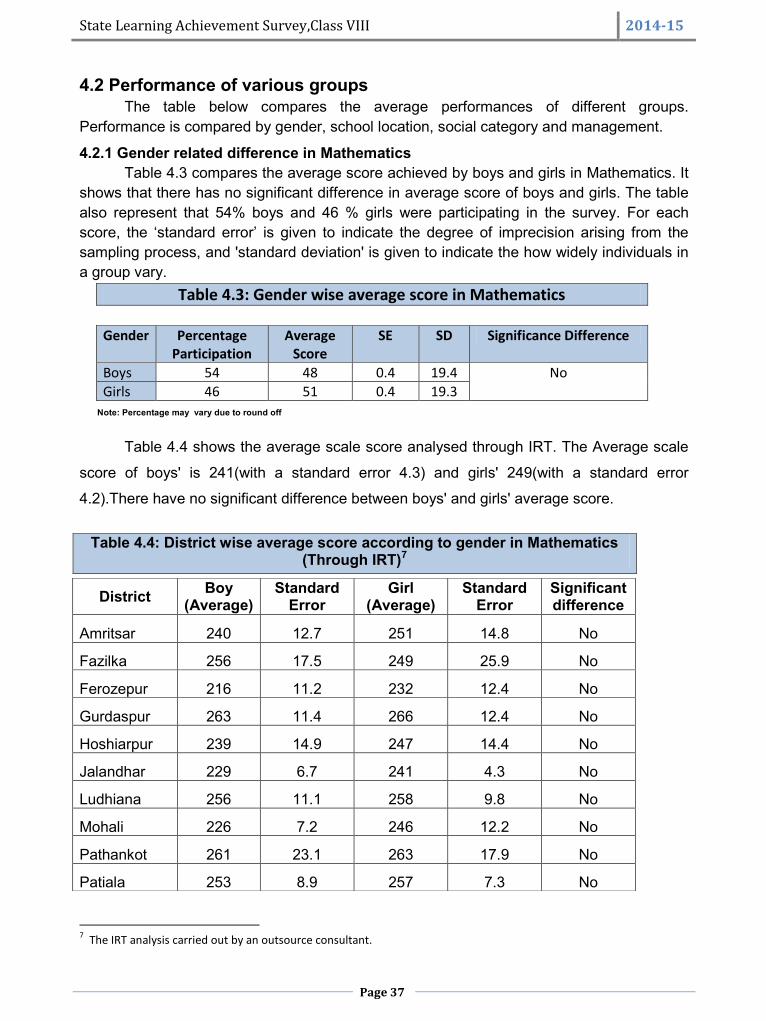
State Learning Achievement Survey,Class VIII 2014-15
Page 37
4.2 Performance of various groupsThe table below compares the average performances of different groups.
Performance is compared by gender, school location, social category and management.
4.2.1 Gender related difference in MathematicsTable 4.3 compares the average score achieved by boys and girls in Mathematics. It
shows that there has no significant difference in average score of boys and girls. The tablealso represent that 54% boys and 46 % girls were participating in the survey. For eachscore, the ‘standard error’ is given to indicate the degree of imprecision arising from thesampling process, and 'standard deviation' is given to indicate the how widely individuals ina group vary.
Table 4.3: Gender wise average score in Mathematics
Gender PercentageParticipation
AverageScore
SE SD Significance Difference
Boys 54 48 0.4 19.4 NoGirls 46 51 0.4 19.3
Note: Percentage may vary due to round off
Table 4.4 shows the average scale score analysed through IRT. The Average scale
score of boys' is 241(with a standard error 4.3) and girls' 249(with a standard error
4.2).There have no significant difference between boys' and girls' average score.
Table 4.4: District wise average score according to gender in Mathematics(Through IRT)7
7 The IRT analysis carried out by an outsource consultant.
District Boy(Average)
StandardError
Girl(Average)
StandardError
Significantdifference
Amritsar 240 12.7 251 14.8 No
Fazilka 256 17.5 249 25.9 No
Ferozepur 216 11.2 232 12.4 No
Gurdaspur 263 11.4 266 12.4 No
Hoshiarpur 239 14.9 247 14.4 No
Jalandhar 229 6.7 241 4.3 No
Ludhiana 256 11.1 258 9.8 No
Mohali 226 7.2 246 12.2 No
Pathankot 261 23.1 263 17.9 No
Patiala 253 8.9 257 7.3 No
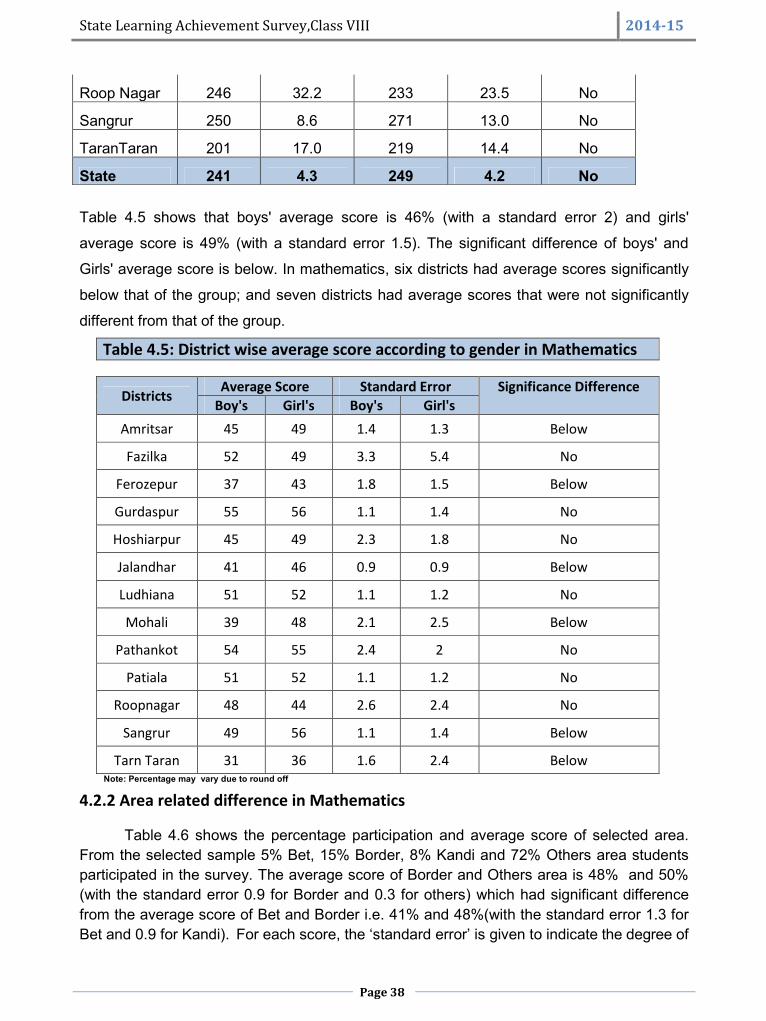
State Learning Achievement Survey,Class VIII 2014-15
Page 38
Table 4.5 shows that boys' average score is 46% (with a standard error 2) and girls'
average score is 49% (with a standard error 1.5). The significant difference of boys' and
Girls' average score is below. In mathematics, six districts had average scores significantly
below that of the group; and seven districts had average scores that were not significantly
different from that of the group.
Table 4.5: District wise average score according to gender in Mathematics
Districts Average Score Standard Error Significance DifferenceBoy's Girl's Boy's Girl's
Amritsar 45 49 1.4 1.3 Below
Fazilka 52 49 3.3 5.4 No
Ferozepur 37 43 1.8 1.5 Below
Gurdaspur 55 56 1.1 1.4 No
Hoshiarpur 45 49 2.3 1.8 No
Jalandhar 41 46 0.9 0.9 Below
Ludhiana 51 52 1.1 1.2 No
Mohali 39 48 2.1 2.5 Below
Pathankot 54 55 2.4 2 No
Patiala 51 52 1.1 1.2 No
Roopnagar 48 44 2.6 2.4 No
Sangrur 49 56 1.1 1.4 Below
Tarn Taran 31 36 1.6 2.4 BelowNote: Percentage may vary due to round off
4.2.2 Area related difference in Mathematics
Table 4.6 shows the percentage participation and average score of selected area.From the selected sample 5% Bet, 15% Border, 8% Kandi and 72% Others area studentsparticipated in the survey. The average score of Border and Others area is 48% and 50%(with the standard error 0.9 for Border and 0.3 for others) which had significant differencefrom the average score of Bet and Border i.e. 41% and 48%(with the standard error 1.3 forBet and 0.9 for Kandi). For each score, the ‘standard error’ is given to indicate the degree of
Roop Nagar 246 32.2 233 23.5 No
Sangrur 250 8.6 271 13.0 No
TaranTaran 201 17.0 219 14.4 No
State 241 4.3 249 4.2 No
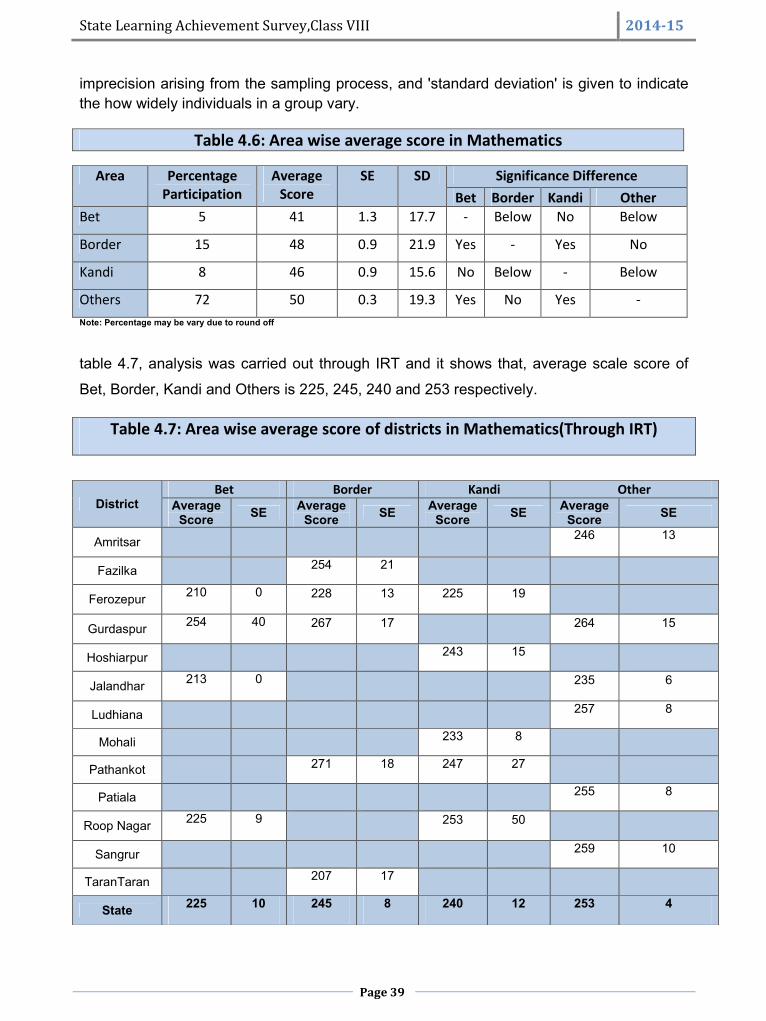
State Learning Achievement Survey,Class VIII 2014-15
Page 39
imprecision arising from the sampling process, and 'standard deviation' is given to indicatethe how widely individuals in a group vary.
Table 4.6: Area wise average score in Mathematics
Area PercentageParticipation
AverageScore
SE SD Significance DifferenceBet Border Kandi Other
Bet 5 41 1.3 17.7 - Below No Below
Border 15 48 0.9 21.9 Yes - Yes No
Kandi 8 46 0.9 15.6 No Below - Below
Others 72 50 0.3 19.3 Yes No Yes -Note: Percentage may be vary due to round off
table 4.7, analysis was carried out through IRT and it shows that, average scale score of
Bet, Border, Kandi and Others is 225, 245, 240 and 253 respectively.
Table 4.7: Area wise average score of districts in Mathematics(Through IRT)
DistrictBet Border Kandi Other
AverageScore SE Average
Score SE AverageScore SE Average
Score SE
Amritsar 246 13
Fazilka 254 21
Ferozepur 210 0 228 13 225 19
Gurdaspur 254 40 267 17 264 15
Hoshiarpur 243 15
Jalandhar 213 0 235 6
Ludhiana 257 8
Mohali 233 8
Pathankot 271 18 247 27
Patiala 255 8
Roop Nagar 225 9 253 50
Sangrur 259 10
TaranTaran 207 17
State 225 10 245 8 240 12 253 4
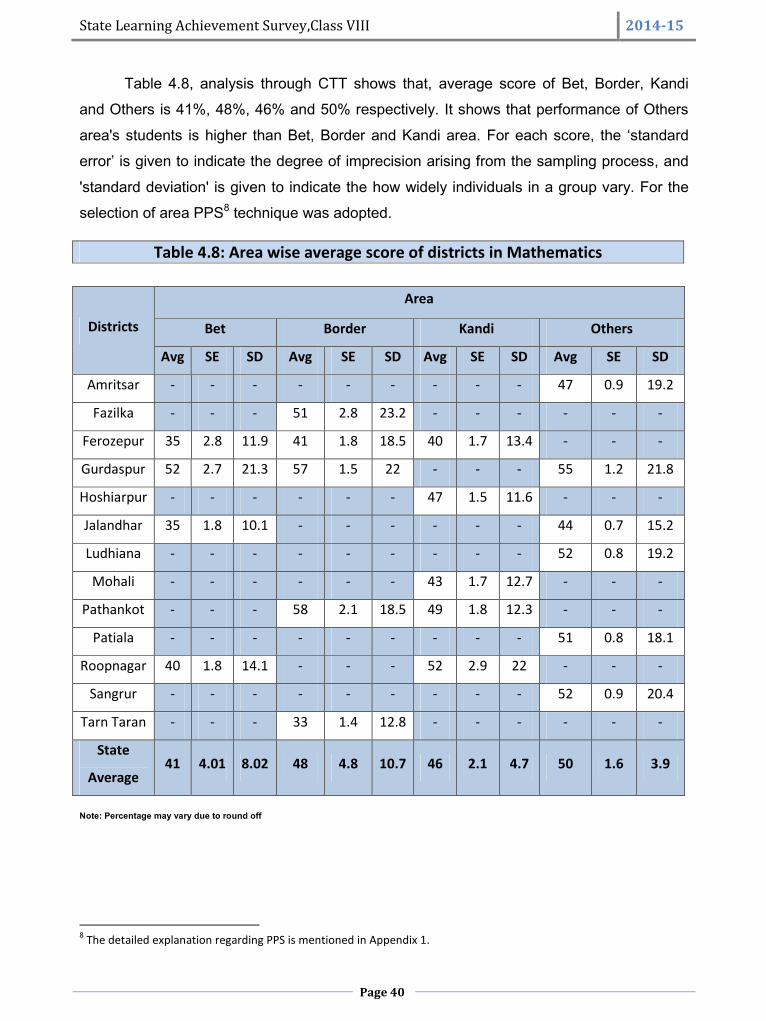
State Learning Achievement Survey,Class VIII 2014-15
Page 40
Table 4.8, analysis through CTT shows that, average score of Bet, Border, Kandi
and Others is 41%, 48%, 46% and 50% respectively. It shows that performance of Others
area's students is higher than Bet, Border and Kandi area. For each score, the ‘standard
error’ is given to indicate the degree of imprecision arising from the sampling process, and
'standard deviation' is given to indicate the how widely individuals in a group vary. For the
selection of area PPS8 technique was adopted.
Table 4.8: Area wise average score of districts in Mathematics
Districts
Area
Bet Border Kandi Others
Avg SE SD Avg SE SD Avg SE SD Avg SE SD
Amritsar - - - - - - - - - 47 0.9 19.2
Fazilka - - - 51 2.8 23.2 - - - - - -
Ferozepur 35 2.8 11.9 41 1.8 18.5 40 1.7 13.4 - - -
Gurdaspur 52 2.7 21.3 57 1.5 22 - - - 55 1.2 21.8
Hoshiarpur - - - - - - 47 1.5 11.6 - - -
Jalandhar 35 1.8 10.1 - - - - - - 44 0.7 15.2
Ludhiana - - - - - - - - - 52 0.8 19.2
Mohali - - - - - - 43 1.7 12.7 - - -
Pathankot - - - 58 2.1 18.5 49 1.8 12.3 - - -
Patiala - - - - - - - - - 51 0.8 18.1
Roopnagar 40 1.8 14.1 - - - 52 2.9 22 - - -
Sangrur - - - - - - - - - 52 0.9 20.4
Tarn Taran - - - 33 1.4 12.8 - - - - - -
State
Average41 4.01 8.02 48 4.8 10.7 46 2.1 4.7 50 1.6 3.9
Note: Percentage may vary due to round off
8 The detailed explanation regarding PPS is mentioned in Appendix 1.
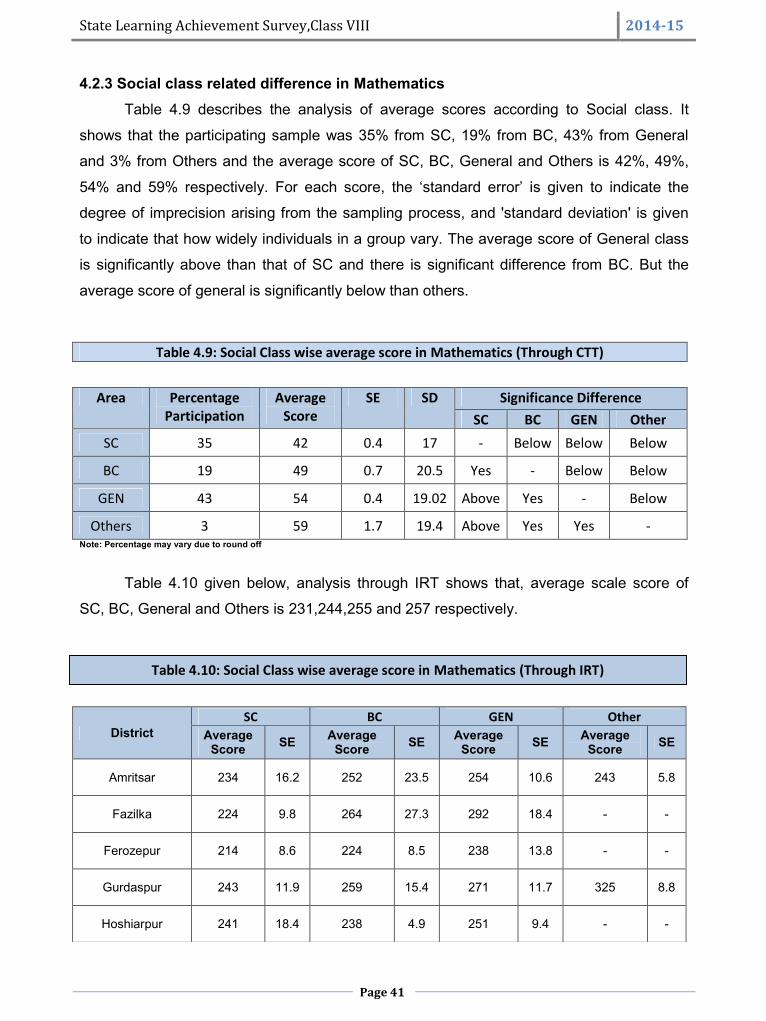
State Learning Achievement Survey,Class VIII 2014-15
Page 41
4.2.3 Social class related difference in MathematicsTable 4.9 describes the analysis of average scores according to Social class. It
shows that the participating sample was 35% from SC, 19% from BC, 43% from General
and 3% from Others and the average score of SC, BC, General and Others is 42%, 49%,
54% and 59% respectively. For each score, the ‘standard error’ is given to indicate the
degree of imprecision arising from the sampling process, and 'standard deviation' is given
to indicate that how widely individuals in a group vary. The average score of General class
is significantly above than that of SC and there is significant difference from BC. But the
average score of general is significantly below than others.
Table 4.9: Social Class wise average score in Mathematics (Through CTT)
Area PercentageParticipation
AverageScore
SE SD Significance DifferenceSC BC GEN Other
SC 35 42 0.4 17 - Below Below Below
BC 19 49 0.7 20.5 Yes - Below Below
GEN 43 54 0.4 19.02 Above Yes - Below
Others 3 59 1.7 19.4 Above Yes Yes -Note: Percentage may vary due to round off
Table 4.10 given below, analysis through IRT shows that, average scale score of
SC, BC, General and Others is 231,244,255 and 257 respectively.
DistrictSC BC GEN Other
AverageScore SE Average
Score SE AverageScore SE Average
Score SE
Amritsar 234 16.2 252 23.5 254 10.6 243 5.8
Fazilka 224 9.8 264 27.3 292 18.4 - -
Ferozepur 214 8.6 224 8.5 238 13.8 - -
Gurdaspur 243 11.9 259 15.4 271 11.7 325 8.8
Hoshiarpur 241 18.4 238 4.9 251 9.4 - -
Table 4.10: Social Class wise average score in Mathematics (Through IRT)
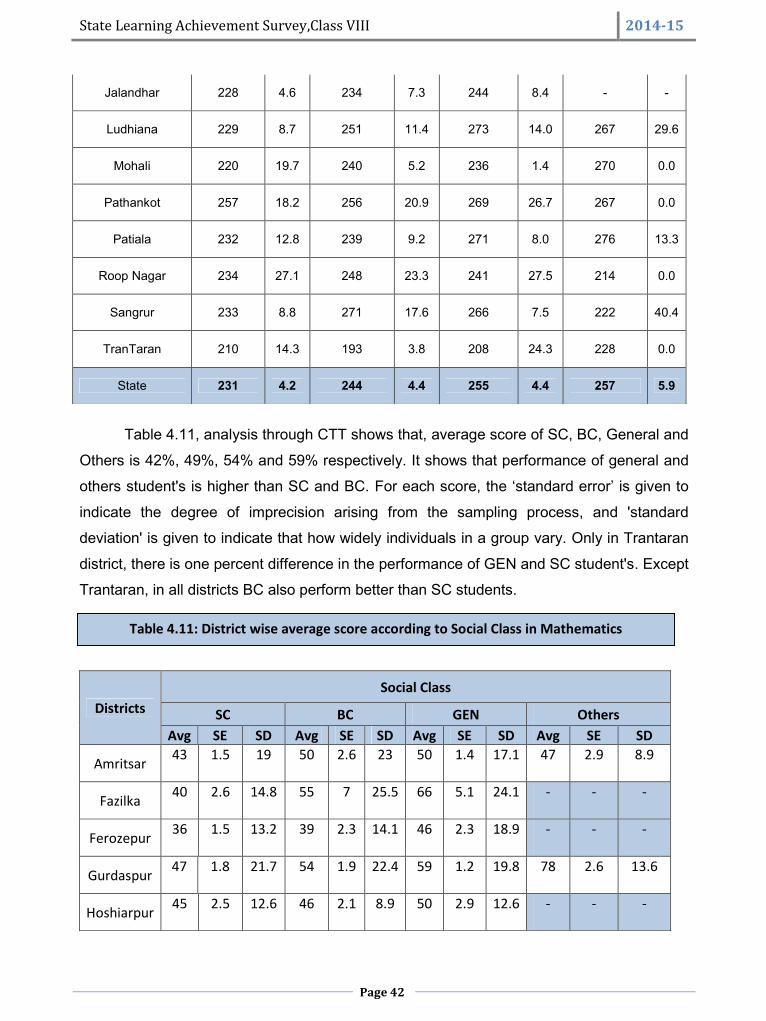
State Learning Achievement Survey,Class VIII 2014-15
Page 42
Table 4.11: District wise average score according to Social Class in Mathematics
Table 4.11, analysis through CTT shows that, average score of SC, BC, General and
Others is 42%, 49%, 54% and 59% respectively. It shows that performance of general and
others student's is higher than SC and BC. For each score, the ‘standard error’ is given to
indicate the degree of imprecision arising from the sampling process, and 'standard
deviation' is given to indicate that how widely individuals in a group vary. Only in Trantaran
district, there is one percent difference in the performance of GEN and SC student's. Except
Trantaran, in all districts BC also perform better than SC students.
DistrictsSocial Class
SC BC GEN OthersAvg SE SD Avg SE SD Avg SE SD Avg SE SD
Amritsar 43 1.5 19 50 2.6 23 50 1.4 17.1 47 2.9 8.9
Fazilka 40 2.6 14.8 55 7 25.5 66 5.1 24.1 - - -
Ferozepur 36 1.5 13.2 39 2.3 14.1 46 2.3 18.9 - - -
Gurdaspur 47 1.8 21.7 54 1.9 22.4 59 1.2 19.8 78 2.6 13.6
Hoshiarpur 45 2.5 12.6 46 2.1 8.9 50 2.9 12.6 - - -
Jalandhar 228 4.6 234 7.3 244 8.4 - -
Ludhiana 229 8.7 251 11.4 273 14.0 267 29.6
Mohali 220 19.7 240 5.2 236 1.4 270 0.0
Pathankot 257 18.2 256 20.9 269 26.7 267 0.0
Patiala 232 12.8 239 9.2 271 8.0 276 13.3
Roop Nagar 234 27.1 248 23.3 241 27.5 214 0.0
Sangrur 233 8.8 271 17.6 266 7.5 222 40.4
TranTaran 210 14.3 193 3.8 208 24.3 228 0.0
State 231 4.2 244 4.4 255 4.4 257 5.9

State Learning Achievement Survey,Class VIII 2014-15
Page 43
Table 4.12: Management wise average score in Mathematics (Through CTT)
Jalandhar 41 0.8 13.8 43 1.5 13.7 47 1.6 17.4 - - -
Ludhiana 42 1.2 15.3 50 2.3 17.3 58 1.2 19.8 56 2.4 13.8
Mohali 39 4.6 17.9 44 2.4 10.5 43 2.1 9.9 55 - -
Pathankot 53 2.4 17.5 53 4.5 17.5 57 2.3 16.8 53 - -
Patiala 42 1.3 16 45 1.8 17.1 57 1.09 16.3 62 3.3 18.8
Roopnagar 44 2.7 19.6 50 3.9 18.7 47 3.09 19.8 33 - -
Sangrur 42 1.7 17.8 56 2.1 24.1 55 1.1 18.1 37 3.8 14.2
Tarn Taran 34 1.9 12.4 26 1.4 5.3 33 2.9 15.5 41 1.2 1.7
StateAverage
42 1.3 4.7 49 2.2 8.1 54 2.3 8.5 59 4.6 13.8
Note: Percentage may vary due to round off
4.2.4 Managements related difference in MathematicsTable 4.12 describes the analysis of average score according Managements9. It
shows that the participating sample was 47% from Department schools and 53% from
Aided or recognised and the average score of Department schools is 43% and Aided or
recognised 55%. For each score, the ‘standard error’ is given to indicate the degree of
imprecision arising from the sampling process, and 'standard deviation' is given to indicate
the how widely individuals in a group vary. It also shows that the average score of
Departments school's are significantly below than Aided/ Recognised schools. It does
interpret that aided/ recognized schools performed higher than department schools.
Management PercentageParticipation
AverageScore
SE SD Significance Difference
Department 47 43 0.4 17 BelowAided 53 55 0.4 19.6
Note: Percentage may vary due to round off
9 The definition regarding managements is mentioned in Appendix 1.
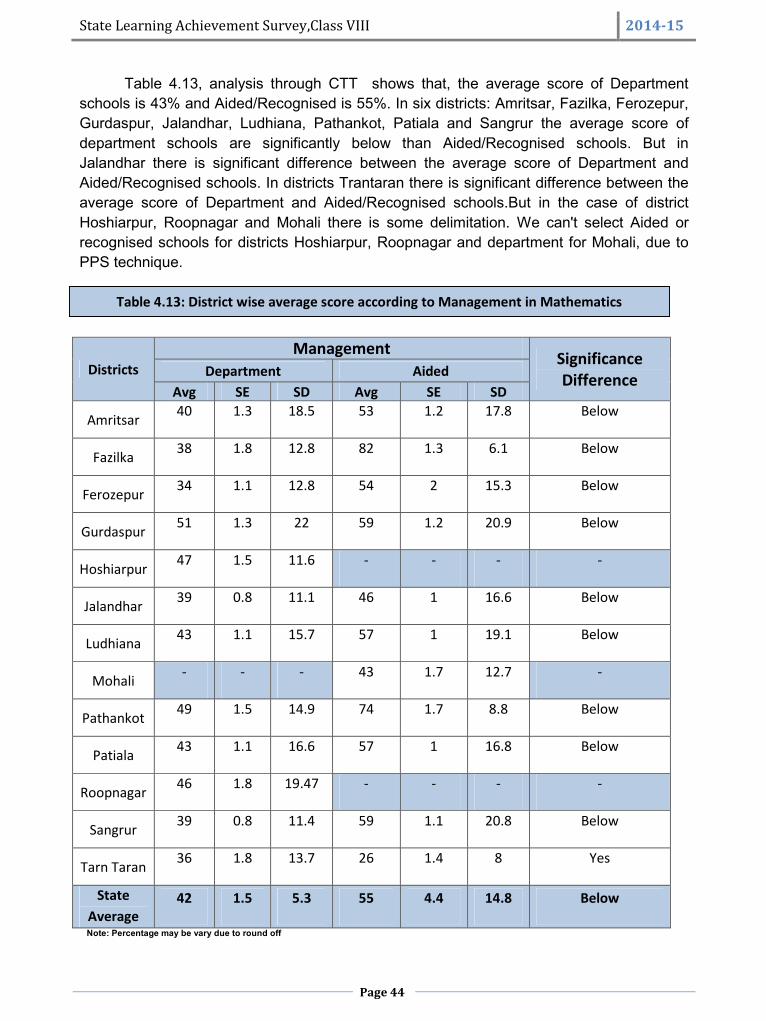
State Learning Achievement Survey,Class VIII 2014-15
Page 44
Table 4.13: District wise average score according to Management in Mathematics
Table 4.13, analysis through CTT shows that, the average score of Departmentschools is 43% and Aided/Recognised is 55%. In six districts: Amritsar, Fazilka, Ferozepur,Gurdaspur, Jalandhar, Ludhiana, Pathankot, Patiala and Sangrur the average score ofdepartment schools are significantly below than Aided/Recognised schools. But inJalandhar there is significant difference between the average score of Department andAided/Recognised schools. In districts Trantaran there is significant difference between theaverage score of Department and Aided/Recognised schools.But in the case of districtHoshiarpur, Roopnagar and Mohali there is some delimitation. We can't select Aided orrecognised schools for districts Hoshiarpur, Roopnagar and department for Mohali, due toPPS technique.
DistrictsManagement Significance
DifferenceDepartment AidedAvg SE SD Avg SE SD
Amritsar 40 1.3 18.5 53 1.2 17.8 Below
Fazilka 38 1.8 12.8 82 1.3 6.1 Below
Ferozepur 34 1.1 12.8 54 2 15.3 Below
Gurdaspur 51 1.3 22 59 1.2 20.9 Below
Hoshiarpur 47 1.5 11.6 - - - -
Jalandhar 39 0.8 11.1 46 1 16.6 Below
Ludhiana 43 1.1 15.7 57 1 19.1 Below
Mohali - - - 43 1.7 12.7 -
Pathankot 49 1.5 14.9 74 1.7 8.8 Below
Patiala 43 1.1 16.6 57 1 16.8 Below
Roopnagar 46 1.8 19.47 - - - -
Sangrur 39 0.8 11.4 59 1.1 20.8 Below
Tarn Taran 36 1.8 13.7 26 1.4 8 Yes
StateAverage
42 1.5 5.3 55 4.4 14.8 Below
Note: Percentage may be vary due to round off
State Learning Achievement Survey,Class VIII 2014-15
Page 45
4.3 Range score in Mathematics
The tables 4.14 and figure 4.1 that follow illustrate the range of achievement of districts.
The tables list the scores achieved by students at key percentiles. For example, the score
at the 25th percentile is the score which 75% of students achieve or surpass; the score at
the 90th percentile is the score that 10% of students achieve or surpass. The range
between the 25th and 75th percentiles (the inter-quartile range) represents the performance
of the middle 50% of students.
The inter-quartile range (i.e. the range between the 75th and 25th percentiles) is highly
variable. For example, Mohali has an inter-quartile range of just 15 whilst Fazilka has a
corresponding value of 45. These values suggest that the class VIII population in Mohali is
far more homogeneous than that of Fazilka. In most districts, the range of performance for
the middle group was between 15 and 45 points. Performance at the 10th and 90th
percentiles respectively shows extremes in low and high achievement. The range between
these two points, which includes 90 percent of the population, is highly variable ranging
from 28 (Mohali) to 58 (Gurdaspur).
The percentiles provide additional information when comparing Mathematics performance
amongst districts. For example, when the districts are arranged in order of average score,
the differences between adjacent distiricts tend to be small. However, the range of scores
may not be similar. For example, there is no significant difference between the median
score of the Fazilka (40) and ferozepur (40). However, the score ranging between the 25th
and 75th percentiles are very different: Fazilka's range is 45 compared with Ferozepur's
range of 20. This indicates that whilst average achievement is very similar in the two areas,
Fazilka has a more heterogeneous group of class VIII students than that of Ferozepur.
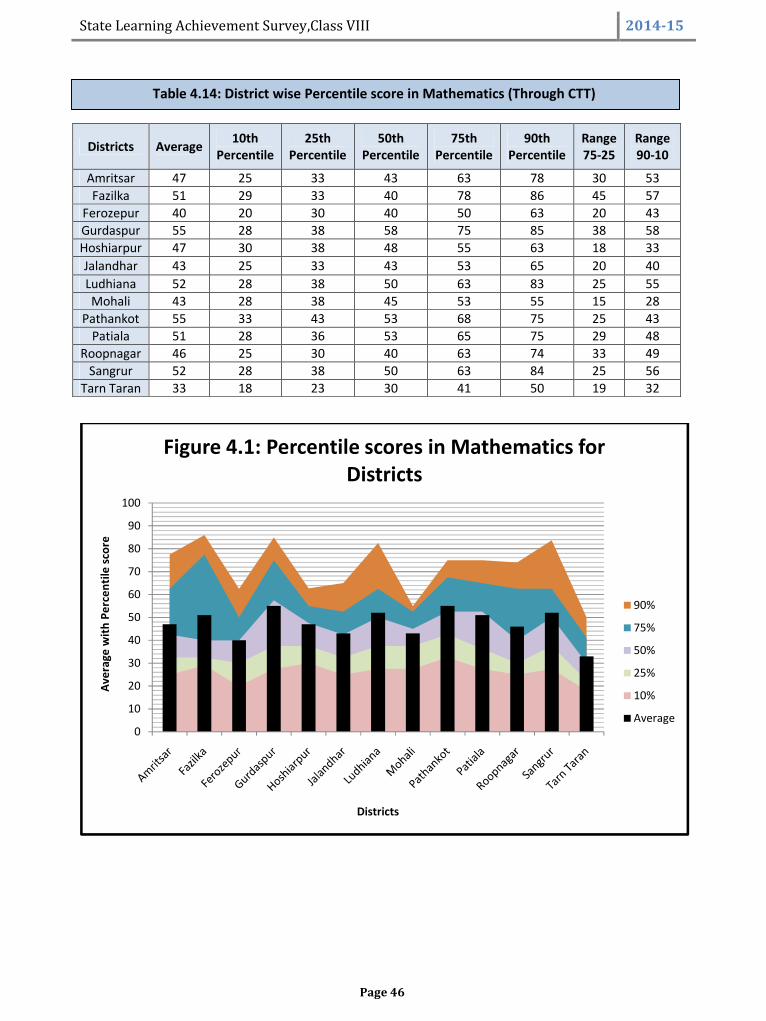
State Learning Achievement Survey,Class VIII 2014-15
Page 46
Table 4.14: District wise Percentile score in Mathematics (Through CTT)
0
10
20
30
40
50
60
70
80
90
100
Aver
age
with
Per
cent
ile sc
ore
Districts
Figure 4.1: Percentile scores in Mathematics forDistricts
90%
75%
50%
25%
10%
Average
Districts Average 10thPercentile
25thPercentile
50thPercentile
75thPercentile
90thPercentile
Range75-25
Range90-10
Amritsar 47 25 33 43 63 78 30 53Fazilka 51 29 33 40 78 86 45 57
Ferozepur 40 20 30 40 50 63 20 43Gurdaspur 55 28 38 58 75 85 38 58Hoshiarpur 47 30 38 48 55 63 18 33Jalandhar 43 25 33 43 53 65 20 40Ludhiana 52 28 38 50 63 83 25 55Mohali 43 28 38 45 53 55 15 28
Pathankot 55 33 43 53 68 75 25 43Patiala 51 28 36 53 65 75 29 48
Roopnagar 46 25 30 40 63 74 33 49Sangrur 52 28 38 50 63 84 25 56
Tarn Taran 33 18 23 30 41 50 19 32
State Learning Achievement Survey,Class VIII 2014-15
Page 47
4.4 ConclusionThe average achievement of students in Mathematics varies greatly across the districts of
Punjab. There is a highly significant difference between outcomes in high scoring districts
such as Pathankot & Gurdaspur (55%), and Ludhiana & Sangrur (52%) and low scoring
districts such as Jalandhar and Mohali (43%) and Tarn Taran (33%).
Districts also vary greatly in the range between their lowest and highest achieving students
as revealed by their interquartile score ranges. Some Districts such as Mohali (15) and
Hoshiarpur (18) have relatively homogeneous cohorts whilst others have far more diverse
outcomes, e.g., Gurdaspur (38) and Fazilka (45).
There is no significance difference between the average score of boys and girls. There
have a significant difference among the average score of Others from Bet and Kandi, but
there have no significance difference between the average score of others and border. On
an average It shows that the others area's students performance is better than the Bet,
Border and Kandi area.
The average score of General class is significantly above than SC and there have
significant difference from BC. But the average score of General is significantly below than
the others. It interprets that on an average general class performed better than SC and BC.
The average score of Departments school's are significantly below than Aided/ Recognised
schools. It does interpret that aided/ recognized schools performed higher than department
schools.
The following chapter provides more information about what class VIII students at various
levels of achievement know and can do in Mathematics.
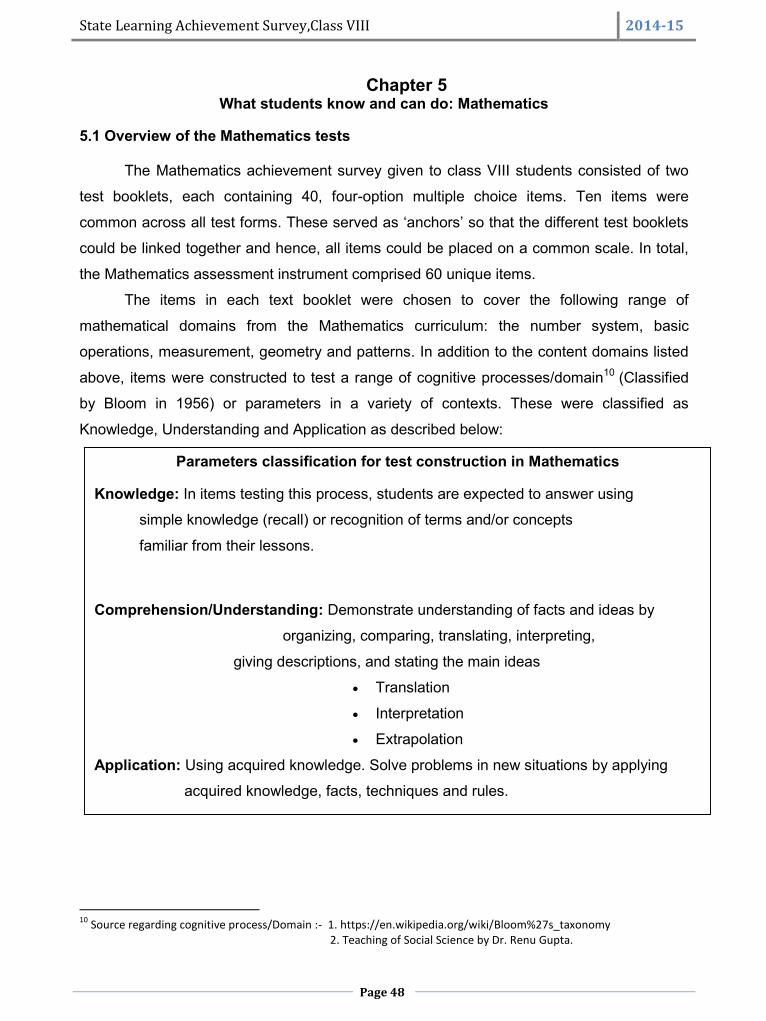
State Learning Achievement Survey,Class VIII 2014-15
Page 48
Chapter 5What students know and can do: Mathematics
5.1 Overview of the Mathematics tests
The Mathematics achievement survey given to class VIII students consisted of two
test booklets, each containing 40, four-option multiple choice items. Ten items were
common across all test forms. These served as ‘anchors’ so that the different test booklets
could be linked together and hence, all items could be placed on a common scale. In total,
the Mathematics assessment instrument comprised 60 unique items.
The items in each text booklet were chosen to cover the following range of
mathematical domains from the Mathematics curriculum: the number system, basic
operations, measurement, geometry and patterns. In addition to the content domains listed
above, items were constructed to test a range of cognitive processes/domain10 (Classified
by Bloom in 1956) or parameters in a variety of contexts. These were classified as
Knowledge, Understanding and Application as described below:
10 Source regarding cognitive process/Domain :- 1. https://en.wikipedia.org/wiki/Bloom%27s_taxonomy2. Teaching of Social Science by Dr. Renu Gupta.
Parameters classification for test construction in Mathematics
Knowledge: In items testing this process, students are expected to answer using
simple knowledge (recall) or recognition of terms and/or concepts
familiar from their lessons.
Comprehension/Understanding: Demonstrate understanding of facts and ideas by
organizing, comparing, translating, interpreting,
giving descriptions, and stating the main ideas
Translation
Interpretation
Extrapolation
Application: Using acquired knowledge. Solve problems in new situations by applying
acquired knowledge, facts, techniques and rules.
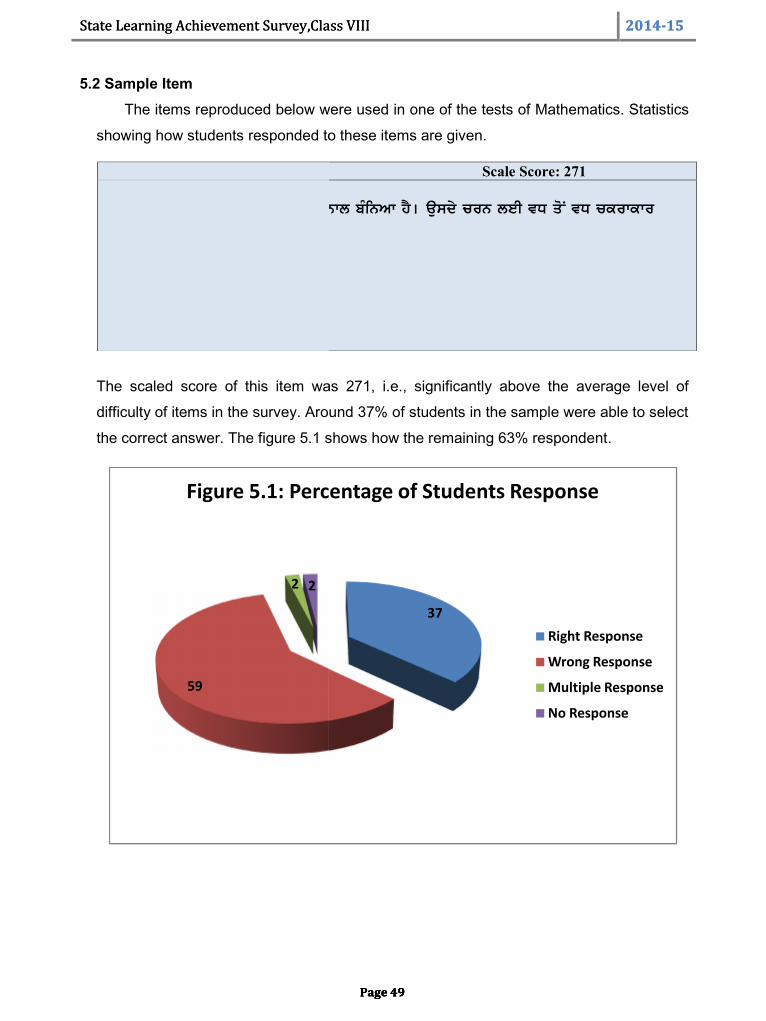
State Learning Achievement Survey,Class VIII 2014-15
Page 49
5.2 Sample ItemThe items reproduced below were used in one of the tests of Mathematics. Statistics
showing how students responded to these items are given.
The scaled score of this item was 271, i.e., significantly above the average level of
difficulty of items in the survey. Around 37% of students in the sample were able to select
the correct answer. The figure 5.1 shows how the remaining 63% respondent.
59
2 2
Figure 5.1: Percentage of Students Response
Sample Item : 6 (21) Scale Score: 271
gqPB 6H fJZe GoVw 7 mItr lMby r~sy nwl bMinAw hY[ ausdy crn leI vD qoN vD ckrwkwr
KyqrPl hY:
1H 149 vrgsm2H 500 vrgsm3H 44 vrgsm4H 154 vrgsm
State Learning Achievement Survey,Class VIII 2014-15
Page 49
5.2 Sample ItemThe items reproduced below were used in one of the tests of Mathematics. Statistics
showing how students responded to these items are given.
The scaled score of this item was 271, i.e., significantly above the average level of
difficulty of items in the survey. Around 37% of students in the sample were able to select
the correct answer. The figure 5.1 shows how the remaining 63% respondent.
37
Figure 5.1: Percentage of Students Response
Right Response
Wrong Response
Multiple Response
No Response
Sample Item : 6 (21) Scale Score: 271
gqPB 6H fJZe GoVw 7 mItr lMby r~sy nwl bMinAw hY[ ausdy crn leI vD qoN vD ckrwkwr
KyqrPl hY:
1H 149 vrgsm2H 500 vrgsm3H 44 vrgsm4H 154 vrgsm
State Learning Achievement Survey,Class VIII 2014-15
Page 49
5.2 Sample ItemThe items reproduced below were used in one of the tests of Mathematics. Statistics
showing how students responded to these items are given.
The scaled score of this item was 271, i.e., significantly above the average level of
difficulty of items in the survey. Around 37% of students in the sample were able to select
the correct answer. The figure 5.1 shows how the remaining 63% respondent.
Right Response
Wrong Response
Multiple Response
No Response
Sample Item : 6 (21) Scale Score: 271
gqPB 6H fJZe GoVw 7 mItr lMby r~sy nwl bMinAw hY[ ausdy crn leI vD qoN vD ckrwkwr
KyqrPl hY:
1H 149 vrgsm2H 500 vrgsm3H 44 vrgsm4H 154 vrgsm
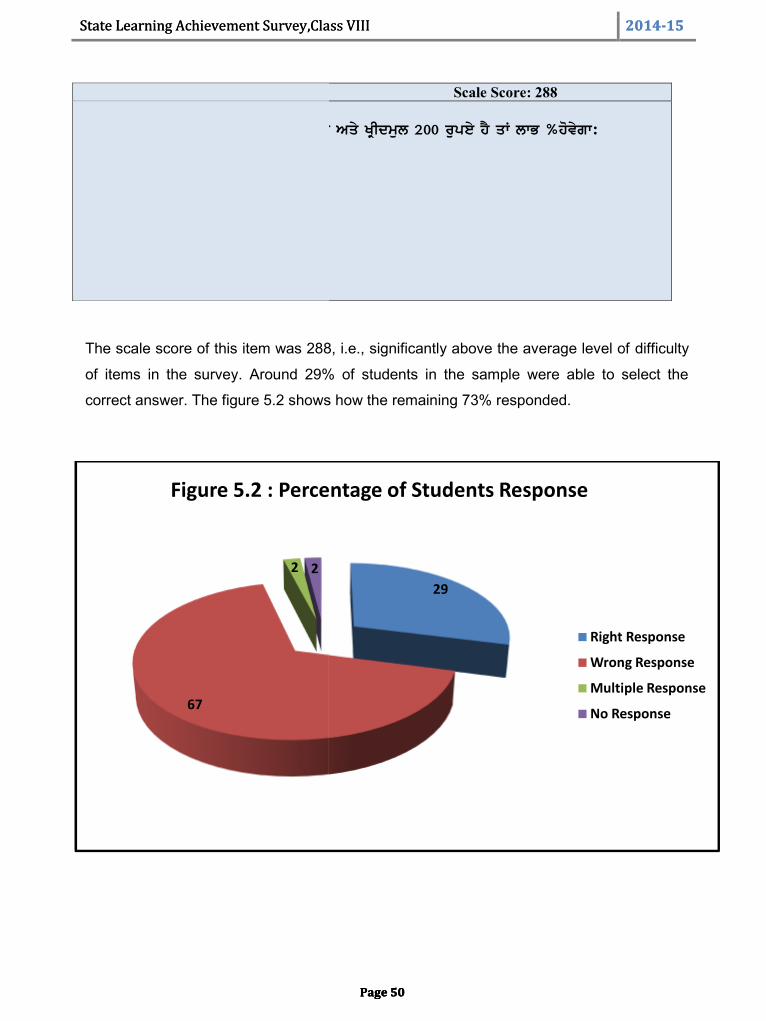
State Learning Achievement Survey,Class VIII 2014-15
Page 50
The scale score of this item was 288, i.e., significantly above the average level of difficulty
of items in the survey. Around 29% of students in the sample were able to select the
correct answer. The figure 5.2 shows how the remaining 73% responded.
67
2 2
Figure 5.2 : Percentage of Students Response
Sample Item :10(21) Scale Score: 288
pRSn 10: jykr vycmul 220 rupey Aqy KRIdmul 200 rupey hY qW lwB %hovygw:
1. 10%
2. 12%
3. 20%
4. 25%
State Learning Achievement Survey,Class VIII 2014-15
Page 50
The scale score of this item was 288, i.e., significantly above the average level of difficulty
of items in the survey. Around 29% of students in the sample were able to select the
correct answer. The figure 5.2 shows how the remaining 73% responded.
29
Figure 5.2 : Percentage of Students Response
Right Response
Wrong Response
Multiple Response
No Response
Sample Item :10(21) Scale Score: 288
pRSn 10: jykr vycmul 220 rupey Aqy KRIdmul 200 rupey hY qW lwB %hovygw:
1. 10%
2. 12%
3. 20%
4. 25%
State Learning Achievement Survey,Class VIII 2014-15
Page 50
The scale score of this item was 288, i.e., significantly above the average level of difficulty
of items in the survey. Around 29% of students in the sample were able to select the
correct answer. The figure 5.2 shows how the remaining 73% responded.
Right Response
Wrong Response
Multiple Response
No Response
Sample Item :10(21) Scale Score: 288
pRSn 10: jykr vycmul 220 rupey Aqy KRIdmul 200 rupey hY qW lwB %hovygw:
1. 10%
2. 12%
3. 20%
4. 25%
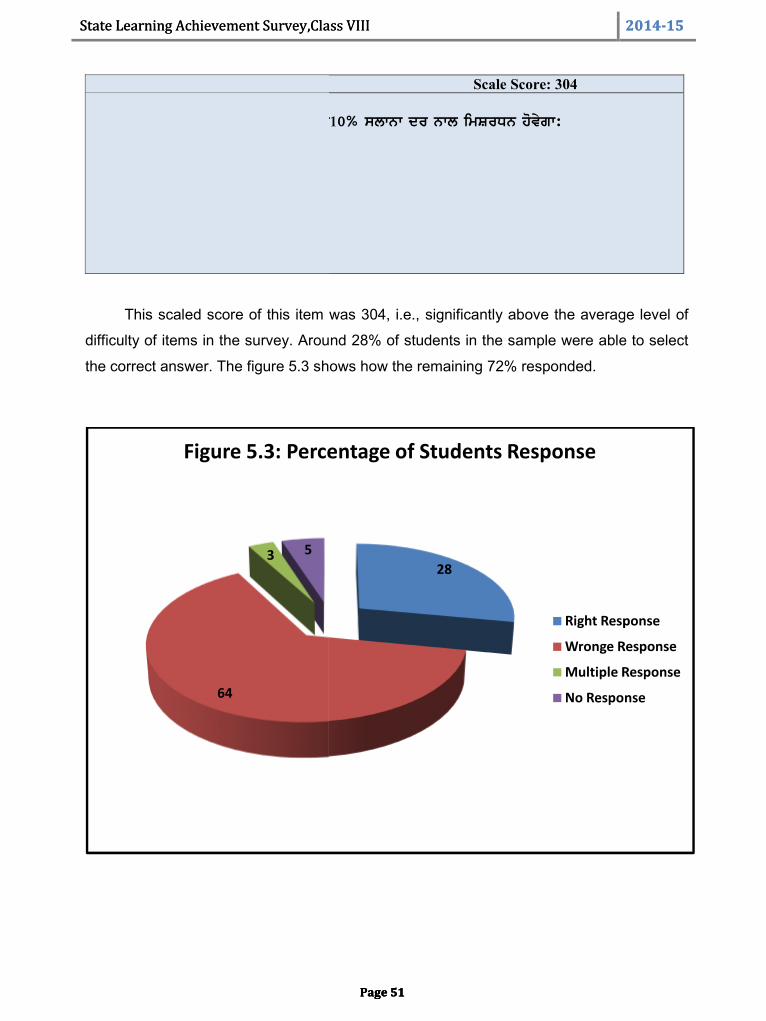
State Learning Achievement Survey,Class VIII 2014-15
Page 51
Sample Item : 18 (21) Scale Score: 304
gqPB18H 4000 rupey dw iqNn swlW ivc10% slwnw dr nwl imSrDn hovygw:
1H 4324 rupey
2H 4254 rupey
3H 5324 rupey
4H ienWH ivcoN koeI nhIN
This scaled score of this item was 304, i.e., significantly above the average level of
difficulty of items in the survey. Around 28% of students in the sample were able to select
the correct answer. The figure 5.3 shows how the remaining 72% responded.
64
3 5
Figure 5.3: Percentage of Students Response
State Learning Achievement Survey,Class VIII 2014-15
Page 51
Sample Item : 18 (21) Scale Score: 304
gqPB18H 4000 rupey dw iqNn swlW ivc10% slwnw dr nwl imSrDn hovygw:
1H 4324 rupey
2H 4254 rupey
3H 5324 rupey
4H ienWH ivcoN koeI nhIN
This scaled score of this item was 304, i.e., significantly above the average level of
difficulty of items in the survey. Around 28% of students in the sample were able to select
the correct answer. The figure 5.3 shows how the remaining 72% responded.
28
Figure 5.3: Percentage of Students Response
Right Response
Wronge Response
Multiple Response
No Response
State Learning Achievement Survey,Class VIII 2014-15
Page 51
Sample Item : 18 (21) Scale Score: 304
gqPB18H 4000 rupey dw iqNn swlW ivc10% slwnw dr nwl imSrDn hovygw:
1H 4324 rupey
2H 4254 rupey
3H 5324 rupey
4H ienWH ivcoN koeI nhIN
This scaled score of this item was 304, i.e., significantly above the average level of
difficulty of items in the survey. Around 28% of students in the sample were able to select
the correct answer. The figure 5.3 shows how the remaining 72% responded.
Right Response
Wronge Response
Multiple Response
No Response
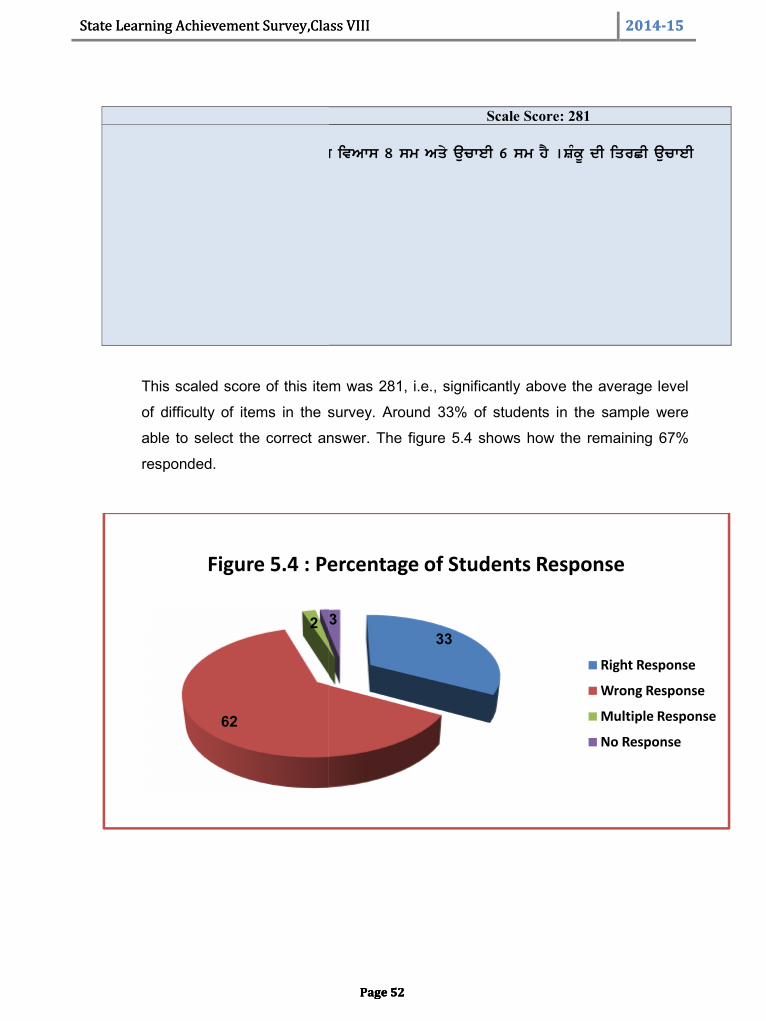
State Learning Achievement Survey,Class VIII 2014-15
Page 52
Sample Item : 21(21) Scale Score: 281
gqPB21H iek SMkU dw ADwr dw ArD ivAws 8 sm Aqy aucweI 6 sm hY [SMkU dI iqrCI aucweIhovygI:
1H 30 ;w
2H 10 ;w
3H 20 ;w
4H 14 ;w
This scaled score of this item was 281, i.e., significantly above the average level
of difficulty of items in the survey. Around 33% of students in the sample were
able to select the correct answer. The figure 5.4 shows how the remaining 67%
responded.
62
2 3
Figure 5.4 : Percentage of Students Response
State Learning Achievement Survey,Class VIII 2014-15
Page 52
Sample Item : 21(21) Scale Score: 281
gqPB21H iek SMkU dw ADwr dw ArD ivAws 8 sm Aqy aucweI 6 sm hY [SMkU dI iqrCI aucweIhovygI:
1H 30 ;w
2H 10 ;w
3H 20 ;w
4H 14 ;w
This scaled score of this item was 281, i.e., significantly above the average level
of difficulty of items in the survey. Around 33% of students in the sample were
able to select the correct answer. The figure 5.4 shows how the remaining 67%
responded.
333
Figure 5.4 : Percentage of Students Response
Right Response
Wrong Response
Multiple Response
No Response
State Learning Achievement Survey,Class VIII 2014-15
Page 52
Sample Item : 21(21) Scale Score: 281
gqPB21H iek SMkU dw ADwr dw ArD ivAws 8 sm Aqy aucweI 6 sm hY [SMkU dI iqrCI aucweIhovygI:
1H 30 ;w
2H 10 ;w
3H 20 ;w
4H 14 ;w
This scaled score of this item was 281, i.e., significantly above the average level
of difficulty of items in the survey. Around 33% of students in the sample were
able to select the correct answer. The figure 5.4 shows how the remaining 67%
responded.
Figure 5.4 : Percentage of Students Response
Right Response
Wrong Response
Multiple Response
No Response
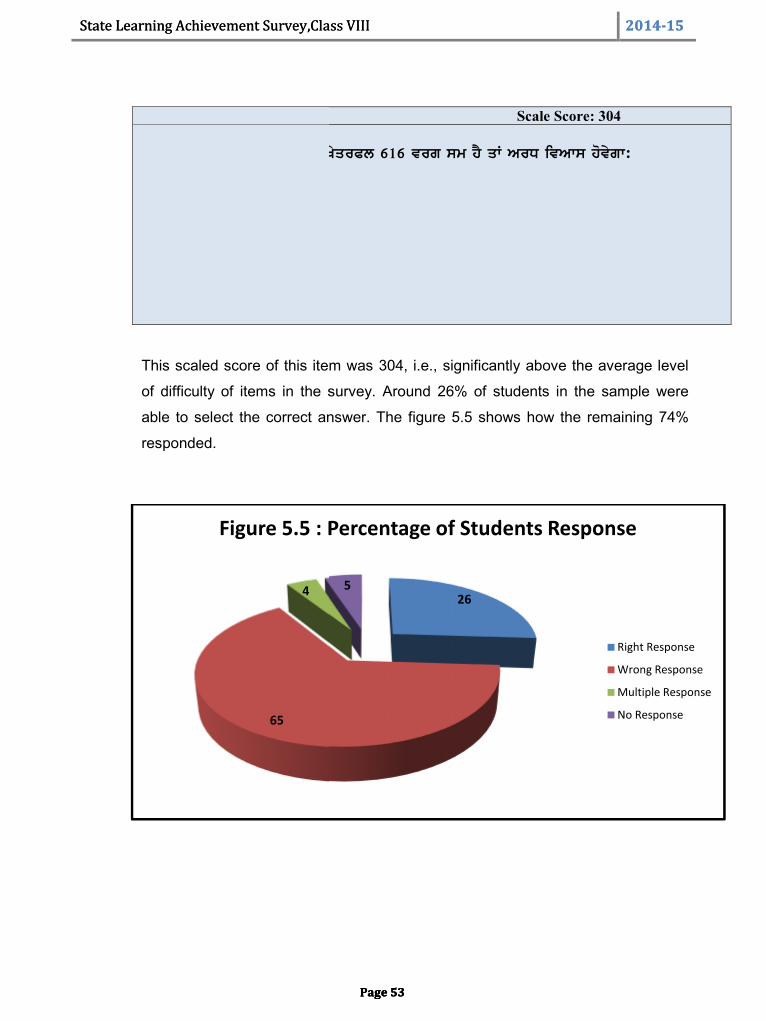
State Learning Achievement Survey,Class VIII 2014-15
Page 53
Sample Item :25 (21) Scale Score: 304
gq;aB 25H fJZe goly dI sqwH dk KyqrPl 616 vrg sm hY qW ArD ivAws hovygw:
1H 21 ;w
2H 7 ;w
3H 14 ;w
4H 49 ;w
This scaled score of this item was 304, i.e., significantly above the average level
of difficulty of items in the survey. Around 26% of students in the sample were
able to select the correct answer. The figure 5.5 shows how the remaining 74%
responded.
65
4
Figure 5.5 : Percentage of Students Response
State Learning Achievement Survey,Class VIII 2014-15
Page 53
Sample Item :25 (21) Scale Score: 304
gq;aB 25H fJZe goly dI sqwH dk KyqrPl 616 vrg sm hY qW ArD ivAws hovygw:
1H 21 ;w
2H 7 ;w
3H 14 ;w
4H 49 ;w
This scaled score of this item was 304, i.e., significantly above the average level
of difficulty of items in the survey. Around 26% of students in the sample were
able to select the correct answer. The figure 5.5 shows how the remaining 74%
responded.
265
Figure 5.5 : Percentage of Students Response
Right Response
Wrong Response
Multiple Response
No Response
State Learning Achievement Survey,Class VIII 2014-15
Page 53
Sample Item :25 (21) Scale Score: 304
gq;aB 25H fJZe goly dI sqwH dk KyqrPl 616 vrg sm hY qW ArD ivAws hovygw:
1H 21 ;w
2H 7 ;w
3H 14 ;w
4H 49 ;w
This scaled score of this item was 304, i.e., significantly above the average level
of difficulty of items in the survey. Around 26% of students in the sample were
able to select the correct answer. The figure 5.5 shows how the remaining 74%
responded.
Figure 5.5 : Percentage of Students Response
Right Response
Wrong Response
Multiple Response
No Response
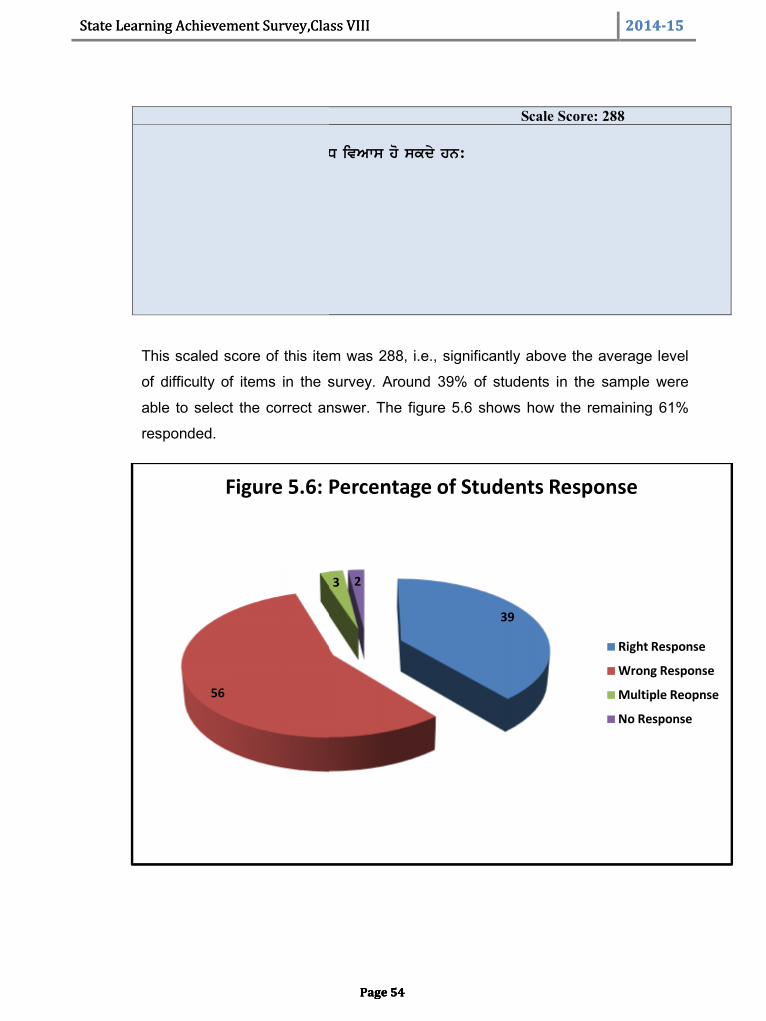
State Learning Achievement Survey,Class VIII 2014-15
Page 54
Sample Item :35(22) Scale Score: 288
gqPB35H iek ckr dy ikMny ArD ivAws ho skdy hn:1. 1
2. 2
3. Anyk
4. koeI nhIN
This scaled score of this item was 288, i.e., significantly above the average level
of difficulty of items in the survey. Around 39% of students in the sample were
able to select the correct answer. The figure 5.6 shows how the remaining 61%
responded.
56
3
Figure 5.6: Percentage of Students Response
State Learning Achievement Survey,Class VIII 2014-15
Page 54
Sample Item :35(22) Scale Score: 288
gqPB35H iek ckr dy ikMny ArD ivAws ho skdy hn:1. 1
2. 2
3. Anyk
4. koeI nhIN
This scaled score of this item was 288, i.e., significantly above the average level
of difficulty of items in the survey. Around 39% of students in the sample were
able to select the correct answer. The figure 5.6 shows how the remaining 61%
responded.
39
3 2
Figure 5.6: Percentage of Students Response
Right Response
Wrong Response
Multiple Reopnse
No Response
State Learning Achievement Survey,Class VIII 2014-15
Page 54
Sample Item :35(22) Scale Score: 288
gqPB35H iek ckr dy ikMny ArD ivAws ho skdy hn:1. 1
2. 2
3. Anyk
4. koeI nhIN
This scaled score of this item was 288, i.e., significantly above the average level
of difficulty of items in the survey. Around 39% of students in the sample were
able to select the correct answer. The figure 5.6 shows how the remaining 61%
responded.
Figure 5.6: Percentage of Students Response
Right Response
Wrong Response
Multiple Reopnse
No Response
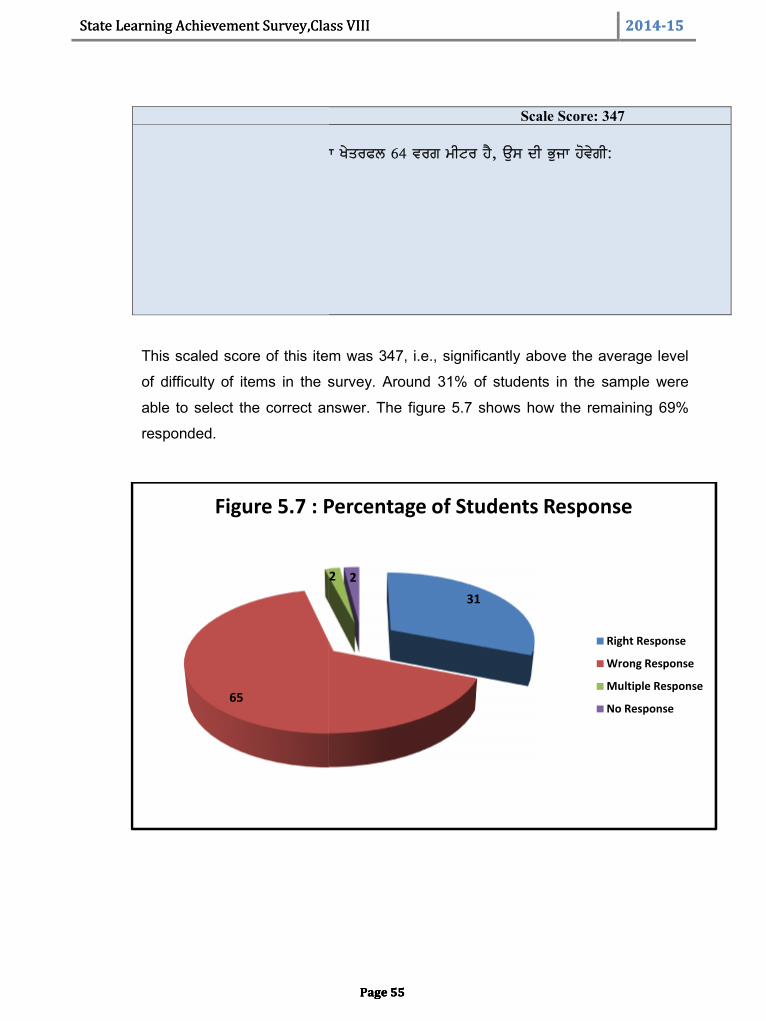
State Learning Achievement Survey,Class VIII 2014-15
Page 55
Sample Item : 22(22) Scale Score: 347
pRSn22H fe;/ torkeko gkoe dk y/socb 64 tor whNo j?, T[; dh G[ik j't/rhL1H 4 whNo
2H 16 whNo
3H 18whNo
4H 8whNo
This scaled score of this item was 347, i.e., significantly above the average level
of difficulty of items in the survey. Around 31% of students in the sample were
able to select the correct answer. The figure 5.7 shows how the remaining 69%
responded.
65
2
Figure 5.7 : Percentage of Students Response
State Learning Achievement Survey,Class VIII 2014-15
Page 55
Sample Item : 22(22) Scale Score: 347
pRSn22H fe;/ torkeko gkoe dk y/socb 64 tor whNo j?, T[; dh G[ik j't/rhL1H 4 whNo
2H 16 whNo
3H 18whNo
4H 8whNo
This scaled score of this item was 347, i.e., significantly above the average level
of difficulty of items in the survey. Around 31% of students in the sample were
able to select the correct answer. The figure 5.7 shows how the remaining 69%
responded.
31
2 2
Figure 5.7 : Percentage of Students Response
Right Response
Wrong Response
Multiple Response
No Response
State Learning Achievement Survey,Class VIII 2014-15
Page 55
Sample Item : 22(22) Scale Score: 347
pRSn22H fe;/ torkeko gkoe dk y/socb 64 tor whNo j?, T[; dh G[ik j't/rhL1H 4 whNo
2H 16 whNo
3H 18whNo
4H 8whNo
This scaled score of this item was 347, i.e., significantly above the average level
of difficulty of items in the survey. Around 31% of students in the sample were
able to select the correct answer. The figure 5.7 shows how the remaining 69%
responded.
Figure 5.7 : Percentage of Students Response
Right Response
Wrong Response
Multiple Response
No Response
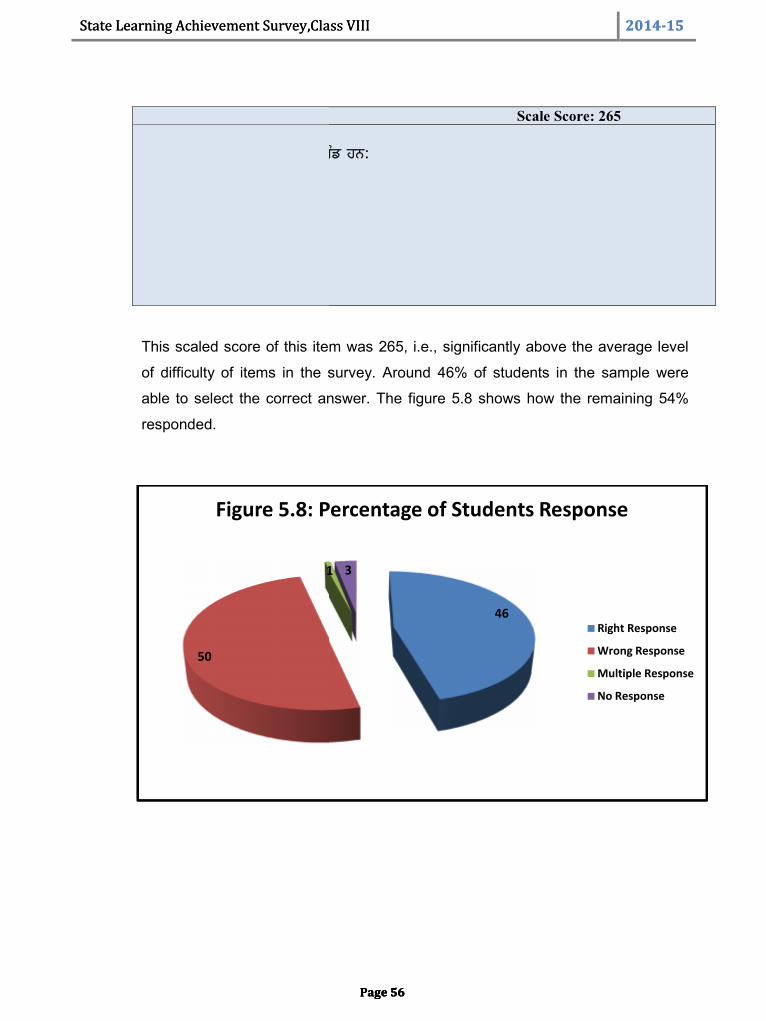
State Learning Achievement Survey,Class VIII 2014-15
Page 56
Sample Item:25(22) Scale Score: 265
pRSn25H x2 + y2 + 2xy d/ r[DByzv jBL
1H (x-2y)( x + 2y )
2H (x + y)2
3H (x- y )2
4H ( x + 2 y)2
This scaled score of this item was 265, i.e., significantly above the average level
of difficulty of items in the survey. Around 46% of students in the sample were
able to select the correct answer. The figure 5.8 shows how the remaining 54%
responded.
50
1
Figure 5.8: Percentage of Students Response
State Learning Achievement Survey,Class VIII 2014-15
Page 56
Sample Item:25(22) Scale Score: 265
pRSn25H x2 + y2 + 2xy d/ r[DByzv jBL
1H (x-2y)( x + 2y )
2H (x + y)2
3H (x- y )2
4H ( x + 2 y)2
This scaled score of this item was 265, i.e., significantly above the average level
of difficulty of items in the survey. Around 46% of students in the sample were
able to select the correct answer. The figure 5.8 shows how the remaining 54%
responded.
46
1 3
Figure 5.8: Percentage of Students Response
Right Response
Wrong Response
Multiple Response
No Response
State Learning Achievement Survey,Class VIII 2014-15
Page 56
Sample Item:25(22) Scale Score: 265
pRSn25H x2 + y2 + 2xy d/ r[DByzv jBL
1H (x-2y)( x + 2y )
2H (x + y)2
3H (x- y )2
4H ( x + 2 y)2
This scaled score of this item was 265, i.e., significantly above the average level
of difficulty of items in the survey. Around 46% of students in the sample were
able to select the correct answer. The figure 5.8 shows how the remaining 54%
responded.
Figure 5.8: Percentage of Students Response
Right Response
Wrong Response
Multiple Response
No Response
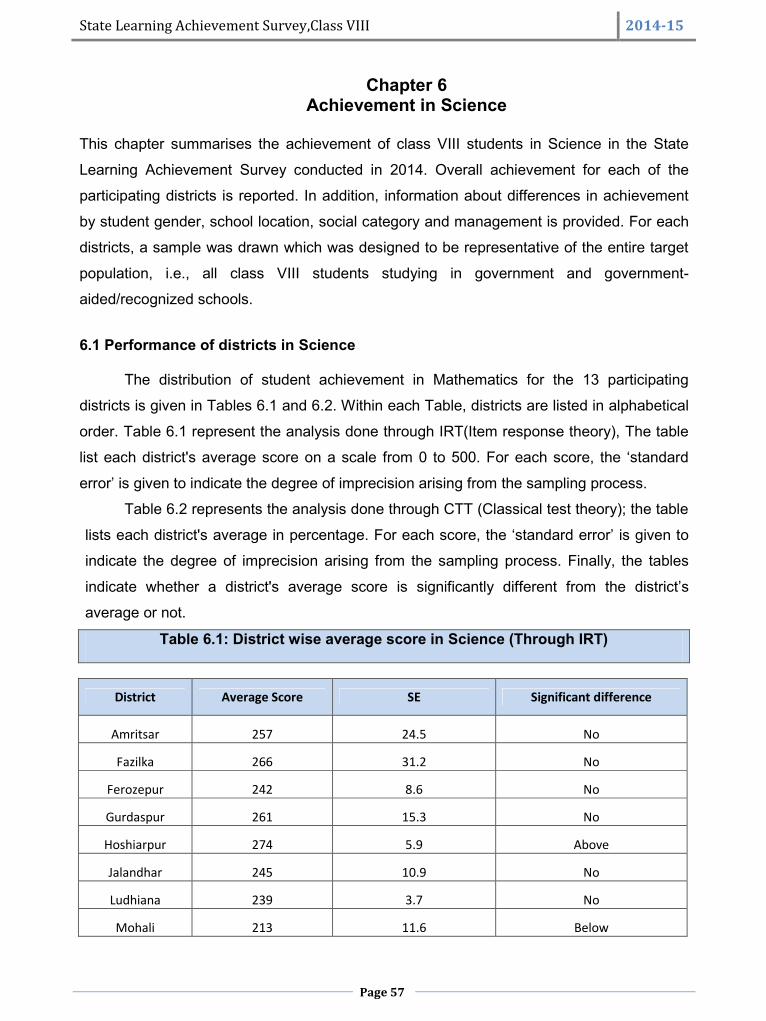
State Learning Achievement Survey,Class VIII 2014-15
Page 57
Chapter 6Achievement in Science
This chapter summarises the achievement of class VIII students in Science in the State
Learning Achievement Survey conducted in 2014. Overall achievement for each of the
participating districts is reported. In addition, information about differences in achievement
by student gender, school location, social category and management is provided. For each
districts, a sample was drawn which was designed to be representative of the entire target
population, i.e., all class VIII students studying in government and government-
aided/recognized schools.
6.1 Performance of districts in Science
The distribution of student achievement in Mathematics for the 13 participating
districts is given in Tables 6.1 and 6.2. Within each Table, districts are listed in alphabetical
order. Table 6.1 represent the analysis done through IRT(Item response theory), The table
list each district's average score on a scale from 0 to 500. For each score, the ‘standard
error’ is given to indicate the degree of imprecision arising from the sampling process.
Table 6.2 represents the analysis done through CTT (Classical test theory); the table
lists each district's average in percentage. For each score, the ‘standard error’ is given to
indicate the degree of imprecision arising from the sampling process. Finally, the tables
indicate whether a district's average score is significantly different from the district’s
average or not.
Table 6.1: District wise average score in Science (Through IRT)
District Average Score SE Significant difference
Amritsar 257 24.5 No
Fazilka 266 31.2 No
Ferozepur 242 8.6 No
Gurdaspur 261 15.3 No
Hoshiarpur 274 5.9 Above
Jalandhar 245 10.9 No
Ludhiana 239 3.7 No
Mohali 213 11.6 Below
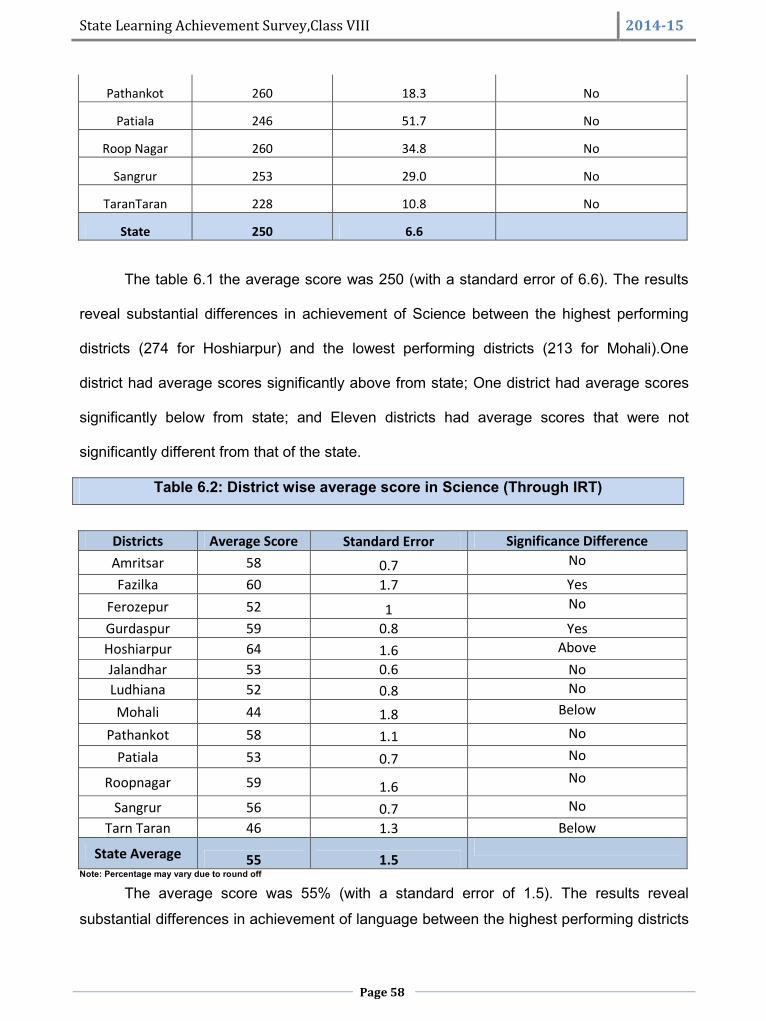
State Learning Achievement Survey,Class VIII 2014-15
Page 58
Pathankot 260 18.3 No
Patiala 246 51.7 No
Roop Nagar 260 34.8 No
Sangrur 253 29.0 No
TaranTaran 228 10.8 No
State 250 6.6
The table 6.1 the average score was 250 (with a standard error of 6.6). The results
reveal substantial differences in achievement of Science between the highest performing
districts (274 for Hoshiarpur) and the lowest performing districts (213 for Mohali).One
district had average scores significantly above from state; One district had average scores
significantly below from state; and Eleven districts had average scores that were not
significantly different from that of the state.
Table 6.2: District wise average score in Science (Through IRT)
Districts Average Score Standard Error Significance DifferenceAmritsar 58 0.7 No
Fazilka 60 1.7 YesFerozepur 52 1 No
Gurdaspur 59 0.8 YesHoshiarpur 64 1.6 AboveJalandhar 53 0.6 NoLudhiana 52 0.8 NoMohali 44 1.8 Below
Pathankot 58 1.1 NoPatiala 53 0.7 No
Roopnagar 59 1.6 No
Sangrur 56 0.7 NoTarn Taran 46 1.3 Below
State Average 55 1.5Note: Percentage may vary due to round off
The average score was 55% (with a standard error of 1.5). The results reveal
substantial differences in achievement of language between the highest performing districts
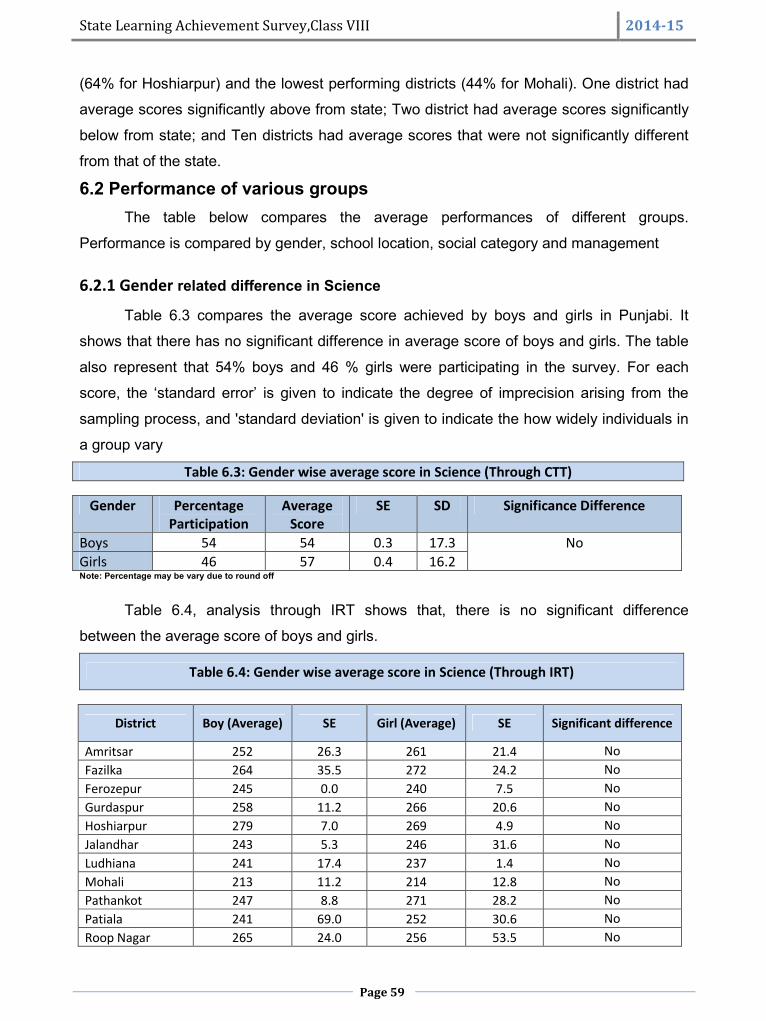
State Learning Achievement Survey,Class VIII 2014-15
Page 59
(64% for Hoshiarpur) and the lowest performing districts (44% for Mohali). One district had
average scores significantly above from state; Two district had average scores significantly
below from state; and Ten districts had average scores that were not significantly different
from that of the state.
6.2 Performance of various groupsThe table below compares the average performances of different groups.
Performance is compared by gender, school location, social category and management
6.2.1 Gender related difference in Science
Table 6.3 compares the average score achieved by boys and girls in Punjabi. It
shows that there has no significant difference in average score of boys and girls. The table
also represent that 54% boys and 46 % girls were participating in the survey. For each
score, the ‘standard error’ is given to indicate the degree of imprecision arising from the
sampling process, and 'standard deviation' is given to indicate the how widely individuals in
a group vary
Table 6.3: Gender wise average score in Science (Through CTT)
Gender PercentageParticipation
AverageScore
SE SD Significance Difference
Boys 54 54 0.3 17.3 NoGirls 46 57 0.4 16.2Note: Percentage may be vary due to round off
Table 6.4, analysis through IRT shows that, there is no significant difference
between the average score of boys and girls.
Table 6.4: Gender wise average score in Science (Through IRT)
District Boy (Average) SE Girl (Average) SE Significant difference
Amritsar 252 26.3 261 21.4 NoFazilka 264 35.5 272 24.2 NoFerozepur 245 0.0 240 7.5 NoGurdaspur 258 11.2 266 20.6 NoHoshiarpur 279 7.0 269 4.9 NoJalandhar 243 5.3 246 31.6 NoLudhiana 241 17.4 237 1.4 NoMohali 213 11.2 214 12.8 NoPathankot 247 8.8 271 28.2 NoPatiala 241 69.0 252 30.6 NoRoop Nagar 265 24.0 256 53.5 No
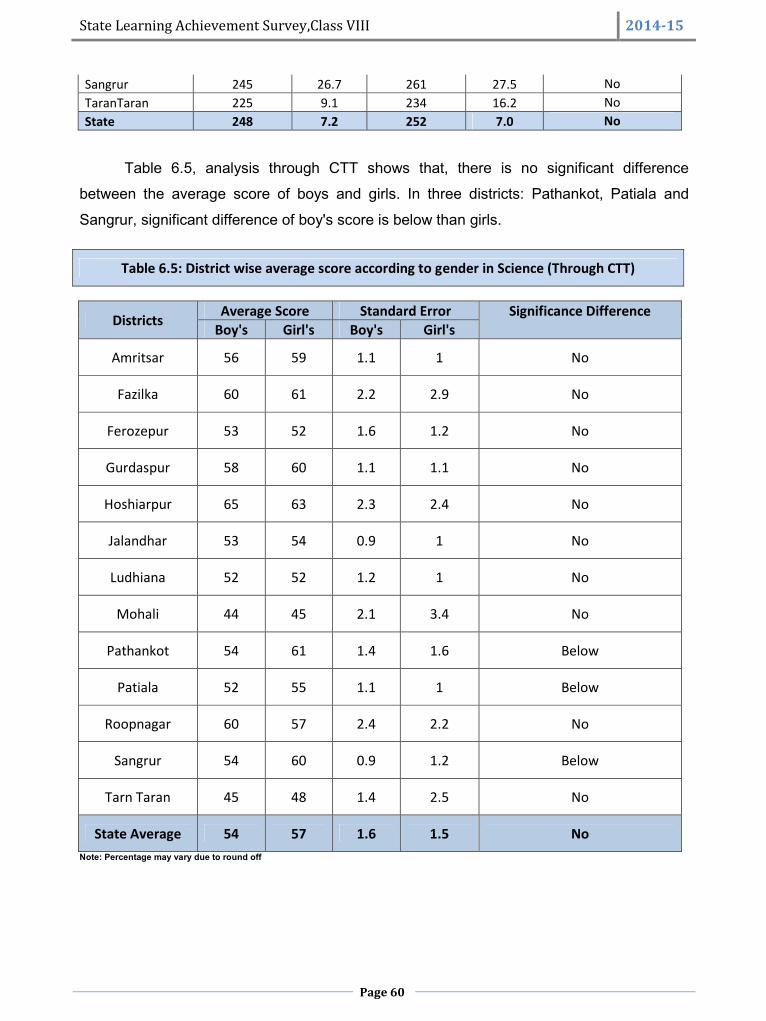
State Learning Achievement Survey,Class VIII 2014-15
Page 60
Sangrur 245 26.7 261 27.5 NoTaranTaran 225 9.1 234 16.2 NoState 248 7.2 252 7.0 No
Table 6.5, analysis through CTT shows that, there is no significant difference
between the average score of boys and girls. In three districts: Pathankot, Patiala and
Sangrur, significant difference of boy's score is below than girls.
Table 6.5: District wise average score according to gender in Science (Through CTT)
Districts Average Score Standard Error Significance DifferenceBoy's Girl's Boy's Girl's
Amritsar 56 59 1.1 1 No
Fazilka 60 61 2.2 2.9 No
Ferozepur 53 52 1.6 1.2 No
Gurdaspur 58 60 1.1 1.1 No
Hoshiarpur 65 63 2.3 2.4 No
Jalandhar 53 54 0.9 1 No
Ludhiana 52 52 1.2 1 No
Mohali 44 45 2.1 3.4 No
Pathankot 54 61 1.4 1.6 Below
Patiala 52 55 1.1 1 Below
Roopnagar 60 57 2.4 2.2 No
Sangrur 54 60 0.9 1.2 Below
Tarn Taran 45 48 1.4 2.5 No
State Average 54 57 1.6 1.5 NoNote: Percentage may vary due to round off
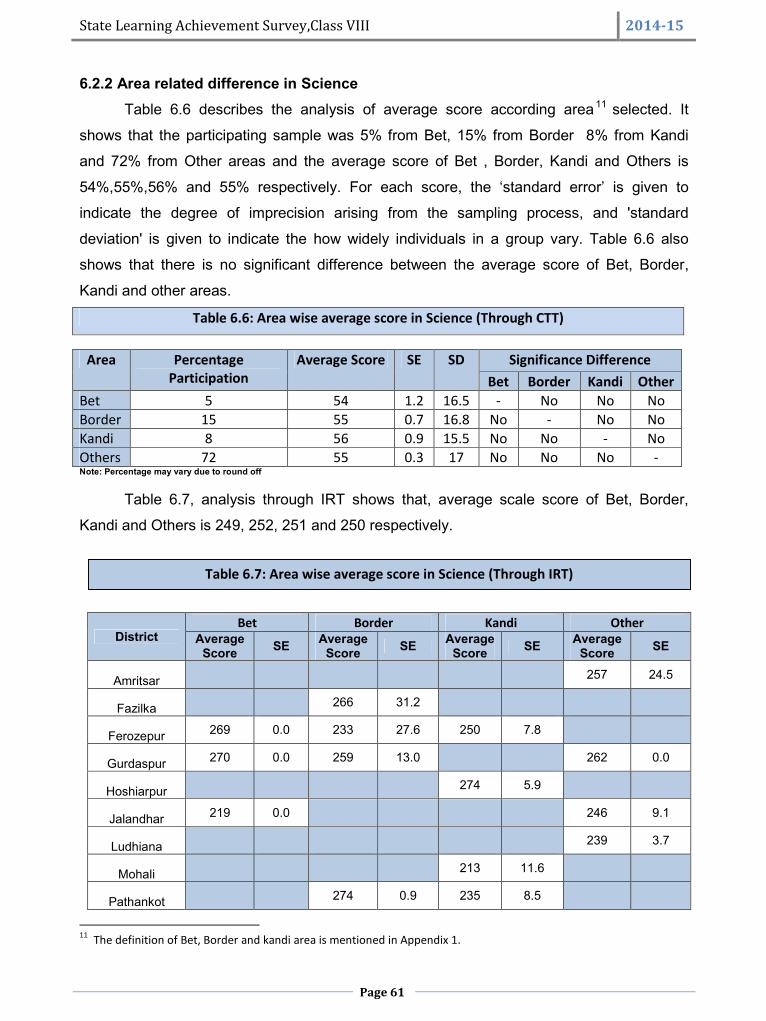
State Learning Achievement Survey,Class VIII 2014-15
Page 61
Table 6.7: Area wise average score in Science (Through IRT)
6.2.2 Area related difference in ScienceTable 6.6 describes the analysis of average score according area11 selected. It
shows that the participating sample was 5% from Bet, 15% from Border 8% from Kandi
and 72% from Other areas and the average score of Bet , Border, Kandi and Others is
54%,55%,56% and 55% respectively. For each score, the ‘standard error’ is given to
indicate the degree of imprecision arising from the sampling process, and 'standard
deviation' is given to indicate the how widely individuals in a group vary. Table 6.6 also
shows that there is no significant difference between the average score of Bet, Border,
Kandi and other areas.
Table 6.6: Area wise average score in Science (Through CTT)
Area PercentageParticipation
Average Score SE SD Significance DifferenceBet Border Kandi Other
Bet 5 54 1.2 16.5 - No No NoBorder 15 55 0.7 16.8 No - No NoKandi 8 56 0.9 15.5 No No - NoOthers 72 55 0.3 17 No No No -Note: Percentage may vary due to round off
Table 6.7, analysis through IRT shows that, average scale score of Bet, Border,
Kandi and Others is 249, 252, 251 and 250 respectively.
11 The definition of Bet, Border and kandi area is mentioned in Appendix 1.
DistrictBet Border Kandi Other
AverageScore SE Average
Score SE AverageScore SE Average
Score SE
Amritsar 257 24.5
Fazilka 266 31.2
Ferozepur 269 0.0 233 27.6 250 7.8
Gurdaspur 270 0.0 259 13.0 262 0.0
Hoshiarpur 274 5.9
Jalandhar 219 0.0 246 9.1
Ludhiana 239 3.7
Mohali 213 11.6
Pathankot 274 0.9 235 8.5
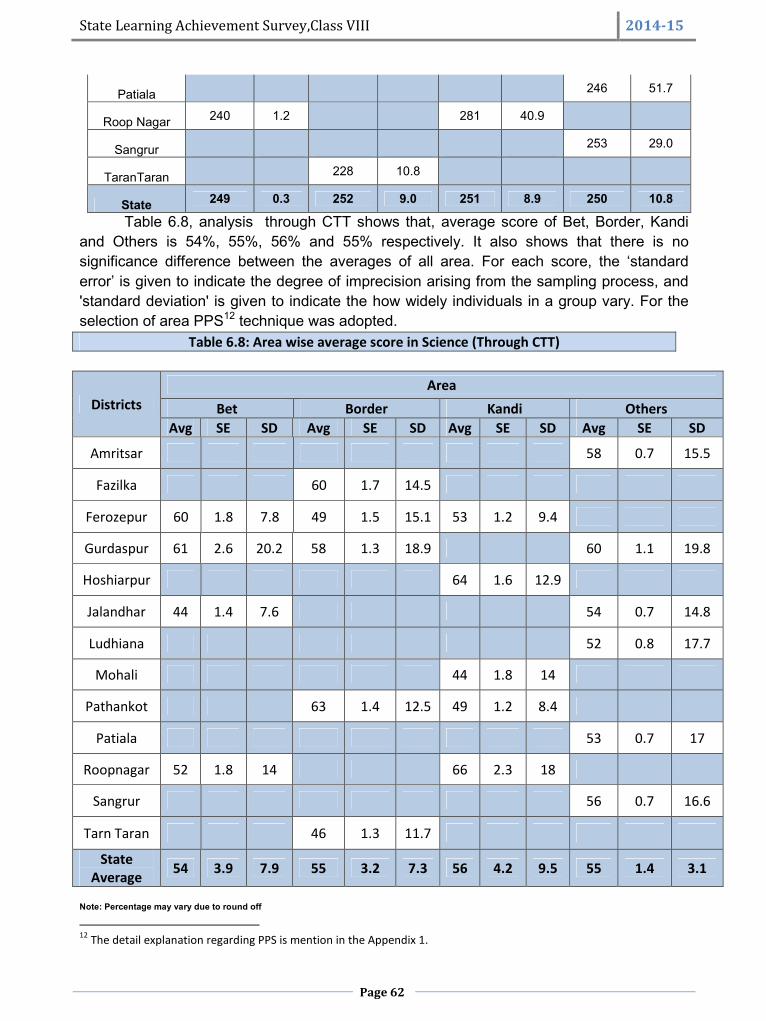
State Learning Achievement Survey,Class VIII 2014-15
Page 62
Table 6.8, analysis through CTT shows that, average score of Bet, Border, Kandiand Others is 54%, 55%, 56% and 55% respectively. It also shows that there is nosignificance difference between the averages of all area. For each score, the ‘standarderror’ is given to indicate the degree of imprecision arising from the sampling process, and'standard deviation' is given to indicate the how widely individuals in a group vary. For theselection of area PPS12 technique was adopted.
Table 6.8: Area wise average score in Science (Through CTT)
DistrictsArea
Bet Border Kandi OthersAvg SE SD Avg SE SD Avg SE SD Avg SE SD
Amritsar 58 0.7 15.5
Fazilka 60 1.7 14.5
Ferozepur 60 1.8 7.8 49 1.5 15.1 53 1.2 9.4
Gurdaspur 61 2.6 20.2 58 1.3 18.9 60 1.1 19.8
Hoshiarpur 64 1.6 12.9
Jalandhar 44 1.4 7.6 54 0.7 14.8
Ludhiana 52 0.8 17.7
Mohali 44 1.8 14
Pathankot 63 1.4 12.5 49 1.2 8.4
Patiala 53 0.7 17
Roopnagar 52 1.8 14 66 2.3 18
Sangrur 56 0.7 16.6
Tarn Taran 46 1.3 11.7
StateAverage 54 3.9 7.9 55 3.2 7.3 56 4.2 9.5 55 1.4 3.1
Note: Percentage may vary due to round off
12 The detail explanation regarding PPS is mention in the Appendix 1.
Patiala 246 51.7
Roop Nagar 240 1.2 281 40.9
Sangrur 253 29.0
TaranTaran 228 10.8
State 249 0.3 252 9.0 251 8.9 250 10.8
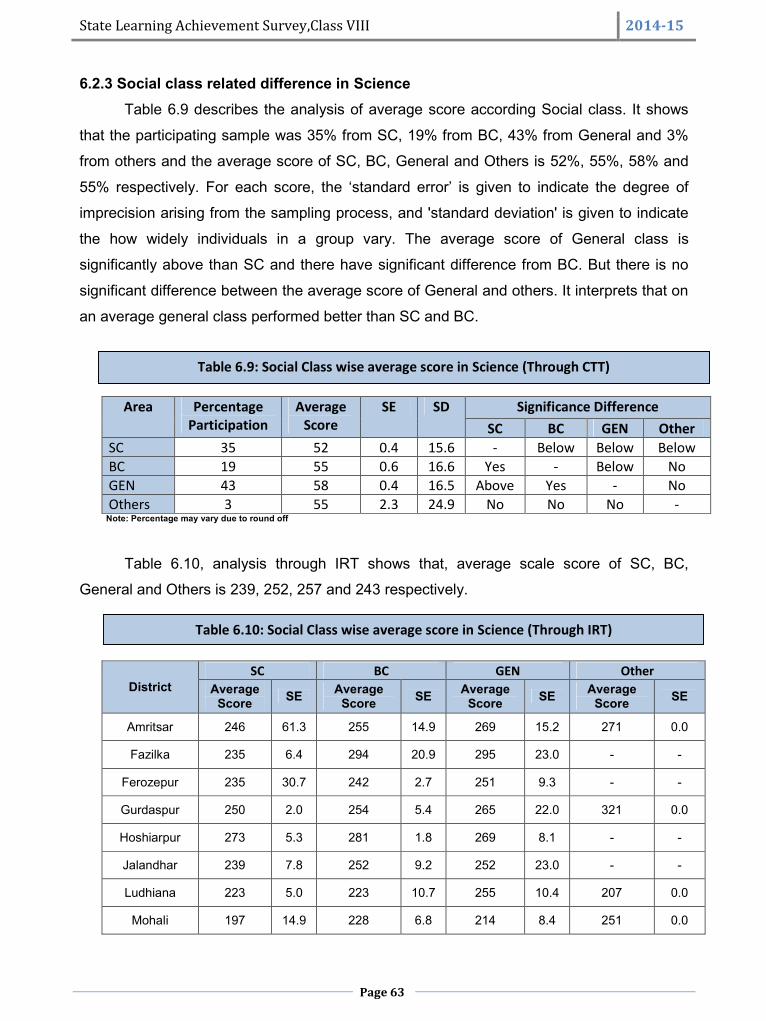
State Learning Achievement Survey,Class VIII 2014-15
Page 63
Table 6.9: Social Class wise average score in Science (Through CTT)
6.2.3 Social class related difference in ScienceTable 6.9 describes the analysis of average score according Social class. It shows
that the participating sample was 35% from SC, 19% from BC, 43% from General and 3%
from others and the average score of SC, BC, General and Others is 52%, 55%, 58% and
55% respectively. For each score, the ‘standard error’ is given to indicate the degree of
imprecision arising from the sampling process, and 'standard deviation' is given to indicate
the how widely individuals in a group vary. The average score of General class is
significantly above than SC and there have significant difference from BC. But there is no
significant difference between the average score of General and others. It interprets that on
an average general class performed better than SC and BC.
Area PercentageParticipation
AverageScore
SE SD Significance DifferenceSC BC GEN Other
SC 35 52 0.4 15.6 - Below Below BelowBC 19 55 0.6 16.6 Yes - Below NoGEN 43 58 0.4 16.5 Above Yes - NoOthers 3 55 2.3 24.9 No No No -
Note: Percentage may vary due to round off
Table 6.10, analysis through IRT shows that, average scale score of SC, BC,
General and Others is 239, 252, 257 and 243 respectively.
DistrictSC BC GEN Other
AverageScore SE Average
Score SE AverageScore SE Average
Score SE
Amritsar 246 61.3 255 14.9 269 15.2 271 0.0
Fazilka 235 6.4 294 20.9 295 23.0 - -
Ferozepur 235 30.7 242 2.7 251 9.3 - -
Gurdaspur 250 2.0 254 5.4 265 22.0 321 0.0
Hoshiarpur 273 5.3 281 1.8 269 8.1 - -
Jalandhar 239 7.8 252 9.2 252 23.0 - -
Ludhiana 223 5.0 223 10.7 255 10.4 207 0.0
Mohali 197 14.9 228 6.8 214 8.4 251 0.0
Table 6.10: Social Class wise average score in Science (Through IRT)
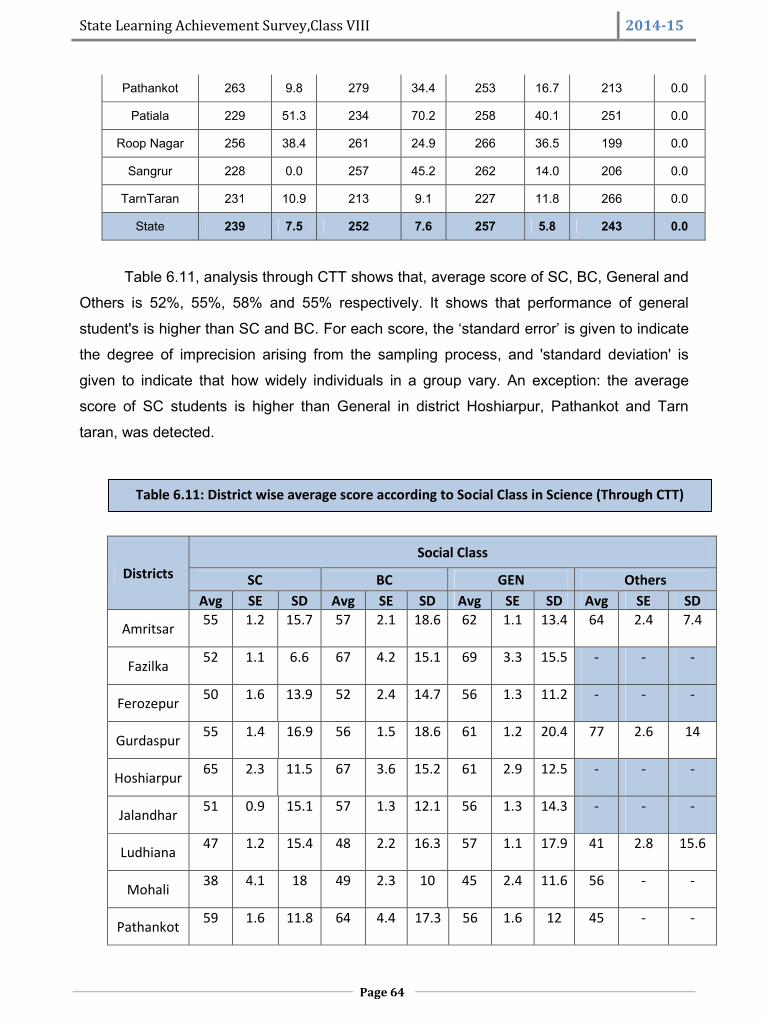
State Learning Achievement Survey,Class VIII 2014-15
Page 64
Table 6.11: District wise average score according to Social Class in Science (Through CTT)
Pathankot 263 9.8 279 34.4 253 16.7 213 0.0
Patiala 229 51.3 234 70.2 258 40.1 251 0.0
Roop Nagar 256 38.4 261 24.9 266 36.5 199 0.0
Sangrur 228 0.0 257 45.2 262 14.0 206 0.0
TarnTaran 231 10.9 213 9.1 227 11.8 266 0.0
State 239 7.5 252 7.6 257 5.8 243 0.0
Table 6.11, analysis through CTT shows that, average score of SC, BC, General and
Others is 52%, 55%, 58% and 55% respectively. It shows that performance of general
student's is higher than SC and BC. For each score, the ‘standard error’ is given to indicate
the degree of imprecision arising from the sampling process, and 'standard deviation' is
given to indicate that how widely individuals in a group vary. An exception: the average
score of SC students is higher than General in district Hoshiarpur, Pathankot and Tarn
taran, was detected.
DistrictsSocial Class
SC BC GEN OthersAvg SE SD Avg SE SD Avg SE SD Avg SE SD
Amritsar 55 1.2 15.7 57 2.1 18.6 62 1.1 13.4 64 2.4 7.4
Fazilka 52 1.1 6.6 67 4.2 15.1 69 3.3 15.5 - - -
Ferozepur 50 1.6 13.9 52 2.4 14.7 56 1.3 11.2 - - -
Gurdaspur 55 1.4 16.9 56 1.5 18.6 61 1.2 20.4 77 2.6 14
Hoshiarpur 65 2.3 11.5 67 3.6 15.2 61 2.9 12.5 - - -
Jalandhar 51 0.9 15.1 57 1.3 12.1 56 1.3 14.3 - - -
Ludhiana 47 1.2 15.4 48 2.2 16.3 57 1.1 17.9 41 2.8 15.6
Mohali 38 4.1 18 49 2.3 10 45 2.4 11.6 56 - -
Pathankot 59 1.6 11.8 64 4.4 17.3 56 1.6 12 45 - -
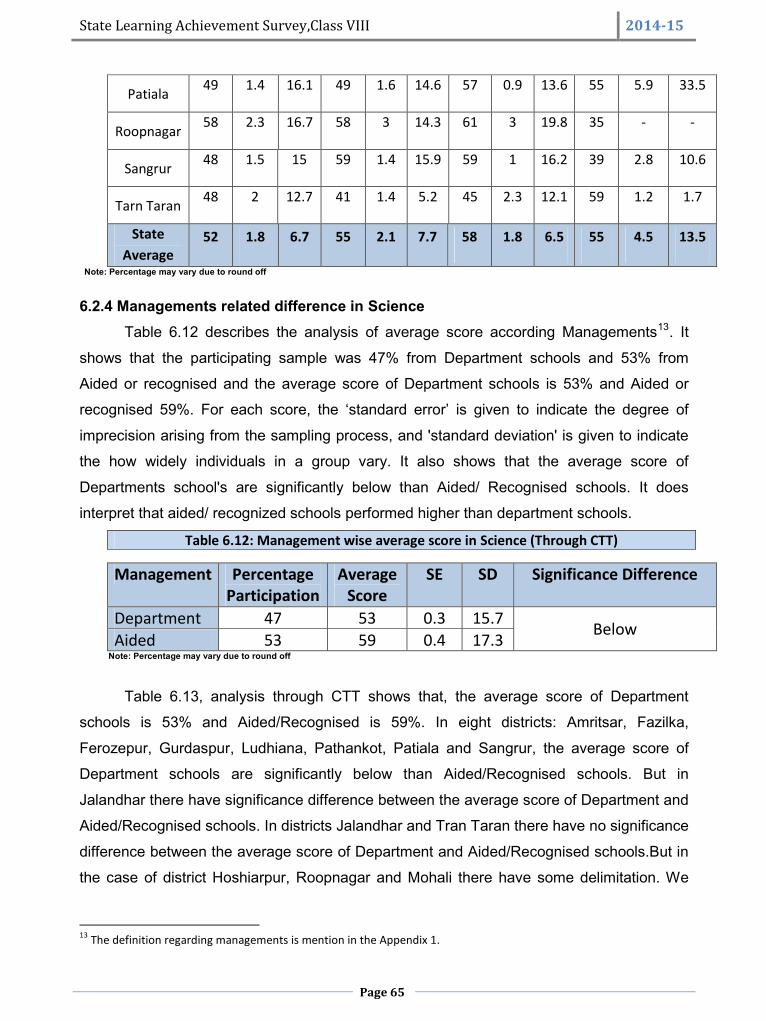
State Learning Achievement Survey,Class VIII 2014-15
Page 65
Patiala 49 1.4 16.1 49 1.6 14.6 57 0.9 13.6 55 5.9 33.5
Roopnagar 58 2.3 16.7 58 3 14.3 61 3 19.8 35 - -
Sangrur 48 1.5 15 59 1.4 15.9 59 1 16.2 39 2.8 10.6
Tarn Taran 48 2 12.7 41 1.4 5.2 45 2.3 12.1 59 1.2 1.7
StateAverage
52 1.8 6.7 55 2.1 7.7 58 1.8 6.5 55 4.5 13.5
Note: Percentage may vary due to round off
6.2.4 Managements related difference in ScienceTable 6.12 describes the analysis of average score according Managements13. It
shows that the participating sample was 47% from Department schools and 53% from
Aided or recognised and the average score of Department schools is 53% and Aided or
recognised 59%. For each score, the ‘standard error’ is given to indicate the degree of
imprecision arising from the sampling process, and 'standard deviation' is given to indicate
the how widely individuals in a group vary. It also shows that the average score of
Departments school's are significantly below than Aided/ Recognised schools. It does
interpret that aided/ recognized schools performed higher than department schools.
Table 6.12: Management wise average score in Science (Through CTT)
Management PercentageParticipation
AverageScore
SE SD Significance Difference
Department 47 53 0.3 15.7 BelowAided 53 59 0.4 17.3Note: Percentage may vary due to round off
Table 6.13, analysis through CTT shows that, the average score of Department
schools is 53% and Aided/Recognised is 59%. In eight districts: Amritsar, Fazilka,
Ferozepur, Gurdaspur, Ludhiana, Pathankot, Patiala and Sangrur, the average score of
Department schools are significantly below than Aided/Recognised schools. But in
Jalandhar there have significance difference between the average score of Department and
Aided/Recognised schools. In districts Jalandhar and Tran Taran there have no significance
difference between the average score of Department and Aided/Recognised schools.But in
the case of district Hoshiarpur, Roopnagar and Mohali there have some delimitation. We
13 The definition regarding managements is mention in the Appendix 1.
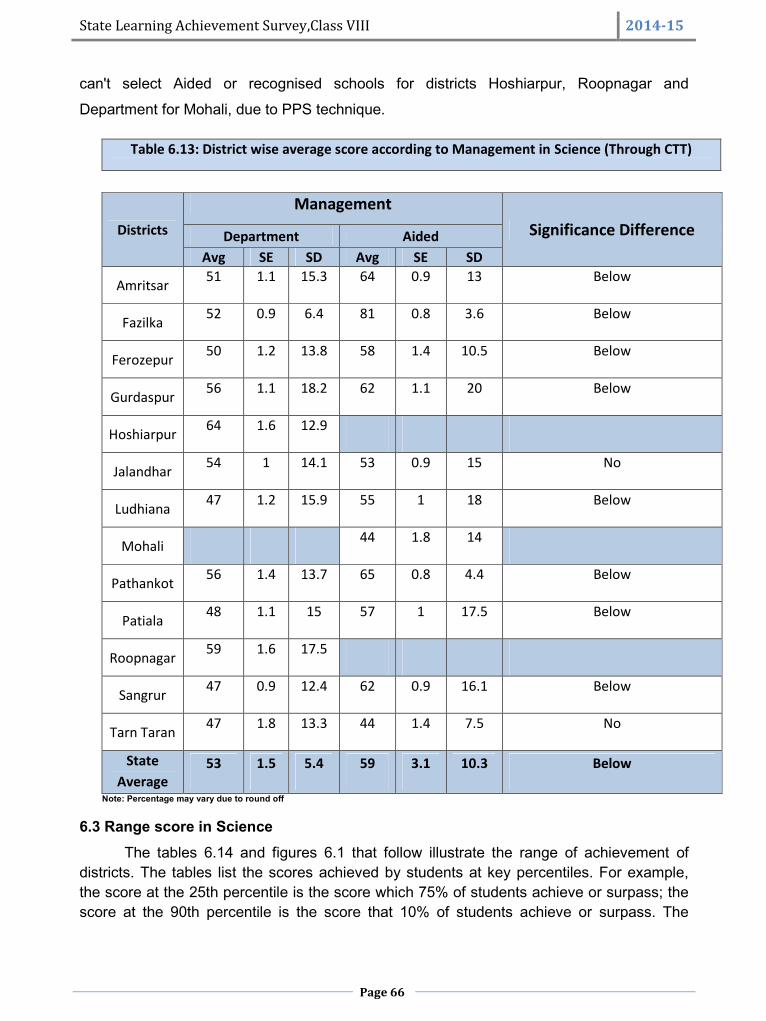
State Learning Achievement Survey,Class VIII 2014-15
Page 66
can't select Aided or recognised schools for districts Hoshiarpur, Roopnagar and
Department for Mohali, due to PPS technique.
Table 6.13: District wise average score according to Management in Science (Through CTT)
Districts
ManagementSignificance DifferenceDepartment Aided
Avg SE SD Avg SE SD
Amritsar 51 1.1 15.3 64 0.9 13 Below
Fazilka 52 0.9 6.4 81 0.8 3.6 Below
Ferozepur 50 1.2 13.8 58 1.4 10.5 Below
Gurdaspur 56 1.1 18.2 62 1.1 20 Below
Hoshiarpur 64 1.6 12.9
Jalandhar 54 1 14.1 53 0.9 15 No
Ludhiana 47 1.2 15.9 55 1 18 Below
Mohali 44 1.8 14
Pathankot 56 1.4 13.7 65 0.8 4.4 Below
Patiala 48 1.1 15 57 1 17.5 Below
Roopnagar 59 1.6 17.5
Sangrur 47 0.9 12.4 62 0.9 16.1 Below
Tarn Taran 47 1.8 13.3 44 1.4 7.5 No
StateAverage
53 1.5 5.4 59 3.1 10.3 Below
Note: Percentage may vary due to round off
6.3 Range score in ScienceThe tables 6.14 and figures 6.1 that follow illustrate the range of achievement of
districts. The tables list the scores achieved by students at key percentiles. For example,the score at the 25th percentile is the score which 75% of students achieve or surpass; thescore at the 90th percentile is the score that 10% of students achieve or surpass. The
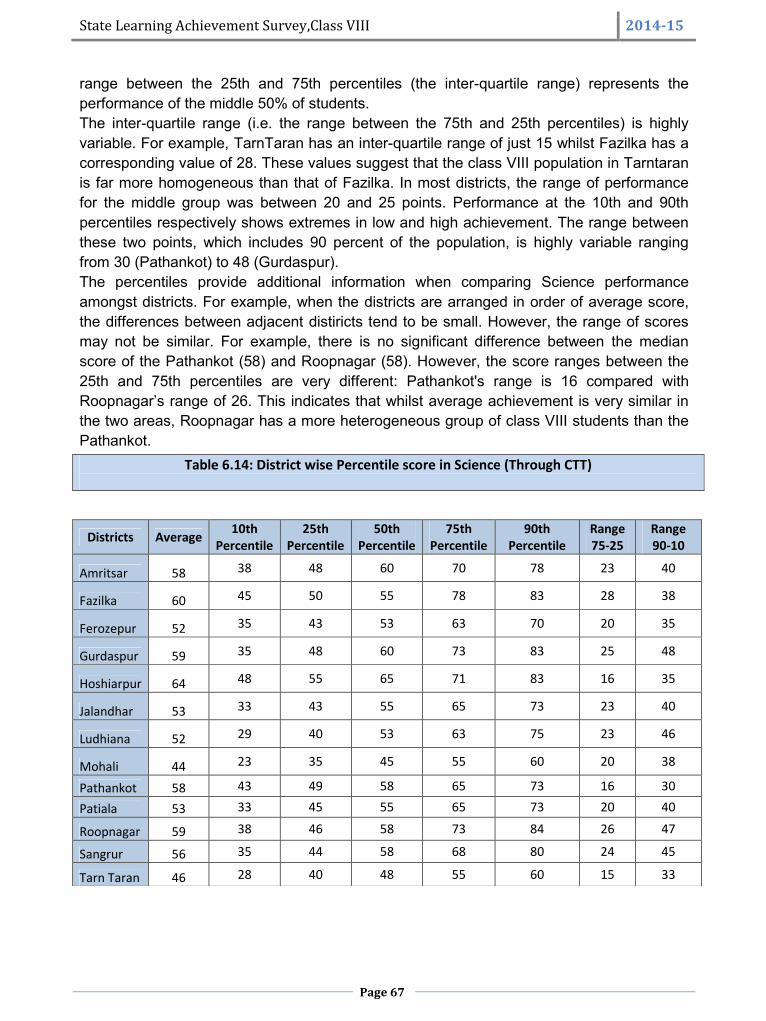
State Learning Achievement Survey,Class VIII 2014-15
Page 67
range between the 25th and 75th percentiles (the inter-quartile range) represents theperformance of the middle 50% of students.The inter-quartile range (i.e. the range between the 75th and 25th percentiles) is highlyvariable. For example, TarnTaran has an inter-quartile range of just 15 whilst Fazilka has acorresponding value of 28. These values suggest that the class VIII population in Tarntaranis far more homogeneous than that of Fazilka. In most districts, the range of performancefor the middle group was between 20 and 25 points. Performance at the 10th and 90thpercentiles respectively shows extremes in low and high achievement. The range betweenthese two points, which includes 90 percent of the population, is highly variable rangingfrom 30 (Pathankot) to 48 (Gurdaspur).The percentiles provide additional information when comparing Science performanceamongst districts. For example, when the districts are arranged in order of average score,the differences between adjacent distiricts tend to be small. However, the range of scoresmay not be similar. For example, there is no significant difference between the medianscore of the Pathankot (58) and Roopnagar (58). However, the score ranges between the25th and 75th percentiles are very different: Pathankot's range is 16 compared withRoopnagar’s range of 26. This indicates that whilst average achievement is very similar inthe two areas, Roopnagar has a more heterogeneous group of class VIII students than thePathankot.
Table 6.14: District wise Percentile score in Science (Through CTT)
Districts Average 10thPercentile
25thPercentile
50thPercentile
75thPercentile
90thPercentile
Range75-25
Range90-10
Amritsar 58 38 48 60 70 78 23 40
Fazilka 60 45 50 55 78 83 28 38
Ferozepur 52 35 43 53 63 70 20 35
Gurdaspur 59 35 48 60 73 83 25 48
Hoshiarpur 64 48 55 65 71 83 16 35
Jalandhar 53 33 43 55 65 73 23 40
Ludhiana 52 29 40 53 63 75 23 46
Mohali 44 23 35 45 55 60 20 38
Pathankot 58 43 49 58 65 73 16 30
Patiala 53 33 45 55 65 73 20 40
Roopnagar 59 38 46 58 73 84 26 47
Sangrur 56 35 44 58 68 80 24 45
Tarn Taran 46 28 40 48 55 60 15 33
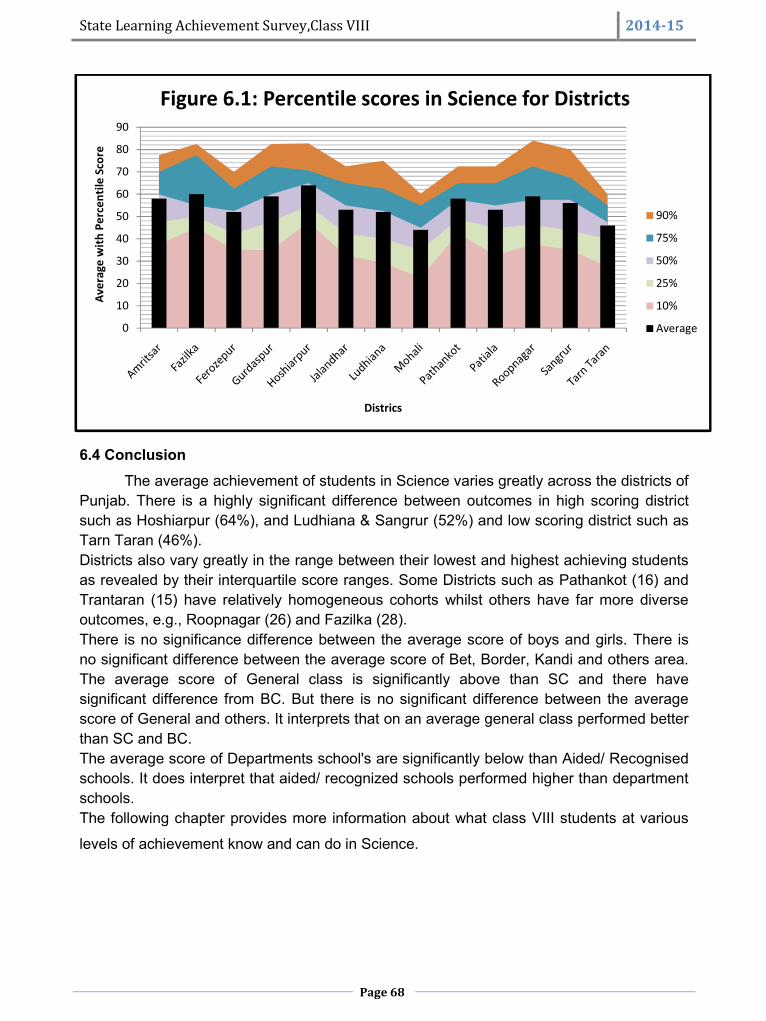
State Learning Achievement Survey,Class VIII 2014-15
Page 68
6.4 ConclusionThe average achievement of students in Science varies greatly across the districts of
Punjab. There is a highly significant difference between outcomes in high scoring districtsuch as Hoshiarpur (64%), and Ludhiana & Sangrur (52%) and low scoring district such asTarn Taran (46%).Districts also vary greatly in the range between their lowest and highest achieving studentsas revealed by their interquartile score ranges. Some Districts such as Pathankot (16) andTrantaran (15) have relatively homogeneous cohorts whilst others have far more diverseoutcomes, e.g., Roopnagar (26) and Fazilka (28).There is no significance difference between the average score of boys and girls. There isno significant difference between the average score of Bet, Border, Kandi and others area.The average score of General class is significantly above than SC and there havesignificant difference from BC. But there is no significant difference between the averagescore of General and others. It interprets that on an average general class performed betterthan SC and BC.The average score of Departments school's are significantly below than Aided/ Recognisedschools. It does interpret that aided/ recognized schools performed higher than departmentschools.The following chapter provides more information about what class VIII students at various
levels of achievement know and can do in Science.
0
10
20
30
40
50
60
70
80
90
Aver
age
with
Per
cent
ile S
core
Districs
Figure 6.1: Percentile scores in Science for Districts
90%
75%
50%
25%
10%
Average
State Learning Achievement Survey,Class VIII 2014-15
Page 69
Chapter 7What students know and can do: Science
7.1 Overview of the Science tests
The Science achievement survey given to class VIII students consisted of two test
booklets, each containing 40, four-option multiple choice items. Ten items were common
across all test forms. These served as ‘anchors’ so that the different test booklets could be
linked together and hence, all items could be placed on a common scale. In total, the
Science assessment instrument comprised 60 unique items.
The items in each text booklet were chosen to cover the following range of scientific
domains from the science curriculum: Physics, Chemistry and Biology. In addition to the
content domains listed above, items were constructed to test a range of cognitive
processes/domain14 (Classified by Bloom in 1956) or parameters in a variety of contexts.
These were classified as Knowledge, Understanding and Application as described below:
14 Source regarding cognitive process/Domain :- 1. https://en.wikipedia.org/wiki/Bloom%27s_taxonomy2. Teaching of Social Science by Dr. Renu Gupta.
Parameters classification for test construction in Science
Knowledge: In items testing this process, students are expected to answer using
simple knowledge (recall) or recognition of terms and/or concepts
familiar from their lessons.
Comprehension/Understanding: Demonstrate understanding of facts and ideas by
organizing, comparing, translating, interpreting,
giving descriptions, and stating the main ideas
Application: Using acquired knowledge. Solve problems in new situations by applying
acquired knowledge, facts, techniques and rules.
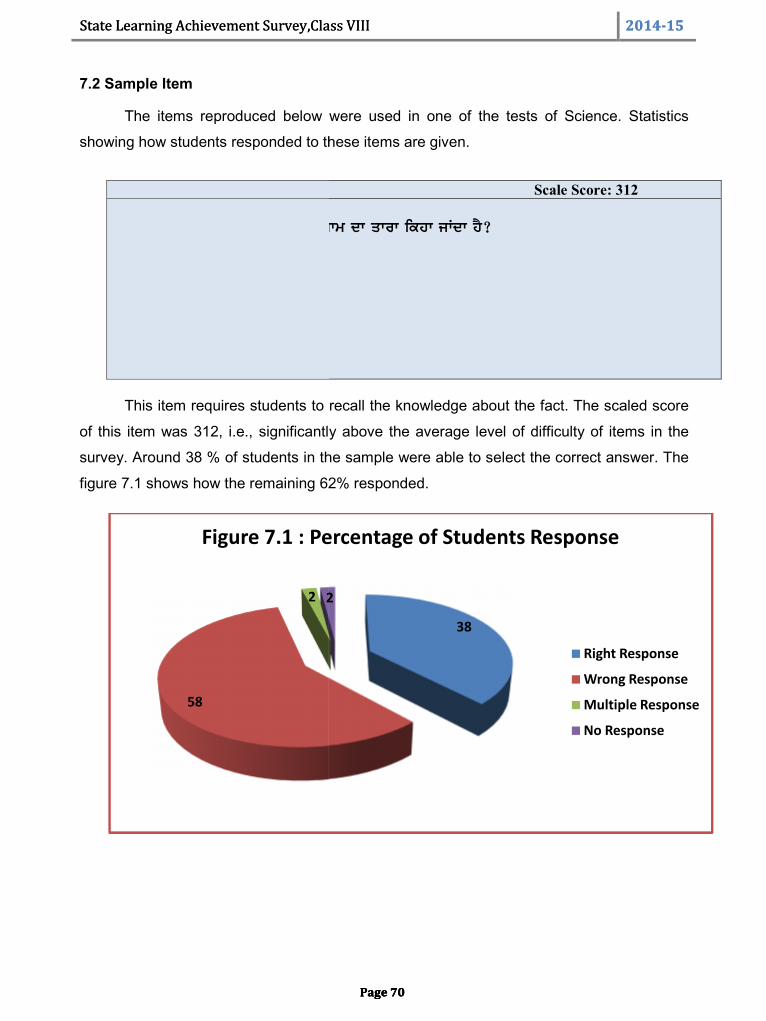
State Learning Achievement Survey,Class VIII 2014-15
Page 70
7.2 Sample Item
The items reproduced below were used in one of the tests of Science. Statistics
showing how students responded to these items are given.
Sample Item :Knowledge Scale Score: 312
1. ikhVy gRih nUM svyr jW swm dw qwrw ikhw jWdw hY?
1. bu~D
2. DrqI
3. Suk`r
4. mMgl
This item requires students to recall the knowledge about the fact. The scaled score
of this item was 312, i.e., significantly above the average level of difficulty of items in the
survey. Around 38 % of students in the sample were able to select the correct answer. The
figure 7.1 shows how the remaining 62% responded.
58
2 2
Figure 7.1 : Percentage of Students Response
State Learning Achievement Survey,Class VIII 2014-15
Page 70
7.2 Sample Item
The items reproduced below were used in one of the tests of Science. Statistics
showing how students responded to these items are given.
Sample Item :Knowledge Scale Score: 312
1. ikhVy gRih nUM svyr jW swm dw qwrw ikhw jWdw hY?
1. bu~D
2. DrqI
3. Suk`r
4. mMgl
This item requires students to recall the knowledge about the fact. The scaled score
of this item was 312, i.e., significantly above the average level of difficulty of items in the
survey. Around 38 % of students in the sample were able to select the correct answer. The
figure 7.1 shows how the remaining 62% responded.
38
2
Figure 7.1 : Percentage of Students Response
Right Response
Wrong Response
Multiple Response
No Response
State Learning Achievement Survey,Class VIII 2014-15
Page 70
7.2 Sample Item
The items reproduced below were used in one of the tests of Science. Statistics
showing how students responded to these items are given.
Sample Item :Knowledge Scale Score: 312
1. ikhVy gRih nUM svyr jW swm dw qwrw ikhw jWdw hY?
1. bu~D
2. DrqI
3. Suk`r
4. mMgl
This item requires students to recall the knowledge about the fact. The scaled score
of this item was 312, i.e., significantly above the average level of difficulty of items in the
survey. Around 38 % of students in the sample were able to select the correct answer. The
figure 7.1 shows how the remaining 62% responded.
Figure 7.1 : Percentage of Students Response
Right Response
Wrong Response
Multiple Response
No Response
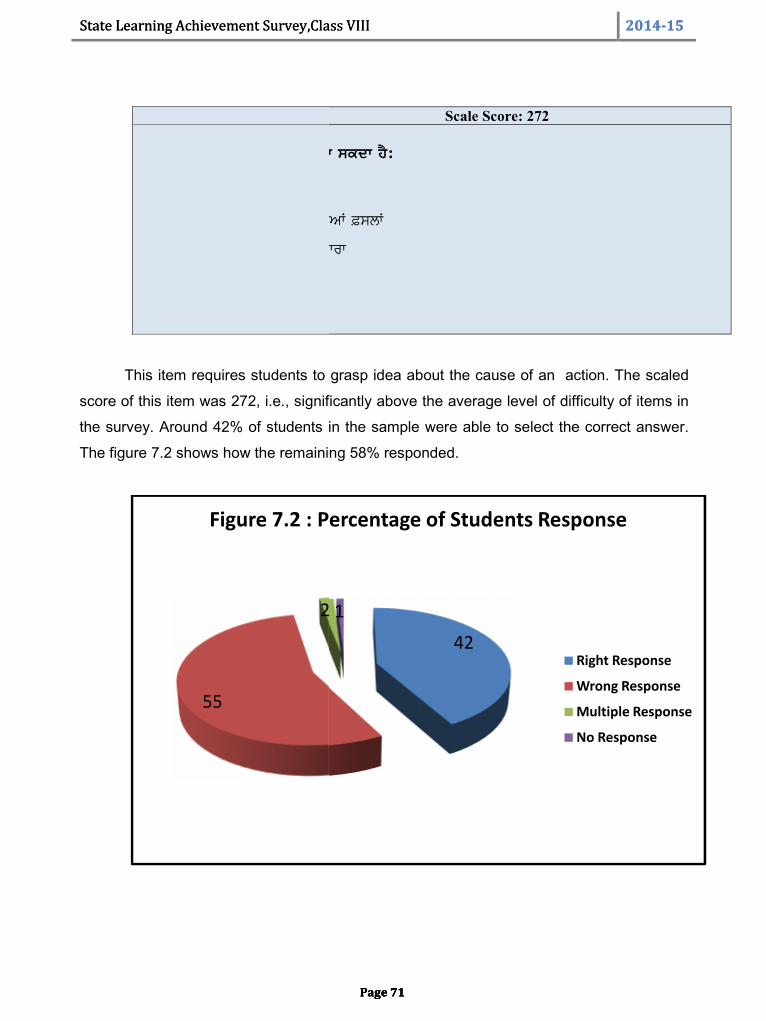
State Learning Achievement Survey,Class VIII 2014-15
Page 71
Sample Item : Understanding Scale Score: 272
21. BO-Kor nUM roikAw jw skdw hY:
1. dr~Kq lgw ky
2. BO-Kor rokx vwlIAW &slW
3. pOVInumw KyqI duAwrw
4. auprokq swry
This item requires students to grasp idea about the cause of an action. The scaled
score of this item was 272, i.e., significantly above the average level of difficulty of items in
the survey. Around 42% of students in the sample were able to select the correct answer.
The figure 7.2 shows how the remaining 58% responded.
55
2 1
Figure 7.2 : Percentage of Students Response
State Learning Achievement Survey,Class VIII 2014-15
Page 71
Sample Item : Understanding Scale Score: 272
21. BO-Kor nUM roikAw jw skdw hY:
1. dr~Kq lgw ky
2. BO-Kor rokx vwlIAW &slW
3. pOVInumw KyqI duAwrw
4. auprokq swry
This item requires students to grasp idea about the cause of an action. The scaled
score of this item was 272, i.e., significantly above the average level of difficulty of items in
the survey. Around 42% of students in the sample were able to select the correct answer.
The figure 7.2 shows how the remaining 58% responded.
42
2 1
Figure 7.2 : Percentage of Students Response
Right Response
Wrong Response
Multiple Response
No Response
State Learning Achievement Survey,Class VIII 2014-15
Page 71
Sample Item : Understanding Scale Score: 272
21. BO-Kor nUM roikAw jw skdw hY:
1. dr~Kq lgw ky
2. BO-Kor rokx vwlIAW &slW
3. pOVInumw KyqI duAwrw
4. auprokq swry
This item requires students to grasp idea about the cause of an action. The scaled
score of this item was 272, i.e., significantly above the average level of difficulty of items in
the survey. Around 42% of students in the sample were able to select the correct answer.
The figure 7.2 shows how the remaining 58% responded.
Figure 7.2 : Percentage of Students Response
Right Response
Wrong Response
Multiple Response
No Response
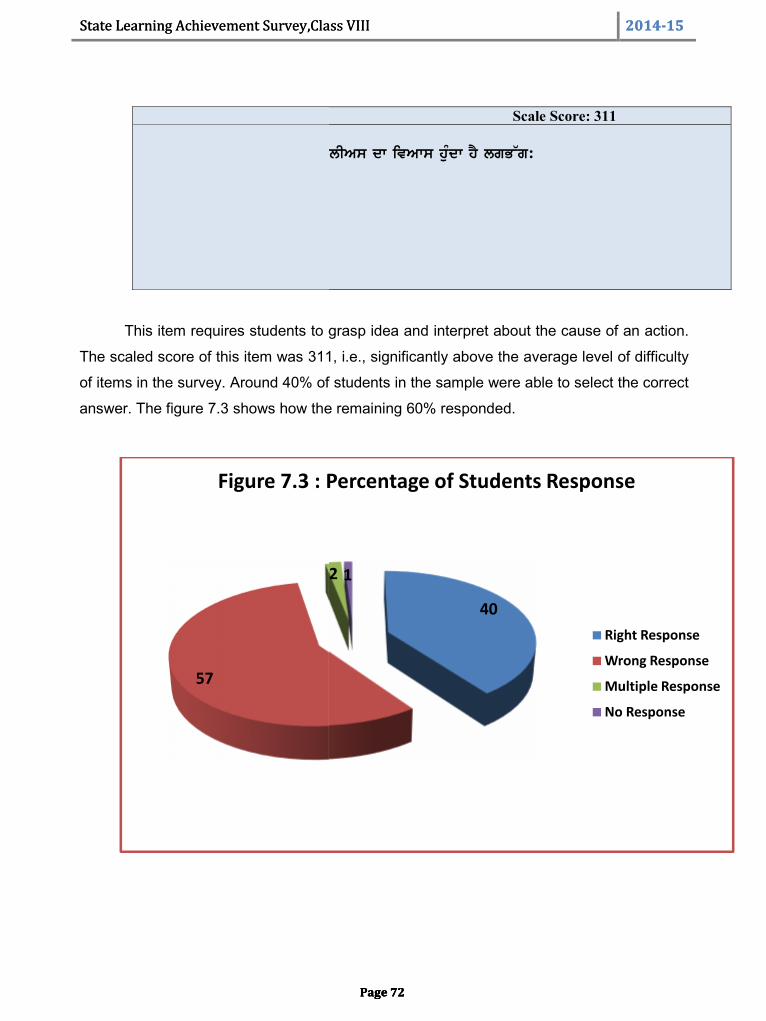
State Learning Achievement Survey,Class VIII 2014-15
Page 72
Sample Item : Understanding Scale Score: 311
36. prmwxU dy inaUklIAs dw ivAws huMdw hY lgB~g:
1. 10-5m2. 10-8m3. 10-10m4. 10-15m
This item requires students to grasp idea and interpret about the cause of an action.
The scaled score of this item was 311, i.e., significantly above the average level of difficulty
of items in the survey. Around 40% of students in the sample were able to select the correct
answer. The figure 7.3 shows how the remaining 60% responded.
57
2
Figure 7.3 : Percentage of Students Response
State Learning Achievement Survey,Class VIII 2014-15
Page 72
Sample Item : Understanding Scale Score: 311
36. prmwxU dy inaUklIAs dw ivAws huMdw hY lgB~g:
1. 10-5m2. 10-8m3. 10-10m4. 10-15m
This item requires students to grasp idea and interpret about the cause of an action.
The scaled score of this item was 311, i.e., significantly above the average level of difficulty
of items in the survey. Around 40% of students in the sample were able to select the correct
answer. The figure 7.3 shows how the remaining 60% responded.
40
2 1
Figure 7.3 : Percentage of Students Response
Right Response
Wrong Response
Multiple Response
No Response
State Learning Achievement Survey,Class VIII 2014-15
Page 72
Sample Item : Understanding Scale Score: 311
36. prmwxU dy inaUklIAs dw ivAws huMdw hY lgB~g:
1. 10-5m2. 10-8m3. 10-10m4. 10-15m
This item requires students to grasp idea and interpret about the cause of an action.
The scaled score of this item was 311, i.e., significantly above the average level of difficulty
of items in the survey. Around 40% of students in the sample were able to select the correct
answer. The figure 7.3 shows how the remaining 60% responded.
Figure 7.3 : Percentage of Students Response
Right Response
Wrong Response
Multiple Response
No Response
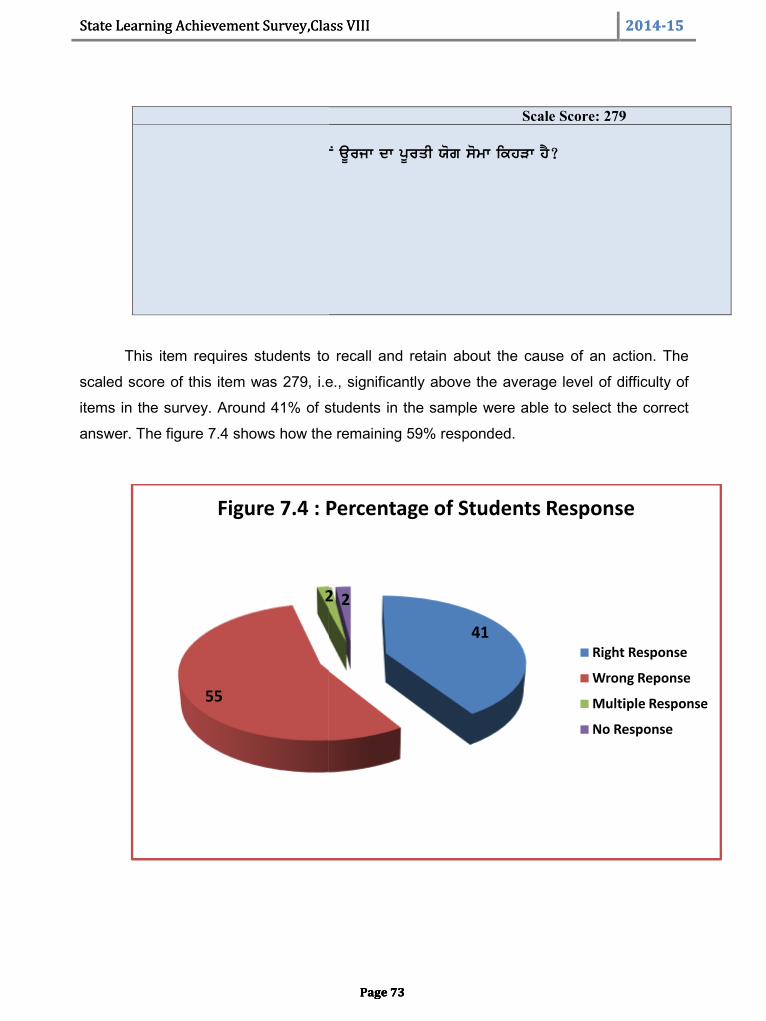
State Learning Achievement Survey,Class VIII 2014-15
Page 73
Sample Item: Knowledge Scale Score: 279
18. inmnilKq iv~coN aUrjw dw pUrqI Xog somw ikhVw hY?
1. kolw
2. kudrqI gYs
3. pYtrolIAm
4. bwieaugYs
This item requires students to recall and retain about the cause of an action. The
scaled score of this item was 279, i.e., significantly above the average level of difficulty of
items in the survey. Around 41% of students in the sample were able to select the correct
answer. The figure 7.4 shows how the remaining 59% responded.
55
2
Figure 7.4 : Percentage of Students Response
State Learning Achievement Survey,Class VIII 2014-15
Page 73
Sample Item: Knowledge Scale Score: 279
18. inmnilKq iv~coN aUrjw dw pUrqI Xog somw ikhVw hY?
1. kolw
2. kudrqI gYs
3. pYtrolIAm
4. bwieaugYs
This item requires students to recall and retain about the cause of an action. The
scaled score of this item was 279, i.e., significantly above the average level of difficulty of
items in the survey. Around 41% of students in the sample were able to select the correct
answer. The figure 7.4 shows how the remaining 59% responded.
41
2 2
Figure 7.4 : Percentage of Students Response
Right Response
Wrong Reponse
Multiple Response
No Response
State Learning Achievement Survey,Class VIII 2014-15
Page 73
Sample Item: Knowledge Scale Score: 279
18. inmnilKq iv~coN aUrjw dw pUrqI Xog somw ikhVw hY?
1. kolw
2. kudrqI gYs
3. pYtrolIAm
4. bwieaugYs
This item requires students to recall and retain about the cause of an action. The
scaled score of this item was 279, i.e., significantly above the average level of difficulty of
items in the survey. Around 41% of students in the sample were able to select the correct
answer. The figure 7.4 shows how the remaining 59% responded.
Figure 7.4 : Percentage of Students Response
Right Response
Wrong Reponse
Multiple Response
No Response
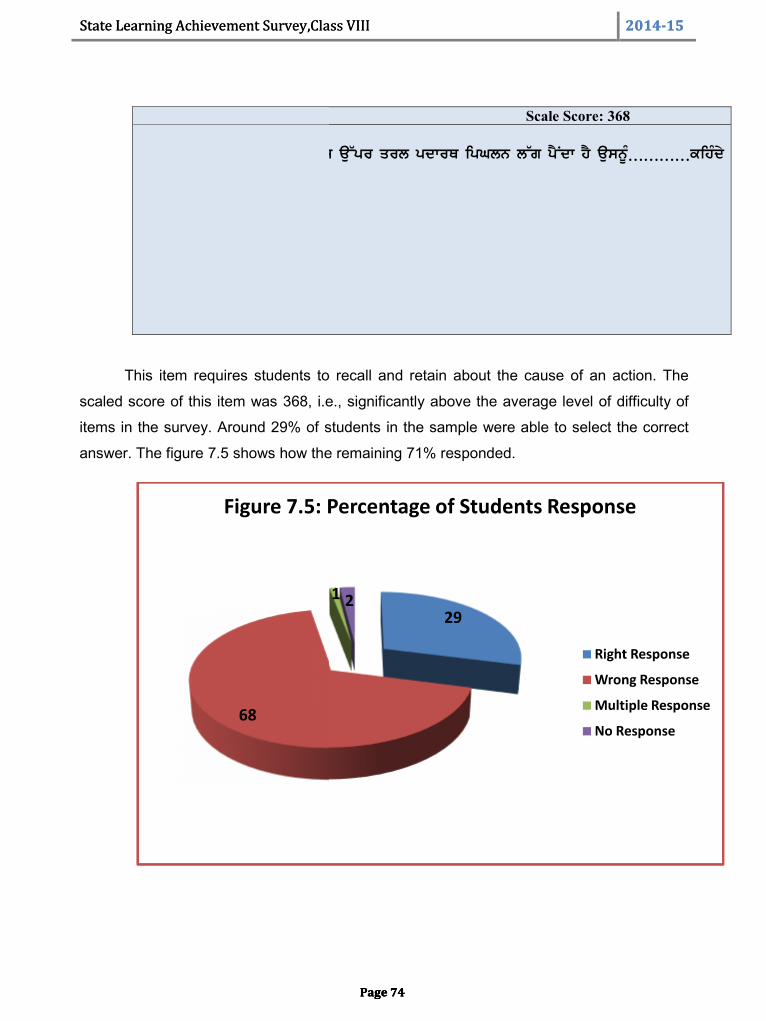
State Learning Achievement Survey,Class VIII 2014-15
Page 74
Sample Item: Knowledge Scale Score: 368
23. auh qwpmwn ijs au~pr qrl pdwrQ ipGln l~g pYNdw hY ausnUM…………kihMdy
hn[
1. ipGlwau drjw
2. aubwl drjw
3. vwSpn
4. sMGnx
This item requires students to recall and retain about the cause of an action. The
scaled score of this item was 368, i.e., significantly above the average level of difficulty of
items in the survey. Around 29% of students in the sample were able to select the correct
answer. The figure 7.5 shows how the remaining 71% responded.
68
1
Figure 7.5: Percentage of Students Response
State Learning Achievement Survey,Class VIII 2014-15
Page 74
Sample Item: Knowledge Scale Score: 368
23. auh qwpmwn ijs au~pr qrl pdwrQ ipGln l~g pYNdw hY ausnUM…………kihMdy
hn[
1. ipGlwau drjw
2. aubwl drjw
3. vwSpn
4. sMGnx
This item requires students to recall and retain about the cause of an action. The
scaled score of this item was 368, i.e., significantly above the average level of difficulty of
items in the survey. Around 29% of students in the sample were able to select the correct
answer. The figure 7.5 shows how the remaining 71% responded.
291 2
Figure 7.5: Percentage of Students Response
Right Response
Wrong Response
Multiple Response
No Response
State Learning Achievement Survey,Class VIII 2014-15
Page 74
Sample Item: Knowledge Scale Score: 368
23. auh qwpmwn ijs au~pr qrl pdwrQ ipGln l~g pYNdw hY ausnUM…………kihMdy
hn[
1. ipGlwau drjw
2. aubwl drjw
3. vwSpn
4. sMGnx
This item requires students to recall and retain about the cause of an action. The
scaled score of this item was 368, i.e., significantly above the average level of difficulty of
items in the survey. Around 29% of students in the sample were able to select the correct
answer. The figure 7.5 shows how the remaining 71% responded.
Figure 7.5: Percentage of Students Response
Right Response
Wrong Response
Multiple Response
No Response
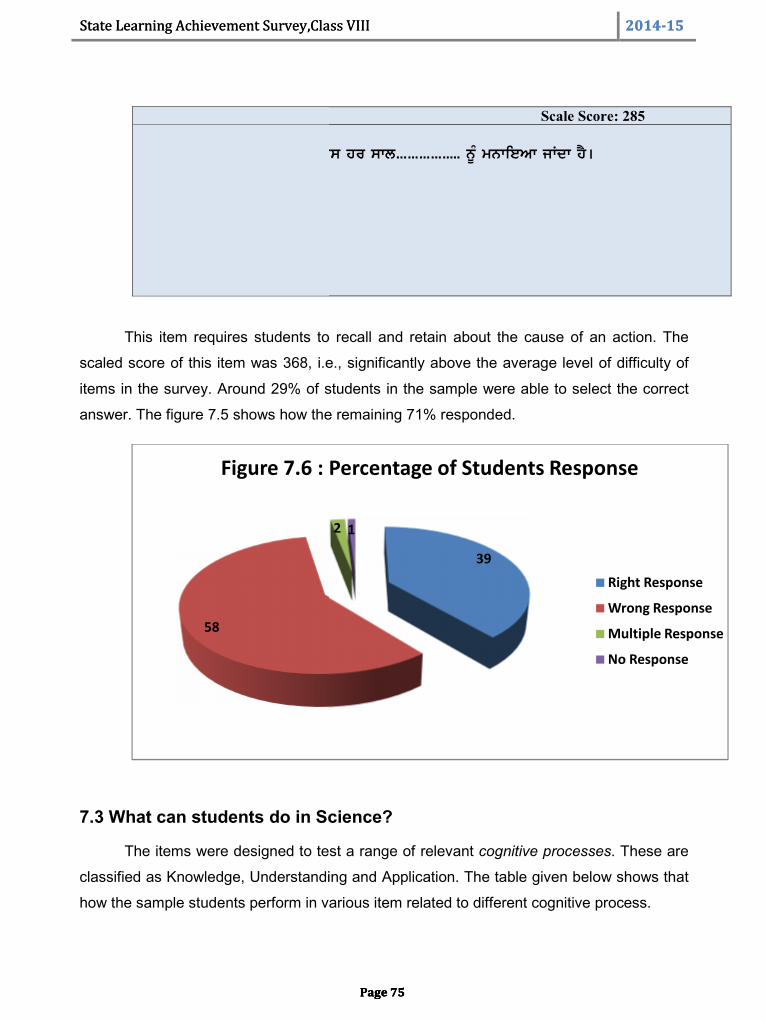
State Learning Achievement Survey,Class VIII 2014-15
Page 75
Sample Item: Knowledge Scale Score: 285
32. is~lI DrqI idvs hr swl…………….. nUM mnwieAw jWdw hY[1. 1 dsMbr
2. 5 sqMbr
3. 5 jUn
4. 2 PrvrI
This item requires students to recall and retain about the cause of an action. The
scaled score of this item was 368, i.e., significantly above the average level of difficulty of
items in the survey. Around 29% of students in the sample were able to select the correct
answer. The figure 7.5 shows how the remaining 71% responded.
7.3 What can students do in Science?
The items were designed to test a range of relevant cognitive processes. These are
classified as Knowledge, Understanding and Application. The table given below shows that
how the sample students perform in various item related to different cognitive process.
58
2
Figure 7.6 : Percentage of Students Response
State Learning Achievement Survey,Class VIII 2014-15
Page 75
Sample Item: Knowledge Scale Score: 285
32. is~lI DrqI idvs hr swl…………….. nUM mnwieAw jWdw hY[1. 1 dsMbr
2. 5 sqMbr
3. 5 jUn
4. 2 PrvrI
This item requires students to recall and retain about the cause of an action. The
scaled score of this item was 368, i.e., significantly above the average level of difficulty of
items in the survey. Around 29% of students in the sample were able to select the correct
answer. The figure 7.5 shows how the remaining 71% responded.
7.3 What can students do in Science?
The items were designed to test a range of relevant cognitive processes. These are
classified as Knowledge, Understanding and Application. The table given below shows that
how the sample students perform in various item related to different cognitive process.
39
2 1
Figure 7.6 : Percentage of Students Response
Right Response
Wrong Response
Multiple Response
No Response
State Learning Achievement Survey,Class VIII 2014-15
Page 75
Sample Item: Knowledge Scale Score: 285
32. is~lI DrqI idvs hr swl…………….. nUM mnwieAw jWdw hY[1. 1 dsMbr
2. 5 sqMbr
3. 5 jUn
4. 2 PrvrI
This item requires students to recall and retain about the cause of an action. The
scaled score of this item was 368, i.e., significantly above the average level of difficulty of
items in the survey. Around 29% of students in the sample were able to select the correct
answer. The figure 7.5 shows how the remaining 71% responded.
7.3 What can students do in Science?
The items were designed to test a range of relevant cognitive processes. These are
classified as Knowledge, Understanding and Application. The table given below shows that
how the sample students perform in various item related to different cognitive process.
Figure 7.6 : Percentage of Students Response
Right Response
Wrong Response
Multiple Response
No Response
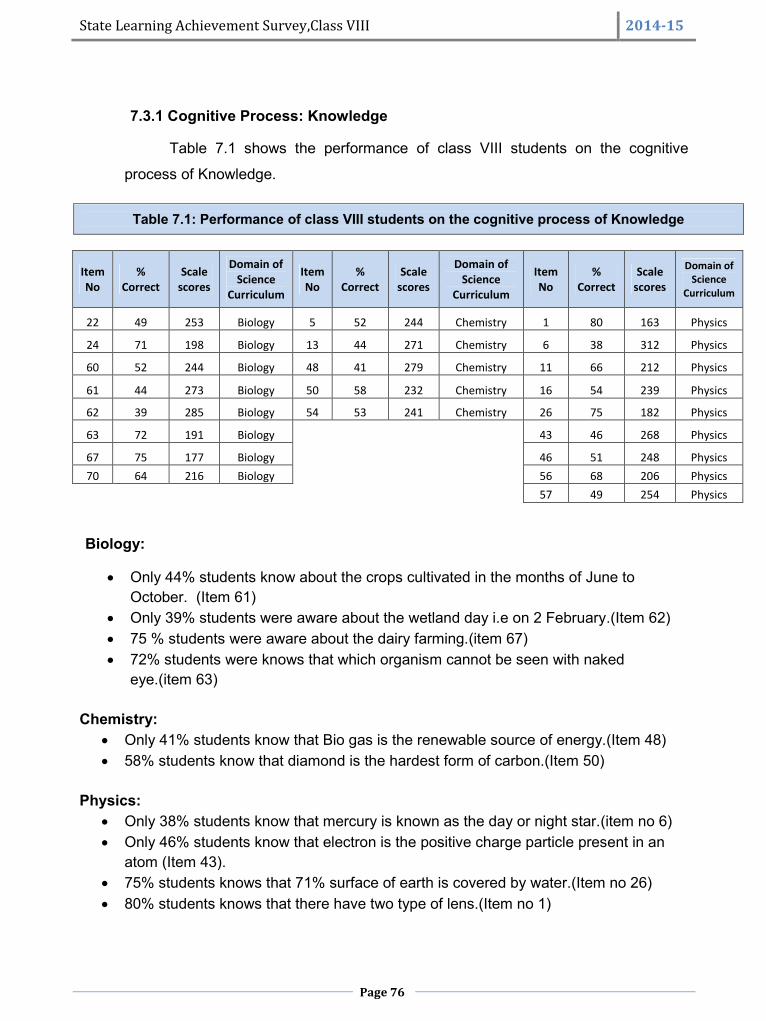
State Learning Achievement Survey,Class VIII 2014-15
Page 76
7.3.1 Cognitive Process: Knowledge
Table 7.1 shows the performance of class VIII students on the cognitive
process of Knowledge.
Table 7.1: Performance of class VIII students on the cognitive process of Knowledge
ItemNo
%Correct
Scalescores
Domain ofScience
Curriculum
ItemNo
%Correct
Scalescores
Domain ofScience
Curriculum
ItemNo
%Correct
Scalescores
Domain ofScience
Curriculum
22 49 253 Biology 5 52 244 Chemistry 1 80 163 Physics
24 71 198 Biology 13 44 271 Chemistry 6 38 312 Physics
60 52 244 Biology 48 41 279 Chemistry 11 66 212 Physics
61 44 273 Biology 50 58 232 Chemistry 16 54 239 Physics
62 39 285 Biology 54 53 241 Chemistry 26 75 182 Physics
63 72 191 Biology 43 46 268 Physics
67 75 177 Biology 46 51 248 Physics70 64 216 Biology 56 68 206 Physics
57 49 254 Physics
Biology:
Only 44% students know about the crops cultivated in the months of June toOctober. (Item 61)
Only 39% students were aware about the wetland day i.e on 2 February.(Item 62) 75 % students were aware about the dairy farming.(item 67) 72% students were knows that which organism cannot be seen with naked
eye.(item 63)
Chemistry: Only 41% students know that Bio gas is the renewable source of energy.(Item 48) 58% students know that diamond is the hardest form of carbon.(Item 50)
Physics: Only 38% students know that mercury is known as the day or night star.(item no 6) Only 46% students know that electron is the positive charge particle present in an
atom (Item 43). 75% students knows that 71% surface of earth is covered by water.(Item no 26) 80% students knows that there have two type of lens.(Item no 1)
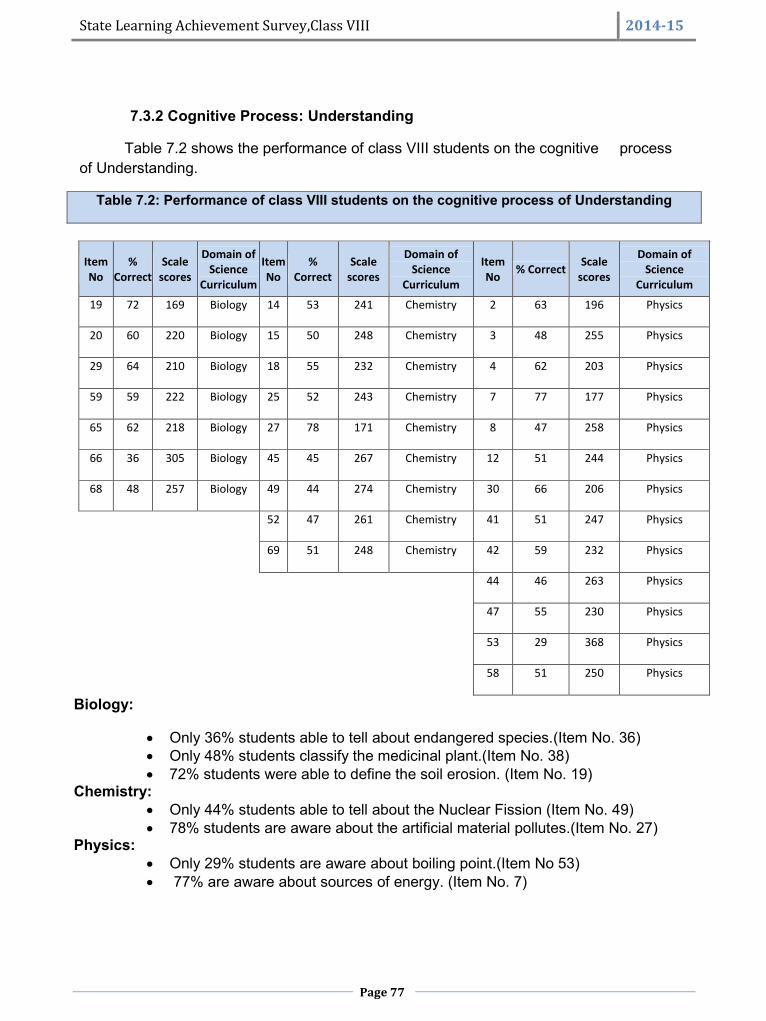
State Learning Achievement Survey,Class VIII 2014-15
Page 77
7.3.2 Cognitive Process: Understanding
Table 7.2 shows the performance of class VIII students on the cognitive processof Understanding.
Table 7.2: Performance of class VIII students on the cognitive process of Understanding
ItemNo
%Correct
Scalescores
Domain ofScience
Curriculum
ItemNo
%Correct
Scalescores
Domain ofScience
Curriculum
ItemNo % Correct Scale
scores
Domain ofScience
Curriculum
19 72 169 Biology 14 53 241 Chemistry 2 63 196 Physics
20 60 220 Biology 15 50 248 Chemistry 3 48 255 Physics
29 64 210 Biology 18 55 232 Chemistry 4 62 203 Physics
59 59 222 Biology 25 52 243 Chemistry 7 77 177 Physics
65 62 218 Biology 27 78 171 Chemistry 8 47 258 Physics
66 36 305 Biology 45 45 267 Chemistry 12 51 244 Physics
68 48 257 Biology 49 44 274 Chemistry 30 66 206 Physics
52 47 261 Chemistry 41 51 247 Physics
69 51 248 Chemistry 42 59 232 Physics
44 46 263 Physics
47 55 230 Physics
53 29 368 Physics
58 51 250 Physics
Biology:
Only 36% students able to tell about endangered species.(Item No. 36) Only 48% students classify the medicinal plant.(Item No. 38) 72% students were able to define the soil erosion. (Item No. 19)
Chemistry: Only 44% students able to tell about the Nuclear Fission (Item No. 49) 78% students are aware about the artificial material pollutes.(Item No. 27)
Physics: Only 29% students are aware about boiling point.(Item No 53) 77% are aware about sources of energy. (Item No. 7)
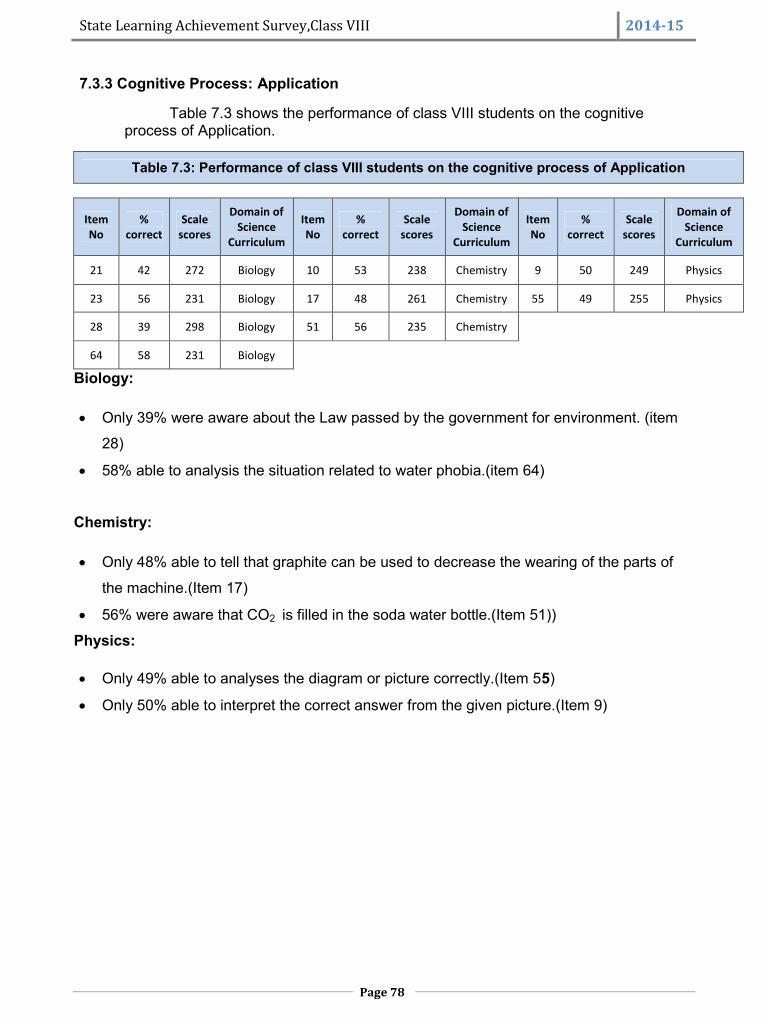
State Learning Achievement Survey,Class VIII 2014-15
Page 78
7.3.3 Cognitive Process: Application
Table 7.3 shows the performance of class VIII students on the cognitiveprocess of Application.
Table 7.3: Performance of class VIII students on the cognitive process of Application
ItemNo
%correct
Scalescores
Domain ofScience
Curriculum
ItemNo
%correct
Scalescores
Domain ofScience
Curriculum
ItemNo
%correct
Scalescores
Domain ofScience
Curriculum
21 42 272 Biology 10 53 238 Chemistry 9 50 249 Physics
23 56 231 Biology 17 48 261 Chemistry 55 49 255 Physics
28 39 298 Biology 51 56 235 Chemistry
64 58 231 Biology
Biology:
Only 39% were aware about the Law passed by the government for environment. (item
28)
58% able to analysis the situation related to water phobia.(item 64)
Chemistry:
Only 48% able to tell that graphite can be used to decrease the wearing of the parts of
the machine.(Item 17)
56% were aware that CO2 is filled in the soda water bottle.(Item 51))
Physics:
Only 49% able to analyses the diagram or picture correctly.(Item 55)
Only 50% able to interpret the correct answer from the given picture.(Item 9)
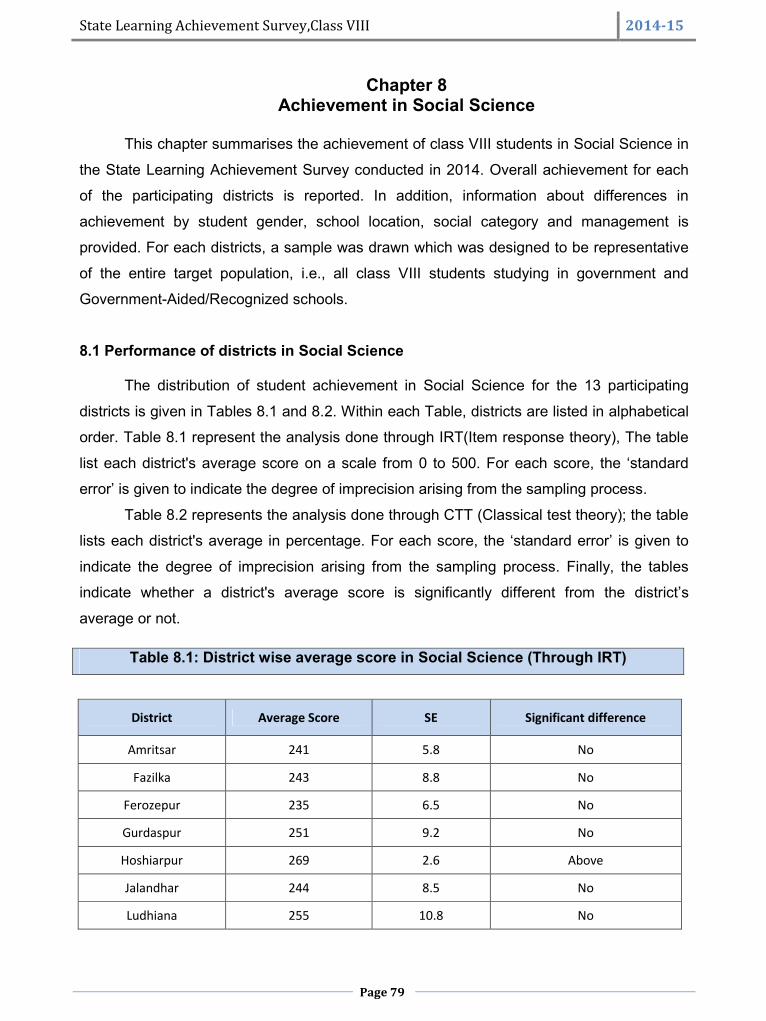
State Learning Achievement Survey,Class VIII 2014-15
Page 79
Chapter 8Achievement in Social Science
This chapter summarises the achievement of class VIII students in Social Science in
the State Learning Achievement Survey conducted in 2014. Overall achievement for each
of the participating districts is reported. In addition, information about differences in
achievement by student gender, school location, social category and management is
provided. For each districts, a sample was drawn which was designed to be representative
of the entire target population, i.e., all class VIII students studying in government and
Government-Aided/Recognized schools.
8.1 Performance of districts in Social Science
The distribution of student achievement in Social Science for the 13 participating
districts is given in Tables 8.1 and 8.2. Within each Table, districts are listed in alphabetical
order. Table 8.1 represent the analysis done through IRT(Item response theory), The table
list each district's average score on a scale from 0 to 500. For each score, the ‘standard
error’ is given to indicate the degree of imprecision arising from the sampling process.
Table 8.2 represents the analysis done through CTT (Classical test theory); the table
lists each district's average in percentage. For each score, the ‘standard error’ is given to
indicate the degree of imprecision arising from the sampling process. Finally, the tables
indicate whether a district's average score is significantly different from the district’s
average or not.
Table 8.1: District wise average score in Social Science (Through IRT)
District Average Score SE Significant difference
Amritsar 241 5.8 No
Fazilka 243 8.8 No
Ferozepur 235 6.5 No
Gurdaspur 251 9.2 No
Hoshiarpur 269 2.6 Above
Jalandhar 244 8.5 No
Ludhiana 255 10.8 No
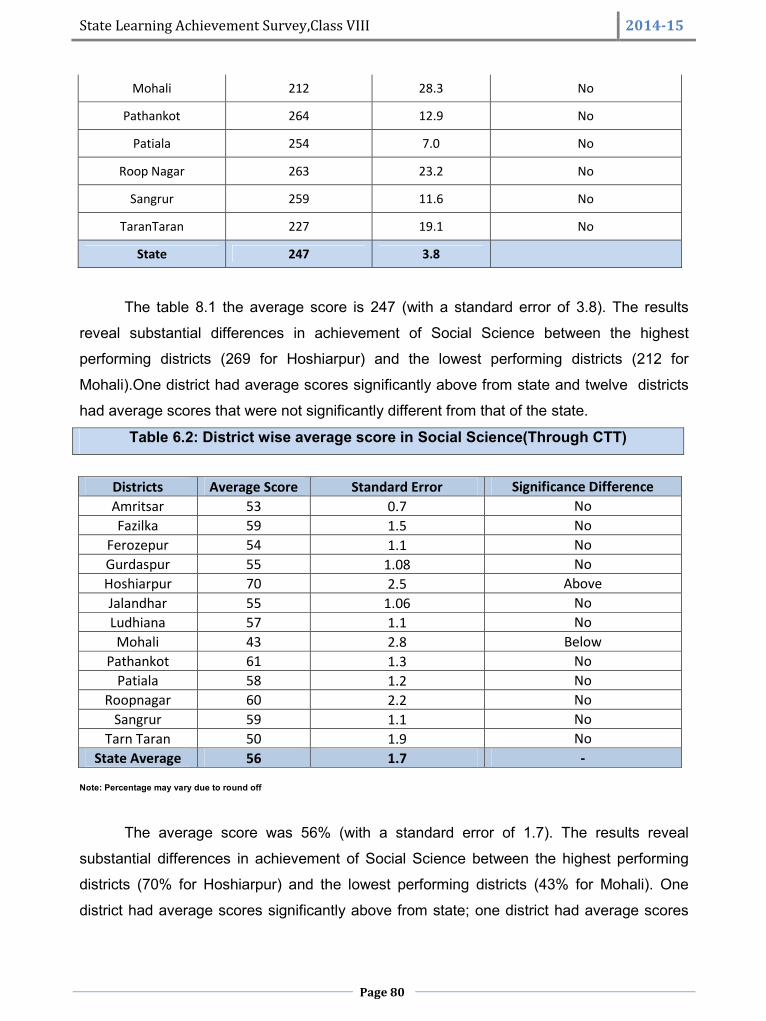
State Learning Achievement Survey,Class VIII 2014-15
Page 80
Mohali 212 28.3 No
Pathankot 264 12.9 No
Patiala 254 7.0 No
Roop Nagar 263 23.2 No
Sangrur 259 11.6 No
TaranTaran 227 19.1 No
State 247 3.8
The table 8.1 the average score is 247 (with a standard error of 3.8). The results
reveal substantial differences in achievement of Social Science between the highest
performing districts (269 for Hoshiarpur) and the lowest performing districts (212 for
Mohali).One district had average scores significantly above from state and twelve districts
had average scores that were not significantly different from that of the state.
Table 6.2: District wise average score in Social Science(Through CTT)
Districts Average Score Standard Error Significance DifferenceAmritsar 53 0.7 NoFazilka 59 1.5 No
Ferozepur 54 1.1 NoGurdaspur 55 1.08 NoHoshiarpur 70 2.5 AboveJalandhar 55 1.06 NoLudhiana 57 1.1 NoMohali 43 2.8 Below
Pathankot 61 1.3 NoPatiala 58 1.2 No
Roopnagar 60 2.2 NoSangrur 59 1.1 No
Tarn Taran 50 1.9 NoState Average 56 1.7 -
Note: Percentage may vary due to round off
The average score was 56% (with a standard error of 1.7). The results reveal
substantial differences in achievement of Social Science between the highest performing
districts (70% for Hoshiarpur) and the lowest performing districts (43% for Mohali). One
district had average scores significantly above from state; one district had average scores
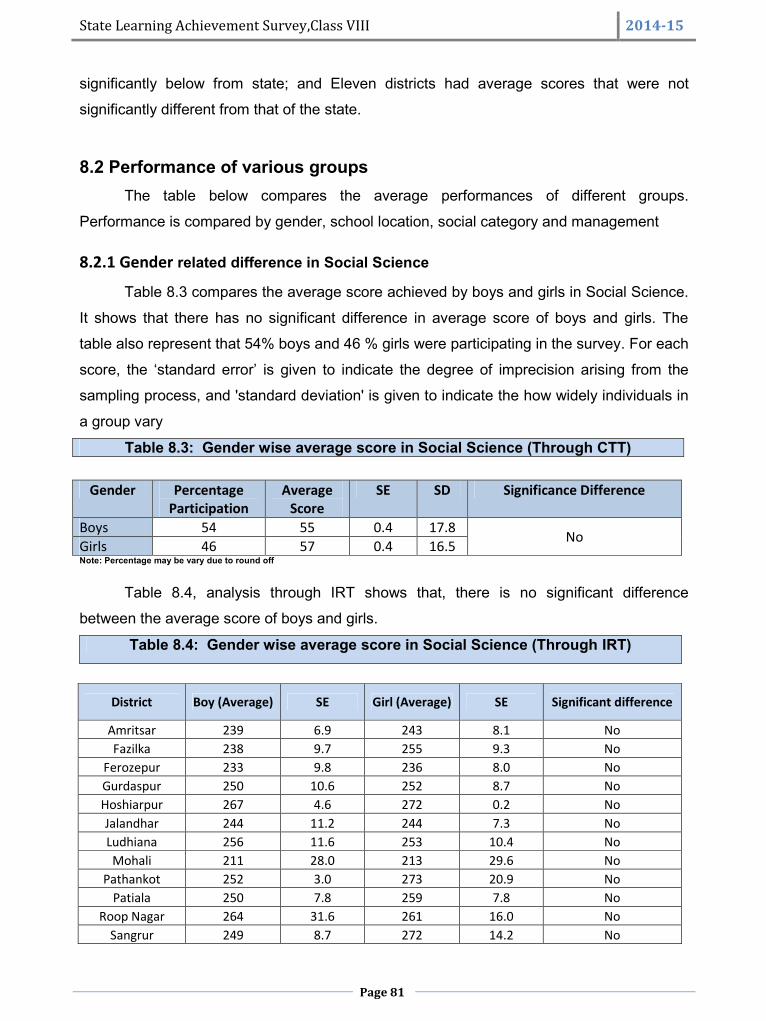
State Learning Achievement Survey,Class VIII 2014-15
Page 81
significantly below from state; and Eleven districts had average scores that were not
significantly different from that of the state.
8.2 Performance of various groupsThe table below compares the average performances of different groups.
Performance is compared by gender, school location, social category and management
8.2.1 Gender related difference in Social Science
Table 8.3 compares the average score achieved by boys and girls in Social Science.
It shows that there has no significant difference in average score of boys and girls. The
table also represent that 54% boys and 46 % girls were participating in the survey. For each
score, the ‘standard error’ is given to indicate the degree of imprecision arising from the
sampling process, and 'standard deviation' is given to indicate the how widely individuals in
a group vary
Table 8.3: Gender wise average score in Social Science (Through CTT)
Gender PercentageParticipation
AverageScore
SE SD Significance Difference
Boys 54 55 0.4 17.8 NoGirls 46 57 0.4 16.5Note: Percentage may be vary due to round off
Table 8.4, analysis through IRT shows that, there is no significant difference
between the average score of boys and girls.
Table 8.4: Gender wise average score in Social Science (Through IRT)
District Boy (Average) SE Girl (Average) SE Significant difference
Amritsar 239 6.9 243 8.1 NoFazilka 238 9.7 255 9.3 No
Ferozepur 233 9.8 236 8.0 NoGurdaspur 250 10.6 252 8.7 NoHoshiarpur 267 4.6 272 0.2 NoJalandhar 244 11.2 244 7.3 NoLudhiana 256 11.6 253 10.4 NoMohali 211 28.0 213 29.6 No
Pathankot 252 3.0 273 20.9 NoPatiala 250 7.8 259 7.8 No
Roop Nagar 264 31.6 261 16.0 NoSangrur 249 8.7 272 14.2 No
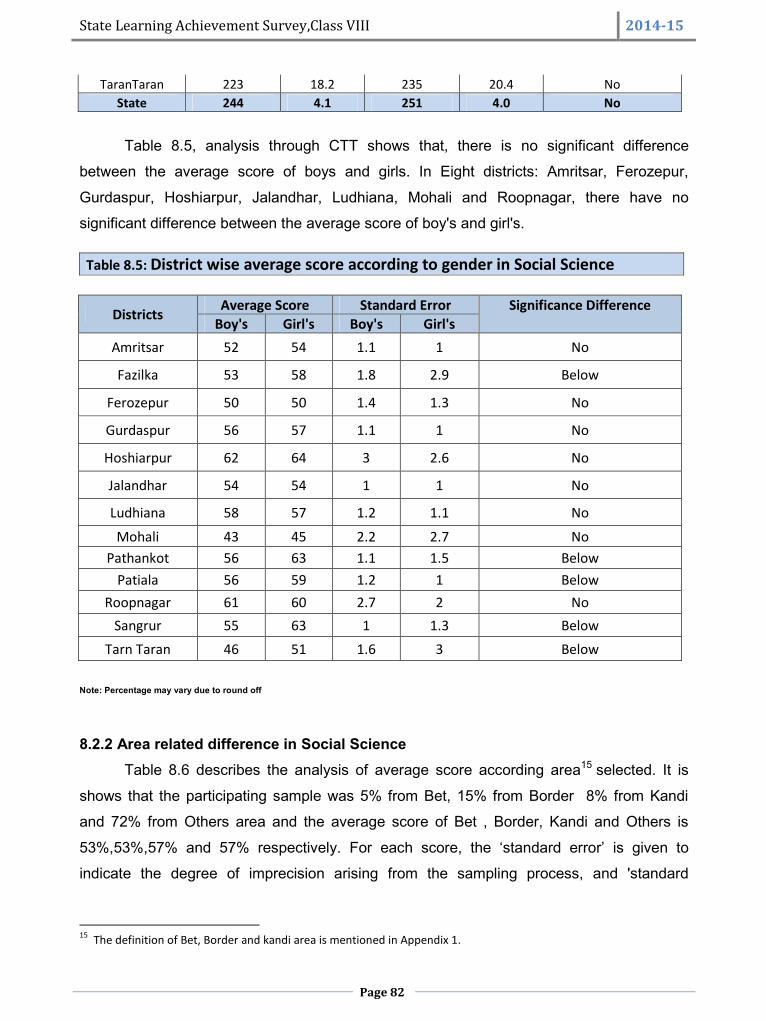
State Learning Achievement Survey,Class VIII 2014-15
Page 82
TaranTaran 223 18.2 235 20.4 NoState 244 4.1 251 4.0 No
Table 8.5, analysis through CTT shows that, there is no significant difference
between the average score of boys and girls. In Eight districts: Amritsar, Ferozepur,
Gurdaspur, Hoshiarpur, Jalandhar, Ludhiana, Mohali and Roopnagar, there have no
significant difference between the average score of boy's and girl's.
Table 8.5: District wise average score according to gender in Social Science
Districts Average Score Standard Error Significance DifferenceBoy's Girl's Boy's Girl's
Amritsar 52 54 1.1 1 No
Fazilka 53 58 1.8 2.9 Below
Ferozepur 50 50 1.4 1.3 No
Gurdaspur 56 57 1.1 1 No
Hoshiarpur 62 64 3 2.6 No
Jalandhar 54 54 1 1 No
Ludhiana 58 57 1.2 1.1 No
Mohali 43 45 2.2 2.7 NoPathankot 56 63 1.1 1.5 Below
Patiala 56 59 1.2 1 BelowRoopnagar 61 60 2.7 2 No
Sangrur 55 63 1 1.3 BelowTarn Taran 46 51 1.6 3 Below
Note: Percentage may vary due to round off
8.2.2 Area related difference in Social ScienceTable 8.6 describes the analysis of average score according area15 selected. It is
shows that the participating sample was 5% from Bet, 15% from Border 8% from Kandi
and 72% from Others area and the average score of Bet , Border, Kandi and Others is
53%,53%,57% and 57% respectively. For each score, the ‘standard error’ is given to
indicate the degree of imprecision arising from the sampling process, and 'standard
15 The definition of Bet, Border and kandi area is mentioned in Appendix 1.

State Learning Achievement Survey,Class VIII 2014-15
Page 83
deviation' is given to indicate the how widely individuals in a group vary. Table 8.6 also
shows that average score of Bet & Border area is significantly below than Kandi & Others.
Table 8.6: Area wise average score in Social Science (Through CTT)
Area PercentageParticipation
AverageScore
SE SD Significance DifferenceBet Border Kandi Other
Bet 5 53 1.1 15 - No Below BelowBorder 15 53 0.7 16.2 No - Below BelowKandi 8 57 0.9 16.5 Yes Yes - NoOthers 72 57 0.3 17.6 Yes Yes No -Note: Percentage may vary due to round off
Table 8.7, analysis through IRT shows that, average scale score of Bet, Border,
Kandi and Others is 240, 241, 254 and 252 respectively.
Table 8.7: Area wise average score in Social Science (Through IRT)
DistrictBet Border Kandi Other
AverageScore SE Average
Score SE AverageScore SE Average
Score SE
Amritsar 241 5.8
Fazilka 243 8.8
Ferozepur 252 0.0 229 9.2 239 5.0
Gurdaspur 248 9.0 245 10.8 255 15.6
Hoshiarpur 269 2.6
Jalandhar 218 0.0 246 8.6
Ludhiana 255 10.8
Mohali 212 28.3
Pathankot 263 18.4 265 12.1
Patiala 254 7.0
Roop Nagar 241 12.8 285 44.6
Sangrur 259 11.6
TaranTaran 227 19.1
State 240 3.9 241 6.3 254 10.9 252 4.2
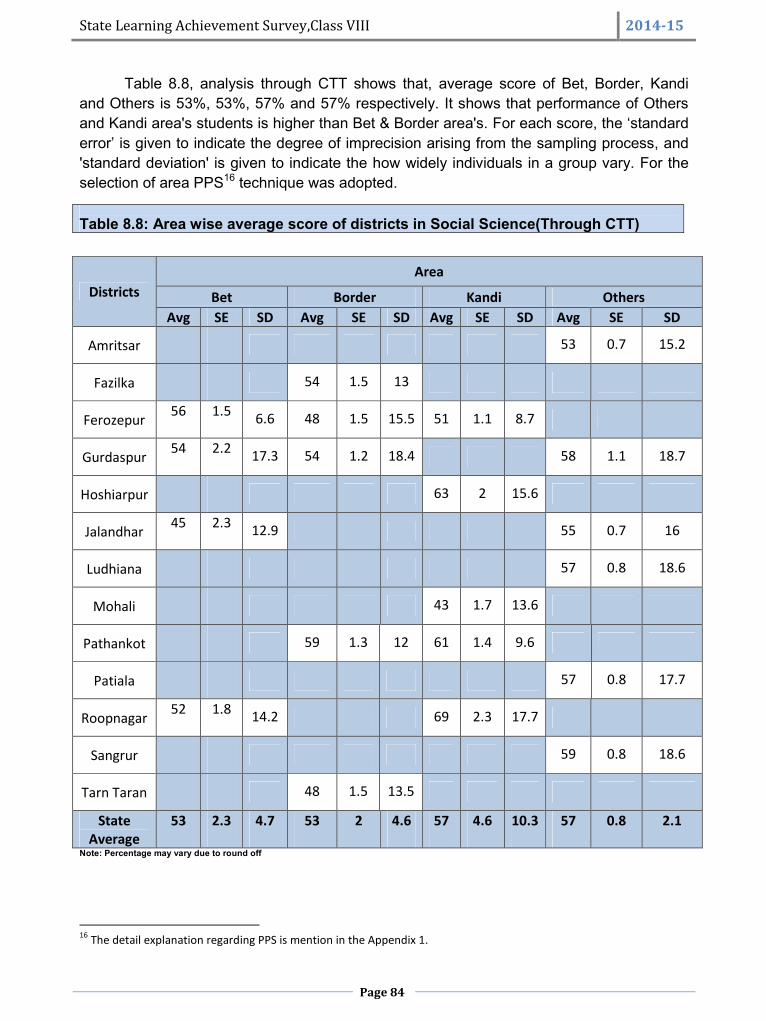
State Learning Achievement Survey,Class VIII 2014-15
Page 84
Table 8.8, analysis through CTT shows that, average score of Bet, Border, Kandiand Others is 53%, 53%, 57% and 57% respectively. It shows that performance of Othersand Kandi area's students is higher than Bet & Border area's. For each score, the ‘standarderror’ is given to indicate the degree of imprecision arising from the sampling process, and'standard deviation' is given to indicate the how widely individuals in a group vary. For theselection of area PPS16 technique was adopted.
Table 8.8: Area wise average score of districts in Social Science(Through CTT)
DistrictsArea
Bet Border Kandi OthersAvg SE SD Avg SE SD Avg SE SD Avg SE SD
Amritsar 53 0.7 15.2
Fazilka 54 1.5 13
Ferozepur 56 1.5 6.6 48 1.5 15.5 51 1.1 8.7
Gurdaspur 54 2.2 17.3 54 1.2 18.4 58 1.1 18.7
Hoshiarpur 63 2 15.6
Jalandhar 45 2.3 12.9 55 0.7 16
Ludhiana 57 0.8 18.6
Mohali 43 1.7 13.6
Pathankot 59 1.3 12 61 1.4 9.6
Patiala 57 0.8 17.7
Roopnagar 52 1.8 14.2 69 2.3 17.7
Sangrur 59 0.8 18.6
Tarn Taran 48 1.5 13.5
StateAverage
53 2.3 4.7 53 2 4.6 57 4.6 10.3 57 0.8 2.1
Note: Percentage may vary due to round off
16 The detail explanation regarding PPS is mention in the Appendix 1.
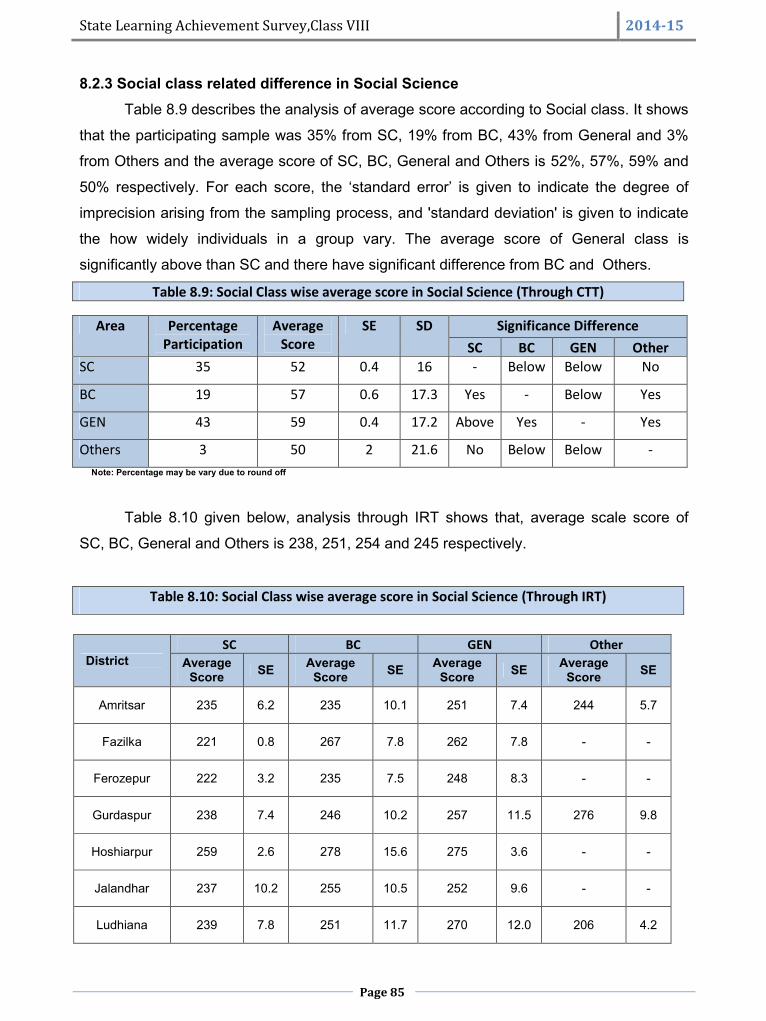
State Learning Achievement Survey,Class VIII 2014-15
Page 85
8.2.3 Social class related difference in Social ScienceTable 8.9 describes the analysis of average score according to Social class. It shows
that the participating sample was 35% from SC, 19% from BC, 43% from General and 3%
from Others and the average score of SC, BC, General and Others is 52%, 57%, 59% and
50% respectively. For each score, the ‘standard error’ is given to indicate the degree of
imprecision arising from the sampling process, and 'standard deviation' is given to indicate
the how widely individuals in a group vary. The average score of General class is
significantly above than SC and there have significant difference from BC and Others.
Table 8.9: Social Class wise average score in Social Science (Through CTT)
Area PercentageParticipation
AverageScore
SE SD Significance DifferenceSC BC GEN Other
SC 35 52 0.4 16 - Below Below No
BC 19 57 0.6 17.3 Yes - Below Yes
GEN 43 59 0.4 17.2 Above Yes - Yes
Others 3 50 2 21.6 No Below Below -Note: Percentage may be vary due to round off
Table 8.10 given below, analysis through IRT shows that, average scale score of
SC, BC, General and Others is 238, 251, 254 and 245 respectively.
Table 8.10: Social Class wise average score in Social Science (Through IRT)
DistrictSC BC GEN Other
AverageScore SE Average
Score SE AverageScore SE Average
Score SE
Amritsar 235 6.2 235 10.1 251 7.4 244 5.7
Fazilka 221 0.8 267 7.8 262 7.8 - -
Ferozepur 222 3.2 235 7.5 248 8.3 - -
Gurdaspur 238 7.4 246 10.2 257 11.5 276 9.8
Hoshiarpur 259 2.6 278 15.6 275 3.6 - -
Jalandhar 237 10.2 255 10.5 252 9.6 - -
Ludhiana 239 7.8 251 11.7 270 12.0 206 4.2
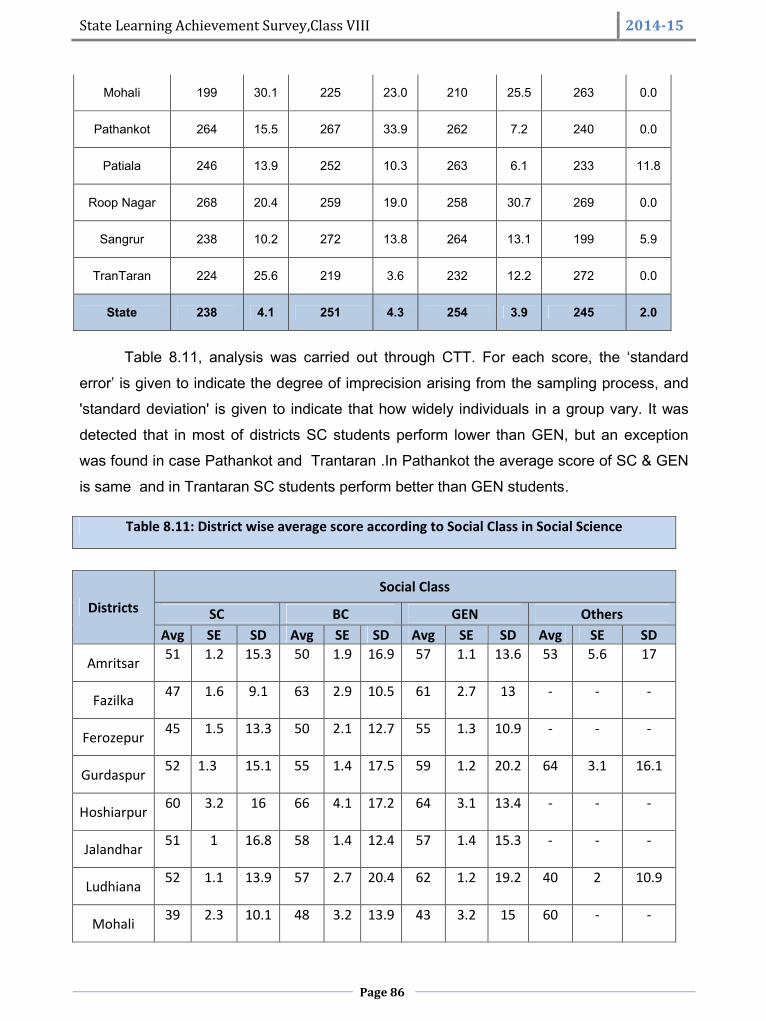
State Learning Achievement Survey,Class VIII 2014-15
Page 86
Mohali 199 30.1 225 23.0 210 25.5 263 0.0
Pathankot 264 15.5 267 33.9 262 7.2 240 0.0
Patiala 246 13.9 252 10.3 263 6.1 233 11.8
Roop Nagar 268 20.4 259 19.0 258 30.7 269 0.0
Sangrur 238 10.2 272 13.8 264 13.1 199 5.9
TranTaran 224 25.6 219 3.6 232 12.2 272 0.0
State 238 4.1 251 4.3 254 3.9 245 2.0
Table 8.11, analysis was carried out through CTT. For each score, the ‘standard
error’ is given to indicate the degree of imprecision arising from the sampling process, and
'standard deviation' is given to indicate that how widely individuals in a group vary. It was
detected that in most of districts SC students perform lower than GEN, but an exception
was found in case Pathankot and Trantaran .In Pathankot the average score of SC & GEN
is same and in Trantaran SC students perform better than GEN students.
Table 8.11: District wise average score according to Social Class in Social Science
DistrictsSocial Class
SC BC GEN OthersAvg SE SD Avg SE SD Avg SE SD Avg SE SD
Amritsar 51 1.2 15.3 50 1.9 16.9 57 1.1 13.6 53 5.6 17
Fazilka 47 1.6 9.1 63 2.9 10.5 61 2.7 13 - - -
Ferozepur 45 1.5 13.3 50 2.1 12.7 55 1.3 10.9 - - -
Gurdaspur 52 1.3 15.1 55 1.4 17.5 59 1.2 20.2 64 3.1 16.1
Hoshiarpur 60 3.2 16 66 4.1 17.2 64 3.1 13.4 - - -
Jalandhar 51 1 16.8 58 1.4 12.4 57 1.4 15.3 - - -
Ludhiana 52 1.1 13.9 57 2.7 20.4 62 1.2 19.2 40 2 10.9
Mohali 39 2.3 10.1 48 3.2 13.9 43 3.2 15 60 - -
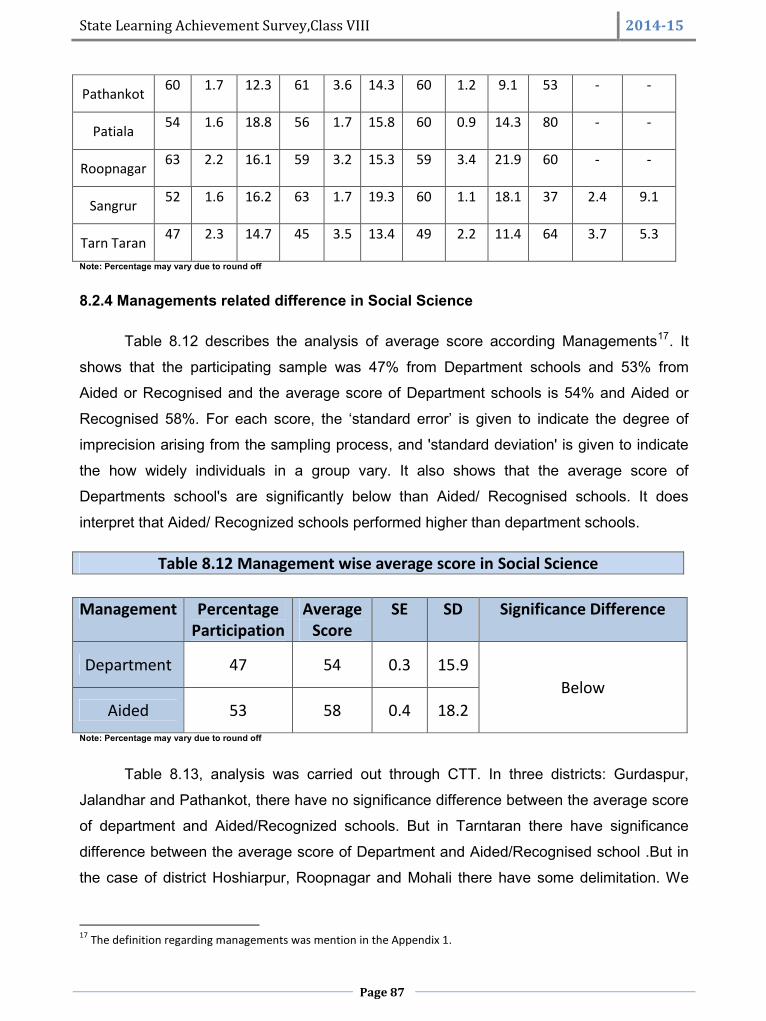
State Learning Achievement Survey,Class VIII 2014-15
Page 87
Pathankot 60 1.7 12.3 61 3.6 14.3 60 1.2 9.1 53 - -
Patiala 54 1.6 18.8 56 1.7 15.8 60 0.9 14.3 80 - -
Roopnagar 63 2.2 16.1 59 3.2 15.3 59 3.4 21.9 60 - -
Sangrur 52 1.6 16.2 63 1.7 19.3 60 1.1 18.1 37 2.4 9.1
Tarn Taran 47 2.3 14.7 45 3.5 13.4 49 2.2 11.4 64 3.7 5.3
Note: Percentage may vary due to round off
8.2.4 Managements related difference in Social Science
Table 8.12 describes the analysis of average score according Managements17. It
shows that the participating sample was 47% from Department schools and 53% from
Aided or Recognised and the average score of Department schools is 54% and Aided or
Recognised 58%. For each score, the ‘standard error’ is given to indicate the degree of
imprecision arising from the sampling process, and 'standard deviation' is given to indicate
the how widely individuals in a group vary. It also shows that the average score of
Departments school's are significantly below than Aided/ Recognised schools. It does
interpret that Aided/ Recognized schools performed higher than department schools.
Table 8.12 Management wise average score in Social Science
Management PercentageParticipation
AverageScore
SE SD Significance Difference
Department 47 54 0.3 15.9Below
Aided 53 58 0.4 18.2Note: Percentage may vary due to round off
Table 8.13, analysis was carried out through CTT. In three districts: Gurdaspur,
Jalandhar and Pathankot, there have no significance difference between the average score
of department and Aided/Recognized schools. But in Tarntaran there have significance
difference between the average score of Department and Aided/Recognised school .But in
the case of district Hoshiarpur, Roopnagar and Mohali there have some delimitation. We
17 The definition regarding managements was mention in the Appendix 1.

State Learning Achievement Survey,Class VIII 2014-15
Page 88
can't select Aided or Recognised schools for districts Hoshiarpur, Roopnagar and
department for Mohali, due to PPS technique.
Table 8.13: District wise average score according to Management in Social Science
Districts
ManagementSignificanceDifferenceDepartment Aided
Avg SE SD Avg SE SD
Amritsar 49 1.2 16.4 57 0.9 12.8 Below
Fazilka 48 1.4 10 68 1.6 7.4 Below
Ferozepur 46 1.1 12.5 58 1.3 10 Below
Gurdaspur 57 0.9 15.8 56 1.1 20.6 No
Hoshiarpur 63 2 15.6
Jalandhar 55 1.1 15.9 53 0.9 16 No
Ludhiana 51 1.1 15.1 61 1 19.5 Below
Mohali 43 1.7 13.6
Pathankot 60 1.2 12 58 1.4 7.5 No
Patiala 55 1.2 17.1 58 1 17.9 Below
Roopnagar 61 1.6 18.1
Sangrur 50 1 13.2 63 1 19.5 Below
Tarn Taran 51 1.9 13.8 41 1.9 10.3 Yes
Note: Percentage may vary due to round off
8.3 Range score in Social Science
The tables 8.14 and figure 8.1 that follow illustrate the range of achievement of
districts. The tables list the scores achieved by students at key percentiles. For example,
the score at the 25th percentile is the score which 75% of students achieve or surpass; the
score at the 90th percentile is the score that 10% of students achieve or surpass. The
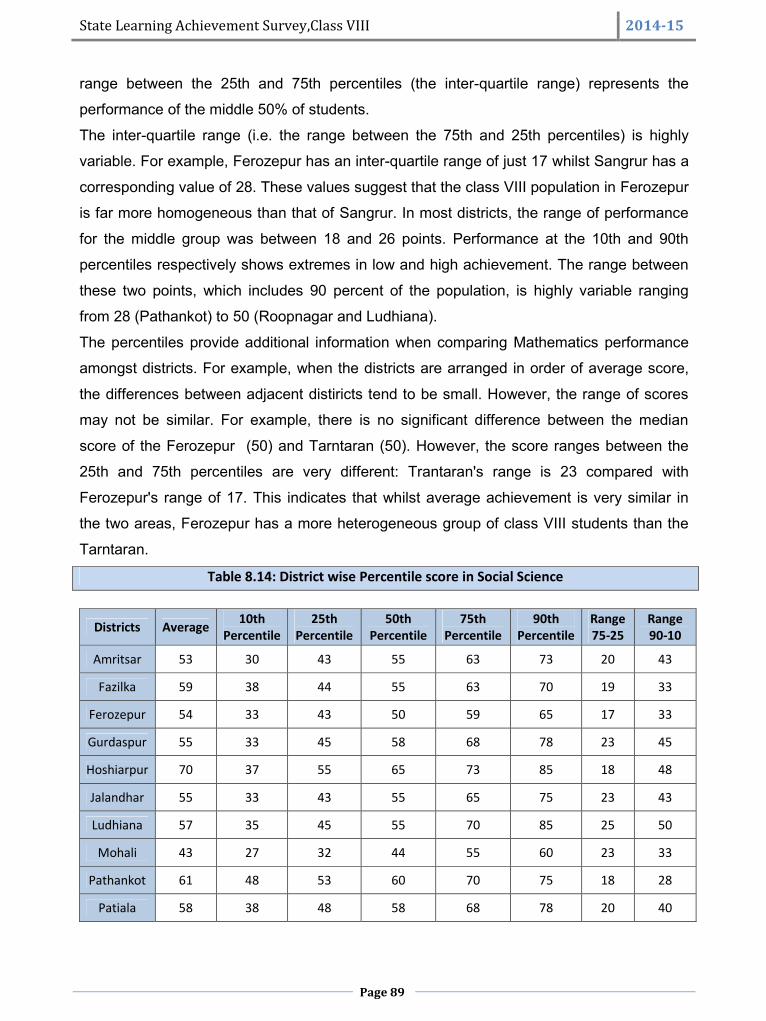
State Learning Achievement Survey,Class VIII 2014-15
Page 89
range between the 25th and 75th percentiles (the inter-quartile range) represents the
performance of the middle 50% of students.
The inter-quartile range (i.e. the range between the 75th and 25th percentiles) is highly
variable. For example, Ferozepur has an inter-quartile range of just 17 whilst Sangrur has a
corresponding value of 28. These values suggest that the class VIII population in Ferozepur
is far more homogeneous than that of Sangrur. In most districts, the range of performance
for the middle group was between 18 and 26 points. Performance at the 10th and 90th
percentiles respectively shows extremes in low and high achievement. The range between
these two points, which includes 90 percent of the population, is highly variable ranging
from 28 (Pathankot) to 50 (Roopnagar and Ludhiana).
The percentiles provide additional information when comparing Mathematics performance
amongst districts. For example, when the districts are arranged in order of average score,
the differences between adjacent distiricts tend to be small. However, the range of scores
may not be similar. For example, there is no significant difference between the median
score of the Ferozepur (50) and Tarntaran (50). However, the score ranges between the
25th and 75th percentiles are very different: Trantaran's range is 23 compared with
Ferozepur's range of 17. This indicates that whilst average achievement is very similar in
the two areas, Ferozepur has a more heterogeneous group of class VIII students than the
Tarntaran.
Table 8.14: District wise Percentile score in Social Science
Districts Average 10thPercentile
25thPercentile
50thPercentile
75thPercentile
90thPercentile
Range75-25
Range90-10
Amritsar 53 30 43 55 63 73 20 43
Fazilka 59 38 44 55 63 70 19 33
Ferozepur 54 33 43 50 59 65 17 33
Gurdaspur 55 33 45 58 68 78 23 45
Hoshiarpur 70 37 55 65 73 85 18 48
Jalandhar 55 33 43 55 65 75 23 43
Ludhiana 57 35 45 55 70 85 25 50
Mohali 43 27 32 44 55 60 23 33
Pathankot 61 48 53 60 70 75 18 28
Patiala 58 38 48 58 68 78 20 40
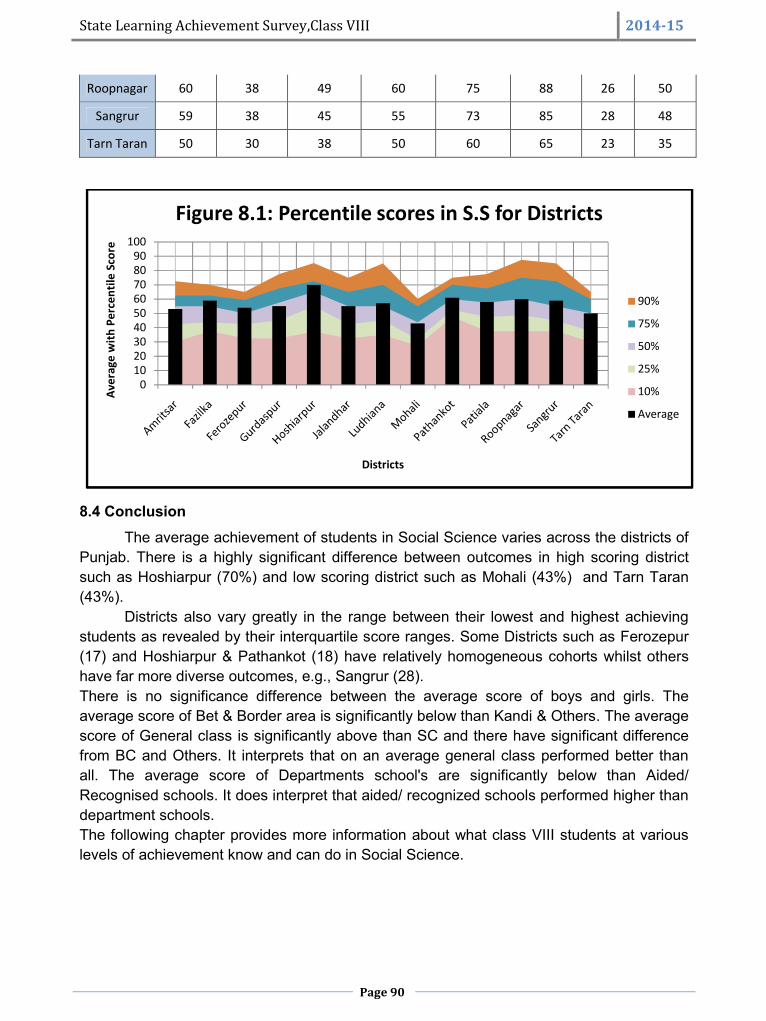
State Learning Achievement Survey,Class VIII 2014-15
Page 90
Roopnagar 60 38 49 60 75 88 26 50
Sangrur 59 38 45 55 73 85 28 48
Tarn Taran 50 30 38 50 60 65 23 35
8.4 ConclusionThe average achievement of students in Social Science varies across the districts of
Punjab. There is a highly significant difference between outcomes in high scoring districtsuch as Hoshiarpur (70%) and low scoring district such as Mohali (43%) and Tarn Taran(43%).
Districts also vary greatly in the range between their lowest and highest achievingstudents as revealed by their interquartile score ranges. Some Districts such as Ferozepur(17) and Hoshiarpur & Pathankot (18) have relatively homogeneous cohorts whilst othershave far more diverse outcomes, e.g., Sangrur (28).There is no significance difference between the average score of boys and girls. Theaverage score of Bet & Border area is significantly below than Kandi & Others. The averagescore of General class is significantly above than SC and there have significant differencefrom BC and Others. It interprets that on an average general class performed better thanall. The average score of Departments school's are significantly below than Aided/Recognised schools. It does interpret that aided/ recognized schools performed higher thandepartment schools.The following chapter provides more information about what class VIII students at variouslevels of achievement know and can do in Social Science.
0102030405060708090
100
Aver
age
with
Per
cent
ile S
core
Districts
Figure 8.1: Percentile scores in S.S for Districts
90%
75%
50%
25%
10%
Average
State Learning Achievement Survey,Class VIII 2014-15
Page 91
Chapter 9What students know and can do: Social Science
9.1 Overview of the Social Science tests
The Social Science achievement survey given to class VIII students consisted of two
test booklets, each containing 40, four-option multiple choice items. Ten items were
common across all test forms. These served as ‘anchors’ so that the different test booklets
could be linked together and hence, all items could be placed on a common scale. In total,
the Social Science assessment instrument comprised 60 unique items.
The items in each text booklet were chosen to cover the following range of scientific
domains from the Social Science curriculum: History, Geography and Civics. In addition to
the content domains listed above, items were constructed to test a range of cognitive
processes/domain18 (Classified by Bloom in 1956) or parameters in a variety of contexts.
These were classified as Knowledge, Understanding, Application and Skill as described
below:
18 Source regarding cognitive process/Domain :- 1. https://en.wikipedia.org/wiki/Bloom%27s_taxonomy2. Teaching of Social Science by Dr. Renu Gupta.
Parameters classification for test construction in Social Science
Knowledge: In items testing this process, students are expected to answer usingsimple knowledge (recall) or recognition of terms and/or conceptsfamiliar from their lessons.
Comprehension/Understanding: Demonstrate understanding of facts and ideas byorganizing, comparing, translating, interpreting,
giving descriptions, and stating the main ideas Translation Interpretation Extrapolation
Application: Using acquired knowledge. Solve problems in new situations by applyingacquired knowledge, facts, techniques and rules.
Skill: It includes Analysis, Synthesis and Evaluation of acquired knowledge.
Analysis: Examine and break information into parts by identifying motives orcauses. Make inferences and find evidence to support generalizations
Analysis of elements Analysis of relationships Analysis of organizational principles
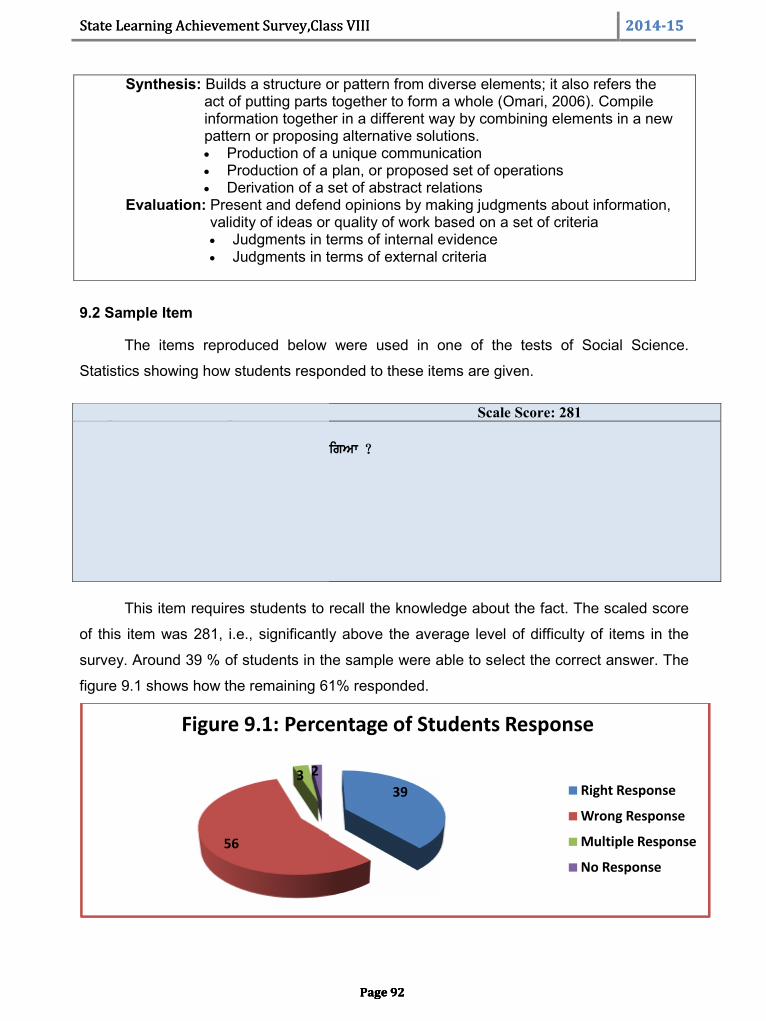
State Learning Achievement Survey,Class VIII 2014-15
Page 92
Synthesis: Builds a structure or pattern from diverse elements; it also refers theact of putting parts together to form a whole (Omari, 2006). Compileinformation together in a different way by combining elements in a newpattern or proposing alternative solutions. Production of a unique communication Production of a plan, or proposed set of operations Derivation of a set of abstract relations
Evaluation: Present and defend opinions by making judgments about information,validity of ideas or quality of work based on a set of criteria Judgments in terms of internal evidence Judgments in terms of external criteria
9.2 Sample Item
The items reproduced below were used in one of the tests of Social Science.
Statistics showing how students responded to these items are given.
This item requires students to recall the knowledge about the fact. The scaled score
of this item was 281, i.e., significantly above the average level of difficulty of items in the
survey. Around 39 % of students in the sample were able to select the correct answer. The
figure 9.1 shows how the remaining 61% responded.
56
3 2
Figure 9.1: Percentage of Students Response
Sample Item: Knowledge Scale Score: 281
22. ipts ieMfIAw AYkt kdoN pws kIqw igAw ?
a) 1773
A) 1780
e) 1784
s) 1833
State Learning Achievement Survey,Class VIII 2014-15
Page 92
Synthesis: Builds a structure or pattern from diverse elements; it also refers theact of putting parts together to form a whole (Omari, 2006). Compileinformation together in a different way by combining elements in a newpattern or proposing alternative solutions. Production of a unique communication Production of a plan, or proposed set of operations Derivation of a set of abstract relations
Evaluation: Present and defend opinions by making judgments about information,validity of ideas or quality of work based on a set of criteria Judgments in terms of internal evidence Judgments in terms of external criteria
9.2 Sample Item
The items reproduced below were used in one of the tests of Social Science.
Statistics showing how students responded to these items are given.
This item requires students to recall the knowledge about the fact. The scaled score
of this item was 281, i.e., significantly above the average level of difficulty of items in the
survey. Around 39 % of students in the sample were able to select the correct answer. The
figure 9.1 shows how the remaining 61% responded.
39
Figure 9.1: Percentage of Students Response
Right Response
Wrong Response
Multiple Response
No Response
Sample Item: Knowledge Scale Score: 281
22. ipts ieMfIAw AYkt kdoN pws kIqw igAw ?
a) 1773
A) 1780
e) 1784
s) 1833
State Learning Achievement Survey,Class VIII 2014-15
Page 92
Synthesis: Builds a structure or pattern from diverse elements; it also refers theact of putting parts together to form a whole (Omari, 2006). Compileinformation together in a different way by combining elements in a newpattern or proposing alternative solutions. Production of a unique communication Production of a plan, or proposed set of operations Derivation of a set of abstract relations
Evaluation: Present and defend opinions by making judgments about information,validity of ideas or quality of work based on a set of criteria Judgments in terms of internal evidence Judgments in terms of external criteria
9.2 Sample Item
The items reproduced below were used in one of the tests of Social Science.
Statistics showing how students responded to these items are given.
This item requires students to recall the knowledge about the fact. The scaled score
of this item was 281, i.e., significantly above the average level of difficulty of items in the
survey. Around 39 % of students in the sample were able to select the correct answer. The
figure 9.1 shows how the remaining 61% responded.
Right Response
Wrong Response
Multiple Response
No Response
Sample Item: Knowledge Scale Score: 281
22. ipts ieMfIAw AYkt kdoN pws kIqw igAw ?
a) 1773
A) 1780
e) 1784
s) 1833
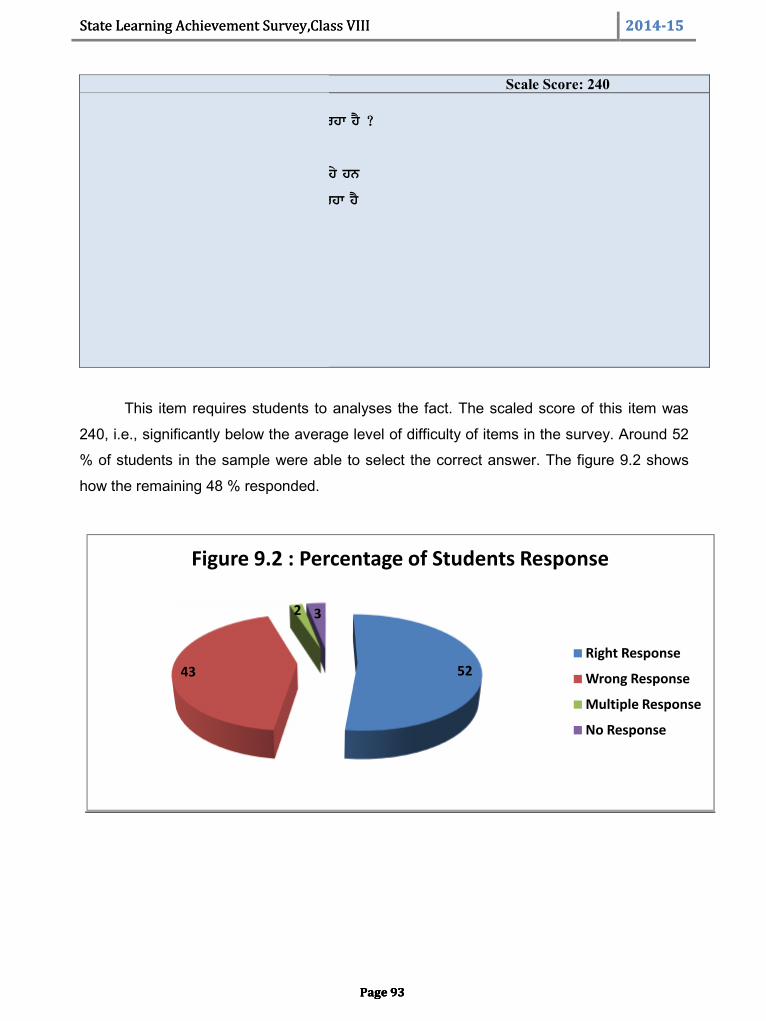
State Learning Achievement Survey,Class VIII 2014-15
Page 93
Sample Item: Skill Scale Score: 240
29. jwqIvwd dw Bwrq qy kI pRBwv pY irhw hY ?
1. jwqI ADwr qy CUqCwq ho rhI hY
2. jwqI ADwrq dbwE smUh pYdw ho rhy hn
3. sB jwqI dy lokW iv`c imlwp vD irhw hY
a) 1 Aqy 2
A) 1 Aqy 3
e) 2 Aqy 3
s) auprokq swry
This item requires students to analyses the fact. The scaled score of this item was
240, i.e., significantly below the average level of difficulty of items in the survey. Around 52
% of students in the sample were able to select the correct answer. The figure 9.2 shows
how the remaining 48 % responded.
43
2 3
Figure 9.2 : Percentage of Students Response
State Learning Achievement Survey,Class VIII 2014-15
Page 93
Sample Item: Skill Scale Score: 240
29. jwqIvwd dw Bwrq qy kI pRBwv pY irhw hY ?
1. jwqI ADwr qy CUqCwq ho rhI hY
2. jwqI ADwrq dbwE smUh pYdw ho rhy hn
3. sB jwqI dy lokW iv`c imlwp vD irhw hY
a) 1 Aqy 2
A) 1 Aqy 3
e) 2 Aqy 3
s) auprokq swry
This item requires students to analyses the fact. The scaled score of this item was
240, i.e., significantly below the average level of difficulty of items in the survey. Around 52
% of students in the sample were able to select the correct answer. The figure 9.2 shows
how the remaining 48 % responded.
52
3
Figure 9.2 : Percentage of Students Response
Right Response
Wrong Response
Multiple Response
No Response
State Learning Achievement Survey,Class VIII 2014-15
Page 93
Sample Item: Skill Scale Score: 240
29. jwqIvwd dw Bwrq qy kI pRBwv pY irhw hY ?
1. jwqI ADwr qy CUqCwq ho rhI hY
2. jwqI ADwrq dbwE smUh pYdw ho rhy hn
3. sB jwqI dy lokW iv`c imlwp vD irhw hY
a) 1 Aqy 2
A) 1 Aqy 3
e) 2 Aqy 3
s) auprokq swry
This item requires students to analyses the fact. The scaled score of this item was
240, i.e., significantly below the average level of difficulty of items in the survey. Around 52
% of students in the sample were able to select the correct answer. The figure 9.2 shows
how the remaining 48 % responded.
Right Response
Wrong Response
Multiple Response
No Response
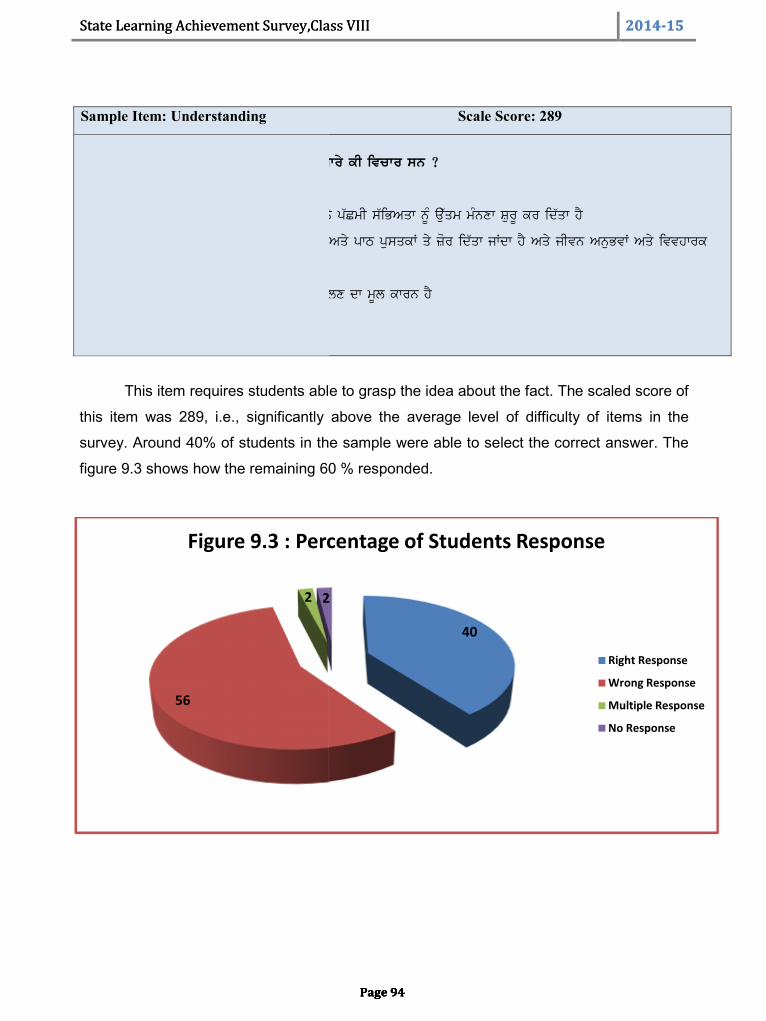
State Learning Achievement Survey,Class VIII 2014-15
Page 94
Sample Item: Understanding Scale Score: 289
38. mhwqmw gWDI jI dy p`CmI is`iKAw bwry kI ivcwr sn ?
a) p`CmI isiKAw Anuswr pVHy BwrqIAW ny p`CmI siBAqw nUM au`qm mMnxw SurU kr id`qw hY
A) p`CmI isiKAw iv`c kyvl pVHn-ilKx Aqy pwT pusqkW qy zor id`qw jWdw hY Aqy jIvn AnuBvW Aqy ivvhwrk
igAwn qy nhIN
e) p`CmI isiKAw Bwrq iv`c byruzgwrI PYlx dw mUl kwrn hY
s) auprokq swry
This item requires students able to grasp the idea about the fact. The scaled score of
this item was 289, i.e., significantly above the average level of difficulty of items in the
survey. Around 40% of students in the sample were able to select the correct answer. The
figure 9.3 shows how the remaining 60 % responded.
56
2 2
Figure 9.3 : Percentage of Students Response
State Learning Achievement Survey,Class VIII 2014-15
Page 94
Sample Item: Understanding Scale Score: 289
38. mhwqmw gWDI jI dy p`CmI is`iKAw bwry kI ivcwr sn ?
a) p`CmI isiKAw Anuswr pVHy BwrqIAW ny p`CmI siBAqw nUM au`qm mMnxw SurU kr id`qw hY
A) p`CmI isiKAw iv`c kyvl pVHn-ilKx Aqy pwT pusqkW qy zor id`qw jWdw hY Aqy jIvn AnuBvW Aqy ivvhwrk
igAwn qy nhIN
e) p`CmI isiKAw Bwrq iv`c byruzgwrI PYlx dw mUl kwrn hY
s) auprokq swry
This item requires students able to grasp the idea about the fact. The scaled score of
this item was 289, i.e., significantly above the average level of difficulty of items in the
survey. Around 40% of students in the sample were able to select the correct answer. The
figure 9.3 shows how the remaining 60 % responded.
40
2
Figure 9.3 : Percentage of Students Response
Right Response
Wrong Response
Multiple Response
No Response
State Learning Achievement Survey,Class VIII 2014-15
Page 94
Sample Item: Understanding Scale Score: 289
38. mhwqmw gWDI jI dy p`CmI is`iKAw bwry kI ivcwr sn ?
a) p`CmI isiKAw Anuswr pVHy BwrqIAW ny p`CmI siBAqw nUM au`qm mMnxw SurU kr id`qw hY
A) p`CmI isiKAw iv`c kyvl pVHn-ilKx Aqy pwT pusqkW qy zor id`qw jWdw hY Aqy jIvn AnuBvW Aqy ivvhwrk
igAwn qy nhIN
e) p`CmI isiKAw Bwrq iv`c byruzgwrI PYlx dw mUl kwrn hY
s) auprokq swry
This item requires students able to grasp the idea about the fact. The scaled score of
this item was 289, i.e., significantly above the average level of difficulty of items in the
survey. Around 40% of students in the sample were able to select the correct answer. The
figure 9.3 shows how the remaining 60 % responded.
Right Response
Wrong Response
Multiple Response
No Response
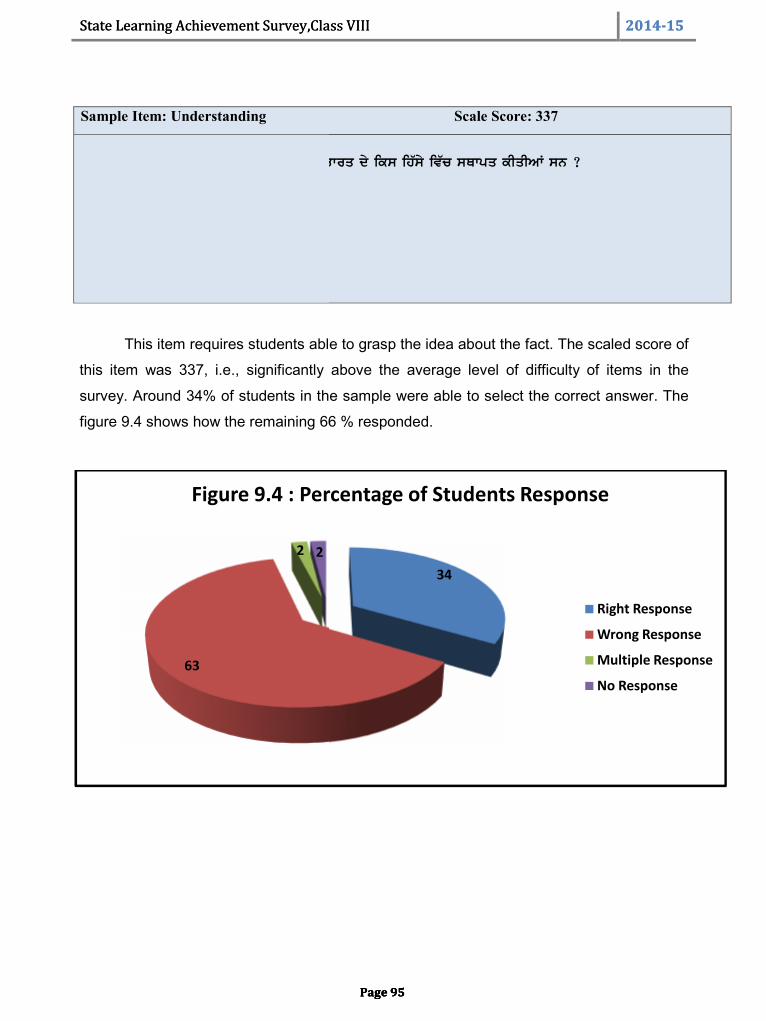
State Learning Achievement Survey,Class VIII 2014-15
Page 95
Sample Item: Understanding Scale Score: 337
16. purqgwlIAW ny AwpxIAW bsqIAW Bwrq dy iks ihsy iv`c sQwpq kIqIAW sn ?
a) a`qr
A) pUrb
e) p`Cm
s) d`Kx
This item requires students able to grasp the idea about the fact. The scaled score of
this item was 337, i.e., significantly above the average level of difficulty of items in the
survey. Around 34% of students in the sample were able to select the correct answer. The
figure 9.4 shows how the remaining 66 % responded.
63
2 2
Figure 9.4 : Percentage of Students Response
State Learning Achievement Survey,Class VIII 2014-15
Page 95
Sample Item: Understanding Scale Score: 337
16. purqgwlIAW ny AwpxIAW bsqIAW Bwrq dy iks ihsy iv`c sQwpq kIqIAW sn ?
a) a`qr
A) pUrb
e) p`Cm
s) d`Kx
This item requires students able to grasp the idea about the fact. The scaled score of
this item was 337, i.e., significantly above the average level of difficulty of items in the
survey. Around 34% of students in the sample were able to select the correct answer. The
figure 9.4 shows how the remaining 66 % responded.
342
Figure 9.4 : Percentage of Students Response
Right Response
Wrong Response
Multiple Response
No Response
State Learning Achievement Survey,Class VIII 2014-15
Page 95
Sample Item: Understanding Scale Score: 337
16. purqgwlIAW ny AwpxIAW bsqIAW Bwrq dy iks ihsy iv`c sQwpq kIqIAW sn ?
a) a`qr
A) pUrb
e) p`Cm
s) d`Kx
This item requires students able to grasp the idea about the fact. The scaled score of
this item was 337, i.e., significantly above the average level of difficulty of items in the
survey. Around 34% of students in the sample were able to select the correct answer. The
figure 9.4 shows how the remaining 66 % responded.
Right Response
Wrong Response
Multiple Response
No Response
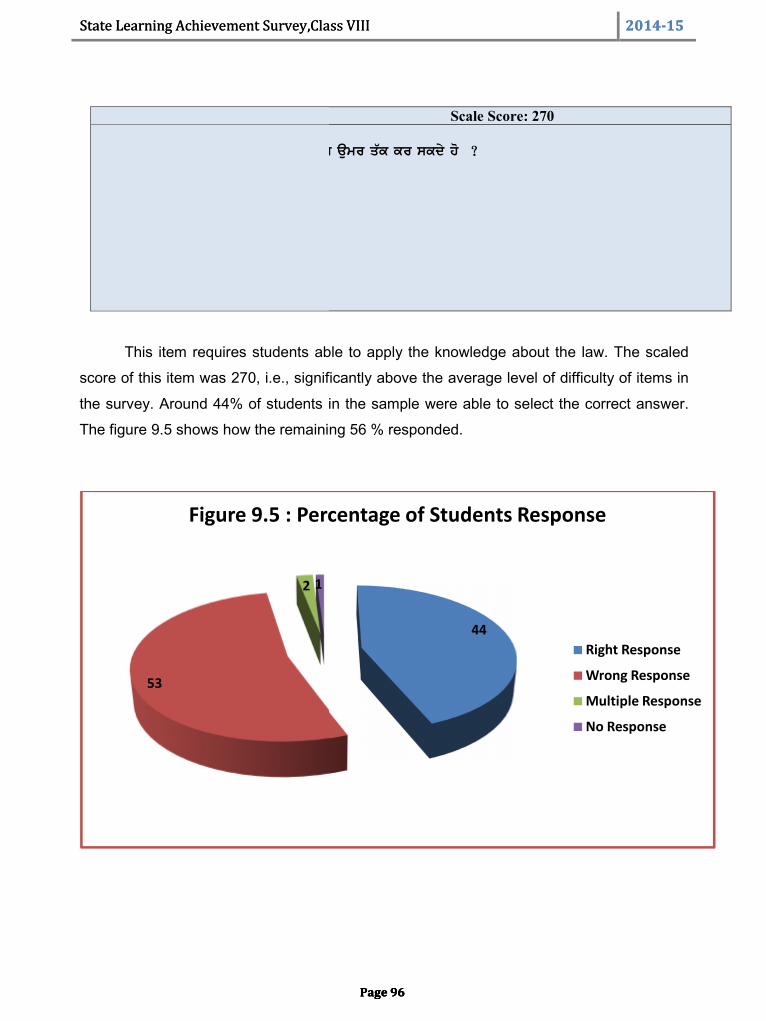
State Learning Achievement Survey,Class VIII 2014-15
Page 96
Sample Item :Application Scale Score: 270
25. is`iKAw dy AiDkwr dI vrqoN iks aumr q`k kr skdy ho ?
a) 15 swl q`k
A) 6 qoN 14 swl qk
e) 5 qoN 14 swl qk
s) iehnW iv`coN koeI nhIN
This item requires students able to apply the knowledge about the law. The scaled
score of this item was 270, i.e., significantly above the average level of difficulty of items in
the survey. Around 44% of students in the sample were able to select the correct answer.
The figure 9.5 shows how the remaining 56 % responded.
53
2 1
Figure 9.5 : Percentage of Students Response
State Learning Achievement Survey,Class VIII 2014-15
Page 96
Sample Item :Application Scale Score: 270
25. is`iKAw dy AiDkwr dI vrqoN iks aumr q`k kr skdy ho ?
a) 15 swl q`k
A) 6 qoN 14 swl qk
e) 5 qoN 14 swl qk
s) iehnW iv`coN koeI nhIN
This item requires students able to apply the knowledge about the law. The scaled
score of this item was 270, i.e., significantly above the average level of difficulty of items in
the survey. Around 44% of students in the sample were able to select the correct answer.
The figure 9.5 shows how the remaining 56 % responded.
44
1
Figure 9.5 : Percentage of Students Response
Right Response
Wrong Response
Multiple Response
No Response
State Learning Achievement Survey,Class VIII 2014-15
Page 96
Sample Item :Application Scale Score: 270
25. is`iKAw dy AiDkwr dI vrqoN iks aumr q`k kr skdy ho ?
a) 15 swl q`k
A) 6 qoN 14 swl qk
e) 5 qoN 14 swl qk
s) iehnW iv`coN koeI nhIN
This item requires students able to apply the knowledge about the law. The scaled
score of this item was 270, i.e., significantly above the average level of difficulty of items in
the survey. Around 44% of students in the sample were able to select the correct answer.
The figure 9.5 shows how the remaining 56 % responded.
Right Response
Wrong Response
Multiple Response
No Response
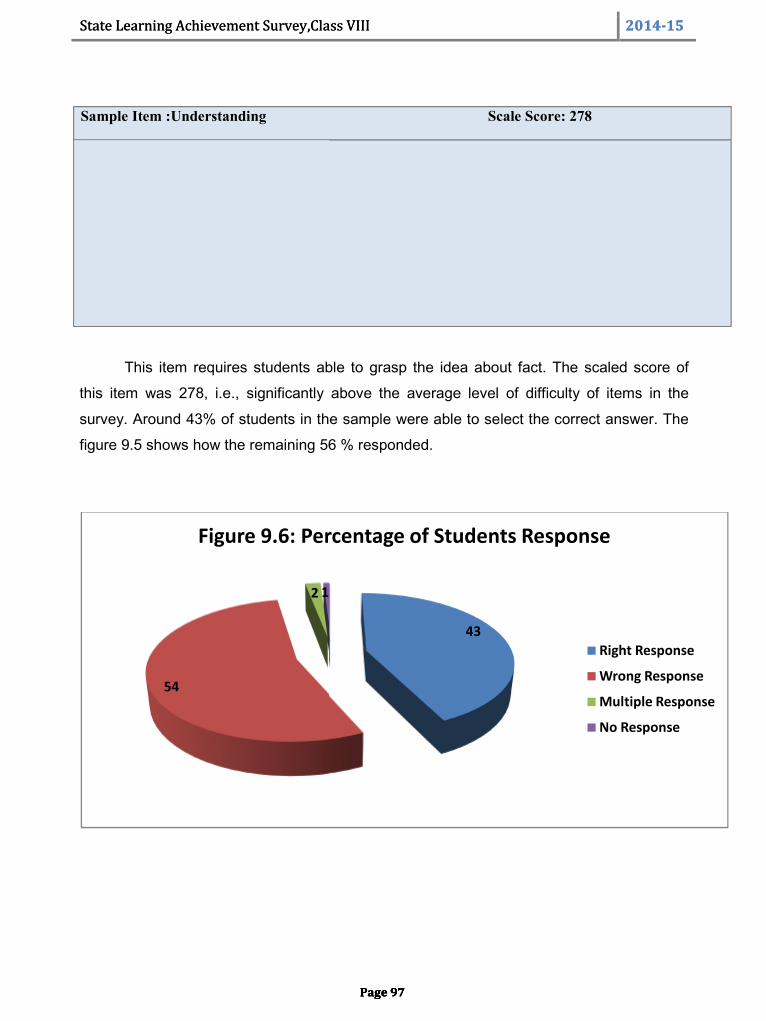
State Learning Achievement Survey,Class VIII 2014-15
Page 97
Sample Item :Understanding Scale Score: 278
28. hyT iliKAW iv`coN kOx srv au`c hY ?
a) pRDwn mMqrI
A) rwStrpqI
e) suprIm kort dw j`j
s) sMivDwn
This item requires students able to grasp the idea about fact. The scaled score of
this item was 278, i.e., significantly above the average level of difficulty of items in the
survey. Around 43% of students in the sample were able to select the correct answer. The
figure 9.5 shows how the remaining 56 % responded.
54
2 1
Figure 9.6: Percentage of Students Response
State Learning Achievement Survey,Class VIII 2014-15
Page 97
Sample Item :Understanding Scale Score: 278
28. hyT iliKAW iv`coN kOx srv au`c hY ?
a) pRDwn mMqrI
A) rwStrpqI
e) suprIm kort dw j`j
s) sMivDwn
This item requires students able to grasp the idea about fact. The scaled score of
this item was 278, i.e., significantly above the average level of difficulty of items in the
survey. Around 43% of students in the sample were able to select the correct answer. The
figure 9.5 shows how the remaining 56 % responded.
43
1
Figure 9.6: Percentage of Students Response
Right Response
Wrong Response
Multiple Response
No Response
State Learning Achievement Survey,Class VIII 2014-15
Page 97
Sample Item :Understanding Scale Score: 278
28. hyT iliKAW iv`coN kOx srv au`c hY ?
a) pRDwn mMqrI
A) rwStrpqI
e) suprIm kort dw j`j
s) sMivDwn
This item requires students able to grasp the idea about fact. The scaled score of
this item was 278, i.e., significantly above the average level of difficulty of items in the
survey. Around 43% of students in the sample were able to select the correct answer. The
figure 9.5 shows how the remaining 56 % responded.
Figure 9.6: Percentage of Students Response
Right Response
Wrong Response
Multiple Response
No Response
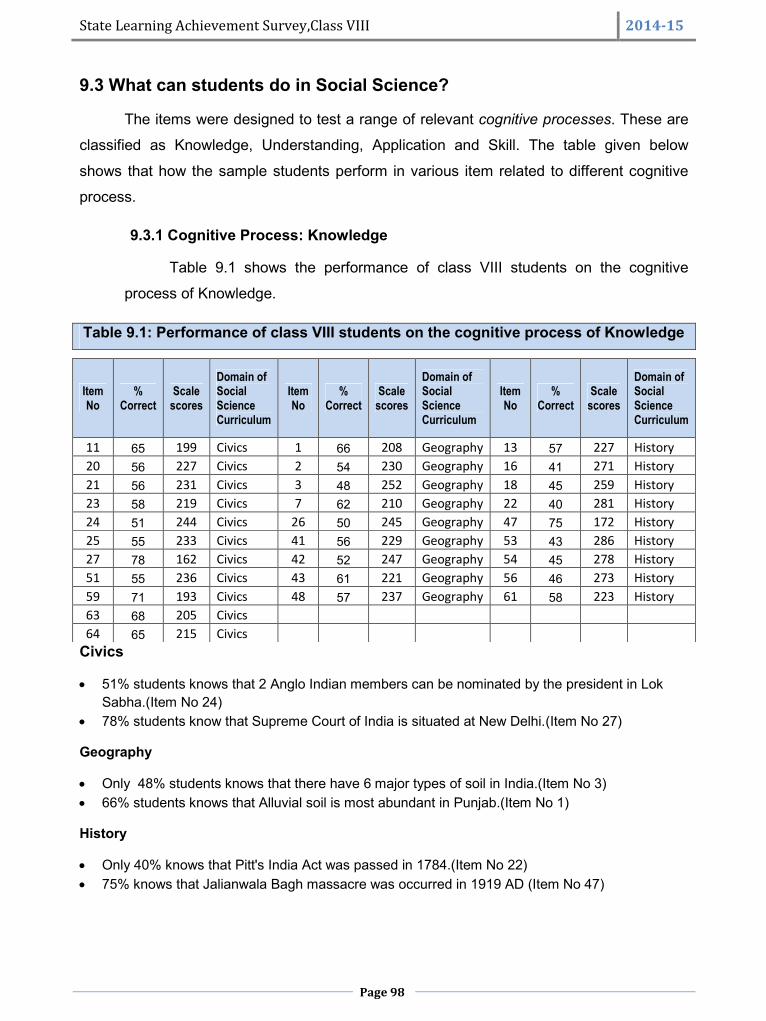
State Learning Achievement Survey,Class VIII 2014-15
Page 98
9.3 What can students do in Social Science?
The items were designed to test a range of relevant cognitive processes. These are
classified as Knowledge, Understanding, Application and Skill. The table given below
shows that how the sample students perform in various item related to different cognitive
process.
9.3.1 Cognitive Process: Knowledge
Table 9.1 shows the performance of class VIII students on the cognitive
process of Knowledge.
Table 9.1: Performance of class VIII students on the cognitive process of Knowledge
Civics
51% students knows that 2 Anglo Indian members can be nominated by the president in LokSabha.(Item No 24)
78% students know that Supreme Court of India is situated at New Delhi.(Item No 27)
Geography
Only 48% students knows that there have 6 major types of soil in India.(Item No 3) 66% students knows that Alluvial soil is most abundant in Punjab.(Item No 1)
History
Only 40% knows that Pitt's India Act was passed in 1784.(Item No 22) 75% knows that Jalianwala Bagh massacre was occurred in 1919 AD (Item No 47)
ItemNo
%Correct
Scalescores
Domain ofSocialScienceCurriculum
ItemNo
%Correct
Scalescores
Domain ofSocialScienceCurriculum
ItemNo
%Correct
Scalescores
Domain ofSocialScienceCurriculum
11 65 199 Civics 1 66 208 Geography 13 57 227 History20 56 227 Civics 2 54 230 Geography 16 41 271 History21 56 231 Civics 3 48 252 Geography 18 45 259 History23 58 219 Civics 7 62 210 Geography 22 40 281 History24 51 244 Civics 26 50 245 Geography 47 75 172 History25 55 233 Civics 41 56 229 Geography 53 43 286 History27 78 162 Civics 42 52 247 Geography 54 45 278 History51 55 236 Civics 43 61 221 Geography 56 46 273 History59 71 193 Civics 48 57 237 Geography 61 58 223 History63 68 205 Civics64 65 215 Civics
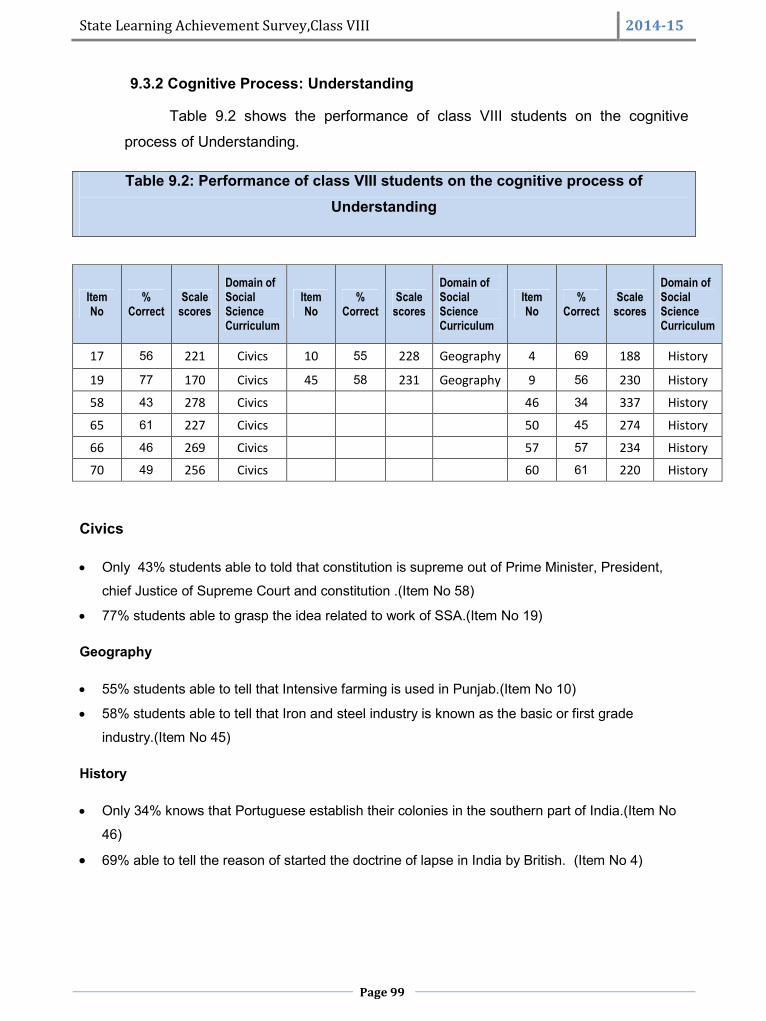
State Learning Achievement Survey,Class VIII 2014-15
Page 99
9.3.2 Cognitive Process: Understanding
Table 9.2 shows the performance of class VIII students on the cognitive
process of Understanding.
Table 9.2: Performance of class VIII students on the cognitive process ofUnderstanding
ItemNo
%Correct
Scalescores
Domain ofSocialScienceCurriculum
ItemNo
%Correct
Scalescores
Domain ofSocialScienceCurriculum
ItemNo
%Correct
Scalescores
Domain ofSocialScienceCurriculum
17 56 221 Civics 10 55 228 Geography 4 69 188 History
19 77 170 Civics 45 58 231 Geography 9 56 230 History
58 43 278 Civics 46 34 337 History
65 61 227 Civics 50 45 274 History
66 46 269 Civics 57 57 234 History
70 49 256 Civics 60 61 220 History
Civics
Only 43% students able to told that constitution is supreme out of Prime Minister, President,
chief Justice of Supreme Court and constitution .(Item No 58)
77% students able to grasp the idea related to work of SSA.(Item No 19)
Geography
55% students able to tell that Intensive farming is used in Punjab.(Item No 10)
58% students able to tell that Iron and steel industry is known as the basic or first grade
industry.(Item No 45)
History
Only 34% knows that Portuguese establish their colonies in the southern part of India.(Item No
46)
69% able to tell the reason of started the doctrine of lapse in India by British. (Item No 4)
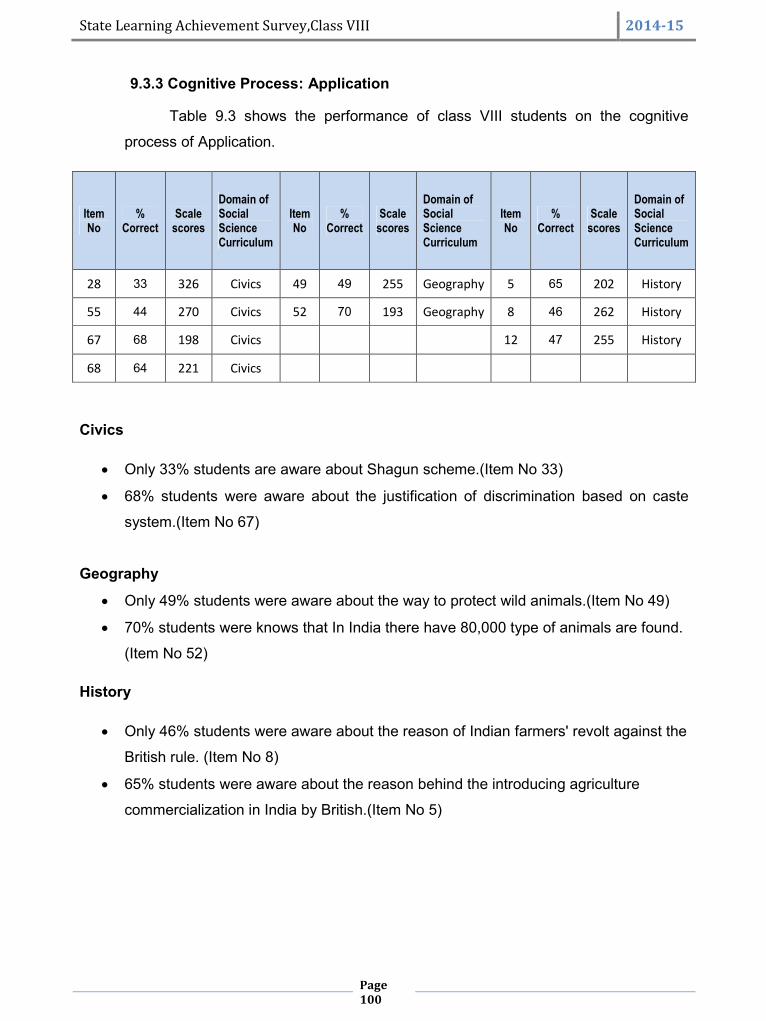
State Learning Achievement Survey,Class VIII 2014-15
Page100
9.3.3 Cognitive Process: Application
Table 9.3 shows the performance of class VIII students on the cognitive
process of Application.
ItemNo
%Correct
Scalescores
Domain ofSocialScienceCurriculum
ItemNo
%Correct
Scalescores
Domain ofSocialScienceCurriculum
ItemNo
%Correct
Scalescores
Domain ofSocialScienceCurriculum
28 33 326 Civics 49 49 255 Geography 5 65 202 History
55 44 270 Civics 52 70 193 Geography 8 46 262 History
67 68 198 Civics 12 47 255 History
68 64 221 Civics
Civics
Only 33% students are aware about Shagun scheme.(Item No 33)
68% students were aware about the justification of discrimination based on caste
system.(Item No 67)
Geography
Only 49% students were aware about the way to protect wild animals.(Item No 49)
70% students were knows that In India there have 80,000 type of animals are found.
(Item No 52)
History
Only 46% students were aware about the reason of Indian farmers' revolt against the
British rule. (Item No 8)
65% students were aware about the reason behind the introducing agriculture
commercialization in India by British.(Item No 5)
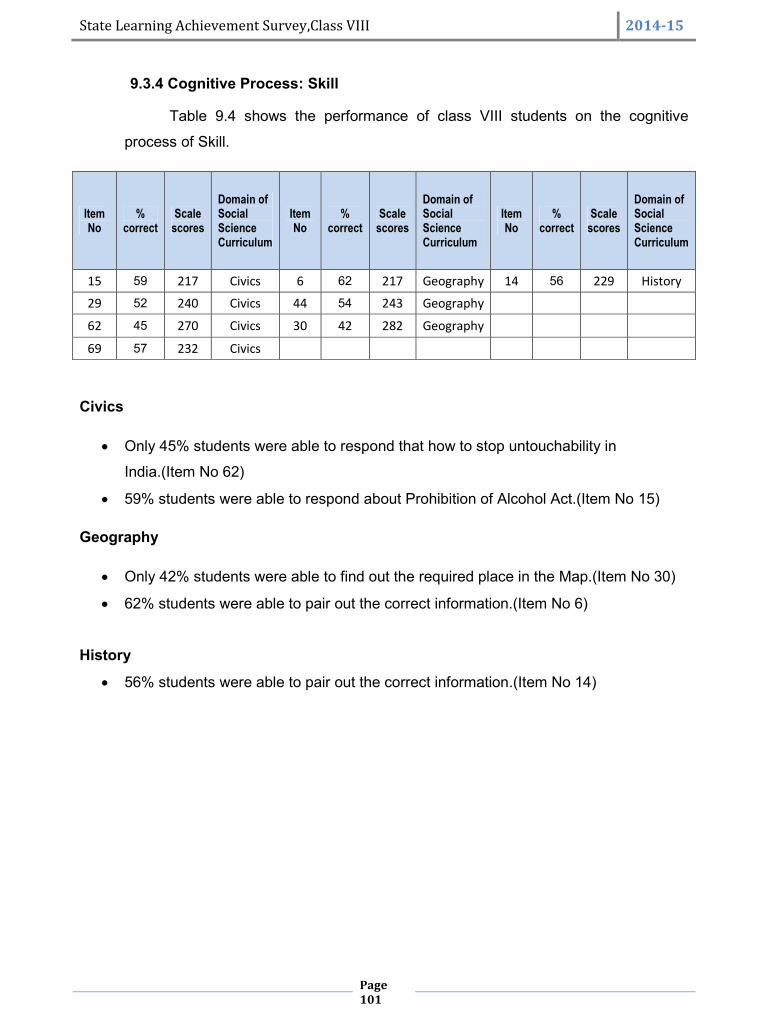
State Learning Achievement Survey,Class VIII 2014-15
Page101
9.3.4 Cognitive Process: Skill
Table 9.4 shows the performance of class VIII students on the cognitive
process of Skill.
ItemNo
%correct
Scalescores
Domain ofSocialScienceCurriculum
ItemNo
%correct
Scalescores
Domain ofSocialScienceCurriculum
ItemNo
%correct
Scalescores
Domain ofSocialScienceCurriculum
15 59 217 Civics 6 62 217 Geography 14 56 229 History
29 52 240 Civics 44 54 243 Geography
62 45 270 Civics 30 42 282 Geography
69 57 232 Civics
Civics
Only 45% students were able to respond that how to stop untouchability in
India.(Item No 62)
59% students were able to respond about Prohibition of Alcohol Act.(Item No 15)
Geography
Only 42% students were able to find out the required place in the Map.(Item No 30)
62% students were able to pair out the correct information.(Item No 6)
History
56% students were able to pair out the correct information.(Item No 14)
State Learning Achievement Survey,Class VIII 2014-15
Page102
Appendix – I
Sample ProcedureThis appendix of the class VIII State Learning Achievement Survey (SLAS) report explains
the sampling methods of the survey. It describes the target and sample populations and the
sample selection procedures. It sets out the necessary exceptions and their impact on the
achieved sample.
Class VIII SLAS: Target PopulationThe class VIII SLAS was designed to investigate learning achievement. But, the target
population was all class IX students because the survey was administer in the beginning of
the session. Sample schools included those managed by the Department of Education,
Private-but-government-aided schools and recognised. This follows the classification
categories of the District Information System for Education (DISE). Schools run by the
central, state or local governments are referred to as ‘government’ schools. Schools run by
private managements but funded largely or recognised by government are known as ‘aided’
schools or recognised. The survey was administered in 13 districts. Because the area i.e
Kandi, Bet, Border and others which was defined for the survey was not available in all
Districts of Punjab. The definition of Kandi, Bet and Border are as follows:-
1. Kandi Area19 :- The area lying below the mountains is called Kandi and runs across
eastern portions of Hoshiarpur and Balachaur tehsil of Nawanshahr District.
2. Bet Area: - The portion of Doaba that lies in the area between the river tract falling
between the Beas and Black Bein is called "Bet". Any area near a river is also called Bet
and therefore, there are Bet areas in all area of Punjab which adjoin a river.
3. Border Area: - The portion of Punjab that share the border of country and other states
like Pathankot, Gurdaspur, Amritsar, TarnTaran, Firozepur, Fazilka, Muktsar, Bathinda,
Mansa, Sangrur, Patiala, Mohali, Ropar and Hoshiarpur.
Population Exclusions
As is the case in other large-scale educational surveys, some sub-populations were
excluded from the total target population at the initial stage of sampling. For logistical
reasons, the class IX having fewer than thirty students excluded. In addition to this ‘small
school exclusion’, the survey excluded ‘Upper Primary Only’ schools due to a classification
error.
19 Information regarding Area like Kandi, Bet, LOC and Border are collected from the http://en.wikipedia.org.
State Learning Achievement Survey,Class VIII 2014-15
Page103
As a result of these exclusions, population coverage of the class IX (Who have passed
class VIII recently) sample varied from districts to districts.
Sample Design and SelectionIn general, developing the sample for each districts involved a three-stage cluster design
which used a combination of probability sampling methods, Probability Proportional to Size
(PPS) sampling and Simple Random Sampling (SRS). In SRS, all sampling units have an
equal probability of being selected. When PPS is applied, larger sampling units have a
higher probability of selection than smaller units.
At the first stage of sampling, districts were selected using Purposive and random sample
principles. This means that the probability of selecting a particular district depended on the
area selected.
At the second stage, in the chosen districts, the requisite number of schools was selected
using the PPS principles. The measure of size was based on class IX enrolment data from
the District Information System for Education (DISE) 2013-14. The number of schools to be
sampled from a district was determined by the total number of students required for testing
and the average class size within the Districts. The number of selected schools for each
district varied between districts to districts. One replacement school was assigned for each
sample school, with one of each pair being selected and the other being utilised as a
reserve, in case it was not possible to collect data from the original. The class VIII (SLAS)
covered two subjects: Language (Punjabi) Mathematics, Science and Social Science.
At the third stage, the required number of students in each school was selected using SRS.
In schools where class IX had multiple sections, an extra stage of selection was added with
one section being sampled at random. The maximum number of students to be tested from
a school was set as 30. Once students were selected, they were tested in the assigned
subjects of their schools. Two different test forms of each subject were evenly distributed
among selected students.
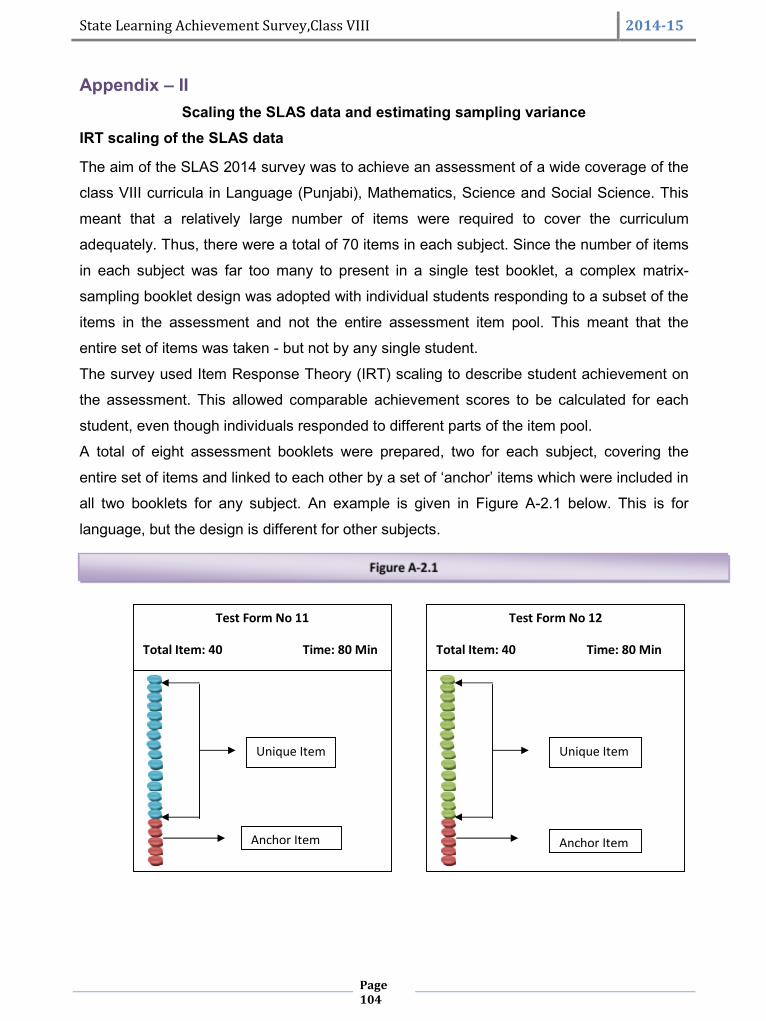
State Learning Achievement Survey,Class VIII 2014-15
Page104
Appendix – IIScaling the SLAS data and estimating sampling variance
IRT scaling of the SLAS data
The aim of the SLAS 2014 survey was to achieve an assessment of a wide coverage of the
class VIII curricula in Language (Punjabi), Mathematics, Science and Social Science. This
meant that a relatively large number of items were required to cover the curriculum
adequately. Thus, there were a total of 70 items in each subject. Since the number of items
in each subject was far too many to present in a single test booklet, a complex matrix-
sampling booklet design was adopted with individual students responding to a subset of the
items in the assessment and not the entire assessment item pool. This meant that the
entire set of items was taken - but not by any single student.
The survey used Item Response Theory (IRT) scaling to describe student achievement on
the assessment. This allowed comparable achievement scores to be calculated for each
student, even though individuals responded to different parts of the item pool.
A total of eight assessment booklets were prepared, two for each subject, covering the
entire set of items and linked to each other by a set of ‘anchor’ items which were included in
all two booklets for any subject. An example is given in Figure A-2.1 below. This is for
language, but the design is different for other subjects.
Figure A-2.1
Test Form No 11
Total Item: 40 Time: 80 Min
Unique Item
Anchor Item
Unique Item
Anchor Item
Test Form No 12
Total Item: 40 Time: 80 Min
Unique Item
Anchor Item
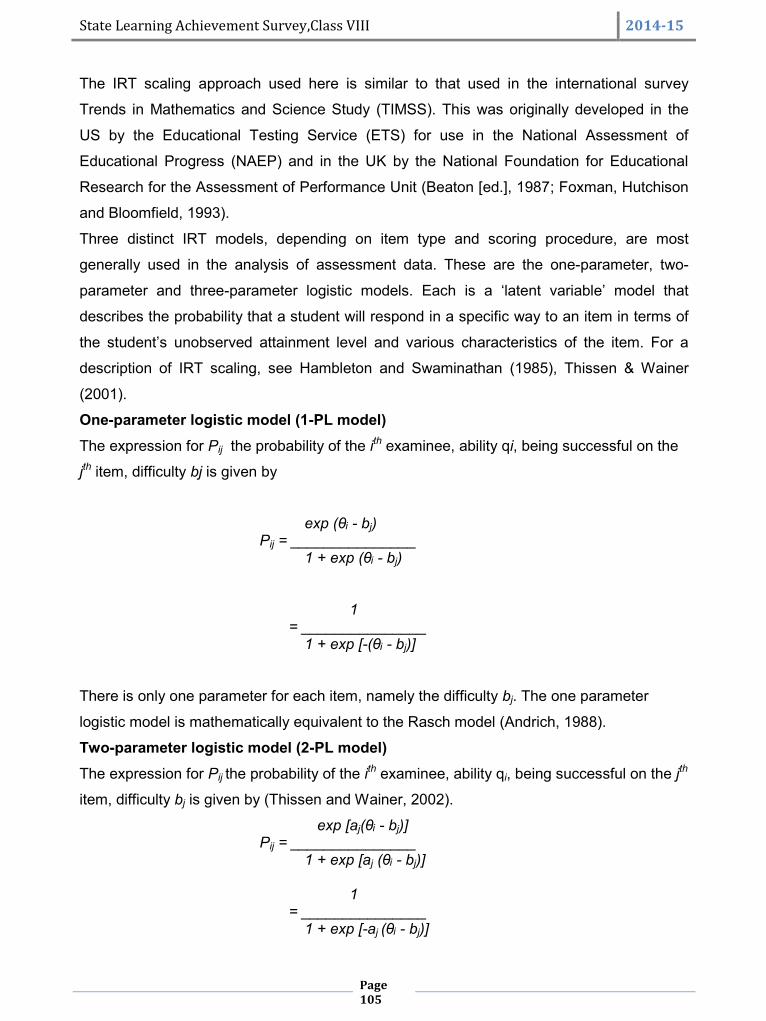
State Learning Achievement Survey,Class VIII 2014-15
Page105
The IRT scaling approach used here is similar to that used in the international survey
Trends in Mathematics and Science Study (TIMSS). This was originally developed in the
US by the Educational Testing Service (ETS) for use in the National Assessment of
Educational Progress (NAEP) and in the UK by the National Foundation for Educational
Research for the Assessment of Performance Unit (Beaton [ed.], 1987; Foxman, Hutchison
and Bloomfield, 1993).
Three distinct IRT models, depending on item type and scoring procedure, are most
generally used in the analysis of assessment data. These are the one-parameter, two-
parameter and three-parameter logistic models. Each is a ‘latent variable’ model that
describes the probability that a student will respond in a specific way to an item in terms of
the student’s unobserved attainment level and various characteristics of the item. For a
description of IRT scaling, see Hambleton and Swaminathan (1985), Thissen & Wainer
(2001).
One-parameter logistic model (1-PL model)The expression for Pij the probability of the ith examinee, ability qi, being successful on the
jth item, difficulty bj is given by
exp (θᵢ - bj)Pij = _______________
1 + exp (θᵢ - bj)
1= _______________
1 + exp [-(θᵢ - bj)]
There is only one parameter for each item, namely the difficulty bj. The one parameter
logistic model is mathematically equivalent to the Rasch model (Andrich, 1988).
Two-parameter logistic model (2-PL model)The expression for Pij the probability of the ith examinee, ability qi, being successful on the jth
item, difficulty bj is given by (Thissen and Wainer, 2002).
exp [aj(θᵢ - bj)]Pij = _______________
1 + exp [aj (θᵢ - bj)]
1= _______________
1 + exp [-aj (θᵢ - bj)]
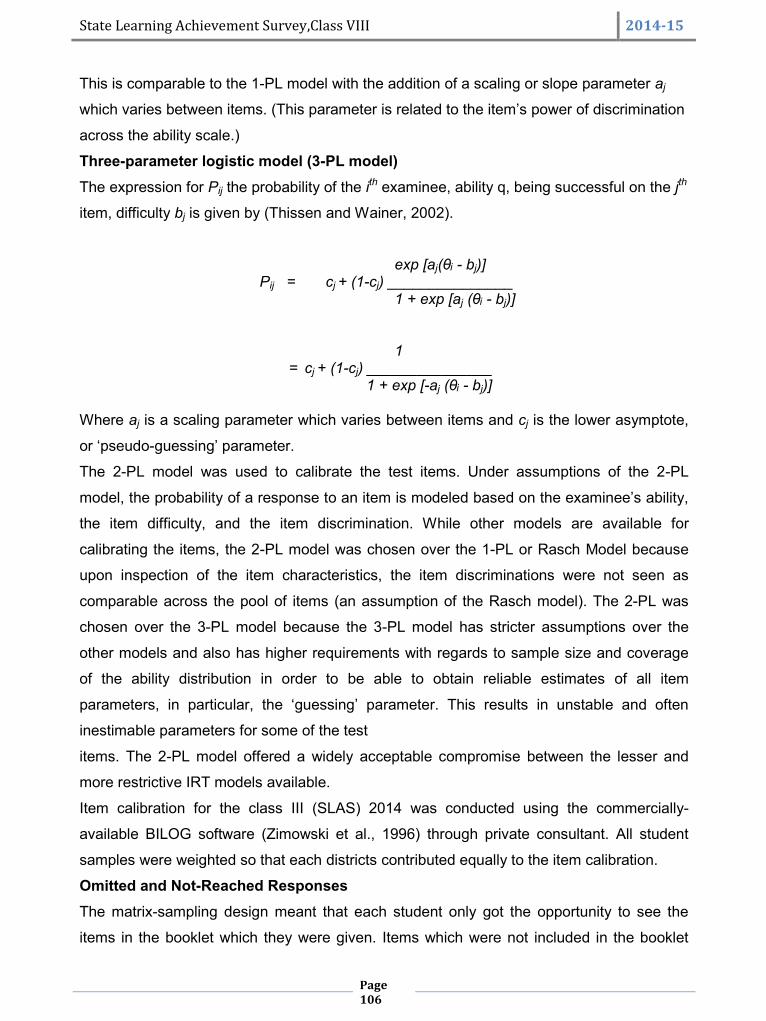
State Learning Achievement Survey,Class VIII 2014-15
Page106
This is comparable to the 1-PL model with the addition of a scaling or slope parameter aj
which varies between items. (This parameter is related to the item’s power of discrimination
across the ability scale.)
Three-parameter logistic model (3-PL model)The expression for Pij the probability of the ith examinee, ability q, being successful on the jth
item, difficulty bj is given by (Thissen and Wainer, 2002).
exp [aj(θᵢ - bj)]Pij = cj + (1-cj) _______________
1 + exp [aj (θᵢ - bj)]
1= cj + (1-cj) _______________
1 + exp [-aj (θᵢ - bj)]
Where aj is a scaling parameter which varies between items and cj is the lower asymptote,
or ‘pseudo-guessing’ parameter.
The 2-PL model was used to calibrate the test items. Under assumptions of the 2-PL
model, the probability of a response to an item is modeled based on the examinee’s ability,
the item difficulty, and the item discrimination. While other models are available for
calibrating the items, the 2-PL model was chosen over the 1-PL or Rasch Model because
upon inspection of the item characteristics, the item discriminations were not seen as
comparable across the pool of items (an assumption of the Rasch model). The 2-PL was
chosen over the 3-PL model because the 3-PL model has stricter assumptions over the
other models and also has higher requirements with regards to sample size and coverage
of the ability distribution in order to be able to obtain reliable estimates of all item
parameters, in particular, the ‘guessing’ parameter. This results in unstable and often
inestimable parameters for some of the test
items. The 2-PL model offered a widely acceptable compromise between the lesser and
more restrictive IRT models available.
Item calibration for the class III (SLAS) 2014 was conducted using the commercially-
available BILOG software (Zimowski et al., 1996) through private consultant. All student
samples were weighted so that each districts contributed equally to the item calibration.
Omitted and Not-Reached ResponsesThe matrix-sampling design meant that each student only got the opportunity to see the
items in the booklet which they were given. Items which were not included in the booklet
State Learning Achievement Survey,Class VIII 2014-15
Page107
taken were treated as ‘not presented’, i.e., they were ignored in the analysis of the data.
However, students could also fail to provide an answer to an item which was in their test
booklet and which, in principle, they could have seen. There are various possible reasons
for this: they could fail to make an attempt on an item by mistake because they didn’t feel it
was worth attempting or because they had given up or run out of time before reaching the
end of the test. An item was considered ‘not reached’ when the item itself, all subsequent
items and the item immediately preceding it were not answered.
Such ‘not reached’ items were treated differently in estimating item parameters and student
proficiency scores. In estimating the values of the item parameters, items in the
assessment booklets that were considered not to have been reached by students were
treated as if they had not been administered. Conversely, ‘not-reached’ items were
considered as incorrect responses when student achievement scores were generated.
Item FitThe fit of the 2-PL model to the items was examined graphically and using a chi-squared fit
index. Items identified as problematic were investigated to see if there were any obvious
faults and where possible, these were rectified. If it proved impossible to remedy the
problems of an item, then that item was dropped from the scoring.
ReliabilityReliability of the test score scales was estimated from the IRT scaling BILOG (Zimowski et
al., 1996) runs. For simplicity and familiarity, the marginal reliability coefficient is quoted
here, rather than showing test information graphs (Thissen and Wainer, 2001). This is given
by
= −Where is the variance of the test score scale in the sample and is the mean error
variance of scores, both available from BILOG output.


![Request for Proposal - SSA Punjabdownload.ssapunjab.org/sub/instructions/2018/February/... · 2018-02-26 · 49. [Annexure-4] Company Profile 44 50. [Annexure-5] Project Implementation](https://img.pdfslide.net/doc/110x75/5f7bea0fff0c246dee589aa0/request-for-proposal-ssa-2018-02-26-49-annexure-4-company-profile-44-50.jpg)