Embed Size (px)
Citation preview
7/23/2019 5 Estructura de Poros en Filtros Percoladores
http://slidepdf.com/reader/full/5-estructura-de-poros-en-filtros-percoladores 1/9
The influence of porous structure and biofilm on the hydrodynamicsof two types of trickle filters
Pang Haoran, Letisse Valérie, Paul Etienne, Hébrard Gilles ⇑
Université de Toulouse, INSA, UPS, INP, Laboratoire d’Ingénierie des Systèmes Biologiques et des Procédés (LISBP), 135 avenue de Rangueil, 31077 Toulouse, France
INRA, UMRA792, LISBP, 31400 Toulouse, France
CNRS, UMR5504, LISBP, 31400 Toulouse, France
h i g h l i g h t s
Concrete-Block media with/without biofilm in MSB.
Majority of liquid held by particles with biofilm.
Biofilm reduces dynamic fractions and delays liquid release.
Biofilm lengthens liquid residence time and increases active liquid volume in filter.
Biofilm improves liquid mixing in filter and reduces liquid film thickness.
a r t i c l e i n f o
Article history:
Received 10 March 2013
Received in revised form 25 June 2013
Accepted 28 June 2013
Available online 5 July 2013
Keywords:
Hydrodynamic
Liquid holdup
Porous structure
Liquid film, RTD
a b s t r a c t
The hydrodynamic behaviors of a Multi-Section Bioreactor (MSB) and a Trickle Fixed-bed Column (TFC)
packed with porous concrete block medium were investigated in terms of liquid holdup and RTD mod-
eling in regimes with and without biofilm. It was found liquid static holdup was always higher than
the dynamic holdup due to the porous structure of medium, rather than the configuration of bioreactor.
Dynamic holdup increased when the hydraulic load increased. The presence of biofilm retarded the liquid
release through the bioreactor; however, it enhanced the mass diffusion between static and dynamicfractions. The RTD measurements and modeling showed that the presence of biofilm lengthened the
liquid residence time, and it promoted the mass diffusion between the liquid and biofilm. Liquid film
thickness estimation implied that the biofilm reduced the liquid film thickness resulting both from the
increase of surface area and reduction of dynamic holdup volume.
2013 Elsevier B.V. All rights reserved.
1. Introduction
Trickle Filter (TF) technology is widely used in small wastewa-
ter treatment plants because it is robust and relatively uncompli-
cated with low specific energy consumption. In a TF, complex
mechanisms take place which are highly dependent on hydraulics.
To improve and operate such TF technology, it is indispensible to
understand the physical parameters which affect the hydraulics
in order to take accurately these effects into account through soft-
ware modeling such as Hydromantis GPS-X. It is important for
example, to assess the contact time between the polluted stream
and the biofilm responsible for pollutant biodegradation; this
contact time is directly dependent on liquid holdup and liquid film
thickness.
With conventional TF, the design and reliable scale-up are
highly dependent on hydrodynamic performance and on the trans-
port phenomena imposed by the type of internal packing and its
geometry [1]. The hydrodynamic behavior of certain types of med-
ium has been widely investigated by other researchers [2–7]. How-
ever, a number of natural and man-made non-spherical porous
medium with biofilm are too complicated to be well investigated
even appropriate boundary conditions were settled in some stud-
ies [8]. The effect of biofilm on hydrodynamics in a TF has seldom
been reported [5,9]; most reports have assumed the biofilm to be
homogeneous along the packing bed, but even so, they have not
quantified the biofilm.
Usually, total liquid holdup can be divided into two aspects:
static and dynamic [10,11]. Static holdup means the fraction of li-
quid that is retained within and around the particles by capillary
forces after complete draining. It depends on the flow rate and also
1385-8947/$ - see front matter 2013 Elsevier B.V. All rights reserved.http://dx.doi.org/10.1016/j.cej.2013.06.115
⇑ Corresponding author at: Université de Toulouse, INSA, UPS, INP, Laboratoire
d’Ingénierie des Systèmes Biologiques et des Procédés (LISBP), 135 avenue de
Rangueil, 31077 Toulouse, France. Tel: +33 (0)5 61 55 97 89; fax: +33 (0)5 61 55 97
60.
E-mail address: [email protected] (H. Gilles).
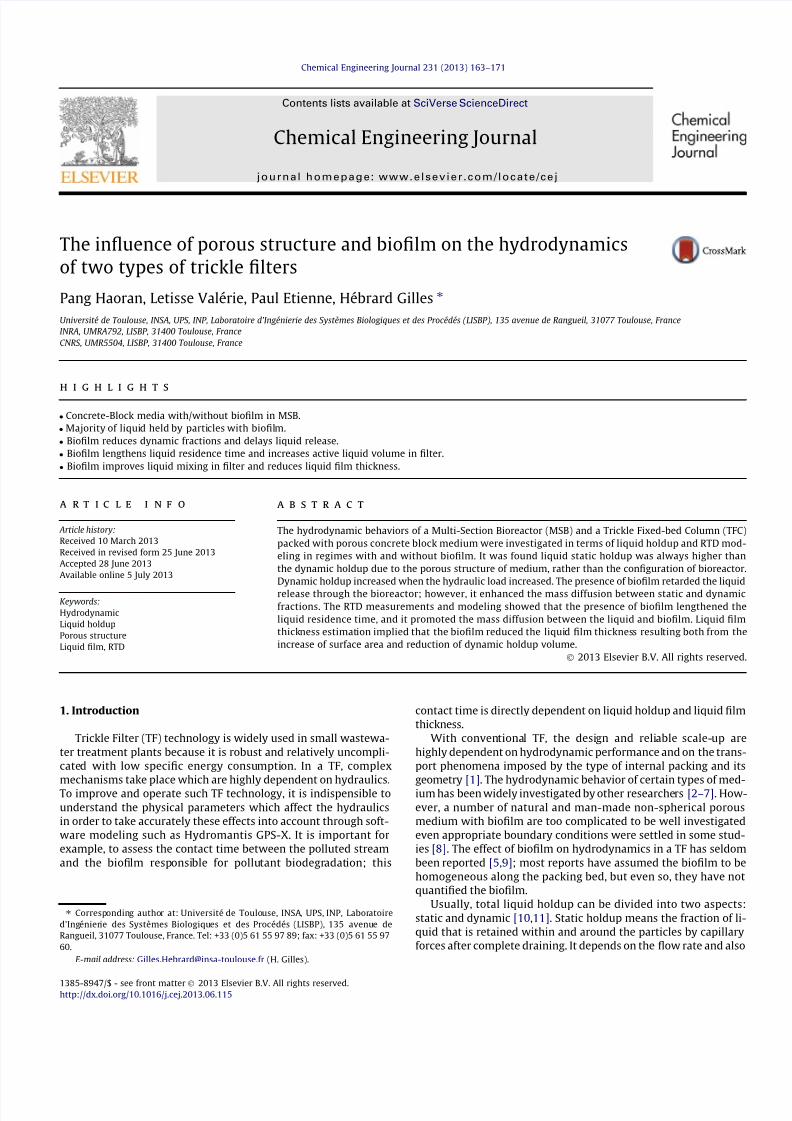
Chemical Engineering Journal 231 (2013) 163–171
Contents lists available at SciVerse ScienceDirect
Chemical Engineering Journal
j o u r n a l h o m e p a g e : w w w . e l s e v i e r . c o m / l o c a t e / c e j
7/23/2019 5 Estructura de Poros en Filtros Percoladores
http://slidepdf.com/reader/full/5-estructura-de-poros-en-filtros-percoladores 2/9
on the type of medium. Dynamic holdup is formed by the flowing
liquid and is highly dependent on the liquid load. For some types of
medium, e.g. structured and non-porous medium [1], dynamic
holdup can be considered as the predominant part of the total li-
quid holdup [2,12]. However, due to the physical characteristics
of the porous packing employed in our study, the static holdup
fraction may have contributed more to the total liquid holdup than
the dynamic.With the ultimate aim of optimizing TF design and operation,
the main objective of this study was to characterize the hydrody-
namic behavior of two types of TF filled with the same porous
medium in order to assess the impact of the properties of the med-
ium on the overall hydrodynamics. Such impact was measured in
term of liquid holdup fractions, liquid film thickness under the re-
gimes with and without biofilm all along the column after two or-
ganic loading rates cultivation. Further objective was using RTD
experiments and modeling to investigate the changes in liquid flow
pattern and residence time due to the presence of biofilm in the
MSB. Additionally, the study attempted to verify whether the con-
figuration of the bioreactor (TFC or MSB) would affect its hydrody-
namic characteristics.
2. Material and methods
2.1. Experimental system and medium
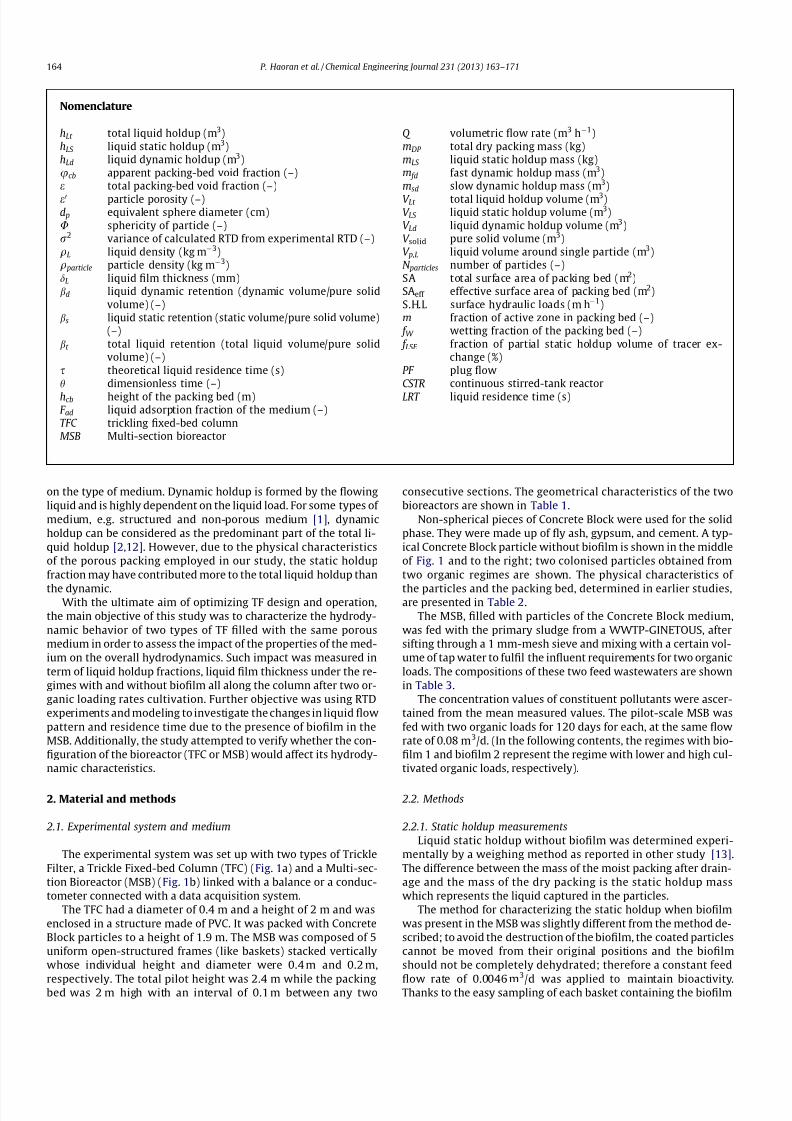
The experimental system was set up with two types of Trickle
Filter, a Trickle Fixed-bed Column (TFC) (Fig. 1a) and a Multi-sec-
tion Bioreactor (MSB) (Fig. 1b) linked with a balance or a conduc-
tometer connected with a data acquisition system.
The TFC had a diameter of 0.4 m and a height of 2 m and was
enclosed in a structure made of PVC. It was packed with Concrete
Block particles to a height of 1.9 m. The MSB was composed of 5
uniform open-structured frames (like baskets) stacked vertically
whose individual height and diameter were 0.4 m and 0.2 m,
respectively. The total pilot height was 2.4 m while the packingbed was 2 m high with an interval of 0.1 m between any two
consecutive sections. The geometrical characteristics of the two
bioreactors are shown in Table 1.
Non-spherical pieces of Concrete Block were used for the solid
phase. They were made up of fly ash, gypsum, and cement. A typ-
ical Concrete Block particle without biofilm is shown in the middle
of Fig. 1 and to the right; two colonised particles obtained from
two organic regimes are shown. The physical characteristics of
the particles and the packing bed, determined in earlier studies,are presented in Table 2.
The MSB, filled with particles of the Concrete Block medium,
was fed with the primary sludge from a WWTP-GINETOUS, after
sifting through a 1 mm-mesh sieve and mixing with a certain vol-
ume of tap water to fulfil the influent requirements for two organic
loads. The compositions of these two feed wastewaters are shown
in Table 3.
The concentration values of constituent pollutants were ascer-
tained from the mean measured values. The pilot-scale MSB was
fed with two organic loads for 120 days for each, at the same flow
rate of 0.08 m3/d. (In the following contents, the regimes with bio-
film 1 and biofilm 2 represent the regime with lower and high cul-
tivated organic loads, respectively).
2.2. Methods
2.2.1. Static holdup measurements
Liquid static holdup without biofilm was determined experi-
mentally by a weighing method as reported in other study [13].
The difference between the mass of the moist packing after drain-
age and the mass of the dry packing is the static holdup mass
which represents the liquid captured in the particles.
The method for characterizing the static holdup when biofilm
was present in the MSB was slightly different from the method de-
scribed; to avoid the destruction of the biofilm, the coated particles
cannot be moved from their original positions and the biofilm
should not be completely dehydrated; therefore a constant feed
flow rate of 0.0046 m3
/d was applied to maintain bioactivity.Thanks to the easy sampling of each basket containing the biofilm
Nomenclature
hLt total liquid holdup (m3)hLS liquid static holdup (m3)hLd liquid dynamic holdup (m3)ucb apparent packing-bed void fraction (–)e total packing-bed void fraction (–)
e0 particle porosity (–)d p equivalent sphere diameter (cm)U sphericity of particle (–)r2 variance of calculated RTD from experimental RTD (–)qL liquid density (kg m3)q particle particle density (kg m3)dL liquid film thickness (mm)bd liquid dynamic retention (dynamic volume/pure solid
volume) (–)bs liquid static retention (static volume/pure solid volume)
(–)bt total liquid retention (total liquid volume/pure solid
volume) (–)s theoretical liquid residence time (s)h dimensionless time (–)
hcb height of the packing bed (m)F ad liquid adsorption fraction of the medium (–)TFC trickling fixed-bed columnMSB Multi-section bioreactor
Q volumetric flow rate (m3 h1)mDP total dry packing mass (kg)mLS liquid static holdup mass (kg)m fd fast dynamic holdup mass (m3)msd slow dynamic holdup mass (m3)
V Lt total liquid holdup volume (m3)V LS liquid static holdup volume (m3)V Ld liquid dynamic holdup volume (m3)V solid pure solid volume (m3)V p,L liquid volume around single particle (m3)N particles number of particles (–)SA total surface area of packing bed (m2)SAeff effective surface area of packing bed (m2)S.H.L surface hydraulic loads (m h1)m fraction of active zone in packing bed (–) f W wetting fraction of the packing bed (–) f LSE fraction of partial static holdup volume of tracer ex-
change (%)PF plug flowCSTR continuous stirred-tank reactor
LRT liquid residence time (s)
164 P. Haoran et al. / Chemical Engineering Journal 231 (2013) 163–171
7/23/2019 5 Estructura de Poros en Filtros Percoladores
http://slidepdf.com/reader/full/5-estructura-de-poros-en-filtros-percoladores 3/9
support, the mass of each section packed with particles coated by
moist biofilm at steady-state (no free water draining out but still
moist) was measured. The pilot was then fed at a defined higher
flow rates (0.0091, 0.0182, 0.0137 or 0.0228 m3/h) for 1hr, and
then stopped; the mass of each section packed with moist particlesand biofilm was weighed again when no further draining water
was observed. The difference between the two masses obtained
gave the liquid static holdup mass captured in both the particles
and biofilm.
The liquid static holdup volume V LS , solid volume V solid, total
packing volume V packing , the porosity of particle e’ , the total void
fraction of packing bed e , and the volume of column V column were
then taken into account to calculate the liquid static retention bS ,
in accordance with [9]:
bS ¼ V LS V solid
¼ V LS
V packing ð1 e0Þ ¼
V LS V columnð1 eÞ
ð1Þ
The water adsorption fraction of the medium, F ad, can then be
calculated as the ratio of liquid static holdup mass mLS and drypacking mass mDP in the following equation:
Fad ¼ mLS
mDP
¼ qL
q particle V LS V packing
¼ qLð1 e0Þ
q particle bS ð2Þ
2.2.2. Dynamic holdup measurements
The drainage method reported by Brunazzi and Viva [13] wasadopted in our study for measuring the liquid dynamic holdup.
The procedure was as follows: the column was first stabilized by
feeding with a high hydraulic load for several minutes; after stabil-
ization at the required flow rate (constant flow measured at the
outlet), the inlet was shut and the liquid held by the packing began
to drain down into the collector placed on the scale. The real-time
drained mass of liquid collected was measured and recorded by the
acquisition system. When steady state drainage was reached (con-
stant outlet values observed), measurement was stopped.
The dynamic retention bd was calculated from the following
equation:
bd ¼ V Ld
V solid¼
V Ld
V columnð1 eÞ
ð3Þ
Fig. 1. Diagram of the TFC (a) and the MSB (b).
Table 2
Physical properties of Concrete Block medium and packing bed.
Particle porosity
(%)
Material density
(kg/m3)
Specific surface area
(m2/m3)
Particle density
(kg/m3)
Particle equivalent
diameter (cm)
Particle
sphericity
Total packing bed void
fraction
e0 q powder SSA q particle d p U e61 1337 350 ± 70 586.4 2.17 ± 0.4 0.74 ± 0.07 79.1/77.4a
a For the MSB packing bed void fraction calculation, the interval void spaces between two adjacent sections were included.
Table 1
Geometrical characteristics of the TFC and the MSB.
Bioreactor Column height (m) Diameter (m) Packing depth (m) Distributor height (m) Single section height (m) Injection spot height (m)
TFC 4 0.4 1.9 2 – 2.5
MSB 2.4 0.2 2 2.5 0.4 2.5
P. Haoran et al. / Chemical Engineering Journal 231 (2013) 163–171 165
7/23/2019 5 Estructura de Poros en Filtros Percoladores
http://slidepdf.com/reader/full/5-estructura-de-poros-en-filtros-percoladores 4/9
where V Ld represents the liquid dynamic holdup volume and V solid
the pure solid volume.
2.2.3. Residence time distribution (RTD)
Residence time distribution experiments were carried out by
the tracer method reported in [14]. After stabilization of the flow
in the column, a salt tracer (30 ml 300 g/L aqueous solution of
sodium chloride) was injected using a syringe from the injection
spot. The conductivity of the liquid with tracer leaving the column
was measured via a flow-through probe (XE100, RADIOMETER
ANALYTICAL S.A.) connected to a conductometer (CDM210 Con-
ductivity Meter, RADIOMETER ANALYTICAL) and the real-time con-
ductivity was monitored by the data acquisition system in the
computer. After each experiment, rinsing was done to remove
any residual salt absorbed of the particles.
The dimensionless E (h) as the function of the dimensionless
time h derives from Eq. (4) and the dimensionless time h in Eq.
(5). The mean liquid residence time l derives from the following
equation:
E ðhÞ ¼ C ðt Þ
C 0ð4Þ
h ¼ t
s ð5Þ
l ¼
PtC ðt ÞP
C ðt Þ ð6Þ
where C 0 = mtracer /V liquid gives the tracer concentration obtained if
all the injected mass was diluted into the liquid volume; C (t ) is
the tracer mass held by liquid at measuring time t ; l is the mean
Liquid Residence Time (LRT) and the theoretical liquid residence
time s = V liquid/Q ; Q is the flow rate of liquid;
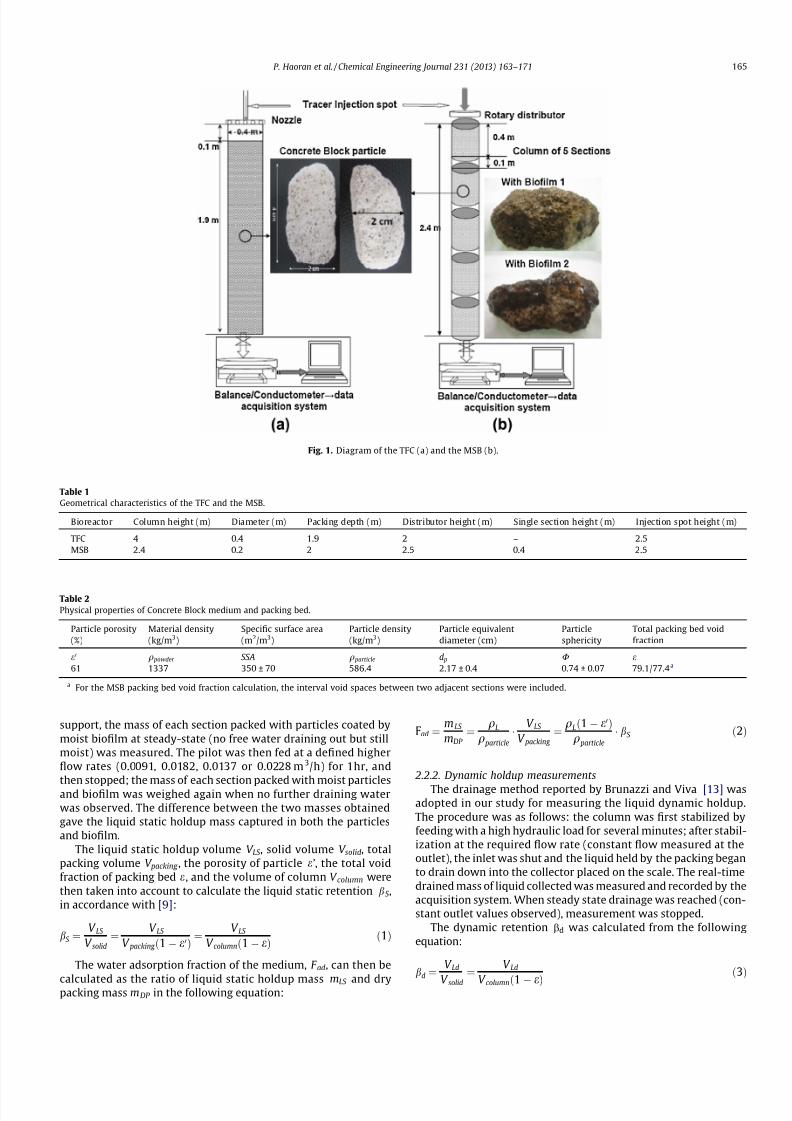
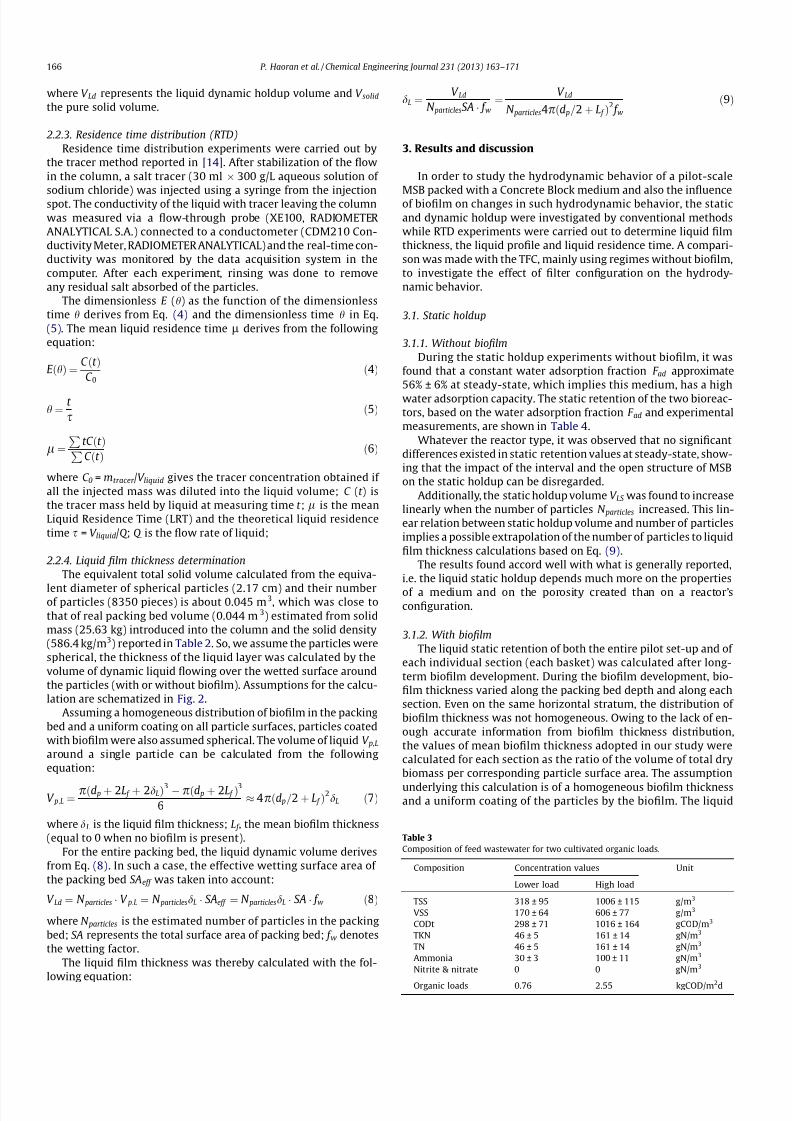
2.2.4. Liquid film thickness determination
The equivalent total solid volume calculated from the equiva-
lent diameter of spherical particles (2.17 cm) and their numberof particles (8350 pieces) is about 0.045 m3, which was close to
that of real packing bed volume (0.044 m 3) estimated from solid
mass (25.63 kg) introduced into the column and the solid density
(586.4 kg/m3) reported in Table 2. So, we assume the particles were
spherical, the thickness of the liquid layer was calculated by the
volume of dynamic liquid flowing over the wetted surface around
the particles (with or without biofilm). Assumptions for the calcu-
lation are schematized in Fig. 2.
Assuming a homogeneous distribution of biofilm in the packing
bed and a uniform coating on all particle surfaces, particles coated
with biofilm were also assumed spherical. The volume of liquid V p,L
around a single particle can be calculated from the following
equation:
V p;L ¼ pðd p þ 2L f þ 2dLÞ3 pðd p þ 2L f Þ3
6 4pðd p=2 þ L f Þ
2dL ð7Þ
where dL is the liquid film thickness; L f , the mean biofilm thickness
(equal to 0 when no biofilm is present).
For the entire packing bed, the liquid dynamic volume derives
from Eq. (8). In such a case, the effective wetting surface area of
the packing bed SAeff was taken into account:
V Ld ¼ N particles V p:L ¼ N particlesdL SAeff ¼ N particlesdL SA f w ð8Þ
where N particles is the estimated number of particles in the packing
bed; SA represents the total surface area of packing bed; f w denotes
the wetting factor.
The liquid film thickness was thereby calculated with the fol-
lowing equation:
dL ¼ V Ld
N particlesSA f w¼
V Ld
N particles4pðd p=2 þ L f Þ2 f w
ð9Þ
3. Results and discussion
In order to study the hydrodynamic behavior of a pilot-scale
MSB packed with a Concrete Block medium and also the influence
of biofilm on changes in such hydrodynamic behavior, the static
and dynamic holdup were investigated by conventional methods
while RTD experiments were carried out to determine liquid film
thickness, the liquid profile and liquid residence time. A compari-
son was made with the TFC, mainly using regimes without biofilm,
to investigate the effect of filter configuration on the hydrody-
namic behavior.
3.1. Static holdup
3.1.1. Without biofilm
During the static holdup experiments without biofilm, it was
found that a constant water adsorption fraction F ad approximate
56% ± 6% at steady-state, which implies this medium, has a high
water adsorption capacity. The static retention of the two bioreac-
tors, based on the water adsorption fraction F ad and experimental
measurements, are shown in Table 4.
Whatever the reactor type, it was observed that no significant
differences existed in static retention values at steady-state, show-
ing that the impact of the interval and the open structure of MSB
on the static holdup can be disregarded.
Additionally, the static holdup volume V LS was found to increase
linearly when the number of particles N particles increased. This lin-
ear relation between static holdup volume and number of particles
implies a possible extrapolation of the number of particles to liquid
film thickness calculations based on Eq. (9).
The results found accord well with what is generally reported,
i.e. the liquid static holdup depends much more on the properties
of a medium and on the porosity created than on a reactor’sconfiguration.
3.1.2. With biofilm
The liquid static retention of both the entire pilot set-up and of
each individual section (each basket) was calculated after long-
term biofilm development. During the biofilm development, bio-
film thickness varied along the packing bed depth and along each
section. Even on the same horizontal stratum, the distribution of
biofilm thickness was not homogeneous. Owing to the lack of en-
ough accurate information from biofilm thickness distribution,
the values of mean biofilm thickness adopted in our study were
calculated for each section as the ratio of the volume of total dry
biomass per corresponding particle surface area. The assumption
underlying this calculation is of a homogeneous biofilm thicknessand a uniform coating of the particles by the biofilm. The liquid
Table 3
Composition of feed wastewater for two cultivated organic loads.
Composition Concentration values Unit
Lower load High load
TSS 318 ± 95 1006 ± 115 g/m3
VSS 170 ± 64 606 ± 77 g/m3
CODt 298 ± 71 1016 ± 164 gCOD/m3
TKN 46 ± 5 161 ± 14 gN/m3
TN 46 ± 5 161 ± 14 gN/m3
Ammonia 30 ± 3 100 ± 11 gN/m3
Nitrite & nitrate 0 0 gN/m3
Organic loads 0.76 2.55 kgCOD/m2d
166 P. Haoran et al. / Chemical Engineering Journal 231 (2013) 163–171
7/23/2019 5 Estructura de Poros en Filtros Percoladores
http://slidepdf.com/reader/full/5-estructura-de-poros-en-filtros-percoladores 5/9
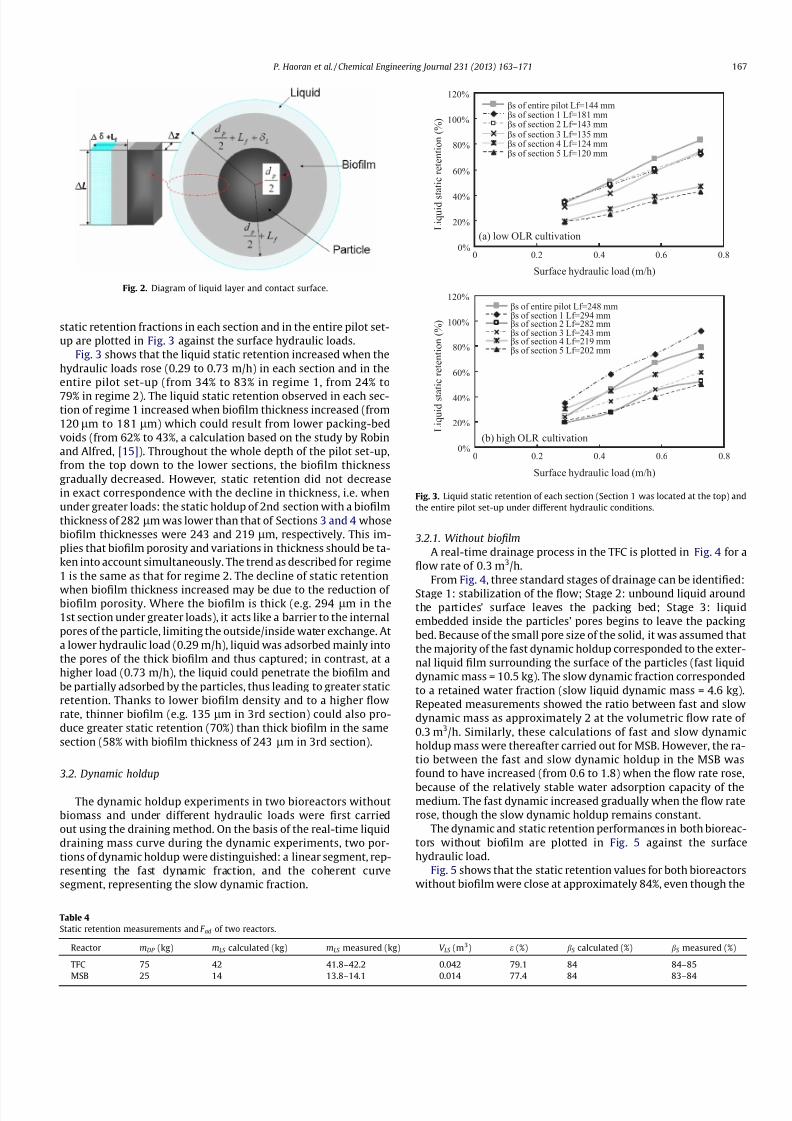
static retention fractions in each section and in the entire pilot set-
up are plotted in Fig. 3 against the surface hydraulic loads.
Fig. 3 shows that the liquid static retention increased when the
hydraulic loads rose (0.29 to 0.73 m/h) in each section and in the
entire pilot set-up (from 34% to 83% in regime 1, from 24% to
79% in regime 2). The liquid static retention observed in each sec-tion of regime 1 increased when biofilm thickness increased (from
120 lm to 181 lm) which could result from lower packing-bed
voids (from 62% to 43%, a calculation based on the study by Robin
and Alfred, [15]). Throughout the whole depth of the pilot set-up,
from the top down to the lower sections, the biofilm thickness
gradually decreased. However, static retention did not decrease
in exact correspondence with the decline in thickness, i.e. when
under greater loads: the static holdup of 2nd section with a biofilm
thickness of 282 lm was lower than that of Sections 3 and 4 whose
biofilm thicknesses were 243 and 219 lm, respectively. This im-
plies that biofilm porosity and variations in thickness should be ta-
ken into account simultaneously. The trend as described for regime
1 is the same as that for regime 2. The decline of static retention
when biofilm thickness increased may be due to the reduction of biofilm porosity. Where the biofilm is thick (e.g. 294 lm in the
1st section under greater loads), it acts like a barrier to the internal
pores of the particle, limiting the outside/inside water exchange. At
a lower hydraulic load (0.29 m/h), liquid was adsorbed mainly into
the pores of the thick biofilm and thus captured; in contrast, at a
higher load (0.73 m/h), the liquid could penetrate the biofilm and
be partially adsorbed by the particles, thus leading to greater static
retention. Thanks to lower biofilm density and to a higher flow
rate, thinner biofilm (e.g. 135 lm in 3rd section) could also pro-
duce greater static retention (70%) than thick biofilm in the same
section (58% with biofilm thickness of 243 lm in 3rd section).
3.2. Dynamic holdup
The dynamic holdup experiments in two bioreactors without
biomass and under different hydraulic loads were first carried
out using the draining method. On the basis of the real-time liquid
draining mass curve during the dynamic experiments, two por-
tions of dynamic holdup were distinguished: a linear segment, rep-
resenting the fast dynamic fraction, and the coherent curve
segment, representing the slow dynamic fraction.
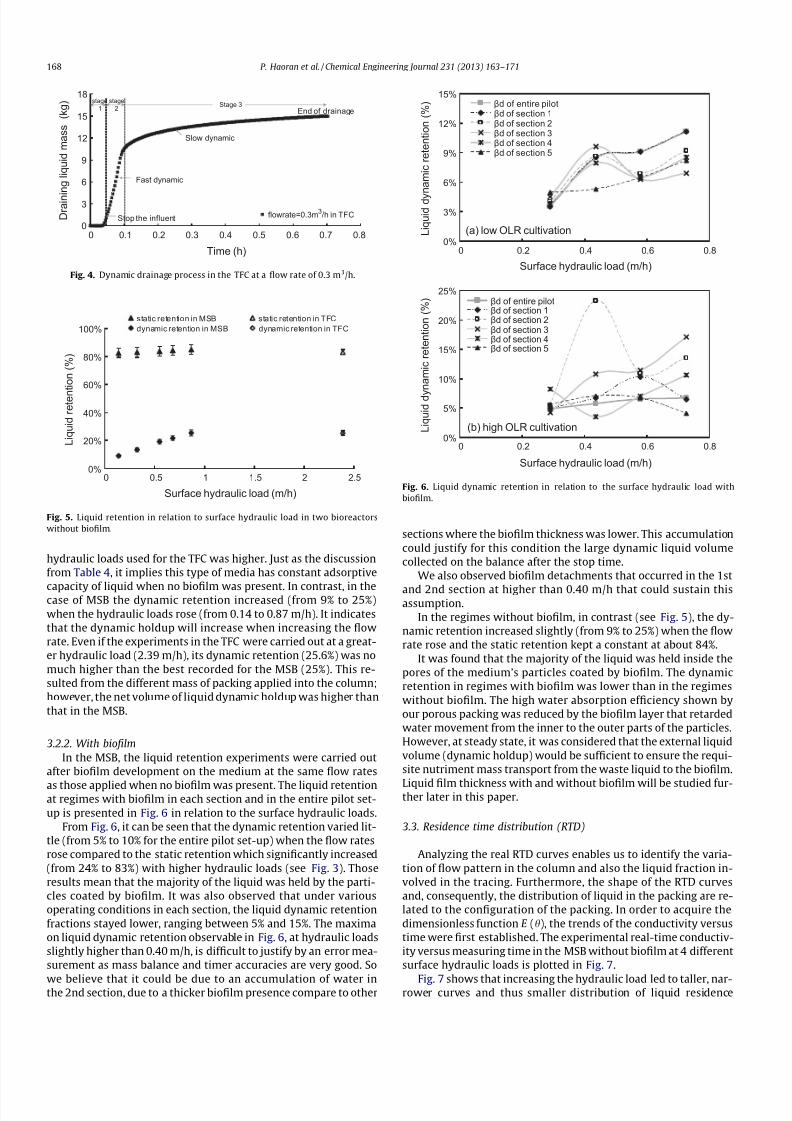
3.2.1. Without biofilm
A real-time drainage process in the TFC is plotted in Fig. 4 for a
flow rate of 0.3 m3/h.
From Fig. 4, three standard stages of drainage can be identified:
Stage 1: stabilization of the flow; Stage 2: unbound liquid aroundthe particles’ surface leaves the packing bed; Stage 3: liquid
embedded inside the particles’ pores begins to leave the packing
bed. Because of the small pore size of the solid, it was assumed that
the majority of the fast dynamic holdup corresponded to the exter-
nal liquid film surrounding the surface of the particles (fast liquid
dynamic mass = 10.5 kg). The slow dynamic fraction corresponded
to a retained water fraction (slow liquid dynamic mass = 4.6 kg).
Repeated measurements showed the ratio between fast and slow
dynamic mass as approximately 2 at the volumetric flow rate of
0.3 m3/h. Similarly, these calculations of fast and slow dynamic
holdup mass were thereafter carried out for MSB. However, the ra-
tio between the fast and slow dynamic holdup in the MSB was
found to have increased (from 0.6 to 1.8) when the flow rate rose,
because of the relatively stable water adsorption capacity of themedium. The fast dynamic increased gradually when the flow rate
rose, though the slow dynamic holdup remains constant.
The dynamic and static retention performances in both bioreac-
tors without biofilm are plotted in Fig. 5 against the surface
hydraulic load.
Fig. 5 shows that the static retention values for both bioreactors
without biofilm were close at approximately 84%, even though the
Fig. 2. Diagram of liquid layer and contact surface.
Table 4
Static retention measurements and F ad of two reactors.
Reactor mDP (kg) mLS calculated (kg) mLS measured (kg) V LS (m3) e (%) bS calculated (%) bS measured (%)
TFC 75 42 41.8–42.2 0.042 79.1 84 84–85
MSB 25 14 13.8–14.1 0.014 77.4 84 83–84
0%
20%
40%
60%
80%
100%
120%
0 0.2 0.4 0.6 0.8
Surface hydraulic load (m/h)
L i q u i d s t a t i c r e t e n t i o n ( % )
βs of entire pilot Lf=144 mmβs of section 1 Lf=181 mmβs of section 2 Lf=143 mmβs of section 3 Lf=135 mmβs of section 4 Lf=124 mmβs of section 5 Lf=120 mm
(a) low OLR cultivation
0%
20%
40%
60%
80%
100%
120%
0 0.2 0.4 0.6 0.8
Surface hydraulic load (m/h)
L i q u i d s t a
t i c r e t e n t i o n ( % )
βs of entire pilot Lf=248 mmβs of section 1 Lf=294 mmβs of section 2 Lf=282 mmβs of section 3 Lf=243 mmβs of section 4 Lf=219 mmβs of section 5 Lf=202 mm
(b) high OLR cultivation
Fig. 3. Liquid static retention of each section (Section 1 was located at the top) and
the entire pilot set-up under different hydraulic conditions.
P. Haoran et al. / Chemical Engineering Journal 231 (2013) 163–171 167
7/23/2019 5 Estructura de Poros en Filtros Percoladores
http://slidepdf.com/reader/full/5-estructura-de-poros-en-filtros-percoladores 6/9
hydraulic loads used for the TFC was higher. Just as the discussion
from Table 4, it implies this type of media has constant adsorptive
capacity of liquid when no biofilm was present. In contrast, in thecase of MSB the dynamic retention increased (from 9% to 25%)
when the hydraulic loads rose (from 0.14 to 0.87 m/h). It indicates
that the dynamic holdup will increase when increasing the flow
rate. Even if the experiments in the TFC were carried out at a great-
er hydraulic load (2.39 m/h), its dynamic retention (25.6%) was no
much higher than the best recorded for the MSB (25%). This re-
sulted from the different mass of packing applied into the column;
however, the net volume of liquid dynamic holdup was higher than
that in the MSB.
3.2.2. With biofilm
In the MSB, the liquid retention experiments were carried out
after biofilm development on the medium at the same flow rates
as those applied when no biofilm was present. The liquid retentionat regimes with biofilm in each section and in the entire pilot set-
up is presented in Fig. 6 in relation to the surface hydraulic loads.
From Fig. 6, it can be seen that the dynamic retention varied lit-
tle (from 5% to 10% for the entire pilot set-up) when the flow rates
rose compared to the static retention which significantly increased
(from 24% to 83%) with higher hydraulic loads (see Fig. 3). Those
results mean that the majority of the liquid was held by the parti-
cles coated by biofilm. It was also observed that under various
operating conditions in each section, the liquid dynamic retention
fractions stayed lower, ranging between 5% and 15%. The maxima
on liquid dynamic retention observable in Fig. 6, at hydraulic loads
slightly higher than 0.40 m/h, is difficult to justify by an error mea-
surement as mass balance and timer accuracies are very good. So
we believe that it could be due to an accumulation of water inthe 2nd section, due to a thicker biofilm presence compare to other
sections where the biofilm thickness was lower. This accumulation
could justify for this condition the large dynamic liquid volume
collected on the balance after the stop time.
We also observed biofilm detachments that occurred in the 1st
and 2nd section at higher than 0.40 m/h that could sustain thisassumption.
In the regimes without biofilm, in contrast (see Fig. 5), the dy-
namic retention increased slightly (from 9% to 25%) when the flow
rate rose and the static retention kept a constant at about 84%.
It was found that the majority of the liquid was held inside the
pores of the medium’s particles coated by biofilm. The dynamic
retention in regimes with biofilm was lower than in the regimes
without biofilm. The high water absorption efficiency shown by
our porous packing was reduced by the biofilm layer that retarded
water movement from the inner to the outer parts of the particles.
However, at steady state, it was considered that the external liquid
volume (dynamic holdup) would be sufficient to ensure the requi-
site nutriment mass transport from the waste liquid to the biofilm.
Liquid film thickness with and without biofilm will be studied fur-ther later in this paper.
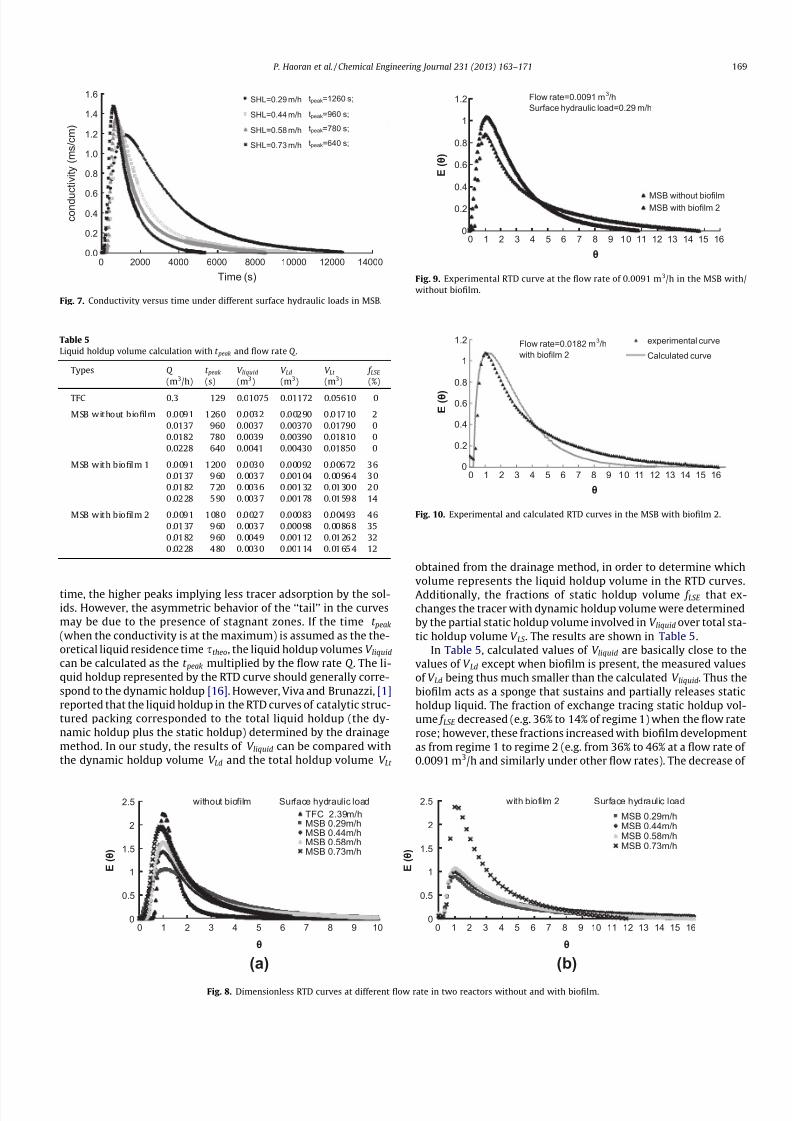
3.3. Residence time distribution (RTD)
Analyzing the real RTD curves enables us to identify the varia-
tion of flow pattern in the column and also the liquid fraction in-
volved in the tracing. Furthermore, the shape of the RTD curves
and, consequently, the distribution of liquid in the packing are re-
lated to the configuration of the packing. In order to acquire the
dimensionless function E (h), the trends of the conductivity versus
time were first established. The experimental real-time conductiv-
ity versus measuring time in the MSB without biofilm at 4 different
surface hydraulic loads is plotted in Fig. 7.
Fig. 7 shows that increasing the hydraulic load led to taller, nar-rower curves and thus smaller distribution of liquid residence
0
3
6
9
12
15
18
0 0.1 0.2 0.3 0.4 0.5 0.6 0.7 0.8
Time (h)
D r a i n i n g l i q u i d m a s s
( k g )
flowrate=0.3m3
/h in TFC
End of drainage
Slow dynamic
Fast dynamic
Stop the influent
Stage 32
stage stage
1
Fig. 4. Dynamic drainage process in the TFC at a flow rate of 0.3 m3/h.
0%
3%
6%
9%
12%
15%
0 0.2 0.4 0.6 0.8
Surface hydraulic load (m/h)
L i q u i d d y
n a m i c r e t e n t i o n ( % ) βd of entire pilot
βd of section 1βd of section 2βd of section 3βd of section 4βd of section 5
(a) low OLR cultivation
0%
5%
10%
15%
20%
25%
0 0.2 0.4 0.6 0.8
Surface hydraulic load (m/h)
L i q u i d d y
n a m i c r e t e n t i o n ( % ) βd of entire pilot
βd of section 1βd of section 2βd of section 3βd of section 4βd of section 5
(b) high OLR cultivation
Fig. 6. Liquid dynamic retention in relation to the surface hydraulic load with
biofilm.
0%
20%
40%
60%
80%
100%
0 0.5 1 1.5 2 2.5
Surface hydraulic load (m/h)
L i q u i d r e t e n
t i o n ( % )
static retention in MSB static retention in TFC
dynamic retention in MSB dynamic retention in TFC
Fig. 5. Liquid retention in relation to surface hydraulic load in two bioreactors
without biofilm.
168 P. Haoran et al. / Chemical Engineering Journal 231 (2013) 163–171
7/23/2019 5 Estructura de Poros en Filtros Percoladores
http://slidepdf.com/reader/full/5-estructura-de-poros-en-filtros-percoladores 7/9
time, the higher peaks implying less tracer adsorption by the sol-ids. However, the asymmetric behavior of the ‘‘tail’’ in the curves
may be due to the presence of stagnant zones. If the time t peak
(when the conductivity is at the maximum) is assumed as the the-
oretical liquid residence time stheo, the liquid holdup volumes V liquid
can be calculated as the t peak multiplied by the flow rate Q . The li-
quid holdup represented by the RTD curve should generally corre-
spond to the dynamic holdup [16]. However, Viva and Brunazzi, [1]
reported that the liquid holdup in the RTD curves of catalytic struc-
tured packing corresponded to the total liquid holdup (the dy-
namic holdup plus the static holdup) determined by the drainage
method. In our study, the results of V liquid can be compared with
the dynamic holdup volume V Ld and the total holdup volume V Lt
obtained from the drainage method, in order to determine which
volume represents the liquid holdup volume in the RTD curves.
Additionally, the fractions of static holdup volume f LSE that ex-
changes the tracer with dynamic holdup volume were determined
by the partial static holdup volume involved in V liquid over total sta-
tic holdup volume V LS . The results are shown in Table 5.
In Table 5, calculated values of V liquid are basically close to the
values of V Ld except when biofilm is present, the measured values
of V Ld being thus much smaller than the calculated V liquid. Thus the
biofilm acts as a sponge that sustains and partially releases static
holdup liquid. The fraction of exchange tracing static holdup vol-
ume f LSE decreased (e.g. 36% to 14% of regime 1) when the flow rate
rose; however, these fractions increased with biofilm development
as from regime 1 to regime 2 (e.g. from 36% to 46% at a flow rate of
0.0091 m3/h and similarly under other flow rates). The decrease of
0.0
0.2
0.4
0.6
0.8
1.0
1.2
1.4
1.6
0 2000 4000 6000 8000 10000 12000 14000
Time (s)
c o n d u
c t i v i t y ( m s / c m )
SHL=0.29 m/h
SHL=0.44 m/h
SHL=0.58 m/h
SHL=0.73 m/h tpeak=640 s;
tpeak=780 s;
tpeak=960 s;
tpeak=1260 s;
Fig. 7. Conductivity versus time under different surface hydraulic loads in MSB.
0
0.5
1
1.5
2
2.5
θ
E (
θ )
E (
θ )
TFC 2.39m/hMSB 0.29m/hMSB 0.44m/hMSB 0.58m/hMSB 0.73m/h
without biofilm Surface hydraulic load
0
0.5
1
1.5
2
2.5
0 1 2 3 4 5 6 7 8 9 10 0 1 2 3 4 5 6 7 8 9 10 11 12 13 14 15 16
θ
MSB 0.29m/hMSB 0.44m/hMSB 0.58m/hMSB 0.73m/h
with biofilm 2 Surface hydraulic load
(a) (b)
Fig. 8. Dimensionless RTD curves at different flow rate in two reactors without and with biofilm.
0
0.2
0.4
0.6
0.8
1
1.2
0 1 2 3 4 5 6 7 8 9 10 11 12 13 14 15 16
θ
E (
θ )
MSB without biofilmMSB with biofilm 2
Flow rate=0.0091 m3/h
Surface hydraulic load=0.29 m/h
Fig. 9. Experimental RTD curve at the flow rate of 0.0091 m3/h in the MSB with/
without biofilm.
Table 5
Liquid holdup volume calculation with t peak and flow rate Q .
Types Q
(m3/h)
t peak
(s)
V liquid
(m3)
V Ld
(m3)
V Lt
(m3)
f LSE
(%)
TFC 0.3 129 0.01075 0.01172 0.05610 0
MSB without biofilm 0.0091 1260 0.0032 0.00290 0.01710 2
0.0137 960 0.0037 0.00370 0.01790 0
0.0182 780 0.0039 0.00390 0.01810 0
0.0228 640 0.0041 0.00430 0.01850 0
MSB with biofilm 1 0.0091 1200 0.0030 0.00092 0.00672 36
0 .0137 960 0. 0037 0 .00104 0. 00 964 30
0 .0182 720 0. 0036 0 .00132 0. 0130 0 20
0 .0228 590 0. 0037 0 .00178 0. 01598 14
MSB with biofilm 2 0.0091 1080 0.0027 0.00083 0.00493 46
0 .0137 960 0. 0037 0 .000 98 0. 00 868 35
0 .0182 960 0. 0049 0 .00112 0. 01262 32
0 .0228 480 0. 0030 0 .00114 0. 01654 12
Flow rate=0.0182 m3/h
with biofilm 2
0
0.2
0.4
0.6
0.8
1
1.2
0 1 2 3 4 5 6 7 8 9 10 11 12 13 14 15 16
θ
E (
θ )
experimental curve
Calculated curve
Fig. 10. Experimental and calculated RTD curves in the MSB with biofilm 2.
P. Haoran et al. / Chemical Engineering Journal 231 (2013) 163–171 169
7/23/2019 5 Estructura de Poros en Filtros Percoladores
http://slidepdf.com/reader/full/5-estructura-de-poros-en-filtros-percoladores 8/9
these fractions implies that increasing the hydraulic loads will re-
duce the diffusion of tracer between the static liquid phase and the
dynamic liquid phase; whereas the diffusion will increase during
the biofilm development process under the same hydraulic condi-
tions. These changes may result from the reduction of contact time
between the liquid and solid phase when the flow rate rises.
The curves of dimensionless E (h) as a function of the dimen-
sionless time h at different hydraulic loads for the bioreactors both
without and with biofilm are plotted in Fig. 8a and b. The dimen-sionless time h was calculated as the ratio of the time t to t peak .
The liquid holdup volume V liquid taken from Table 5 was also used
for the C 0 calculation.
In Fig. 8, comparing the RTD curves acquired at a greater flow
rate in the TFC , such RTD curves at lower flow rates in the MSB dis-
play lower peaks but a greater distribution area (hP 12) which
was assumed to be due to the sustained release of liquid in the col-
umn. The tails of the curves in the MSB may be due to the presence
of stagnant zones in the column.
Furthermore, the regimes with and without biofilm were com-
pared at each volumetric flow rate (see Fig. 8). An example for a
flow rate of 0.0091 m3/h is shown in Fig. 9.
From Fig. 9, it is clear that the presence of biofilm lengthened
the liquid residence time in the filter (h? 15) compared to timeswithout biofilm (h? 11). This could imply two time scales phe-
nomena: one was related to the dynamic flow; the other was re-
lated to the diffusive process that was promoted by the presence
of biofilm which decreased the packing bed porosity and increased
the contact time between liquid and biofilm. A sustained-release
process is also signified by the longer tail in the RTD curve. In addi-
tion, lower peak when biofilm was present implies more tracer
adsorption in the biofilm compare to the higher peak when biofilm
was absent. Furthermore, the same behavior was also observed at
other flow rates. In a bioreactor with biomass, the tracer can be
transported within the biofilm by diffusion. The biofilm slowly ex-
changes the tracer with the flow-through zones; this can signifi-
cantly increase the tailing potential and lead to a sustained
release process which was also observed and investigated by Rie-
mer et al. [17] who proposed a ‘‘biodiffusion model’’ to fit the li-
quid residence time distribution in their study.
For the liquid distribution in a trickle bed, it is widely accepted
in many studies that a Gaussian Plug Flow (PF) model with axial
dispersion may fit the liquid profile when longer tails are present;
on the other hand, the model of n Continuous Stirred Tank Reactor(CSTR) with stagnant/dead zone reported by Levich et al.; Sant’An-
na et al. [18,19] has also been widely employed for investigating
the liquid profile in a Trickle Filter. Moreover, a Plug Flow reactor
can be approximated by a large number of CSTR in series. Hence
the model of n CSTR with stagnant/dead zones in series in the form
of Eq. (10) was applied to investigate the RTD in both bioreactors
with the variance derived in the following equation:
E ðhÞ ¼ 1
mn
nn
ðn 1Þ!hn1e
nhm ð10Þ
r2 ¼
Pt 2C ðt Þ
l2P
C ðt Þ 1 ð11Þ
where m is the fraction of active zone, n is the number of CSTR.
When m equals 1, it means no stagnant/dead zone is present in
the packing bed.
With a variance r2 0, the liquid distribution in the column is
close to plug flow pattern, whereas when r2 1, the liquid distri-
bution is close to ‘‘completely stirred’’ pattern.
RTD curves were calculated on the basis of Eq. (10) and com-
pared with the experimental curves of all regimes. Fig. 10 presents
an example of the calculated RTD curve and the experimental RTD
curve in the MSB with biofilm.
In Fig. 10, theRTDcurve calculatedon the basisof Eq.(10) fitswell
with the experimental RTD curve expect for the tail segment which
is more gradual than themodel. General results from themodels for
both bioreactors are shown in Table 6. A certain discrepancy existsbetween our experimental and modeling curves (about 10%); these
errors have no consequences on the followingdiscussion, where the
flow pattern was discussed in relation to operating conditions.
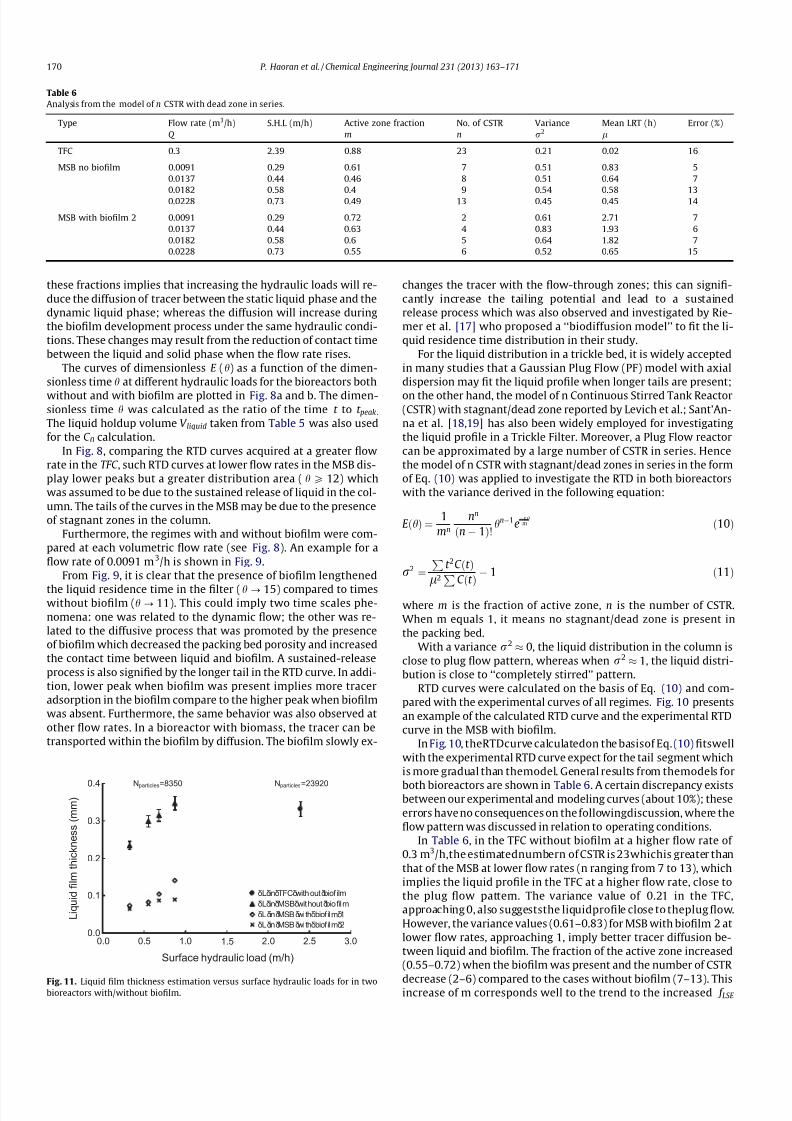
In Table 6, in the TFC without biofilm at a higher flow rate of
0.3 m3/h,the estimatednumbern of CSTR is 23whichis greater than
that of the MSB at lower flow rates (n ranging from 7 to 13), which
implies the liquid profile in the TFC at a higher flow rate, close to
the plug flow pattern. The variance value of 0.21 in the TFC,
approaching 0, also suggeststhe liquidprofile close to theplug flow.
However, the variance values (0.61–0.83) for MSB with biofilm 2 at
lower flow rates, approaching 1, imply better tracer diffusion be-
tween liquid and biofilm. The fraction of the active zone increased
(0.55–0.72) when the biofilm was present and the number of CSTR
decrease (2–6) compared to the cases without biofilm (7–13). Thisincrease of m corresponds well to the trend to the increased f LSE
Table 6
Analysis from the model of n CSTR with dead zone in series.
Type Flow rate (m3/h) S.H.L (m/h) Active zone fraction No. of CSTR Variance Mean LRT (h) Error (%)
Q m n r2 l
TFC 0.3 2.39 0.88 23 0.21 0.02 16
MSB no biofilm 0.0091 0.29 0.61 7 0.51 0.83 5
0.0137 0.44 0.46 8 0.51 0.64 7
0.0182 0.58 0.4 9 0.54 0.58 13
0.0228 0.73 0.49 13 0.45 0.45 14
MSB with biofilm 2 0.0091 0.29 0.72 2 0.61 2.71 7
0.0137 0.44 0.63 4 0.83 1.93 6
0.0182 0.58 0.6 5 0.64 1.82 7
0.0228 0.73 0.55 6 0.52 0.65 15
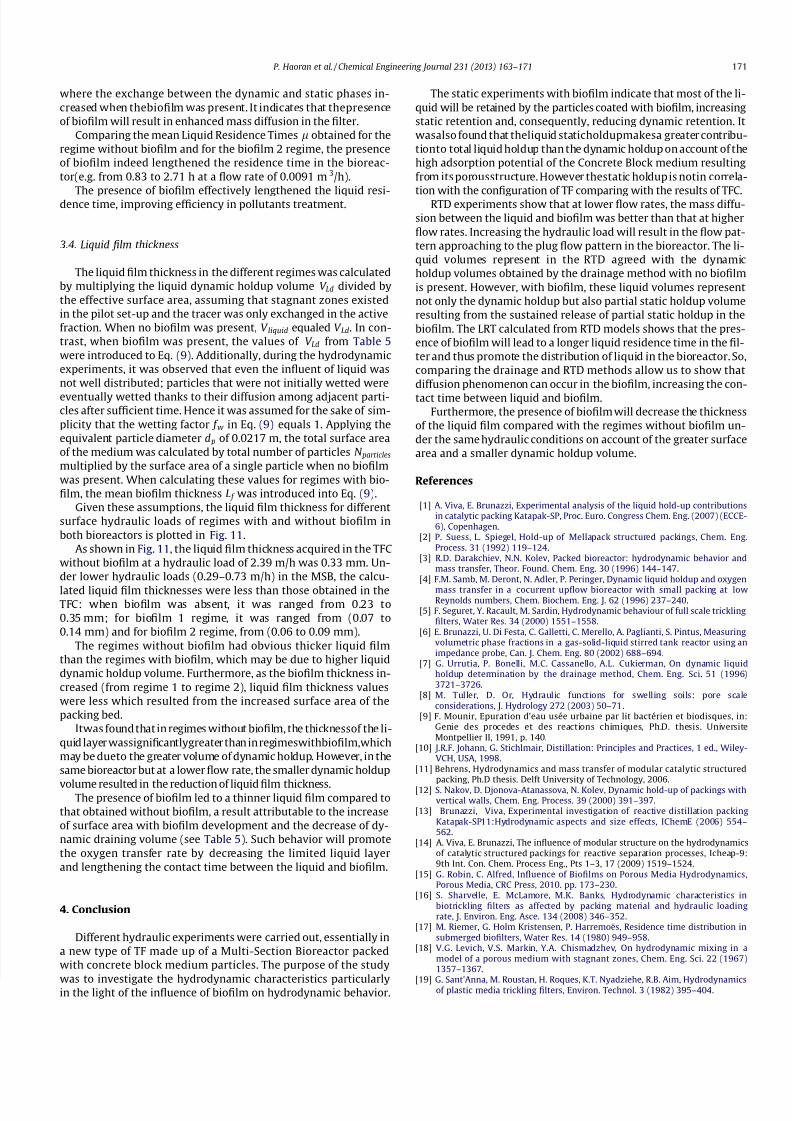
0.0
0.1
0.2
0.3
0.4
0.0 0.5 1.0 1.5 2.0 2.5 3.0
Surface hydraulic load (m/h)
L i q u i d f i l m
t h i c k n e s s ( m m )
δLδinδTFCδwith outδbiof ilm
δLδinδMSBδwithout δbiofilm
δLδinδMSB δwithδbiofilmδ1
δLδinδMSB δwithδbiofilmδ2
Nparticles=23920Nparticles=8350
Fig. 11. Liquid film thickness estimation versus surface hydraulic loads for in twobioreactors with/without biofilm.
170 P. Haoran et al. / Chemical Engineering Journal 231 (2013) 163–171
7/23/2019 5 Estructura de Poros en Filtros Percoladores
http://slidepdf.com/reader/full/5-estructura-de-poros-en-filtros-percoladores 9/9
where the exchange between the dynamic and static phases in-
creased when thebiofilm was present. It indicates that thepresence
of biofilm will result in enhanced mass diffusion in the filter.
Comparing the mean Liquid Residence Times l obtained for the
regime without biofilm and for the biofilm 2 regime, the presence
of biofilm indeed lengthened the residence time in the bioreac-
tor(e.g. from 0.83 to 2.71 h at a flow rate of 0.0091 m3/h).
The presence of biofilm effectively lengthened the liquid resi-dence time, improving efficiency in pollutants treatment.
3.4. Liquid film thickness
The liquid film thickness in the different regimes was calculated
by multiplying the liquid dynamic holdup volume V Ld divided by
the effective surface area, assuming that stagnant zones existed
in the pilot set-up and the tracer was only exchanged in the active
fraction. When no biofilm was present, V liquid equaled V Ld. In con-
trast, when biofilm was present, the values of V Ld from Table 5
were introduced to Eq. (9). Additionally, during the hydrodynamic
experiments, it was observed that even the influent of liquid was
not well distributed; particles that were not initially wetted were
eventually wetted thanks to their diffusion among adjacent parti-cles after sufficient time. Hence it was assumed for the sake of sim-
plicity that the wetting factor f w in Eq. (9) equals 1. Applying the
equivalent particle diameter d p of 0.0217 m, the total surface area
of the medium was calculated by total number of particles N particles
multiplied by the surface area of a single particle when no biofilm
was present. When calculating these values for regimes with bio-
film, the mean biofilm thickness L f was introduced into Eq. (9).
Given these assumptions, the liquid film thickness for different
surface hydraulic loads of regimes with and without biofilm in
both bioreactors is plotted in Fig. 11.
As shown in Fig. 11, the liquid film thickness acquired in the TFC
without biofilm at a hydraulic load of 2.39 m/h was 0.33 mm. Un-
der lower hydraulic loads (0.29–0.73 m/h) in the MSB, the calcu-
lated liquid film thicknesses were less than those obtained in theTFC: when biofilm was absent, it was ranged from 0.23 to
0.35 mm; for biofilm 1 regime, it was ranged from (0.07 to
0.14 mm) and for biofilm 2 regime, from (0.06 to 0.09 mm).
The regimes without biofilm had obvious thicker liquid film
than the regimes with biofilm, which may be due to higher liquid
dynamic holdup volume. Furthermore, as the biofilm thickness in-
creased (from regime 1 to regime 2), liquid film thickness values
were less which resulted from the increased surface area of the
packing bed.
Itwas found that in regimes without biofilm, the thicknessof the li-
quid layer wassignificantlygreater than inregimeswithbiofilm,which
may be dueto the greater volume of dynamic holdup. However, in the
same bioreactor but at a lower flow rate, the smaller dynamic holdup
volume resulted in the reduction of liquid film thickness.The presence of biofilm led to a thinner liquid film compared to
that obtained without biofilm, a result attributable to the increase
of surface area with biofilm development and the decrease of dy-
namic draining volume (see Table 5). Such behavior will promote
the oxygen transfer rate by decreasing the limited liquid layer
and lengthening the contact time between the liquid and biofilm.
4. Conclusion
Different hydraulic experiments were carried out, essentially in
a new type of TF made up of a Multi-Section Bioreactor packed
with concrete block medium particles. The purpose of the study
was to investigate the hydrodynamic characteristics particularlyin the light of the influence of biofilm on hydrodynamic behavior.
The static experiments with biofilm indicate that most of the li-
quid will be retained by the particles coated with biofilm, increasing
static retention and, consequently, reducing dynamic retention. It
wasalso found that theliquid staticholdupmakesa greater contribu-
tionto total liquid holdup than the dynamic holdup on account of the
high adsorption potential of the Concrete Block medium resulting
from its porousstructure. However thestatic holdup is notin correla-
tion with the configuration of TF comparing with the results of TFC.RTD experiments show that at lower flow rates, the mass diffu-
sion between the liquid and biofilm was better than that at higher
flow rates. Increasing the hydraulic load will result in the flow pat-
tern approaching to the plug flow pattern in the bioreactor. The li-
quid volumes represent in the RTD agreed with the dynamic
holdup volumes obtained by the drainage method with no biofilm
is present. However, with biofilm, these liquid volumes represent
not only the dynamic holdup but also partial static holdup volume
resulting from the sustained release of partial static holdup in the
biofilm. The LRT calculated from RTD models shows that the pres-
ence of biofilm will lead to a longer liquid residence time in the fil-
ter and thus promote the distribution of liquid in the bioreactor. So,
comparing the drainage and RTD methods allow us to show that
diffusion phenomenon can occur in the biofilm, increasing the con-
tact time between liquid and biofilm.
Furthermore, the presence of biofilm will decrease the thickness
of the liquid film compared with the regimes without biofilm un-
der the same hydraulic conditions on account of the greater surface
area and a smaller dynamic holdup volume.
References
[1] A. Viva, E. Brunazzi, Experimental analysis of the liquid hold-up contributionsin catalytic packing Katapak-SP, Proc. Euro. Congress Chem. Eng. (2007) (ECCE-6), Copenhagen.
[2] P. Suess, L. Spiegel, Hold-up of Mellapack structured packings, Chem. Eng.Process. 31 (1992) 119–124.
[3] R.D. Darakchiev, N.N. Kolev, Packed bioreactor: hydrodynamic behavior andmass transfer, Theor. Found. Chem. Eng. 30 (1996) 144–147.
[4] F.M. Samb, M. Deront, N. Adler, P. Peringer, Dynamic liquid holdup and oxygen
mass transfer in a cocurrent upflow bioreactor with small packing at lowReynolds numbers, Chem. Biochem. Eng. J. 62 (1996) 237–240.
[5] F. Seguret, Y. Racault, M. Sardin, Hydrodynamic behaviour of full scale tricklingfilters, Water Res. 34 (2000) 1551–1558.
[6] E. Brunazzi, U. Di Festa, C. Galletti, C. Merello, A. Paglianti, S. Pintus, Measuringvolumetric phase fractions in a gas-solid-liquid stirred tank reactor using animpedance probe, Can. J. Chem. Eng. 80 (2002) 688–694.
[7] G. Urrutia, P. Bonelli, M.C. Cassanello, A.L. Cukierman, On dynamic liquidholdup determination by the drainage method, Chem. Eng. Sci. 51 (1996)3721–3726.
[8] M. Tuller, D. Or, Hydraulic functions for swelling soils: pore scaleconsiderations, J. Hydrology 272 (2003) 50–71.
[9] F. Mounir, Epuration d’eau usée urbaine par lit bactérien et biodisques, in:Genie des procedes et des reactions chimiques, Ph.D. thesis. UniversiteMontpellier II, 1991, p. 140.
[10] J.R.F. Johann, G. Stichlmair, Distillation: Principles and Practices, 1 ed., Wiley-VCH, USA, 1998.
[11] Behrens, Hydrodynamics and mass transfer of modular catalytic structuredpacking, Ph.D thesis. Delft University of Technology, 2006.
[12] S. Nakov, D. Djonova-Atanassova, N. Kolev, Dynamic hold-up of packings withvertical walls, Chem. Eng. Process. 39 (2000) 391–397.
[13] Brunazzi, Viva, Experimental investigation of reactive distillation packingKatapak-SP11:Hydrodynamic aspects and size effects, IChemE (2006) 554–562.
[14] A. Viva, E. Brunazzi, The influence of modular structure on the hydrodynamicsof catalytic structured packings for reactive separation processes, Icheap-9:9th Int. Con. Chem. Process Eng., Pts 1–3, 17 (2009) 1519–1524.
[15] G. Robin, C. Alfred, Influence of Biofilms on Porous Media Hydrodynamics,Porous Media, CRC Press, 2010. pp. 173–230.
[16] S. Sharvelle, E. McLamore, M.K. Banks, Hydrodynamic characteristics inbiotrickling filters as affected by packing material and hydraulic loadingrate, J. Environ. Eng. Asce. 134 (2008) 346–352.
[17] M. Riemer, G. Holm Kristensen, P. Harremoës, Residence time distribution insubmerged biofilters, Water Res. 14 (1980) 949–958.
[18] V.G. Levich, V.S. Markin, Y.A. Chismadzhev, On hydrodynamic mixing in amodel of a porous medium with stagnant zones, Chem. Eng. Sci. 22 (1967)1357–1367.
[19] G. Sant’Anna, M. Roustan, H. Roques, K.T. Nyadziehe, R.B. Aim, Hydrodynamicsof plastic media trickling filters, Environ. Technol. 3 (1982) 395–404.
P. Haoran et al. / Chemical Engineering Journal 231 (2013) 163–171 171