Embed Size (px)
Citation preview
1
HEMOGLOBIN DISORDERS
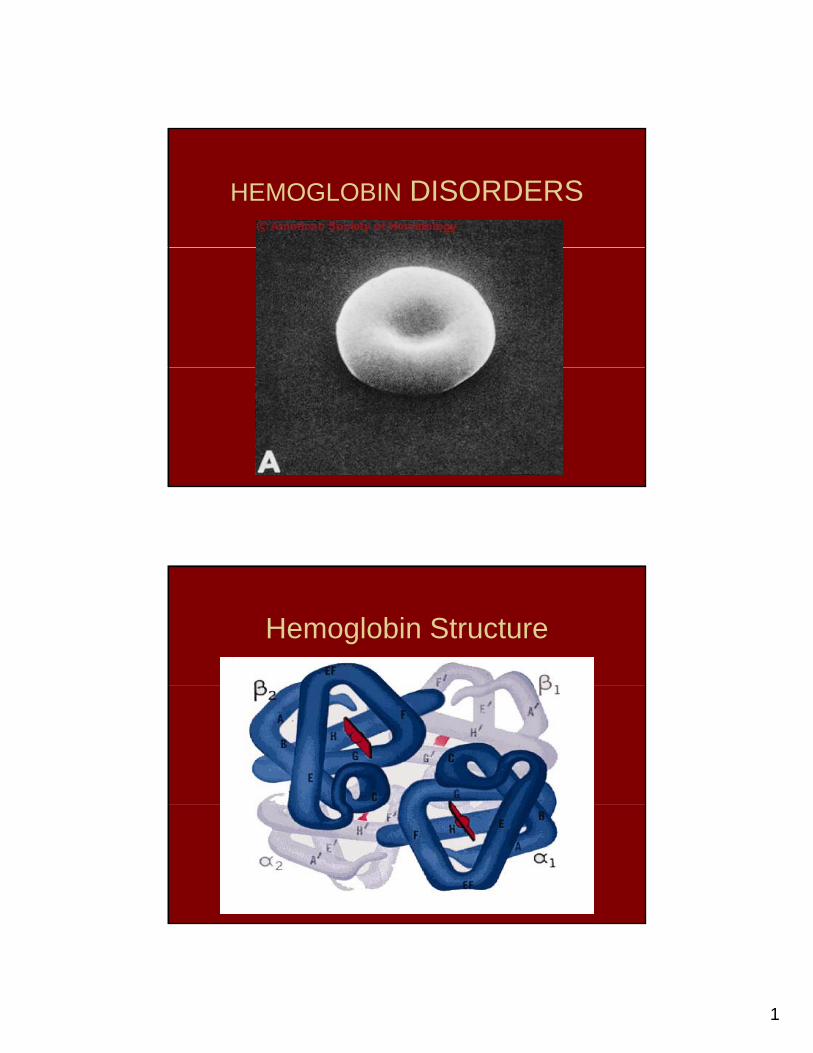
Hemoglobin Structure
2
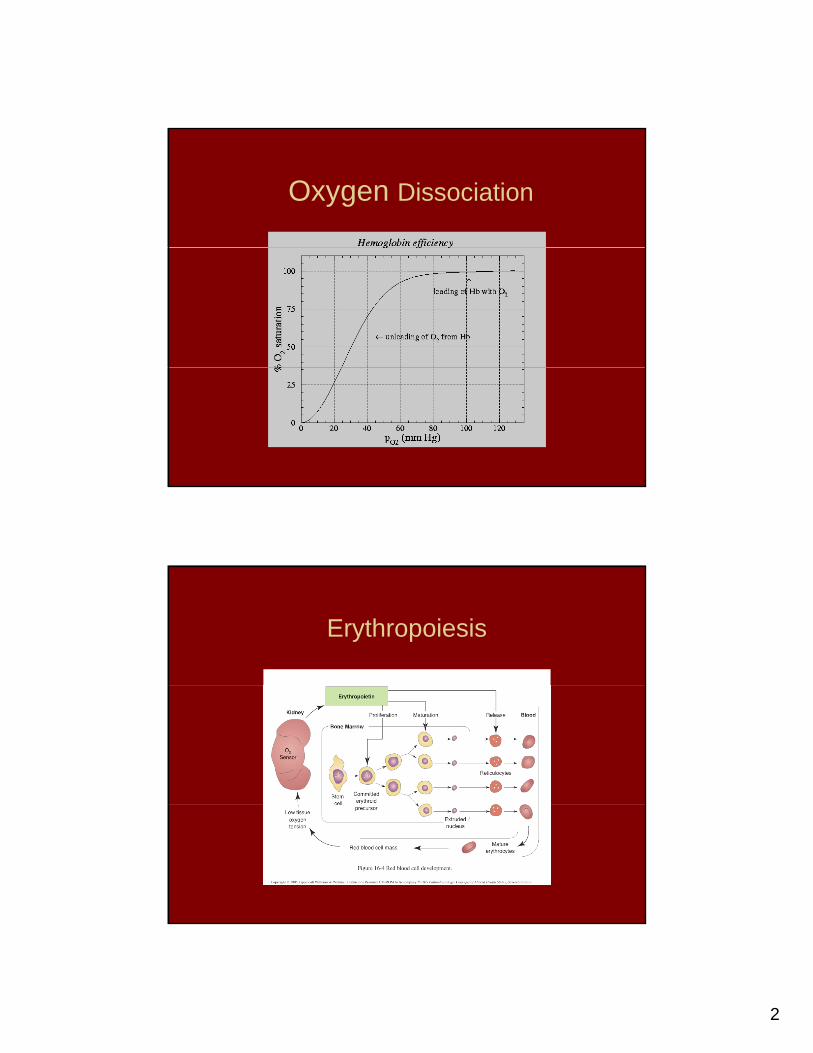
Oxygen Dissociation
Erythropoiesis
3
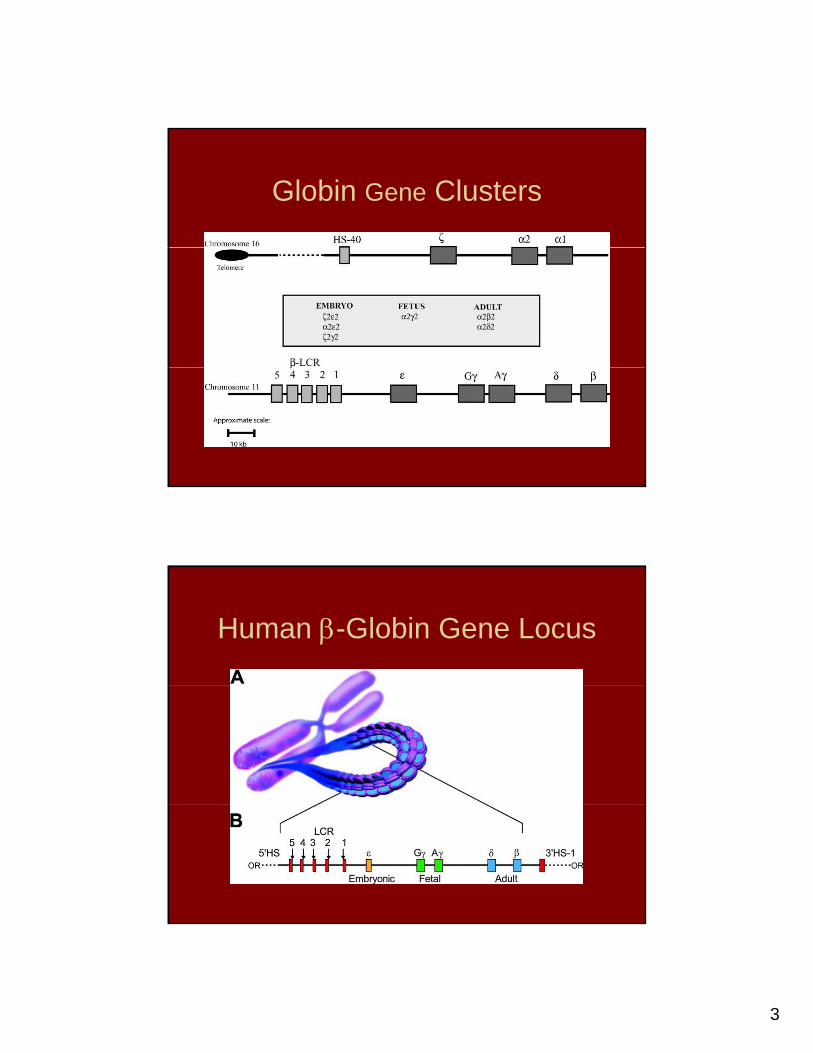
Globin Gene Clusters
Human β-Globin Gene Locus
4
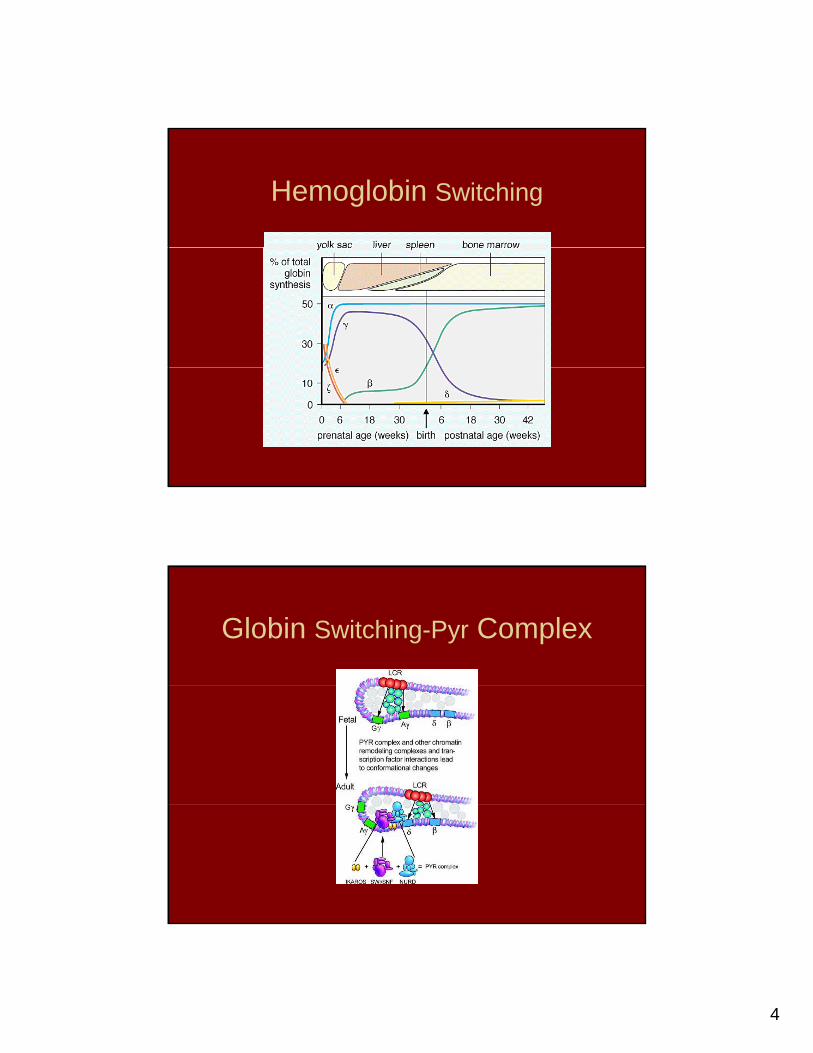
Hemoglobin Switching
Globin Switching-Pyr Complex
5
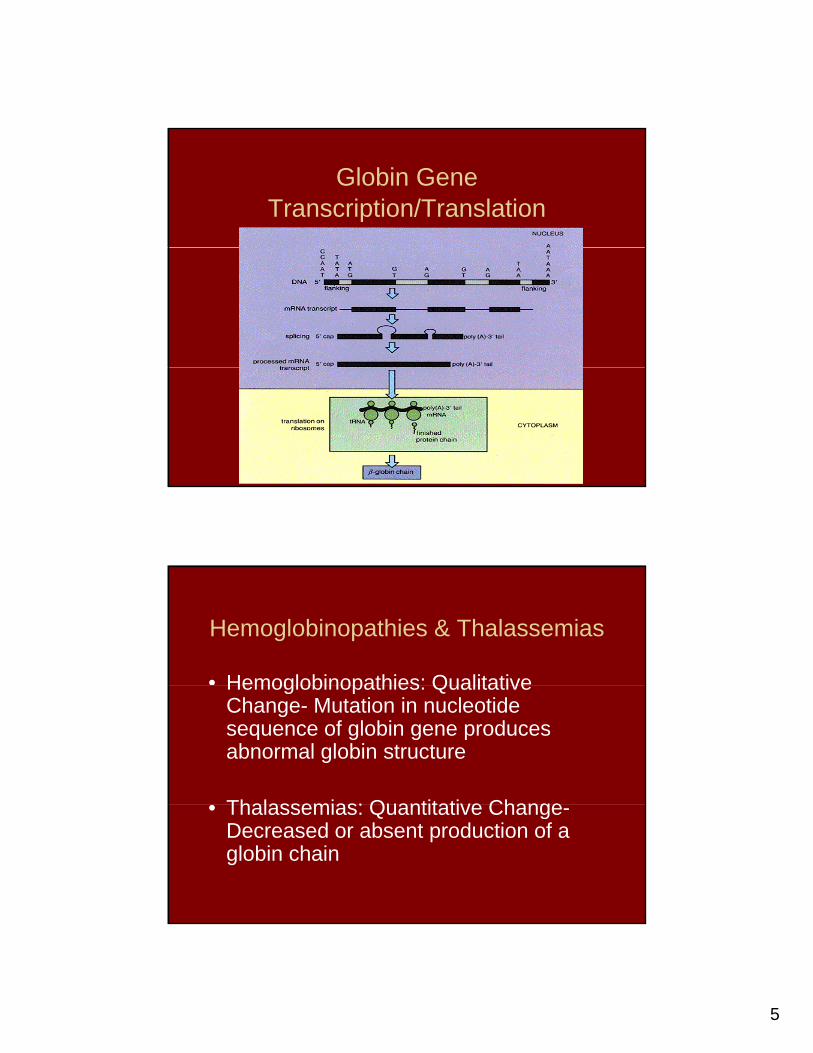
Globin GeneTranscription/Translation
Hemoglobinopathies & Thalassemias
• Hemoglobinopathies: QualitativeHemoglobinopathies: Qualitative Change- Mutation in nucleotide sequence of globin gene produces abnormal globin structure
• Thalassemias: Quantitative Change• Thalassemias: Quantitative Change-Decreased or absent production of a globin chain
6
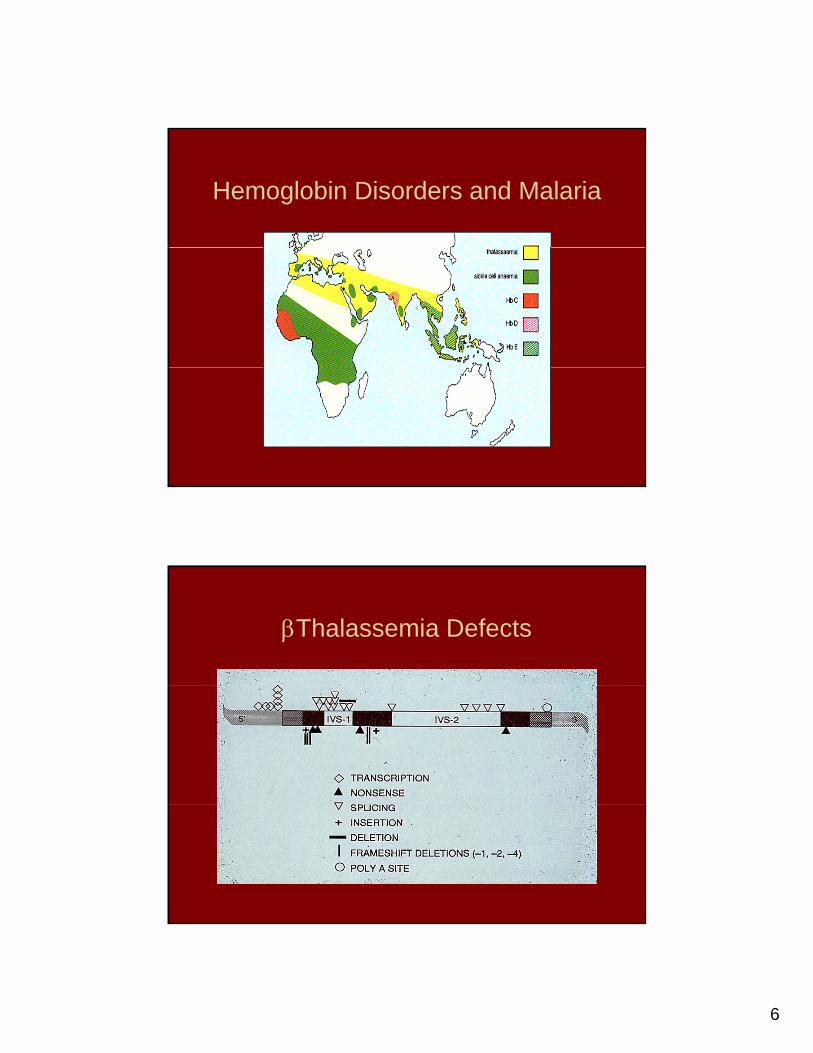
Hemoglobin Disorders and Malaria
βThalassemia Defects
7
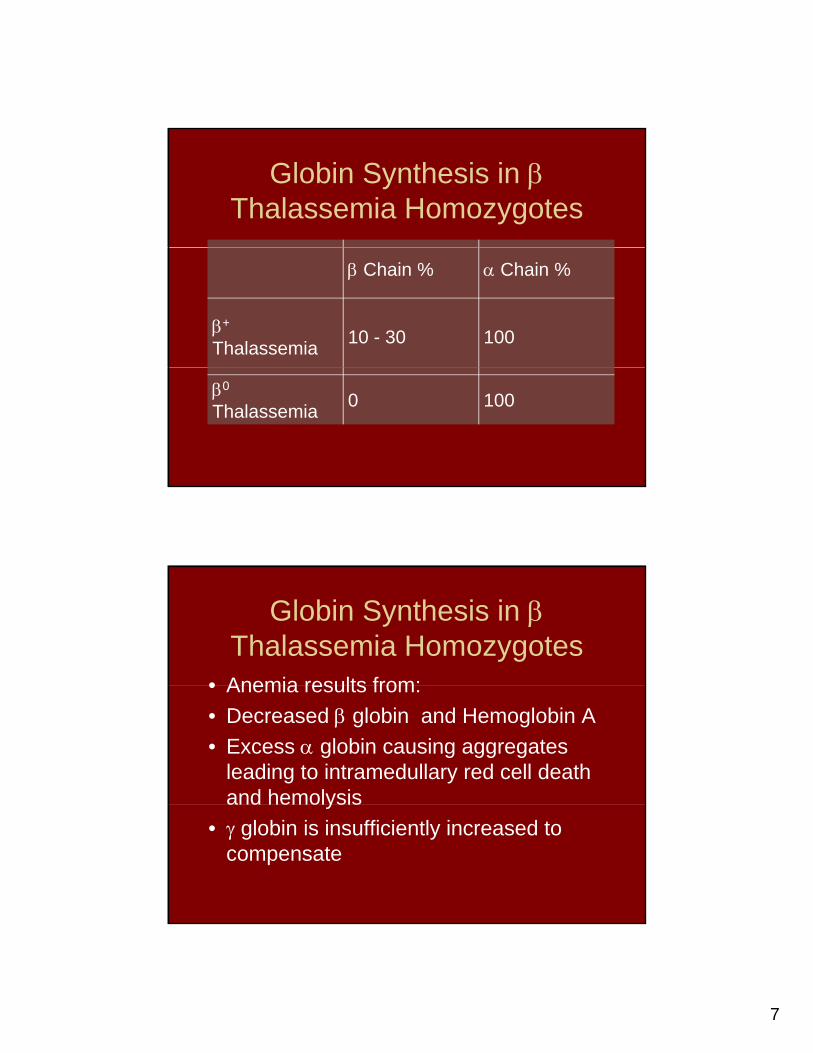
Globin Synthesis in βThalassemia Homozygotes
β Chain % α Chain %
β+
Thalassemia 10 - 30 100
β0
Thalassemia 0 100
Globin Synthesis in βThalassemia Homozygotes
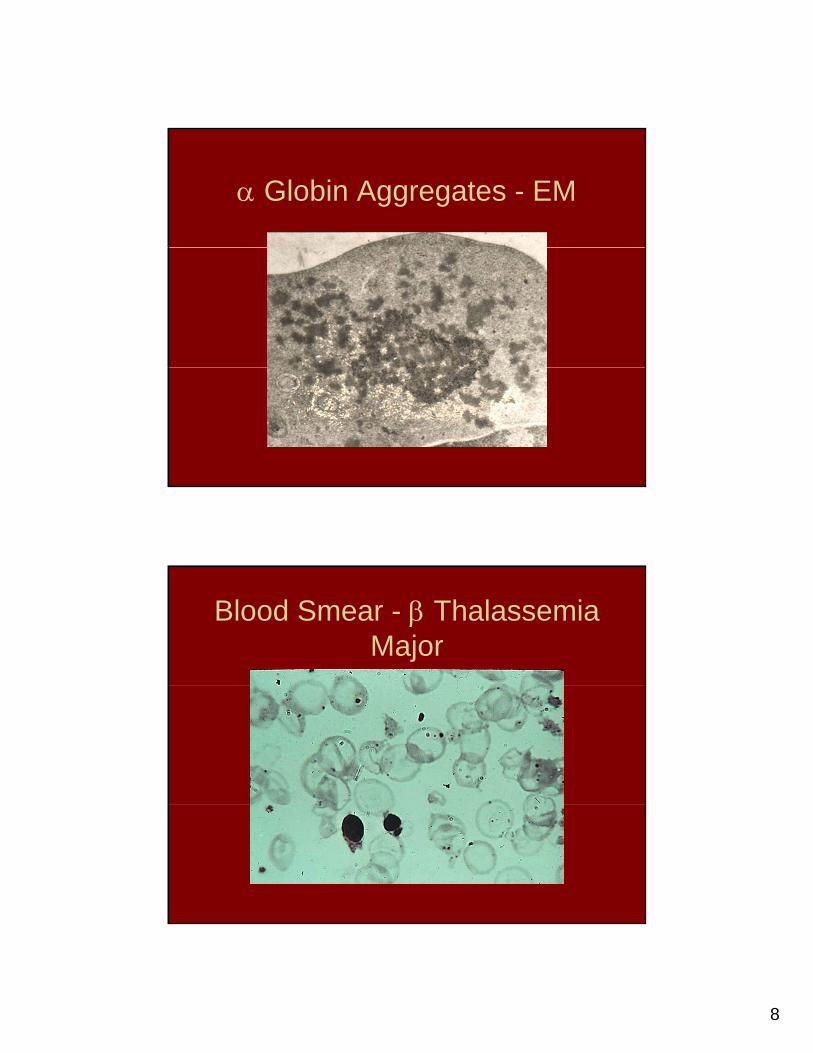
• Anemia results from:• Anemia results from:• Decreased β globin and Hemoglobin A• Excess α globin causing aggregates
leading to intramedullary red cell death and hemolysisa d e o ys s
• γ globin is insufficiently increased to compensate
8
α Globin Aggregates - EM
Blood Smear - β Thalassemia Major
9
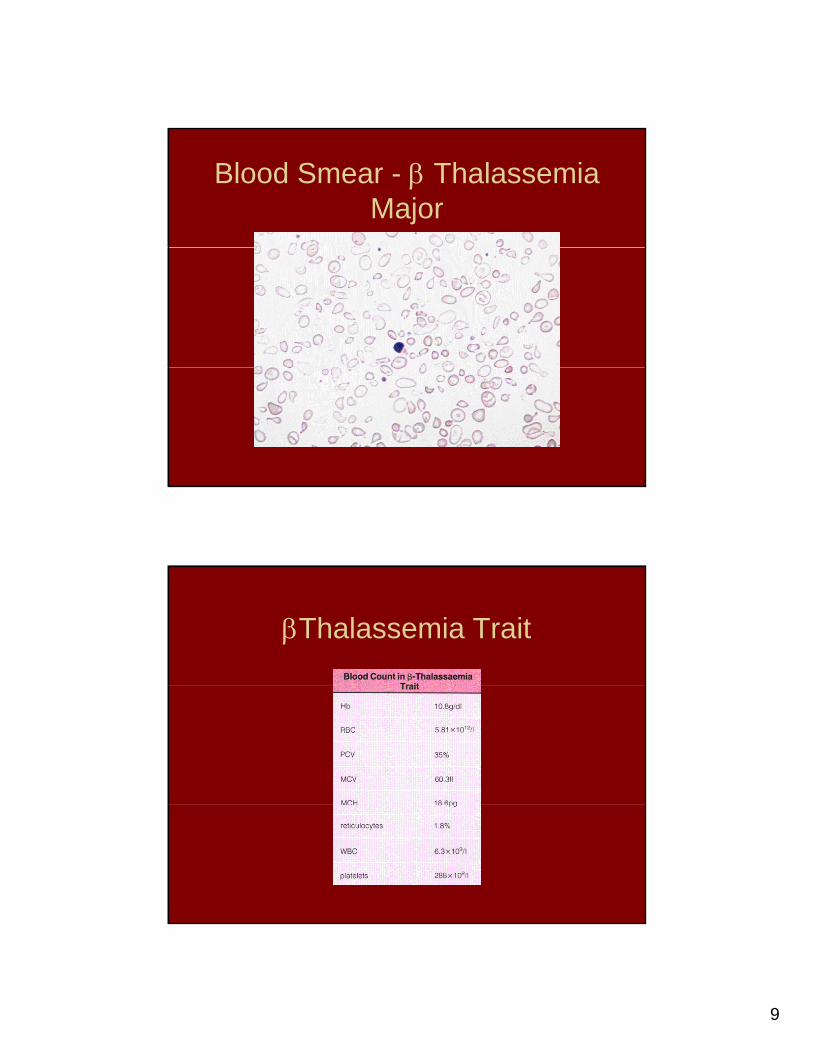
Blood Smear - β Thalassemia Major
βThalassemia Trait
10
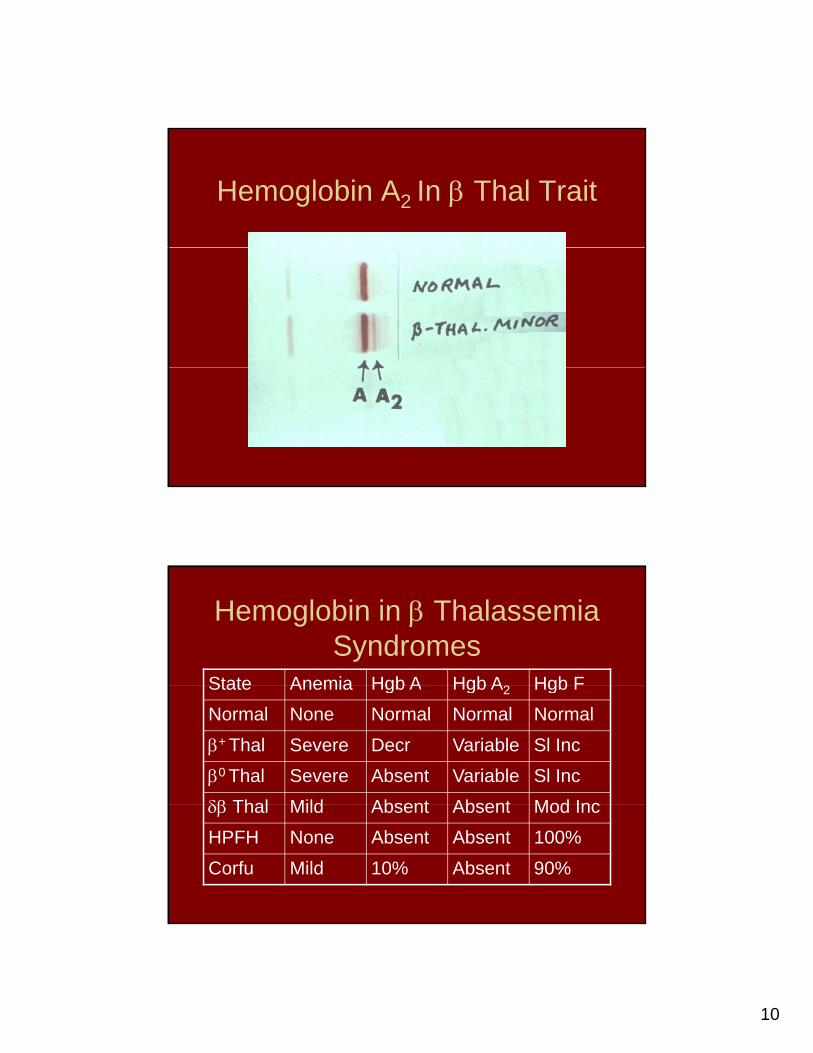
Hemoglobin A2 In β Thal Trait
Hemoglobin in β Thalassemia Syndromes
State Anemia Hgb A Hgb A Hgb FState Anemia Hgb A Hgb A2 Hgb FNormal None Normal Normal Normalβ+ Thal Severe Decr Variable Sl Incβ0 Thal Severe Absent Variable Sl Incδβ Thal Mild Absent Absent Mod Incδβ Thal Mild Absent Absent Mod IncHPFH None Absent Absent 100%Corfu Mild 10% Absent 90%
11
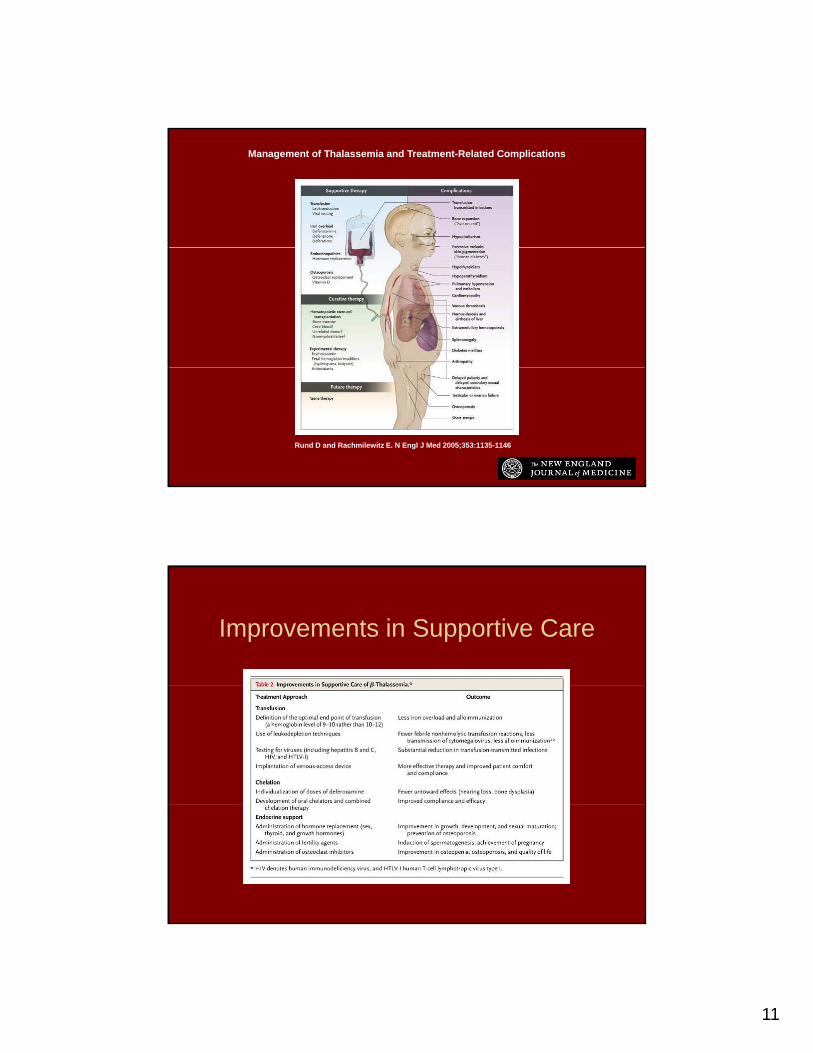
Management of Thalassemia and Treatment-Related Complications
Rund D and Rachmilewitz E. N Engl J Med 2005;353:1135-1146
Improvements in Supportive Care
12
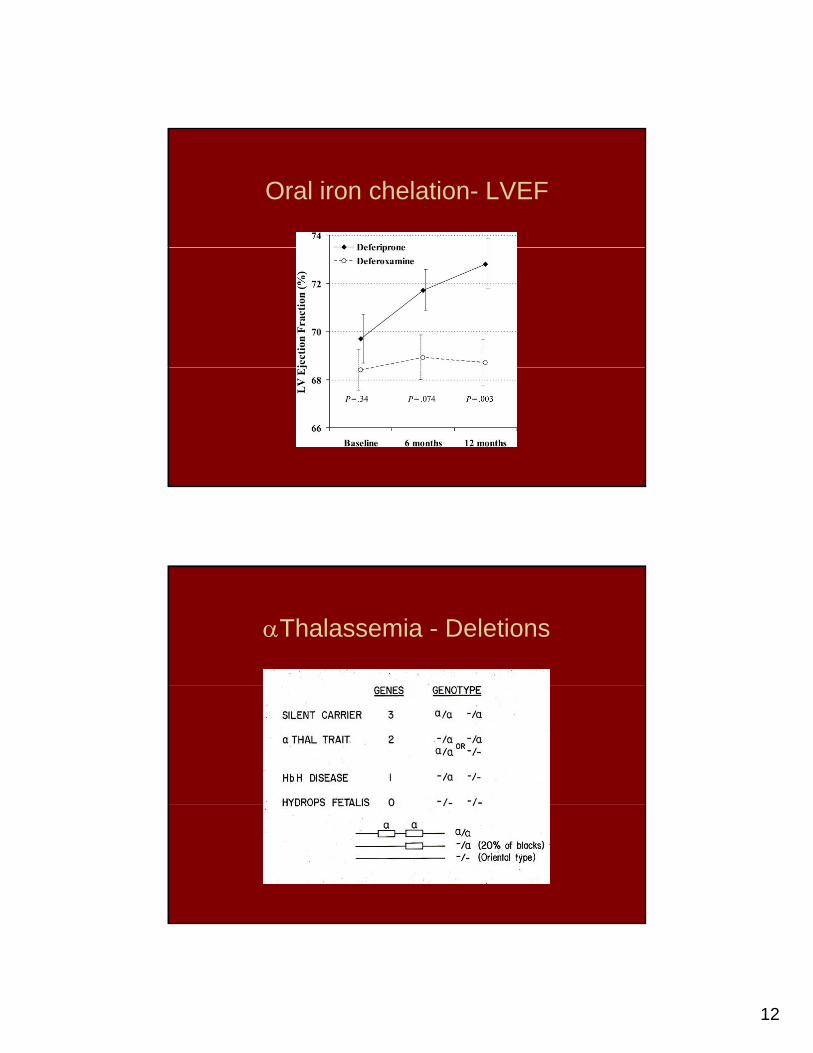
Oral iron chelation- LVEF
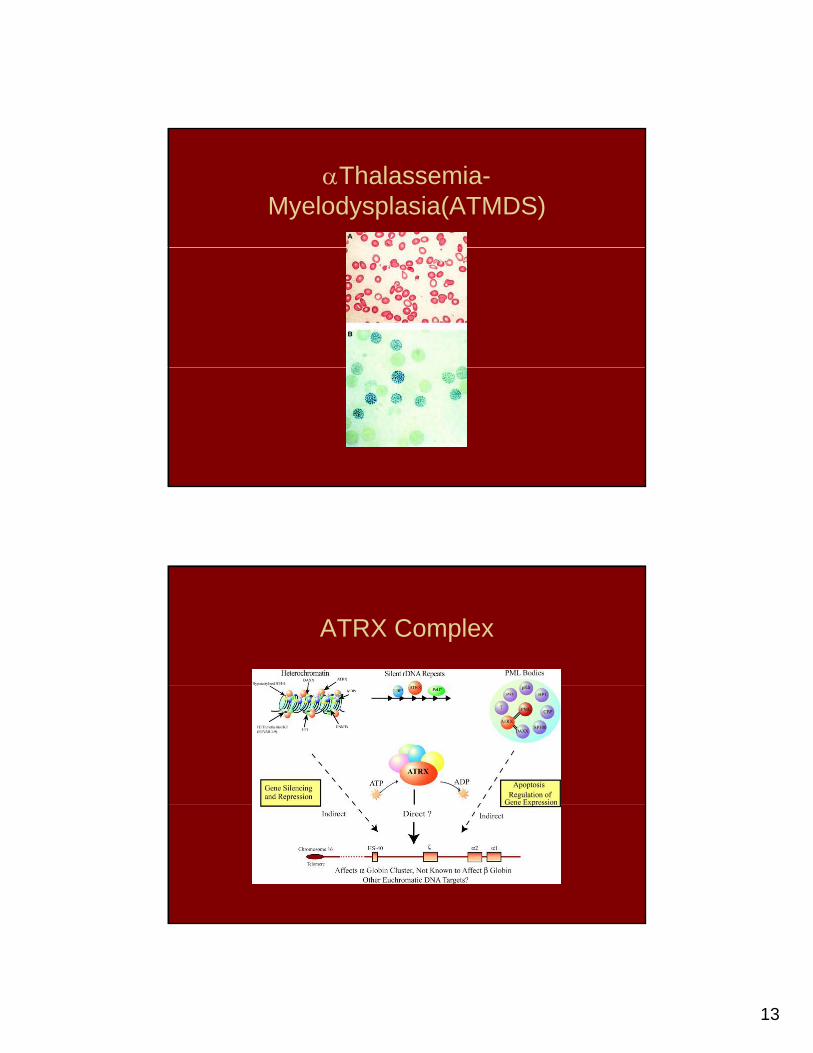
αThalassemia - Deletions
13
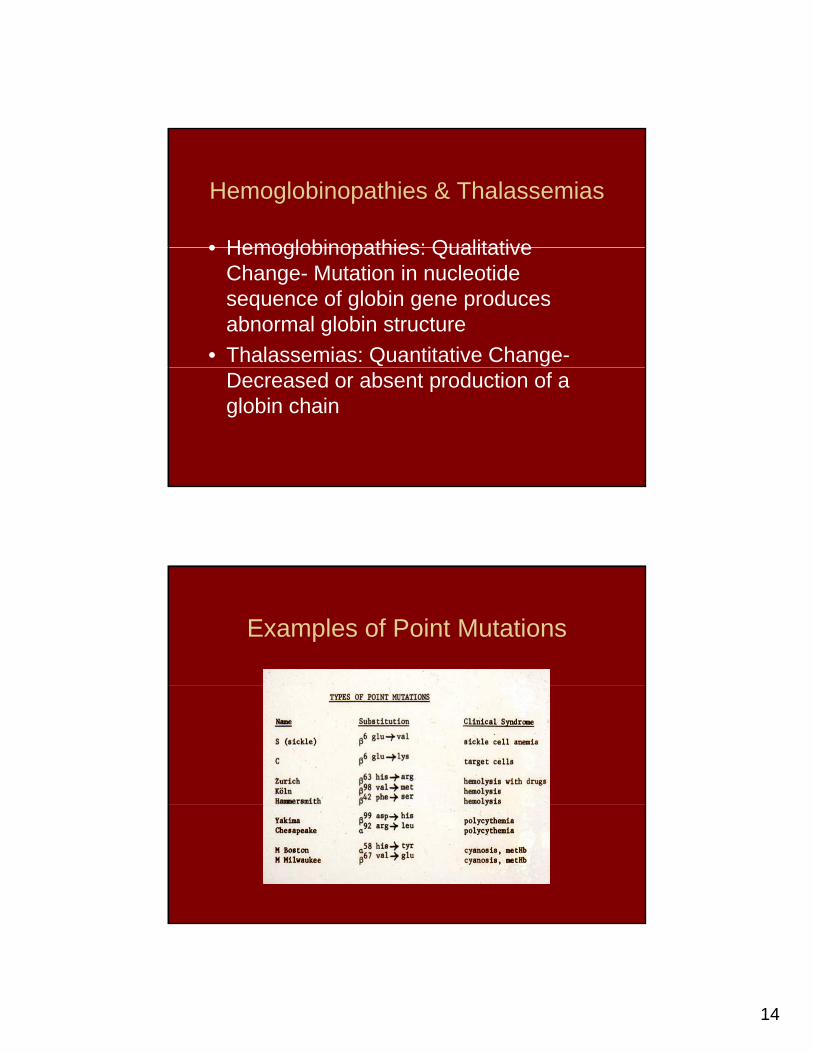
αThalassemia-Myelodysplasia(ATMDS)
ATRX Complex
14
Hemoglobinopathies & Thalassemias
• Hemoglobinopathies: Qualitative• Hemoglobinopathies: Qualitative Change- Mutation in nucleotide sequence of globin gene produces abnormal globin structure
• Thalassemias: Quantitative Change-Decreased or absent production of a globin chain
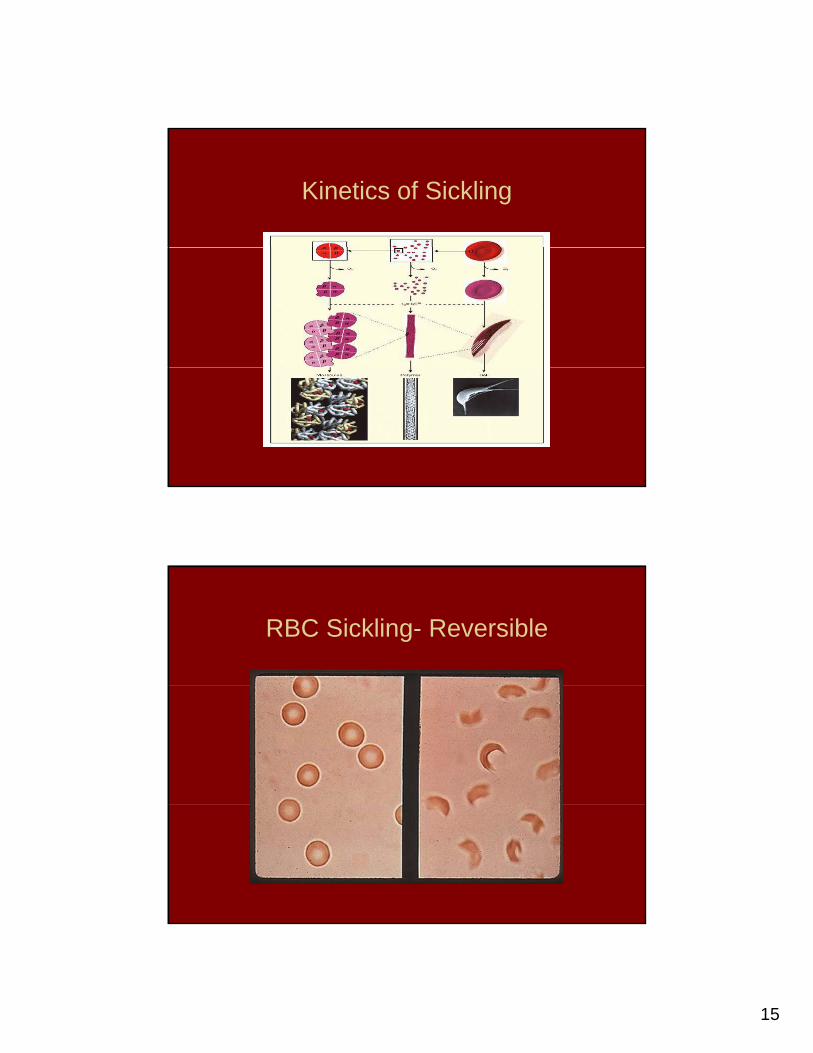
Examples of Point Mutations
15
Kinetics of Sickling
RBC Sickling- Reversible
16
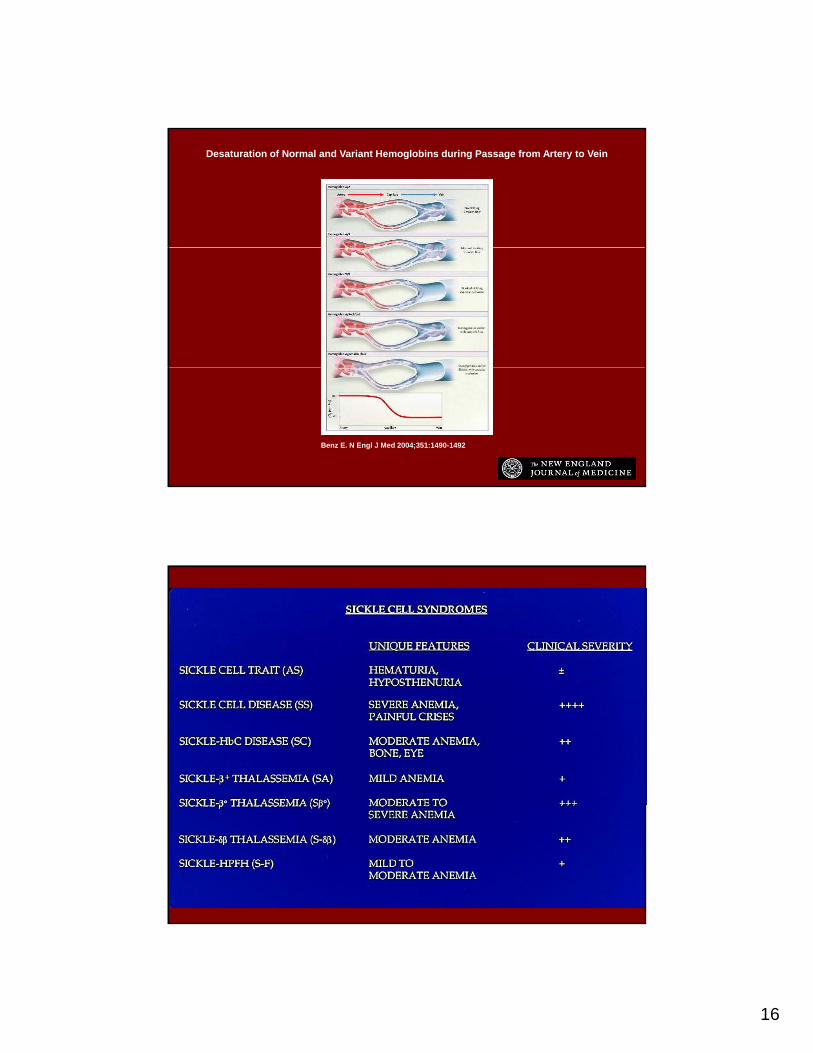
Desaturation of Normal and Variant Hemoglobins during Passage from Artery to Vein
Benz E. N Engl J Med 2004;351:1490-1492
17
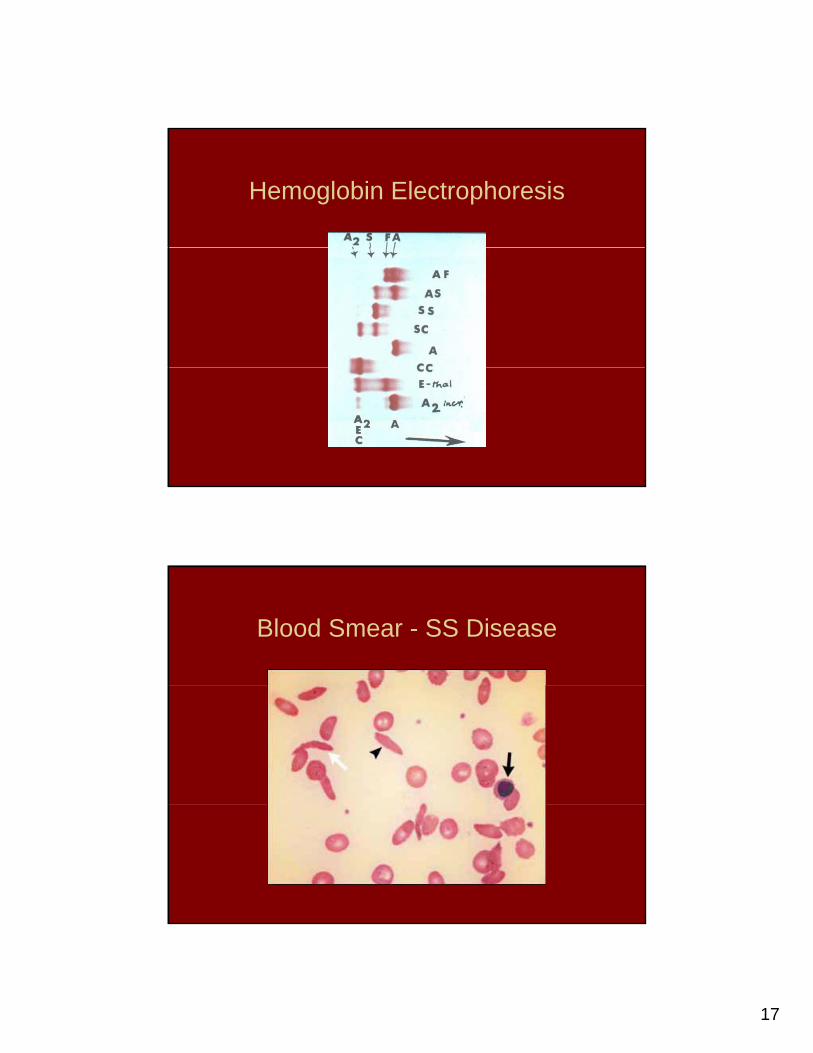
Hemoglobin Electrophoresis
Blood Smear - SS Disease
18
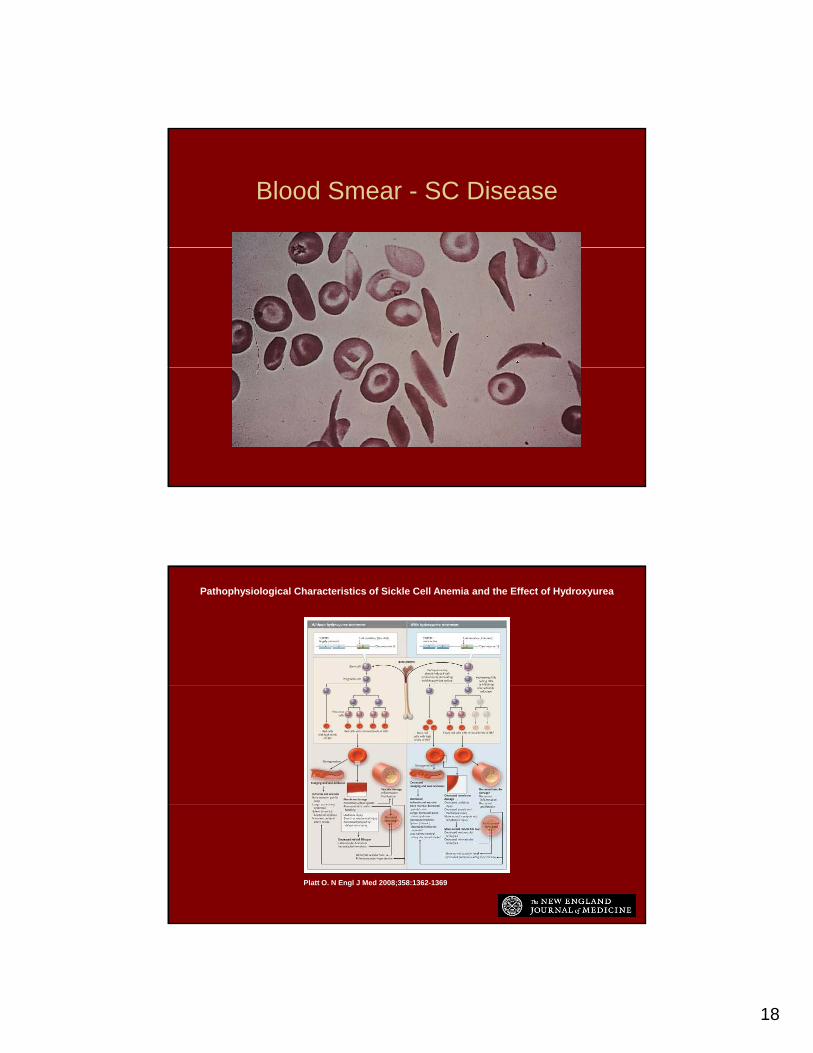
Blood Smear - SC Disease
Pathophysiological Characteristics of Sickle Cell Anemia and the Effect of Hydroxyurea
Platt O. N Engl J Med 2008;358:1362-1369
19
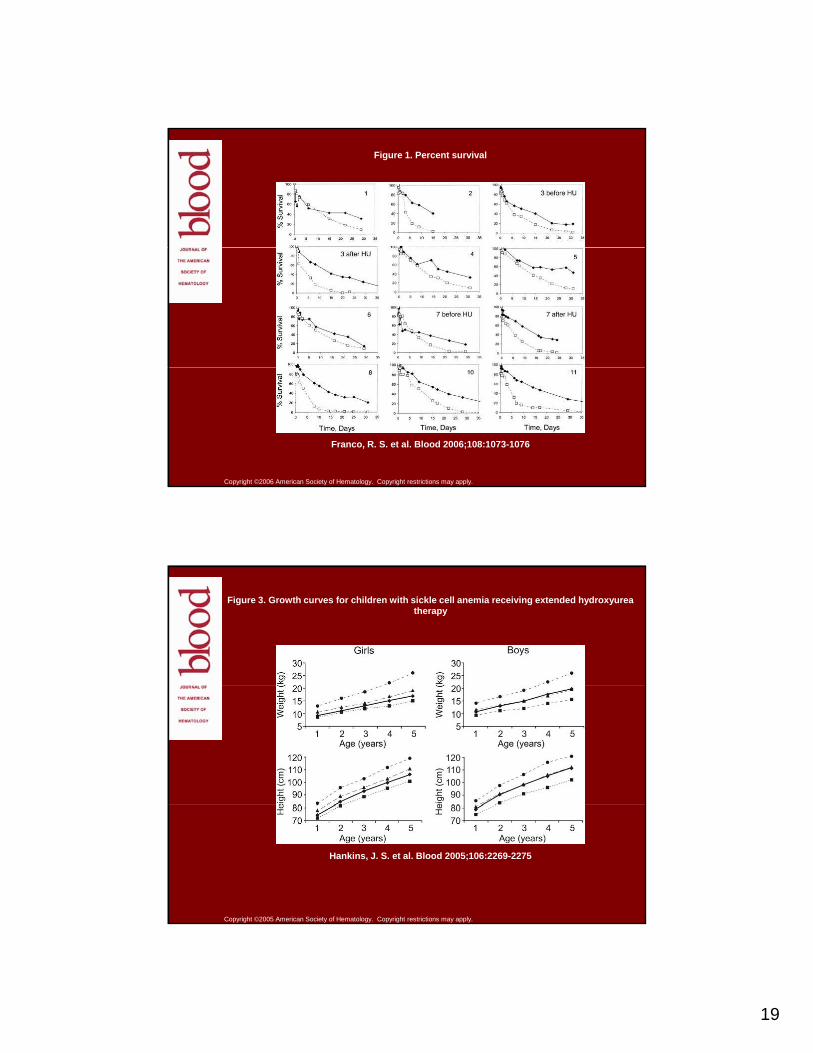
Figure 1. Percent survival
Copyright ©2006 American Society of Hematology. Copyright restrictions may apply.
Franco, R. S. et al. Blood 2006;108:1073-1076
Figure 3. Growth curves for children with sickle cell anemia receiving extended hydroxyurea therapy
Copyright ©2005 American Society of Hematology. Copyright restrictions may apply.
Hankins, J. S. et al. Blood 2005;106:2269-2275
20
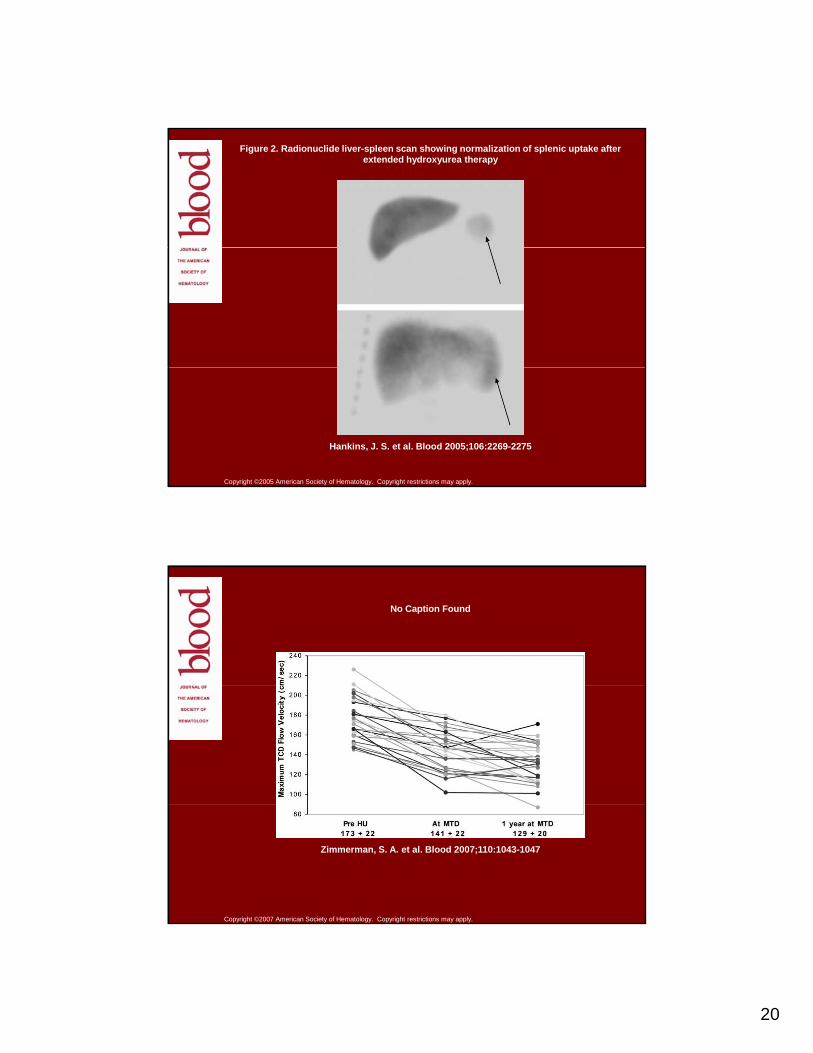
Figure 2. Radionuclide liver-spleen scan showing normalization of splenic uptake after extended hydroxyurea therapy
Copyright ©2005 American Society of Hematology. Copyright restrictions may apply.
Hankins, J. S. et al. Blood 2005;106:2269-2275
No Caption Found
Copyright ©2007 American Society of Hematology. Copyright restrictions may apply.
Zimmerman, S. A. et al. Blood 2007;110:1043-1047
21
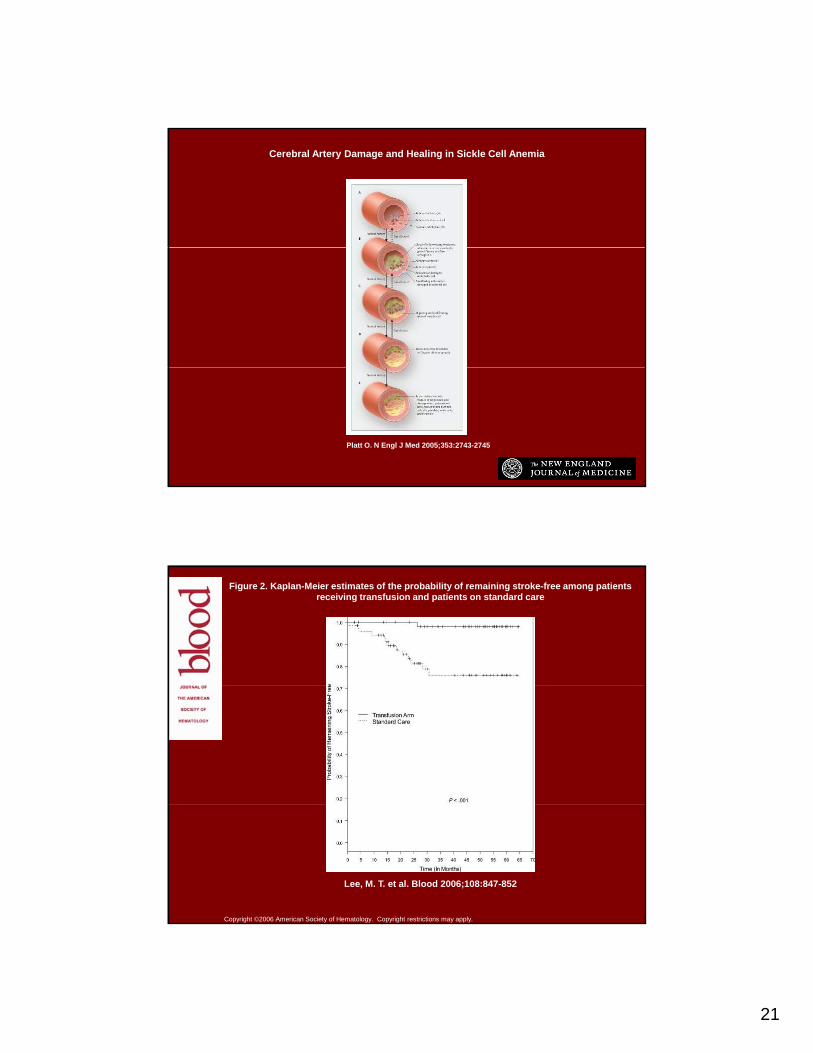
Cerebral Artery Damage and Healing in Sickle Cell Anemia
Platt O. N Engl J Med 2005;353:2743-2745
Figure 2. Kaplan-Meier estimates of the probability of remaining stroke-free among patients receiving transfusion and patients on standard care
Copyright ©2006 American Society of Hematology. Copyright restrictions may apply.
Lee, M. T. et al. Blood 2006;108:847-852
22
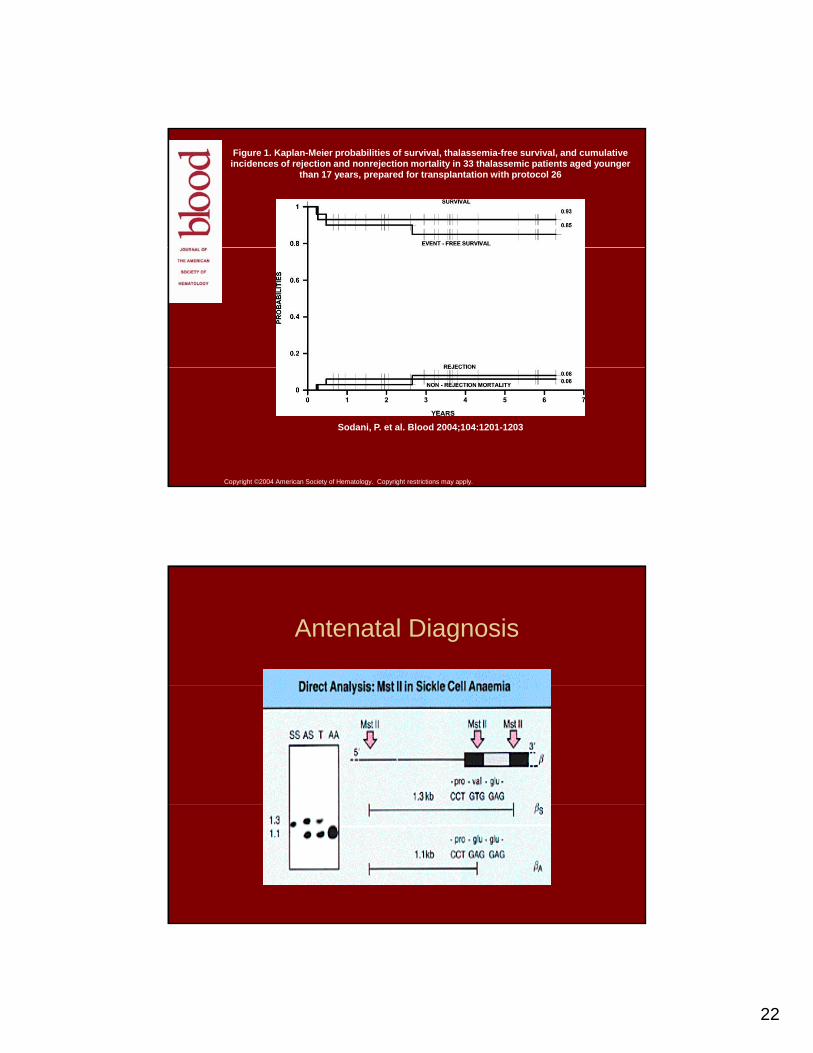
Figure 1. Kaplan-Meier probabilities of survival, thalassemia-free survival, and cumulative incidences of rejection and nonrejection mortality in 33 thalassemic patients aged younger
than 17 years, prepared for transplantation with protocol 26
Copyright ©2004 American Society of Hematology. Copyright restrictions may apply.
Sodani, P. et al. Blood 2004;104:1201-1203
Antenatal Diagnosis