Embed Size (px)
Citation preview
FINAL IDP 2020/21- 2022/2023
5 TH GENERATION
Prepared by:
Executive Department
IDP/PMS Section
Supported by:
IDP Steering Committee
IDP Representative Forum
Hlabisa Municipality
Lot 808 off Masson Street Hlabisa 3937
035- 838 8500
www.big5hlabisa.gov.za
0
Vision Statement
In light of the
Vision
We are visionary leaders who serve through community driven
initiatives, high performance, sound work ethic, innovation, cutting
edge resources and synergistic partnerships.
Our Core Values
Professionalism
Integrity
Competency
Team work
MISSION
A sustainable economy achieved through service delivery and
development facilitation for prosperity and improved quality of life.
1
TABLE OF CONTENTS
I. MAYOR’S FOREWORD ............................................................................................... 1
II. MUNICIPAL MANAGER’S OVERVIEW .................................................................. 4
III. POWERS AND FUNCTIONS ................................................................................... 5
IV. STRUCTURE OF THE DOCUMENT ..................................................................... 8
1. SECTION A: EXECUTIVE SUMMARY ..................................................................... 9
1.1. INTRODUCTION ...................................................................................................... 9
1.2. SPATIAL OVERVIEW ............................................................................................. 9
1.3. BRIEF DEMOGRAPHIC PROFILE ..................................................................... 13
2.2. PLANNING AND DEVELOPMENT PRINCIPLES ............................................ 31
2.2.1. Government Policies and Imperatives ........................................................ 31
2.2.2. Sustainable Development Goals (SDGs) ..................................................... 32
2.2.3. National Development Plan .......................................................................... 33
2.2.4. The Provincial Growth and Development Strategy (PGDS) .................... 33
2.2.5. Provincial Growth and Development Plan (PGDP)................................... 34
2.2.6. District Growth and Development Plan ...................................................... 35
2.2.7. The Back to Basics ........................................................................................ 35
2.2.8. State of the Nation Address (SONA) – 20120 ............................................. 36
2.2.9. State of the Province Address (SOPA) – 2020 ............................................ 37
3. SECTION C: SITUATIONAL ANALYSIS ................................................................ 38
3.1. DEMOGRAPHIC CHARECTERESTICS .................................................... 38
3.1.1. Demographic Indicators ............................................................................... 38
3.1.2. Population by size ......................................................................................... 38
2.1.3. Population Distribution ....................................................................................... 41
A. Type of dwelling ........................................................................................................ 41
3.1.4. Population Composition ...................................................................................... 42
A. Dependency ratio ...................................................................................................... 42
3.1.5. Population Groups ................................................... Error! Bookmark not defined.
2
3.1.6. Distribution of population by gender ................................................................. 44
3.2. SOCIO – ECONOMIC INDICATORS ................................................................ 48
3.2.1. Population by Households Size ........................................................................... 48
3.2.2. Female headed households .................................................................................. 51
3.2.3. Child Headed households .................................................................................... 51
3.2.4. Income Status ....................................................................................................... 53
3.3. POPULATION DENSITY ..................................................................................... 55
3.4. POPULATION BY EDUCATION LEVEL ......................................................... 55
3.5. EMPLOYMENT STATUS .................................................................................... 56
3.6. HOUSEHOLD SERVICES ................................................................................... 57
3.6.1. Distribution of households using electricity for lighting, heating and cooking
......................................................................................................................................... 57
3.6.2. Households with access to refuse removal ......................................................... 58
3.6.3. Distribution of household by type of toilet facility ........................................... 60
3.6.4. Households with access to piped water ............................................................. 61
4. SPATIAL AND ENVIRONMENTAL ANALYSIS ........................................... 63
4.1. SPATIAL ANALYSIS ...................................................................................... 63
4.1.1. Administrative entities ..................................................................................... 63
4.1.2. Structuring Elements ........................................................................................ 63
4.1.3. Existing Nodes & Corridors ............................................................................. 65
I. Primary Development Nodes ................................................................................... 66
II. Secondary Development Nodes/Services Centres .............................................. 67
III. Tertiary Development Nodes ............................................................................... 68
4.1.4. Roads and Corridors ........................................................................................ 71
4.1.5. Broad Land Uses ............................................................................................... 72
4.1.6. Land Ownership ........................................................................................... 76
I. Privately owned ......................................................................................................... 76
II. Commercial land ....................................................................................................... 76
3
III. Traditional Authority Land ..................................................................................... 76
IV. Land Reform ......................................................................................................... 76
V. Land Claims .............................................................................................................. 77
4.1.7. Land Capability ............................................................................................ 80
4.2. ENVIRONMENTAL ANALYSIS ........................................................................... 80
4.2.1. Introduction ................................................................................................... 80
4.2.2. BIOPHYSICAL ENVIRONMENT ............................................................. 82
I. CLIMATE ............................................................................................................. 82
II. HYDROLOGY ...................................................................................................... 82
1. Major watercourses and wetlands ........................................................................... 82
2. ECOLOGICAL STATUS OF THE MAJOR RIVERS ......................................... 82
3. FACTORS DRIVING THE ECOLOGICAL INTEGRITY OF RIVERS AND
WETLANDS .................................................................................................................. 84
A) Socio-Economic Factors: .......................................................................................... 84
4.2.3. CLIMATE CHANGE ................................................................................... 87
4.2.4. WASTE MANAGEMENT ANALYSIS .............................................................. 92
LANDFILL SITES ........................................................................................................ 92
A) HLABISA WASTE DISPOSAL SITE ................................................................ 92
B) HLUHLUWE WASTE DISPOSAL .................................................................... 93
4.2.5. DISTRICT-WIDE WASTE DISPOSAL SITE COMPLIANT CHECK . 94
A) Recycling, Reuse, Recovery and Waste Minimization Initiatives .................... 96
B) illegal dumping .......................................................................................................... 98
4.2.6. MUNICIPAL ENVIRONMENTAL CAPACITY ANALYSIS .............. 100
I. ENVIRONMENTAL GOVERNANCE ............................................................ 100
II. Human Resource Capacity .................................................................................... 100
III. Environmental Planning Tools: Integrated Waste Management Plan .............. 100
4.2.7. AGRICULTURE ........................................................................................ 100
I. AGRICULTURAL POTENTIAL OF THE MUNICIPALITY .Error! Bookmark
not defined.
4
4.2.8. ALIEN INVASIVE SPECIES .................................................................... 101
4.2.9. Disaster Management ................................................................................. 104
I. Municipal Institutional Capacity........................................................................... 105
A) Staffing ..................................................................................................................... 105
B) Policies ..................................................................................................................... 105
C) Resources ................................................................................................................. 106
4.2.10. Risk Assessment .......................................................................................... 107
Severe hazards ............................................................................................................. 107
I. Risk Reduction and Prevention ......................................................................... 109
II. Response and Recovery ...................................................................................... 109
A) Municipal Capacity in terms of Response and Recovery .................................... 109
B) Training & Awareness ............................................................................................ 109
C) Funding Arrangements .......................................................................................... 109
4.3. SECTORAL ANALYSIS ....................................................................................... 112
BACKGROUND ................................................................................................................. 112
4.3.1. OFFICE OF THE MUNICIPAL MANAGER ......................................... 114
4.3.2. CORPORATE SERVICES DEPARTMENT ........................................... 115
4.3.3. BUDGET AND TERASURY SERVICES DEPARTMENT ................... 116
4.3.6. SOCIAL AND ECONOMIC DEVELOPMENT SERVICES
DEPARTMENT ........................................................................................................... 118
Municipal Institutional Capacity & Status of Critical Posts ................................... 118
4.4. Human Resource Development ..................................................................... 118
4.4.1. Institutional Arrangements to drive IDP .................................................. 119
(a) Office of the Municipal Manager ......................................................................... 119
(b) IDP Steering Committee ....................................................................................... 120
(c) IDP Representative Forum.................................................................................... 120
(d) Council .................................................................................................................... 120
4.5. SWOT ANALYSIS ......................................................................................... 121
5
4.6. SERVICE DELIVERY & INFRASTRUCTURE ANALYSIS ........................... 123
4.6.1. Water and Sanitation .................................................................................. 123
I. Water Services Context .......................................................................................... 123
UMkhanyakude District Backlog Analysis ............................................................... 124
II. Water Schemes .................................................................................................... 126
The Big 5 Hlabisa Capital Projects .................................. Error! Bookmark not defined.
The Big 5 Hlabisa Drought Relief Programme ......................................................... 126
III. Sanitation ................................................................... Error! Bookmark not defined.
IV. Solid Waste Management ................................................................................... 128
4.6.2. Transportation Infrastructure ................................................................... 128
I. Road Networks .................................................................................................... 128
II. Road and Transport Infrastructure Analysis .................................................. 128
III. Access to Community Facilities ............................................................................. 129
IV. Human Settlement .............................................................................................. 130
Housing trends ................................................................................................................. 134
4.6.3. Telecommunication ......................................................................................... 134
Water Supply ................................................................................................................... 135
4.6.4. Energy .......................................................................................................... 135
4.7. LOCAL ECONOMIC DEVELOPMENT & SOCIAL DEVELOPMENT
ANALYSIS .......................................................................................................................... 138
4.7.1. Local Economic Development Analysis .................................................... 138
4.7.2. Local Economic Development Strategy .................................................... 138
4.7.3. Key Natural Asset /Resources Analysis .................................................... 138
4.7.4. Competitive & Comparative Advantages ................................................. 140
4.7.5. Main Economic Contributors ........................................................................ 142
4.7.6. Employment and Income Levels.......................... Error! Bookmark not defined.
4.7.7. Agriculture .................................................................................................. 143
7.7.8. Tourism .............................................................................................................. 144
6
4.7.8. Small Medium and Micro Enterprises (SMMEs) .................................... 145
4.7.9. Informal Sector ........................................................................................... 145
4.7.10. Manufacturing (Industrial) ........................................................................ 146
4.7.11. Threats and restrictions facing Manufacturing Sector ............................... 147
4.7.12. Expanded Publics Works Programme .......................................................... 147
4.7.13. Services ............................................................................................................ 147
4.7.14. Mining .............................................................................................................. 148
4.7.15. LOCAL ECONOMIC DEVELOPMENT SWOT ANALYSIS .................. 150
4.8. SOCIAL DEVELOPMENT ANALYSIS .............................................................. 151
4.8.1. Broad Based Community Needs -2012/2015 - 2017/2018 ........................ 151
4.8.2. Education ..................................................................................................... 151
4.8.3. Health ........................................................................................................... 151
4.8.4. Safety & Security ........................................................................................ 152
I. Protection Services .................................................................................................. 152
II. Fire Protection......................................................................................................... 152
III. Community Policing Forum .................................................................................. 152
TRAFFIC MANAGEMENT .......................................................................................... 153
4.8.5. Community Development ........................................................................... 153
4.8.6. Development of the People with Disabilities, elderly, women and youth
153
4.8.7. Social Development: SWOT Analysis ....................................................... 155
4.9. FINANCIAL VIABILITY & MANEGEMENT ANALYSIS . Error! Bookmark not
defined.
4.9.1. Financial Viability & Management ................. Error! Bookmark not defined.
4.9.2. Capability of the Municipality to execute Capital ProjectsError! Bookmark
not defined.
4.9.3. Indigent support ................................................ Error! Bookmark not defined.
4.9.4. Revenue Enhancement & Protection Strategies .......... Error! Bookmark not
defined.
7
4.9.5. Municipal Consumer Debt Collection ............. Error! Bookmark not defined.
4.9.6. Grants & Subsidies ........................................... Error! Bookmark not defined.
4.9.7. Municipal Infrastructure Assets & Maintenance (Q&M) .Error! Bookmark
not defined.
4.9.8. Current & Planned Borrowings ...................... Error! Bookmark not defined.
4.9.9. Municipal Credit Rating .................................. Error! Bookmark not defined.
4.9.10. Supply Chain Management .............................. Error! Bookmark not defined.
4.9.11. Supply Chain Management .............................. Error! Bookmark not defined.
4.9.12. Bid Committees ................................................. Error! Bookmark not defined.
4.9.13. Challenges .................................................................................................... 163
4.9.14. Municipal Financial Viability and Management Emerging Key Issues
Error! Bookmark not defined.
4.9.15. Financial Viability & Management SWOT Analysis ... Error! Bookmark not
defined.
4.10. GOOD GOVERNANCE AND PUBLIC PARTICIPATION ......................... 164
4.10.1. Good Governance Analysis ........................................................................ 165
4.10.2. National and Provincial Programmes ....................................................... 165
1. Operation Sukuma Sakhe (OSS) ....................................................................... 165
2. Intergovernmental Relations (IGR) .................................................................. 166
4.10.3. district igr structures .................................................................................. 166
1. District Mayor’s Forum ..................................................................................... 166
2. Municipal Managers Forum .............................................................................. 166
3. Chief Financial Officers Forum ......................................................................... 166
4. Technical Forum ................................................................................................. 167
5. Planning Development Forum ........................................................................... 167
6. Community Forum ............................................................................................. 167
7. Communication (DCF) ....................................................................................... 167
8. Corporate Services Forum ................................................................................. 167
9. Waste Management Forum ................................................................................ 167
8
10. Development Planning Shared Services (DPSS) .......................................... 168
11. District Technical Advisor Committee (DTAC) on PMS ............................ 168
4.10.4. Local Municipal Structures ....................................................................... 168
1. IDP Steering Committee (IDP SC) .................................................................... 168
2. IDP Representative Forum ................................................................................ 168
3. Council ................................................................................................................. 168
4. Municipal Public Accounts Committee (MPAC) ............................................. 169
5. Audit Committee ................................................................................................. 169
4.10.5. Status of Municipal Policies and Sector Plans.......................................... 169
4.10.6. Municipal Risk Management ..................................................................... 169
4.10.7. Public Participation Analysis ..................................................................... 170
4.10.8. Ward Committee Functionality ................................................................. 171
4.10.9. Good Governance & Public Participation SWOT Analysis .................... 172
4.10.10. COMBINED SWOT ANALYSIS .................................................................. 173
5. SECTION D: DEVELOPMENT STRATEGY ............... Error! Bookmark not defined.
5.1. INTRODUCTION ........................................................ Error! Bookmark not defined.
5.2. NATIONAL AND PROVINCIAL POLICY PERSPECTIVE ............... Error!
Bookmark not defined.
NATIONAL DEVELOPMENT PLAN ........................... Error! Bookmark not defined.
5.3. KZN Provincial Priorities ........................................ Error! Bookmark not defined.
5.4. PROVINCIAL GROWTH AND DEVELOPMENT STRATEGY (PGDS)
Error! Bookmark not defined.
VISION ...................................................................................... Error! Bookmark not defined.
MISSION ............................................................................... Error! Bookmark not defined.
OUR VALUES ....................................................................... Error! Bookmark not defined.
5.5. STRATEGIC ISSUES .............................................. Error! Bookmark not defined.
2. STRATEGIC OBJECTIVES ....................................... Error! Bookmark not defined.
6. SECTION E1: STRATEGIC MAPPING ......................................................... 203
6.1. Spatial Development Framework ...................................................................... 203
9
2. DEVELOPMENT CONTEXT .................................... Error! Bookmark not defined.
I. Big 5 (NORTH Eastern part of the Municipality) ............................................... 223
6.2. Environmental Sensitive Areas .......................................................................... 231
7. SECTION E2: IMPLEMEMENTATION PLAN ..................................................... 232
FINANCIAL PLAN .................................................................. Error! Bookmark not defined.
PURPOSE .................................................................................. Error! Bookmark not defined.
SECTOR DEPARTMENTAL PROJECTS WITHIN BIG 5 HLABISA LM.... Error!
Bookmark not defined.
SECTION G: SERVICE DELIVERY AND BUDGET IMPLEMENTATION PLAN
2019/2020(SDBIP) ANNEXURE B .................................................................................... 266
SECTION H: ORGANISATIONAL SCORECARD 2019/2020 ANNEXURE C ..... Error!
Bookmark not defined.273
ORANISATIONAL STRUCTURE ANNEXURE A
1
I. MAYOR’S FOREWORD
I. MAYOR’S FOREWORD
The season of planning of the Integrated Development Plan in local government is upon us,
where all the stakeholders including communities and organized formations are expected to
register their respective interest and footprint on the future plans and developments of the Big
5 Hlabisa Local Municipality for the coming financial year.
The five (5) year Integrated Development Plan that we adopt now in March 2019, which
effectively marked the beginning of new term of the Integrated Development Plan. This
process therefore forms the first IDP of the fifth generation and we have collectively
determined the terms and conditions of our social contract together with you as our
stakeholders, principals and partners. This Integrated Development Plan could not come at
the most opportune time. This is made so in the light of the policy certainty and direction
which come into effect and established through the adoption of the National Development
Plan.
To give practical expression to the policy direction of the National Development Plan, as
well as other National Priorities, the Big 5 Hlabisa Local Municipality through its Integrated
Development Plan, has placed itself at the center of interaction with the stakeholders. This is
done through various engagements and public participation platforms we have developed to
obtain and ascertain community interests as well as their priorities.
During the period of public participation, communities, stakeholders and our partners were
called upon to make necessary inputs which are geared towards making sure that the
Integrated Development Plans are aligned to our collective aspirations and priorities with an
objective of confronting the on-going challenges predicated on the triple axis of poverty,
unemployment and inequalities.
2
All the efforts and foundation that we laid in the past years are beginning confirm the
correctness of our policies, strategies and plans given the current strong and sustainable
investment in the regional economy, as well as judging by the level of expansions,
investment and development in the region by both Government and private sector and the
consequent impact on the quality of life and economic growth in the region.
On the other hand we are working with different investors, to mitigate both permanent and
temporary layoffs, thus ensuring the continuation and job security and production to meet the
market demand. In the past local communities have raised concerns about too many
‘governments’ at local level and duplication created by two tiers local Government system
and we have duly responded.
We have concluded an intensive consultation and public participation programme with our
communities regarding the creation of single tier system of local governance in Big 5 Hlabisa
and so far all the legal processes have been followed and complied with. Flowing from these
engagements and submissions, it will be in the best interest of the communities that
governance is consolidated into a single tier in Big 5 Hlabisa so that duplication, wastage,
confusion and conflicting roles can be effectively eliminated and accountability as well as
stability is achieved.
Small Medium and Micro Enterprises (SMMEs) and Cooperatives remain the epicenter of
our focus and development through heightening capacity building and access to other
opportunity available in other spheres of Government and private sector to support SMMEs,
Cooperatives and Emerging farmers. In partnership with the National Department of Rural
Development and Land Reform we intend developing an extra feasibility studies for possible
Precincts and those feasibilities will be building on the successful work that we will achieve.
There are capital projects that will be kick-started in the next financial year to restore
confide0nce to our communities and to attract more investors into our town’s thus creating
ambience for further investment and growth in both towns.
In the short term critical challenge of youth unemployment that has been highlighted by both
the National Development Plan and the Census 2011 results, will be receiving serious
3
attention and in the short term we will be increasing intake in the Community Works
Programme and Expanded Public Works Programme targeting poverty stricken Wards across
the municipal area.
I call on all and sundry, to take the time out and have a go at this Big 5 Hlabisa Integrated
Development Plan. In doing so, we will arrive at our envisaged future as one, walking hand
in hand in seamless service of our communities.
Thanking you;
4
II. MUNICIPAL MANAGER’S OVERVIEW
The Big 5 Hlabisa Local Municipality remains focused on delivering on its mandate and
functions and I am happy to be getting this maximum cooperation from the whole staff and
colleagues and our delivery partners as well as other Spheres of Government.
We have developed our strategies based on the review of the baseline information to come to
the second that informed our Integrated Development Plan (IDP). In the next financial year, I
will be concluding the process of organizational review that is inclusive of resources required
to implement such as administrative structure. The process of reviewing the organizational
structure has been delayed due to the limitations on our resources. Amongst other
considerations in achieving the strategy as adopted by Council.
We remain proud with the efforts we have put on both the level of awareness about service
delivery record, information dissemination, stakeholder engagements and the public
participation processes. These efforts have paid off as manifested by less service delivery
protests experienced during the current financial year.
We have had reasonable and stable labour peace in our environment and this is attributed to
functional relationship we continue to enjoy with the Unions within the Local Forum and this
relationship will be even more important as we move forward.
We continue to work hard to reduce the cost of running this municipality through employing
austerity measures including realizing value for money. All the financial and non-financial
measures in the next financial year are geared towards improving our audit performance from
the unqualified audit to a clean audit opinion consistent with the operation “Clean Audit”.
We have put our ducts in a row to achieve a clean audit. To this end we have made
appointments of members for the Audit Committee for a period of three (3) years and I have
no doubt that the skill mix in the Committee will help us to achieve the clean audit objective.
Oversight by the Municipal Public Accounts Committee (MPAC) has brought new impetus
and focus within the municipality. The Integrated Development Plan we are presenting here
has been structured in accordance with legal requirements of the Local Government: Municipal
Systems Act, No. 32 of 2000.
5
The diagnostic analysis conducted has assisted us to determine service delivery gaps and
backlogs thus enabling us to craft relevant strategies and sector plans. These are captured in
detail herein. In order to ensure streamlined development in the entire region we developed a
Spatial Development Framework to which all development should be aligned. In order to
achieve the plans and objectives we have set for the 2019/20 financial year we have allocated
a budget which defines the resources to be used. In this IDP we have also looked critically at
the objectives we intend to achieve and how performance to will be monitored.
These objectives adhere to the principles of being Specific, Measurable, Achievable, Realistic
and Time-bound. As a consequence, thereof monitoring and evaluation will be more targeted
and progressive.
Pursuant to co-operative governance we have aligned our plans with those of the other spheres
of government, more specifically those of KwaZulu-Natal Provincial Government.
Thanking you;
Municipal Manager
Dr VJ Mthembu
III. POWERS AND FUNCTIONS
The Constitution of the Republic of South Africa Act 108 of 1996, precisely Schedule 4, Part
B, read together with Section 152 thereof, and containing the objects of local government,
vests the powers and functions of the municipality. Meanwhile, municipal transformation and
institutional development relates to a fundamental and significant change relating to the way
the municipalities perform their functions, how resources are deployed and the institutional
strategies which are implemented with a view to ensuring optimum results in service delivery
6
to the community. It is envisaged that transformation and institutional development shall be
seen to take place when the following is addressed as part of the Municipality’s strategic
planning and direction
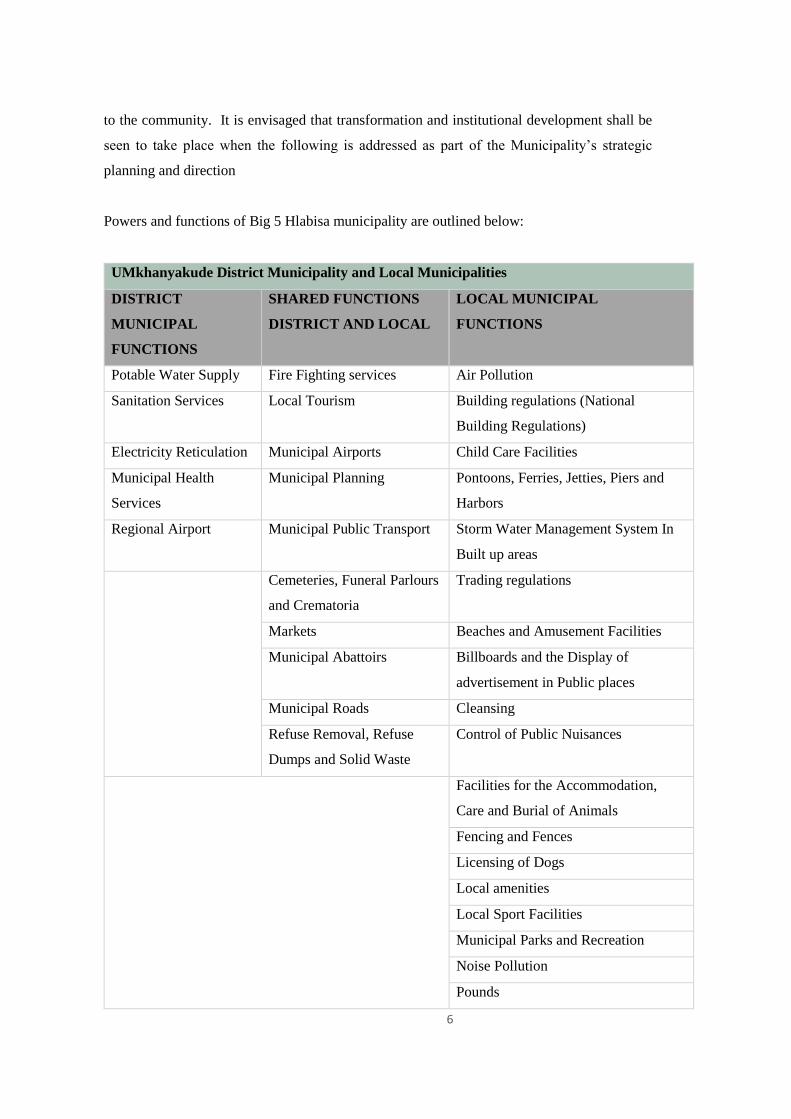
Powers and functions of Big 5 Hlabisa municipality are outlined below:
UMkhanyakude District Municipality and Local Municipalities
DISTRICT
MUNICIPAL
FUNCTIONS
SHARED FUNCTIONS
DISTRICT AND LOCAL
LOCAL MUNICIPAL
FUNCTIONS
Potable Water Supply Fire Fighting services Air Pollution
Sanitation Services Local Tourism Building regulations (National
Building Regulations)
Electricity Reticulation Municipal Airports Child Care Facilities
Municipal Health
Services
Municipal Planning Pontoons, Ferries, Jetties, Piers and
Harbors
Regional Airport Municipal Public Transport Storm Water Management System In
Built up areas
Cemeteries, Funeral Parlours
and Crematoria
Trading regulations
Markets Beaches and Amusement Facilities
Municipal Abattoirs Billboards and the Display of
advertisement in Public places
Municipal Roads Cleansing
Refuse Removal, Refuse
Dumps and Solid Waste
Control of Public Nuisances
Facilities for the Accommodation,
Care and Burial of Animals
Fencing and Fences
Licensing of Dogs
Local amenities
Local Sport Facilities
Municipal Parks and Recreation
Noise Pollution
Pounds

7
Public Places
Street Trading
Street Lighting
Traffic and Parking
8
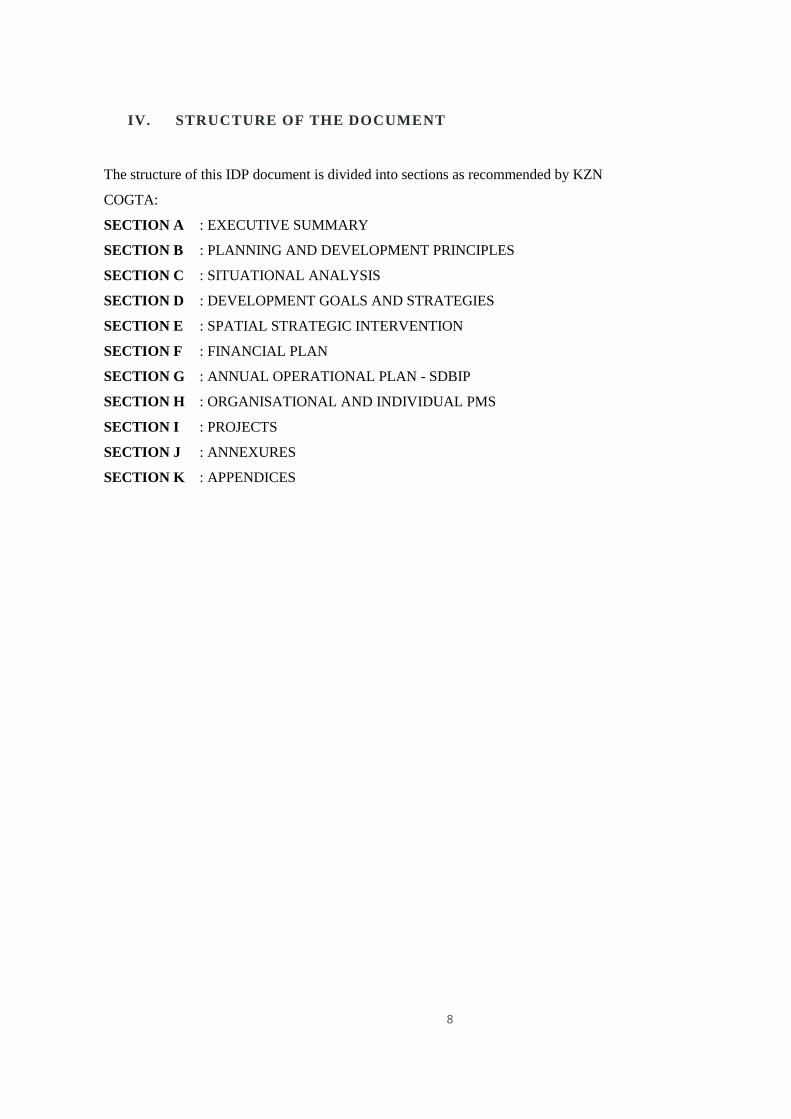
IV. STRUCTURE OF THE DOCUMENT
The structure of this IDP document is divided into sections as recommended by KZN
COGTA:
SECTION A : EXECUTIVE SUMMARY
SECTION B : PLANNING AND DEVELOPMENT PRINCIPLES
SECTION C : SITUATIONAL ANALYSIS
SECTION D : DEVELOPMENT GOALS AND STRATEGIES
SECTION E : SPATIAL STRATEGIC INTERVENTION
SECTION F : FINANCIAL PLAN
SECTION G : ANNUAL OPERATIONAL PLAN - SDBIP
SECTION H : ORGANISATIONAL AND INDIVIDUAL PMS
SECTION I : PROJECTS
SECTION J : ANNEXURES
SECTION K : APPENDICES
9
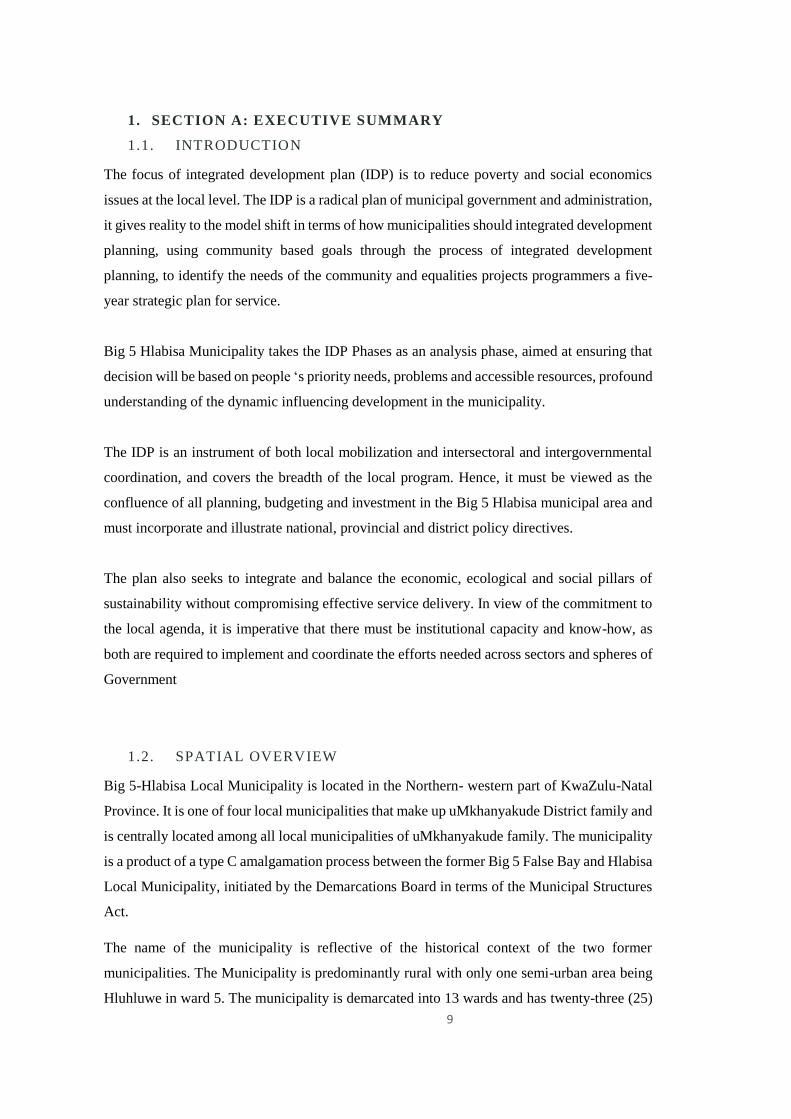
1. SECTION A: EXECUTIVE SUMMARY
1.1. INTRODUCTION
The focus of integrated development plan (IDP) is to reduce poverty and social economics
issues at the local level. The IDP is a radical plan of municipal government and administration,
it gives reality to the model shift in terms of how municipalities should integrated development
planning, using community based goals through the process of integrated development
planning, to identify the needs of the community and equalities projects programmers a five-
year strategic plan for service.
Big 5 Hlabisa Municipality takes the IDP Phases as an analysis phase, aimed at ensuring that
decision will be based on people ‘s priority needs, problems and accessible resources, profound
understanding of the dynamic influencing development in the municipality.
The IDP is an instrument of both local mobilization and intersectoral and intergovernmental
coordination, and covers the breadth of the local program. Hence, it must be viewed as the
confluence of all planning, budgeting and investment in the Big 5 Hlabisa municipal area and
must incorporate and illustrate national, provincial and district policy directives.
The plan also seeks to integrate and balance the economic, ecological and social pillars of
sustainability without compromising effective service delivery. In view of the commitment to
the local agenda, it is imperative that there must be institutional capacity and know-how, as
both are required to implement and coordinate the efforts needed across sectors and spheres of
Government
1.2. SPATIAL OVERVIEW
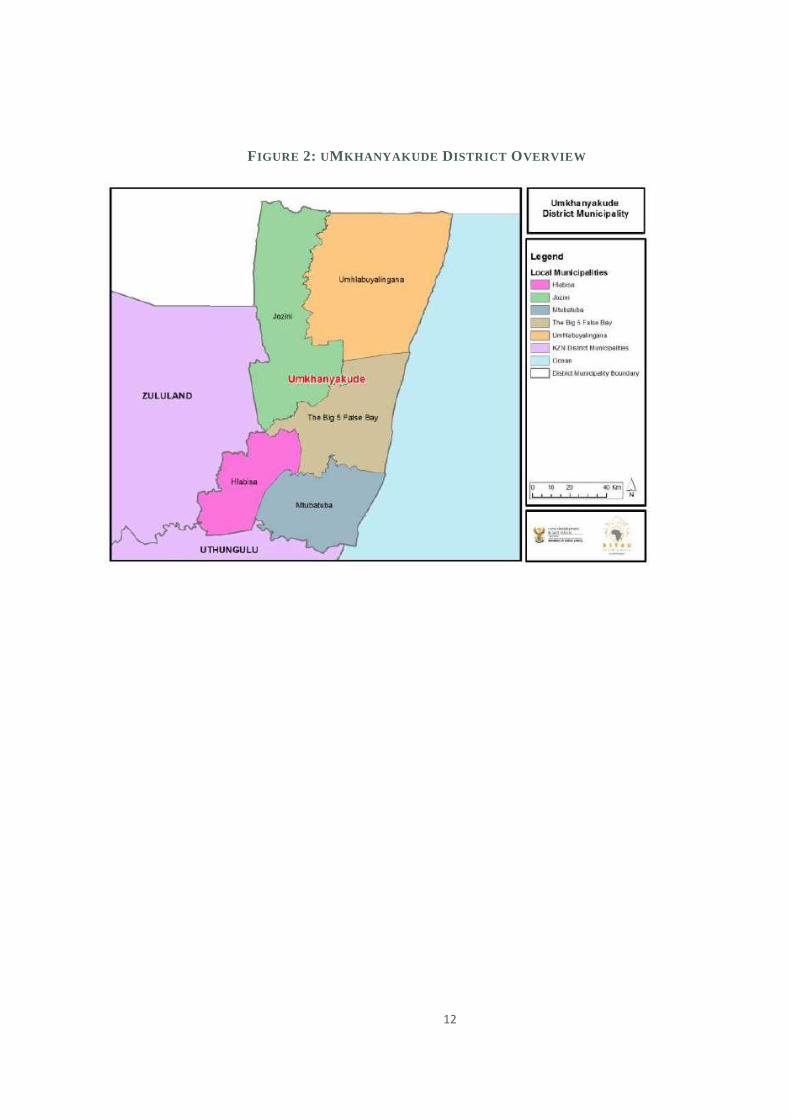
Big 5-Hlabisa Local Municipality is located in the Northern- western part of KwaZulu-Natal
Province. It is one of four local municipalities that make up uMkhanyakude District family and
is centrally located among all local municipalities of uMkhanyakude family. The municipality
is a product of a type C amalgamation process between the former Big 5 False Bay and Hlabisa
Local Municipality, initiated by the Demarcations Board in terms of the Municipal Structures
Act.
The name of the municipality is reflective of the historical context of the two former
municipalities. The Municipality is predominantly rural with only one semi-urban area being
Hluhluwe in ward 5. The municipality is demarcated into 13 wards and has twenty-three (25)

10
councillors. Hluhluwe and Hlabisa are the main towns that are centers of employment
opportunities, shopping and recreational facilities Easily accessible off the N2 national route,
the municipality lies adjacent to the False Bay (western) side of the Isimangaliso Wetland Park
(previously known as the Greater St Lucia Wetlands Park).
11
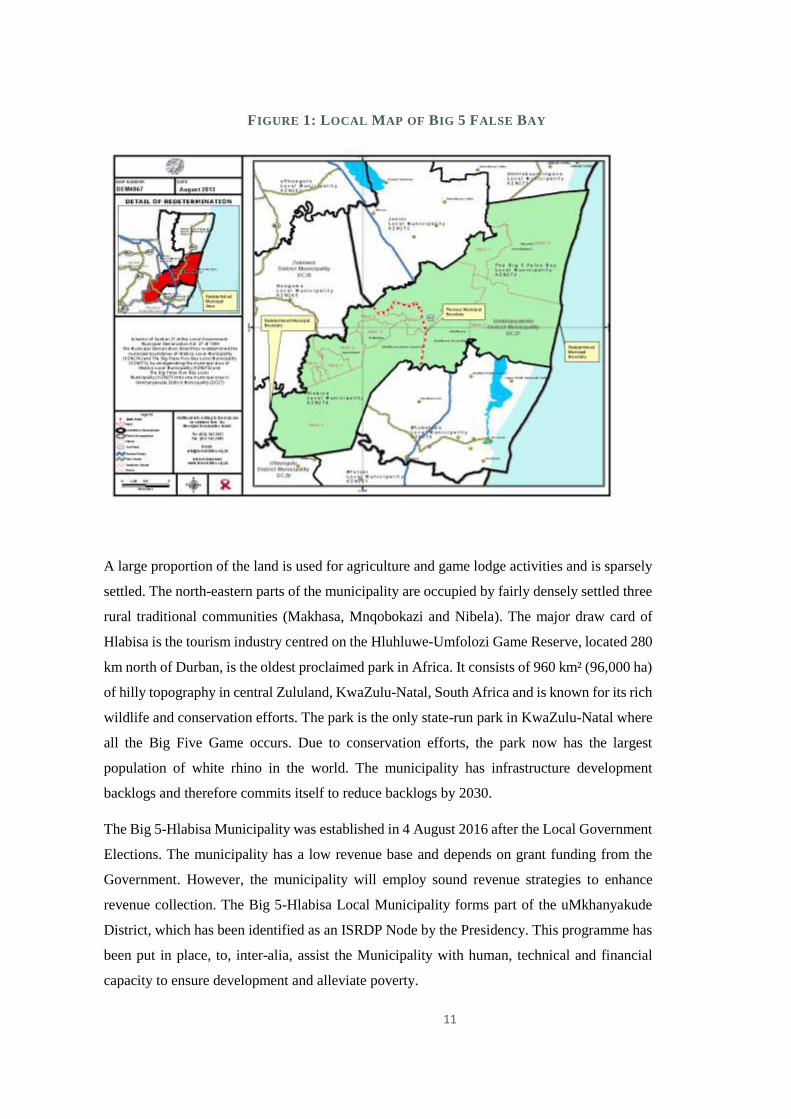
FIGURE 1: LOCAL MAP OF BIG 5 FALSE BAY
A large proportion of the land is used for agriculture and game lodge activities and is sparsely
settled. The north-eastern parts of the municipality are occupied by fairly densely settled three
rural traditional communities (Makhasa, Mnqobokazi and Nibela). The major draw card of
Hlabisa is the tourism industry centred on the Hluhluwe-Umfolozi Game Reserve, located 280
km north of Durban, is the oldest proclaimed park in Africa. It consists of 960 km² (96,000 ha)
of hilly topography in central Zululand, KwaZulu-Natal, South Africa and is known for its rich
wildlife and conservation efforts. The park is the only state-run park in KwaZulu-Natal where
all the Big Five Game occurs. Due to conservation efforts, the park now has the largest
population of white rhino in the world. The municipality has infrastructure development
backlogs and therefore commits itself to reduce backlogs by 2030.
The Big 5-Hlabisa Municipality was established in 4 August 2016 after the Local Government
Elections. The municipality has a low revenue base and depends on grant funding from the
Government. However, the municipality will employ sound revenue strategies to enhance
revenue collection. The Big 5-Hlabisa Local Municipality forms part of the uMkhanyakude
District, which has been identified as an ISRDP Node by the Presidency. This programme has
been put in place, to, inter-alia, assist the Municipality with human, technical and financial
capacity to ensure development and alleviate poverty.
12
FIGURE 2: UMKHANYAKUDE DISTRICT OVERVIEW
13
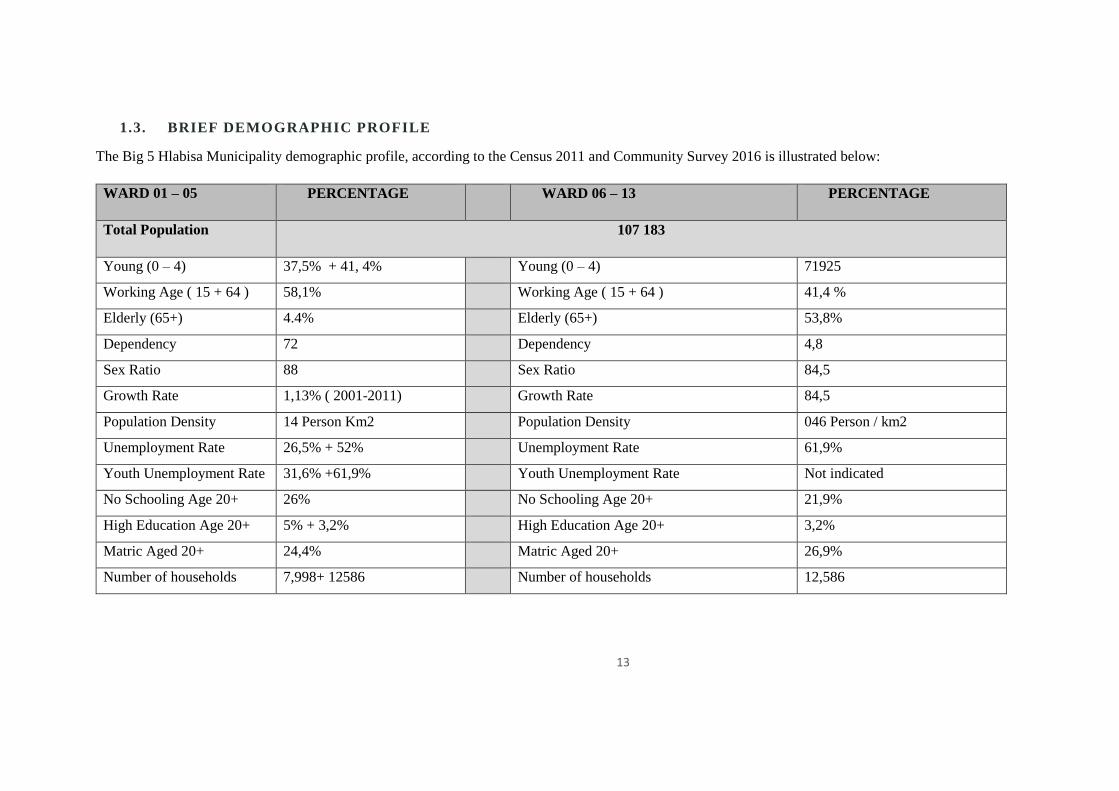
1.3. BRIEF DEMOGRAPHIC PROFILE
The Big 5 Hlabisa Municipality demographic profile, according to the Census 2011 and Community Survey 2016 is illustrated below:
WARD 01 – 05 PERCENTAGE WARD 06 – 13 PERCENTAGE
Total Population 107 183
Young (0 – 4) 37,5% + 41, 4% Young (0 – 4) 71925
Working Age ( 15 + 64 ) 58,1% Working Age ( 15 + 64 ) 41,4 %
Elderly (65+) 4.4% Elderly (65+) 53,8%
Dependency 72 Dependency 4,8
Sex Ratio 88 Sex Ratio 84,5
Growth Rate 1,13% ( 2001-2011) Growth Rate 84,5
Population Density 14 Person Km2 Population Density 046 Person / km2
Unemployment Rate 26,5% + 52% Unemployment Rate 61,9%
Youth Unemployment Rate 31,6% +61,9% Youth Unemployment Rate Not indicated
No Schooling Age 20+ 26% No Schooling Age 20+ 21,9%
High Education Age 20+ 5% + 3,2% High Education Age 20+ 3,2%
Matric Aged 20+ 24,4% Matric Aged 20+ 26,9%
Number of households 7,998+ 12586 Number of households 12,586
14
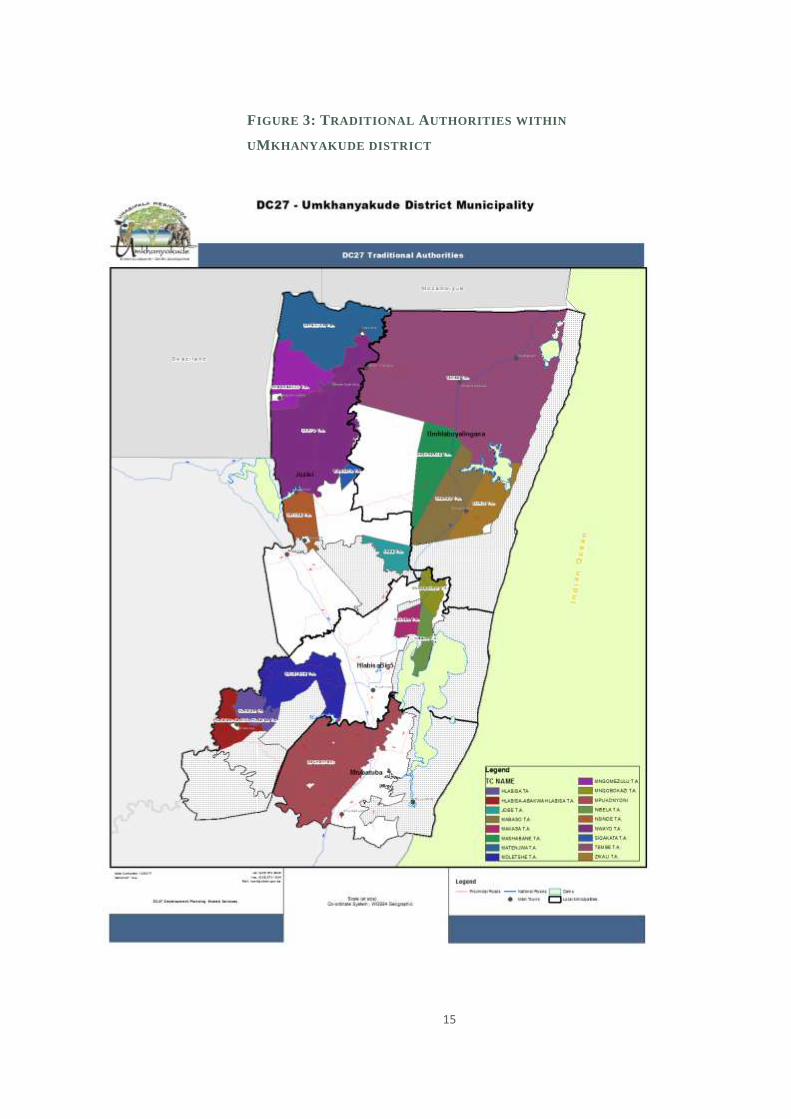
1.4. WARDS AND TRADITIONAL AUTHORITY
The Municipal area consists of 13 Wards and six Traditional areas namely Makhasa, Nibela,
Mnqobokazi, Mpembeni, Matshamnyama and Mdletsheni.
15
FIGURE 3: TRADITIONAL AUTHORITIES WITHIN
UMKHANYAKUDE DISTRICT
16
2. DEVELOPMENT OF THE 2020/2021 IDP
The development of the IDP Process Plan is guided by the Municipal Systems Act, Act 32 0f
2000. In terms of Section 25 (1) of the Act, Each Municipal Council must, within a prescribed
period after the start of its elected term, adopt a single, inclusive and strategic plan for the
development of the Municipality which:
Links, integrates and co-ordinates plans and take into account proposals for the
development of the Municipality;
Align the resources and capacity of the Municipality with the implementation of the
plan;
Forms the policy framework and general basis in which annual budgets must be
based;
Complies with the provisions of this Chapter; and
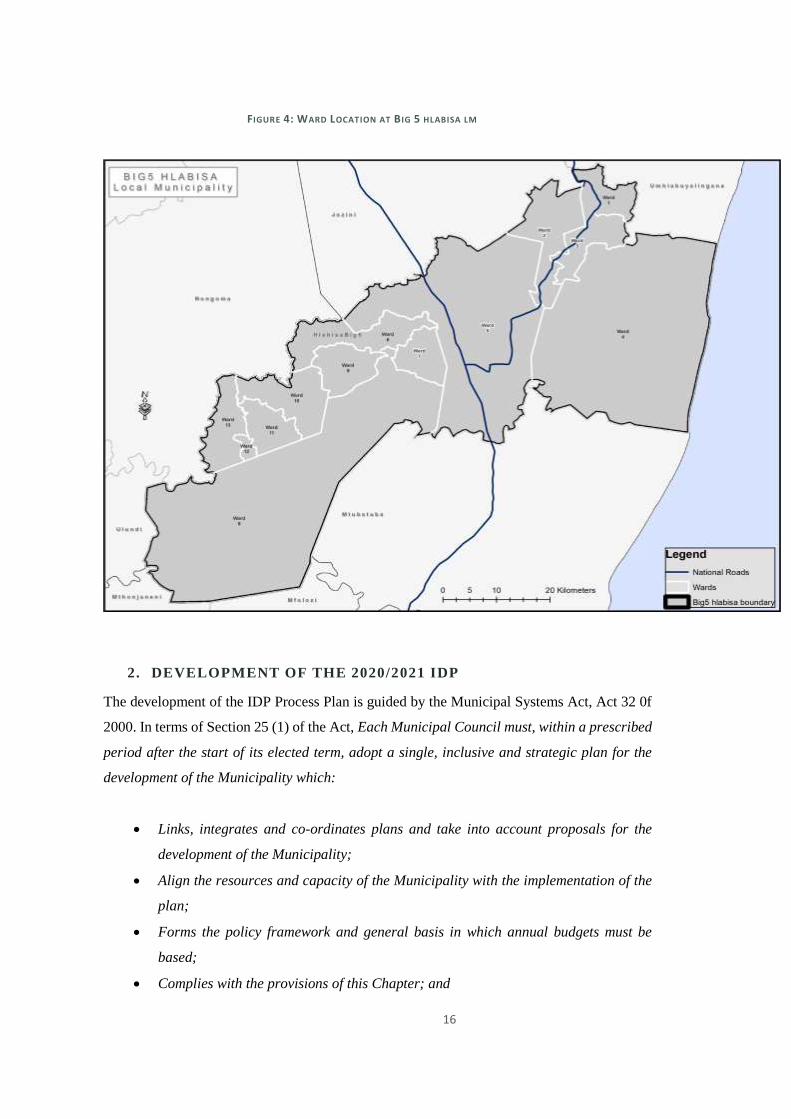
FIGURE 4: WARD LOCATION AT B IG 5 HLABISA LM
17
Is compatible with National and Provincial development plans and planning
requirements binding on the Municipality in terms of legislation.
The process of developing the IDP which was entirely driven internally. This process is the
primary responsibility of the Council, officials and other stakeholders to ensure that integrated
planning is undertaken. The Big 5 Hlabisa Council is responsible for the approval of the IDP
for the District and the responsibility cannot be delegated. Clear accountability and
management of the IDP process belongs to the Municipality and thus, should be owned and
controlled by the Municipality. Councilors, senior officials, local municipalities, sector
departments and parastatals, and civil society amongst others, have distinct roles to play during
integrated development planning processes.
The Executive Mayor is responsible for driving the whole IDP process and provides leadership
in the development and reviews of the IDP. The day-to-day management of the IDP process
has been delegated to the Office of the Municipal Manager who consistently chairs the IDP
Steering committee. The IDP Manager deals with coordination of the day-to- day issues
relating to the IDP. These include adherence to IDP Process plan, coordination of stakeholders,
support to Local municipalities and documentation of the IDP.
The senior management attends the IDP steering Committee meetings. The IDP Steering
Committee is a technical working team of dedicated senior management officials, who together
with the Municipal Manager and/or the IDP Manager must ensure a smooth compilation and
implementation of the IDP. To ensure full participation, IDP Steering Committee meetings
have been aligned with the Management Committee meeting (MANCO).
The IDP Manager compiles the IDP document through consultation with various sets of
information and directs its output to the IDP Representative Forum for debates and further
inputs and refinement of the plan. The IDP Representative Forum is the structure that provides
a platform for public participation through involvement of different community structure
representatives, political leaders, traditional leaders and government entities which provide
support throughout the planning process.
The IDP development process for 2019/20 is the fourth one during the fourth term of local
government and incorporates the main components of the District Growth and Development
Plan (DGDP) especially the status quo analysis as well as the strategies phases. In essence the
18
IDP review process captured the relevant components of the DGDP and used targets relevant
to the 5-year lifespan of the IDP.
One of the fundamental features of the integrated development planning process is the
involvement of community and stakeholder organizations in the process. Participation of
affected and interested parties is very important to ensure that the IDP addresses core issues as
experienced by the citizens of the District. As in the past, community participation was
fundamental part of the IDP process and community participation programmes should be
conducted, both in terms of monitoring the implementation of IDP, as well as the revision of
the IDP process.
The community will have an opportunity to participate in the process through the IDP Forum
which will comprise of the Mayors, all political parties and various stakeholders in the
municipality area of jurisdiction. The IDP Forum meetings will be open to the general public
and represent all stakeholders.
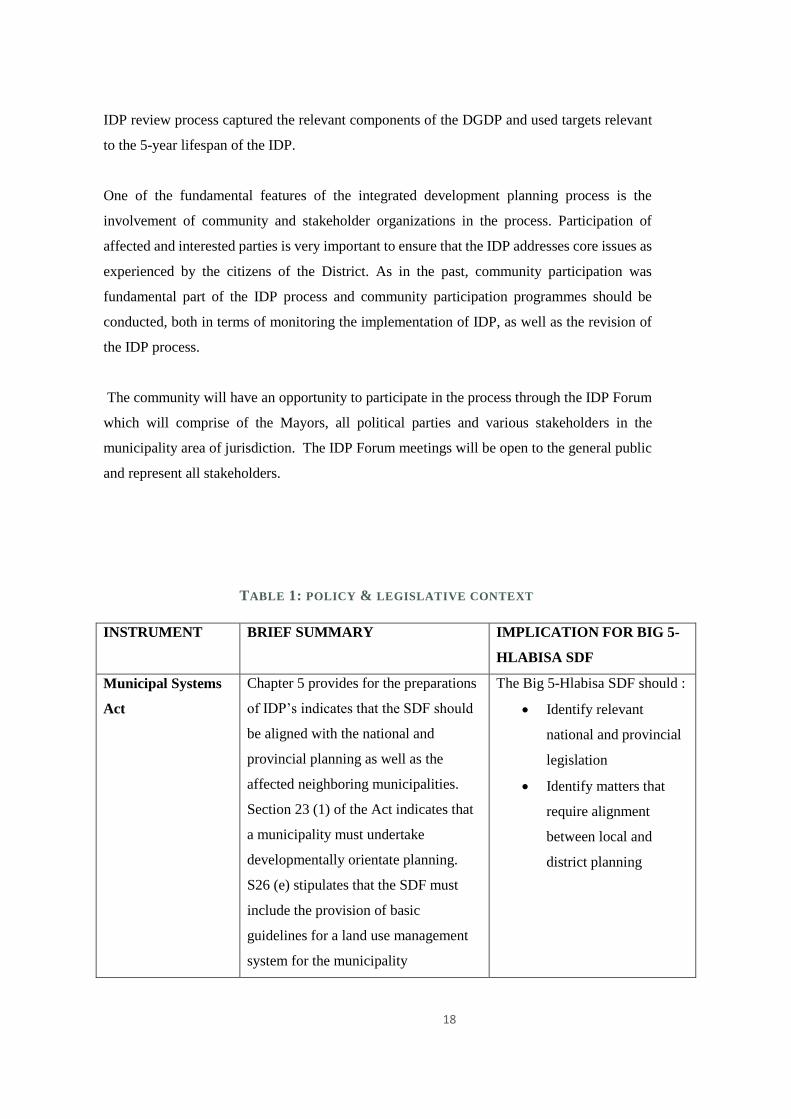
TABLE 1: POLICY & LEGISLATIVE CONTEXT
INSTRUMENT BRIEF SUMMARY IMPLICATION FOR BIG 5-
HLABISA SDF
Municipal Systems
Act
Chapter 5 provides for the preparations
of IDP’s indicates that the SDF should
be aligned with the national and
provincial planning as well as the
affected neighboring municipalities.
Section 23 (1) of the Act indicates that
a municipality must undertake
developmentally orientate planning.
S26 (e) stipulates that the SDF must
include the provision of basic
guidelines for a land use management
system for the municipality
The Big 5-Hlabisa SDF should :
Identify relevant
national and provincial
legislation
Identify matters that
require alignment
between local and
district planning
19
INSTRUMENT BRIEF SUMMARY IMPLICATION FOR BIG 5-
HLABISA SDF
S26 (e) lists an SDF as a core
component of an IDP and requires that
the SDF provides basic guidelines for a
municipal land use management.
National Spatial
Development
Perspective (NSDP)
The purpose of the plan aims to assist
in implementing the spatial priorities
that meet the constitutional imperative
of providing basic services to all and
alleviating poverty and inequality by
re-organise and the apartheid spatial
relations. It examines the spatial
dimensions of social exclusion and
inequality, recognizing the burden that
unequal and inefficient spatial
arrangements place on communities.
This plan has developed a set of
development principles which guide the
development, investment and
development decisions. The principles
identified are as follows:
Principle 1: Rapid economic
growth that is sustained and
inclusive is a pre-requisite for
the achievement of other policy
objectives, among which
poverty alleviation is key.
Principle 2: Government has a
constitutional obligation to
provide basic services to all
citizens (e.g. water, energy,
The Big 5-Hlabisa SDF should
address issues of spatial
restructuring.
The municipality
should thus focus on
identifying on sectors
and areas that require
service delivery
especially rural areas.
The Big 5 Hlabisa SDF
should aim to yield
catalytic effects.
The SDF should
identify growth nodes
which are viewed as
potential areas. It can
promote either
clustering of economic
activities in areas with
high potential for
economic development
or, where feasible.
It can promote spread
of economic benefits
which are not
dependent on clustering
20
INSTRUMENT BRIEF SUMMARY IMPLICATION FOR BIG 5-
HLABISA SDF
health and educational
facilities) wherever they reside.
Principle 3: Beyond the
constitutional obligation
identified in Principle 2 above,
government spending on fixed
investment should be focused
on localities of economic
growth and/or economic
potential in order to gear up
private-sector investment, to
stimulate sustainable economic
activities and to create long-
term employment
opportunities.
Principle 4: Efforts to address
past and current social
inequalities should focus on
people, not places. In localities
where there are both high
levels of poverty and
demonstrated economic
potential, this could include
fixed capital investment
beyond basic services to exploit
the potential of those localities.
Principle 5: In In order to
overcome the spatial distortions
of apartheid, future settlement
and economic development
within the areas of the
municipality where
relatively low economic
potential exists by
identifying potential
and suitable activities
for those parts.
21
INSTRUMENT BRIEF SUMMARY IMPLICATION FOR BIG 5-
HLABISA SDF
opportunities should be
channeled into activity
corridors and nodes that are
adjacent to or that link the main
growth centers
These guidelines are regarded or
recognized as critical tools for bringing
about coordinated government action
and alignment to meet social, economic
and environmental objectives.
Provincial Growth
Development
Strategy (PGDS)
The PGDS aims to build this gateway
by growing the economy for the
development and the improvement of
the quality of life of all people living in
the Province. Whilst the Provincial
Government of KZN is leading this
process, its success depends on strong
compacts with labour, civil society and
business. Thus it is critical that all
stakeholders be synchronized in the
single-minded pursuit of shifting
KZN’s growth path towards shared
growth and integrated, sustainable
development. The strategy indicated
strategic goals to be achieved for the
province (See the Strategic Framework
)
The adopted vision for the province
reads as follows:
The “By 2030 KwaZulu-Natal will be
a prosperous Province with a
healthy, secure and skilled
The Big 5 Hlabisa should make
use of the PGDS informant’s
maps and data available.
The PGDS has made
use of the Provincial
SDF, therefore the Big 5
Hlabisa SDF output
should provide similar
framework at a local
scale for public and
private sector
investment by
highlighting areas of
development
opportunity.
In that sense, the
developed SDF will
structure and develop a
sensible development
that works towards a
common goal and
22
INSTRUMENT BRIEF SUMMARY IMPLICATION FOR BIG 5-
HLABISA SDF
population, acting as a gateway to
Africa and the World”
The purpose of the PGDS in KwaZulu-
Natal is to:
Be the primary growth and
development strategy for
KwaZulu-Natal to 2030;
Mobilise and synchronise
strategic plans and investment
priorities in all spheres of
government, state owned
entities, business, higher
education institutions, labour,
civil society and all other social
partners in order to achieve the
desired growth and
development goals, objectives
and outcomes;
Spatially contextualize and
prioritise interventions so as to
achieve greater spatial equity;
Develop clearly defined
institutional arrangements that
ensure decisive leadership,
robust management, thorough
implementation and on-going
review of the growth and
development plan.
ensure that development
on local level does not
take place in an ad hoc
silo on its own.
It also should address
key issues of
implementation
blockages whilst
providing strategic
direction.
It should provide a
constructive vision
formulated by relevant
stakeholders and the
community in order to
achieve
It should identify
development corridors
and nodes aligned with
the PGDS and PSEDS
development corridors
and activity nodes.
It should address
development issues
found in the
municipality and
achieve objectives as
23
INSTRUMENT BRIEF SUMMARY IMPLICATION FOR BIG 5-
HLABISA SDF
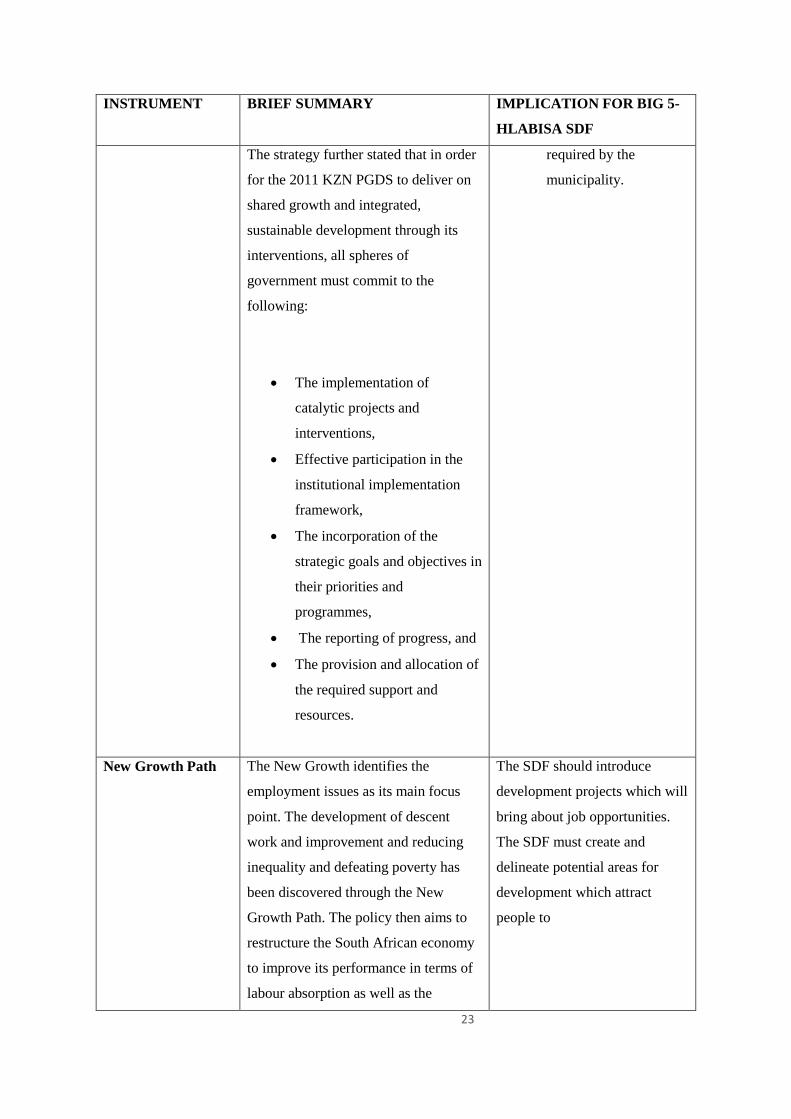
The strategy further stated that in order
for the 2011 KZN PGDS to deliver on
shared growth and integrated,
sustainable development through its
interventions, all spheres of
government must commit to the
following:
The implementation of
catalytic projects and
interventions,
Effective participation in the
institutional implementation
framework,
The incorporation of the
strategic goals and objectives in
their priorities and
programmes,
The reporting of progress, and
The provision and allocation of
the required support and
resources.
required by the
municipality.
New Growth Path
The New Growth identifies the
employment issues as its main focus
point. The development of descent
work and improvement and reducing
inequality and defeating poverty has
been discovered through the New
Growth Path. The policy then aims to
restructure the South African economy
to improve its performance in terms of
labour absorption as well as the
The SDF should introduce
development projects which will
bring about job opportunities.
The SDF must create and
delineate potential areas for
development which attract
people to
24
INSTRUMENT BRIEF SUMMARY IMPLICATION FOR BIG 5-
HLABISA SDF
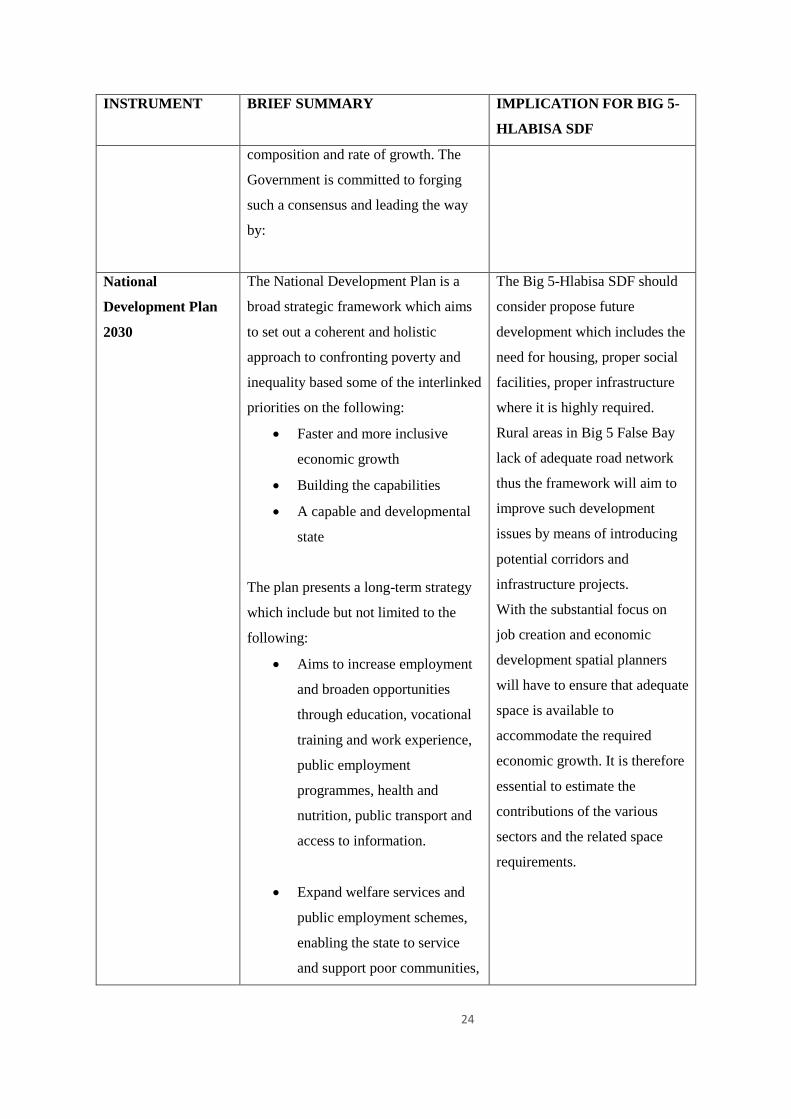
composition and rate of growth. The
Government is committed to forging
such a consensus and leading the way
by:
National
Development Plan
2030
The National Development Plan is a
broad strategic framework which aims
to set out a coherent and holistic
approach to confronting poverty and
inequality based some of the interlinked
priorities on the following:
Faster and more inclusive
economic growth
Building the capabilities
A capable and developmental
state
The plan presents a long-term strategy
which include but not limited to the
following:
Aims to increase employment
and broaden opportunities
through education, vocational
training and work experience,
public employment
programmes, health and
nutrition, public transport and
access to information.
Expand welfare services and
public employment schemes,
enabling the state to service
and support poor communities,
The Big 5-Hlabisa SDF should
consider propose future
development which includes the
need for housing, proper social
facilities, proper infrastructure
where it is highly required.
Rural areas in Big 5 False Bay
lack of adequate road network
thus the framework will aim to
improve such development
issues by means of introducing
potential corridors and
infrastructure projects.
With the substantial focus on
job creation and economic
development spatial planners
will have to ensure that adequate
space is available to
accommodate the required
economic growth. It is therefore
essential to estimate the
contributions of the various
sectors and the related space
requirements.
25
INSTRUMENT BRIEF SUMMARY IMPLICATION FOR BIG 5-
HLABISA SDF
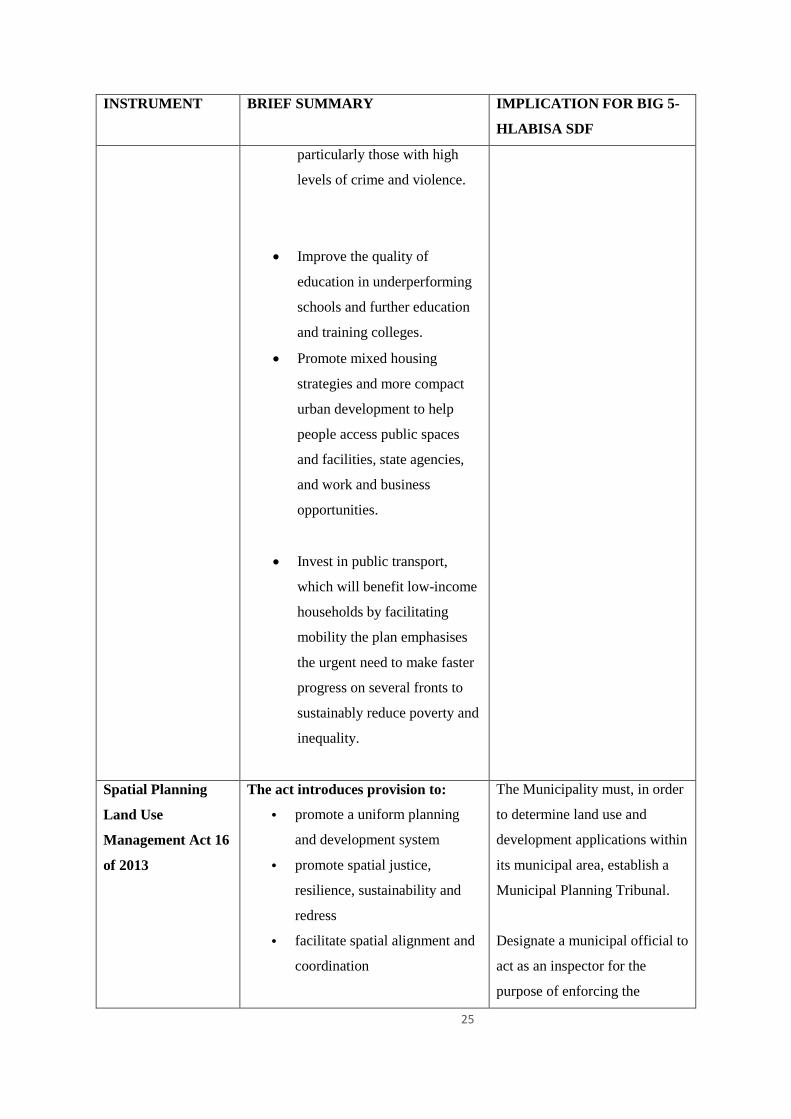
particularly those with high
levels of crime and violence.
Improve the quality of
education in underperforming
schools and further education
and training colleges.
Promote mixed housing
strategies and more compact
urban development to help
people access public spaces
and facilities, state agencies,
and work and business
opportunities.
Invest in public transport,
which will benefit low-income
households by facilitating
mobility the plan emphasises
the urgent need to make faster
progress on several fronts to
sustainably reduce poverty and
inequality.
Spatial Planning
Land Use
Management Act 16
of 2013
The act introduces provision to:
• promote a uniform planning
and development system
• promote spatial justice,
resilience, sustainability and
redress
• facilitate spatial alignment and
coordination
The Municipality must, in order
to determine land use and
development applications within
its municipal area, establish a
Municipal Planning Tribunal.
Designate a municipal official to
act as an inspector for the
purpose of enforcing the
26
INSTRUMENT BRIEF SUMMARY IMPLICATION FOR BIG 5-
HLABISA SDF
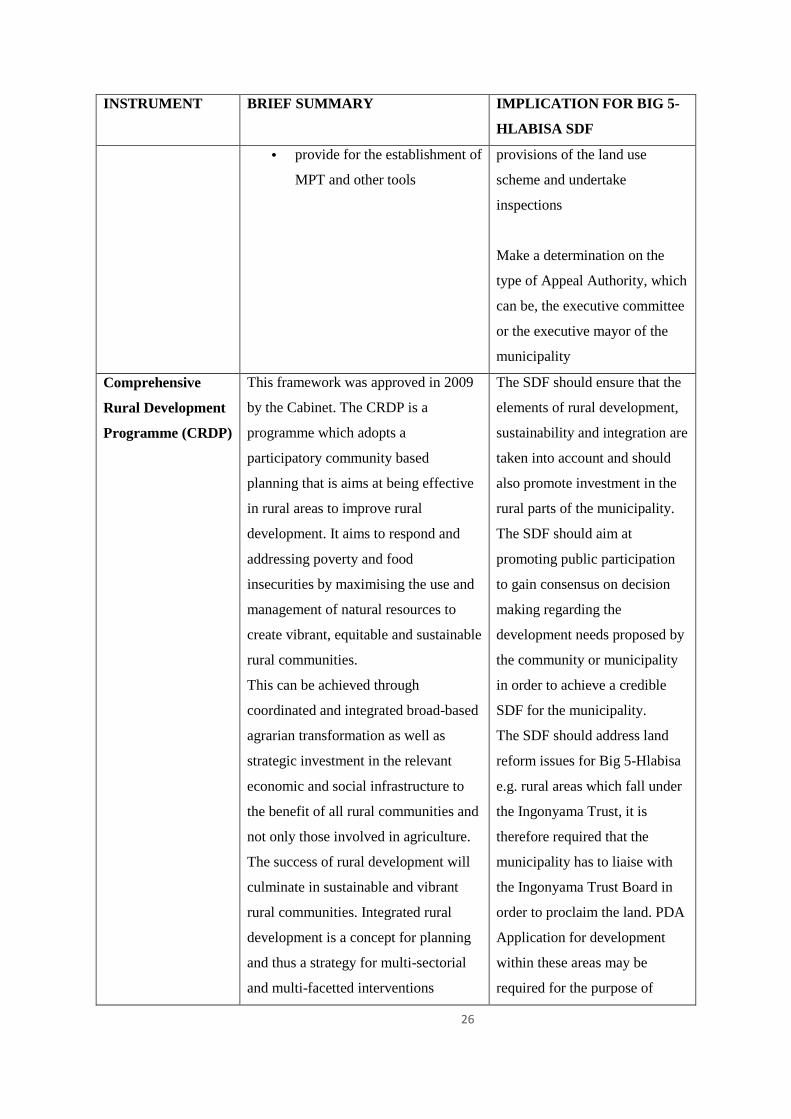
• provide for the establishment of
MPT and other tools
provisions of the land use
scheme and undertake
inspections
Make a determination on the
type of Appeal Authority, which
can be, the executive committee
or the executive mayor of the
municipality
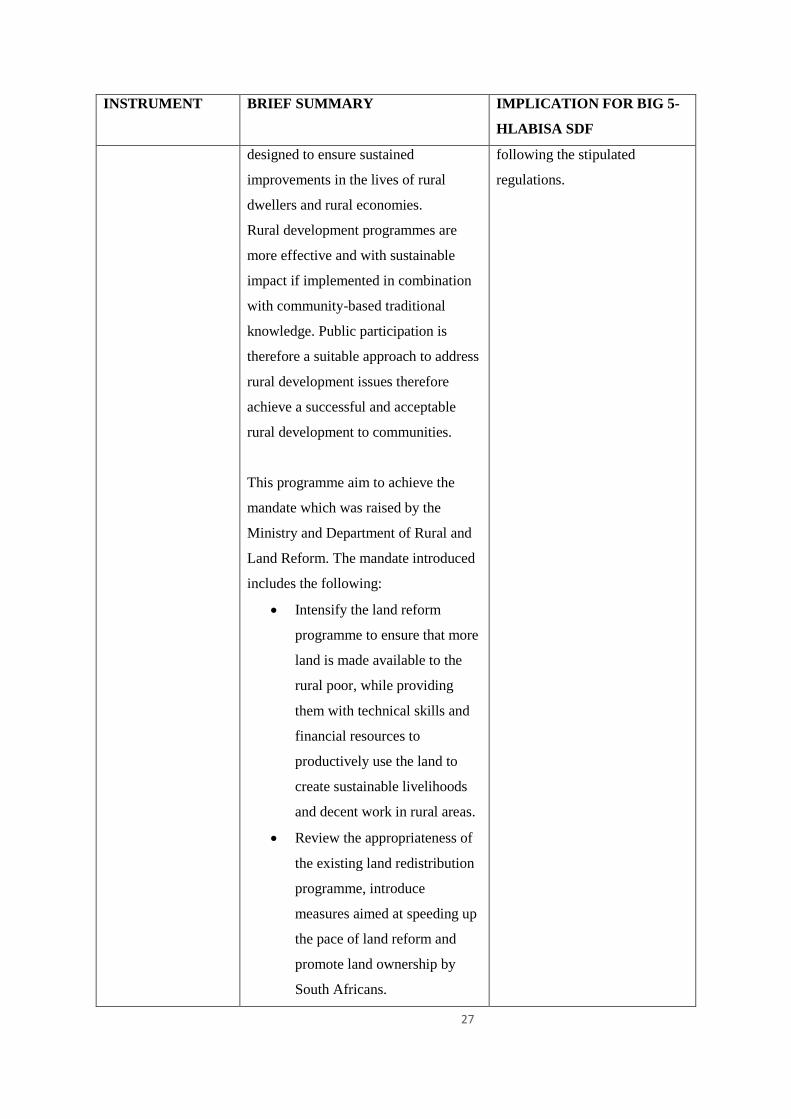
Comprehensive
Rural Development
Programme (CRDP)
This framework was approved in 2009
by the Cabinet. The CRDP is a
programme which adopts a
participatory community based
planning that is aims at being effective
in rural areas to improve rural
development. It aims to respond and
addressing poverty and food
insecurities by maximising the use and
management of natural resources to
create vibrant, equitable and sustainable
rural communities.
This can be achieved through
coordinated and integrated broad-based
agrarian transformation as well as
strategic investment in the relevant
economic and social infrastructure to
the benefit of all rural communities and
not only those involved in agriculture.
The success of rural development will
culminate in sustainable and vibrant
rural communities. Integrated rural
development is a concept for planning
and thus a strategy for multi-sectorial
and multi-facetted interventions
The SDF should ensure that the
elements of rural development,
sustainability and integration are
taken into account and should
also promote investment in the
rural parts of the municipality.
The SDF should aim at
promoting public participation
to gain consensus on decision
making regarding the
development needs proposed by
the community or municipality
in order to achieve a credible
SDF for the municipality.
The SDF should address land
reform issues for Big 5-Hlabisa
e.g. rural areas which fall under
the Ingonyama Trust, it is
therefore required that the
municipality has to liaise with
the Ingonyama Trust Board in
order to proclaim the land. PDA
Application for development
within these areas may be
required for the purpose of
27
INSTRUMENT BRIEF SUMMARY IMPLICATION FOR BIG 5-
HLABISA SDF
designed to ensure sustained
improvements in the lives of rural
dwellers and rural economies.
Rural development programmes are
more effective and with sustainable
impact if implemented in combination
with community-based traditional
knowledge. Public participation is
therefore a suitable approach to address
rural development issues therefore
achieve a successful and acceptable
rural development to communities.
This programme aim to achieve the
mandate which was raised by the
Ministry and Department of Rural and
Land Reform. The mandate introduced
includes the following:
Intensify the land reform
programme to ensure that more
land is made available to the
rural poor, while providing
them with technical skills and
financial resources to
productively use the land to
create sustainable livelihoods
and decent work in rural areas.
Review the appropriateness of
the existing land redistribution
programme, introduce
measures aimed at speeding up
the pace of land reform and
promote land ownership by
South Africans.
following the stipulated
regulations.
28
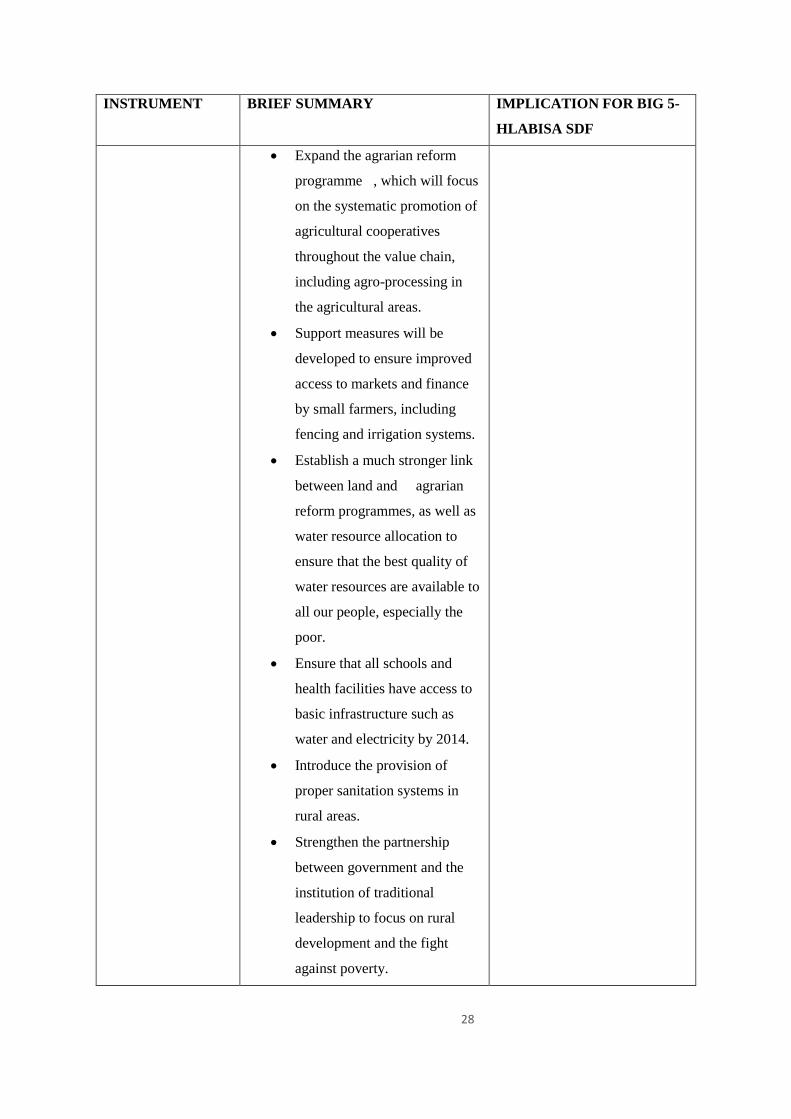
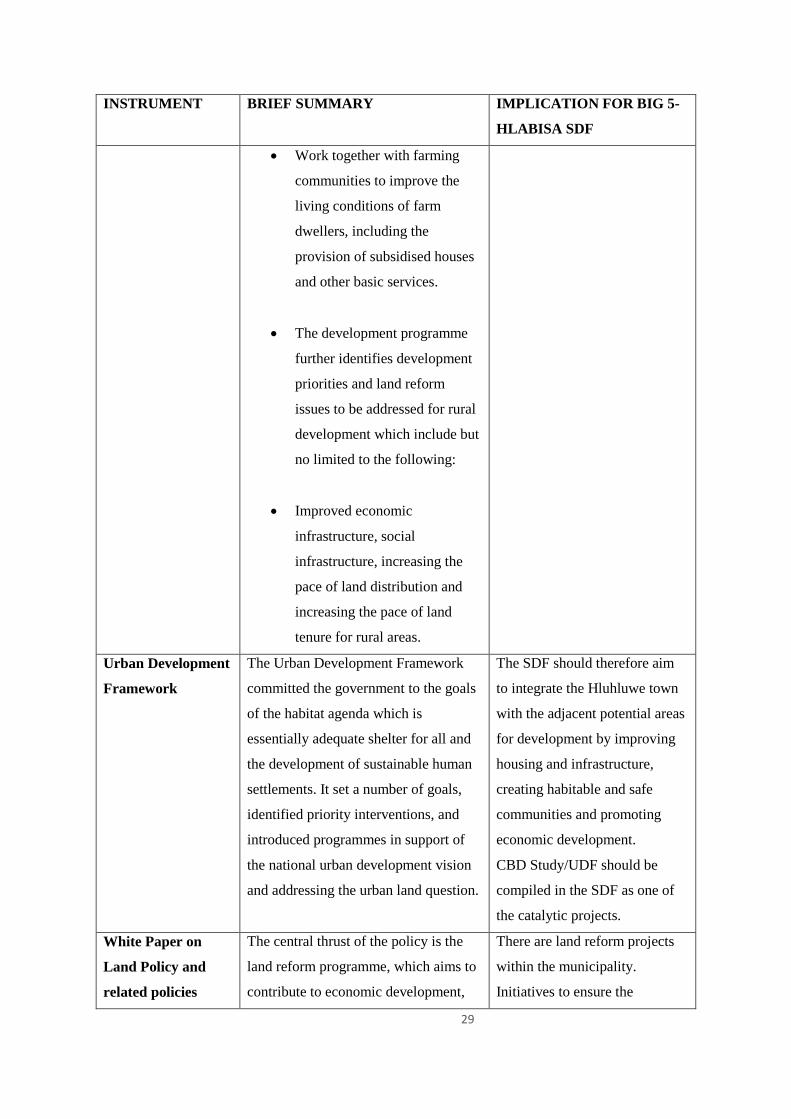
INSTRUMENT BRIEF SUMMARY IMPLICATION FOR BIG 5-
HLABISA SDF
Expand the agrarian reform
programme , which will focus
on the systematic promotion of
agricultural cooperatives
throughout the value chain,
including agro-processing in
the agricultural areas.
Support measures will be
developed to ensure improved
access to markets and finance
by small farmers, including
fencing and irrigation systems.
Establish a much stronger link
between land and agrarian
reform programmes, as well as
water resource allocation to
ensure that the best quality of
water resources are available to
all our people, especially the
poor.
Ensure that all schools and
health facilities have access to
basic infrastructure such as
water and electricity by 2014.
Introduce the provision of
proper sanitation systems in
rural areas.
Strengthen the partnership
between government and the
institution of traditional
leadership to focus on rural
development and the fight
against poverty.
29
INSTRUMENT BRIEF SUMMARY IMPLICATION FOR BIG 5-
HLABISA SDF
Work together with farming
communities to improve the
living conditions of farm
dwellers, including the
provision of subsidised houses
and other basic services.
The development programme
further identifies development
priorities and land reform
issues to be addressed for rural
development which include but
no limited to the following:
Improved economic
infrastructure, social
infrastructure, increasing the
pace of land distribution and
increasing the pace of land
tenure for rural areas.
Urban Development
Framework
The Urban Development Framework
committed the government to the goals
of the habitat agenda which is
essentially adequate shelter for all and
the development of sustainable human
settlements. It set a number of goals,
identified priority interventions, and
introduced programmes in support of
the national urban development vision
and addressing the urban land question.
The SDF should therefore aim
to integrate the Hluhluwe town
with the adjacent potential areas
for development by improving
housing and infrastructure,
creating habitable and safe
communities and promoting
economic development.
CBD Study/UDF should be
compiled in the SDF as one of
the catalytic projects.
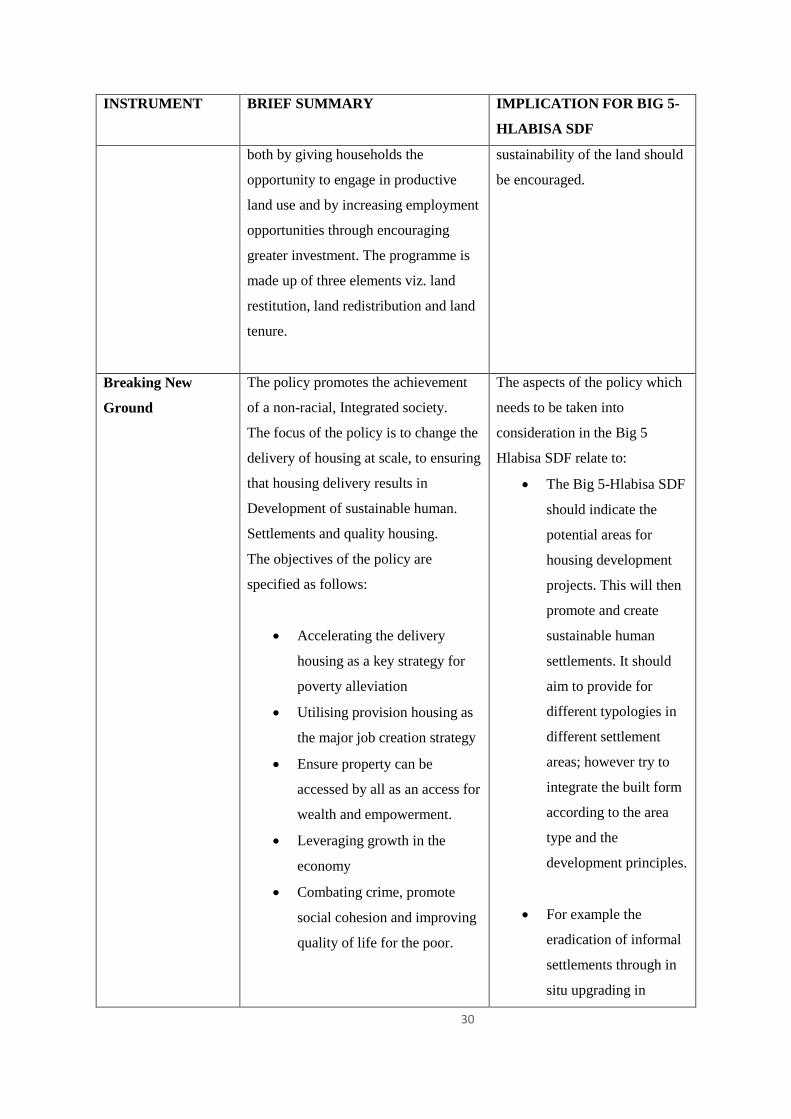
White Paper on
Land Policy and
related policies
The central thrust of the policy is the
land reform programme, which aims to
contribute to economic development,
There are land reform projects
within the municipality.
Initiatives to ensure the
30
INSTRUMENT BRIEF SUMMARY IMPLICATION FOR BIG 5-
HLABISA SDF
both by giving households the
opportunity to engage in productive
land use and by increasing employment
opportunities through encouraging
greater investment. The programme is
made up of three elements viz. land
restitution, land redistribution and land
tenure.
sustainability of the land should
be encouraged.
Breaking New
Ground
The policy promotes the achievement
of a non-racial, Integrated society.
The focus of the policy is to change the
delivery of housing at scale, to ensuring
that housing delivery results in
Development of sustainable human.
Settlements and quality housing.
The objectives of the policy are
specified as follows:
Accelerating the delivery
housing as a key strategy for
poverty alleviation
Utilising provision housing as
the major job creation strategy
Ensure property can be
accessed by all as an access for
wealth and empowerment.
Leveraging growth in the
economy
Combating crime, promote
social cohesion and improving
quality of life for the poor.
The aspects of the policy which
needs to be taken into
consideration in the Big 5
Hlabisa SDF relate to:
The Big 5-Hlabisa SDF
should indicate the
potential areas for
housing development
projects. This will then
promote and create
sustainable human
settlements. It should
aim to provide for
different typologies in
different settlement
areas; however try to
integrate the built form
according to the area
type and the
development principles.
For example the
eradication of informal
settlements through in
situ upgrading in
31
INSTRUMENT BRIEF SUMMARY IMPLICATION FOR BIG 5-
HLABISA SDF
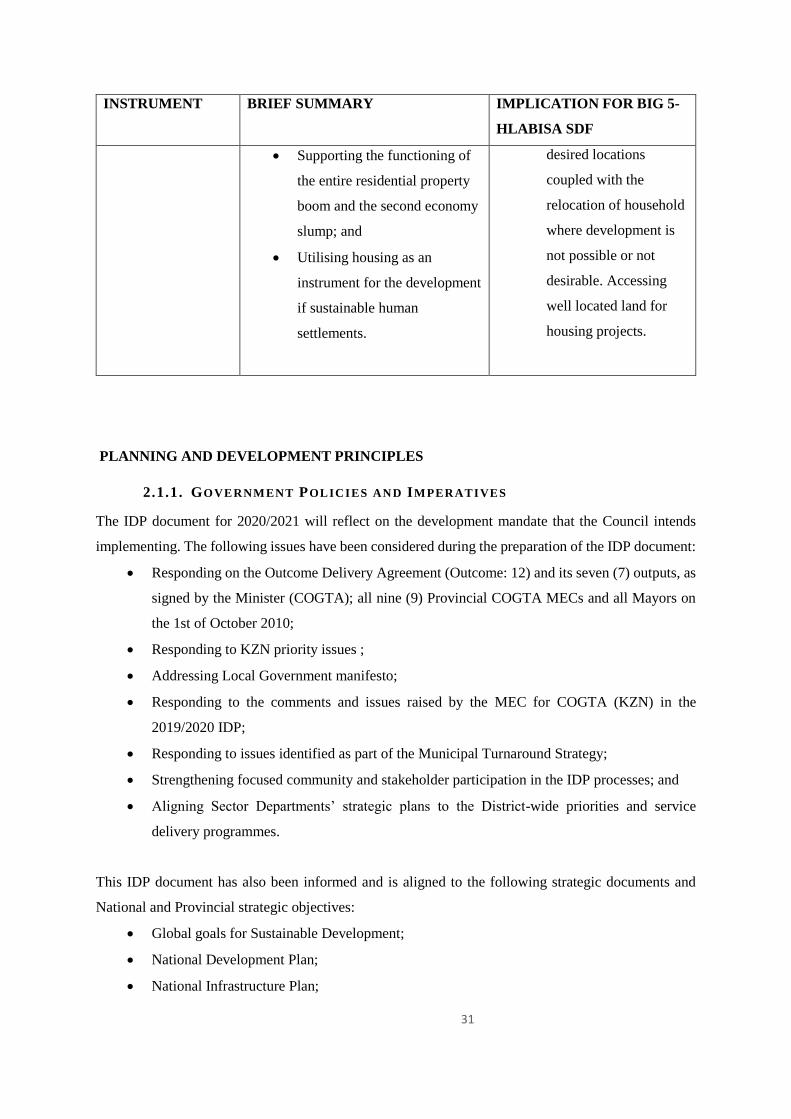
Supporting the functioning of
the entire residential property
boom and the second economy
slump; and
Utilising housing as an
instrument for the development
if sustainable human
settlements.
desired locations
coupled with the
relocation of household
where development is
not possible or not
desirable. Accessing
well located land for
housing projects.
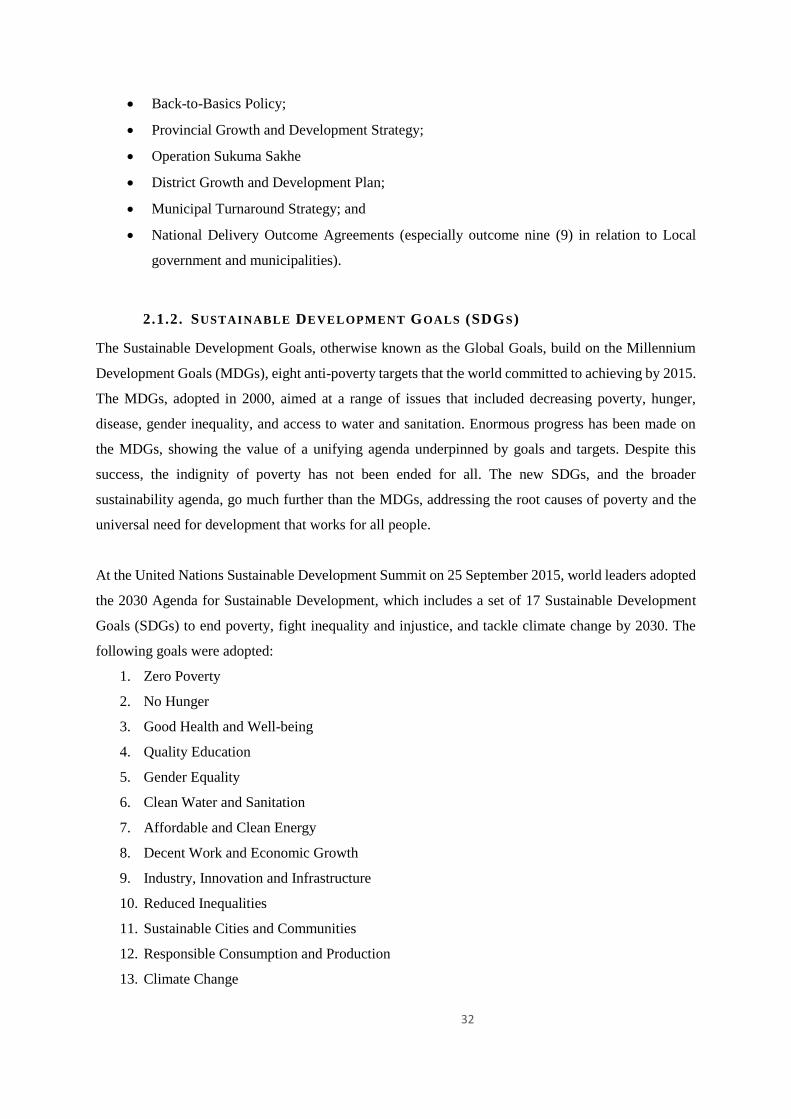
PLANNING AND DEVELOPMENT PRINCIPLES
2.1.1. GOVERNMENT POLICIES AND IMPERATIVES
The IDP document for 2020/2021 will reflect on the development mandate that the Council intends
implementing. The following issues have been considered during the preparation of the IDP document:
Responding on the Outcome Delivery Agreement (Outcome: 12) and its seven (7) outputs, as
signed by the Minister (COGTA); all nine (9) Provincial COGTA MECs and all Mayors on
the 1st of October 2010;
Responding to KZN priority issues ;
Addressing Local Government manifesto;
Responding to the comments and issues raised by the MEC for COGTA (KZN) in the
2019/2020 IDP;
Responding to issues identified as part of the Municipal Turnaround Strategy;
Strengthening focused community and stakeholder participation in the IDP processes; and
Aligning Sector Departments’ strategic plans to the District-wide priorities and service
delivery programmes.
This IDP document has also been informed and is aligned to the following strategic documents and
National and Provincial strategic objectives:
Global goals for Sustainable Development;
National Development Plan;
National Infrastructure Plan;
32
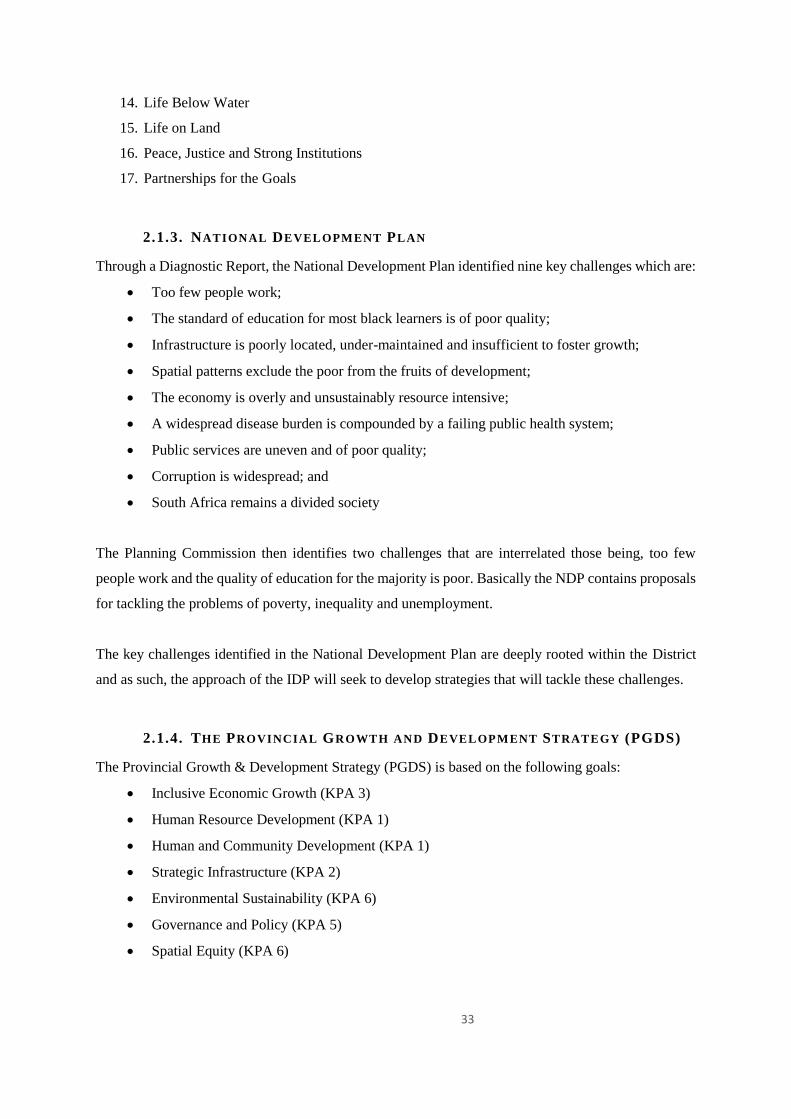
Back-to-Basics Policy;
Provincial Growth and Development Strategy;
Operation Sukuma Sakhe
District Growth and Development Plan;
Municipal Turnaround Strategy; and
National Delivery Outcome Agreements (especially outcome nine (9) in relation to Local
government and municipalities).
2.1.2. SUSTAINABLE DEVELOPMENT GOALS (SDGS)
The Sustainable Development Goals, otherwise known as the Global Goals, build on the Millennium
Development Goals (MDGs), eight anti-poverty targets that the world committed to achieving by 2015.
The MDGs, adopted in 2000, aimed at a range of issues that included decreasing poverty, hunger,
disease, gender inequality, and access to water and sanitation. Enormous progress has been made on
the MDGs, showing the value of a unifying agenda underpinned by goals and targets. Despite this
success, the indignity of poverty has not been ended for all. The new SDGs, and the broader
sustainability agenda, go much further than the MDGs, addressing the root causes of poverty and the
universal need for development that works for all people.
At the United Nations Sustainable Development Summit on 25 September 2015, world leaders adopted
the 2030 Agenda for Sustainable Development, which includes a set of 17 Sustainable Development
Goals (SDGs) to end poverty, fight inequality and injustice, and tackle climate change by 2030. The
following goals were adopted:
1. Zero Poverty
2. No Hunger
3. Good Health and Well-being
4. Quality Education
5. Gender Equality
6. Clean Water and Sanitation
7. Affordable and Clean Energy
8. Decent Work and Economic Growth
9. Industry, Innovation and Infrastructure
10. Reduced Inequalities
11. Sustainable Cities and Communities
12. Responsible Consumption and Production
13. Climate Change
33
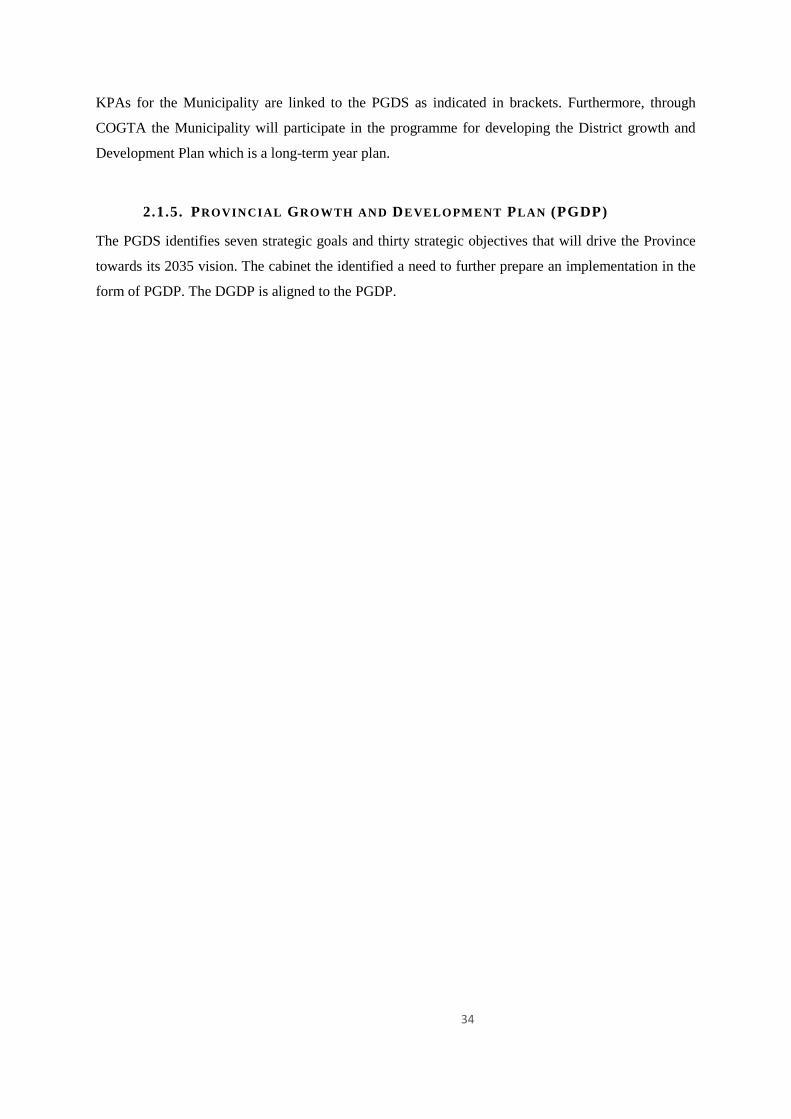
14. Life Below Water
15. Life on Land
16. Peace, Justice and Strong Institutions
17. Partnerships for the Goals
2.1.3. NATIONAL DEVELOPMENT PLAN
Through a Diagnostic Report, the National Development Plan identified nine key challenges which are:
Too few people work;
The standard of education for most black learners is of poor quality;
Infrastructure is poorly located, under-maintained and insufficient to foster growth;
Spatial patterns exclude the poor from the fruits of development;
The economy is overly and unsustainably resource intensive;
A widespread disease burden is compounded by a failing public health system;
Public services are uneven and of poor quality;
Corruption is widespread; and
South Africa remains a divided society
The Planning Commission then identifies two challenges that are interrelated those being, too few
people work and the quality of education for the majority is poor. Basically the NDP contains proposals
for tackling the problems of poverty, inequality and unemployment.
The key challenges identified in the National Development Plan are deeply rooted within the District
and as such, the approach of the IDP will seek to develop strategies that will tackle these challenges.
2.1.4. THE PROVINCIAL GROWTH AND DEVELOPMENT STRATEGY (PGDS)
The Provincial Growth & Development Strategy (PGDS) is based on the following goals:
Inclusive Economic Growth (KPA 3)
Human Resource Development (KPA 1)
Human and Community Development (KPA 1)
Strategic Infrastructure (KPA 2)
Environmental Sustainability (KPA 6)
Governance and Policy (KPA 5)
Spatial Equity (KPA 6)
34
KPAs for the Municipality are linked to the PGDS as indicated in brackets. Furthermore, through
COGTA the Municipality will participate in the programme for developing the District growth and
Development Plan which is a long-term year plan.
2.1.5. PROVINCIAL GROWTH AND DEVELOPMENT PLAN (PGDP)
The PGDS identifies seven strategic goals and thirty strategic objectives that will drive the Province
towards its 2035 vision. The cabinet the identified a need to further prepare an implementation in the
form of PGDP. The DGDP is aligned to the PGDP.
35
2.1.6. DISTRICT GROWTH AND DEVELOPMENT PLAN
The District Growth and Development Plan is meant to play a key role in the integration and alignment
of the intentions of the NDP at national level and PGDP at provincial level on the one hand, with the
activities of local government operating at the coalface of implementation and interaction with
constituent communities on the other.
The aim of the DGDP is therefore to translate the Provincial Growth and Development Plan into a
detailed implementation plan at a district level, inclusive of clearly defined targets and responsibilities
thus enabling the province to measure its progress in achieving the accepted growth and development
goals. In addition to the more detailed focus on the interventions identified by the PGDS-PGDP, the
DGDP is expected to propose specific milestones that will have to be achieved per priority sectors. This
will be refined in a collaborative approach with all the relevant stakeholders to ensure ownership of
targets that will be set for specific time horizons.
The KwaZulu-Natal Provincial Planning Commission facilitates and supports the lead departments to
develop detailed trajectories to ensure that the roadmap is clear on what is required to achieve the 2030
Vision for KwaZulu-Natal. The current DGDP has been reviewed.
2.1.7. THE BACK TO BASICS
President of the Republic of South Africa jointly with Minister: COGTA held Local Government
Summit on the 18th of September 2014 with all municipalities countrywide in Gauteng Province. The
Back to Basics Programme is all about fulfillment of municipalities on their constitutional mandate i.e.
Putting People / Community first for their lives to change for the better. Back to Basic Programme in
the IDP and ensure that service delivery key performance indicator are included in the SDBIP.
Five (5) key pillars of Back to Basics Programme identified as follows:
THE IMPORTANT BACK TO BASICS PILLARS.
The B2B Program is divided into five pillars.
1. PUTTING PEOPLE FIRST.
This pillar is focused on the involvement of the Public in Municipal Affairs as required by Municipal
Systems Act 32 of 2000, Section 16 Chapter 4. It allows the Municipality to monitor the functioning of
Ward Committees and the impact of community feedback meetings held by ward councillors with the
intention of information sharing and evaluating the progress made in their request to be developed
accordingly.
36
2. SERVICE DELIVERY.
This pillar focuses on all issues related to the service of the people. The manner in which the
Municipality delivers the service and the level thereof is taken into account. The services ranges from
waste collection, water and sanitation, road and maintenance to mansion a few. This pillar calculates
the percentage in which these services are rendered and seek for reason as why it’s not satisfactory.
3. GOOD GOVERNANCE.
This Pillar looks at all Council and its committees, the manner in which they honour their scheduled
meetings. It also looks at the functioning of the MPAC and the Audit Committee. This pillar paints a
picture the Municipal stability and the functioning of the Oversight.
4. Sound Financial Management.
The good sound financial management of the Municipality is based on the information provided on this
pillar. The accuracy of the figures and percentages of amount spent and received makes contributes to
the call of clean audit. The monitoring of the expenditure and the income is done based on this pillar.
5. BUILDING CAPABLE LOCAL GOVERNMENT INSTITUTIONS.
This pillar is concerned with the quality of officials in the Municipality, it focuses on the employment
and the vacancy rate in the Municipality. The kind of training the employees undergo and the amount
spent on such programs. It also addresses the issues of overstaffing comparing it with the relevant
benchmark.
2.1.8 STATE OF THE NATION ADDRESS (SONA) – 2020
President Cyril Ramaphosa delivered the State of the Nation Address on 13 February 2020 at 7 pm
before a joint sitting of the two houses of Parliament. The President took the nation into his confidence
on the way forward, set the tone on critical matters and reported back to South Africans on the progress
since his last address in June last year. The President mentioned that when we are united in peace and
faith, we can conquer all obstacles and turn our country into a place in which we all feel free, safe and
comfortable.
He further argues that, the reality of a youthful population that has more access to education than ever
before and which is achieving steadily improving outcomes. It is the reality of 2.4 million children in
37
Early Childhood Development (ECD) and pre-school. It is about the 81% of learners who passed matric
last year, with an increasing proportion coming from rural and township schools. Even if we were to
marshal every single resource at our disposal, and engage on a huge expenditure of public funds, we
would not alone be able to guarantee employment to the millions of people who are out of work.
Through the Jobs Summit, we brought labour, business, government and communities together to find
solutions to the unemployment crisis, and we continue to meet at the beginning of every month, the
Deputy President and myself, to remove blockages and drive interventions that will save and create
jobs.
Together, over these last two years, we have worked to stabilise our economy and build a foundation
for growth. We have been deliberate in rebuilding institutions and removing impediments to investment.
The social partners – trade unions, business, community-based organisations and government – are
committed to mobilising funding to address Eskom’s financial crisis in a financially sustainable manner.
We will be undertaking far-reaching economic reform measures that we will include those contained in
the paper produced by The National Treasury, entitled Economic Transformation, Inclusive Growth
and Competitiveness. In the previous SONA, I said that is a critical area of investment that supports
structural transformation, growth and job creation. The Infrastructure Fund implementation team has
finalised the list of shovel-ready projects and has begun work to expand private investment into public
infrastructure sectors with revenue stream.
2.1.9. STATE OF THE PROVINCE ADDRESS (SOPA) – 2020
In his SOPA the Premier reconfirmed the provincial’s commitment to eight (8) key national Priorities.
Basic services (especially access to clean potable water)
Job creation
Growing the economy
Growing SMMEs and cooperatives
Education, health, and skills development
Human settlements and sustainable livelihoods
Building a peaceful province
Building a caring and incorruptible government.

38
The Premier further declared that State of the Province Address Is about reporting to the people of
KwaZulu-Natal on the progress that we are making on our priorities, to state our challenges, and most
importantly to mobilise all the people of this province to play their own part to move our province
forward.
SECTION C: SITUATIONAL ANALYSIS
DEMOGRAPHIC CHARECTERESTICS
i . DEMOGRAPHIC INDICATORS
This section reflects the demographic characteristics of Big 5 Hlabisa Municipality area. This will cover
qualitative where possible quantitative summary of demographic variable and social infrastructure of
the area. The population figures and projections used are based on Statistics South Africa, Census 1996,
2001 and 2011 and Community Survey 2016
The municipality has not commissioned any studies or surveys to assist with the situational analysis
(commonly referred to as backlog studies) due to financial and capacity constraints. Embarking upon
the analysis process for Big 5-Hlabisa Municipality has required widespread research into the most
reliable sources of data to use.
i i . POPULATION BY SIZE
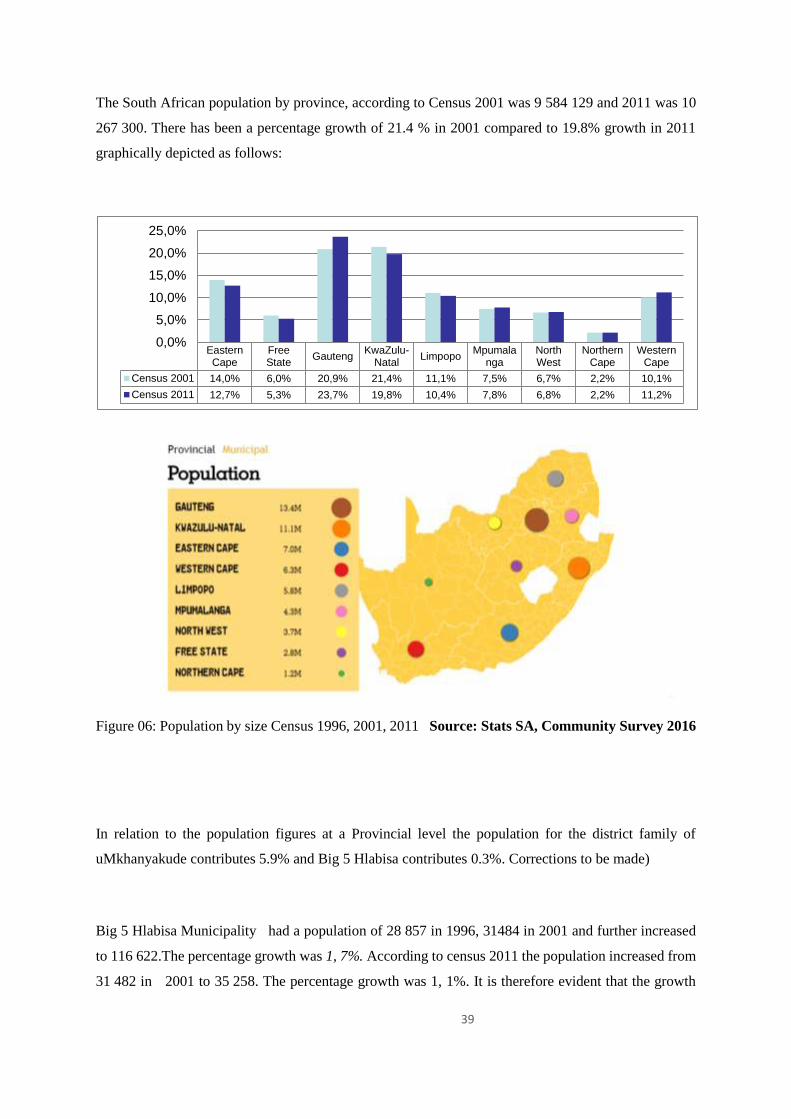
39
The South African population by province, according to Census 2001 was 9 584 129 and 2011 was 10
267 300. There has been a percentage growth of 21.4 % in 2001 compared to 19.8% growth in 2011
graphically depicted as follows:
Figure 06: Population by size Census 1996, 2001, 2011 Source: Stats SA, Community Survey 2016
In relation to the population figures at a Provincial level the population for the district family of
uMkhanyakude contributes 5.9% and Big 5 Hlabisa contributes 0.3%. Corrections to be made)
Big 5 Hlabisa Municipality had a population of 28 857 in 1996, 31484 in 2001 and further increased
to 116 622.The percentage growth was 1, 7%. According to census 2011 the population increased from
31 482 in 2001 to 35 258. The percentage growth was 1, 1%. It is therefore evident that the growth
EasternCape
FreeState
GautengKwaZulu-
NatalLimpopo
Mpumalanga
NorthWest
NorthernCape
WesternCape
Census 2001 14,0% 6,0% 20,9% 21,4% 11,1% 7,5% 6,7% 2,2% 10,1%
Census 2011 12,7% 5,3% 23,7% 19,8% 10,4% 7,8% 6,8% 2,2% 11,2%
0,0%
5,0%
10,0%
15,0%
20,0%
25,0%
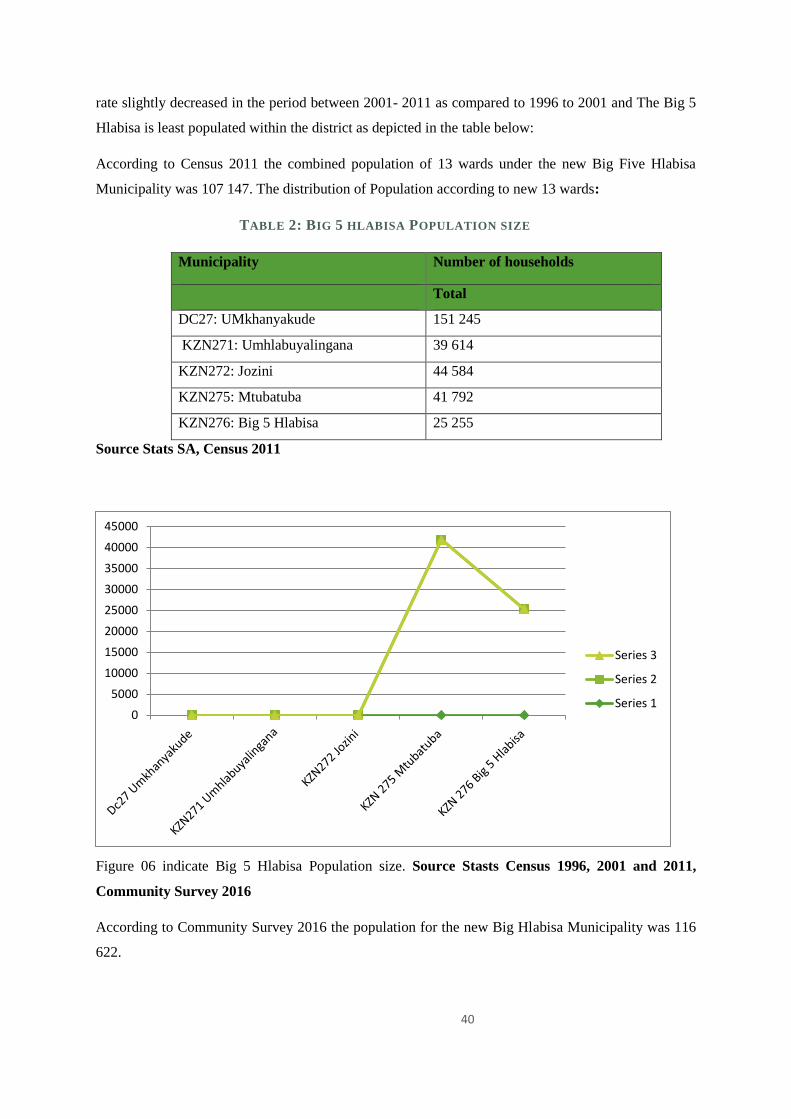
40
rate slightly decreased in the period between 2001- 2011 as compared to 1996 to 2001 and The Big 5
Hlabisa is least populated within the district as depicted in the table below:
According to Census 2011 the combined population of 13 wards under the new Big Five Hlabisa
Municipality was 107 147. The distribution of Population according to new 13 wards:
TABLE 2: BIG 5 HLABISA POPULATION SIZE
Municipality Number of households
Total
DC27: UMkhanyakude 151 245
KZN271: Umhlabuyalingana 39 614
KZN272: Jozini 44 584
KZN275: Mtubatuba 41 792
KZN276: Big 5 Hlabisa 25 255
Source Stats SA, Census 2011
Figure 06 indicate Big 5 Hlabisa Population size. Source Stasts Census 1996, 2001 and 2011,
Community Survey 2016
According to Community Survey 2016 the population for the new Big Hlabisa Municipality was 116
622.
0
5000
10000
15000
20000
25000
30000
35000
40000
45000
Series 3
Series 2
Series 1
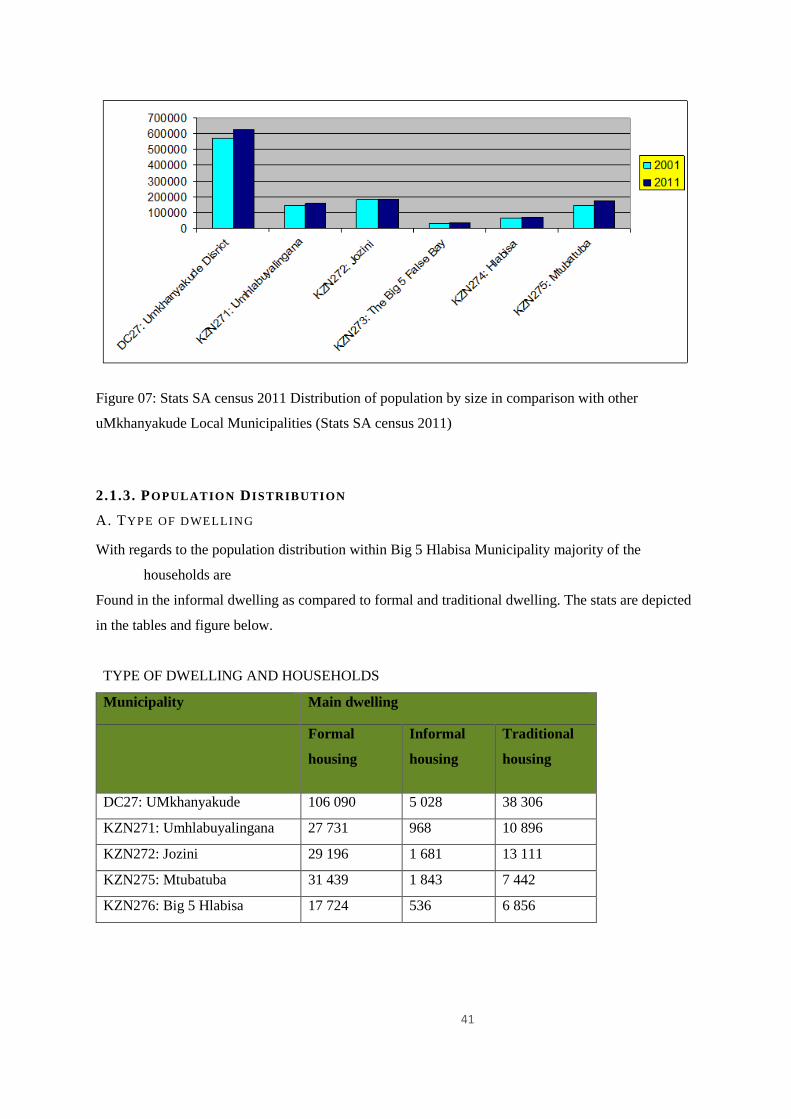
41
Figure 07: Stats SA census 2011 Distribution of population by size in comparison with other
uMkhanyakude Local Municipalities (Stats SA census 2011)
2.1.3. POPULATION DISTRIBUTION
A. TYPE OF DWELLING
With regards to the population distribution within Big 5 Hlabisa Municipality majority of the
households are
Found in the informal dwelling as compared to formal and traditional dwelling. The stats are depicted
in the tables and figure below.
TYPE OF DWELLING AND HOUSEHOLDS
Municipality Main dwelling
Formal
housing
Informal
housing
Traditional
housing
DC27: UMkhanyakude 106 090 5 028 38 306
KZN271: Umhlabuyalingana 27 731 968 10 896
KZN272: Jozini 29 196 1 681 13 111
KZN275: Mtubatuba 31 439 1 843 7 442
KZN276: Big 5 Hlabisa 17 724 536 6 856
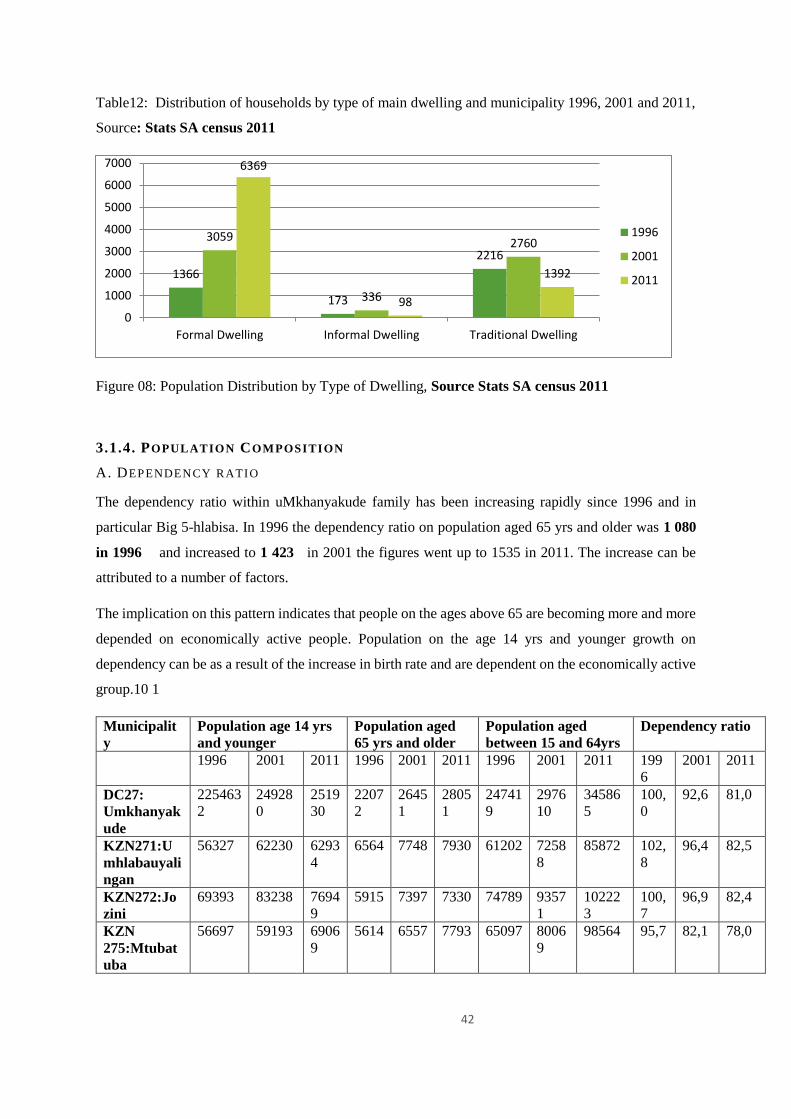
42
Table12: Distribution of households by type of main dwelling and municipality 1996, 2001 and 2011,
Source: Stats SA census 2011
Figure 08: Population Distribution by Type of Dwelling, Source Stats SA census 2011
3.1.4. POPULATION COMPOSITION
A. DEPENDENCY RATIO
The dependency ratio within uMkhanyakude family has been increasing rapidly since 1996 and in
particular Big 5-hlabisa. In 1996 the dependency ratio on population aged 65 yrs and older was 1 080
in 1996 and increased to 1 423 in 2001 the figures went up to 1535 in 2011. The increase can be
attributed to a number of factors.
The implication on this pattern indicates that people on the ages above 65 are becoming more and more
depended on economically active people. Population on the age 14 yrs and younger growth on
dependency can be as a result of the increase in birth rate and are dependent on the economically active
group.10 1
Municipalit
y
Population age 14 yrs
and younger
Population aged
65 yrs and older
Population aged
between 15 and 64yrs
Dependency ratio
1996 2001 2011 1996 2001 2011 1996 2001 2011 199
6
2001 2011
DC27:
Umkhanyak
ude
225463
2
24928
0
2519
30
2207
2
2645
1
2805
1
24741
9
2976
10
34586
5
100,
0
92,6 81,0
KZN271:U
mhlabauyali
ngan
56327 62230 6293
4
6564 7748 7930 61202 7258
8
85872 102,
8
96,4 82,5
KZN272:Jo
zini
69393 83238 7694
9
5915 7397 7330 74789 9357
1
10222
3
100,
7
96,9 82,4
KZN
275:Mtubat
uba
56697 59193 6906
9
5614 6557 7793 65097 8006
9
98564 95,7 82,1 78,0
1366
173
2216
3059
336
2760
6369
98
1392
0
1000
2000
3000
4000
5000
6000
7000
Formal Dwelling Informal Dwelling Traditional Dwelling
1996
2001
2011
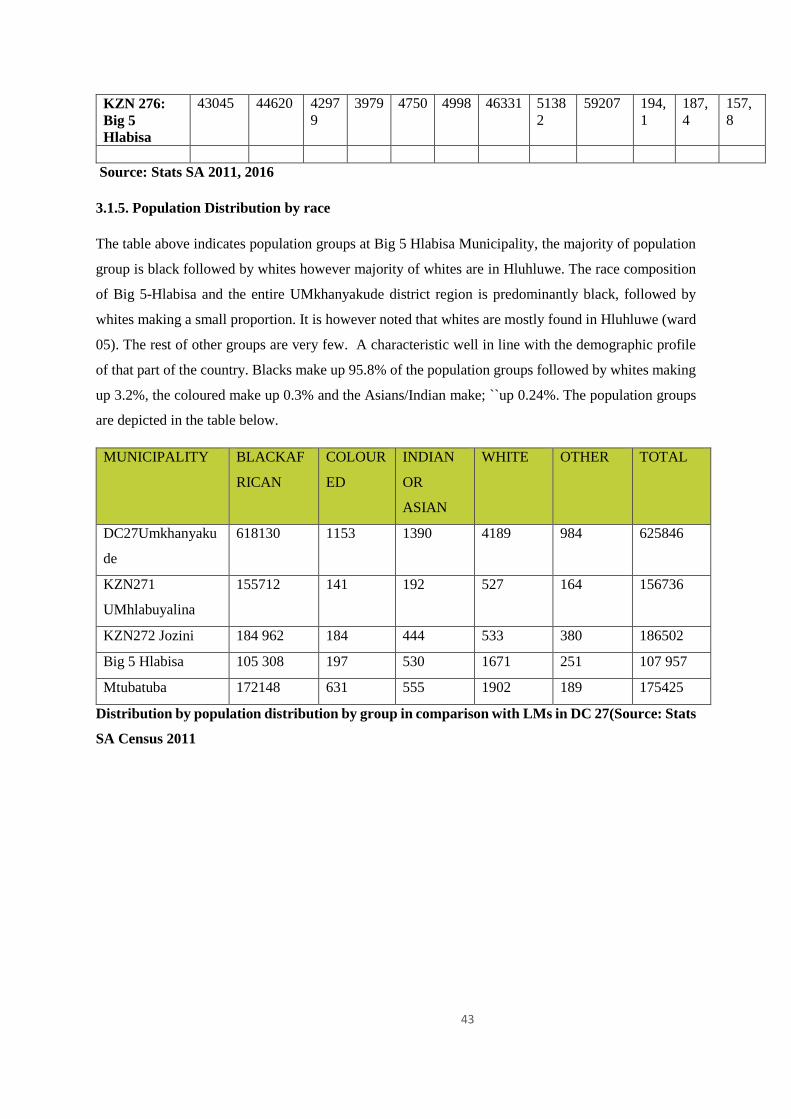
43
KZN 276:
Big 5
Hlabisa
43045 44620 4297
9
3979 4750 4998 46331 5138
2
59207 194,
1
187,
4
157,
8
Source: Stats SA 2011, 2016
3.1.5. Population Distribution by race
The table above indicates population groups at Big 5 Hlabisa Municipality, the majority of population
group is black followed by whites however majority of whites are in Hluhluwe. The race composition
of Big 5-Hlabisa and the entire UMkhanyakude district region is predominantly black, followed by
whites making a small proportion. It is however noted that whites are mostly found in Hluhluwe (ward
05). The rest of other groups are very few. A characteristic well in line with the demographic profile
of that part of the country. Blacks make up 95.8% of the population groups followed by whites making
up 3.2%, the coloured make up 0.3% and the Asians/Indian make; ``up 0.24%. The population groups
are depicted in the table below.
MUNICIPALITY BLACKAF
RICAN
COLOUR
ED
INDIAN
OR
ASIAN
WHITE OTHER TOTAL
DC27Umkhanyaku
de
618130 1153 1390 4189 984 625846
KZN271
UMhlabuyalina
155712 141 192 527 164 156736
KZN272 Jozini 184 962 184 444 533 380 186502
Big 5 Hlabisa 105 308 197 530 1671 251 107 957
Mtubatuba 172148 631 555 1902 189 175425
Distribution by population distribution by group in comparison with LMs in DC 27(Source: Stats
SA Census 2011
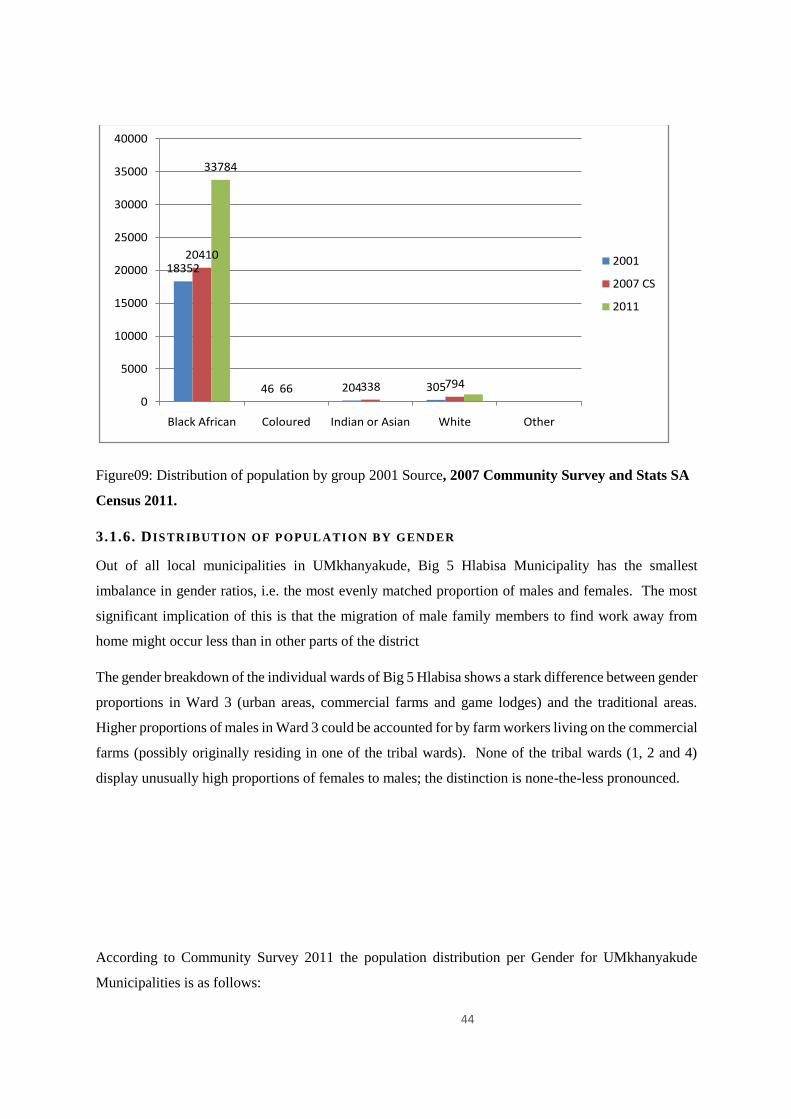
44
Figure09: Distribution of population by group 2001 Source, 2007 Community Survey and Stats SA
Census 2011.
3.1.6. DISTRIBUTION OF POPUL ATION BY GENDER
Out of all local municipalities in UMkhanyakude, Big 5 Hlabisa Municipality has the smallest
imbalance in gender ratios, i.e. the most evenly matched proportion of males and females. The most
significant implication of this is that the migration of male family members to find work away from
home might occur less than in other parts of the district
The gender breakdown of the individual wards of Big 5 Hlabisa shows a stark difference between gender
proportions in Ward 3 (urban areas, commercial farms and game lodges) and the traditional areas.
Higher proportions of males in Ward 3 could be accounted for by farm workers living on the commercial
farms (possibly originally residing in one of the tribal wards). None of the tribal wards (1, 2 and 4)
display unusually high proportions of females to males; the distinction is none-the-less pronounced.
According to Community Survey 2011 the population distribution per Gender for UMkhanyakude
Municipalities is as follows:
18352
46 204 305
20410
66 338 794
33784
0
5000
10000
15000
20000
25000
30000
35000
40000
Black African Coloured Indian or Asian White Other
2001
2007 CS
2011
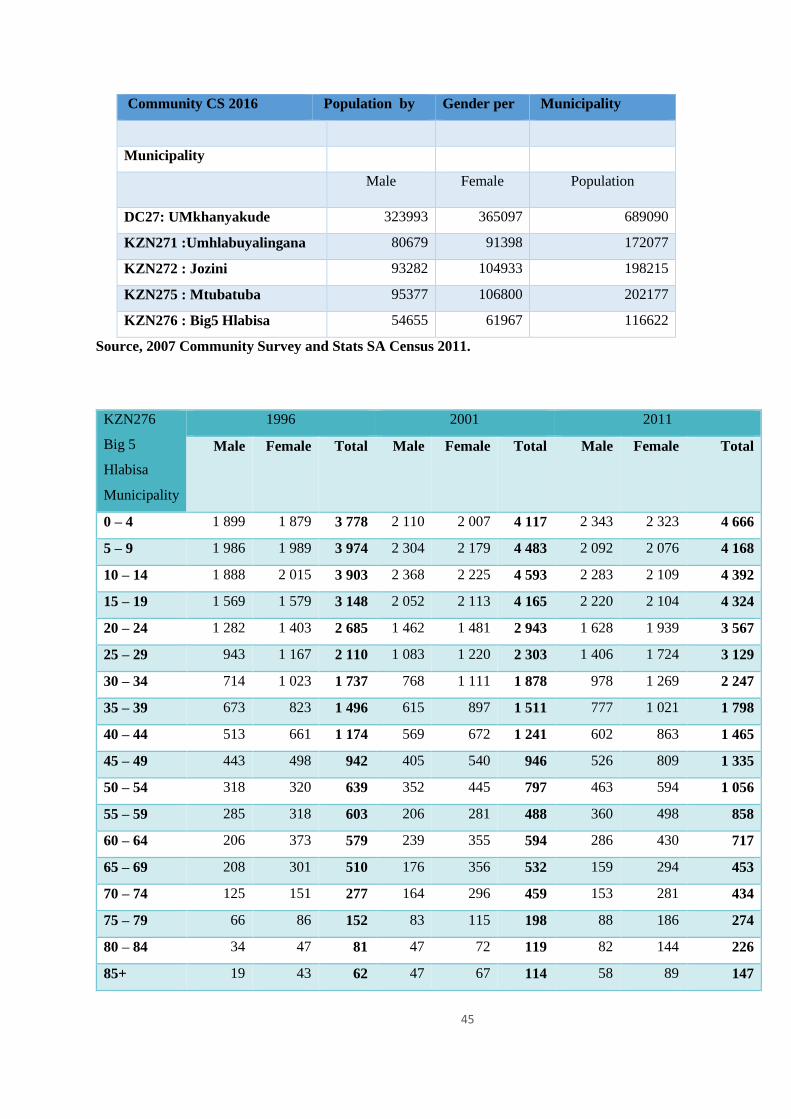
45
Community CS 2016 Population by Gender per Municipality
Municipality
Male Female Population
DC27: UMkhanyakude 323993 365097 689090
KZN271 :Umhlabuyalingana 80679 91398 172077
KZN272 : Jozini 93282 104933 198215
KZN275 : Mtubatuba 95377 106800 202177
KZN276 : Big5 Hlabisa 54655 61967 116622
Source, 2007 Community Survey and Stats SA Census 2011.
KZN276
Big 5
Hlabisa
Municipality
1996 2001 2011
Male Female Total Male Female Total Male Female Total
0 – 4 1 899 1 879 3 778 2 110 2 007 4 117 2 343 2 323 4 666
5 – 9 1 986 1 989 3 974 2 304 2 179 4 483 2 092 2 076 4 168
10 – 14 1 888 2 015 3 903 2 368 2 225 4 593 2 283 2 109 4 392
15 – 19 1 569 1 579 3 148 2 052 2 113 4 165 2 220 2 104 4 324
20 – 24 1 282 1 403 2 685 1 462 1 481 2 943 1 628 1 939 3 567
25 – 29 943 1 167 2 110 1 083 1 220 2 303 1 406 1 724 3 129
30 – 34 714 1 023 1 737 768 1 111 1 878 978 1 269 2 247
35 – 39 673 823 1 496 615 897 1 511 777 1 021 1 798
40 – 44 513 661 1 174 569 672 1 241 602 863 1 465
45 – 49 443 498 942 405 540 946 526 809 1 335
50 – 54 318 320 639 352 445 797 463 594 1 056
55 – 59 285 318 603 206 281 488 360 498 858
60 – 64 206 373 579 239 355 594 286 430 717
65 – 69 208 301 510 176 356 532 159 294 453
70 – 74 125 151 277 164 296 459 153 281 434
75 – 79 66 86 152 83 115 198 88 186 274
80 – 84 34 47 81 47 72 119 82 144 226
85+ 19 43 62 47 67 114 58 89 147
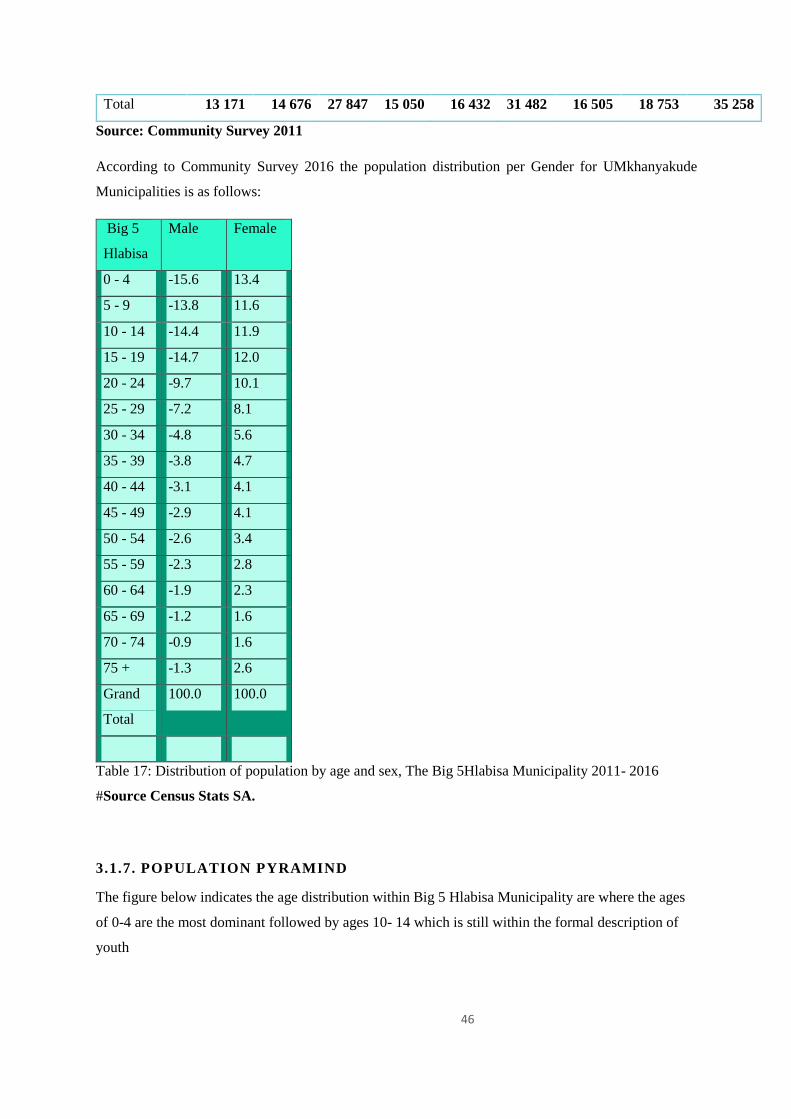
46
Total 13 171 14 676 27 847 15 050 16 432 31 482 16 505 18 753 35 258
Source: Community Survey 2011
According to Community Survey 2016 the population distribution per Gender for UMkhanyakude
Municipalities is as follows:
Big 5
Hlabisa
Male Female
0 - 4 -15.6 13.4
5 - 9 -13.8 11.6
10 - 14 -14.4 11.9
15 - 19 -14.7 12.0
20 - 24 -9.7 10.1
25 - 29 -7.2 8.1
30 - 34 -4.8 5.6
35 - 39 -3.8 4.7
40 - 44 -3.1 4.1
45 - 49 -2.9 4.1
50 - 54 -2.6 3.4
55 - 59 -2.3 2.8
60 - 64 -1.9 2.3
65 - 69 -1.2 1.6
70 - 74 -0.9 1.6
75 + -1.3 2.6
Grand
Total
100.0 100.0
Table 17: Distribution of population by age and sex, The Big 5Hlabisa Municipality 2011- 2016
#Source Census Stats SA.
3.1.7. POPULATION PYRAMIND
The figure below indicates the age distribution within Big 5 Hlabisa Municipality are where the ages
of 0-4 are the most dominant followed by ages 10- 14 which is still within the formal description of
youth
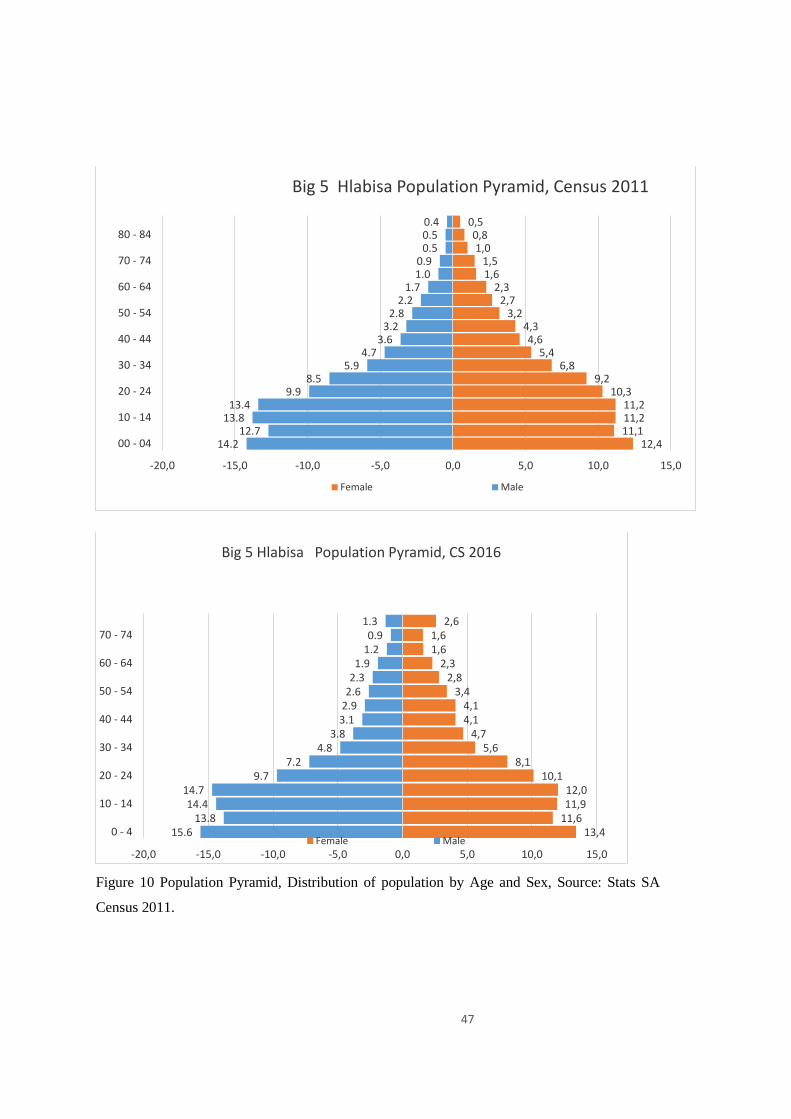
47
Figure 10 Population Pyramid, Distribution of population by Age and Sex, Source: Stats SA
Census 2011.
14.212.7
13.813.4
9.98.5
5.94.7
3.63.2
2.82.2
1.71.00.9
0.50.50.4
12,411,111,211,2
10,39,2
6,85,4
4,64,3
3,22,7
2,31,61,5
1,00,8
0,5
-20,0 -15,0 -10,0 -5,0 0,0 5,0 10,0 15,0
00 - 04
10 - 14
20 - 24
30 - 34
40 - 44
50 - 54
60 - 64
70 - 74
80 - 84
Big 5 Hlabisa Population Pyramid, Census 2011
Female Male
15.613.8
14.414.7
9.77.2
4.83.8
3.12.92.62.31.9
1.20.9
1.3
13,411,611,912,0
10,18,1
5,64,7
4,14,1
3,42,8
2,31,61,6
2,6
-20,0 -15,0 -10,0 -5,0 0,0 5,0 10,0 15,0
0 - 4
10 - 14
20 - 24
30 - 34
40 - 44
50 - 54
60 - 64
70 - 74
Big 5 Hlabisa Population Pyramid, CS 2016
Female Male
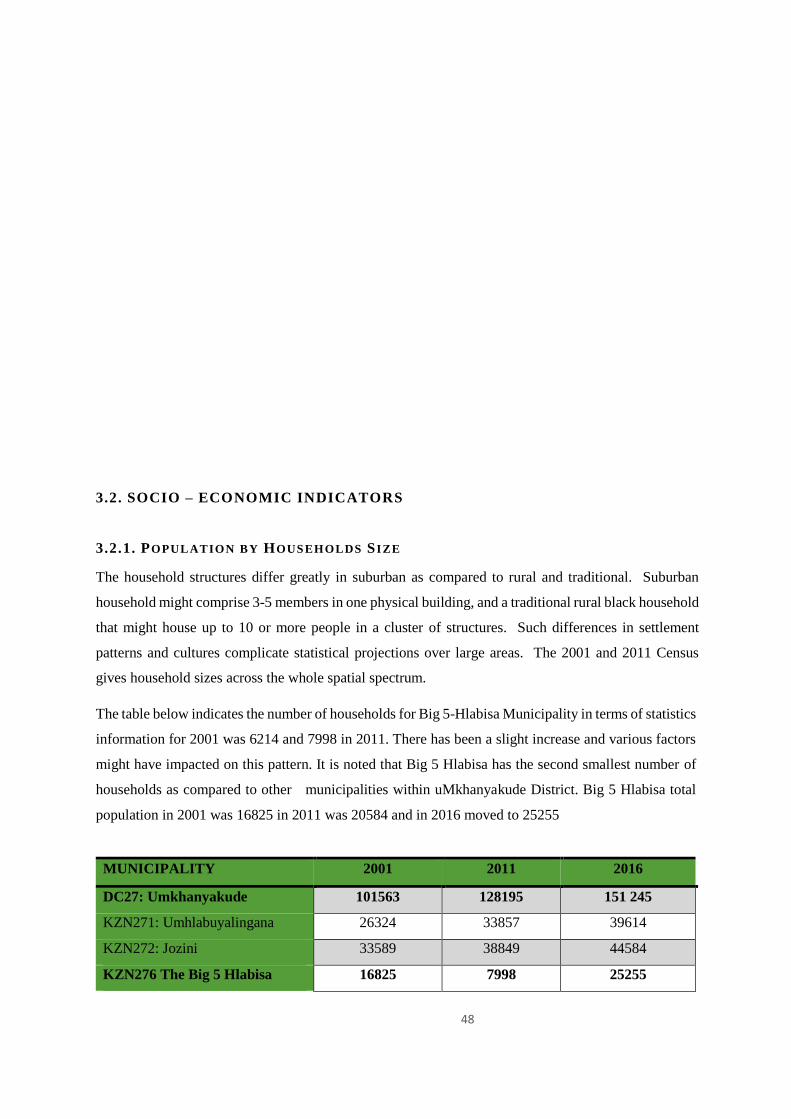
48
3.2. SOCIO – ECONOMIC INDICATORS
3.2.1. POPULATION BY HOUSEHOLDS S IZE
The household structures differ greatly in suburban as compared to rural and traditional. Suburban
household might comprise 3-5 members in one physical building, and a traditional rural black household
that might house up to 10 or more people in a cluster of structures. Such differences in settlement
patterns and cultures complicate statistical projections over large areas. The 2001 and 2011 Census
gives household sizes across the whole spatial spectrum.
The table below indicates the number of households for Big 5-Hlabisa Municipality in terms of statistics
information for 2001 was 6214 and 7998 in 2011. There has been a slight increase and various factors
might have impacted on this pattern. It is noted that Big 5 Hlabisa has the second smallest number of
households as compared to other municipalities within uMkhanyakude District. Big 5 Hlabisa total
population in 2001 was 16825 in 2011 was 20584 and in 2016 moved to 25255
MUNICIPALITY 2001 2011 2016
DC27: Umkhanyakude 101563 128195 151 245
KZN271: Umhlabuyalingana 26324 33857 39614
KZN272: Jozini 33589 38849 44584
KZN276 The Big 5 Hlabisa 16825 7998 25255
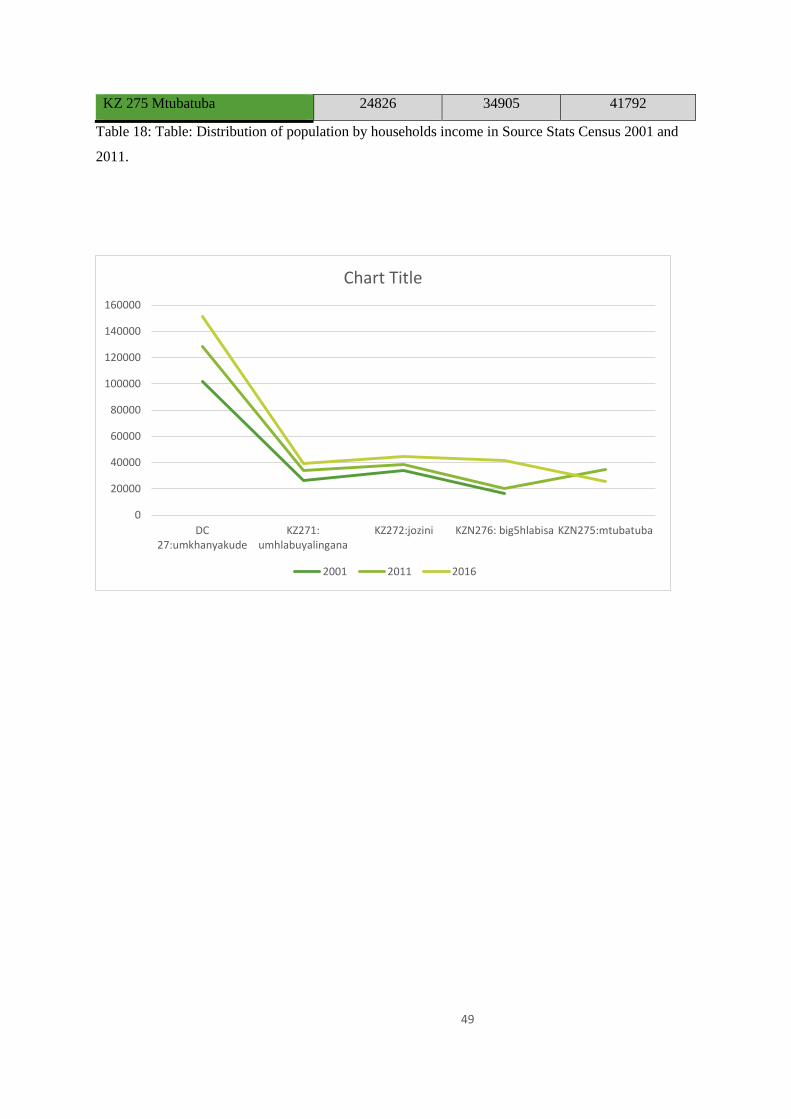
49
KZ 275 Mtubatuba 24826 34905 41792
Table 18: Table: Distribution of population by households income in Source Stats Census 2001 and
2011.
0
20000
40000
60000
80000
100000
120000
140000
160000
DC27:umkhanyakude
KZ271:umhlabuyalingana
KZ272:jozini KZN276: big5hlabisa KZN275:mtubatuba
Chart Title
2001 2011 2016
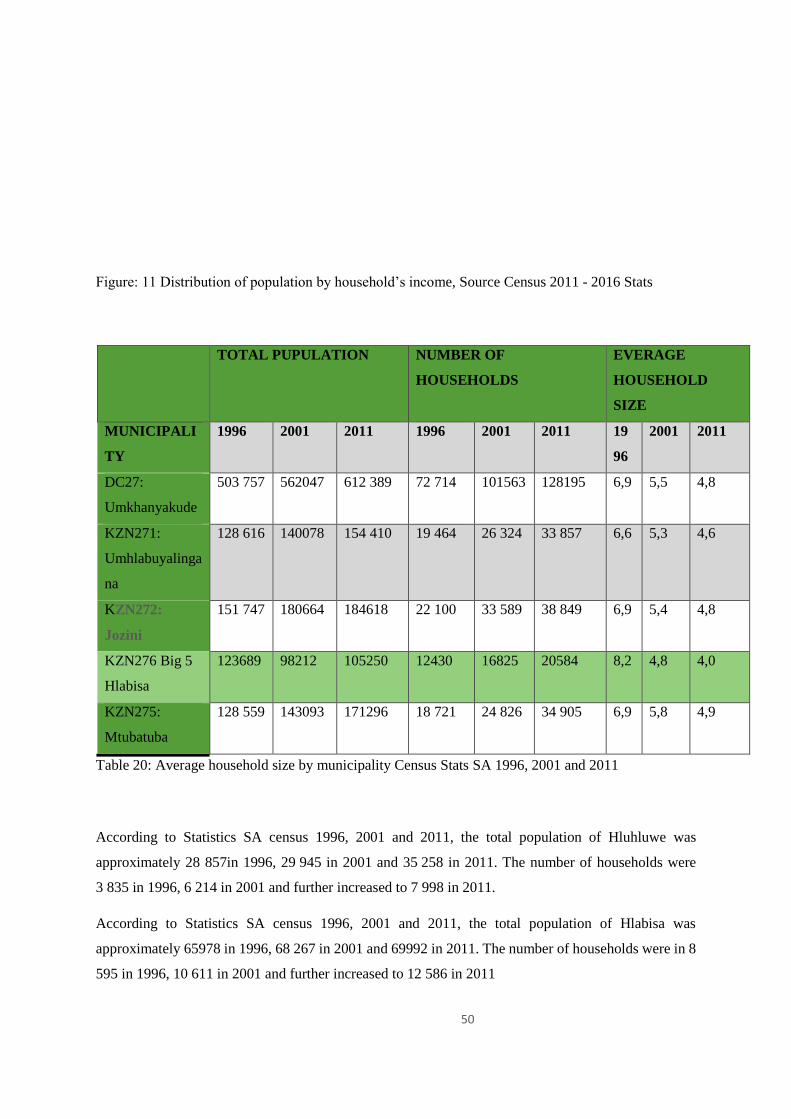
50
Figure: 11 Distribution of population by household’s income, Source Census 2011 - 2016 Stats
TOTAL PUPULATION NUMBER OF
HOUSEHOLDS
EVERAGE
HOUSEHOLD
SIZE
MUNICIPALI
TY
1996 2001 2011 1996 2001 2011 19
96
2001 2011
DC27:
Umkhanyakude
503 757 562047 612 389 72 714 101563 128195 6,9 5,5 4,8
KZN271:
Umhlabuyalinga
na
128 616 140078 154 410 19 464 26 324 33 857 6,6 5,3 4,6
KZN272:
Jozini
151 747 180664 184618 22 100 33 589 38 849 6,9 5,4 4,8
KZN276 Big 5
Hlabisa
123689 98212 105250 12430 16825 20584 8,2 4,8 4,0
KZN275:
Mtubatuba
128 559 143093 171296 18 721 24 826 34 905 6,9 5,8 4,9
Table 20: Average household size by municipality Census Stats SA 1996, 2001 and 2011
According to Statistics SA census 1996, 2001 and 2011, the total population of Hluhluwe was
approximately 28 857in 1996, 29 945 in 2001 and 35 258 in 2011. The number of households were
3 835 in 1996, 6 214 in 2001 and further increased to 7 998 in 2011.
According to Statistics SA census 1996, 2001 and 2011, the total population of Hlabisa was
approximately 65978 in 1996, 68 267 in 2001 and 69992 in 2011. The number of households were in 8
595 in 1996, 10 611 in 2001 and further increased to 12 586 in 2011
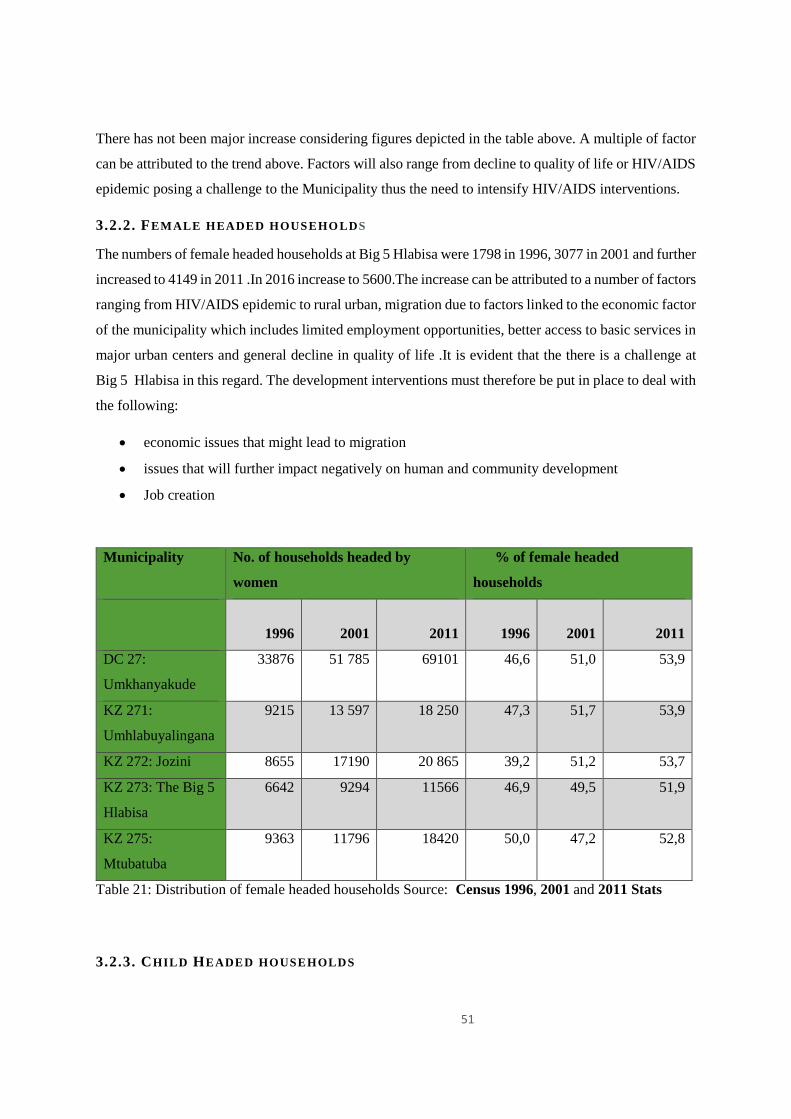
51
There has not been major increase considering figures depicted in the table above. A multiple of factor
can be attributed to the trend above. Factors will also range from decline to quality of life or HIV/AIDS
epidemic posing a challenge to the Municipality thus the need to intensify HIV/AIDS interventions.
3.2.2. FEMALE HEADED HOUSEHO LDS
The numbers of female headed households at Big 5 Hlabisa were 1798 in 1996, 3077 in 2001 and further
increased to 4149 in 2011 .In 2016 increase to 5600.The increase can be attributed to a number of factors
ranging from HIV/AIDS epidemic to rural urban, migration due to factors linked to the economic factor
of the municipality which includes limited employment opportunities, better access to basic services in
major urban centers and general decline in quality of life .It is evident that the there is a challenge at
Big 5 Hlabisa in this regard. The development interventions must therefore be put in place to deal with
the following:
economic issues that might lead to migration
issues that will further impact negatively on human and community development
Job creation
Municipality No. of households headed by
women
% of female headed
households
1996
2001
2011
1996
2001
2011
DC 27:
Umkhanyakude
33876 51 785 69101 46,6 51,0 53,9
KZ 271:
Umhlabuyalingana
9215 13 597 18 250 47,3 51,7 53,9
KZ 272: Jozini 8655 17190 20 865 39,2 51,2 53,7
KZ 273: The Big 5
Hlabisa
6642 9294 11566 46,9 49,5 51,9
KZ 275:
Mtubatuba
9363 11796 18420 50,0 47,2 52,8
Table 21: Distribution of female headed households Source: Census 1996, 2001 and 2011 Stats
3.2.3. CHILD HEADED HOUSEHOLDS
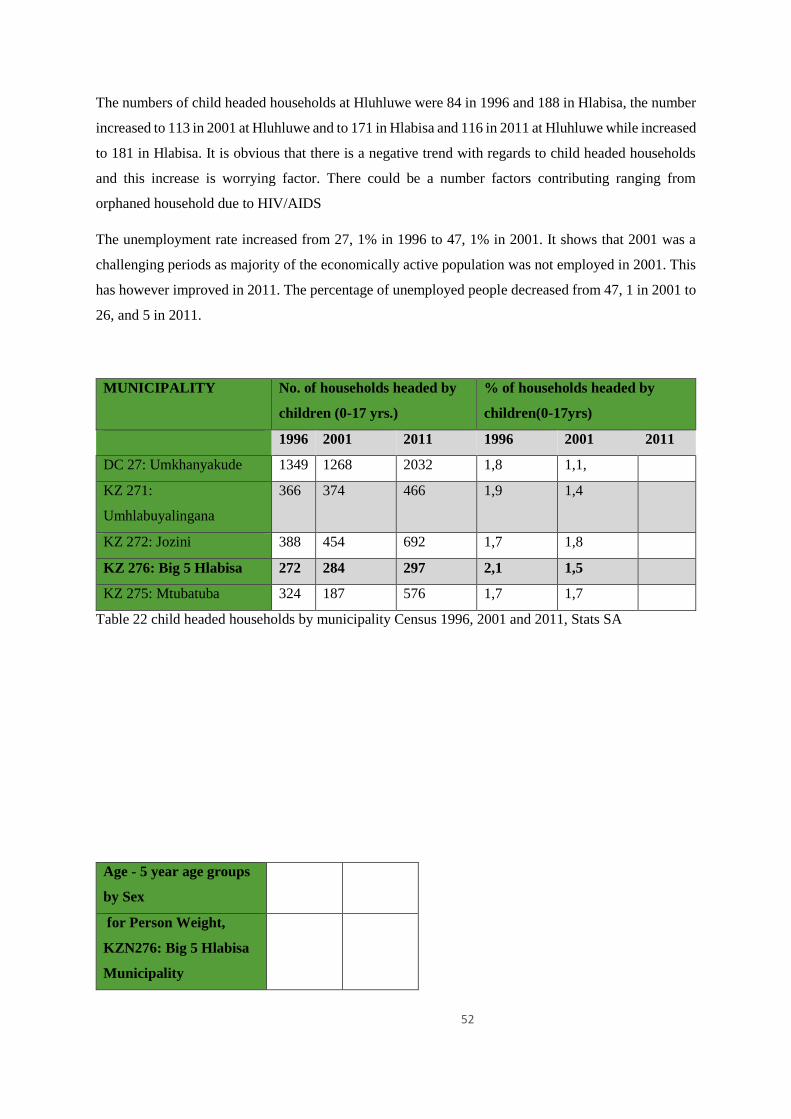
52
The numbers of child headed households at Hluhluwe were 84 in 1996 and 188 in Hlabisa, the number
increased to 113 in 2001 at Hluhluwe and to 171 in Hlabisa and 116 in 2011 at Hluhluwe while increased
to 181 in Hlabisa. It is obvious that there is a negative trend with regards to child headed households
and this increase is worrying factor. There could be a number factors contributing ranging from
orphaned household due to HIV/AIDS
The unemployment rate increased from 27, 1% in 1996 to 47, 1% in 2001. It shows that 2001 was a
challenging periods as majority of the economically active population was not employed in 2001. This
has however improved in 2011. The percentage of unemployed people decreased from 47, 1 in 2001 to
26, and 5 in 2011.
MUNICIPALITY No. of households headed by
children (0-17 yrs.)
% of households headed by
children(0-17yrs)
1996 2001 2011 1996 2001 2011
DC 27: Umkhanyakude 1349 1268 2032 1,8 1,1,
KZ 271:
Umhlabuyalingana
366 374 466 1,9 1,4
KZ 272: Jozini 388 454 692 1,7 1,8
KZ 276: Big 5 Hlabisa 272 284 297 2,1 1,5
KZ 275: Mtubatuba 324 187 576 1,7 1,7
Table 22 child headed households by municipality Census 1996, 2001 and 2011, Stats SA
Age - 5 year age groups
by Sex
for Person Weight,
KZN276: Big 5 Hlabisa
Municipality
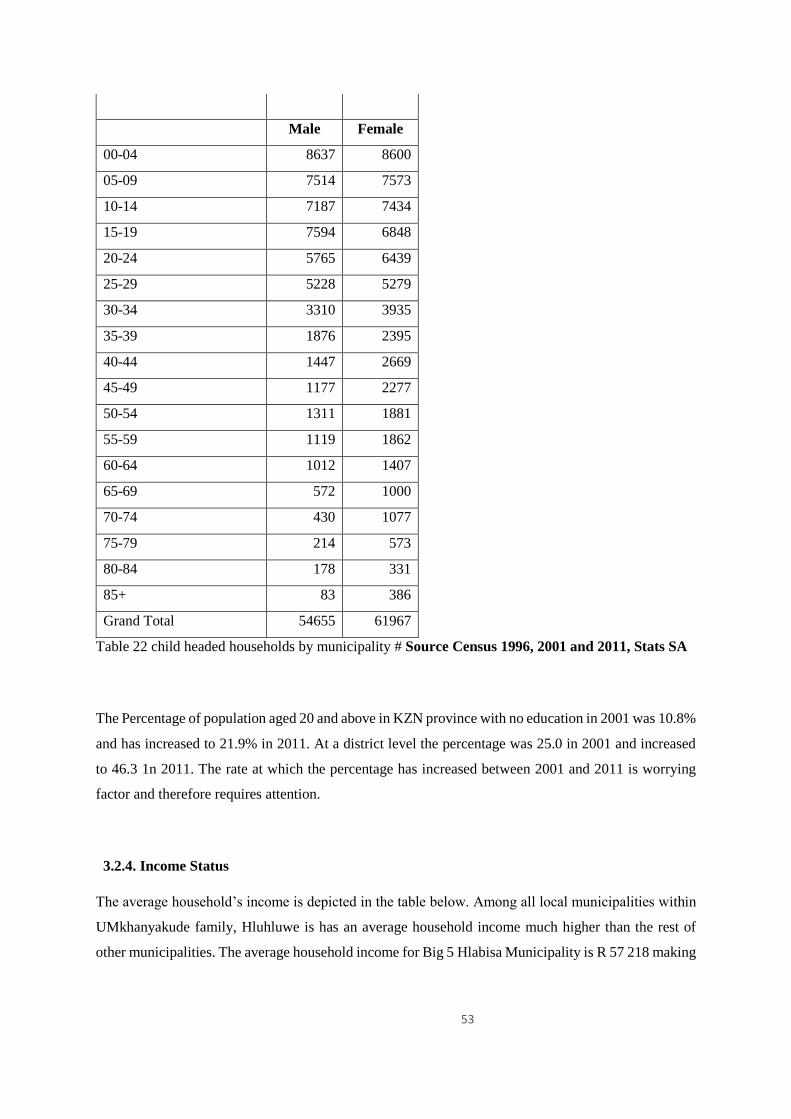
53
Male Female
00-04 8637 8600
05-09 7514 7573
10-14 7187 7434
15-19 7594 6848
20-24 5765 6439
25-29 5228 5279
30-34 3310 3935
35-39 1876 2395
40-44 1447 2669
45-49 1177 2277
50-54 1311 1881
55-59 1119 1862
60-64 1012 1407
65-69 572 1000
70-74 430 1077
75-79 214 573
80-84 178 331
85+ 83 386
Grand Total 54655 61967
Table 22 child headed households by municipality # Source Census 1996, 2001 and 2011, Stats SA
The Percentage of population aged 20 and above in KZN province with no education in 2001 was 10.8%
and has increased to 21.9% in 2011. At a district level the percentage was 25.0 in 2001 and increased
to 46.3 1n 2011. The rate at which the percentage has increased between 2001 and 2011 is worrying
factor and therefore requires attention.
3.2.4. Income Status
The average household’s income is depicted in the table below. Among all local municipalities within
UMkhanyakude family, Hluhluwe is has an average household income much higher than the rest of
other municipalities. The average household income for Big 5 Hlabisa Municipality is R 57 218 making
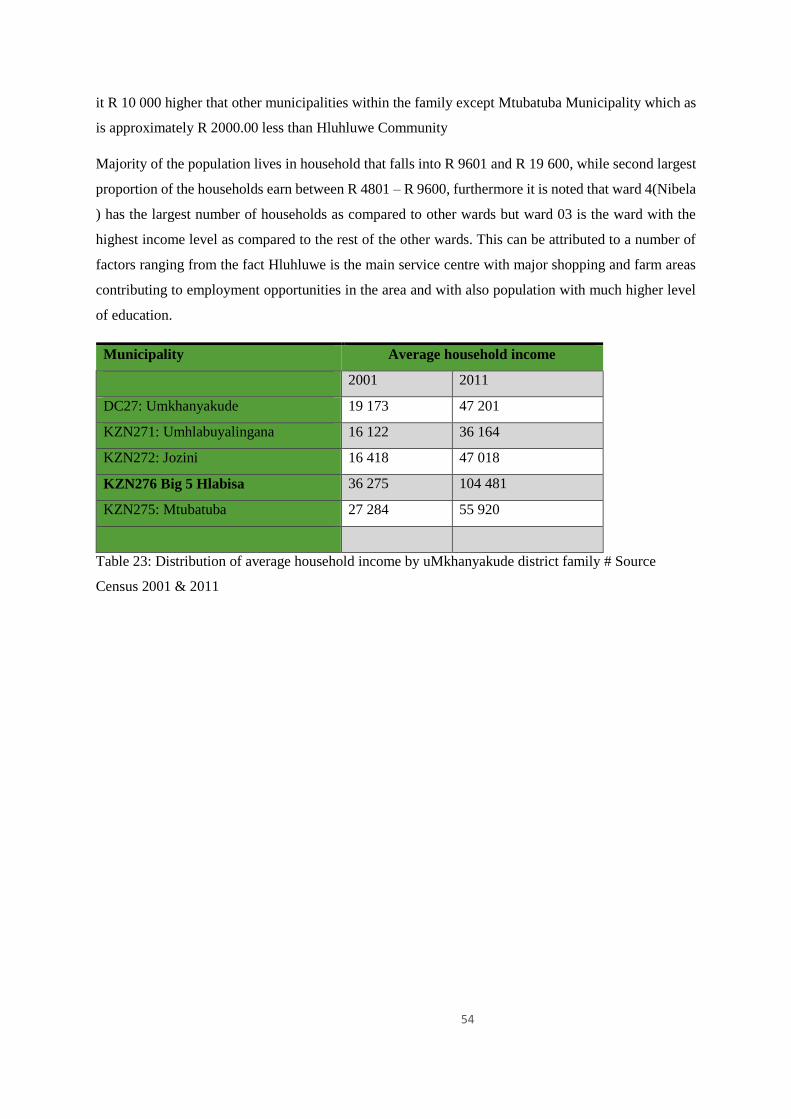
54
it R 10 000 higher that other municipalities within the family except Mtubatuba Municipality which as
is approximately R 2000.00 less than Hluhluwe Community
Majority of the population lives in household that falls into R 9601 and R 19 600, while second largest
proportion of the households earn between R 4801 – R 9600, furthermore it is noted that ward 4(Nibela
) has the largest number of households as compared to other wards but ward 03 is the ward with the
highest income level as compared to the rest of the other wards. This can be attributed to a number of
factors ranging from the fact Hluhluwe is the main service centre with major shopping and farm areas
contributing to employment opportunities in the area and with also population with much higher level
of education.
Municipality Average household income
2001 2011
DC27: Umkhanyakude 19 173 47 201
KZN271: Umhlabuyalingana 16 122 36 164
KZN272: Jozini 16 418 47 018
KZN276 Big 5 Hlabisa 36 275 104 481
KZN275: Mtubatuba 27 284 55 920
Table 23: Distribution of average household income by uMkhanyakude district family # Source
Census 2001 & 2011
55
3.3. POPULATION DENSITY
The relatively low population density of 41 ppl /km² of Big 5 Hlabisa is to be expected. This
reflects:
Only one significant urban settlement (Hluhluwe town, including Phumlani);
A large proportion of commercial agriculture in the municipal area ;
A significant number of game lodges and Game Farms in the municipal area;
Significantly populated but scattered rural homesteads spread across large areas;
The Makhasa (Ward 2) is far more densely populated than the other two traditional areas,
despite having a very similar sized population;
The Nibela peninsula is less densely populated than Makhasa but more densely populated
than Mnqobokazi, which is the least densely populated of the rural wards but also the
largest in size;
Aside from the settlement at Hluhluwe town, the rest of Ward 3 is very sparsely populated
(14.1 ppl/km²). This ward accommodates all of the commercial agriculture and game
lodge activity that occurs in Big 5 Hlabisa Municipality.
Density has a strong cost implication for service provision. The known low densities of the tribal
areas (Wards 1, 2 and 4) already pose development challenges. Although other factors
undoubtedly need to be taken into account, the densities listed below imply that Mnqobokazi
would be the most difficult to service, followed by Nibela and that Makhasa would be the least
difficult or costly of the three. Wards densities in terms of number of people per km² are expressed
below:
3.4. POPULATION BY EDUCATION LEVEL
Majority of the Youth population at Big 5 Hlabisa Municipality. More than 50 %( i.e. 34% primary
schooling and 24% attending schooling) are school-going kids. This is an indication of youthfulness of
the population of Big 5 Hlabisa. Based on the above figure, 16% of the total population has no schooling.
A trend similar to other local municipalities within the District indicates decrease in number of student
acquiring post grade twelve qualification, which implies that a number of students get lost along the
system.
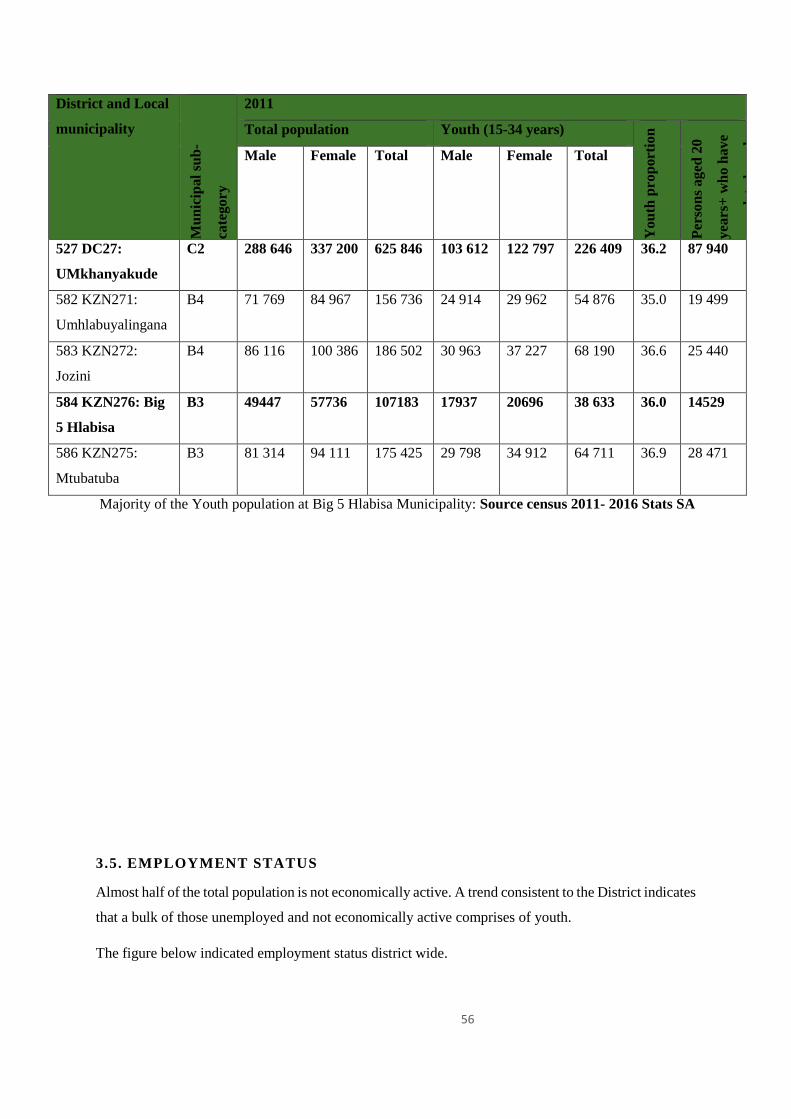
56
District and Local
municipality
Mu
nic
ipal
sub
-
cate
go
ry
2011
Total population Youth (15-34 years)
Yo
uth
pro
port
ion
Per
son
s a
ged
20
yea
rs+
wh
o h
av
e
com
ple
ted
gra
de
12
Male Female Total Male Female Total
527 DC27:
UMkhanyakude
C2 288 646 337 200 625 846 103 612 122 797 226 409 36.2 87 940
582 KZN271:
Umhlabuyalingana
B4 71 769 84 967 156 736 24 914 29 962 54 876 35.0 19 499
583 KZN272:
Jozini
B4 86 116 100 386 186 502 30 963 37 227 68 190 36.6 25 440
584 KZN276: Big
5 Hlabisa
B3 49447 57736 107183 17937 20696 38 633 36.0 14529
586 KZN275:
Mtubatuba
B3 81 314 94 111 175 425 29 798 34 912 64 711 36.9 28 471
Majority of the Youth population at Big 5 Hlabisa Municipality: Source census 2011- 2016 Stats SA
3.5. EMPLOYMENT STATUS
Almost half of the total population is not economically active. A trend consistent to the District indicates
that a bulk of those unemployed and not economically active comprises of youth.
The figure below indicated employment status district wide.
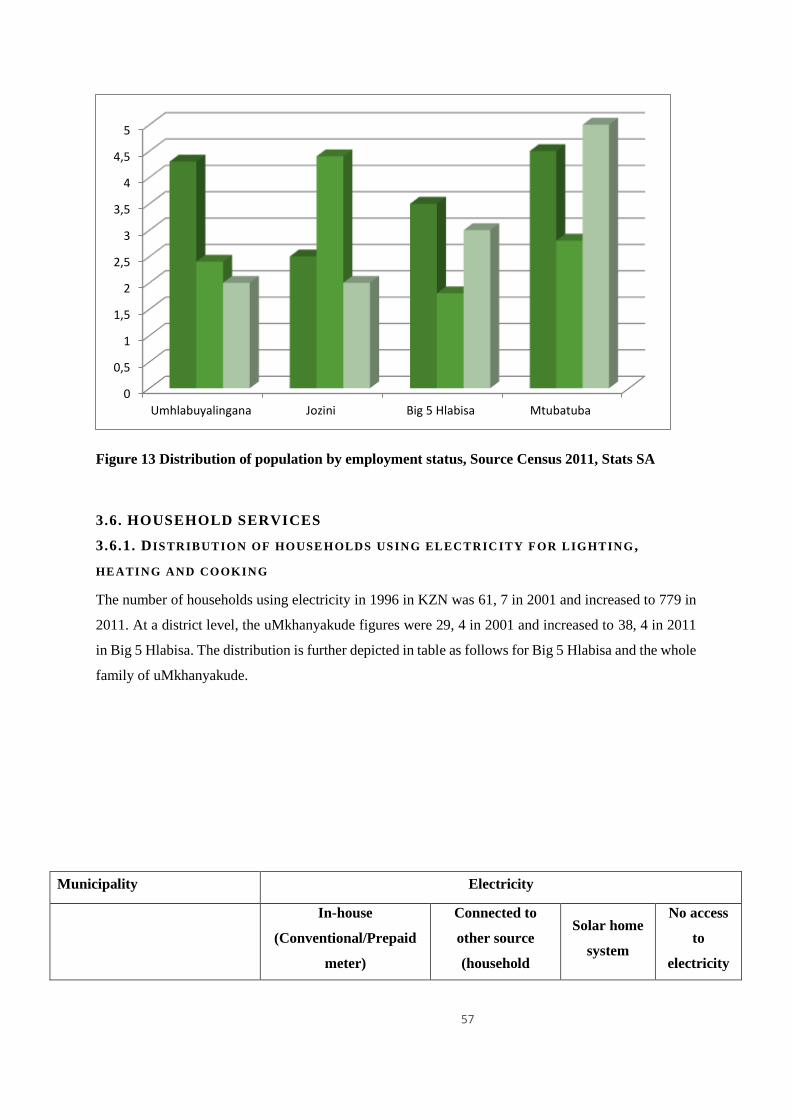
57
Figure 13 Distribution of population by employment status, Source Census 2011, Stats SA
3.6. HOUSEHOLD SERVICES
3.6.1. DISTRIBUTION OF HOUSE HOLDS USING ELECTRIC ITY FOR LIGHTING ,
HEATING AND COOKING
The number of households using electricity in 1996 in KZN was 61, 7 in 2001 and increased to 779 in
2011. At a district level, the uMkhanyakude figures were 29, 4 in 2001 and increased to 38, 4 in 2011
in Big 5 Hlabisa. The distribution is further depicted in table as follows for Big 5 Hlabisa and the whole
family of uMkhanyakude.
Municipality Electricity
In-house
(Conventional/Prepaid
meter)
Connected to
other source
(household
Solar home
system
No access
to
electricity
0
0,5
1
1,5
2
2,5
3
3,5
4
4,5
5
Umhlabuyalingana Jozini Big 5 Hlabisa Mtubatuba
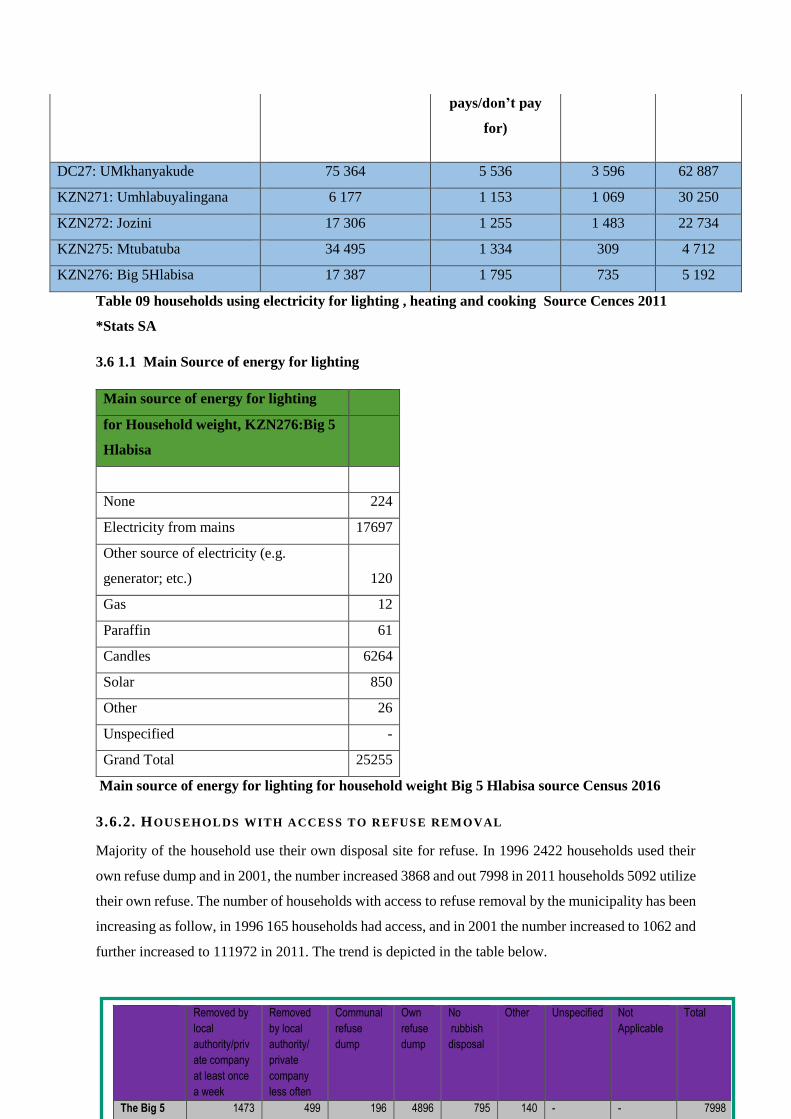
58
pays/don’t pay
for)
DC27: UMkhanyakude 75 364 5 536 3 596 62 887
KZN271: Umhlabuyalingana 6 177 1 153 1 069 30 250
KZN272: Jozini 17 306 1 255 1 483 22 734
KZN275: Mtubatuba 34 495 1 334 309 4 712
KZN276: Big 5Hlabisa 17 387 1 795 735 5 192
Table 09 households using electricity for lighting , heating and cooking Source Cences 2011
*Stats SA
3.6 1.1 Main Source of energy for lighting
Main source of energy for lighting
for Household weight, KZN276:Big 5
Hlabisa
None 224
Electricity from mains 17697
Other source of electricity (e.g.
generator; etc.) 120
Gas 12
Paraffin 61
Candles 6264
Solar 850
Other 26
Unspecified -
Grand Total 25255
Main source of energy for lighting for household weight Big 5 Hlabisa source Census 2016
3.6.2. HOUSEHOLDS WITH ACCES S TO REFUSE REMOVAL
Majority of the household use their own disposal site for refuse. In 1996 2422 households used their
own refuse dump and in 2001, the number increased 3868 and out 7998 in 2011 households 5092 utilize
their own refuse. The number of households with access to refuse removal by the municipality has been
increasing as follow, in 1996 165 households had access, and in 2001 the number increased to 1062 and
further increased to 111972 in 2011. The trend is depicted in the table below.
Removed by
local
authority/priv
ate company
at least once
a week
Removed
by local
authority/
private
company
less often
Communal
refuse
dump
Own
refuse
dump
No
rubbish
disposal
Other Unspecified Not
Applicable
Total
The Big 5
Hlabisa
1473 499 196 4896 795 140 - - 7998
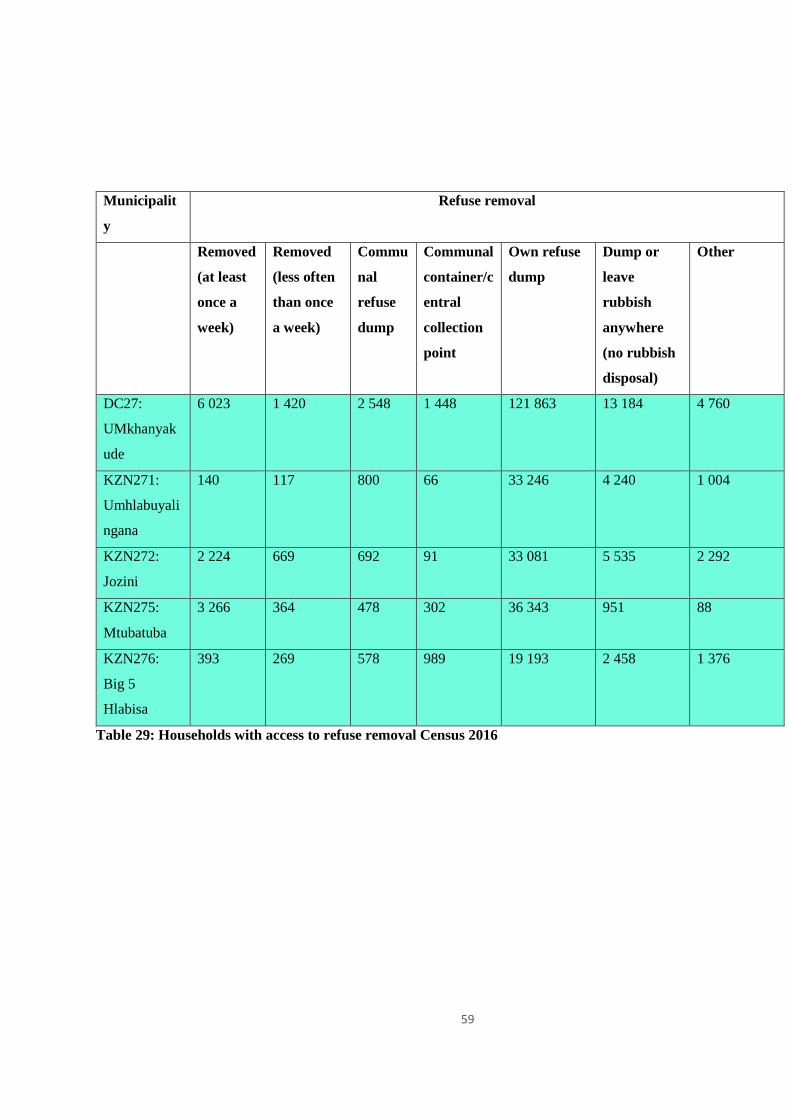
59
Municipalit
y
Refuse removal
Removed
(at least
once a
week)
Removed
(less often
than once
a week)
Commu
nal
refuse
dump
Communal
container/c
entral
collection
point
Own refuse
dump
Dump or
leave
rubbish
anywhere
(no rubbish
disposal)
Other
DC27:
UMkhanyak
ude
6 023 1 420 2 548 1 448 121 863 13 184 4 760
KZN271:
Umhlabuyali
ngana
140 117 800 66 33 246 4 240 1 004
KZN272:
Jozini
2 224 669 692 91 33 081 5 535 2 292
KZN275:
Mtubatuba
3 266 364 478 302 36 343 951 88
KZN276:
Big 5
Hlabisa
393 269 578 989 19 193 2 458 1 376
Table 29: Households with access to refuse removal Census 2016
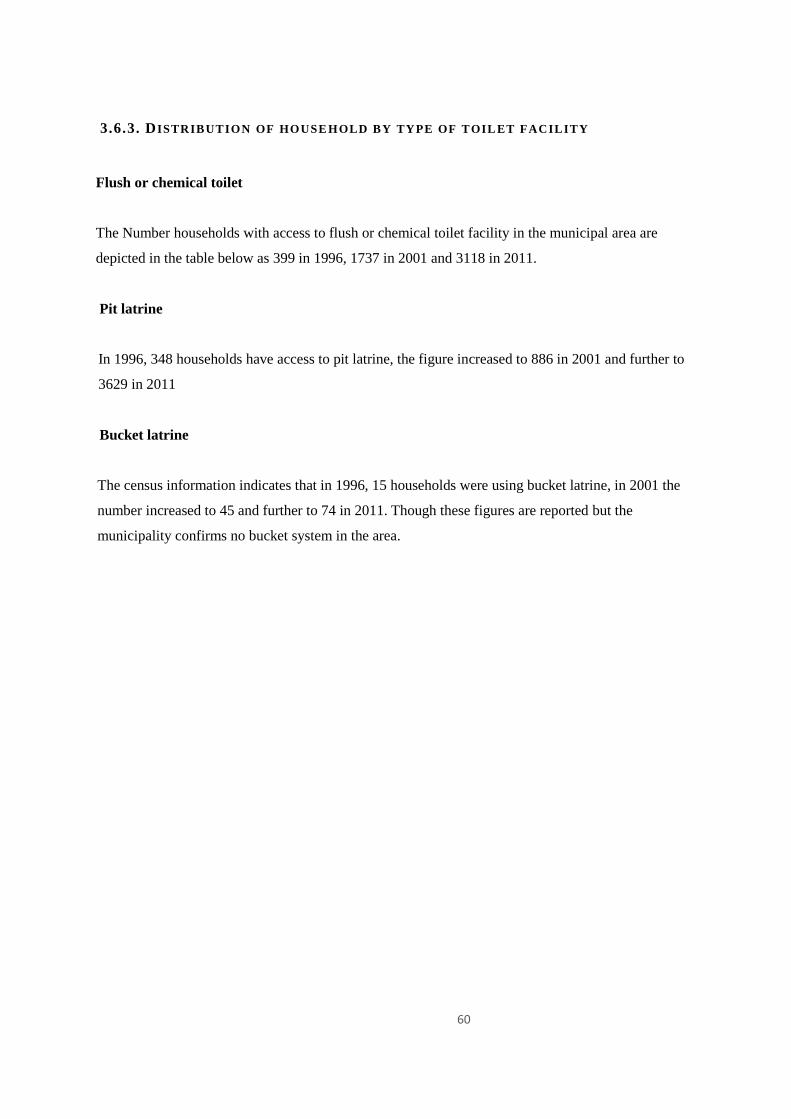
60
3.6.3. DISTRIBUTION OF HOUSE HOLD BY TYPE OF TOIL ET FACILITY
Flush or chemical toilet
The Number households with access to flush or chemical toilet facility in the municipal area are
depicted in the table below as 399 in 1996, 1737 in 2001 and 3118 in 2011.
Pit latrine
In 1996, 348 households have access to pit latrine, the figure increased to 886 in 2001 and further to
3629 in 2011
Bucket latrine
The census information indicates that in 1996, 15 households were using bucket latrine, in 2001 the
number increased to 45 and further to 74 in 2011. Though these figures are reported but the
municipality confirms no bucket system in the area.
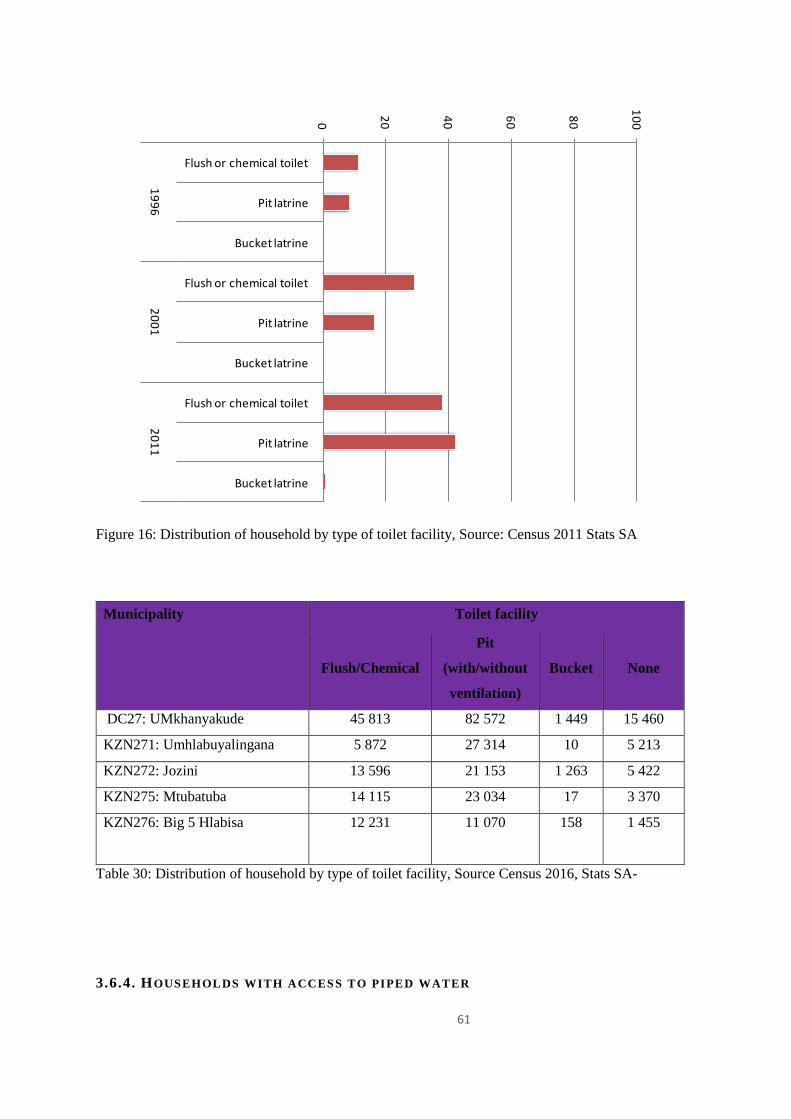
61
Figure 16: Distribution of household by type of toilet facility, Source: Census 2011 Stats SA
Municipality Toilet facility
Flush/Chemical
Pit
(with/without
ventilation)
Bucket None
DC27: UMkhanyakude 45 813 82 572 1 449 15 460
KZN271: Umhlabuyalingana 5 872 27 314 10 5 213
KZN272: Jozini 13 596 21 153 1 263 5 422
KZN275: Mtubatuba 14 115 23 034 17 3 370
KZN276: Big 5 Hlabisa 12 231 11 070 158 1 455
Table 30: Distribution of household by type of toilet facility, Source Census 2016, Stats SA-
3.6.4. HOUSEHOLDS WITH ACCES S TO PIPED WATER
0
20
40
60
80
10
0Flush or chemical toilet
Pit latrine
Bucket latrine
Flush or chemical toilet
Pit latrine
Bucket latrine
Flush or chemical toilet
Pit latrine
Bucket latrine
19
96
20
01
20
11
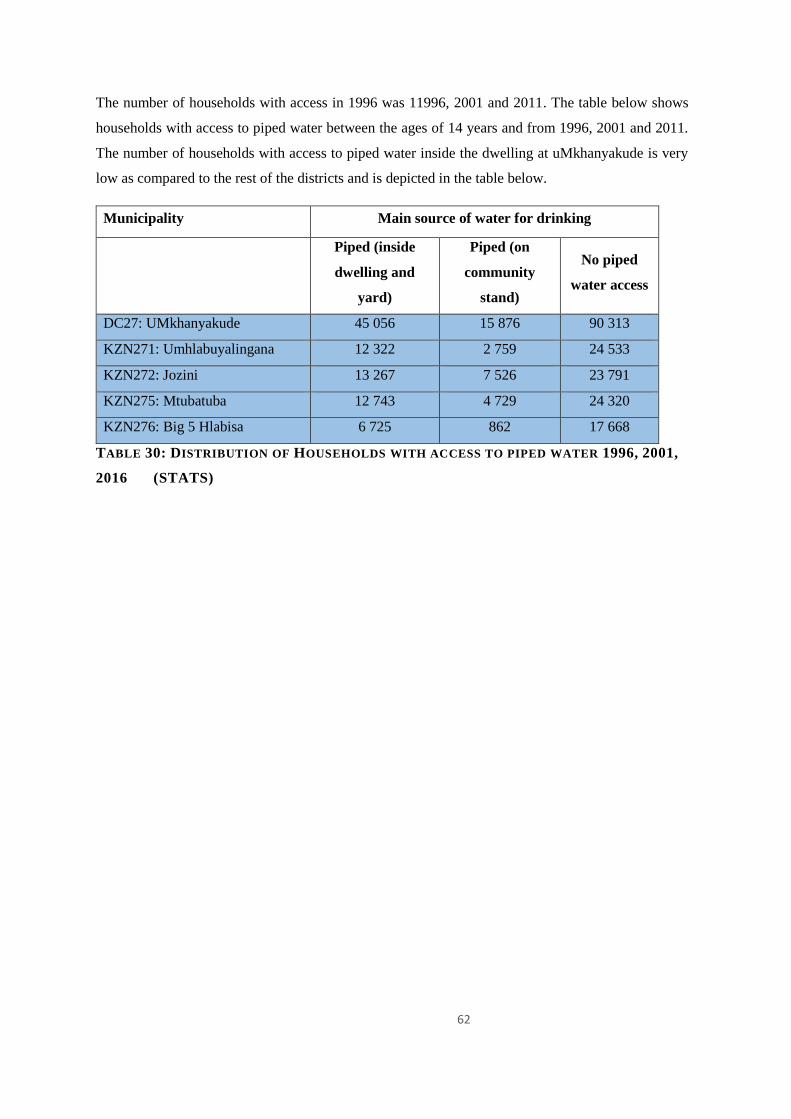
62
The number of households with access in 1996 was 11996, 2001 and 2011. The table below shows
households with access to piped water between the ages of 14 years and from 1996, 2001 and 2011.
The number of households with access to piped water inside the dwelling at uMkhanyakude is very
low as compared to the rest of the districts and is depicted in the table below.
Municipality Main source of water for drinking
Piped (inside
dwelling and
yard)
Piped (on
community
stand)
No piped
water access
DC27: UMkhanyakude 45 056 15 876 90 313
KZN271: Umhlabuyalingana 12 322 2 759 24 533
KZN272: Jozini 13 267 7 526 23 791
KZN275: Mtubatuba 12 743 4 729 24 320
KZN276: Big 5 Hlabisa 6 725 862 17 668
TABLE 30: DISTRIBUTION OF HOUSEHOLDS WITH ACCESS TO PIPED WATER 1996, 2001,
2016 (STATS)
63
SPATIAL AND ENVIRONMENTAL ANALYSIS
b. SPATIAL ANALYSIS
The KwaZulu-Natal is one of the nine (9) provinces of South Africa which lies on the North East Coast
of the country and it is the third smallest in size with total area of 94,361 km2 inhabited by a total
population of 10,456,900 people making it the second most inhabited after Gauteng Province.
UMkhanyakude is one of the ten districts in KZN and has total number of 625 846 people from its four
local municipalities as follows:
uMhlabuyalingana Local Municipality
Jozini Local Municipality
Big 5 -Hlabisa Local Municipality
Mtubatuba Local Municipality
Jozini Municipality has the largest population amongst a total number of 128, 195 households in
uMkhanyakude family of municipalities. The Big 5-Hlabisa Local Municipality is bordered by 3
Municipalities in the UMkhanyakude District, namely Mtubatuba (KZ275) in the South, Jozini (KZ272)
to the North- West and uMhlabuyalingana Municipality to the North-East.
The main road linkages in the district are the N2 which is major route which links Hluhluwe with
Richards Bay and Pongola and the R22, also known as the Lobombo Spatial Development (LSDI)
Initiative, which links Hluhluwe to the Mozambique Border and the R618 linking the south western
part of the municipality to the Zululand district. These roads have also been identified as Major
Corridors within the uMkhanyakude District.
i . ADMINISTRATIVE ENTITI ES
In terms of the Municipal Systems Act 32 of 2000 and the Municipal Structures Act, The Big 5-Hlabisa
local Municipality has two satellite offices located within the town of Hluhluwe (North Eastern) and
Hlabisa (South Western). Both these offices are responsible for the political and administrative function
assigned to it in terms of the powers and functions. However strong Traditional Authority areas exist
within wards and is administered by the Ingonyama Trust board as far as tenure is concerned.
i i . STRUCTURING ELEMENTS
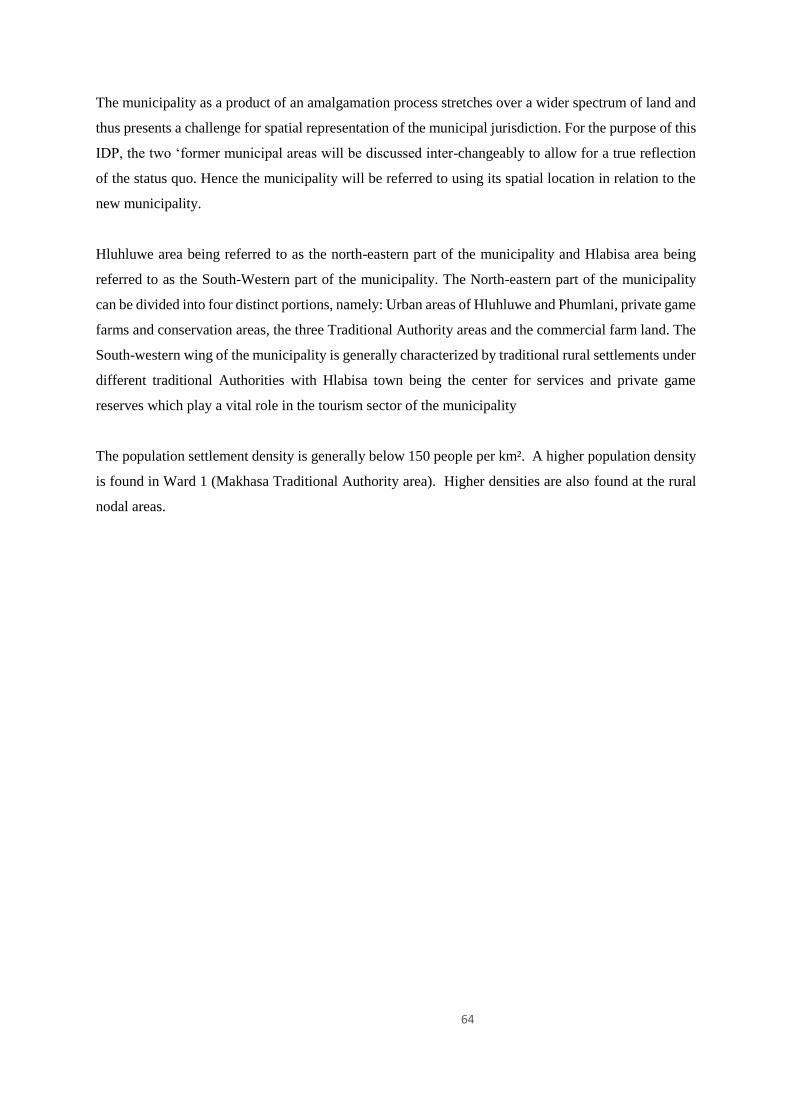
64
The municipality as a product of an amalgamation process stretches over a wider spectrum of land and
thus presents a challenge for spatial representation of the municipal jurisdiction. For the purpose of this
IDP, the two ‘former municipal areas will be discussed inter-changeably to allow for a true reflection
of the status quo. Hence the municipality will be referred to using its spatial location in relation to the
new municipality.
Hluhluwe area being referred to as the north-eastern part of the municipality and Hlabisa area being
referred to as the South-Western part of the municipality. The North-eastern part of the municipality
can be divided into four distinct portions, namely: Urban areas of Hluhluwe and Phumlani, private game
farms and conservation areas, the three Traditional Authority areas and the commercial farm land. The
South-western wing of the municipality is generally characterized by traditional rural settlements under
different traditional Authorities with Hlabisa town being the center for services and private game
reserves which play a vital role in the tourism sector of the municipality
The population settlement density is generally below 150 people per km². A higher population density
is found in Ward 1 (Makhasa Traditional Authority area). Higher densities are also found at the rural
nodal areas.
65
Specific location/spatial characteristics are evident that have shaped the spatial development of the Big
5-Hlabisa Municipality. These include:
Accessibility
The N2 is the main link between Durban, the KZN North Coast, Gauteng and Mpumalanga. It
traverses the area on the west. The LSDI road to Mbazwana and Manguzi is the main access to the
eastern portion of the municipality. Sandy soil conditions in Hluhluwe area particularly ward
04(Nibela) complicate access and many roads are not accessible during the rainy season.
Urban Edge
The delineation of an Urban Edge is crucial in achieving development principles as entrenched in
the chapter 2 of the Spatial Planning Land Use Management Act, 16 of 2013. A proper enforcement
of urban edge would help address the urban sprawl, the intensification of development and the
integration of urban areas. The Urban Edge defines the zone within which the municipality will in
future attempt to upgrade levels of development and infrastructure based on the availability of
resources in the municipality.
The function of the Urban Edge is used to:
Contain urban sprawl
Protect significant environments and resources
Re-orientate growth expectations
Density built environments
Restructure growth patterns
Rationalize service delivery area
The Urban Edge comprises the existing urban components of Hluhluwe and Hlabisa and their
immediate surroundings. The main aim of the urban edge is to attain effective and efficient functionality
of the town. This will be achieved by concentrating on areas that have potential for infill in relation to
the existing settlements in order to achieve growth.
Hluhluwe urban edge is proposed to concentrate development within the mobility routes such as N2
and R22.
i i i . EXISTING NODES & CORRIDORS
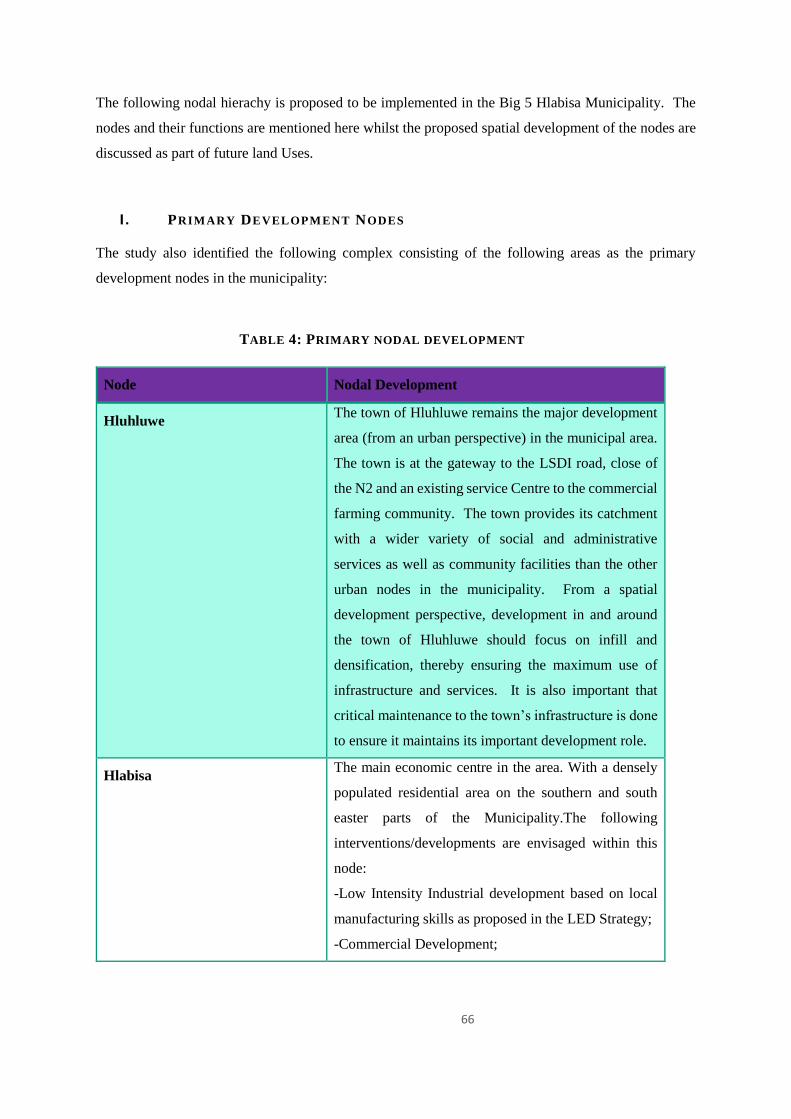
66
The following nodal hierachy is proposed to be implemented in the Big 5 Hlabisa Municipality. The
nodes and their functions are mentioned here whilst the proposed spatial development of the nodes are
discussed as part of future land Uses.
I . PRIMARY DEVELOPMENT NODES
The study also identified the following complex consisting of the following areas as the primary
development nodes in the municipality:
TABLE 4: PRIMARY NODAL DEVELOPMENT
Node Nodal Development
Hluhluwe The town of Hluhluwe remains the major development
area (from an urban perspective) in the municipal area.
The town is at the gateway to the LSDI road, close of
the N2 and an existing service Centre to the commercial
farming community. The town provides its catchment
with a wider variety of social and administrative
services as well as community facilities than the other
urban nodes in the municipality. From a spatial
development perspective, development in and around
the town of Hluhluwe should focus on infill and
densification, thereby ensuring the maximum use of
infrastructure and services. It is also important that
critical maintenance to the town’s infrastructure is done
to ensure it maintains its important development role.
Hlabisa The main economic centre in the area. With a densely
populated residential area on the southern and south
easter parts of the Municipality.The following
interventions/developments are envisaged within this
node:
-Low Intensity Industrial development based on local
manufacturing skills as proposed in the LED Strategy;
-Commercial Development;
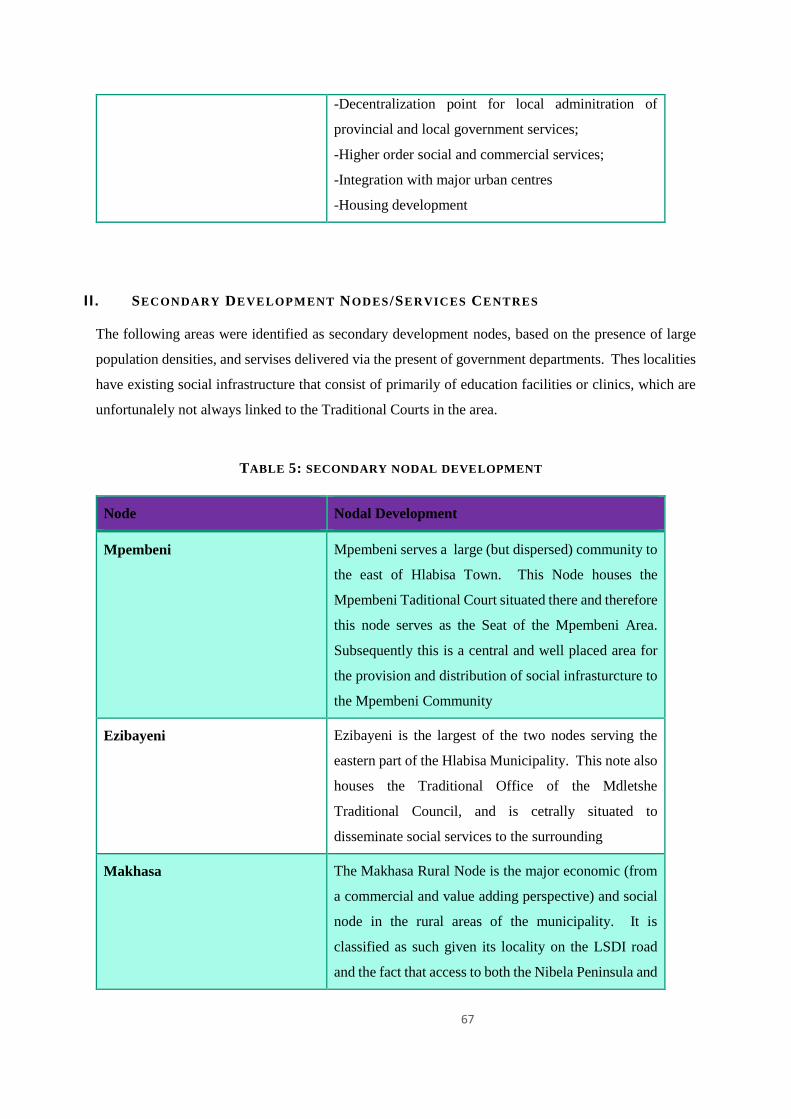
67
-Decentralization point for local adminitration of
provincial and local government services;
-Higher order social and commercial services;
-Integration with major urban centres
-Housing development
I I . SECONDARY DEVELOPMENT NODES /SERVICES CENTRES
The following areas were identified as secondary development nodes, based on the presence of large
population densities, and servises delivered via the present of government departments. Thes localities
have existing social infrastructure that consist of primarily of education facilities or clinics, which are
unfortunalely not always linked to the Traditional Courts in the area.
TABLE 5: SECONDARY NODAL DEVELOPMENT
Node Nodal Development
Mpembeni Mpembeni serves a large (but dispersed) community to
the east of Hlabisa Town. This Node houses the
Mpembeni Taditional Court situated there and therefore
this node serves as the Seat of the Mpembeni Area.
Subsequently this is a central and well placed area for
the provision and distribution of social infrasturcture to
the Mpembeni Community
Ezibayeni Ezibayeni is the largest of the two nodes serving the
eastern part of the Hlabisa Municipality. This note also
houses the Traditional Office of the Mdletshe
Traditional Council, and is cetrally situated to
disseminate social services to the surrounding
Makhasa The Makhasa Rural Node is the major economic (from
a commercial and value adding perspective) and social
node in the rural areas of the municipality. It is
classified as such given its locality on the LSDI road
and the fact that access to both the Nibela Peninsula and
68
the Phinda Game Reserve is gained from it. There are
already a number of developments in the node with a
major sport stadium completed. There is also
increasing pressure for the further development of the
node as its economic and social role is recognized by
the community and investors alike. As such, it is
imperative that a framework for the development of the
Makhasa Node be prepared in the short term to ensure
the orderly (and sustainable) development of the node.
III. TERTIARY DEVELOPMENT NODES
Tertiary nodes are the second lowest order nodes which may develop a nucleus and emerge into higher
order nodes over time. A range of services for local communities could be concentrated within these
nodes in a sustainable way. In identifying suitable/optimal locations. These include, amonst other
factors:
Density and distributed of population to be served
Level of existing economic activity
Proximity of transport routes and modes of transport
Topography of locality
Land Tenure arrangements
Level of service infrastructure
The following nodes were identified as tertiary nodes:
Ngebeza
Nhlwathi
Mthekwini
Mganwini
Rural Settlement Clusters
Rural Clusters are the lowest order nodes found within Big 5 Hlabisa Municipality. High level services
cannot be provided cost-effectively within these areas and initiatives will be aimed at basic service
delivery.
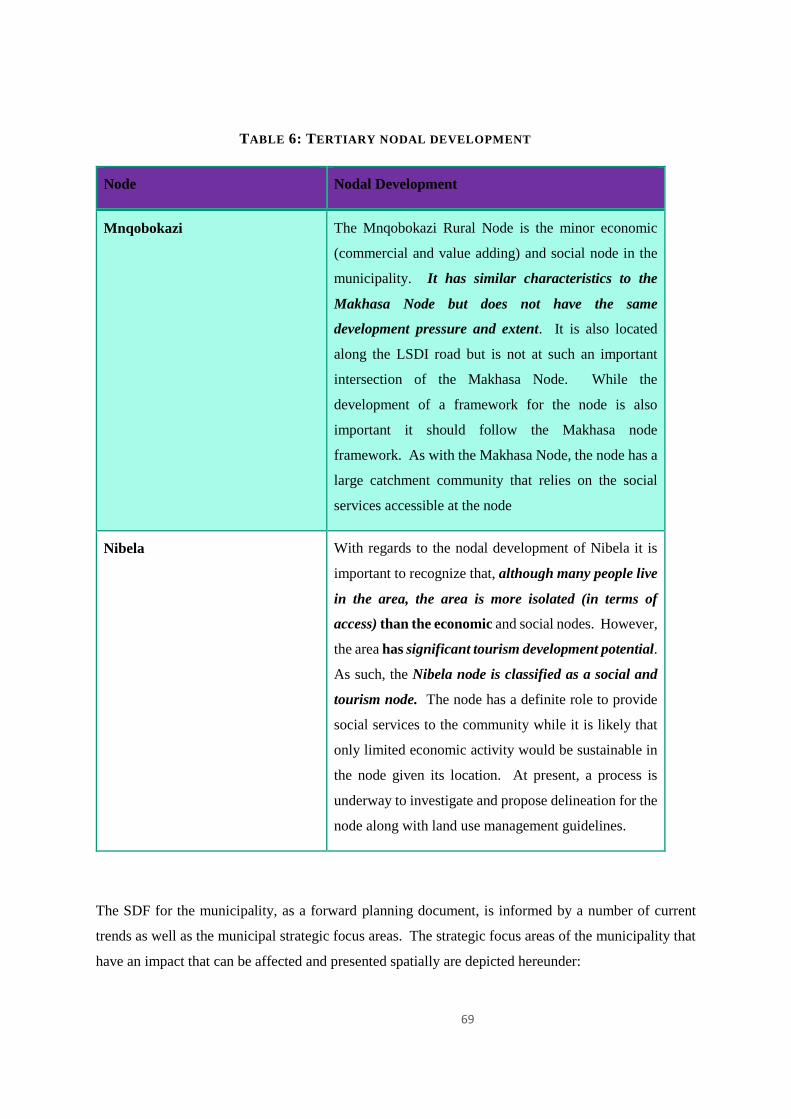
69
TABLE 6: TERTIARY NODAL DEVELOPMENT
Node Nodal Development
Mnqobokazi The Mnqobokazi Rural Node is the minor economic
(commercial and value adding) and social node in the
municipality. It has similar characteristics to the
Makhasa Node but does not have the same
development pressure and extent. It is also located
along the LSDI road but is not at such an important
intersection of the Makhasa Node. While the
development of a framework for the node is also
important it should follow the Makhasa node
framework. As with the Makhasa Node, the node has a
large catchment community that relies on the social
services accessible at the node
Nibela With regards to the nodal development of Nibela it is
important to recognize that, although many people live
in the area, the area is more isolated (in terms of
access) than the economic and social nodes. However,
the area has significant tourism development potential.
As such, the Nibela node is classified as a social and
tourism node. The node has a definite role to provide
social services to the community while it is likely that
only limited economic activity would be sustainable in
the node given its location. At present, a process is
underway to investigate and propose delineation for the
node along with land use management guidelines.
The SDF for the municipality, as a forward planning document, is informed by a number of current
trends as well as the municipal strategic focus areas. The strategic focus areas of the municipality that
have an impact that can be affected and presented spatially are depicted hereunder:
70
To create an enabling environment for effective service delivery
To actively pursue social and economic development
To maintain a strong environmental focus.
The SDF for Big 5 Hlabisa is based on land use and natural features (as well as existing community
facilities), the transportation network and nodes, i.e. areas of development or investment. Future
development proposals around these are informed by the strategic focus areas listed above
Land uses and natural features in and adjoining the municipal area that are significant from a spatial
development perspective are the Greater St Lucia Wetland Park, Private Game Reserves. The
population density map shows that the areas listed above have very low population densities as well.
The distribution of community facilities (namely schools and clinics) clearly follows the areas of highest
population density and is not located in these areas of environmental significance. From a spatial
development perspective these areas are protected by way of an Interface Area that buffers the areas of
environmental significance from extensive development intrusion. Rather, limited agriculture and eco-
tourism is suggested to be undertaken in these interface areas.
With regard to the Transportation Network the SDF does not indicate corridors but rather transport
routes with a distinction between the types of transport network. Thus, there is caution not to identify
corridors that may be perceived to be promoting ribbon development. The following type of transport
routes are identified in the SDF
The N2 and the LSDI Road are national roads. They present the municipal area with development
potential in that they provide access to areas with development potential by way of other non-
national roads that intersect with them. Access off these roads is not readily attained /permissible.
The N2 in particular (and the LSDI road to a smaller degree) carries larger volumes of traffic than
the other roads through the municipal area at higher traveling speeds. As such, the N2 and the LSDI
are classified in terms of the SDF as Main Transport Routes. Importantly, these routes have
limitations on the distance (not only access) of development from them by way of road building
lines. These have to be abided by for safety purposes and the fact the infrastructure services are in
the road reserve of the LSDI road in particular.
There are a number of Tourism Routes identified in the SDF as well.
The first one is the P466. It primarily provides access to the various private game reserves
located in the northern portion of the municipal area between the N2 and the LSDI road.
71
This area described above is referred to as a “Management Area” in the draft rural LUMS.
A variety of tourism and recreational related activities take place in this area that need to
be managed in terms of the appropriate legislation.
The R22 route is a gateway route for Hluhluwe and a tourism corridor
Secondly, the route from Hluhluwe in a westerly direction, across the N2, towards the
northern entrance of the Hluhluwe Umfolozi Game Reserve is proposed as a tourism route
in the SDF. A portion of this route is the entrance into Hluhluwe town from the N2.
The circular route that provides access to the False Bay and numerous private resorts to the
west of Lake St Lucia is also a very important tourism route in the SDF.
A further route that is considered to be a tourism route is the route that provides access
from Makhasa to Nibela (in a south easterly direction) and towards Mnqobokazi in the
north. It is the proximity of the area that is served by this route to Lake St Lucia and the
Greater St Lucia Wetland Park that has contributed to is proposed tourism route status. The
area referred to has inherent tourism potential.
Access to the various private game reserves is also gained from Makhasa in a westerly
direction as shown on the SDF map as well.
iv. ROADS AND CORRIDORS
With regard to the Transportation Network the SDF does not indicate corridors but rather transport
routes with a distinction between the types of transport network. Thus, there is caution not to identify
corridors that may be perceived to be promoting ribbon development. The following type of transport
routes are identified in the SDF
The N2 and the LSDI Road are national roads. They present the municipal area with development
potential in that they provide access to areas with development potential by way of other non-national
roads that intersect with them. Access off these roads is not readily attained /permissible. The N2 in
particular (and the LSDI road to a smaller degree) carries larger volumes of traffic than the other roads
through the municipal area at higher traveling speeds. As such, the N2 and the LSDI are classified in
terms of the SDF as Main Transport Routes. Importantly, these routes have limitations on the distance
(not only access) of development from them by way of road building lines. These have to be abided by
for safety purposes and the fact the infrastructure services are in the road reserve of the LSDI road in
particular.
72
There are a number of Tourism Routes identified in the SDF as well.
The first one is the P466. It primarily provides access to the various private game reserves
located in the northern portion of the municipal area between the N2 and the LSDI road.
This area described above is referred to as a “Management Area” in the draft rural LUMS.
A variety of tourism and recreational related activities take place in this area that need to
be managed in terms of the appropriate legislation.
The R22 route is a gateway route for Hluhluwe and a tourism corridor .
Secondly, the route from Hluhluwe in a westerly direction, across the N2, towards the
northern entrance of the Hluhluwe Umfolozi Game Reserve is proposed as a tourism route
in the SDF. A portion of this route is the entrance into Hluhluwe town from the N2.
The circular route that provides access to the False Bay and numerous private resorts to the
west of Lake St Lucia is also a very important tourism route in the SDF.
A further route that is considered to be a tourism route is the route that provides access
from Makhasa to Nibela (in a south easterly direction) and towards Mnqobokazi in the
north. It is the proximity of the area that is served by this route to Lake St Lucia and the
Greater St Lucia Wetland Park that has contributed to is proposed tourism route status. The
area referred to has inherent tourism potential.
Access to the various private game reserves is also gained from Makhasa in a westerly
direction as shown on the SDF map as well.
v. BROAD LAND USES
A draft Land Use Management Framework Plan that also serves as the Rural Town Planning Scheme
for the municipality, has been prepared that proposes the following zones.
Agriculture
Education
Medium Impact Mixed Use
Management Area
Traditional Settlement
73
Existing and future movement corridors
Existing Railways
National Parks and Equivalent Reserves
Communications Towers
The following comments should be noted:
The extent of the Hluhluwe Town Planning Scheme area is indicated as a town planning scheme
area and has its own zonings and land development controls.
The Management Area is defined and has its own policy statements and recommended land
management controls.
In each of the three Traditional Authority Areas, the municipality has identified the need for rural
housing development which is progress. Communities have been provided with access to housing
and the current and future projects are underway. Department of Human Settlement is in the
process of initiating rural housing projects. These projects will include the preparation of
settlement plans that will, once completed, become formal zoning plans that form part of the
Municipal LUMS.
The following descriptions for the rural zones referred to on the previous page are expanded
upon hereunder out of the draft Land Use Management Framework Plan:
ZONE DESCRIPTION
Agriculture The primary purpose of this zone is to protect land agricultural land within
the greater municipal area. The zone is to ensure that agricultural land is
utilized in accordance with national legislation and regional policy
guidelines related to sustainable development, agricultural production and
natural resources.
Existing Roads This zone shows the major existing roads that have structured and affect
land use patterns in Hluhluwe.
Existing Railway Shows the existing railway and other structural features of the
municipality.
74
ZONE DESCRIPTION
Management Area This zone is in close proximity to the town of Hluhluwe and is located
between the Mzinene River to the west and north and the Greater St Lucia
Wetland Park (GSLWP), a World Heritage Site to the east. This area is
designated as ‘Mixed Use Tourism’ in the IDP and has had numerous
development inquiries and applications for residential and holiday
accommodation.
The intention of this zone is firstly, to prevent urban sprawl, secondly
to carefully assess the potential impact of any proposed development
on this land adjoining the GSLWP, a World Heritage Site, and thirdly
to try to ensure a range of tourist accommodation for all income
groups. Assessing the economic potential of development in any area
is difficult especially if those doing the assessing are carrying no
commercial risk. For this reason, the controls have been designed to
ensure that the environmental impact of proposed developments
remains a priority in assessing proposals in this zone.
To avoid the creation of high land values that result from identifying
nodes for development of agricultural land each development
application must be subject to an environmental scoping report subject
to a Record of Decision from the Department of Agriculture and
Environmental Affairs before development can be approved.
The area has been intensively subdivided over the years and includes
many subdivisions less than 10Ha in extent. The intention is to limit
development in this area to low density developments that will provide
accommodation and options for eco-tourism ventures but preserve the
sense of place.
The agricultural suitability of land in this zone is rated as moderate and
the vegetation of this bio-resource group in this area is sandy bush and
palm veld with extensive farming (Bio-resource Program KZN).
It is also recommended that the high capital costs of developing tourist
accommodation be investigated with a view to developing a
government assisted loan policy to assist the development of tourist
oriented accommodation.
75
ZONE DESCRIPTION
Medium Impact
Mixed Use
This zone is to encourage the development of a central business district in
the SERC’s in Makhasa and Mnqobokazi and the Opportunity Node in
Nibela. All development required in urban areas that serve the adjoining
rural areas is encouraged to locate in these mixed use areas so that in the
future it will ultimately be possible for the authorities in the area to service
them on a sustainable basis.
For the reasons outlined earlier discussions held with the
Traditional Authorities, to develop acceptable methods of
incorporating them into existing land management procedures and
the proposed LUMS, were not successful. It is suggested that
negotiations between the councilors and the Traditional
Authorities be commenced as soon as possible. There is a need to
establish a mutually agreed administrative mechanism in the short
term to ensure that changing land use information from the
Traditional Areas, whether authorized in terms of development
legislation or not, is included in the land use information database
of the municipality.
This mechanism could ensure that land use allocations and
changes made in the Traditional Areas are passed on to the
municipality. This would ensure that the actual ongoing land uses
in these areas can be recorded the municipality’s land use
information database even though the formal legal processes for
integrating land allocation procedures in the Traditional Areas
have not yet been established. This information will be extremely
valuable to all authorities involved in development and can only
improve future land development decisions. It is not suggested that
any laws be flouted by any authorities and applications of any uses
requiring approval from government authorities must be made.
National Parks and
Equivalent Reserves
This zone recognizes all existing Game Parks in the municipal area. The
parks are all managed by competent public or private authorities and have
controlled public access.
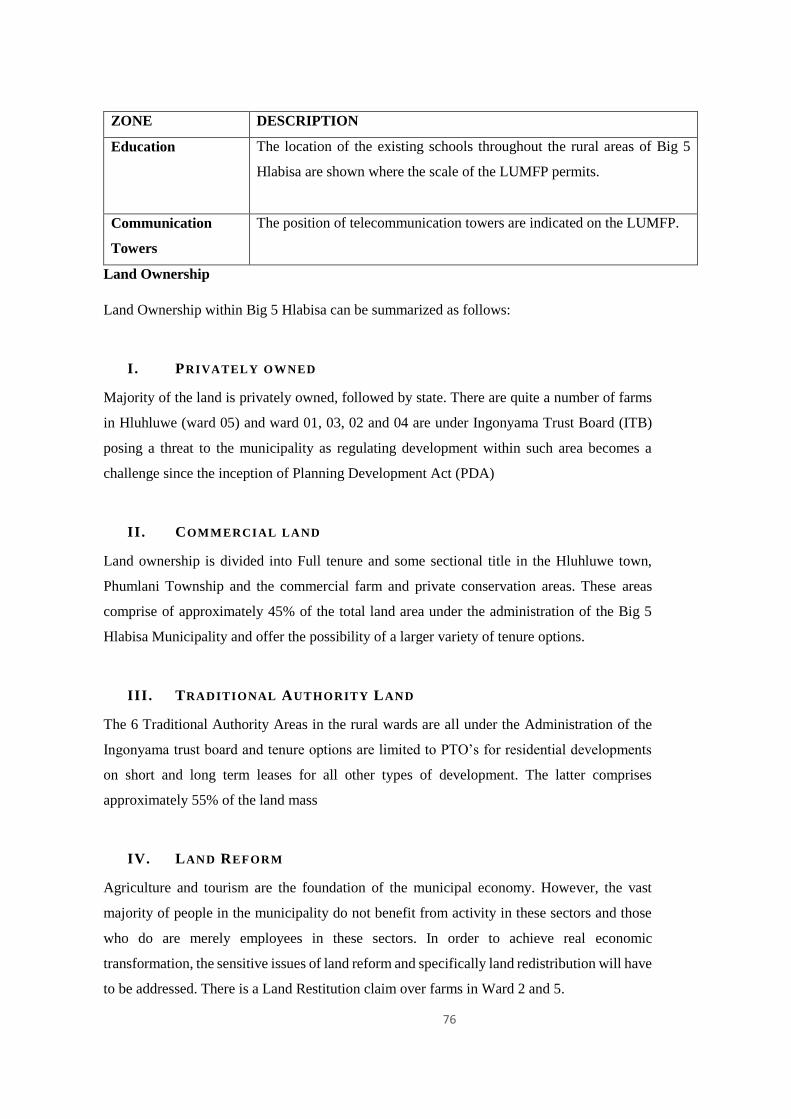
76
ZONE DESCRIPTION
Education The location of the existing schools throughout the rural areas of Big 5
Hlabisa are shown where the scale of the LUMFP permits.
Communication
Towers
The position of telecommunication towers are indicated on the LUMFP.
Land Ownership
Land Ownership within Big 5 Hlabisa can be summarized as follows:
I . PRIVATELY OWNED
Majority of the land is privately owned, followed by state. There are quite a number of farms
in Hluhluwe (ward 05) and ward 01, 03, 02 and 04 are under Ingonyama Trust Board (ITB)
posing a threat to the municipality as regulating development within such area becomes a
challenge since the inception of Planning Development Act (PDA)
II. COMMERCIAL LAND
Land ownership is divided into Full tenure and some sectional title in the Hluhluwe town,
Phumlani Township and the commercial farm and private conservation areas. These areas
comprise of approximately 45% of the total land area under the administration of the Big 5
Hlabisa Municipality and offer the possibility of a larger variety of tenure options.
III. TRADITIONAL AUTHORITY LAND
The 6 Traditional Authority Areas in the rural wards are all under the Administration of the
Ingonyama trust board and tenure options are limited to PTO’s for residential developments
on short and long term leases for all other types of development. The latter comprises
approximately 55% of the land mass
IV. LAND REFORM
Agriculture and tourism are the foundation of the municipal economy. However, the vast
majority of people in the municipality do not benefit from activity in these sectors and those
who do are merely employees in these sectors. In order to achieve real economic
transformation, the sensitive issues of land reform and specifically land redistribution will have
to be addressed. There is a Land Restitution claim over farms in Ward 2 and 5.
77
V. LAND CLAIMS
A total of three claim areas in Hluhluwe have been identified. It is noted that all the three areas
have been stated as settled areas by the Department of Rural Development and Land Reform
(DRDLR). It is hoped that with the recently reviewed legislation will help in resolving some
of the land claims. The table below specifies the land claims in details as follows:
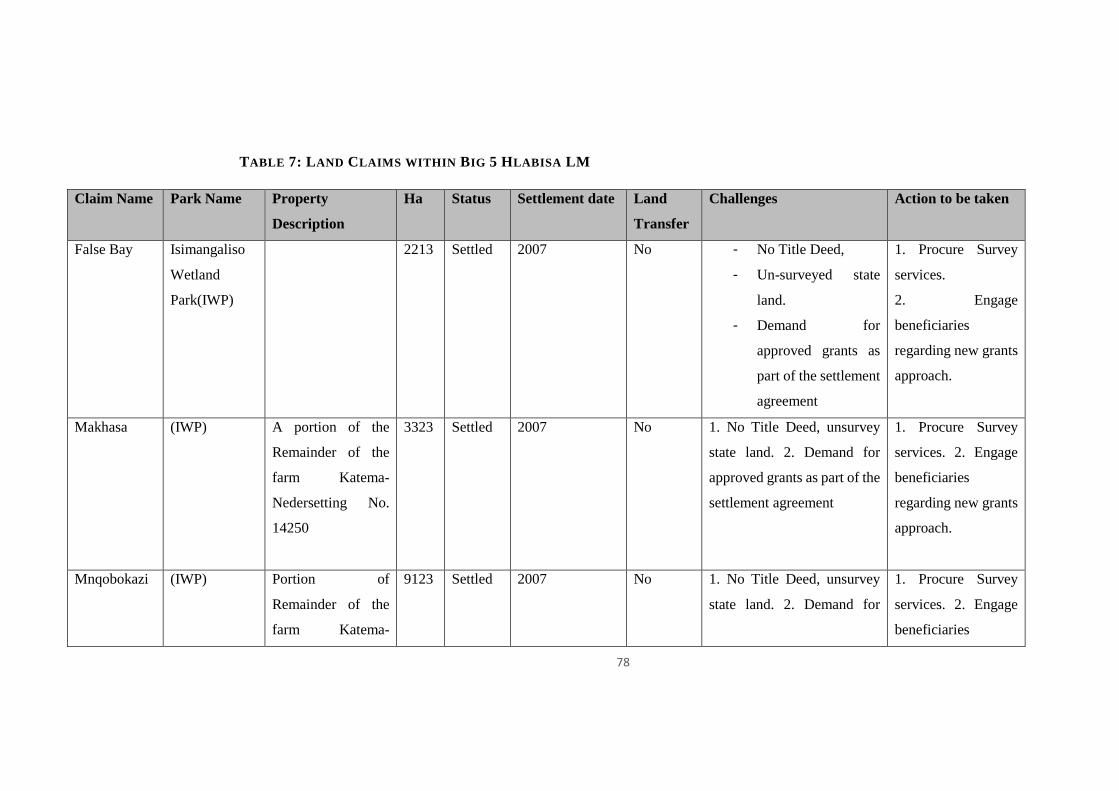
78
TABLE 7: LAND CLAIMS WITHIN BIG 5 HLABISA LM
Claim Name Park Name Property
Description
Ha Status Settlement date Land
Transfer
Challenges Action to be taken
False Bay Isimangaliso
Wetland
Park(IWP)
2213 Settled 2007 No - No Title Deed,
- Un-surveyed state
land.
- Demand for
approved grants as
part of the settlement
agreement
1. Procure Survey
services.
2. Engage
beneficiaries
regarding new grants
approach.
Makhasa (IWP) A portion of the
Remainder of the
farm Katema-
Nedersetting No.
14250
3323 Settled 2007 No 1. No Title Deed, unsurvey
state land. 2. Demand for
approved grants as part of the
settlement agreement
1. Procure Survey
services. 2. Engage
beneficiaries
regarding new grants
approach.
Mnqobokazi (IWP) Portion of
Remainder of the
farm Katema-
9123 Settled 2007 No 1. No Title Deed, unsurvey
state land. 2. Demand for
1. Procure Survey
services. 2. Engage
beneficiaries
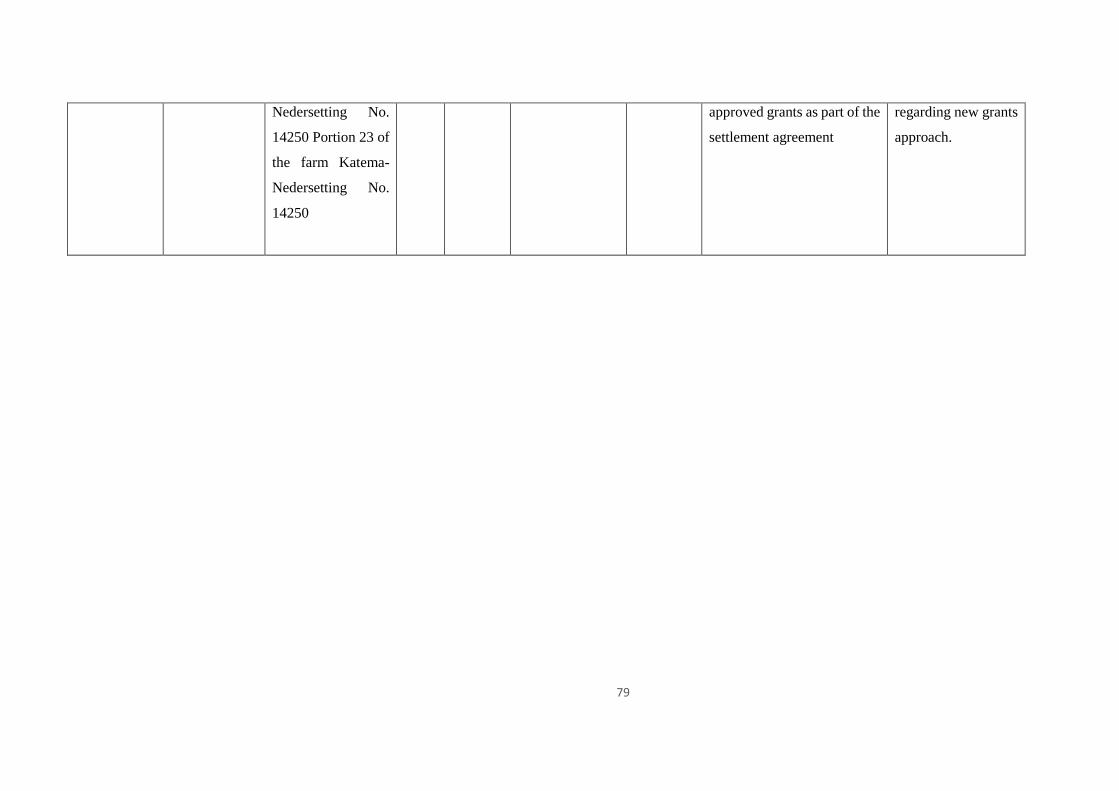
79
Nedersetting No.
14250 Portion 23 of
the farm Katema-
Nedersetting No.
14250
approved grants as part of the
settlement agreement
regarding new grants
approach.
80
vi. LAND CAPABILITY
The land Capability of an area is ultimately what informs a sustainable Spatial Development Framework
and the following needs to be taken into account
Balance between urban and rural land development.
Urban and rural areas should be developed in support of each other.
The discouragement of urban sprawl by encouraging settlement on serviced land within existing
nodes.
The direction of new development towards logical infill areas.
Rural settlements should be developed to an acceptable standard of services and infrastructure.
Compact urban form is desirable.
Development should integrate social, economic, institutional and environmental aspects.
Sensitive, vulnerable, highly dynamic or stressed ecosystems require specific attention in
management and planning procedures, especially where they are subject to significant human
resource usage and development pressure.
Development should be within limited resources (financial, institutional and physical).
Stimulate and reinforce cross boundary linkages, i.e. between the Municipality, conservation areas
and the Greater St Lucia Wetland Park.
A Spatial Development Framework (SDF) should indicate areas where strategic intervention is
required and should act as marketing tool to indicate where development can be promoted.
c. ENVIRONMENTAL ANALYSIS
i . INTRODUCTION
The purpose of the environmental analysis is to ensure that municipal development strategies and projects
take existing environmental problems and threats into consideration as well as environmental assets that
require protection or controlled management.
While the principal duty of a municipality is to govern the affairs of that municipality in accordance with
the Constitution and relevant legislation, especially the Structures Act and the Systems Act; the
environmental right contained in the Bill of Rights imposes another important duty on municipalities. As
such municipalities play a fundamental role in the protection of the environment. In fact, they are obliged
to ensure that the environment is protected for present and future generations.
81
The National Environmental Management Act (Act 107 of 1998), or otherwise referred to as NEMA,
together with The Environmental Conservation Act (Act 73 of 1989), promote Integrated Environmental
Management (IEM) in South Africa in order to promote and support sustainable development.
The Big 5 Hlabisa municipality (KZ276) is one of the three coastal municipalities in uMkhanyakude
District, and as such sharing its borders with the iSimangaliso Wetlands Park world heritage site. The
municipality district is characterised by its game reserves, both private and state owned, marine protected
areas and natural forests.
82
i i . BIOPHYSICAL ENVIRONMENT
The biophysical environment is regarded as the biotic and abiotic components of the natural environment,
and their interrelationship with each other
I. CLIMATE
The Big 5 Hlabisa falls within the humid subtropical region. A summary of the climatic conditions
measured at the Hluhluwe - Glenpark [28°8'S, 32°17'E] weather station is as follows:
Highest total rainfall = 190.0 mm - January 2011;
Lowest total rainfall = 36.6 mm - January 2008;
Highest temperature = 32 ºC - March 2011; and
Minimum temperature = 10.3 ºC - June 2011.
II. HYDROLOGY
1. MAJOR WATERCOURSES AN D WETLANDS
The Big 5 Hlabisa LM has a relatively flatter topography. There is a combination of perennial and non-
perenial river systems. The municipality are is drained by the Mzinene River, which flows into iSimangaliso
Wetland Park to eventually drain into the Indian Ocean. The Hluhluwe River (a perennial system) drains
eastward toward iSimangaliso Wetland Park.
There is also the Mfolozi River (forming the southern boundary of the municipal area) and the Nyalazi
River (draining the central area), which also forms the eastern boundary of the area. The Nyalazi River
drains northwards toward iSimangaliso Wetland Park. This municipal area is also rich in wetland habitat
units, including floodplain and pan-type wetland habitat units.
2. ECOLOGICAL STATUS OF THE MAJOR RIVERS
Monitoring as part of the River Health Programme (RHP) within the UKDM is seemingly lacking as only
relatively few monitoring points are routinely surveyed. This is partly due to inaccessibility and rurality of
many of the watercourses, lack of personnel and resources to undertake regular monitoring or to expand on
the monitoring schemes to incorporate more sites.
83
Of the eleven (11) monitoring sites within or associated with the uMkhanyakude District; three (3) are along
the Mkuze River, Mzinene River, Hluhluwe River and 2 along the Mfolozi River. Indeed, it is reported
that not enough data are available to produce either a technical report or a State of Rivers report on the
ecological state of the rivers in the Usutu to Mhlatuze WMA (DWA, 2007). This would include the rivers
within the Big 5 Hlabisa.
The Big 5 Hlabisa LM is regarded as a major source of fresh water in the region. In recent years, declining
quantity of fresh water is observed in the rivers and streams of the municipality as is the case generally in
the country. Catchment management objectives and agencies are inactive in the municipality. Given that
South Africa is water stressed country, the water resources (including riparian zones, river banks, vegetation
conservation etc.) within the municipality has to be effectively managed. Studies show that the water
demand within the Umfolozi catchment within which the Hlabisa LM falls by far exceeds the available
supply.
Substantial reaches and catchments of many of the major rivers are incorporated within formally protected
areas and therefore have a high conservation status. This has largely allowed for the major rivers to have
retained overall ecological integrity and functionality. A major ecological driving force of the larger rivers
is erosion within the catchment areas – especially within the catchments that support tribal lands utilised
for livestock grazing and subsistence agriculture. Soil erosion within these areas is of major significance
to the watercourses within the region, leading to sedimentation and consequential smothering of aquatic
habitat.
Overburdened rivers deposit these silts and sediments within the estuaries and coastal lagoons, which
impacts the estuarine ecological integrity by unnatural closure of the estuarine mouth into the ocean. This
inhibits interaction of the rivers within the oceans, which impacts on biodiversity at the regional scale
because of the lack of migrational movement of aquatic biota.
Upper Mfolozi River catchment suffers from faecal and nutrient (Vryheid and nearby informal settlement
areas) and the Black Mfolozi suffers elevated sulphate levels due to mining activities within the catchment
areas (Mosai, 2004), but these seem to not pose a risk to the Mfolozi River within the Big 5 Hlabisa. The
lower Mfolozi River is reportedly highly impacted through sugarcane farming that has largely transformed
riparian zones and coastal swamplands. The PES of the lower Mfolozi River should then also rather reflect
a Class C PES (DWA, 2002). Water quality assessments (DWA, 2012) indicate that the Mfolozi River has
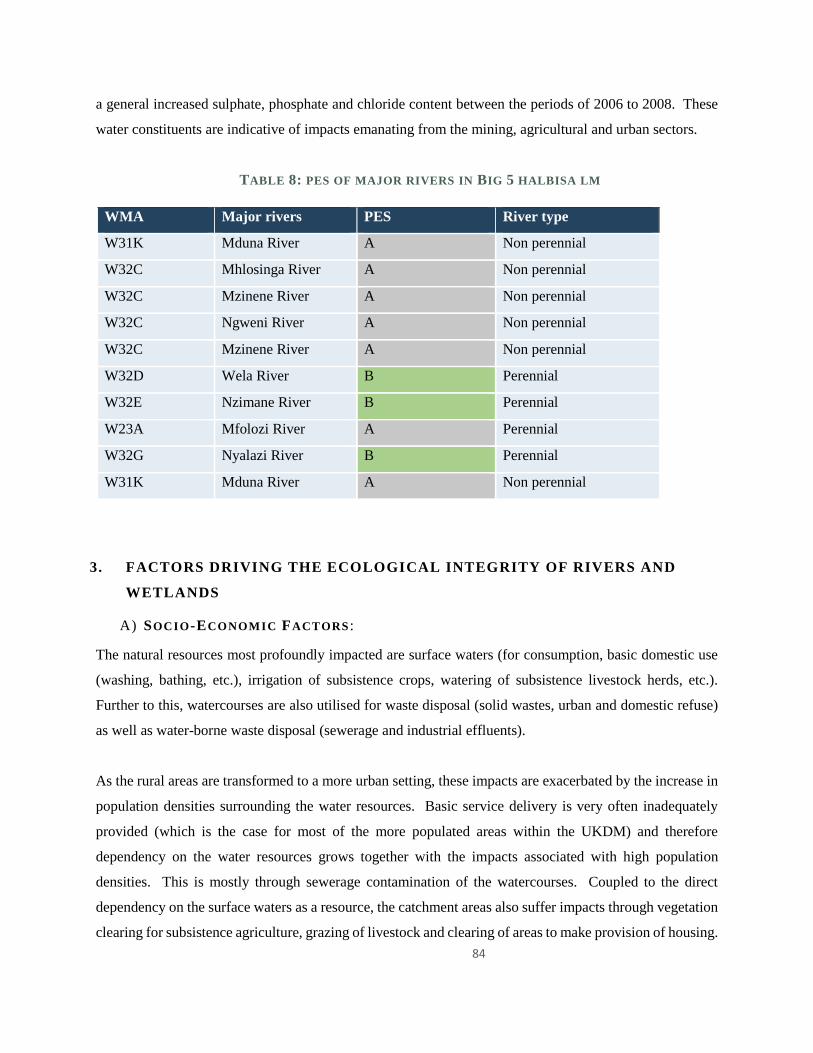
84
a general increased sulphate, phosphate and chloride content between the periods of 2006 to 2008. These
water constituents are indicative of impacts emanating from the mining, agricultural and urban sectors.
TABLE 8: PES OF MAJOR RIVERS IN BIG 5 HALBISA LM
WMA Major rivers PES River type
W31K Mduna River A Non perennial
W32C Mhlosinga River A Non perennial
W32C Mzinene River A Non perennial
W32C Ngweni River A Non perennial
W32C Mzinene River A Non perennial
W32D Wela River B Perennial
W32E Nzimane River B Perennial
W23A Mfolozi River A Perennial
W32G Nyalazi River B Perennial
W31K Mduna River A Non perennial
3. FACTORS DRIVING THE ECOLOGICAL INTEGRITY OF RIVERS AND
WETLANDS
A) SOCIO-ECONOMIC FACTORS :
The natural resources most profoundly impacted are surface waters (for consumption, basic domestic use
(washing, bathing, etc.), irrigation of subsistence crops, watering of subsistence livestock herds, etc.).
Further to this, watercourses are also utilised for waste disposal (solid wastes, urban and domestic refuse)
as well as water-borne waste disposal (sewerage and industrial effluents).
As the rural areas are transformed to a more urban setting, these impacts are exacerbated by the increase in
population densities surrounding the water resources. Basic service delivery is very often inadequately
provided (which is the case for most of the more populated areas within the UKDM) and therefore
dependency on the water resources grows together with the impacts associated with high population
densities. This is mostly through sewerage contamination of the watercourses. Coupled to the direct
dependency on the surface waters as a resource, the catchment areas also suffer impacts through vegetation
clearing for subsistence agriculture, grazing of livestock and clearing of areas to make provision of housing.
85
These are impacts within the catchment areas that also have profound impacts on the surface waters as a
resource as well as the ecological integrity of the surface waters as a habitat unit. The locality of the
watercourses within the topographical profiles (the bottom of valleys, etc.) usually means that the
watercourses receive the runoff from the entire catchment. The overall ecological health of an aquatic or
wetland system can therefore be a reflection of the overall health of the catchment area.
The uMkhanyakude District as a whole faces increasing levels of disaster risk. It is exposed to a wide range
of natural hazards, including severe storms that can trigger widespread hardship and devastation. This could
lead to flooding of storm water management systems, overflowing of sewerage disposal systems and
flooding of waste disposal systems. Flooding and overtopping of these mechanisms will lead to dangerous
effluents and leachates entering the aquatic and wetland habitats through storm water runoff.
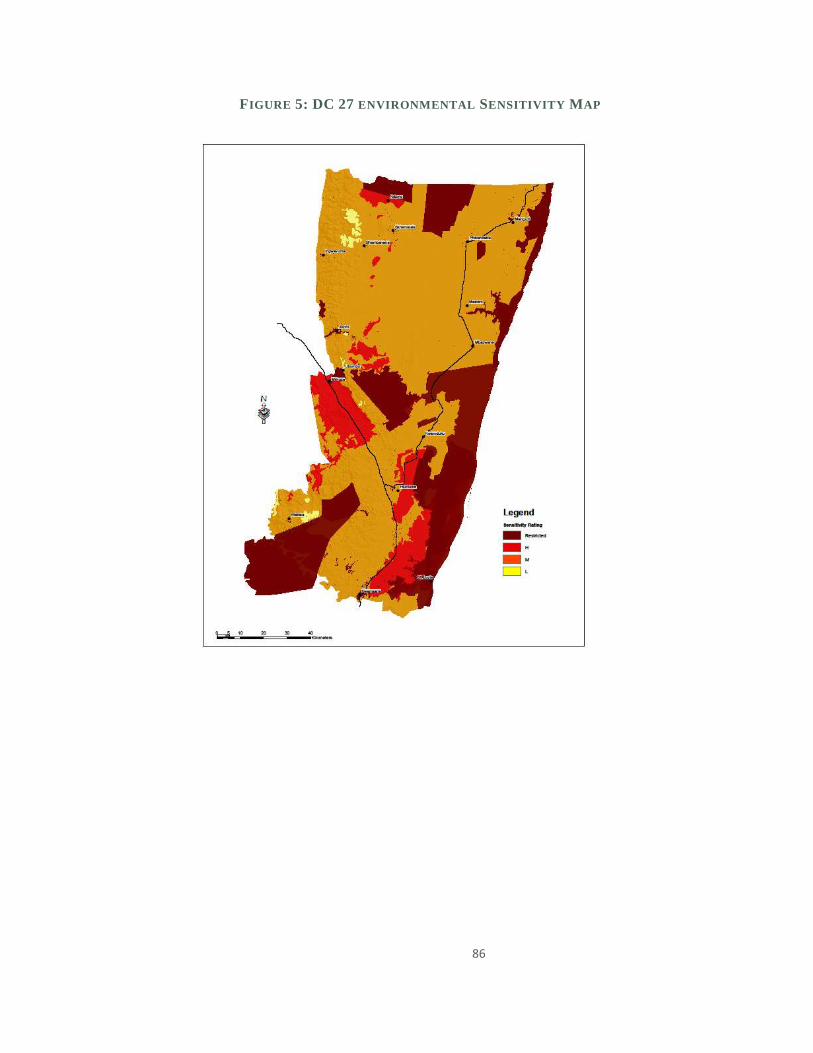
86
FIGURE 5: DC 27 ENVIRONMENTAL SENSITIVITY MAP
87
i i i . CLIMATE CHANGE
Climate change concern is not for Big 5 Hlabisa Municipality only, but it is a global. National, Provincial
and local government concern. Development Intervention needs consider changes in climate. The
development is sustainable if it considers issues of development without compromising future development
of the area that will be realized if social, economic and environmental issues inform development of the
area. The SDF articulate the pattern that must be followed in developing the municipal space.
Climate change pose challenges, the municipality will develop alternative energy source which will further
promote the use of alternative energy including renewable energy technologies furthermore the
municipality will ensure the following:
Ensures the municipality's preparedness to climate change risks
Develop Climate Change Strategy and implementation plan
Operated waste disposal site according to legal requirements
Control illegal dumping and eradicate dumping hotspots
Development of Integrated Waste Management Plan (IWMP)
The climate change further impacts on disaster management risk and it has been realized that Big 5 Hlabisa
experience the following disasters:
Hydro-meteorological Hazards - Severe Storms (Lightning)
Hydro-meteorological Hazards – Extremely Hot Temperatures
Hydro-meteorological – Drought
In response to disaster management risks posed by Climate Change the municipality has developed a
Disaster Management Plan which is currently at a draft stage
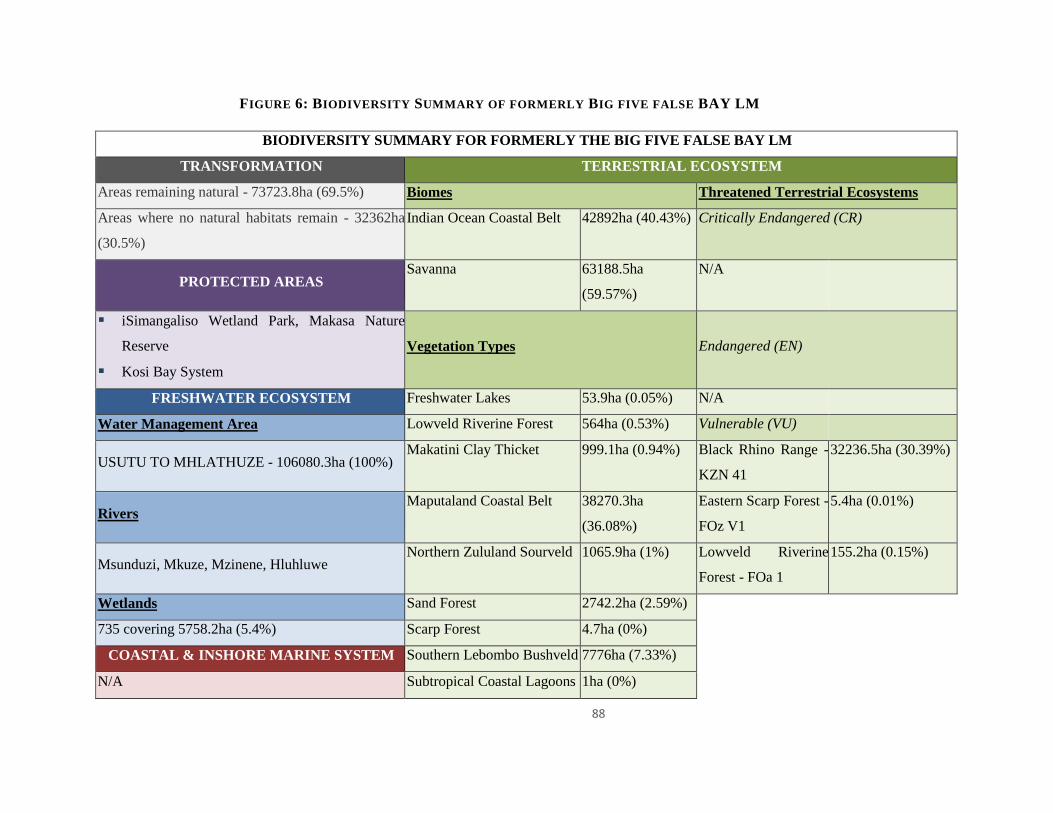
88
FIGURE 6: BIODIVERSITY SUMMARY OF FORMERLY BIG FIVE FALSE BAY LM
BIODIVERSITY SUMMARY FOR FORMERLY THE BIG FIVE FALSE BAY LM
TRANSFORMATION TERRESTRIAL ECOSYSTEM
Areas remaining natural - 73723.8ha (69.5%) Biomes Threatened Terrestrial Ecosystems
Areas where no natural habitats remain - 32362ha
(30.5%)
Indian Ocean Coastal Belt 42892ha (40.43%) Critically Endangered (CR)
PROTECTED AREAS Savanna 63188.5ha
(59.57%)
N/A
iSimangaliso Wetland Park, Makasa Nature
Reserve
Kosi Bay System
Vegetation Types Endangered (EN)
FRESHWATER ECOSYSTEM Freshwater Lakes 53.9ha (0.05%) N/A
Water Management Area Lowveld Riverine Forest 564ha (0.53%) Vulnerable (VU)
USUTU TO MHLATHUZE - 106080.3ha (100%) Makatini Clay Thicket 999.1ha (0.94%) Black Rhino Range -
KZN 41
32236.5ha (30.39%)
Rivers Maputaland Coastal Belt 38270.3ha
(36.08%)
Eastern Scarp Forest -
FOz V1
5.4ha (0.01%)
Msunduzi, Mkuze, Mzinene, Hluhluwe Northern Zululand Sourveld 1065.9ha (1%) Lowveld Riverine
Forest - FOa 1
155.2ha (0.15%)
Wetlands Sand Forest 2742.2ha (2.59%)
735 covering 5758.2ha (5.4%) Scarp Forest 4.7ha (0%)
COASTAL & INSHORE MARINE SYSTEM Southern Lebombo Bushveld 7776ha (7.33%)
N/A Subtropical Coastal Lagoons 1ha (0%)
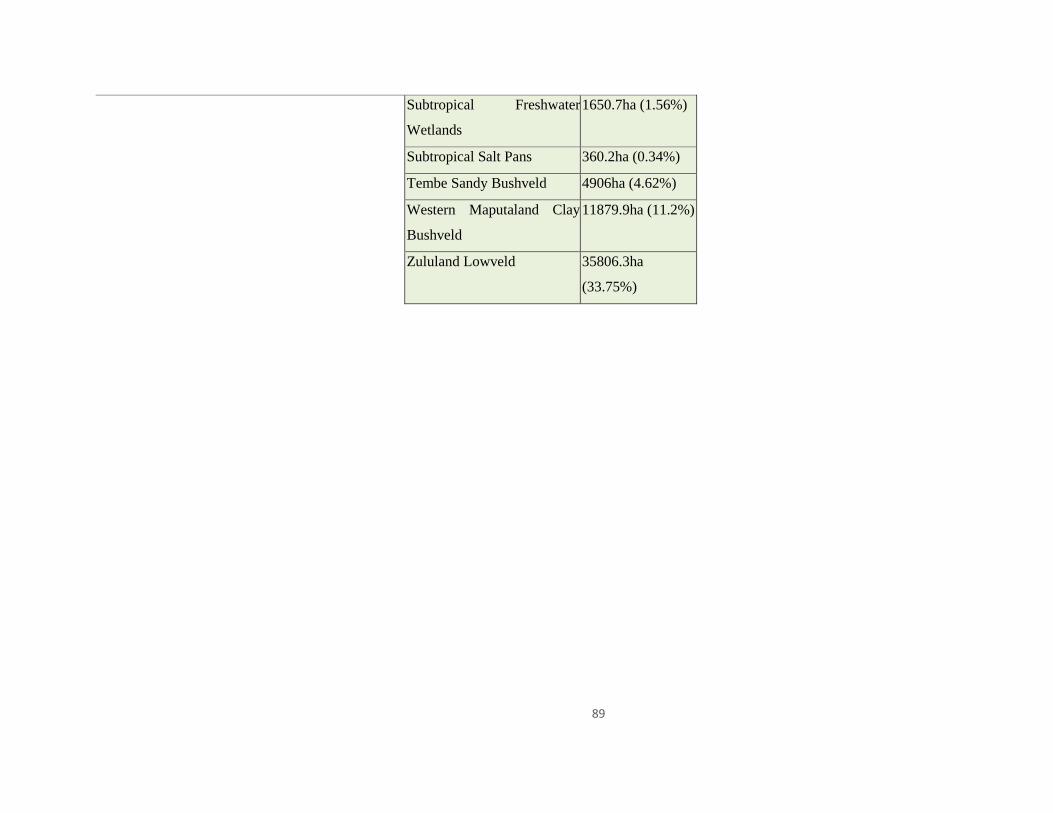
89
Subtropical Freshwater
Wetlands
1650.7ha (1.56%)
Subtropical Salt Pans 360.2ha (0.34%)
Tembe Sandy Bushveld 4906ha (4.62%)
Western Maputaland Clay
Bushveld
11879.9ha (11.2%)
Zululand Lowveld 35806.3ha
(33.75%)
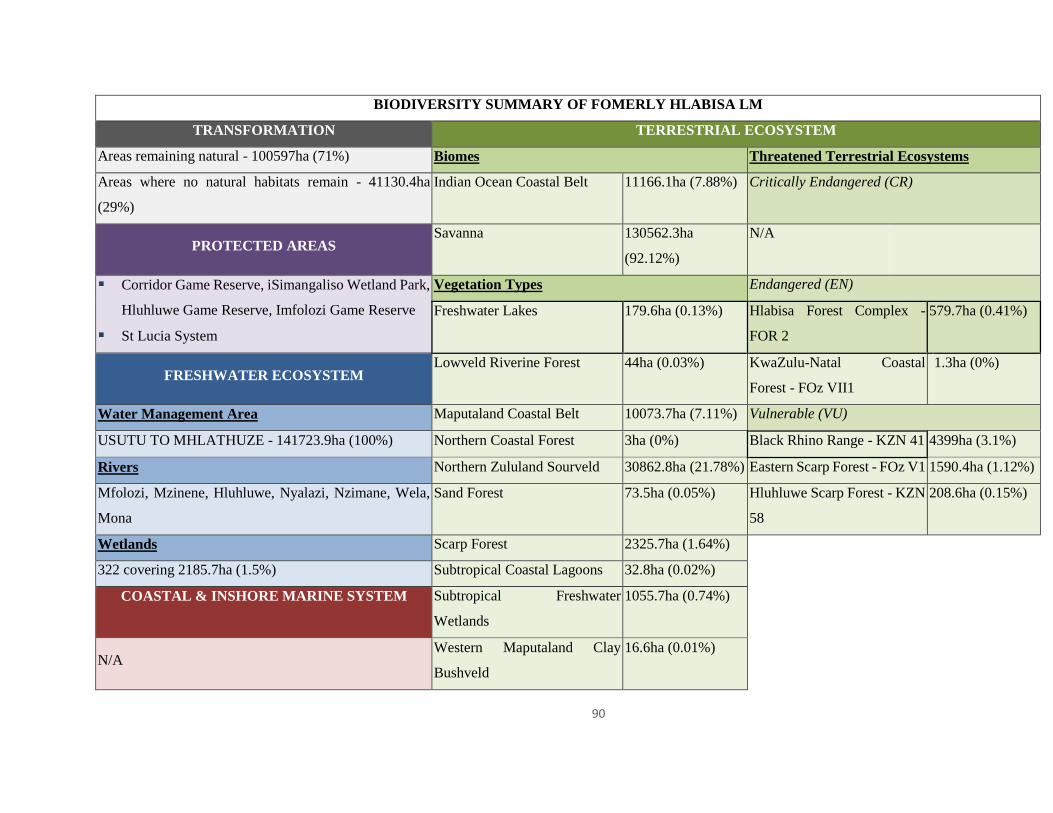
90
BIODIVERSITY SUMMARY OF FOMERLY HLABISA LM
TRANSFORMATION TERRESTRIAL ECOSYSTEM
Areas remaining natural - 100597ha (71%) Biomes Threatened Terrestrial Ecosystems
Areas where no natural habitats remain - 41130.4ha
(29%)
Indian Ocean Coastal Belt 11166.1ha (7.88%) Critically Endangered (CR)
PROTECTED AREAS Savanna 130562.3ha
(92.12%)
N/A
Corridor Game Reserve, iSimangaliso Wetland Park,
Hluhluwe Game Reserve, Imfolozi Game Reserve
St Lucia System
Vegetation Types Endangered (EN)
Freshwater Lakes 179.6ha (0.13%) Hlabisa Forest Complex -
FOR 2
579.7ha (0.41%)
FRESHWATER ECOSYSTEM Lowveld Riverine Forest 44ha (0.03%) KwaZulu-Natal Coastal
Forest - FOz VII1
1.3ha (0%)
Water Management Area Maputaland Coastal Belt 10073.7ha (7.11%) Vulnerable (VU)
USUTU TO MHLATHUZE - 141723.9ha (100%) Northern Coastal Forest 3ha (0%) Black Rhino Range - KZN 41 4399ha (3.1%)
Rivers Northern Zululand Sourveld 30862.8ha (21.78%) Eastern Scarp Forest - FOz V1 1590.4ha (1.12%)
Mfolozi, Mzinene, Hluhluwe, Nyalazi, Nzimane, Wela,
Mona
Sand Forest 73.5ha (0.05%) Hluhluwe Scarp Forest - KZN
58
208.6ha (0.15%)
Wetlands Scarp Forest 2325.7ha (1.64%)
322 covering 2185.7ha (1.5%) Subtropical Coastal Lagoons 32.8ha (0.02%)
COASTAL & INSHORE MARINE SYSTEM Subtropical Freshwater
Wetlands
1055.7ha (0.74%)
N/A Western Maputaland Clay
Bushveld
16.6ha (0.01%)
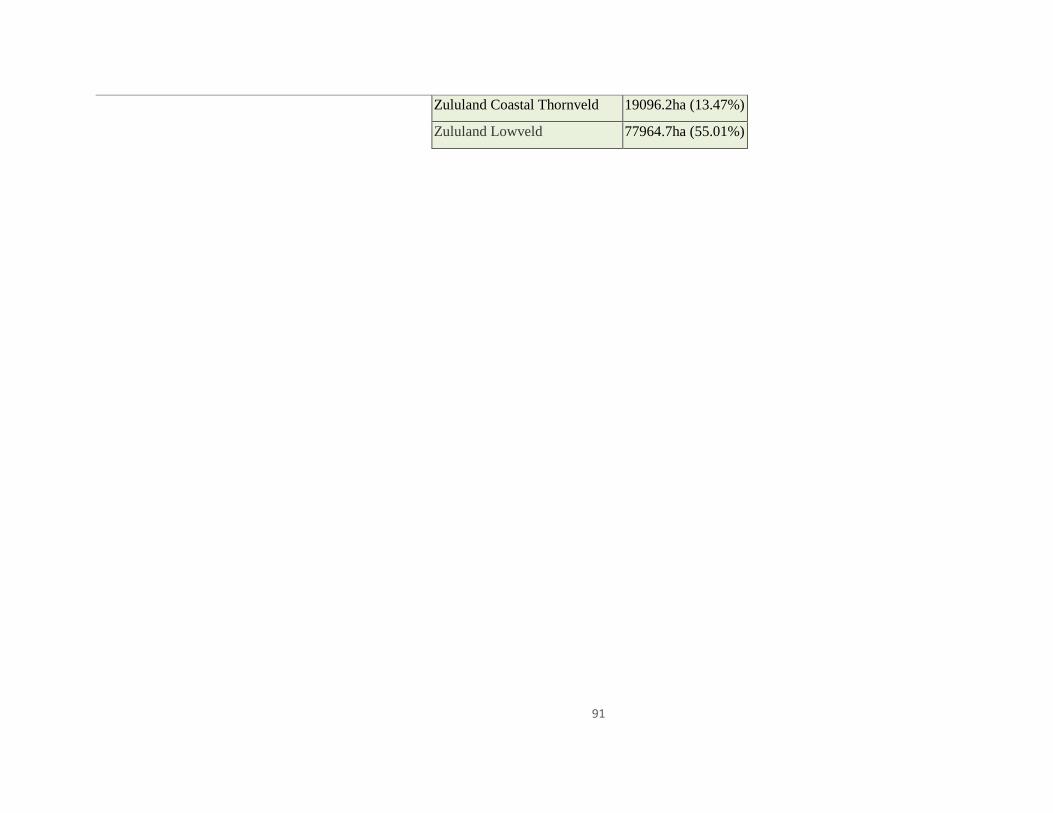
91
Zululand Coastal Thornveld 19096.2ha (13.47%)
Zululand Lowveld 77964.7ha (55.01%)
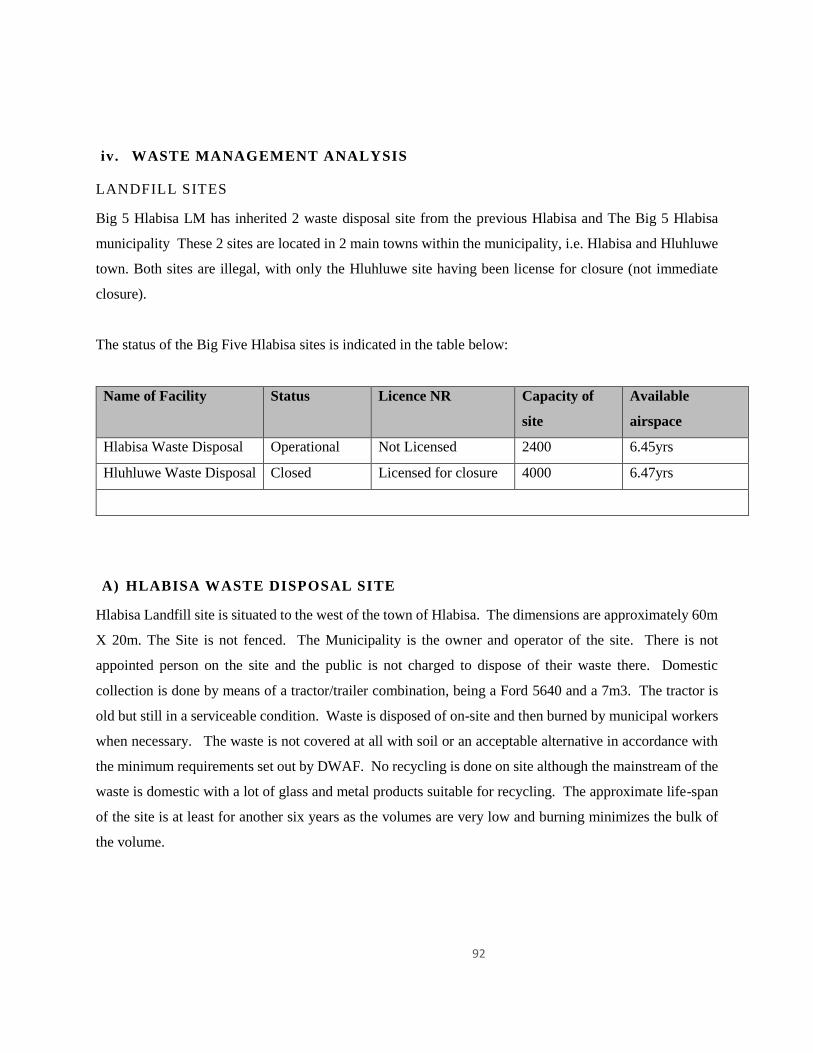
92
iv. WASTE MANAGEMENT ANALYSIS
LANDFILL SITES
Big 5 Hlabisa LM has inherited 2 waste disposal site from the previous Hlabisa and The Big 5 Hlabisa
municipality These 2 sites are located in 2 main towns within the municipality, i.e. Hlabisa and Hluhluwe
town. Both sites are illegal, with only the Hluhluwe site having been license for closure (not immediate
closure).
The status of the Big Five Hlabisa sites is indicated in the table below:
Name of Facility Status Licence NR Capacity of
site
Available
airspace
Hlabisa Waste Disposal Operational Not Licensed 2400 6.45yrs
Hluhluwe Waste Disposal Closed Licensed for closure 4000 6.47yrs
A) HLABISA WASTE DISPOSAL SITE
Hlabisa Landfill site is situated to the west of the town of Hlabisa. The dimensions are approximately 60m
X 20m. The Site is not fenced. The Municipality is the owner and operator of the site. There is not
appointed person on the site and the public is not charged to dispose of their waste there. Domestic
collection is done by means of a tractor/trailer combination, being a Ford 5640 and a 7m3. The tractor is
old but still in a serviceable condition. Waste is disposed of on-site and then burned by municipal workers
when necessary. The waste is not covered at all with soil or an acceptable alternative in accordance with
the minimum requirements set out by DWAF. No recycling is done on site although the mainstream of the
waste is domestic with a lot of glass and metal products suitable for recycling. The approximate life-span
of the site is at least for another six years as the volumes are very low and burning minimizes the bulk of
the volume.
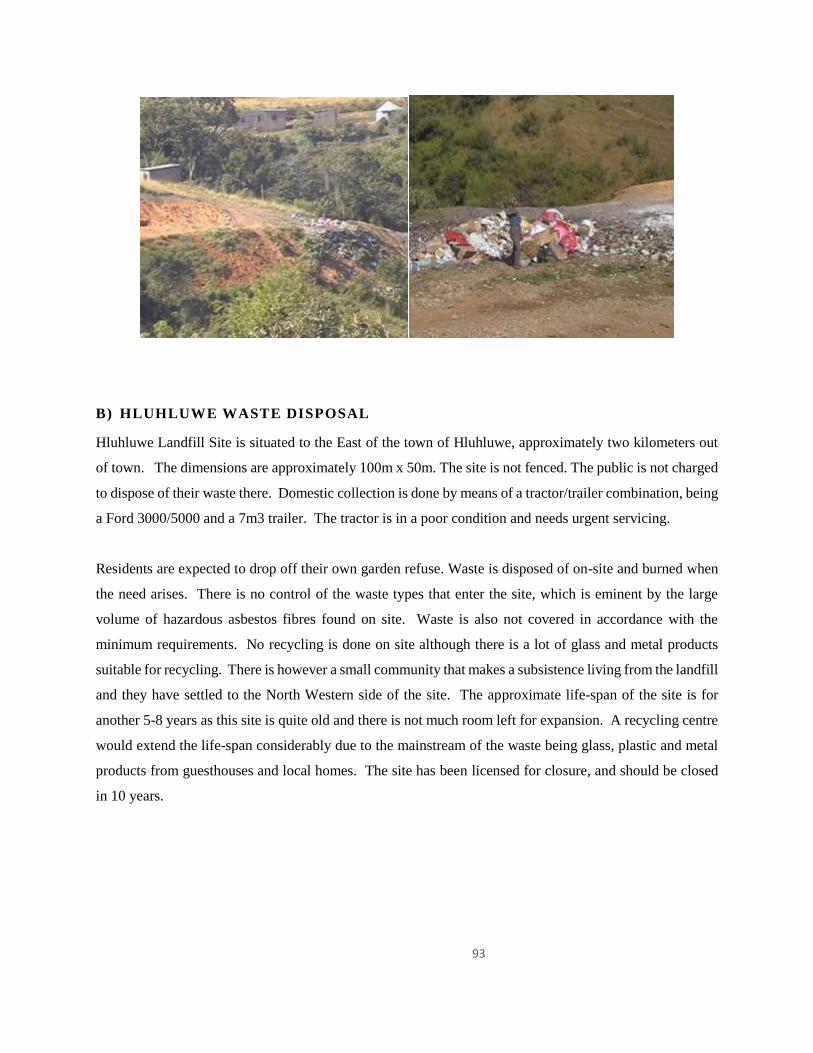
93
B) HLUHLUWE WASTE DISPOSAL
Hluhluwe Landfill Site is situated to the East of the town of Hluhluwe, approximately two kilometers out
of town. The dimensions are approximately 100m x 50m. The site is not fenced. The public is not charged
to dispose of their waste there. Domestic collection is done by means of a tractor/trailer combination, being
a Ford 3000/5000 and a 7m3 trailer. The tractor is in a poor condition and needs urgent servicing.
Residents are expected to drop off their own garden refuse. Waste is disposed of on-site and burned when
the need arises. There is no control of the waste types that enter the site, which is eminent by the large
volume of hazardous asbestos fibres found on site. Waste is also not covered in accordance with the
minimum requirements. No recycling is done on site although there is a lot of glass and metal products
suitable for recycling. There is however a small community that makes a subsistence living from the landfill
and they have settled to the North Western side of the site. The approximate life-span of the site is for
another 5-8 years as this site is quite old and there is not much room left for expansion. A recycling centre
would extend the life-span considerably due to the mainstream of the waste being glass, plastic and metal
products from guesthouses and local homes. The site has been licensed for closure, and should be closed
in 10 years.
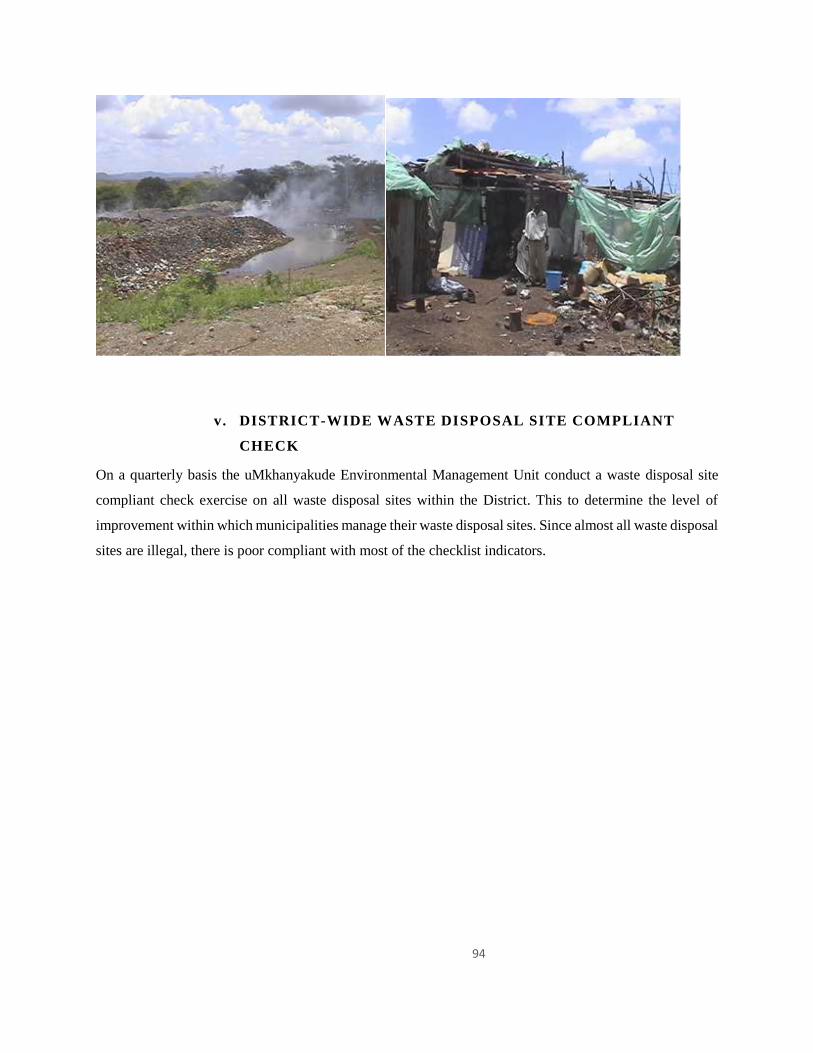
94
v. DISTRICT-WIDE WASTE DISPOSAL SITE COMPLIANT
CHECK
On a quarterly basis the uMkhanyakude Environmental Management Unit conduct a waste disposal site
compliant check exercise on all waste disposal sites within the District. This to determine the level of
improvement within which municipalities manage their waste disposal sites. Since almost all waste disposal
sites are illegal, there is poor compliant with most of the checklist indicators.
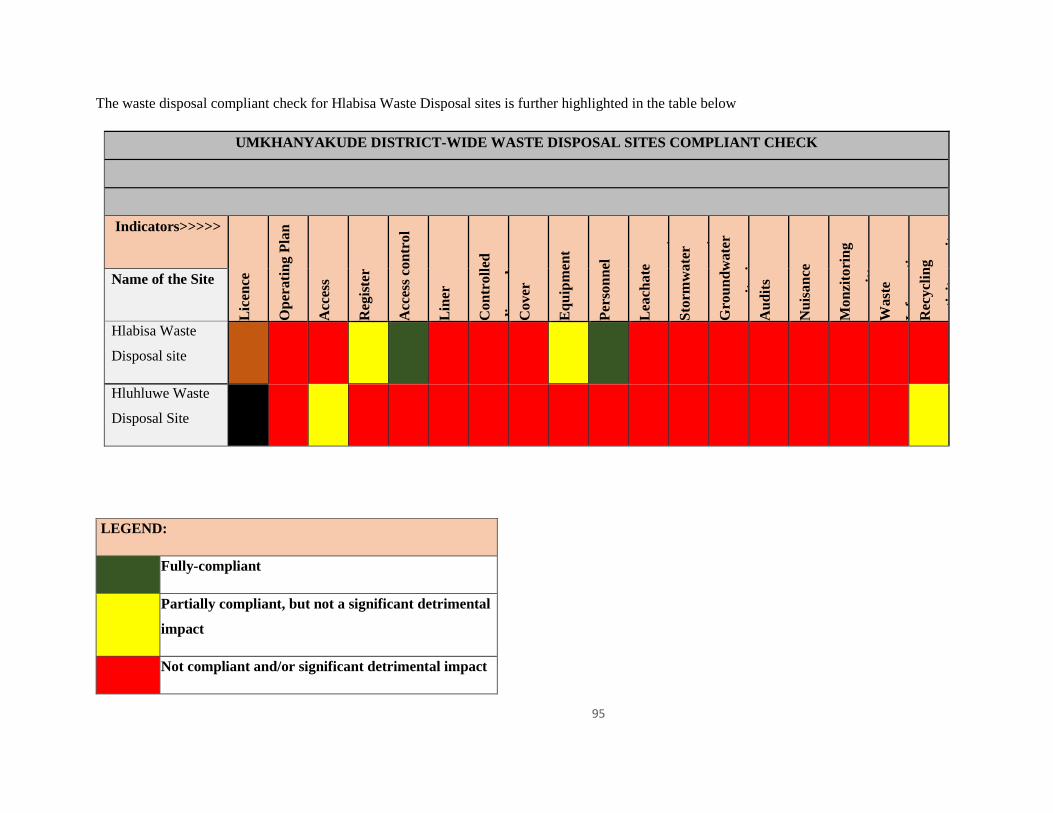
95
The waste disposal compliant check for Hlabisa Waste Disposal sites is further highlighted in the table below
UMKHANYAKUDE DISTRICT-WIDE WASTE DISPOSAL SITES COMPLIANT CHECK
Indicators>>>>>
L
icen
ce
Op
erati
ng P
lan
Acc
ess
Reg
iste
r
Acc
ess
con
trol
Lin
er
Con
troll
ed
dis
posa
l C
over
Eq
uip
men
t
Per
son
nel
Lea
chate
man
agem
ent
Sto
rmw
ate
r
man
agem
ent
Gro
un
dw
ate
r
mon
itori
ng
Au
dit
s
Nu
isan
ce
Mon
zito
rin
g
com
mit
tee
Wast
e
Info
rmati
on
R
ecycl
ing
act
ivit
y o
n s
ite
Name of the Site
Hlabisa Waste
Disposal site
Hluhluwe Waste
Disposal Site
LEGEND:
Fully-compliant
Partially compliant, but not a significant detrimental
impact
Not compliant and/or significant detrimental impact
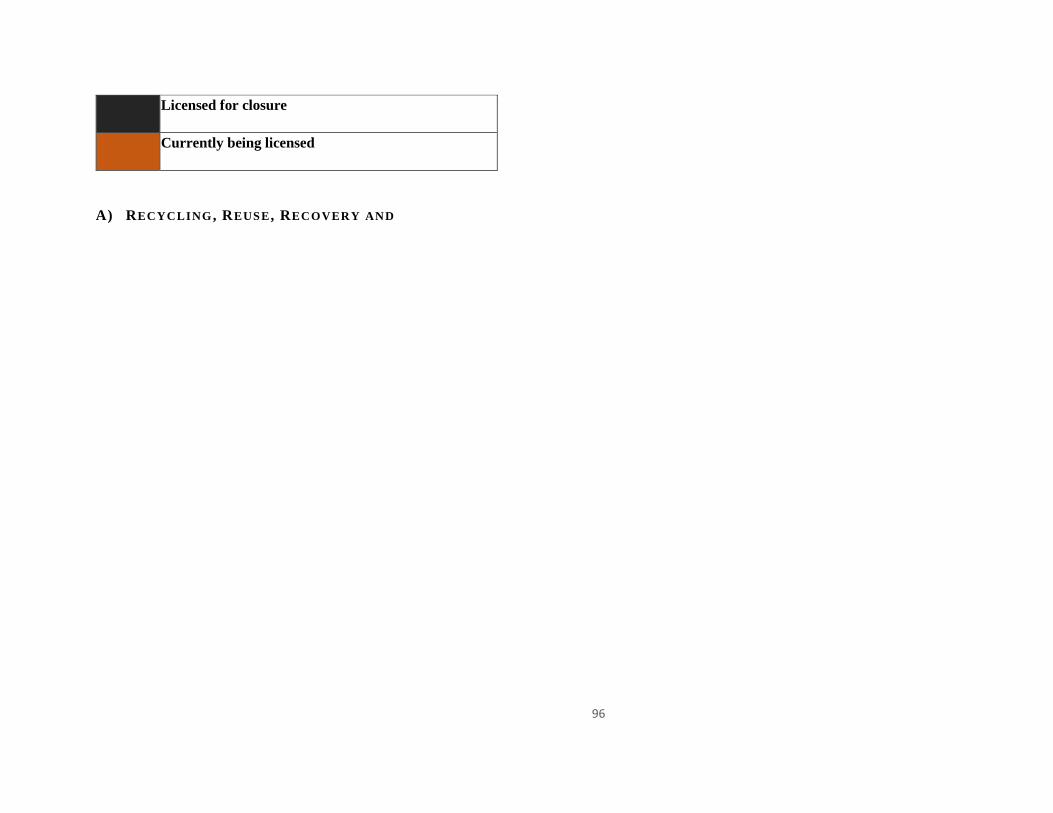
96
Licensed for closure
Currently being licensed
A) RECYCLING , REUSE , RECOVERY AND
97
B) WASTE M INIMIZATION INITIATIVES
The municipality does not have any recycling policy for either its municipal staff nor for the municipality
as a whole. Domestic waste at all the landfill sites was observed to contain large amounts of recyclable
material despite the recycling activities. This included plastics and paper grades. General waste at
households was observed to contain a large amount of recyclable material. This included plastic and paper
grades. There are no accurate records of the quantities of waste generated in different areas of the
municipality. It is therefore not possible to set recycling, reuse, recovery and minimization targets.
There are however initiatives by private individuals (recyclers). These ccollect selective recyclable waste
material in Hluhluwe and Hlabisa towns for recycling purposes. It should be noted that given the population
number, the volume of waste generated, The Big 5 Hlabisa Municipality town should consider establishing
a buy-back centre instead of a landfill site.
98
C) ILLEGAL DUMPING
Hlabisa town is one of the cleanest towns in uMkhanyakude. The opposite can be said of the Hluhluwe
town. As it is the case with other towns, illegal dumping is rife at Hluhluwe town. The indiscriminate
disposal at the Hluhluwe waste disposal aggravate the problem. During windy days, waste gets blown away
from the waste disposal site into the adjacent Phumulani Village and even as far as the town. Almost every
street corner in the Phumulani village has a dumping spot.
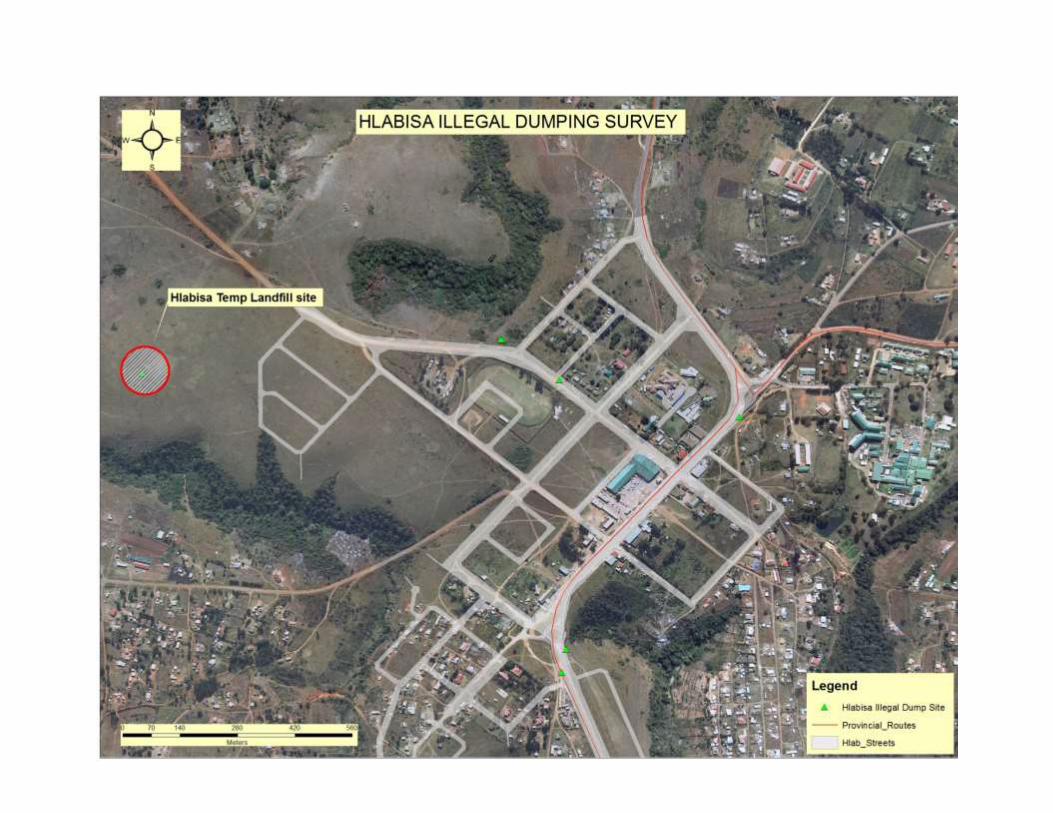
99
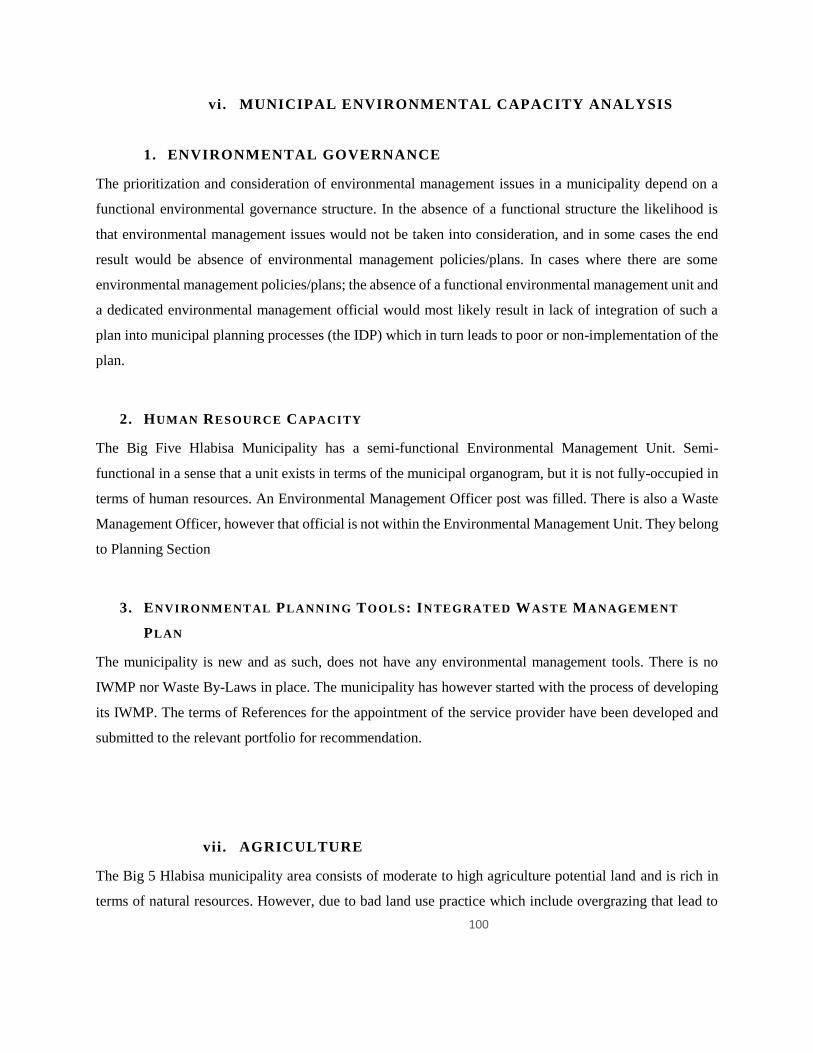
100
vi. MUNICIPAL ENVIRONMENTAL CAPACITY ANALYSIS
1. ENVIRONMENTAL GOVERNANCE
The prioritization and consideration of environmental management issues in a municipality depend on a
functional environmental governance structure. In the absence of a functional structure the likelihood is
that environmental management issues would not be taken into consideration, and in some cases the end
result would be absence of environmental management policies/plans. In cases where there are some
environmental management policies/plans; the absence of a functional environmental management unit and
a dedicated environmental management official would most likely result in lack of integration of such a
plan into municipal planning processes (the IDP) which in turn leads to poor or non-implementation of the
plan.
2. HUMAN RESOURCE CAPACITY
The Big Five Hlabisa Municipality has a semi-functional Environmental Management Unit. Semi-
functional in a sense that a unit exists in terms of the municipal organogram, but it is not fully-occupied in
terms of human resources. An Environmental Management Officer post was filled. There is also a Waste
Management Officer, however that official is not within the Environmental Management Unit. They belong
to Planning Section
3. ENVIRONMENTAL PLANNING TOOLS: INTEGRATED WASTE MANAGEMENT
PLAN
The municipality is new and as such, does not have any environmental management tools. There is no
IWMP nor Waste By-Laws in place. The municipality has however started with the process of developing
its IWMP. The terms of References for the appointment of the service provider have been developed and
submitted to the relevant portfolio for recommendation.
vii . AGRICULTURE
The Big 5 Hlabisa municipality area consists of moderate to high agriculture potential land and is rich in
terms of natural resources. However, due to bad land use practice which include overgrazing that lead to
101
deforestation, the municipality has not been able to utilize natural advantage to its maximum. As a result,
soil erosion is evident in a number of areas. This is more prevalent in areas or tribal areas where most of
people keep livestock and do not stick to accepted grazing capacity. Therefore, it is important to develop
strategies that will mitigate negative impact on the use of natural resources.
With its 2 main towns (Hluhluwe and Hlabisa), the majority of the Big 5 Hlabisa LM population are rural
dwellers, and many households rely at least partially on subsistence agriculture to meet some of their food
requirements. Big 5 Hlabisa has the combination of both subsistence and commercial agriculture.
Subsistence agriculture is the most wide-spread in the old Hlabisa municipality side, covering most of the
area. In the then Big 5 False Bay municipality, there are large areas under commercial and subsistence
agriculture around Hluhluwe.
The area with the highest agricultural potential is the Nibela Tribal Authority (TA) area (ward 04) and the
commercial farm areas. The rainfall drops from the East (coastal) to the west (inland). Improved agriculture
production can be remedied by the introduction of sound agricultural management and irrigation. Soil
conditions and climate culminates to create the perfect conditions for pineapple production, and the
Hluhluwe’ area has distinguished itself in producing 98% of table pineapples in the country. Queen and
Cayan pineapples are in huge demand for the fresh fruit market. It is however a concern that processing
locally be prioritized to boost the local economy. Further interventions are investigated as to how processing
of pineapples can be further developed within the area.
One of the greatest difficulties in considering the impact of climate change on agriculture is that crop and
vegetation responses to change have been projected to be highly localized. For the majority of cultivated
land, the most likely best-case scenario is that small reductions in yield will occur.
The most recent climate projections for the country suggest that rain-fed agriculture in UMkhanyakude is
likely to be negatively affected due to lower annual rainfall, higher temperatures, increased hydrological
risk, increased rainfall variability, drying of top soils, less water in the soil for plants, and increased
irrigation requirements. Such a change may have serious implications for food security and livelihoods
locally, and, nationally.
viii . ALIEN INVASIVE SPECIES
102
Some of the environmental issues caused by the invasive alien plants in UMkhanyakude include:
– Impacts food security because they compete with crops;
– They decrease grazing capacity;
– Livestock poisoning: e.g. lantana; and
– Alien plants Increases intensity of fires.
Some work is taking place regarding alien plant control in the district for example programmes by DAEA,
EKZNW, iSimangaliso Wetland Park and DWA. Over 40 species of alien vegetation with various levels of
abundance have been identifies within the uMkhanyakude District; and the following invasive alien species
are found within the Big 5 Hlabisa municipal area:
– Chromoleana odorata,
– Lantana camara,
– Opuntia ficus-indica,
– Melia azedarach,
– Psidium guajava,
– Solanum mauritianum and
– Ceasalpinnia decapetala.
The species are considered to constitute an immediate threat to the ecology of the Big 5 Hlabisa municipal
area.
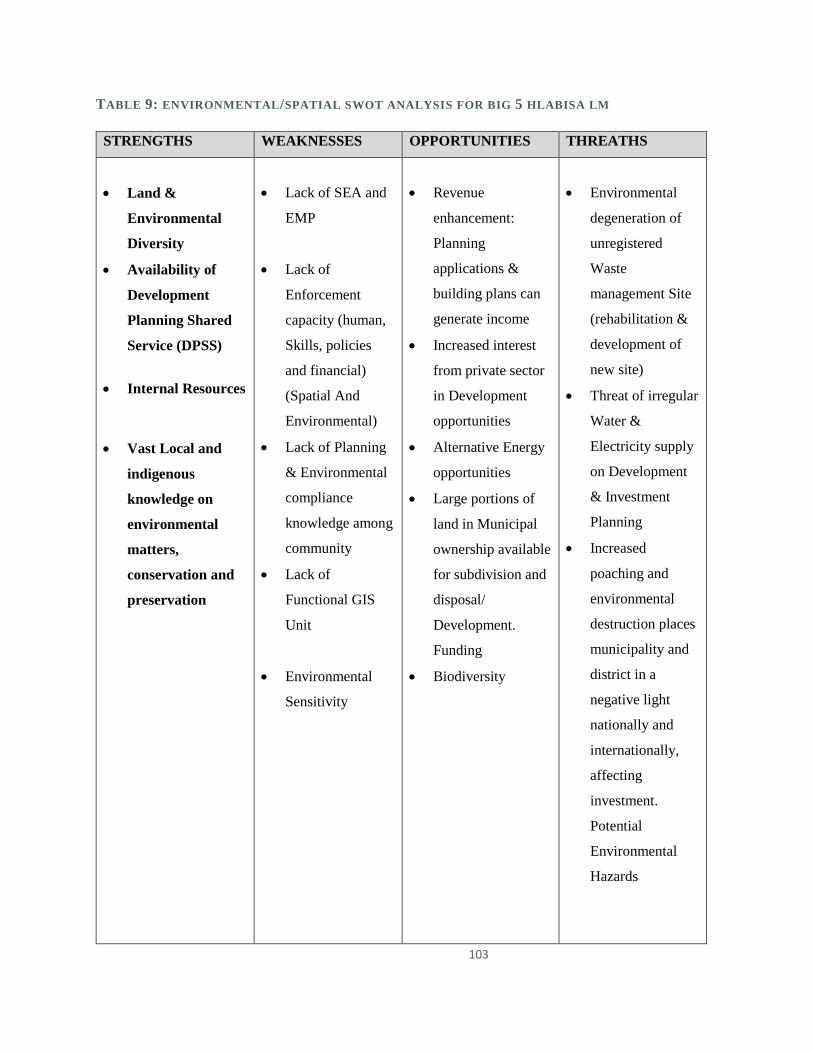
103
TABLE 9: ENVIRONMENTAL/SPATIAL SWOT ANALYSIS FOR BIG 5 HLABISA LM
STRENGTHS WEAKNESSES OPPORTUNITIES THREATHS
Land &
Environmental
Diversity
Availability of
Development
Planning Shared
Service (DPSS)
Internal Resources
Vast Local and
indigenous
knowledge on
environmental
matters,
conservation and
preservation
Lack of SEA and
EMP
Lack of
Enforcement
capacity (human,
Skills, policies
and financial)
(Spatial And
Environmental)
Lack of Planning
& Environmental
compliance
knowledge among
community
Lack of
Functional GIS
Unit
Environmental
Sensitivity
Revenue
enhancement:
Planning
applications &
building plans can
generate income
Increased interest
from private sector
in Development
opportunities
Alternative Energy
opportunities
Large portions of
land in Municipal
ownership available
for subdivision and
disposal/
Development.
Funding
Biodiversity
Environmental
degeneration of
unregistered
Waste
management Site
(rehabilitation &
development of
new site)
Threat of irregular
Water &
Electricity supply
on Development
& Investment
Planning
Increased
poaching and
environmental
destruction places
municipality and
district in a
negative light
nationally and
internationally,
affecting
investment.
Potential
Environmental
Hazards
104
ix. DISASTER MANAGEMENT
2.4.9.1 STATUS OF MUNICIPAL INSTITUTIONAL CAPACITY
A. Status of Municipal Disaster Management Centre
Big5 Hlabisa Local Municipality does not have a Disaster Management Centre (building) however there
is a Disaster unit that is accommodated in park homes. The unit is divided into two (2), there is one in
Hlabisa and one in Hluhluwe Town, with one Disaster Officer per town. The unit is operational with
locomotion and Cell phone allowance allocated to these two Disaster Management Officers.
B. Status of Fire & Rescue Services
105
Big 5 Hlabisa Local Municipality Does not have Fire Stations (buildings) however there is a fire unit that
is divided in two (2), there is one in Hlabisa, accommodated in Park Homes and one in Hluhluwe
accommodated in the District Fire Station. There are eleven (11) fire fighters and 5 Firelighters who are
on contract, not permanently employed. These Firefighters are divided into two towns. There are four fire
vehicles, two (2) 1800L fire engine and two (2) bakkie.
C. Status of Municipal Disaster Management Policy Framework
Big 5 Hlabisa Local Municipality currently has no municipal disaster management policy framework. The
municipality is however in the process of developing its own disaster management policy framework.
D. Status of Municipal Disaster Management Plan
Big 5 Hlabisa Local Municipality has a Disaster Management Plan that was adopted by council June 2017
and was however reviewed in May 2018. Our plan is now Level two Disaster Risk Management Plan.
E. Municipal Disaster Management Inter-Departmental Committee
The big 5 Hlabisa Local Municipality has no municipal Inter-Departmental committee, however it make
use of the Manco meetings to address Disaster Management related issues.
F. Municipal Disaster Management Advisory Forum
Big 5 Hlabisa Local Municipality Disaster Management Advisory Forum was officially launched in
August 2017. The Forum supposed to meet on a quarterly but does not due to some internal challenges.
2.4.9.2 MUNICIPAL INSTITUTIONAL CAPACITY
A) STAFFING
Big 5 Hlabisa Local Municipality has a Disaster management, Fire and Rescue Services Section under
Municipal Protection Services Unit. The Unit has two (2) Disaster Management Officers, one station officer
and (15) Firefighters.
Six Fire Fighters
Two Shift Leaders
One Station Officer
B) POLICIES
106
Big 5 Hlabisa Local Municipality currently has a municipal disaster management policy framework and
Disaster Management Plan of which is linked to the district disaster management policy framework for
guidance and direction regarding Municipal disaster management function.
C) RESOURCES
The District Disaster Management Centre was established in Hluhluwe and the Project was completed in
by end of 2014 and was handed over to the District by the MEC Nomusa Dube – Ncube. There is currently
a portfolio committee, however the extent to which disaster risk management activities are addressed by
the committee is not clear and therefore needs to be clarified.
107
x. RISK ASSESSMENT
The municipality undertaken a risk assessment where the community was made aware of disaster
management concept following to this process was identification of most common disasters. Priority
hazards identified at Big 5 Hlabisa Municipality are as follows:
SEVERE HAZARDS
Lightening
Strong winds
Hail
Heavy rain
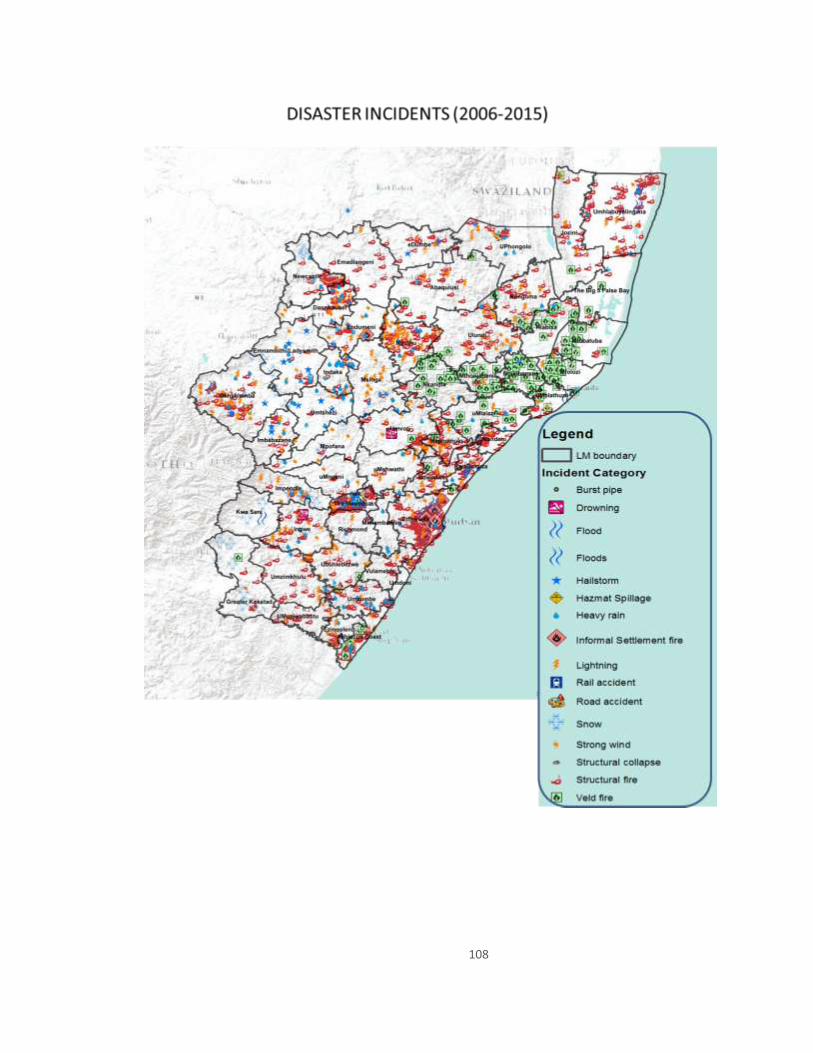
108
109
I. RISK REDUCTION AND PREVENTION
The importance of Risk Reduction and Prevention cannot be underestimated; currently the municipality is
involved in awareness campaigns at local schools and in the community on disaster management.
II. RESPONSE AND RECOVERY
A) MUNICIPAL CAPACITY IN TERMS OF RESPONSE AND RECOVERY
The municipality utilizes its staff for response and recovery in event disasters caused by fire.
B) TRAINING & AWARENESS
Training and awareness campaigns on disaster management are still a concern, but there has been an
improvement. School awareness campaigns are conducted in local schools. This will be strengthened
further in 2019/2020 moving forward
C) FUNDING ARRANGEMENTS
The Municipality does not have funding capacity to develop the disaster management plan and therefore
has undertaken its development in-house through support from COGTA and all the relevant stakeholders.
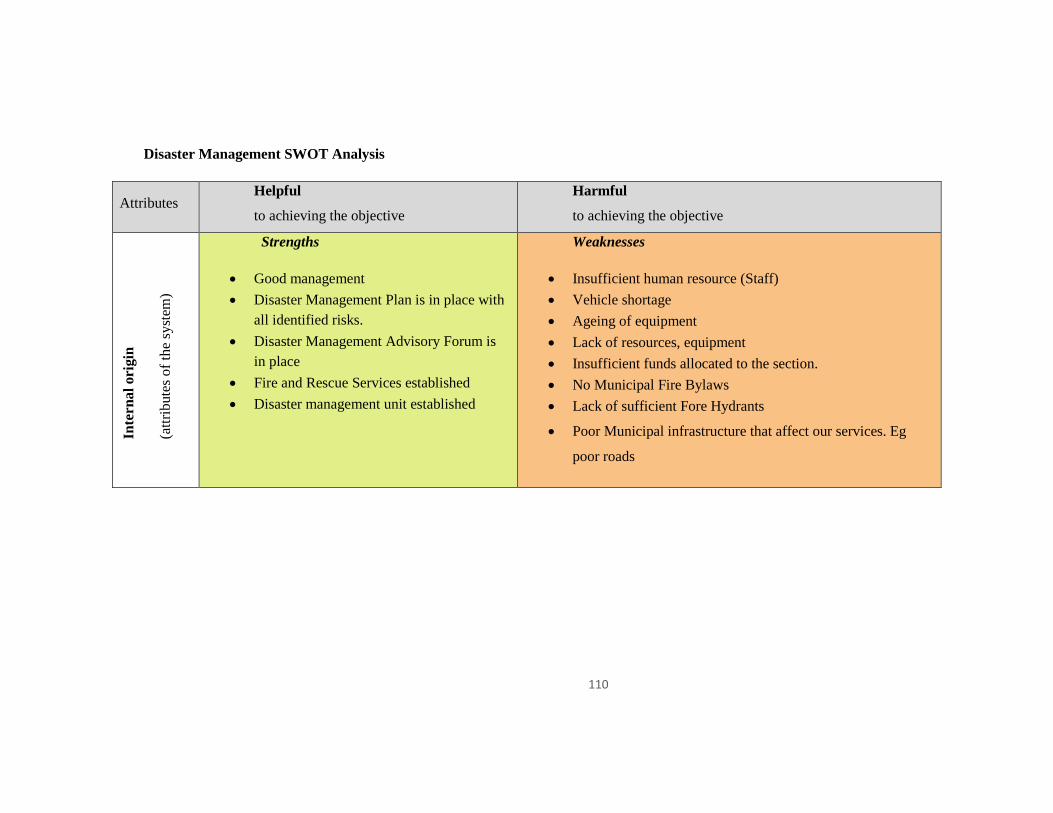
110
Disaster Management SWOT Analysis
Attributes Helpful
to achieving the objective
Harmful
to achieving the objective
Inte
rnal
ori
gin
(att
ribute
s of
the
syst
em)
Strengths
Good management
Disaster Management Plan is in place with
all identified risks.
Disaster Management Advisory Forum is
in place
Fire and Rescue Services established
Disaster management unit established
Weaknesses
Insufficient human resource (Staff)
Vehicle shortage
Ageing of equipment
Lack of resources, equipment
Insufficient funds allocated to the section.
No Municipal Fire Bylaws
Lack of sufficient Fore Hydrants
Poor Municipal infrastructure that affect our services. Eg
poor roads
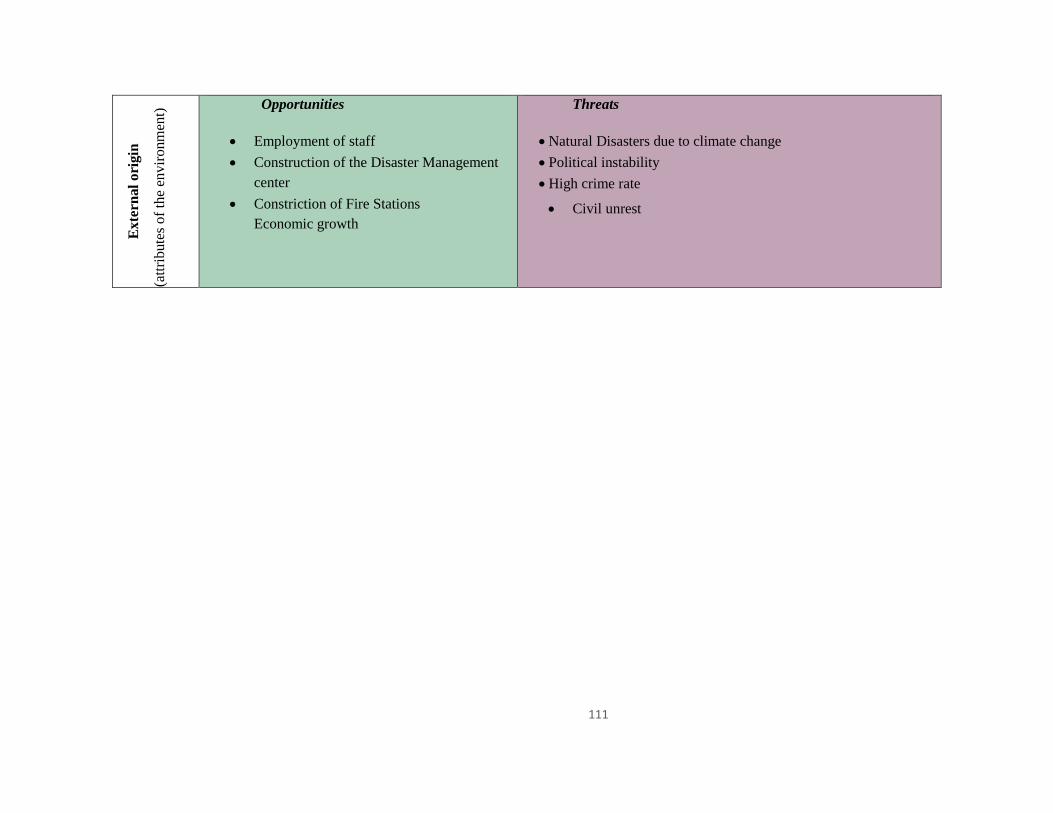
111
Exte
rnal
ori
gin
(att
ribute
s of
the
envir
onm
ent)
Opportunities
Employment of staff
Construction of the Disaster Management
center
Constriction of Fire Stations
Economic growth
Threats
Natural Disasters due to climate change
Political instability
High crime rate
Civil unrest
112
D. SECTORAL ANALYSIS
BACKGROUND
Big 5 Hlabisa Municipality strives to transform itself into a sustainable high performance organization,
in which employees are developed, valued, empowered and motivated therefore quality management
is embedded in all managerial practices and processes, and service delivery in terms of the IDP takes
priority.
Improvement in on the issues of Employment Equity Plan (EEP) National Requirements is one of our
concerns, due to geographic location of our municipality it becomes a challenge to attract staff in terms
of employment equity targets however Attraction & Retention has been developed to address the
challenge. The municipality complies with EEP standards and has set targets under section D and E1
of this document.
Employment equity seeks to address the disparity in employment representation within corporate
South Africa in terms of Employment Equity Act No. 55 of 1988. Big 5 Hlabisa consider employment
equity as one its priorities and works towards Employment Equity (EE) targets. The Employment Plan
is developed and submitted to the Department of Labour (DOL) in compliance the act requirements.
The municipality’s recruitment policy and Employment Equity Policy considers issues of
transformation and will always enhance sound labour relations.
Chapter 7 of the Municipal Systems Act (MSA) gives guidance on how municipalities should structure
local public administration and Human Resource Resources. Sec 55 requires the municipality within
its administrative and financial capacity to establish and organize its administration in a manner that
would enable the municipality to be:
responsive to the needs of the community
to facilitate a culture of public service and accountability amongst its staff
Be performance orientated and focus on section 152 of the constitution and give effect to its
duties on as per section 153, where municipalities are guided on how they should structure
themselves in a manner that will enhance service delivery.
The purpose of conducting an institutional analysis is to ensure that the municipal development
strategies take existing institutional capacities into consideration and that institutional shortcomings
are addressed. The Institutional capacity of the municipality is very important for the municipality to
113
realize its vision and objectives, therefore issues of institutional capacity and transformation will be
prioritized during the term of this IDP. Further to this there the SWOT analysis will unpack issues of
concern and existing capacities and opportunities that the municipality has to further improve on its
development processes.
Briefly the Big 5 Hlabisa Municipality is structured as follows:
The Office of the Municipal Manager is led by the Municipal Manager who is Accounting Officer and
a Head of Administration.
Under the Municipal Manager, the Municipality is categorised into 6(six) functional departments,
namely:
The organogram approved in 2019/20 reflects that Big 5 Hlabisa local municipality has the following
6 departments refer to ANNEXURE one.
Office of the Municipal Manager
Corporate Services
Technical Services
Community Services
Economic and Development Planning
Budget and Treasury
114
xi. OFFICE OF THE MUNICIPAL MANAGER
The Office of the Municipal Manager provides the momentum of the administration and integrates all
the disparate components of the Municipality and is responsible for strengthening of the
communication with the community.
The Municipal Manager is the head of the municipal administration as well as being accounting officer
for the purposes of financial management and accountability. All above mentioned departments are
led by Directors and have functional units. It is also commendable that the municipality has been able
to further work on its organisational structure and issues of alignment were considered.
Big 5 Hlabisa has high vacancy rate on Senior Management positions, The Acting arrangements are
used to address the challenge, however due to the period as per regulations for appointment of senior
managers this arrangement can sustain the municipality. The municipality further formalised support
arrangements with Hlabisa municipality for Community Services and Infrastructure Development and
Basic Services Department.
The functions of the Office of the Municipal Manager are as follows:
– Rendering strategic leadership during development, implementation and monitoring of the
Integrated Development Plan (IDP) and the Performance Management System (PMS)
– Establishing, develop and manage economically viable, effective and accountable administration.
– Taking full liability for sound financial management.
– Coordinating and manage Intergovernmental Relations (IGR).
– Ensuring sound co-operative governance.
– Managing the Municipality’s administration in accordance with the Constitution, Local
Government Structures Act, and the Municipal Systems Act, the Municipal Finance Management
Act, the Public Management Act and all other provincial and national legislation applicable.
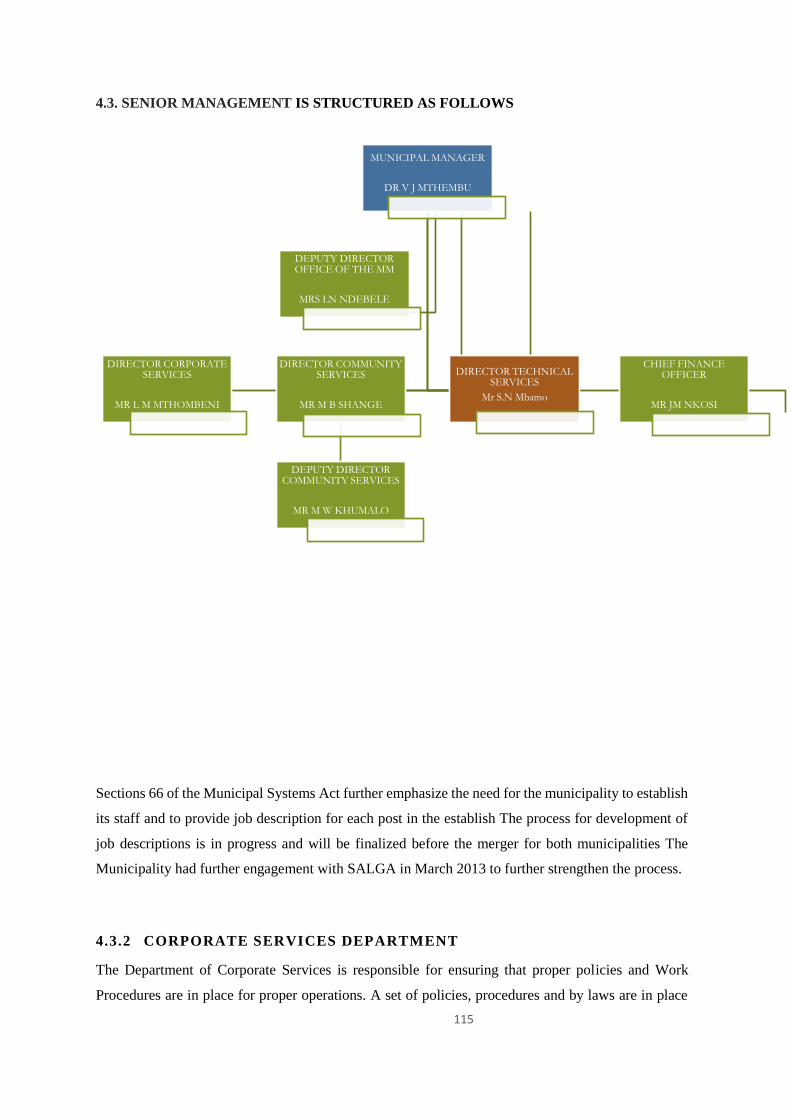
115
4.3. SENIOR MANAGEMENT IS STRUCTURED AS FOLLOWS
Sections 66 of the Municipal Systems Act further emphasize the need for the municipality to establish
its staff and to provide job description for each post in the establish The process for development of
job descriptions is in progress and will be finalized before the merger for both municipalities The
Municipality had further engagement with SALGA in March 2013 to further strengthen the process.
4.3.2 CORPORATE SERVICES DEPARTMENT
The Department of Corporate Services is responsible for ensuring that proper policies and Work
Procedures are in place for proper operations. A set of policies, procedures and by laws are in place
MUNICIPAL MANAGER
DR V J MTHEMBU
DIRECTOR CORPORATE SERVICES
MR L M MTHOMBENI
DIRECTOR COMMUNITY SERVICES
MR M B SHANGE
DEPUTY DIRECTOR COMMUNITY SERVICES
MR M W KHUMALO
DIRECTOR TECHNICAL SERVICES
Mr S.N Mbamo
CHIEF FINANCE OFFICER
MR JM NKOSI
DEPUTY DIRECTOR OFFICE OF THE MM
MRS LN NDEBELE
116
and are reviewed annually and as need arises to ensure relevance to Municipal objectives as set out in
the IDP
Human Resource is the overall umbrella in the organization for how the employees continue to grow
professionally and personally. The municipality has to ensure that it invest on employee development
by orientating the employees into the organizational culture thereby enabling the achievement of the
vision and strategic agenda. Big 5 Hlabisa Municipality has development interventions in place for
the institutions and its employees. The department comprise of the following sections
(a) Human Resource Management
(b) Administration
(c) Legal Services
(d) Information Communication Technology
4.3.3BUDGET AND TERASURY SERVICES DEPARTMENT
The Department Financial Services consists of the following components:
Supply Chain Management
Income
Expenditure
Budget and reporting
Departmental responsibilities
Income & Expenditure Control
Financial Planning, Reporting and Statements
Procurement and Municipal Inventory Control
4.3.4 ECONOMIC AND DEVELOPMENT PLANNING SERVICES
The department comprise of the following components:
Building Inspectorate
Town Planning
Geographic Information System (GIS)
Environmental Planning
Local Economic

117
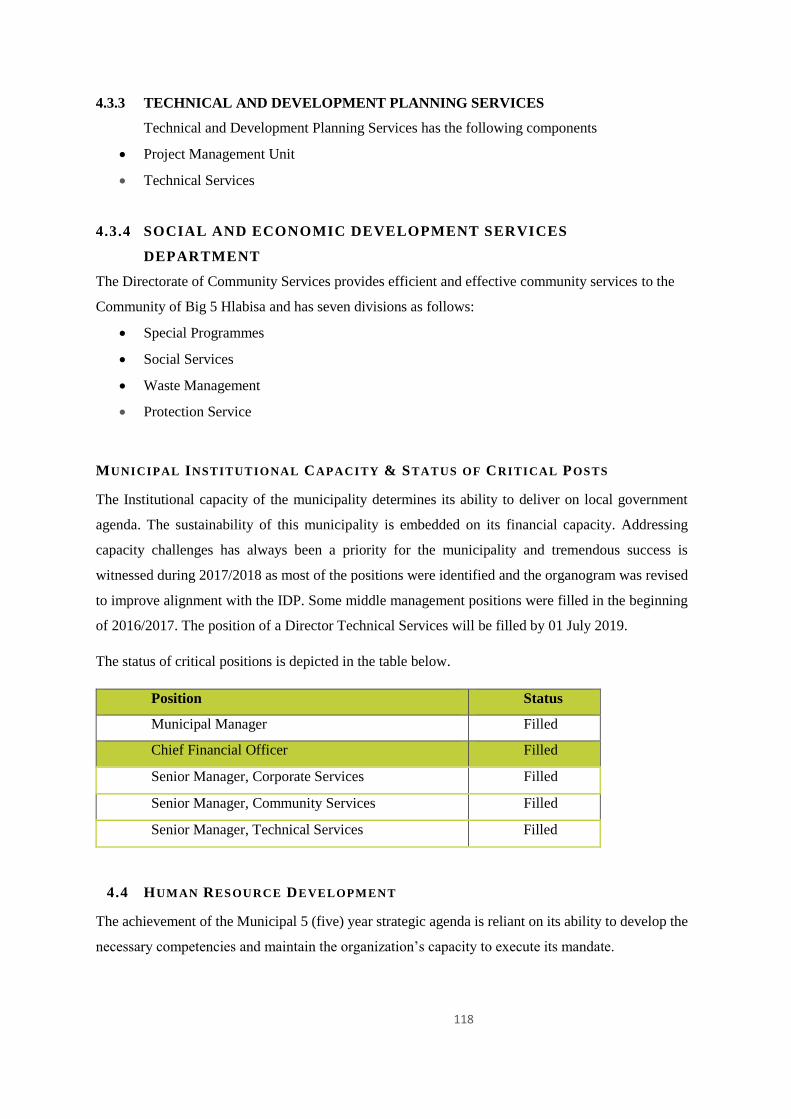
118
4.3.3 TECHNICAL AND DEVELOPMENT PLANNING SERVICES
Technical and Development Planning Services has the following components
Project Management Unit
Technical Services
4.3.4 SOCIAL AND ECONOMIC DEVELOPMENT SERVICES
DEPARTMENT
The Directorate of Community Services provides efficient and effective community services to the
Community of Big 5 Hlabisa and has seven divisions as follows:
Special Programmes
Social Services
Waste Management
Protection Service
MUNICIPAL INSTITUTIONAL CAPACITY & STATUS OF CRITICAL POSTS
The Institutional capacity of the municipality determines its ability to deliver on local government
agenda. The sustainability of this municipality is embedded on its financial capacity. Addressing
capacity challenges has always been a priority for the municipality and tremendous success is
witnessed during 2017/2018 as most of the positions were identified and the organogram was revised
to improve alignment with the IDP. Some middle management positions were filled in the beginning
of 2016/2017. The position of a Director Technical Services will be filled by 01 July 2019.
The status of critical positions is depicted in the table below.
Position Status
Municipal Manager Filled
Chief Financial Officer Filled
Senior Manager, Corporate Services Filled
Senior Manager, Community Services Filled
Senior Manager, Technical Services Filled
4.4 HUMAN RESOURCE DEVELOPMENT
The achievement of the Municipal 5 (five) year strategic agenda is reliant on its ability to develop the
necessary competencies and maintain the organization’s capacity to execute its mandate.
119
In this regard, the continuous improvement of organizational skills capacity for sustained performance
is the heart of the Human Resource Development (HRD) Plan, which seeks to support implementation
of a 5-year strategic program. In order to meet the Municipality’s challenges, it needs to be ensured
that employees possess the necessary skills, knowledge and aptitude to deliver services in line with
Municipality’s stated objectives and service delivery plans.
The key objective of the HRD Plan is to develop organizational capacity through the development of
our leaders, managers and workforce in order to respond to current and future challenges, and
anticipated impacts, thereby complementing our vision, development strategy and our strategic
objectives.
Human Resource Development Strategy has been developed and approved by Council. Skills capacity
is the main priority for the municipality. Skills on Environmental Management, Building Inspectorate,
and GIS are still a concern and the municipality has vacancy on these areas. Currently the municipality
relies on a shared service for GIS; however, filling of these positions will be addressed during the new
financial year.
The strategic vision of the municipality cannot be realized if issues of capacity in this respect is not
addressed. The municipality reviews Workplace Skills Plan (WSP) annually. The following policies
are in place to guide the operation of the municipality, further to this the status of municipal policies
is provided in the
Recruitment and Selection policy,
Retention policy and Exit Policy
To enhance skills capacity and compliance with municipal 2013 competencies Senior Management,
Finance Interns enrolled for CPMD. Some of the staff in the middle management staff also been been
trained.
4.4.2 INSTITUTIONAL ARRANGEMENTS TO DRIVE IDP
Institutional arrangements to drive the IDP process and its implementation are in place and their
functionality has further improved as compared to the previous financial years.
(A) OFFICE OF THE MUNICIPAL MANAGER
The office of the Municipal Manager compiles the IDP document through consultation with various
sets of information and directs its output to the IDP Representative Forum for debates and further
inputs and refinement of the plan. The IDP Representative Forum is the structure that provides a
120
platform for public participation through involvement of different community structure
representatives, political leaders, traditional leaders and government entities which provide support
throughout the planning process.
The following structures are in place and are being formalised for Big 5 Hlabisa Municipality to
drive the IDP, Budget and PMS Process.
IDP Steering Committee (IDP SC)
IDP Representative Forum
The above mentioned committees are key drivers of the IDP process, however the municipality has
realised the challenges in getting sector departments and other relevant stakeholders to attend and
participate meaningfully during IDP RF meetings. A different approach to revive participation will be
investigated to enhance sustainable development. One –on – one meeting will be intensified during
the IDP cycle and further initiatives
(B) IDP STEERING COMMITTEE
The IDP SC is technical committee and a platform for development planning deliberations and
proposed interventions. Steering Committee is responsible for the management and the drafting of the
IDP in terms of Section 30(a) of the Municipal Systems Act. This committee provided secretarial
support to the IDP Representative Forum (IDP RF)
(C) IDP REPRESENTATIVE FORUM
The purpose of the IDP Representative forum is to provide platform to external municipal stakeholders
for debating issues and contributing to find workable solutions to existing and competing community
needs. It is chaired by the Mayor. Issues of development planning, strategic solutions in existence are
addressed. The sector departments also assist on the mandate with expertise to accelerate development
and address service delivery backlogs.
Submissions for planned programs and projects are also made in this forum. As a result of this forum
there has been remarkable improvement and municipality will strengthen the functionality of this
forum. The members of the forum are registered on the database which is reviewed on annual basis.
(D) COUNCIL
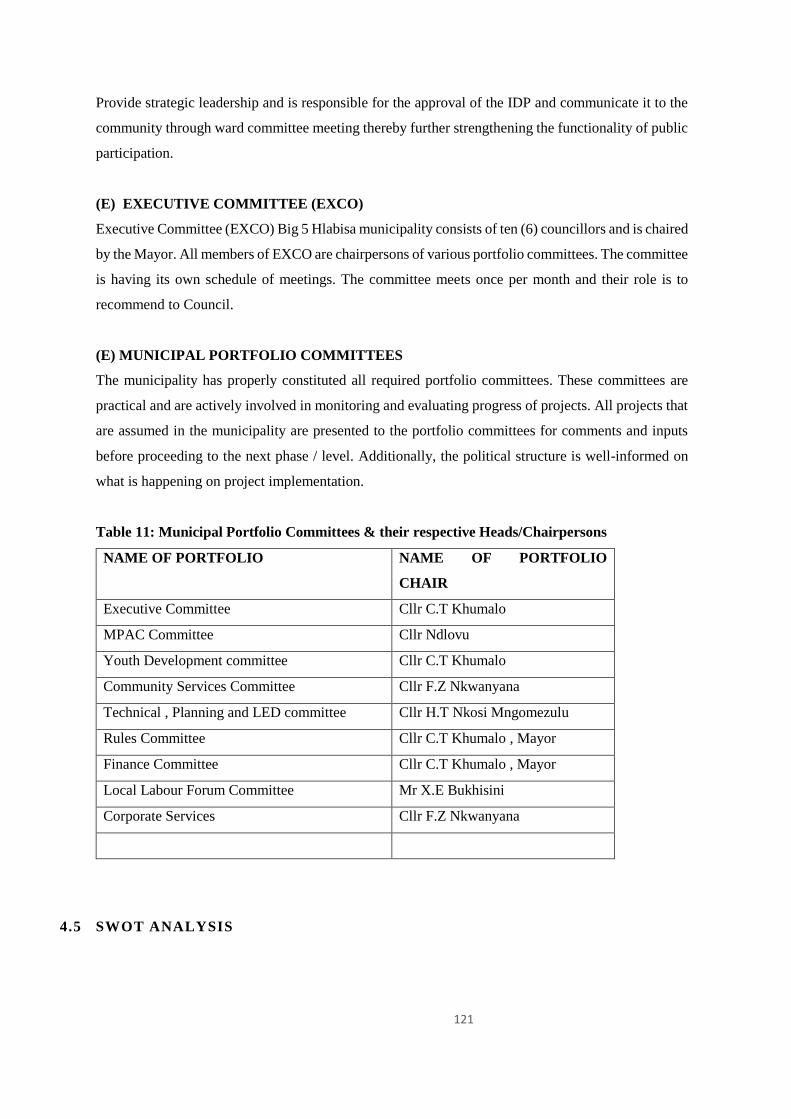
121
Provide strategic leadership and is responsible for the approval of the IDP and communicate it to the
community through ward committee meeting thereby further strengthening the functionality of public
participation.
(E) EXECUTIVE COMMITTEE (EXCO)
Executive Committee (EXCO) Big 5 Hlabisa municipality consists of ten (6) councillors and is chaired
by the Mayor. All members of EXCO are chairpersons of various portfolio committees. The committee
is having its own schedule of meetings. The committee meets once per month and their role is to
recommend to Council.
(E) MUNICIPAL PORTFOLIO COMMITTEES
The municipality has properly constituted all required portfolio committees. These committees are
practical and are actively involved in monitoring and evaluating progress of projects. All projects that
are assumed in the municipality are presented to the portfolio committees for comments and inputs
before proceeding to the next phase / level. Additionally, the political structure is well-informed on
what is happening on project implementation.
Table 11: Municipal Portfolio Committees & their respective Heads/Chairpersons
NAME OF PORTFOLIO NAME OF PORTFOLIO
CHAIR
Executive Committee Cllr C.T Khumalo
MPAC Committee Cllr Ndlovu
Youth Development committee Cllr C.T Khumalo
Community Services Committee Cllr F.Z Nkwanyana
Technical , Planning and LED committee Cllr H.T Nkosi Mngomezulu
Rules Committee Cllr C.T Khumalo , Mayor
Finance Committee Cllr C.T Khumalo , Mayor
Local Labour Forum Committee Mr X.E Bukhisini
Corporate Services Cllr F.Z Nkwanyana
4.5 SWOT ANALYSIS
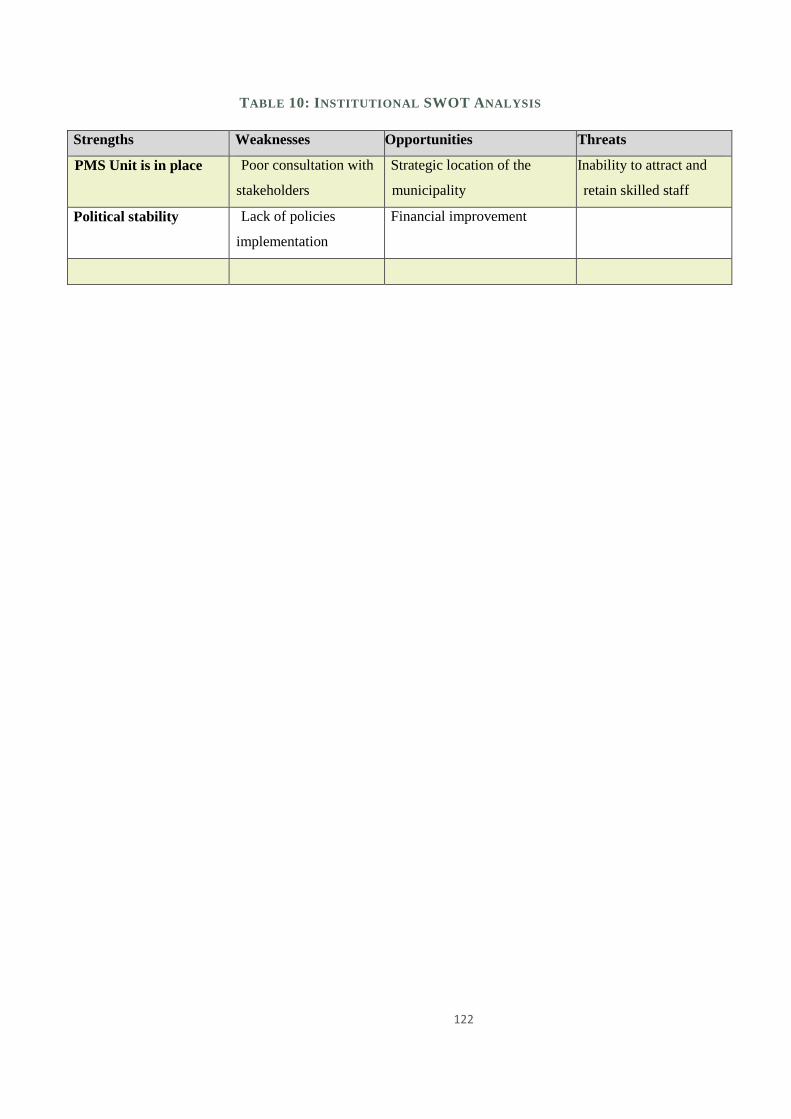
122
TABLE 10: INSTITUTIONAL SWOT ANALYSIS
Strengths Weaknesses Opportunities Threats
PMS Unit is in place Poor consultation with
stakeholders
Strategic location of the
municipality
Inability to attract and
retain skilled staff
Political stability Lack of policies
implementation
Financial improvement
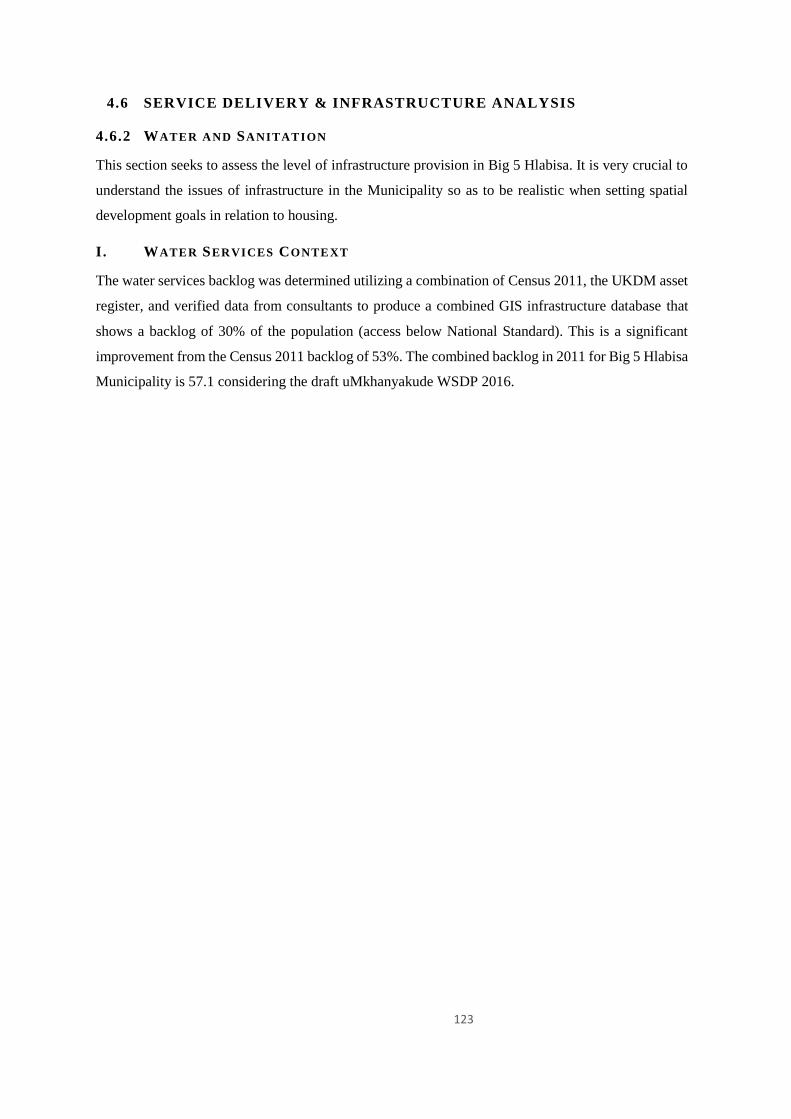
123
4.6 SERVICE DELIVERY & INFRASTRUCTURE ANALYSIS
4.6.2 WATER AND SANITATION
This section seeks to assess the level of infrastructure provision in Big 5 Hlabisa. It is very crucial to
understand the issues of infrastructure in the Municipality so as to be realistic when setting spatial
development goals in relation to housing.
I. WATER SERVICES CONTEXT
The water services backlog was determined utilizing a combination of Census 2011, the UKDM asset
register, and verified data from consultants to produce a combined GIS infrastructure database that
shows a backlog of 30% of the population (access below National Standard). This is a significant
improvement from the Census 2011 backlog of 53%. The combined backlog in 2011 for Big 5 Hlabisa
Municipality is 57.1 considering the draft uMkhanyakude WSDP 2016.
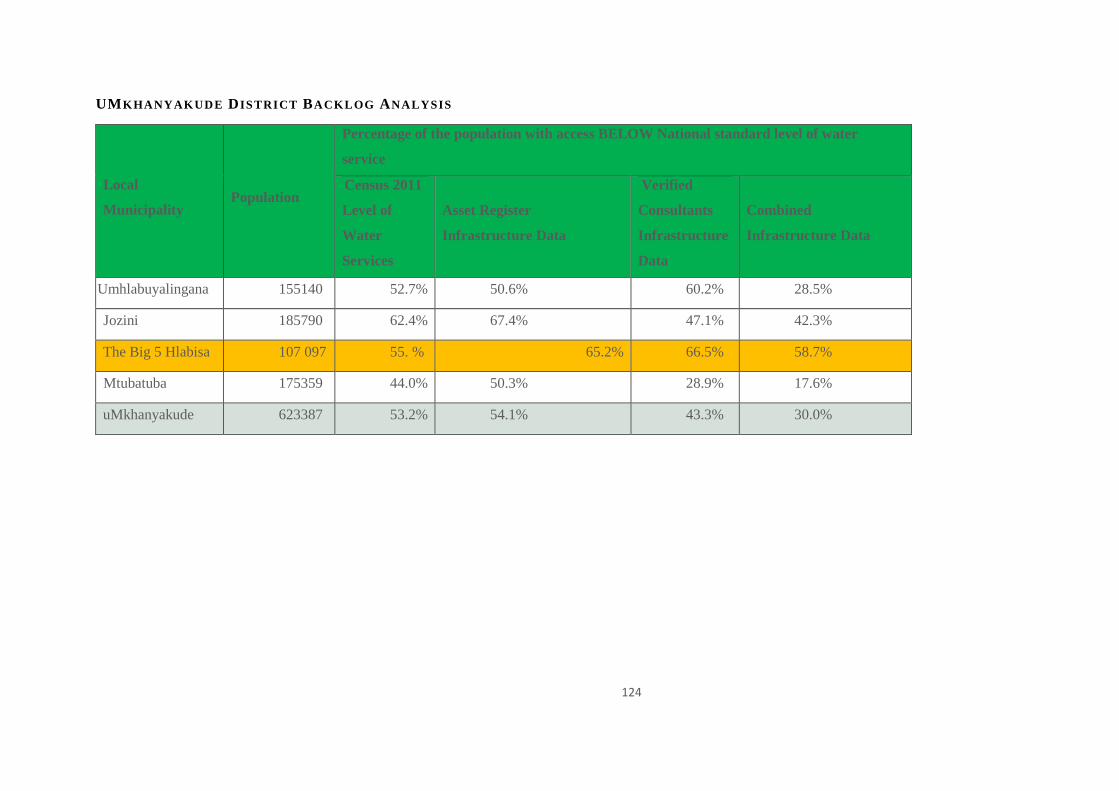
124
UMKHANYAKUDE DISTRICT BACKLOG ANALYSIS
Local
Municipality Population
Percentage of the population with access BELOW National standard level of water
service
Census 2011
Level of
Water
Services
Asset Register
Infrastructure Data
Verified
Consultants
Infrastructure
Data
Combined
Infrastructure Data
Umhlabuyalingana 155140 52.7% 50.6% 60.2% 28.5%
Jozini 185790 62.4% 67.4% 47.1% 42.3%
The Big 5 Hlabisa 107 097 55. % 65.2% 66.5% 58.7%
Mtubatuba 175359 44.0% 50.3% 28.9% 17.6%
uMkhanyakude 623387 53.2% 54.1% 43.3% 30.0%
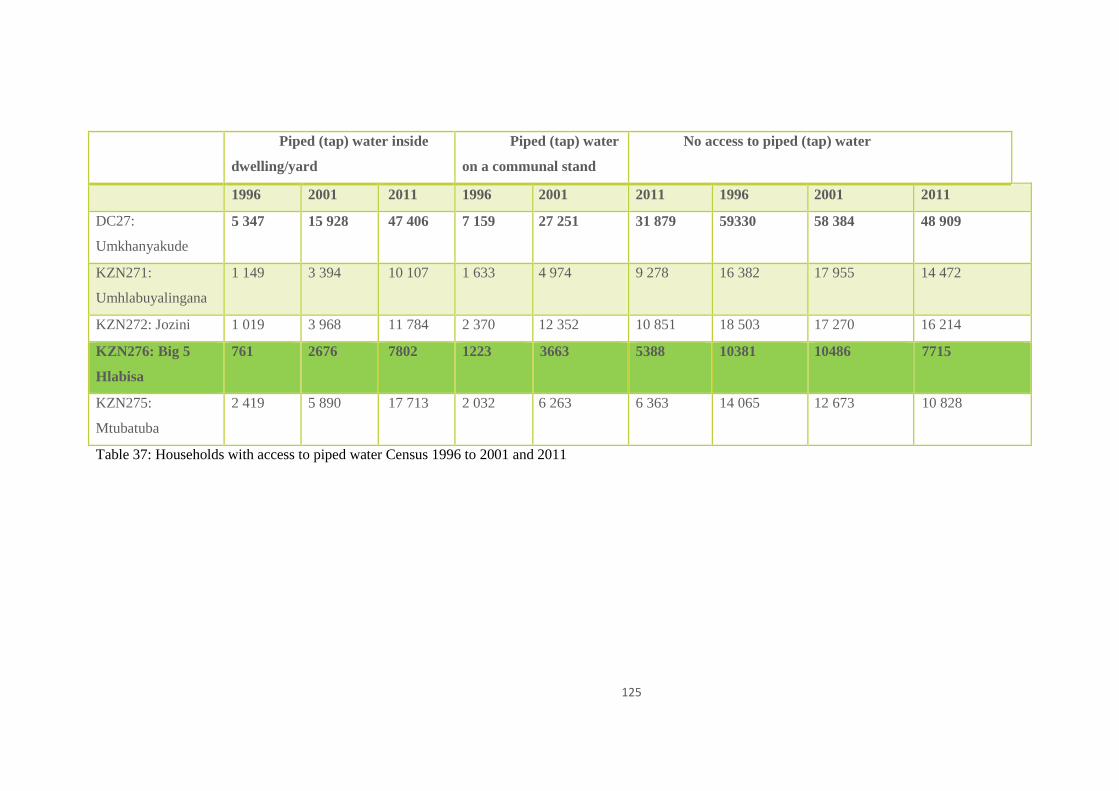
125
Piped (tap) water inside
dwelling/yard
Piped (tap) water
on a communal stand
No access to piped (tap) water
1996 2001 2011 1996 2001 2011 1996 2001 2011
DC27:
Umkhanyakude
5 347 15 928 47 406 7 159 27 251 31 879 59330 58 384 48 909
KZN271:
Umhlabuyalingana
1 149 3 394 10 107 1 633 4 974 9 278 16 382 17 955 14 472
KZN272: Jozini 1 019 3 968 11 784 2 370 12 352 10 851 18 503 17 270 16 214
KZN276: Big 5
Hlabisa
761 2676 7802 1223 3663 5388 10381 10486 7715
KZN275:
Mtubatuba
2 419 5 890 17 713 2 032 6 263 6 363 14 065 12 673 10 828
Table 37: Households with access to piped water Census 1996 to 2001 and 2011
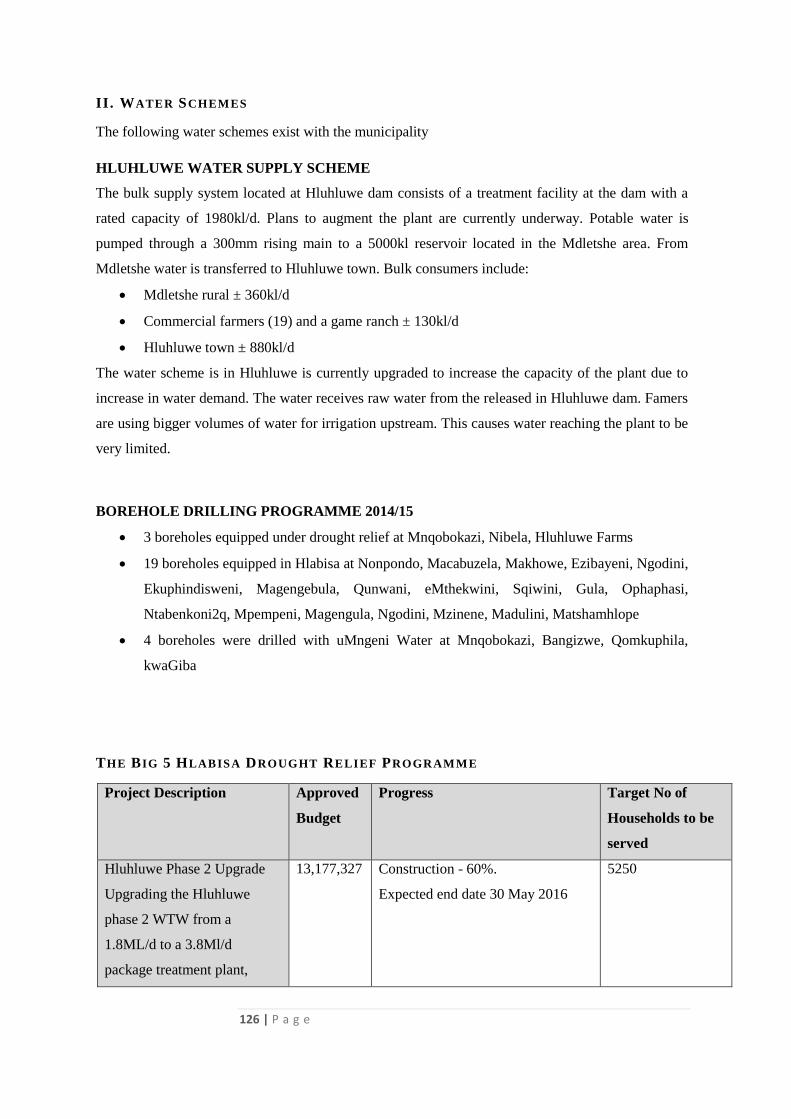
126 | P a g e
II. WATER SCHEMES
The following water schemes exist with the municipality
HLUHLUWE WATER SUPPLY SCHEME
The bulk supply system located at Hluhluwe dam consists of a treatment facility at the dam with a
rated capacity of 1980kl/d. Plans to augment the plant are currently underway. Potable water is
pumped through a 300mm rising main to a 5000kl reservoir located in the Mdletshe area. From
Mdletshe water is transferred to Hluhluwe town. Bulk consumers include:
Mdletshe rural ± 360kl/d
Commercial farmers (19) and a game ranch ± 130kl/d
Hluhluwe town ± 880kl/d
The water scheme is in Hluhluwe is currently upgraded to increase the capacity of the plant due to
increase in water demand. The water receives raw water from the released in Hluhluwe dam. Famers
are using bigger volumes of water for irrigation upstream. This causes water reaching the plant to be
very limited.
BOREHOLE DRILLING PROGRAMME 2014/15
3 boreholes equipped under drought relief at Mnqobokazi, Nibela, Hluhluwe Farms
19 boreholes equipped in Hlabisa at Nonpondo, Macabuzela, Makhowe, Ezibayeni, Ngodini,
Ekuphindisweni, Magengebula, Qunwani, eMthekwini, Sqiwini, Gula, Ophaphasi,
Ntabenkoni2q, Mpempeni, Magengula, Ngodini, Mzinene, Madulini, Matshamhlope
4 boreholes were drilled with uMngeni Water at Mnqobokazi, Bangizwe, Qomkuphila,
kwaGiba
THE BIG 5 HLABISA DROUGHT RELIEF PROGRAMME
Project Description Approved
Budget
Progress Target No of
Households to be
served
Hluhluwe Phase 2 Upgrade
Upgrading the Hluhluwe
phase 2 WTW from a
1.8ML/d to a 3.8Ml/d
package treatment plant,
13,177,327 Construction - 60%.
Expected end date 30 May 2016
5250
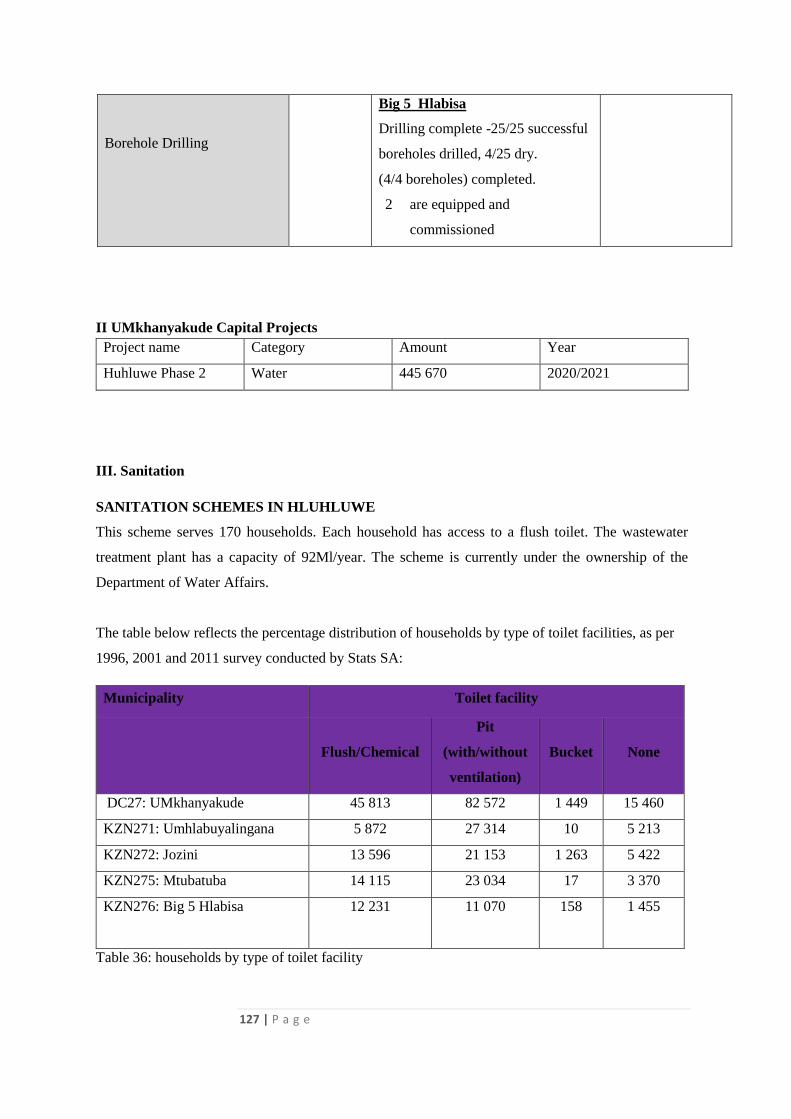
127 | P a g e
Borehole Drilling
Big 5 Hlabisa
Drilling complete -25/25 successful
boreholes drilled, 4/25 dry.
(4/4 boreholes) completed.
2 are equipped and
commissioned
II UMkhanyakude Capital Projects
Project name Category Amount Year
Huhluwe Phase 2 Water 445 670 2020/2021
III. Sanitation
SANITATION SCHEMES IN HLUHLUWE
This scheme serves 170 households. Each household has access to a flush toilet. The wastewater
treatment plant has a capacity of 92Ml/year. The scheme is currently under the ownership of the
Department of Water Affairs.
The table below reflects the percentage distribution of households by type of toilet facilities, as per
1996, 2001 and 2011 survey conducted by Stats SA:
Municipality Toilet facility
Flush/Chemical
Pit
(with/without
ventilation)
Bucket None
DC27: UMkhanyakude 45 813 82 572 1 449 15 460
KZN271: Umhlabuyalingana 5 872 27 314 10 5 213
KZN272: Jozini 13 596 21 153 1 263 5 422
KZN275: Mtubatuba 14 115 23 034 17 3 370
KZN276: Big 5 Hlabisa 12 231 11 070 158 1 455
Table 36: households by type of toilet facility
128 | P a g e
3 SOLID WASTE MANAGEMENT
Solid waste management is indeed a concern ensure sustainable development where the is a balance
between the economic, social and environmental aspect in the area, therefore the municipality has
been able to engage the Environmental Services as the development of Integrated Waste Management
Plan is underway through assistance National support. Further articulation has been undertaken under
the Environmental Status Quo Analysis above.
4.6.3 TRANSPORTATION INFRASTRUCTURE
I. ROAD NETWORKS
N2 and the LSDI are classified in terms of the SDF as Main Transport Routes. The N2 in particular
(and the LSDI road to a smaller degree) carries larger volumes of traffic than the other roads through
the municipal area at higher travelling speeds. There are a number of Tourism Routes identified in the
SDF as well.
The first one is the P466. It primarily provides access to the various private game reserves located in
the northern portion of the municipal area between the N2 and the LSDI road. This area described
above is referred to as a “Management Area” in the draft rural LUMS.
The R22 route is a gateway route for Hluhluwe and a tourism corridor. Secondly, the route from
Hluhluwe in a westerly direction, across the N2, towards the northern entrance of the Hluhluwe
Umfolozi Game Reserve is proposed as a tourism route in the SDF. A portion of this route is the
entrance into Hluhluwe town from the N2.
II. ROAD AND TRANSPORT INFRASTRUCTURE ANALYSIS
The Municipality has a short supply of good all weather roads. This restricts the provision of some
services such as waste removal. In addition, access to economic opportunities is also limited. The main
problem in Big 5 Hlabisa is the lack of access experienced by rural communities as rural roads are not
in a good condition. Public transportation such as taxis and buses are most commonly used across the
municipality. For those areas where road conditions are bad, informal transportation through mainly
the bakkies is used.
The municipality relies heavily on MIG funding for infrastructure development. The rural transport
forum is in place, but its functionality requires some improvement. The transport plan is not in place
and the municipality does not have funding for its development, however funding arrangements will
be initiated with potential funders
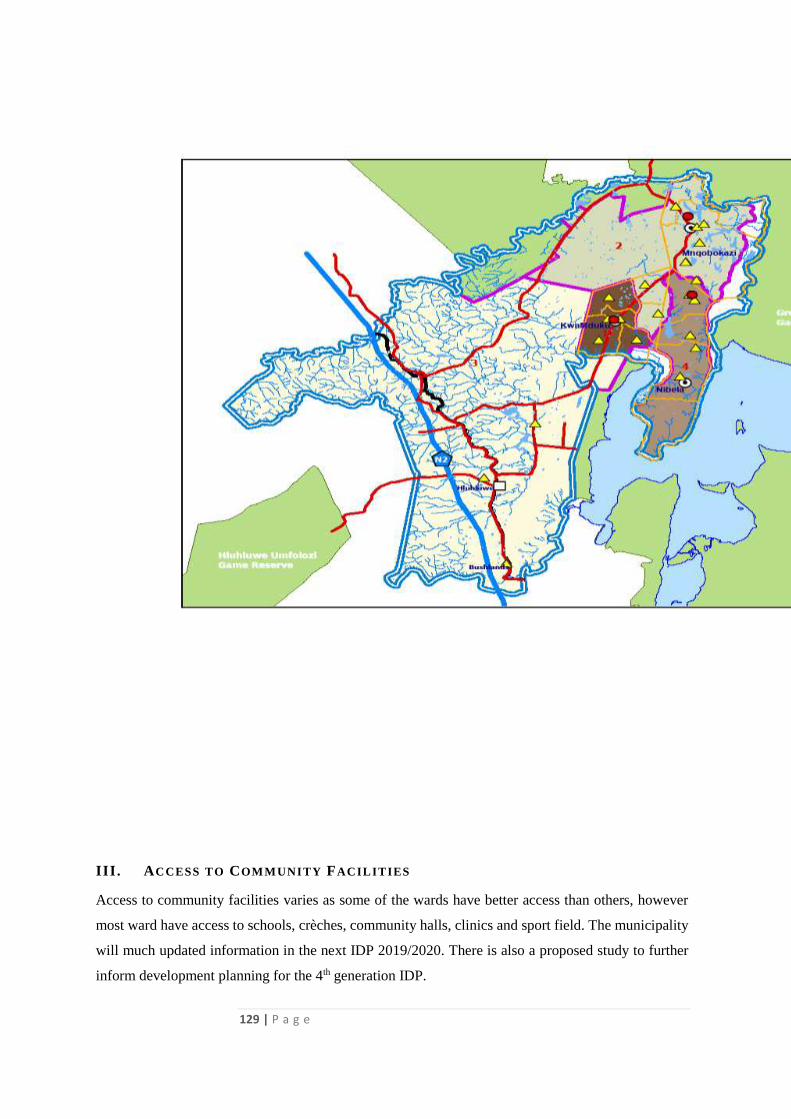
129 | P a g e
III. ACCESS TO COMMUNITY FACILITIES
Access to community facilities varies as some of the wards have better access than others, however
most ward have access to schools, crèches, community halls, clinics and sport field. The municipality
will much updated information in the next IDP 2019/2020. There is also a proposed study to further
inform development planning for the 4th generation IDP.
130 | P a g e
IV. HUMAN SETTLEMENT
Housing delivery is one of the main service delivery needs for the community of Big 5 Hlabisa. During
the needs identification process, it was raised as a concern and the municipality intends to work
tirelessly with the Department of Human Settlement and all relevant stakeholders to make positive
impact and to provide sustainable human settlement. The Housing sector plans were developed in
2009, the new Housing Sector Plan for Big 5 Hlabisa will be in place in May 2018.
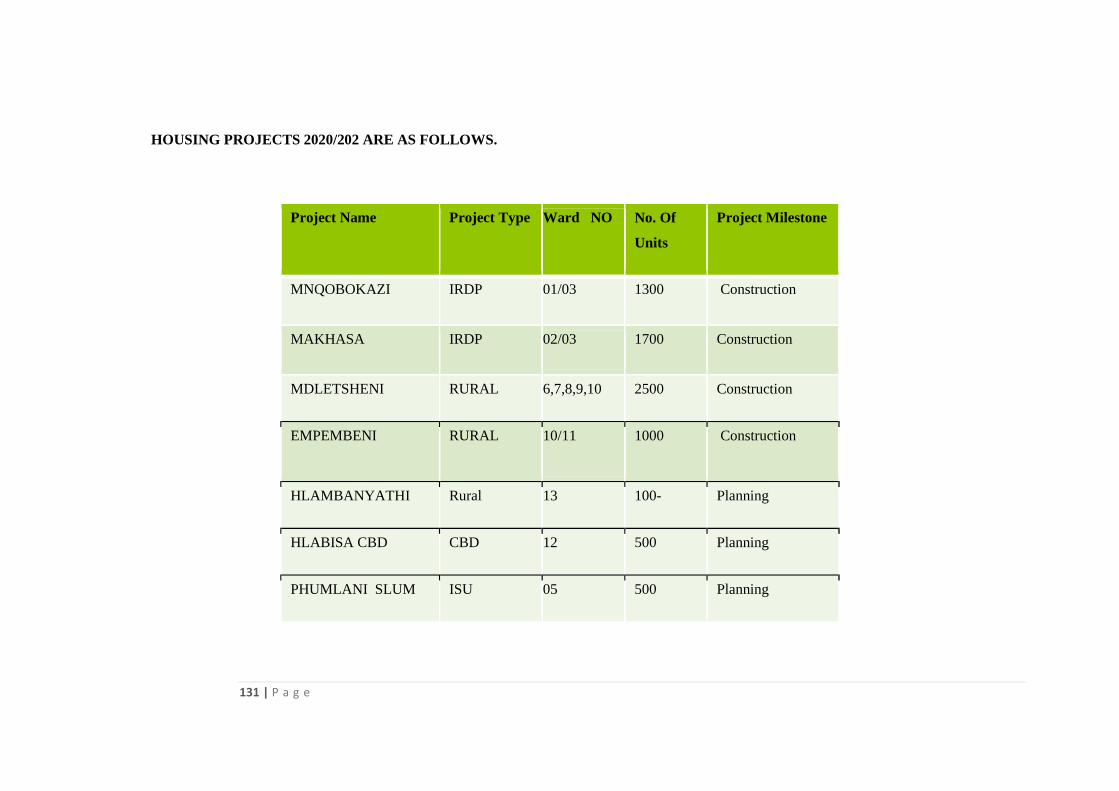
131 | P a g e
HOUSING PROJECTS 2020/202 ARE AS FOLLOWS.
Project Name Project Type Ward NO No. Of
Units
Project Milestone
MNQOBOKAZI IRDP 01/03 1300 Construction
MAKHASA IRDP 02/03 1700 Construction
MDLETSHENI RURAL 6,7,8,9,10 2500 Construction
EMPEMBENI RURAL 10/11 1000 Construction
HLAMBANYATHI Rural 13 100- Planning
HLABISA CBD CBD 12 500 Planning
PHUMLANI SLUM ISU 05 500 Planning
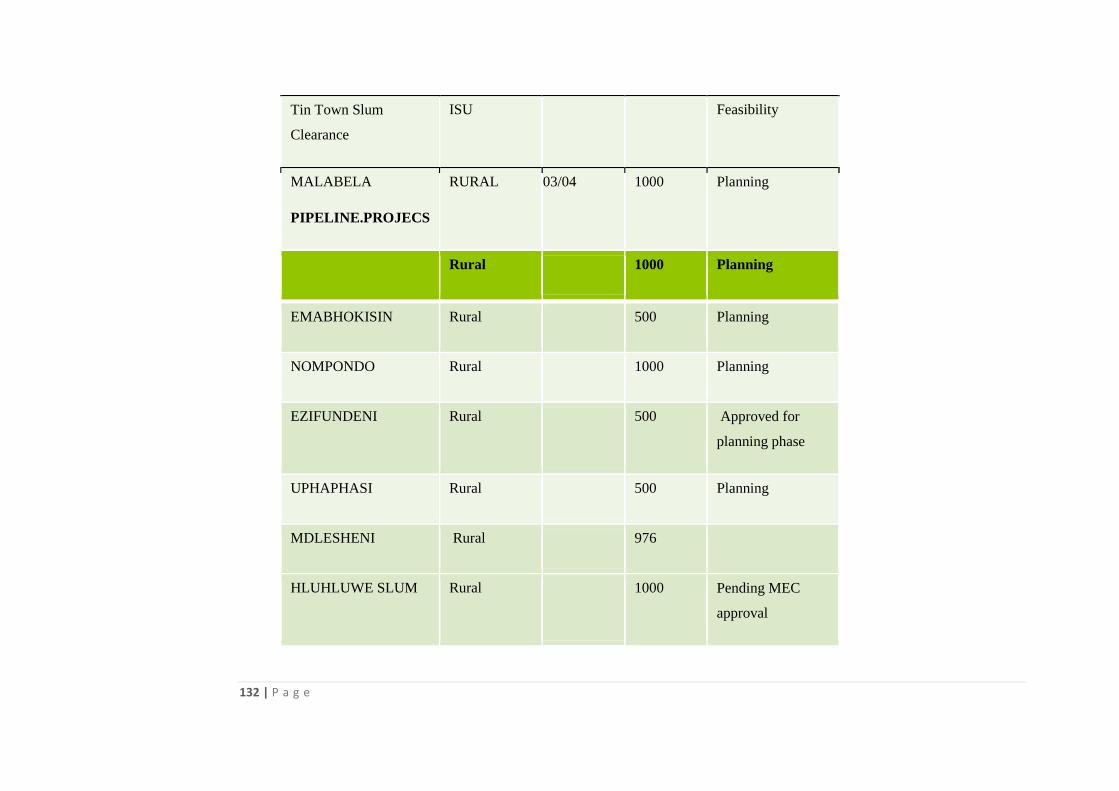
132 | P a g e
Tin Town Slum
Clearance
ISU
Feasibility
MALABELA
PIPELINE.PROJECS
RURAL 03/04 1000 Planning
Rural 1000 Planning
EMABHOKISIN Rural 500 Planning
NOMPONDO Rural 1000 Planning
EZIFUNDENI Rural 500 Approved for
planning phase
UPHAPHASI Rural 500 Planning
MDLESHENI Rural 976
HLUHLUWE SLUM Rural 1000 Pending MEC
approval

133 | P a g e
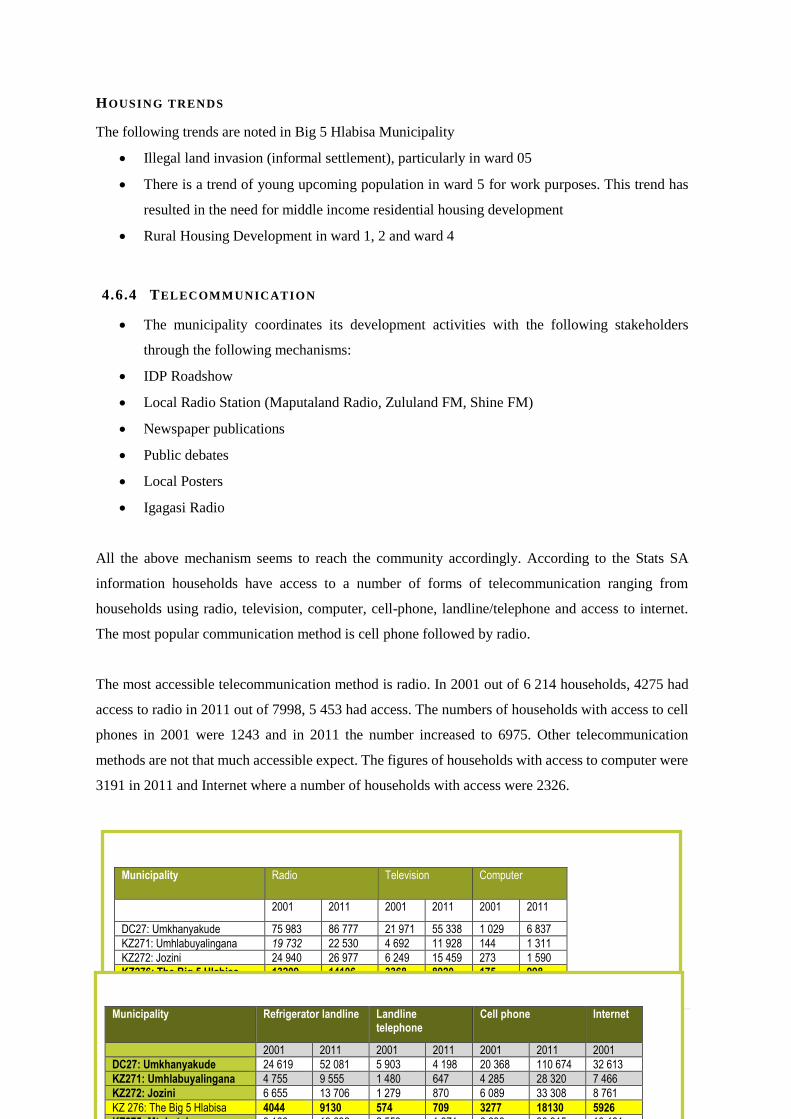
134 | P a g e
HOUSING TRENDS
The following trends are noted in Big 5 Hlabisa Municipality
Illegal land invasion (informal settlement), particularly in ward 05
There is a trend of young upcoming population in ward 5 for work purposes. This trend has
resulted in the need for middle income residential housing development
Rural Housing Development in ward 1, 2 and ward 4
4.6.4 TELECOMMUNICATION
The municipality coordinates its development activities with the following stakeholders
through the following mechanisms:
IDP Roadshow
Local Radio Station (Maputaland Radio, Zululand FM, Shine FM)
Newspaper publications
Public debates
Local Posters
Igagasi Radio
All the above mechanism seems to reach the community accordingly. According to the Stats SA
information households have access to a number of forms of telecommunication ranging from
households using radio, television, computer, cell-phone, landline/telephone and access to internet.
The most popular communication method is cell phone followed by radio.
The most accessible telecommunication method is radio. In 2001 out of 6 214 households, 4275 had
access to radio in 2011 out of 7998, 5 453 had access. The numbers of households with access to cell
phones in 2001 were 1243 and in 2011 the number increased to 6975. Other telecommunication
methods are not that much accessible expect. The figures of households with access to computer were
3191 in 2011 and Internet where a number of households with access were 2326.
Municipality Radio Television Computer
2001 2011 2001 2011 2001 2011
DC27: Umkhanyakude 75 983 86 777 21 971 55 338 1 029 6 837
KZ271: Umhlabuyalingana 19 732 22 530 4 692 11 928 144 1 311
KZ272: Jozini 24 940 26 977 6 249 15 459 273 1 590
KZ276: The Big 5 Hlabisa 13209 14106 3368 8920 175 998
KZ275: Mtubatuba 19 103 23 164 7 662 19 029 438 2 938
Table 39: Distribution of households by access to a radio, television, refrigerator, computer, landline/telephone,
Census 2011
Municipality Refrigerator landline Landline telephone
Cell phone Internet
2001 2011 2001 2011 2001 2011 2001
DC27: Umkhanyakude 24 619 52 081 5 903 4 198 20 368 110 674 32 613
KZ271: Umhlabuyalingana 4 755 9 555 1 480 647 4 285 28 320 7 466
KZ272: Jozini 6 655 13 706 1 279 870 6 089 33 308 8 761
KZ 276: The Big 5 Hlabisa 4044 9130 574 709 3277 18130 5926
KZ275: Mtubatuba 9 166 19 692 2 553 1 971 6 696 30 915 10 461
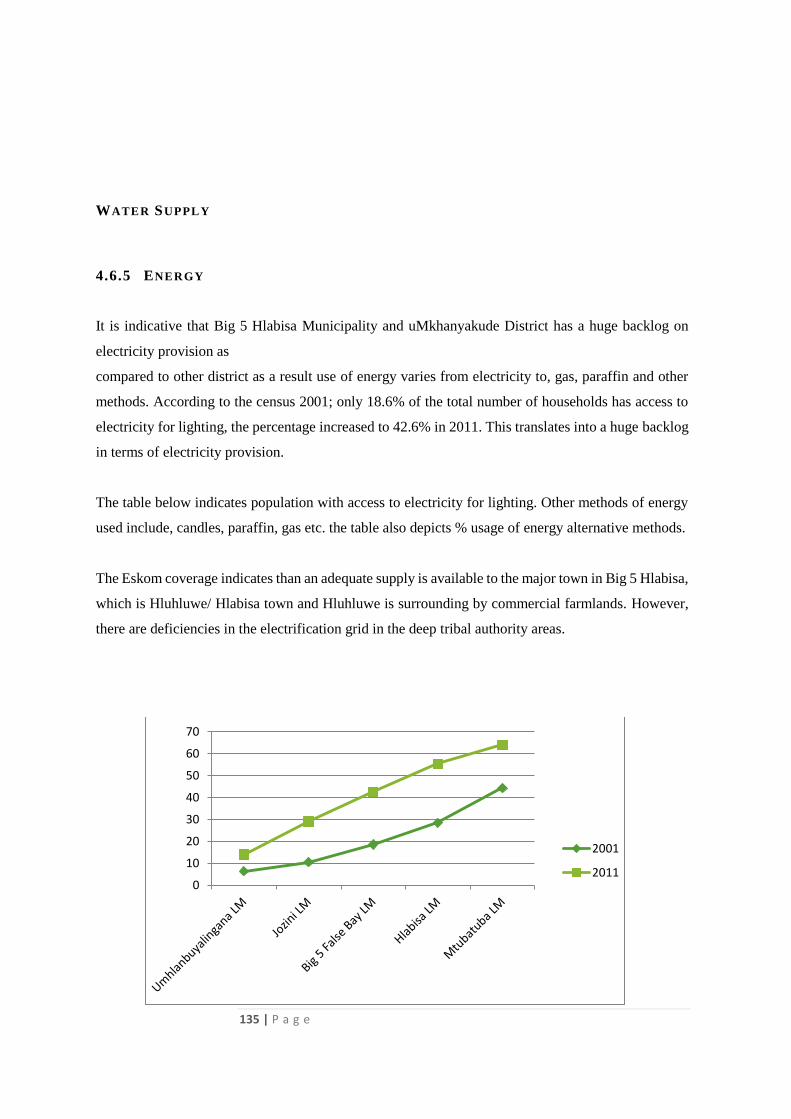
135 | P a g e
WATER SUPPLY
4.6.5 ENERGY
It is indicative that Big 5 Hlabisa Municipality and uMkhanyakude District has a huge backlog on
electricity provision as
compared to other district as a result use of energy varies from electricity to, gas, paraffin and other
methods. According to the census 2001; only 18.6% of the total number of households has access to
electricity for lighting, the percentage increased to 42.6% in 2011. This translates into a huge backlog
in terms of electricity provision.
The table below indicates population with access to electricity for lighting. Other methods of energy
used include, candles, paraffin, gas etc. the table also depicts % usage of energy alternative methods.
The Eskom coverage indicates than an adequate supply is available to the major town in Big 5 Hlabisa,
which is Hluhluwe/ Hlabisa town and Hluhluwe is surrounding by commercial farmlands. However,
there are deficiencies in the electrification grid in the deep tribal authority areas.
0
10
20
30
40
50
60
70
2001
2011
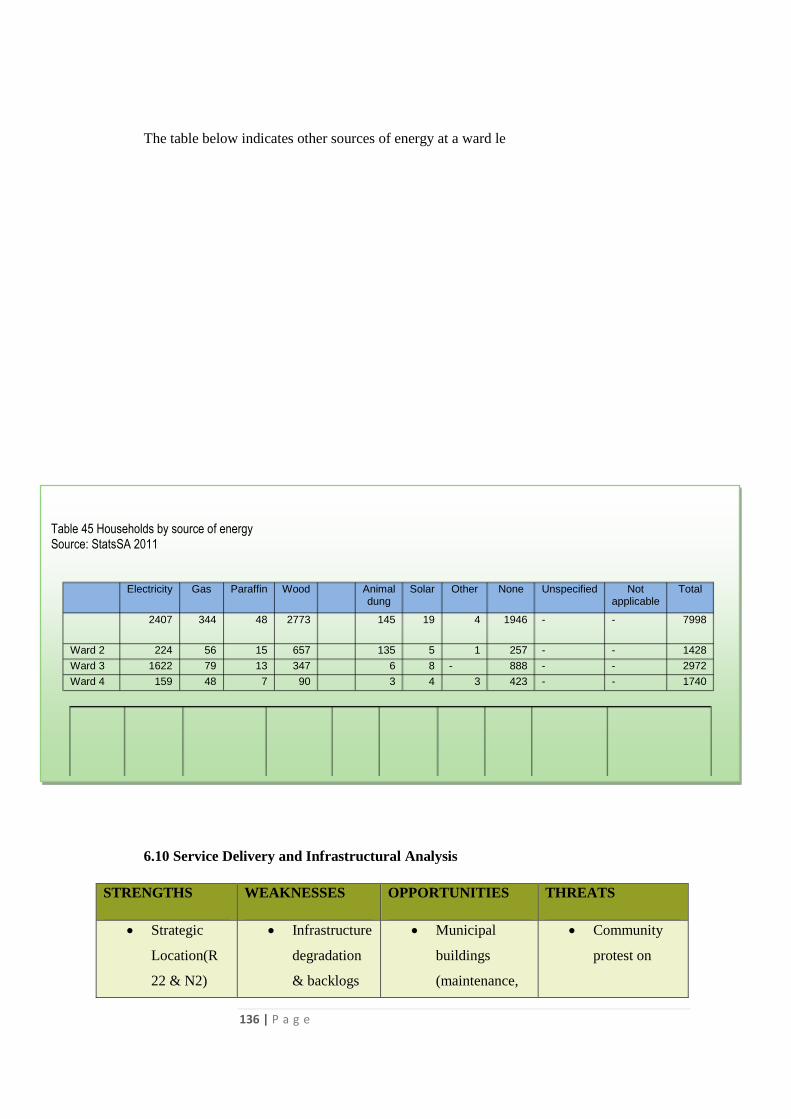
136 | P a g e
The table below indicates other sources of energy at a ward le
6.10 Service Delivery and Infrastructural Analysis
STRENGTHS WEAKNESSES OPPORTUNITIES THREATS
Strategic
Location(R
22 & N2)
Infrastructure
degradation
& backlogs
Municipal
buildings
(maintenance,
Community
protest on
Table 45 Households by source of energy Source: StatsSA 2011
Electricity Gas Paraffin Wood Animal dung
Solar Other None Unspecified Not applicable
Total
2407 344 48 2773 145 19 4 1946 - - 7998
Ward 2 224 56 15 657 135 5 1 257 - - 1428
Ward 3 1622 79 13 347 6 8 - 888 - - 2972
Ward 4 159 48 7 90 3 4 3 423 - - 1740
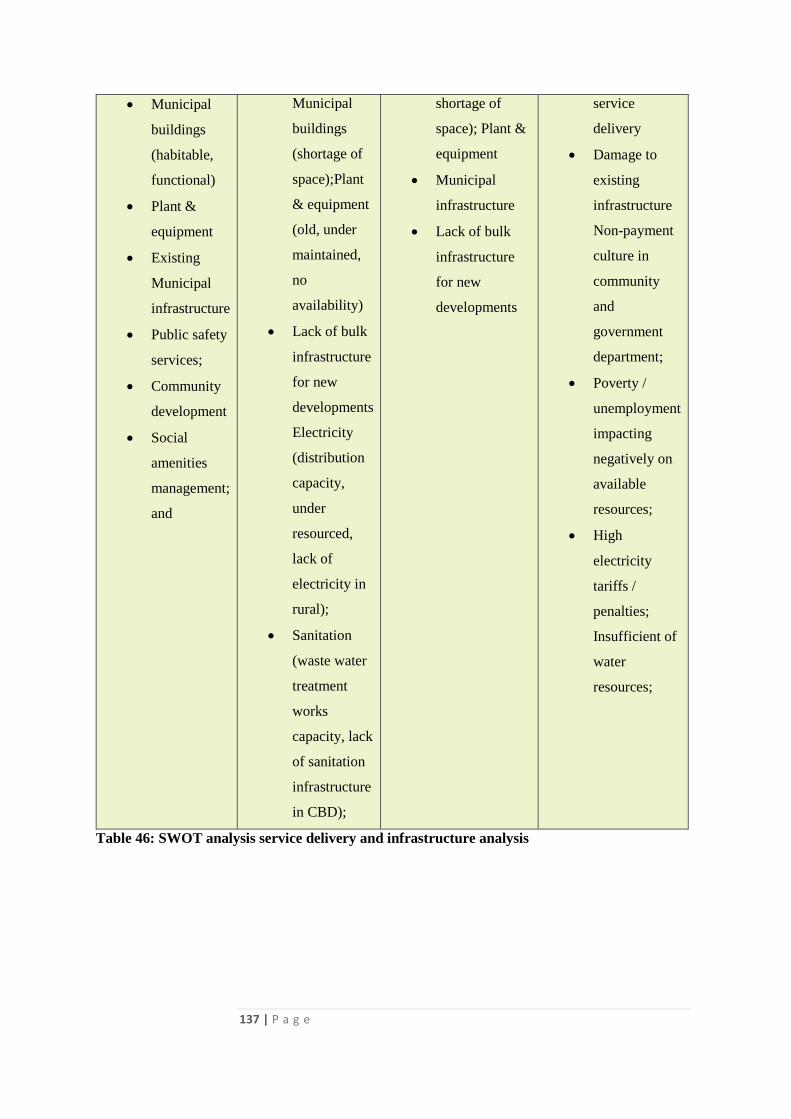
137 | P a g e
Municipal
buildings
(habitable,
functional)
Plant &
equipment
Existing
Municipal
infrastructure
Public safety
services;
Community
development
Social
amenities
management;
and
Municipal
buildings
(shortage of
space);Plant
& equipment
(old, under
maintained,
no
availability)
Lack of bulk
infrastructure
for new
developments
Electricity
(distribution
capacity,
under
resourced,
lack of
electricity in
rural);
Sanitation
(waste water
treatment
works
capacity, lack
of sanitation
infrastructure
in CBD);
shortage of
space); Plant &
equipment
Municipal
infrastructure
Lack of bulk
infrastructure
for new
developments
service
delivery
Damage to
existing
infrastructure
Non-payment
culture in
community
and
government
department;
Poverty /
unemployment
impacting
negatively on
available
resources;
High
electricity
tariffs /
penalties;
Insufficient of
water
resources;
Table 46: SWOT analysis service delivery and infrastructure analysis
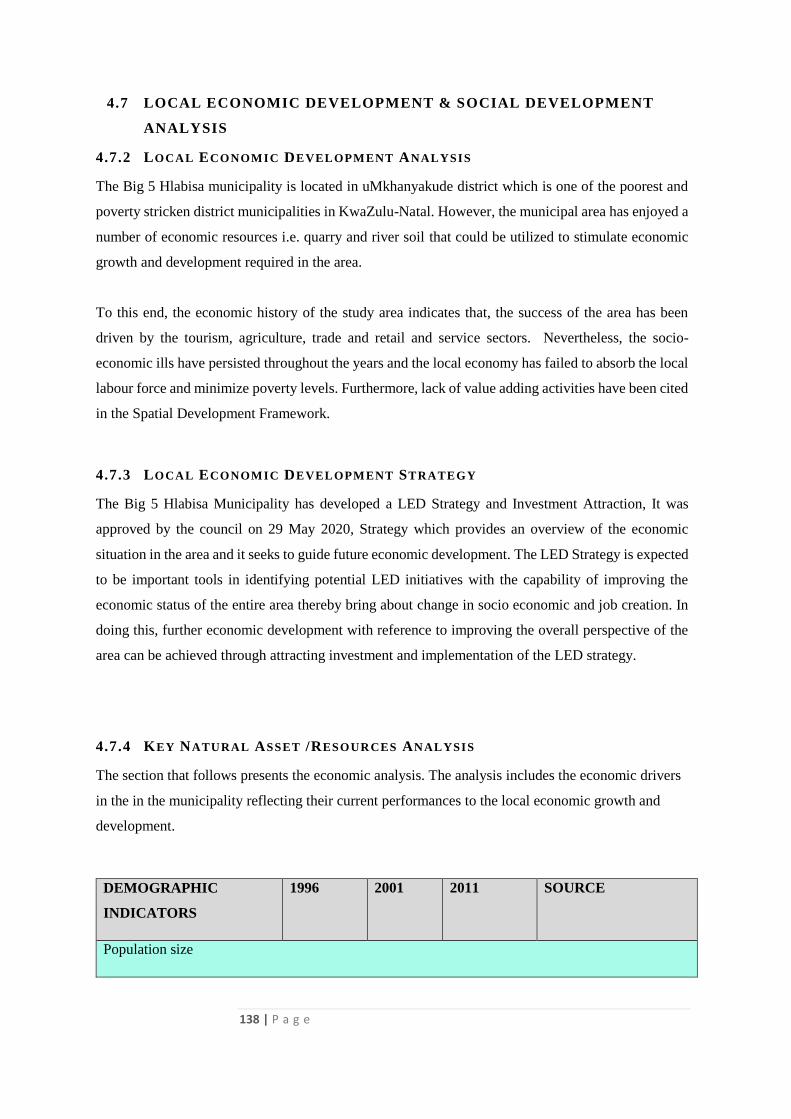
138 | P a g e
4.7 LOCAL ECONOMIC DEVELOPMENT & SOCIAL DEVELOPMENT
ANALYSIS
4.7.2 LOCAL ECONOMIC DEVELOPMENT ANALYSIS
The Big 5 Hlabisa municipality is located in uMkhanyakude district which is one of the poorest and
poverty stricken district municipalities in KwaZulu-Natal. However, the municipal area has enjoyed a
number of economic resources i.e. quarry and river soil that could be utilized to stimulate economic
growth and development required in the area.
To this end, the economic history of the study area indicates that, the success of the area has been
driven by the tourism, agriculture, trade and retail and service sectors. Nevertheless, the socio-
economic ills have persisted throughout the years and the local economy has failed to absorb the local
labour force and minimize poverty levels. Furthermore, lack of value adding activities have been cited
in the Spatial Development Framework.
4.7.3 LOCAL ECONOMIC DEVELOPMENT STRATEGY
The Big 5 Hlabisa Municipality has developed a LED Strategy and Investment Attraction, It was
approved by the council on 29 May 2020, Strategy which provides an overview of the economic
situation in the area and it seeks to guide future economic development. The LED Strategy is expected
to be important tools in identifying potential LED initiatives with the capability of improving the
economic status of the entire area thereby bring about change in socio economic and job creation. In
doing this, further economic development with reference to improving the overall perspective of the
area can be achieved through attracting investment and implementation of the LED strategy.
4.7.4 KEY NATURAL ASSET /RESOURCES ANALYSIS
The section that follows presents the economic analysis. The analysis includes the economic drivers
in the in the municipality reflecting their current performances to the local economic growth and
development.
DEMOGRAPHIC
INDICATORS
1996 2001 2011 SOURCE
Population size
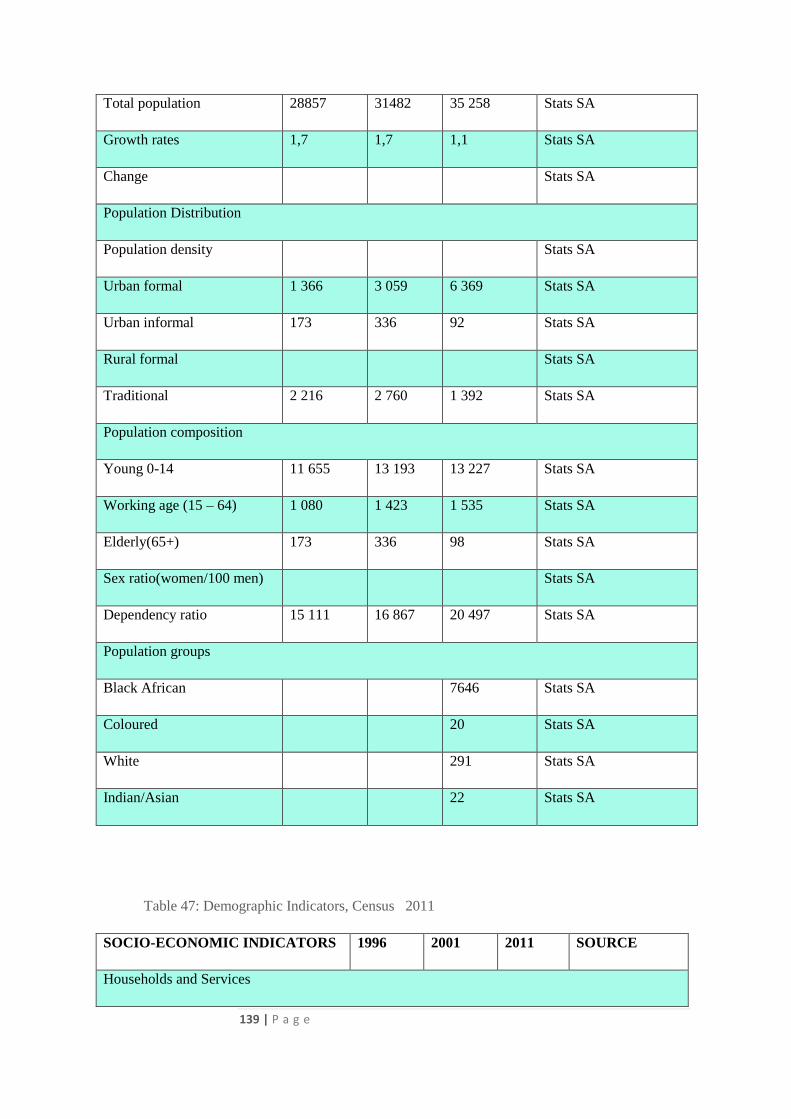
139 | P a g e
Total population 28857 31482 35 258 Stats SA
Growth rates 1,7 1,7 1,1 Stats SA
Change Stats SA
Population Distribution
Population density Stats SA
Urban formal 1 366 3 059 6 369 Stats SA
Urban informal 173 336 92 Stats SA
Rural formal Stats SA
Traditional 2 216 2 760 1 392 Stats SA
Population composition
Young 0-14 11 655 13 193 13 227 Stats SA
Working age (15 – 64) 1 080 1 423 1 535 Stats SA
Elderly(65+) 173 336 98 Stats SA
Sex ratio(women/100 men) Stats SA
Dependency ratio 15 111 16 867 20 497 Stats SA
Population groups
Black African 7646 Stats SA
Coloured 20 Stats SA
White 291 Stats SA
Indian/Asian 22 Stats SA
Table 47: Demographic Indicators, Census 2011
SOCIO-ECONOMIC INDICATORS 1996 2001 2011 SOURCE
Households and Services
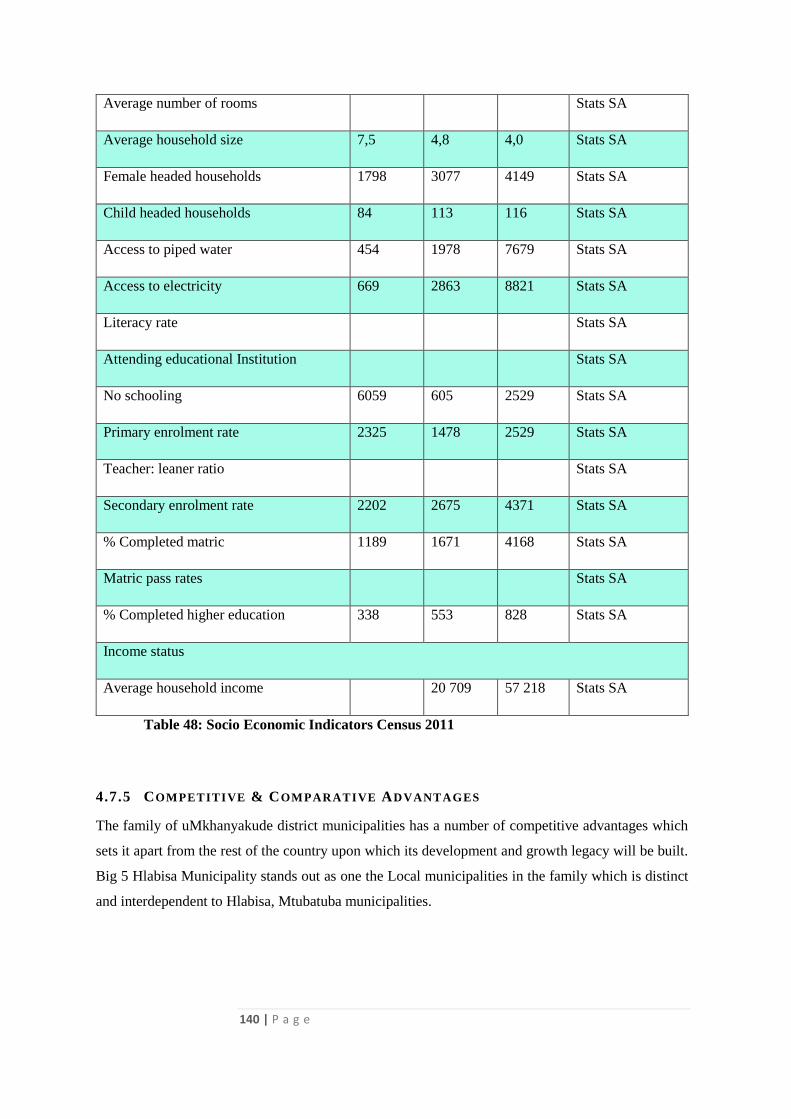
140 | P a g e
Average number of rooms Stats SA
Average household size 7,5 4,8 4,0 Stats SA
Female headed households 1798 3077 4149 Stats SA
Child headed households 84 113 116 Stats SA
Access to piped water 454 1978 7679 Stats SA
Access to electricity 669 2863 8821 Stats SA
Literacy rate Stats SA
Attending educational Institution Stats SA
No schooling 6059 605 2529 Stats SA
Primary enrolment rate 2325 1478 2529 Stats SA
Teacher: leaner ratio Stats SA
Secondary enrolment rate 2202 2675 4371 Stats SA
% Completed matric 1189 1671 4168 Stats SA
Matric pass rates Stats SA
% Completed higher education 338 553 828 Stats SA
Income status
Average household income 20 709 57 218 Stats SA
Table 48: Socio Economic Indicators Census 2011
4.7.5 COMPETITIVE & COMPARATIVE ADVANTAGES
The family of uMkhanyakude district municipalities has a number of competitive advantages which
sets it apart from the rest of the country upon which its development and growth legacy will be built.
Big 5 Hlabisa Municipality stands out as one the Local municipalities in the family which is distinct
and interdependent to Hlabisa, Mtubatuba municipalities.
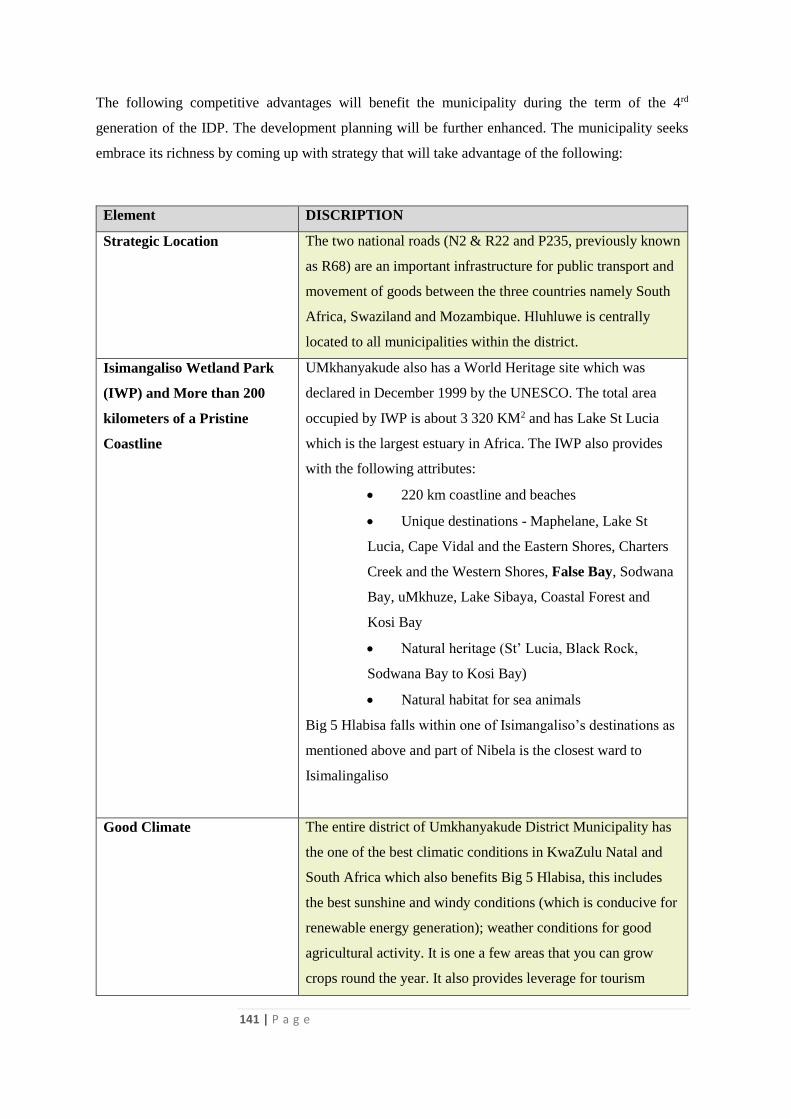
141 | P a g e
The following competitive advantages will benefit the municipality during the term of the 4rd
generation of the IDP. The development planning will be further enhanced. The municipality seeks
embrace its richness by coming up with strategy that will take advantage of the following:
Element DISCRIPTION
Strategic Location
The two national roads (N2 & R22 and P235, previously known
as R68) are an important infrastructure for public transport and
movement of goods between the three countries namely South
Africa, Swaziland and Mozambique. Hluhluwe is centrally
located to all municipalities within the district.
Isimangaliso Wetland Park
(IWP) and More than 200
kilometers of a Pristine
Coastline
UMkhanyakude also has a World Heritage site which was
declared in December 1999 by the UNESCO. The total area
occupied by IWP is about 3 320 KM2 and has Lake St Lucia
which is the largest estuary in Africa. The IWP also provides
with the following attributes:
220 km coastline and beaches
Unique destinations - Maphelane, Lake St
Lucia, Cape Vidal and the Eastern Shores, Charters
Creek and the Western Shores, False Bay, Sodwana
Bay, uMkhuze, Lake Sibaya, Coastal Forest and
Kosi Bay
Natural heritage (St’ Lucia, Black Rock,
Sodwana Bay to Kosi Bay)
Natural habitat for sea animals
Big 5 Hlabisa falls within one of Isimangaliso’s destinations as
mentioned above and part of Nibela is the closest ward to
Isimalingaliso
Good Climate
The entire district of Umkhanyakude District Municipality has
the one of the best climatic conditions in KwaZulu Natal and
South Africa which also benefits Big 5 Hlabisa, this includes
the best sunshine and windy conditions (which is conducive for
renewable energy generation); weather conditions for good
agricultural activity. It is one a few areas that you can grow
crops round the year. It also provides leverage for tourism
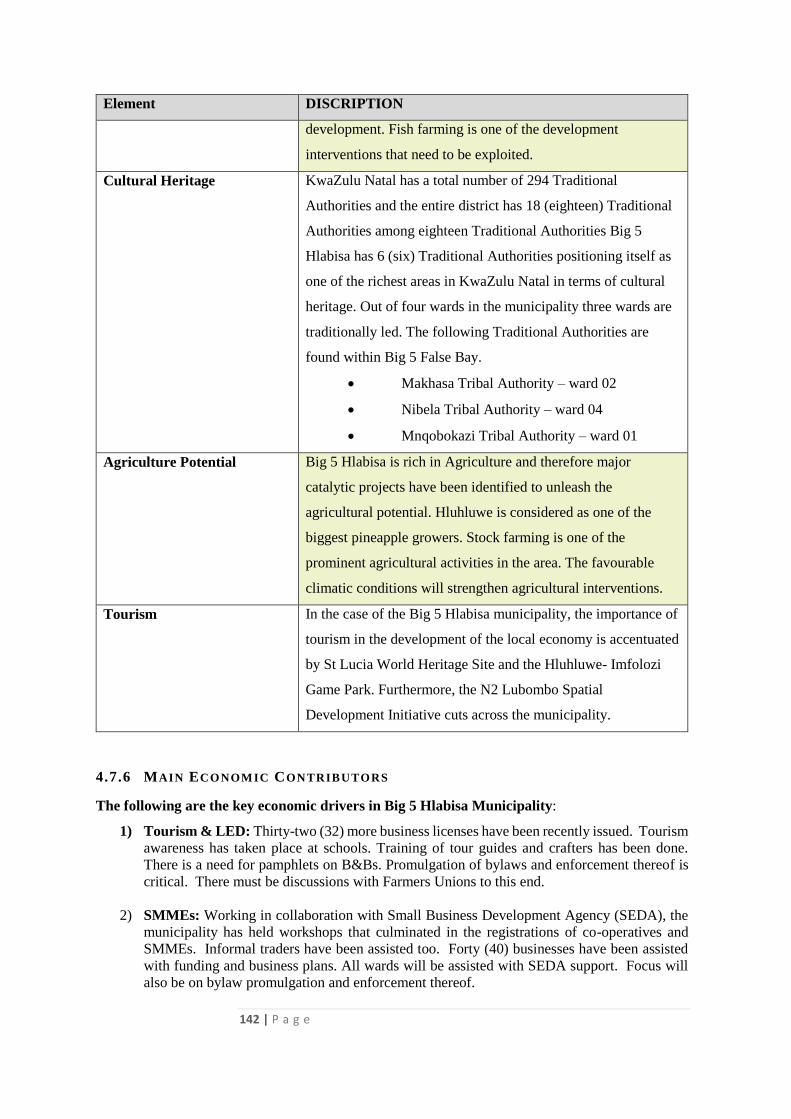
142 | P a g e
Element DISCRIPTION
development. Fish farming is one of the development
interventions that need to be exploited.
Cultural Heritage
KwaZulu Natal has a total number of 294 Traditional
Authorities and the entire district has 18 (eighteen) Traditional
Authorities among eighteen Traditional Authorities Big 5
Hlabisa has 6 (six) Traditional Authorities positioning itself as
one of the richest areas in KwaZulu Natal in terms of cultural
heritage. Out of four wards in the municipality three wards are
traditionally led. The following Traditional Authorities are
found within Big 5 False Bay.
Makhasa Tribal Authority – ward 02
Nibela Tribal Authority – ward 04
Mnqobokazi Tribal Authority – ward 01
Agriculture Potential
Big 5 Hlabisa is rich in Agriculture and therefore major
catalytic projects have been identified to unleash the
agricultural potential. Hluhluwe is considered as one of the
biggest pineapple growers. Stock farming is one of the
prominent agricultural activities in the area. The favourable
climatic conditions will strengthen agricultural interventions.
Tourism
In the case of the Big 5 Hlabisa municipality, the importance of
tourism in the development of the local economy is accentuated
by St Lucia World Heritage Site and the Hluhluwe- Imfolozi
Game Park. Furthermore, the N2 Lubombo Spatial
Development Initiative cuts across the municipality.
4.7.6 MAIN ECONOMIC CONTRIBUTORS
The following are the key economic drivers in Big 5 Hlabisa Municipality:
1) Tourism & LED: Thirty-two (32) more business licenses have been recently issued. Tourism
awareness has taken place at schools. Training of tour guides and crafters has been done.
There is a need for pamphlets on B&Bs. Promulgation of bylaws and enforcement thereof is
critical. There must be discussions with Farmers Unions to this end.
2) SMMEs: Working in collaboration with Small Business Development Agency (SEDA), the
municipality has held workshops that culminated in the registrations of co-operatives and
SMMEs. Informal traders have been assisted too. Forty (40) businesses have been assisted
with funding and business plans. All wards will be assisted with SEDA support. Focus will
also be on bylaw promulgation and enforcement thereof.
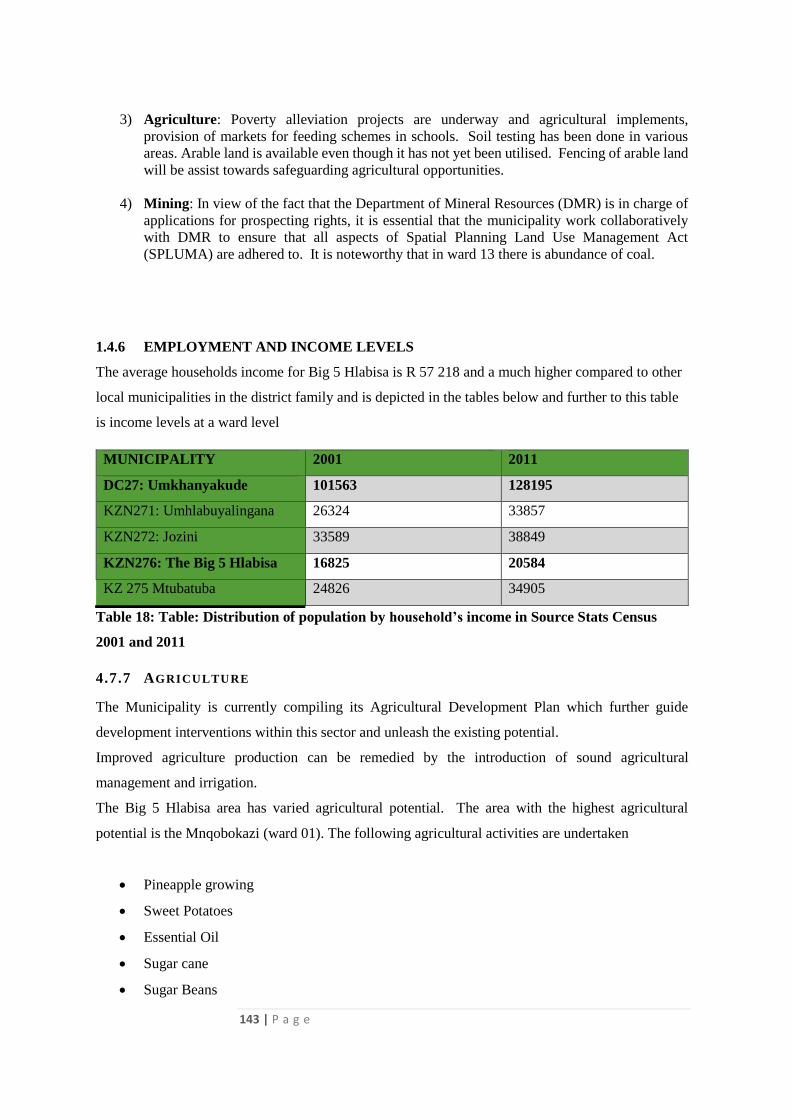
143 | P a g e
3) Agriculture: Poverty alleviation projects are underway and agricultural implements,
provision of markets for feeding schemes in schools. Soil testing has been done in various
areas. Arable land is available even though it has not yet been utilised. Fencing of arable land
will be assist towards safeguarding agricultural opportunities.
4) Mining: In view of the fact that the Department of Mineral Resources (DMR) is in charge of
applications for prospecting rights, it is essential that the municipality work collaboratively
with DMR to ensure that all aspects of Spatial Planning Land Use Management Act
(SPLUMA) are adhered to. It is noteworthy that in ward 13 there is abundance of coal.
1.4.6 EMPLOYMENT AND INCOME LEVELS
The average households income for Big 5 Hlabisa is R 57 218 and a much higher compared to other
local municipalities in the district family and is depicted in the tables below and further to this table
is income levels at a ward level
MUNICIPALITY 2001 2011
DC27: Umkhanyakude 101563 128195
KZN271: Umhlabuyalingana 26324 33857
KZN272: Jozini 33589 38849
KZN276: The Big 5 Hlabisa 16825 20584
KZ 275 Mtubatuba 24826 34905
Table 18: Table: Distribution of population by household’s income in Source Stats Census
2001 and 2011
4.7.7 AGRICULTURE
The Municipality is currently compiling its Agricultural Development Plan which further guide
development interventions within this sector and unleash the existing potential.
Improved agriculture production can be remedied by the introduction of sound agricultural
management and irrigation.
The Big 5 Hlabisa area has varied agricultural potential. The area with the highest agricultural
potential is the Mnqobokazi (ward 01). The following agricultural activities are undertaken
Pineapple growing
Sweet Potatoes
Essential Oil
Sugar cane
Sugar Beans
144 | P a g e
Timber plantation
The municipality intends to further facilitate local processing; currently there are engagements with
COGTA and Agriculture on sweat potatoes production and processing locally. There are current
engagements with Department of Trade & Industry on local pineapple processing which are however
not yet at an advanced stage, but there are some deliverables which would be realized during
2020/2021
The agricultural potential in ward one is followed by Nibela (Ward 04) which has distinguished itself
on small scale fishery
Soil conditions and climate culminate to create the perfect conditions for pineapple production, and
the Hluhluwe has distinguished itself in producing 98% of table pineapples in the country. Queen and
Cayan pineapples are sought after for the fresh fruit market.
The municipality works with Department of Agriculture on the following food security projects:
Community gardens
Poultry
7.7.8. TOURISM
UMkhanyakude District is recognized by the KwaZulu-Natal Tourism Authority (KZNTA) as a
unique tourist destination within the Province, and has potential to develop into a world-class
destination. This is based on the districts rich and diverse natural resource base and the strategic
location of the district, which positions it to benefit from the SADC development initiatives. The
Lubombo Spatial Development Initiative, Lubombo/ Transfrontier Conservation Area and
UMkhanyakude District Municipality all identifies tourism as a leading economic and growth sector
that needs to be promoted within the district.
The primary attractions within UMkhanyakude District include a combination of various wildlife and
coastal zones, previously marketed as a component of ‘Zululand’, with a number of individual tourism
publicity associations focusing on individual areas such as Maputaland, Hluhluwe and St Lucia. It
appears that the current status is one of being a previous component of ‘Zululand’ and developing its
own identity.
145 | P a g e
4.7.8 SMALL MEDIUM AND MICRO ENTERPRISES (SMMES)
The development of mass trading is one of the most important developments in the political economy
of Big 5 Hlabisa Municipality. The creation of employment and income opportunities for thousands,
and the provision of cheap and symbolically important goods and services to urban marginal, have
resulted in informal trade drastically changing the lives of the poor and has forced forward redefinition
of Big 5 Hlabisa life, space and culture. The majority of the informal traders are women; the emergence
of street trading is a history of active and defiant women creating a productive sphere for them in an
oppressive environment.
In response the above Big 5 Hlabisa has developed Informal Trading Policy, which addresses amongst
other things the improved management and control of informal trading
The focus on SMME development for Big 5 Hlabisa as a critical factor for economic growth means
that the municipality must promote the economic change through channels, the established firms,
markets and new entrepreneurial businesses.
It is important to recognize that supporting SMME development at a local government level, involves
creating linkages and networking among the local agencies concerned with the different components
of SMME development, as well as building sustainable partnerships among local government bodies,
government organizations’, the private sector, NGOs, and communities, in order to ensure continuing
support for SMMEs to grow, sustain and expand their businesses.
Currently the municipality is involved in the following interventions
Increased agricultural production
Capacity building and training
Reduction in unemployment rate
Employment creation
Social development
Support to existing enterprises
Poverty reduction
Avail municipal land to SMME
4.7.9 INFORMAL SECTOR
The municipality has developed the informal trader’s policy and it has been approved by the council.
The informal economy makes an imperative influence to the economic and community life of most
South Africans, including most residents in Big 5 Hlabisa. It established quickly in the 1990s due to
146 | P a g e
deregulation of the economy and the changeover to a self-governing political system. The informal
economy in Big 5 Hlabisa municipal area is ranging from street traders and shebeen owners to child
career and domestic workers.
The following is the list of activities falling within the Informal Sector
Street traders
Hairdressing and hair cut
Traditional medicine
Restaurants/ Food outlets
Traditional wear,
Shoes and shoe repairs
Trader in pedestrian
Taxi drivers
Traders found in public open spaces
4.7.10 MANUFACTURING (INDUSTRIAL)
Although commerce and industry comes third after services and agriculture as an economic driver but,
it is not a major one. At present this is dominated by retail and business services such financial
institutions and retail outlets. Big retail outlets are still not located in the municipality. This can be
attributed to the low purchasing power parity in the municipality as demonstrated by low levels of
employment and low levels of earnings.
Wholesale and industry represents about 14% of the economic activities in the municipality. Big 5
Hlabisa is the major economic hub of the municipality with various government services centers, retail
outlets and retail banking and other financial services centers being located in the town.
Currently there are no major industrial activities taking place in the Big 5 Hlabisa municipality. Light
industry has also not taken place as it could have been. This means that all major commodities and
needs of the communities in the municipality are imported from Richards Bay, Empangeni and other
major centers.
This is an area with a potential for growth and again the development of a Commerce and
Manufacturing Plan by the municipality may be necessary to identify and package opportunities,
particularly for small business development.
147 | P a g e
4.7.11 THREATS AND RESTRICTI ONS FACING MANUFACTURING SECTOR
Challenges Facing Manufacturers in Big 5 Hlabisa Municipality are:
Skills Shortages;
Lack of Water and Electricity, and
Planning & Zoning Regulations
4.7.12 EXPANDED PUBLICS WORKS PROGRAMME
EPWP is a key government initiative which contributes to Government Policy Priorities in terms of
decent work and sustainable livelihoods; it also seeks to ensure provision of poverty and income relief
through temporary work for the unemployed to carry our social useful activities.
The Big 5-Hlabisa Municipality is currently participating in the phase three EPWP initiative. It must
be noted that the Municipality did not participate in the previous two phases. In this phase the
Municipality has received R 1 million grant/funding from the National Treasury and as a result 151
job opportunities and 18 Full Time Equivalents (FTEs) were created during the financial year (2020-
2021). The participants are divided into different wards and are working on three different projects,
and these are listed below:
Hluhluwe Town Beautification
Roads and Infrastructure Development
Storm water drainage
Hlabisa Town Beautification
The project targets will be achieved and within the budget received. Through this initiative, it must be
noted that the Municipality is now responding to issues of waste management and refuse collection.
Of particular importance, the participants were recruited from all wards of the Municipality and the
initiative has received a reasonable support from the community.
4.7.13 .SERVICES
Big 5 Hlabisa Municipality is main service center\ and the following government departments are in
existence:
Medical
Education
Home Affairs
Safety and Security
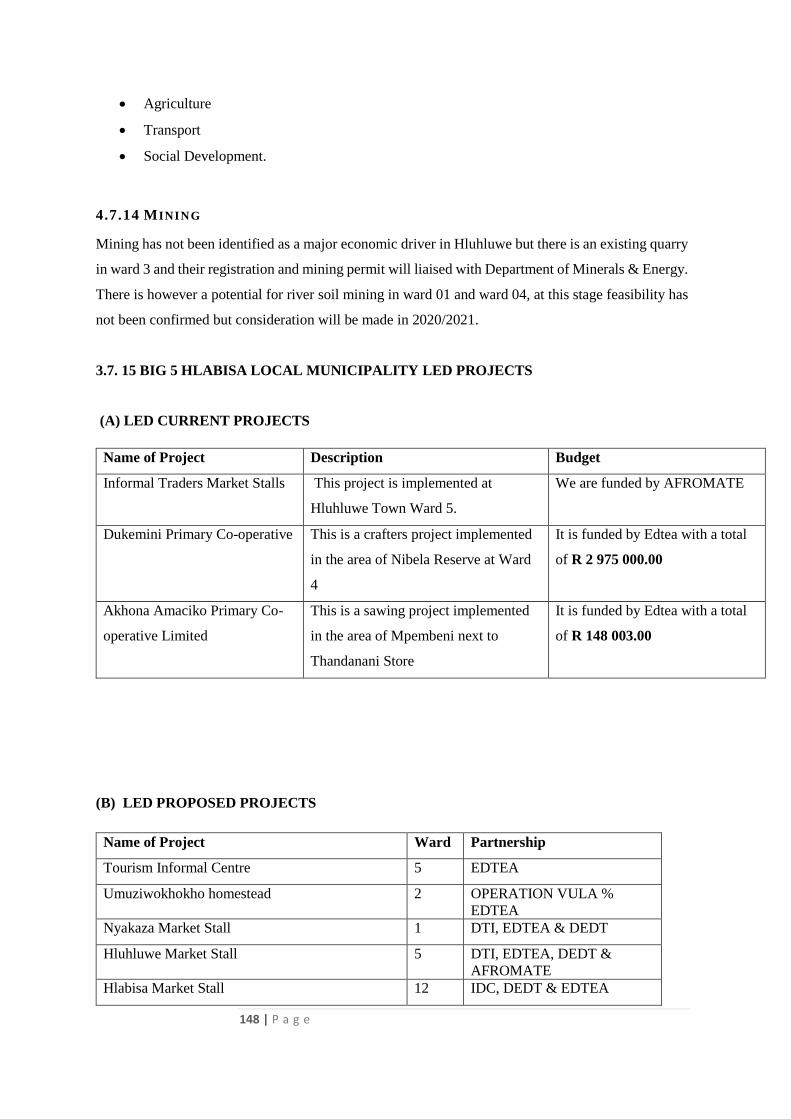
148 | P a g e
Agriculture
Transport
Social Development.
4.7.14 MINING
Mining has not been identified as a major economic driver in Hluhluwe but there is an existing quarry
in ward 3 and their registration and mining permit will liaised with Department of Minerals & Energy.
There is however a potential for river soil mining in ward 01 and ward 04, at this stage feasibility has
not been confirmed but consideration will be made in 2020/2021.
3.7. 15 BIG 5 HLABISA LOCAL MUNICIPALITY LED PROJECTS
(A) LED CURRENT PROJECTS
Name of Project Description Budget
Informal Traders Market Stalls This project is implemented at
Hluhluwe Town Ward 5.
We are funded by AFROMATE
Dukemini Primary Co-operative This is a crafters project implemented
in the area of Nibela Reserve at Ward
4
It is funded by Edtea with a total
of R 2 975 000.00
Akhona Amaciko Primary Co-
operative Limited
This is a sawing project implemented
in the area of Mpembeni next to
Thandanani Store
It is funded by Edtea with a total
of R 148 003.00
(B) LED PROPOSED PROJECTS
Name of Project Ward Partnership
Tourism Informal Centre 5 EDTEA
Umuziwokhokho homestead 2 OPERATION VULA %
EDTEA
Nyakaza Market Stall 1 DTI, EDTEA & DEDT
Hluhluwe Market Stall 5 DTI, EDTEA, DEDT &
AFROMATE
Hlabisa Market Stall 12 IDC, DEDT & EDTEA
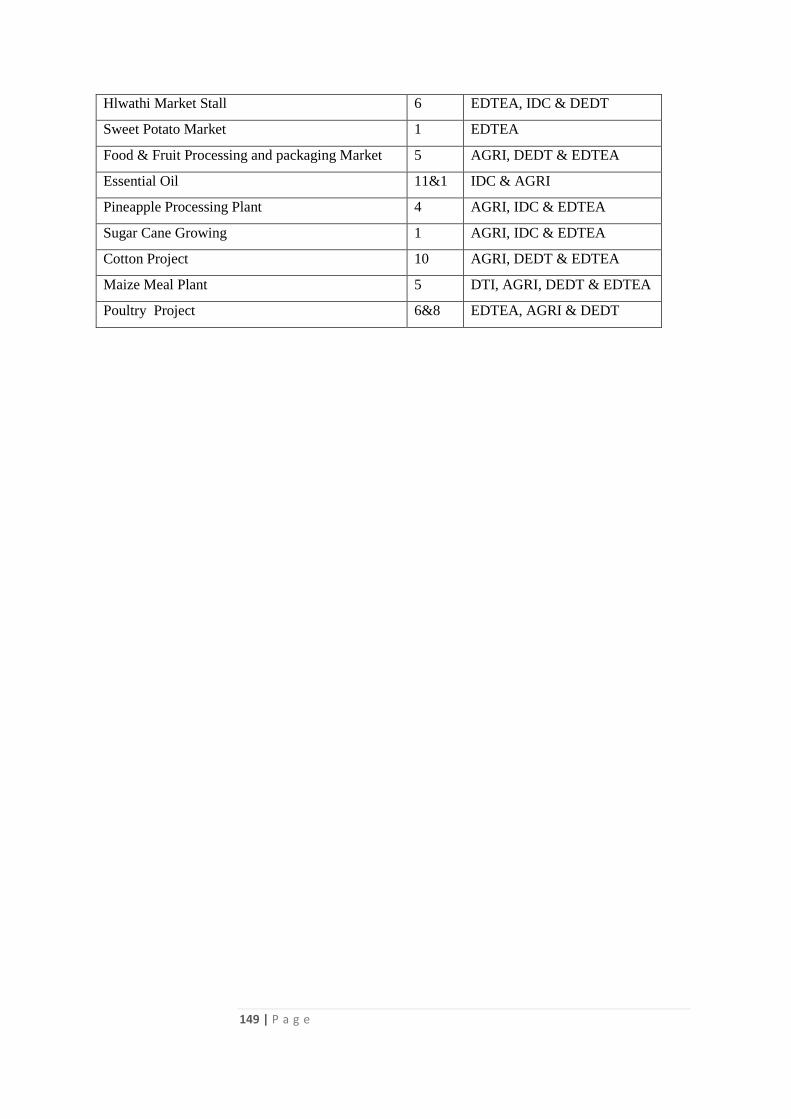
149 | P a g e
Hlwathi Market Stall 6 EDTEA, IDC & DEDT
Sweet Potato Market 1 EDTEA
Food & Fruit Processing and packaging Market 5 AGRI, DEDT & EDTEA
Essential Oil 11&1 IDC & AGRI
Pineapple Processing Plant 4 AGRI, IDC & EDTEA
Sugar Cane Growing 1 AGRI, IDC & EDTEA
Cotton Project 10 AGRI, DEDT & EDTEA
Maize Meal Plant 5 DTI, AGRI, DEDT & EDTEA
Poultry Project 6&8 EDTEA, AGRI & DEDT
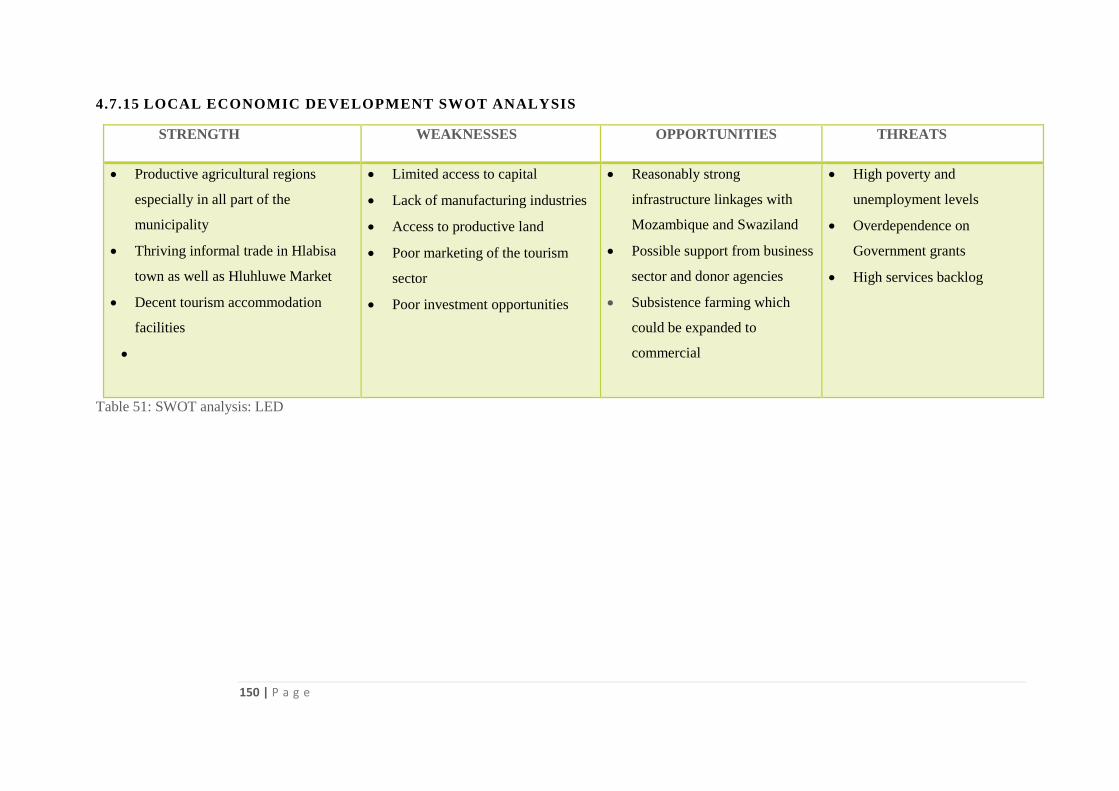
150 | P a g e
4.7.15 LOCAL ECONOMIC DEVELOPMENT SWOT ANALYSIS
STRENGTH WEAKNESSES OPPORTUNITIES THREATS
Productive agricultural regions
especially in all part of the
municipality
Thriving informal trade in Hlabisa
town as well as Hluhluwe Market
Decent tourism accommodation
facilities
Limited access to capital
Lack of manufacturing industries
Access to productive land
Poor marketing of the tourism
sector
Poor investment opportunities
Reasonably strong
infrastructure linkages with
Mozambique and Swaziland
Possible support from business
sector and donor agencies
Subsistence farming which
could be expanded to
commercial
High poverty and
unemployment levels
Overdependence on
Government grants
High services backlog
Table 51: SWOT analysis: LED
151
4.8 SOCIAL DEVELOPMENT ANALYSIS
4.8.2 BROAD BASED COMMUNITY NEEDS -2012/2015 - 2020/2021
During the analysis phase of the IDP the consultative meetings held as mentioned in section A of the
document where the councilors and the mayor, councilors and the IDP unit visited the community to
identify critical issues on ground. Analysis was out of the issues raised and the municipality had
several strategic sessions where the strategic objectives were developed for future development of the
communities. The strategic objectives were developed and articulated in section D of this document.
Programs and Projects are also further outlined in section H of the document. In summary the
following needs have been prioritized.
4.8.3 EDUCATION
The uMkhanyakude family has the lowest educational levels as compared to other districts according
to the Stats SA Census 2011. The enrolment at primary schools has been improving since 1996. The
numbers of children with primary education and that have some secondary education and have
completed it have also been increasing. The number of households with access to higher education
and that have been able to complete it are very low and therefore require some attention.
It is however noted and becoming a concern that the matric pass rate has not been favorable since 2008
and is depicted in the table below the pass rate was provided by the Department of Education. The
access to educational facilities is analyzed under Service Delivery and Infrastructure Development
subtopic community facilities.
4.8.4 HEALTH
The municipality does not directly provide this service but works with the Department of Health on
Local AIDS council and provided a venue for mobile health in ward 03. The environmental health is
provided by the uMkhanyakude District Municipality and officials are deployed for each local
municipality.
4.8.4.1 Accelerate prevention to reduce new HIV, TB and STI infections Reduce new
infections to less than 30 000 by 2022 through combination prevention interventions
Description Number
152 | P a g e
Client tested 12 404
Male Condoms Distributed 646 174
Female Condoms Distributed 40 457
Total Condoms Distributed 686 631
Ante – natal first visit before 20 weeks rale 155, 42%
Infants 1st PCR test positive around 10 weeks 0.67%
Child rapid after HIV test 0%
Termination of Pregnancy in facility 10-19
years
11
Infant death 1
4.8.4.2 Reduce TB increase
Description Number
TB Symptoms Child under 5 years
screened for TB facility rate
89%
TB Symptoms 5 years and older
screened for TB facility rate
89%
Male Urethritis Syndrome 413
STI treated – new episode 488
STI partner treated 21.6%
4.8.5 SAFETY & SECURITY
Safety and Security is categorized as follows:
I . PROTECTION SERVICES
Protection Services comprise of the following sections:
Traffic Management
Disaster Management
II. F IRE PROTECTION
This component has been institutionalized and according to the official organogram it is part of
Protection Services. The municipality undertakes community awareness sessions on fire hazards and
prevention. In the case of fire related disasters the municipality has access to tents and blankets from
UMkhanyakude District Municipality which are distributed based on the assessment report.
III .Community Policing Forum
Big 5 Hlabisa has prioritized issues of safety and security and has managed to establish the following
forums to address issues of safety and security, however this function need to be replicated at the ward
level.
153 | P a g e
Community Policing Forum
Community Policing Safety Committee
The following crime activities are reported
House Breaking
Stock theft
Rape
The main purpose of this forum is to mobilize the participation of community structures on issues of
crime awareness and prevention.
IV.TRAFFIC MANAGEMENT
Currently the municipality provides Traffic Law Enforcement, renewal of drivers licences, renewal of
motor vehicle license and payment of traffic fines. There is a well-established Drivers Licence Testing
Center in Hlabisa which is fully functional. There is also a project complete for Leaner Driver licensing
in Hluhluwe that is that operational. The facility for Leaners License is complete.
4.8.6 COMMUNITY DEVELOPMENT
Community development involves youth development, development of people with disabilities and
various programmes are coordinate at both the district level and at a municipal level. There are
programmes to empower the community on the issues that seeks to address social ills
4.8.7 DEVELOPMENT OF THE PEOPLE WITH DISABILITIES , ELDERLY , WOMEN
AND YOUTH
The municipality is actively involved in empowerment of people living with disabilities. Various
Interventions including facilitation of bursaries and capacity building are ongoing. The municipality
actively participates in the disability forum at the district level and has its own forum at a ward level
and municipal level and local disability forum has recently been established.
There is currently elderly forum at a municipal level, and also in the district level. The municipality
facilitates golden games at ward level and local level.
The youth development forum establishment is at an advanced stage at all ward levels and currently
being re- established at a municipal level.
154 | P a g e
Women empowerment is considered as a priority and the forum is being established at ward level to
address issues affecting women furthermore OSS is live and vibrant in a number of issues. There is
women forum at the district and the municipality actively participates. The awareness campaigns on
16 days of activism are also facilitated with all relevant sector departments.
HIV/AIDS and crime are most prevalent in the municipality. Social crime prevention will be
developed in consultation with key stakeholders. There has also been increase in drug abuse, however
communities are involved in dealing with social ills through the ward drugs action committee. It is
hoped that this intervention will contribute to reduction of crime and drug related incidents.
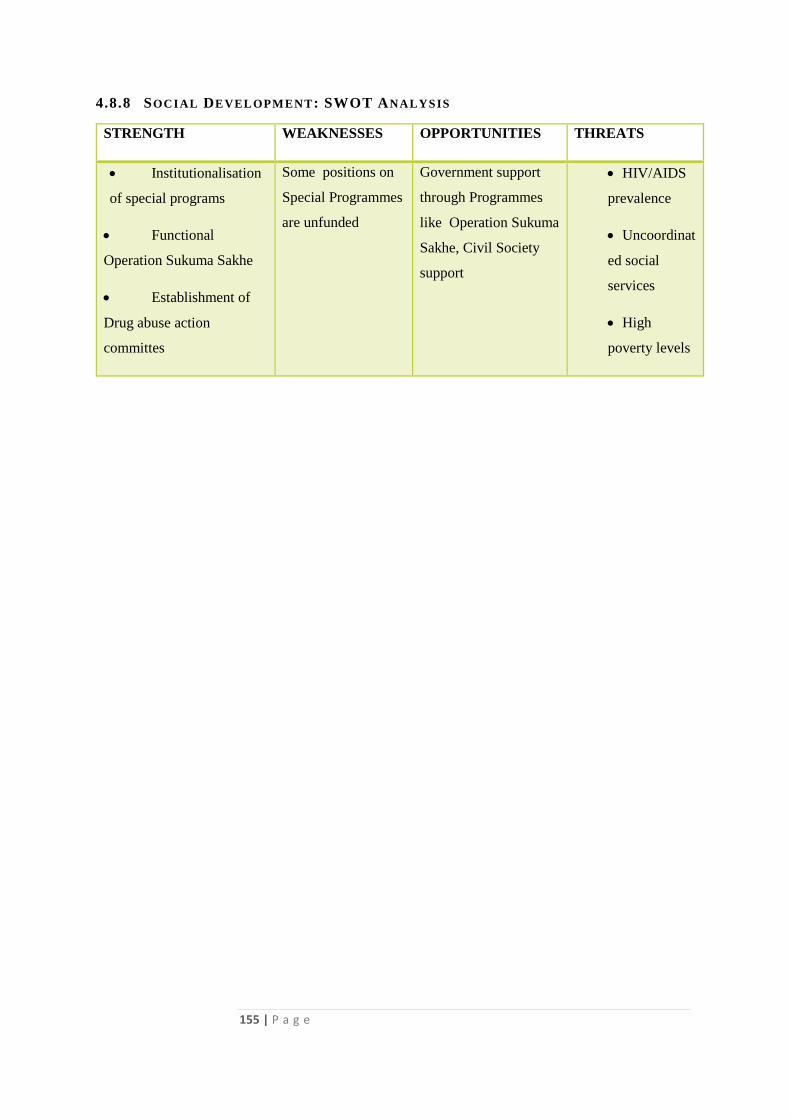
155 | P a g e
4.8.8 SOCIAL DEVELOPMENT: SWOT ANALYSIS
STRENGTH WEAKNESSES OPPORTUNITIES THREATS
Institutionalisation
of special programs
Functional
Operation Sukuma Sakhe
Establishment of
Drug abuse action
committes
Some positions on
Special Programmes
are unfunded
Government support
through Programmes
like Operation Sukuma
Sakhe, Civil Society
support
HIV/AIDS
prevalence
Uncoordinat
ed social
services
High
poverty levels
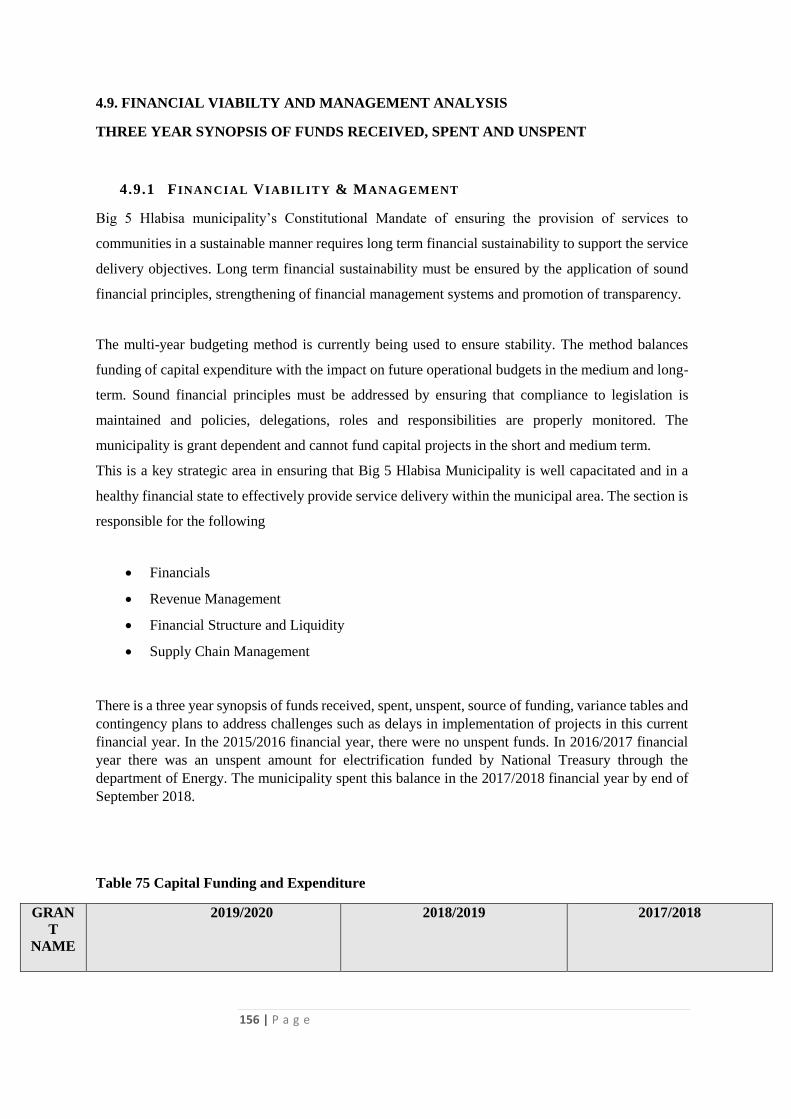
156 | P a g e
4.9. FINANCIAL VIABILTY AND MANAGEMENT ANALYSIS
THREE YEAR SYNOPSIS OF FUNDS RECEIVED, SPENT AND UNSPENT
4.9.1 F INANCIAL VIABILITY & MANAGEMENT
Big 5 Hlabisa municipality’s Constitutional Mandate of ensuring the provision of services to
communities in a sustainable manner requires long term financial sustainability to support the service
delivery objectives. Long term financial sustainability must be ensured by the application of sound
financial principles, strengthening of financial management systems and promotion of transparency.
The multi-year budgeting method is currently being used to ensure stability. The method balances
funding of capital expenditure with the impact on future operational budgets in the medium and long-
term. Sound financial principles must be addressed by ensuring that compliance to legislation is
maintained and policies, delegations, roles and responsibilities are properly monitored. The
municipality is grant dependent and cannot fund capital projects in the short and medium term.
This is a key strategic area in ensuring that Big 5 Hlabisa Municipality is well capacitated and in a
healthy financial state to effectively provide service delivery within the municipal area. The section is
responsible for the following
Financials
Revenue Management
Financial Structure and Liquidity
Supply Chain Management
There is a three year synopsis of funds received, spent, unspent, source of funding, variance tables and
contingency plans to address challenges such as delays in implementation of projects in this current
financial year. In the 2015/2016 financial year, there were no unspent funds. In 2016/2017 financial
year there was an unspent amount for electrification funded by National Treasury through the
department of Energy. The municipality spent this balance in the 2017/2018 financial year by end of
September 2018.
Table 75 Capital Funding and Expenditure
GRAN
T
NAME
2019/2020 2018/2019 2017/2018
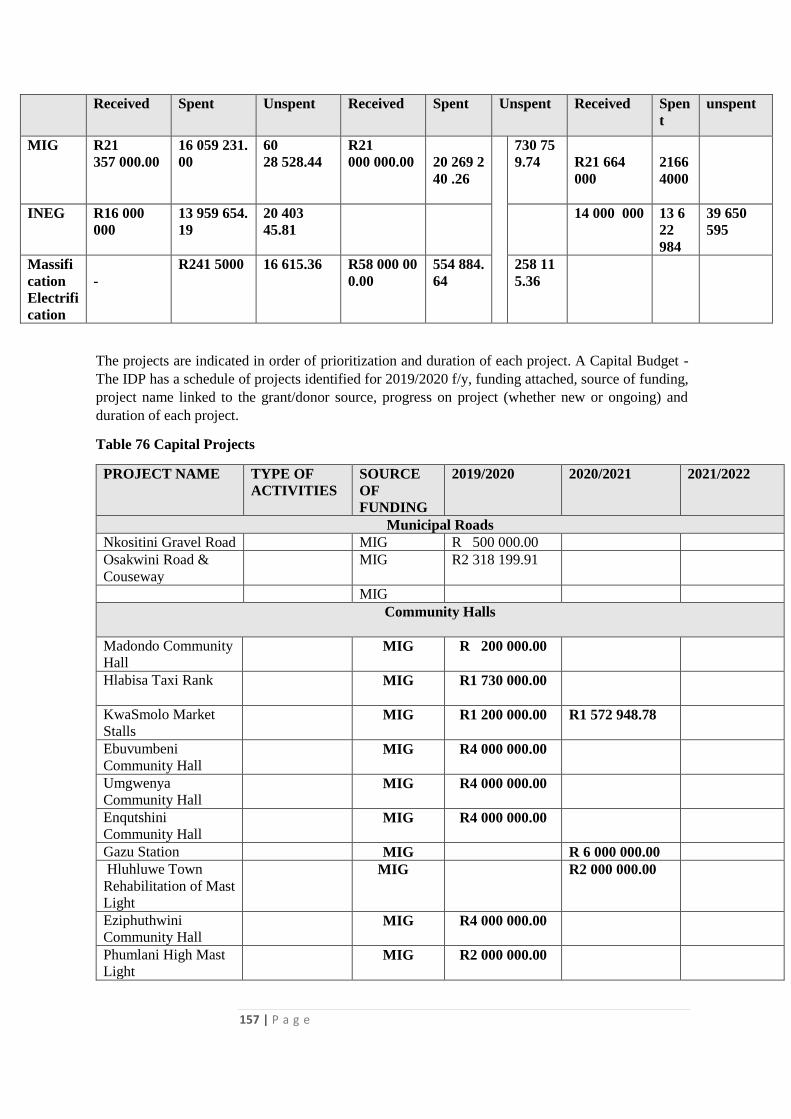
157 | P a g e
Received Spent Unspent Received Spent Unspent Received Spen
t
unspent
MIG R21
357 000.00
16 059 231.
00
60
28 528.44
R21
000 000.00
20 269 2
40 .26
730 75
9.74
R21 664
000
2166
4000
INEG R16 000
000
13 959 654.
19
20 403
45.81
14 000 000
13 6
22
984
39 650
595
Massifi
cation
Electrifi
cation
-
R241 5000 16 615.36 R58 000 00
0.00
554 884.
64
258 11
5.36
The projects are indicated in order of prioritization and duration of each project. A Capital Budget -
The IDP has a schedule of projects identified for 2019/2020 f/y, funding attached, source of funding,
project name linked to the grant/donor source, progress on project (whether new or ongoing) and
duration of each project.
Table 76 Capital Projects
PROJECT NAME TYPE OF
ACTIVITIES
SOURCE
OF
FUNDING
2019/2020 2020/2021 2021/2022
Municipal Roads
Nkositini Gravel Road MIG R 500 000.00
Osakwini Road &
Couseway
MIG R2 318 199.91
MIG
Community Halls
Madondo Community
Hall MIG R 200 000.00
Hlabisa Taxi Rank MIG R1 730 000.00
KwaSmolo Market
Stalls MIG R1 200 000.00 R1 572 948.78
Ebuvumbeni
Community Hall MIG R4 000 000.00
Umgwenya
Community Hall MIG R4 000 000.00
Enqutshini
Community Hall MIG R4 000 000.00
Gazu Station MIG R 6 000 000.00
Hluhluwe Town
Rehabilitation of Mast
Light
MIG R2 000 000.00
Eziphuthwini
Community Hall MIG R4 000 000.00
Phumlani High Mast
Light MIG R2 000 000.00
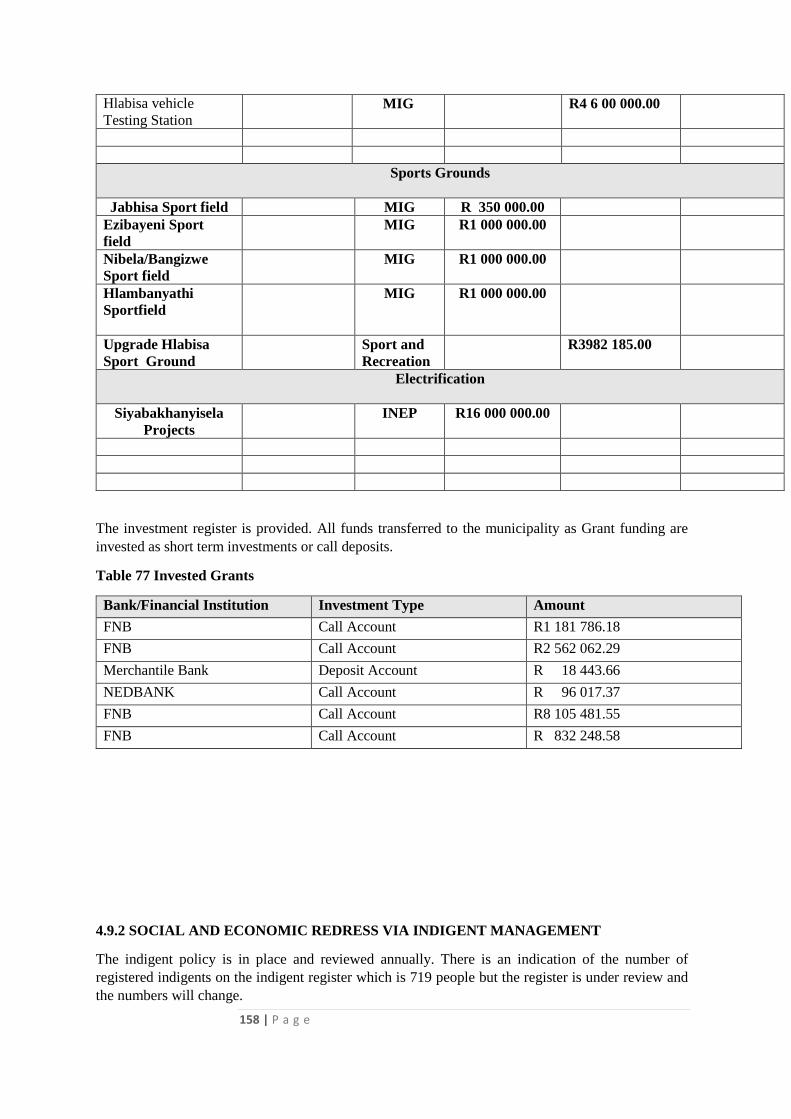
158 | P a g e
Hlabisa vehicle
Testing Station MIG R4 6 00 000.00
Sports Grounds
Jabhisa Sport field MIG R 350 000.00
Ezibayeni Sport
field
MIG R1 000 000.00
Nibela/Bangizwe
Sport field
MIG R1 000 000.00
Hlambanyathi
Sportfield
MIG R1 000 000.00
Upgrade Hlabisa
Sport Ground
Sport and
Recreation
R3982 185.00
Electrification
Siyabakhanyisela
Projects
INEP R16 000 000.00
The investment register is provided. All funds transferred to the municipality as Grant funding are
invested as short term investments or call deposits.
Table 77 Invested Grants
Bank/Financial Institution Investment Type Amount
FNB Call Account R1 181 786.18
FNB Call Account R2 562 062.29
Merchantile Bank Deposit Account R 18 443.66
NEDBANK Call Account R 96 017.37
FNB Call Account R8 105 481.55
FNB Call Account R 832 248.58
4.9.2 SOCIAL AND ECONOMIC REDRESS VIA INDIGENT MANAGEMENT
The indigent policy is in place and reviewed annually. There is an indication of the number of
registered indigents on the indigent register which is 719 people but the register is under review and
the numbers will change.
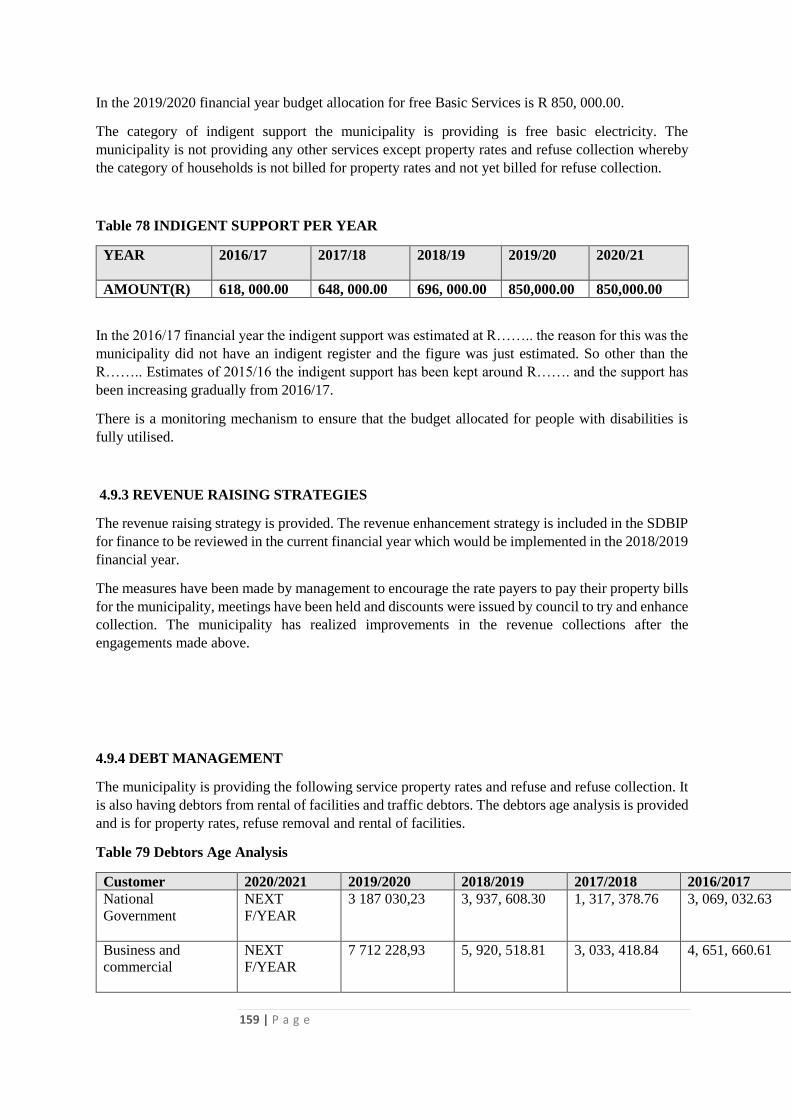
159 | P a g e
In the 2019/2020 financial year budget allocation for free Basic Services is R 850, 000.00.
The category of indigent support the municipality is providing is free basic electricity. The
municipality is not providing any other services except property rates and refuse collection whereby
the category of households is not billed for property rates and not yet billed for refuse collection.
Table 78 INDIGENT SUPPORT PER YEAR
YEAR 2016/17 2017/18 2018/19
2019/20 2020/21
AMOUNT(R) 618, 000.00 648, 000.00 696, 000.00 850,000.00 850,000.00
In the 2016/17 financial year the indigent support was estimated at R…….. the reason for this was the
municipality did not have an indigent register and the figure was just estimated. So other than the
R…….. Estimates of 2015/16 the indigent support has been kept around R……. and the support has
been increasing gradually from 2016/17.
There is a monitoring mechanism to ensure that the budget allocated for people with disabilities is
fully utilised.
4.9.3 REVENUE RAISING STRATEGIES
The revenue raising strategy is provided. The revenue enhancement strategy is included in the SDBIP
for finance to be reviewed in the current financial year which would be implemented in the 2018/2019
financial year.
The measures have been made by management to encourage the rate payers to pay their property bills
for the municipality, meetings have been held and discounts were issued by council to try and enhance
collection. The municipality has realized improvements in the revenue collections after the
engagements made above.
4.9.4 DEBT MANAGEMENT
The municipality is providing the following service property rates and refuse and refuse collection. It
is also having debtors from rental of facilities and traffic debtors. The debtors age analysis is provided
and is for property rates, refuse removal and rental of facilities.
Table 79 Debtors Age Analysis
Customer 2020/2021 2019/2020 2018/2019 2017/2018 2016/2017
National
Government
NEXT
F/YEAR
3 187 030,23
3, 937, 608.30
1, 317, 378.76 3, 069, 032.63
Business and
commercial
NEXT
F/YEAR
7 712 228,93 5, 920, 518.81 3, 033, 418.84 4, 651, 660.61
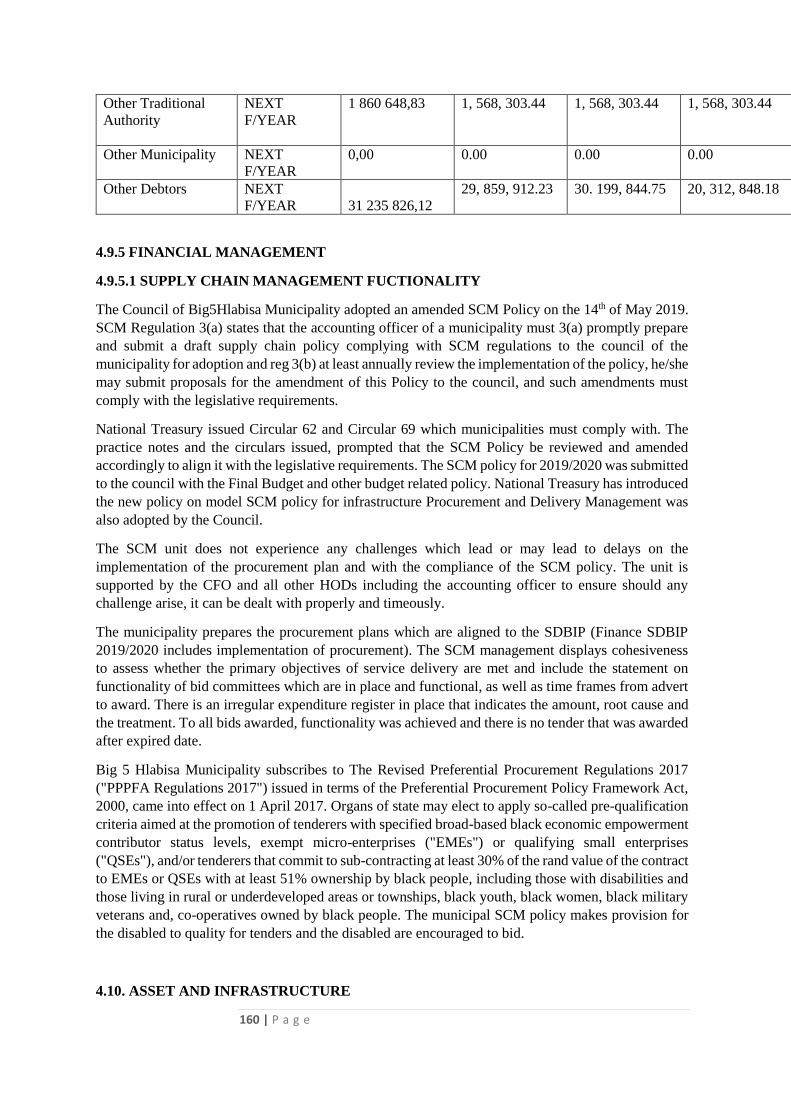
160 | P a g e
Other Traditional
Authority
NEXT
F/YEAR
1 860 648,83
1, 568, 303.44
1, 568, 303.44 1, 568, 303.44
Other Municipality
NEXT
F/YEAR
0,00
0.00 0.00 0.00
Other Debtors
NEXT
F/YEAR
31 235 826,12
29, 859, 912.23 30. 199, 844.75 20, 312, 848.18
4.9.5 FINANCIAL MANAGEMENT
4.9.5.1 SUPPLY CHAIN MANAGEMENT FUCTIONALITY
The Council of Big5Hlabisa Municipality adopted an amended SCM Policy on the 14th of May 2019.
SCM Regulation 3(a) states that the accounting officer of a municipality must 3(a) promptly prepare
and submit a draft supply chain policy complying with SCM regulations to the council of the
municipality for adoption and reg 3(b) at least annually review the implementation of the policy, he/she
may submit proposals for the amendment of this Policy to the council, and such amendments must
comply with the legislative requirements.
National Treasury issued Circular 62 and Circular 69 which municipalities must comply with. The
practice notes and the circulars issued, prompted that the SCM Policy be reviewed and amended
accordingly to align it with the legislative requirements. The SCM policy for 2019/2020 was submitted
to the council with the Final Budget and other budget related policy. National Treasury has introduced
the new policy on model SCM policy for infrastructure Procurement and Delivery Management was
also adopted by the Council.
The SCM unit does not experience any challenges which lead or may lead to delays on the
implementation of the procurement plan and with the compliance of the SCM policy. The unit is
supported by the CFO and all other HODs including the accounting officer to ensure should any
challenge arise, it can be dealt with properly and timeously.
The municipality prepares the procurement plans which are aligned to the SDBIP (Finance SDBIP
2019/2020 includes implementation of procurement). The SCM management displays cohesiveness
to assess whether the primary objectives of service delivery are met and include the statement on
functionality of bid committees which are in place and functional, as well as time frames from advert
to award. There is an irregular expenditure register in place that indicates the amount, root cause and
the treatment. To all bids awarded, functionality was achieved and there is no tender that was awarded
after expired date.
Big 5 Hlabisa Municipality subscribes to The Revised Preferential Procurement Regulations 2017
("PPPFA Regulations 2017") issued in terms of the Preferential Procurement Policy Framework Act,
2000, came into effect on 1 April 2017. Organs of state may elect to apply so-called pre-qualification
criteria aimed at the promotion of tenderers with specified broad-based black economic empowerment
contributor status levels, exempt micro-enterprises ("EMEs") or qualifying small enterprises
("QSEs"), and/or tenderers that commit to sub-contracting at least 30% of the rand value of the contract
to EMEs or QSEs with at least 51% ownership by black people, including those with disabilities and
those living in rural or underdeveloped areas or townships, black youth, black women, black military
veterans and, co-operatives owned by black people. The municipal SCM policy makes provision for
the disabled to quality for tenders and the disabled are encouraged to bid.
4.10. ASSET AND INFRASTRUCTURE
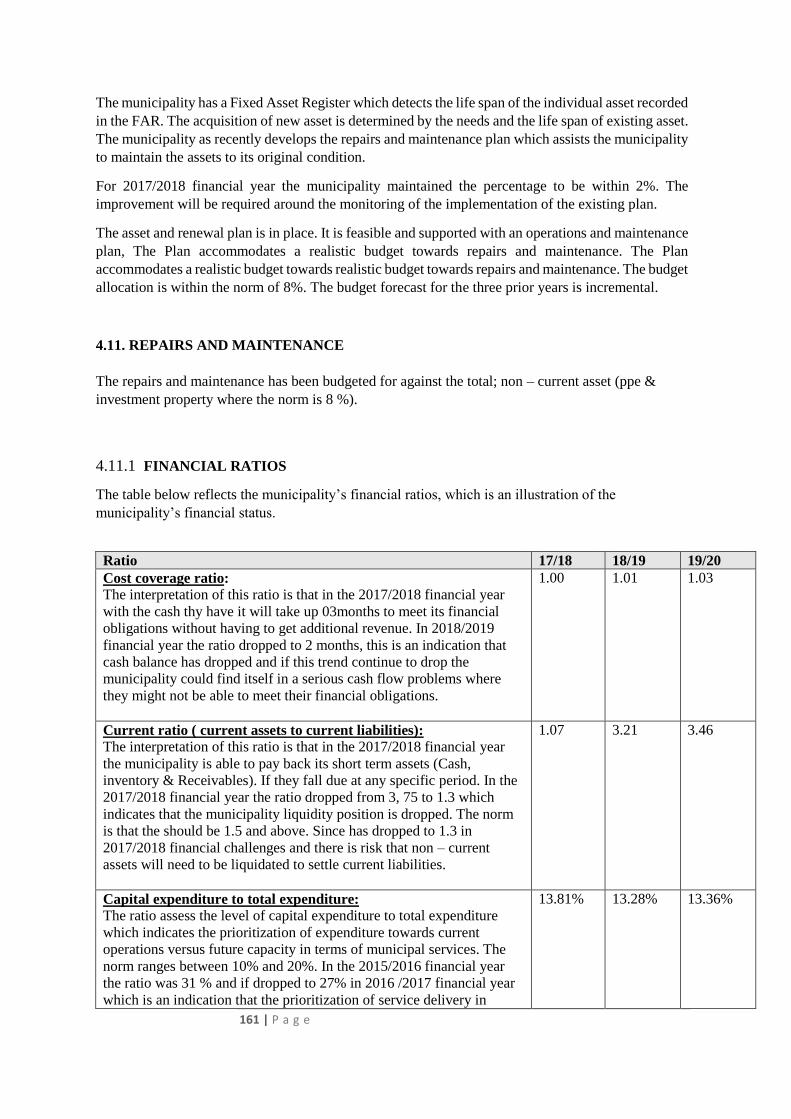
161 | P a g e
The municipality has a Fixed Asset Register which detects the life span of the individual asset recorded
in the FAR. The acquisition of new asset is determined by the needs and the life span of existing asset.
The municipality as recently develops the repairs and maintenance plan which assists the municipality
to maintain the assets to its original condition.
For 2017/2018 financial year the municipality maintained the percentage to be within 2%. The
improvement will be required around the monitoring of the implementation of the existing plan.
The asset and renewal plan is in place. It is feasible and supported with an operations and maintenance
plan, The Plan accommodates a realistic budget towards repairs and maintenance. The Plan
accommodates a realistic budget towards realistic budget towards repairs and maintenance. The budget
allocation is within the norm of 8%. The budget forecast for the three prior years is incremental.
4.11. REPAIRS AND MAINTENANCE
The repairs and maintenance has been budgeted for against the total; non – current asset (ppe &
investment property where the norm is 8 %).
4.11.1 FINANCIAL RATIOS
The table below reflects the municipality’s financial ratios, which is an illustration of the
municipality’s financial status.
Ratio 17/18 18/19 19/20
Cost coverage ratio:
The interpretation of this ratio is that in the 2017/2018 financial year
with the cash thy have it will take up 03months to meet its financial
obligations without having to get additional revenue. In 2018/2019
financial year the ratio dropped to 2 months, this is an indication that
cash balance has dropped and if this trend continue to drop the
municipality could find itself in a serious cash flow problems where
they might not be able to meet their financial obligations.
1.00 1.01 1.03
Current ratio ( current assets to current liabilities):
The interpretation of this ratio is that in the 2017/2018 financial year
the municipality is able to pay back its short term assets (Cash,
inventory & Receivables). If they fall due at any specific period. In the
2017/2018 financial year the ratio dropped from 3, 75 to 1.3 which
indicates that the municipality liquidity position is dropped. The norm
is that the should be 1.5 and above. Since has dropped to 1.3 in
2017/2018 financial challenges and there is risk that non – current
assets will need to be liquidated to settle current liabilities.
1.07 3.21 3.46
Capital expenditure to total expenditure:
The ratio assess the level of capital expenditure to total expenditure
which indicates the prioritization of expenditure towards current
operations versus future capacity in terms of municipal services. The
norm ranges between 10% and 20%. In the 2015/2016 financial year
the ratio was 31 % and if dropped to 27% in 2016 /2017 financial year
which is an indication that the prioritization of service delivery in
13.81% 13.28% 13.36%
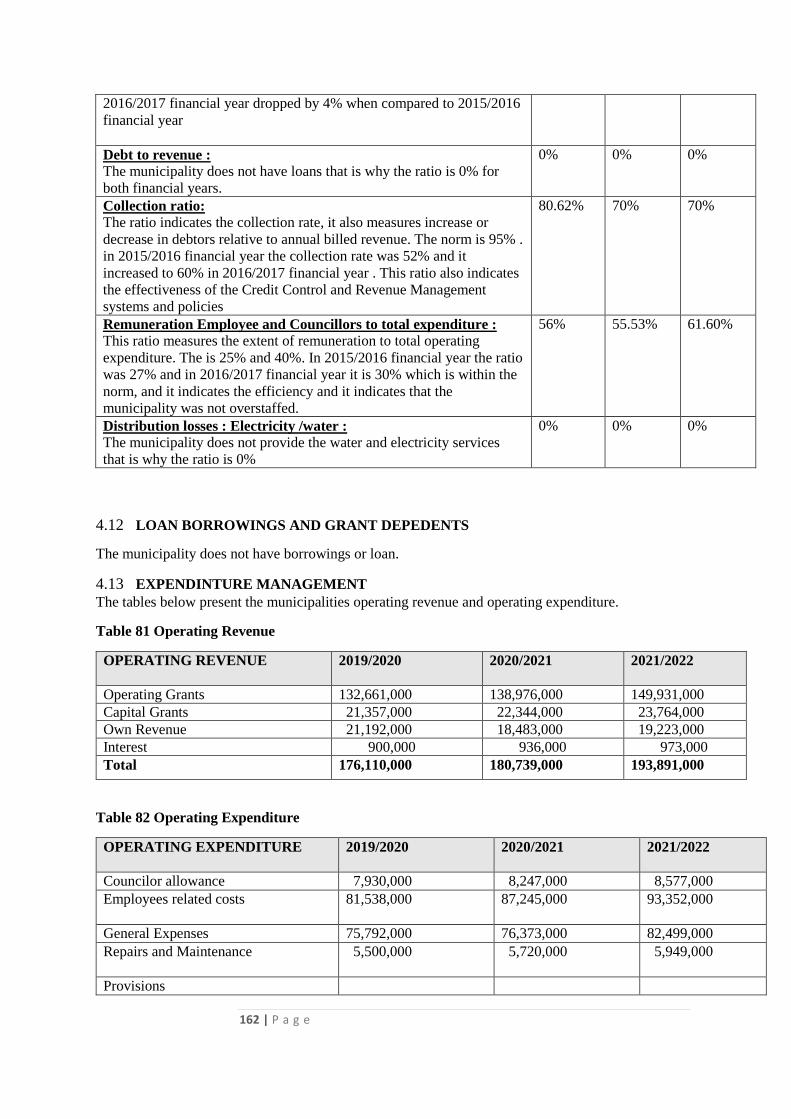
162 | P a g e
2016/2017 financial year dropped by 4% when compared to 2015/2016
financial year
Debt to revenue :
The municipality does not have loans that is why the ratio is 0% for
both financial years.
0% 0% 0%
Collection ratio:
The ratio indicates the collection rate, it also measures increase or
decrease in debtors relative to annual billed revenue. The norm is 95% .
in 2015/2016 financial year the collection rate was 52% and it
increased to 60% in 2016/2017 financial year . This ratio also indicates
the effectiveness of the Credit Control and Revenue Management
systems and policies
80.62% 70% 70%
Remuneration Employee and Councillors to total expenditure :
This ratio measures the extent of remuneration to total operating
expenditure. The is 25% and 40%. In 2015/2016 financial year the ratio
was 27% and in 2016/2017 financial year it is 30% which is within the
norm, and it indicates the efficiency and it indicates that the
municipality was not overstaffed.
56% 55.53% 61.60%
Distribution losses : Electricity /water :
The municipality does not provide the water and electricity services
that is why the ratio is 0%
0% 0% 0%
4.12 LOAN BORROWINGS AND GRANT DEPEDENTS
The municipality does not have borrowings or loan.
4.13 EXPENDINTURE MANAGEMENT
The tables below present the municipalities operating revenue and operating expenditure.
Table 81 Operating Revenue
OPERATING REVENUE
2019/2020 2020/2021 2021/2022
Operating Grants 132,661,000 138,976,000 149,931,000
Capital Grants 21,357,000 22,344,000 23,764,000
Own Revenue 21,192,000 18,483,000 19,223,000
Interest 900,000 936,000 973,000
Total 176,110,000 180,739,000 193,891,000
Table 82 Operating Expenditure
OPERATING EXPENDITURE
2019/2020 2020/2021 2021/2022
Councilor allowance 7,930,000 8,247,000 8,577,000
Employees related costs
81,538,000 87,245,000 93,352,000
General Expenses 75,792,000 76,373,000 82,499,000
Repairs and Maintenance
5,500,000 5,720,000 5,949,000
Provisions
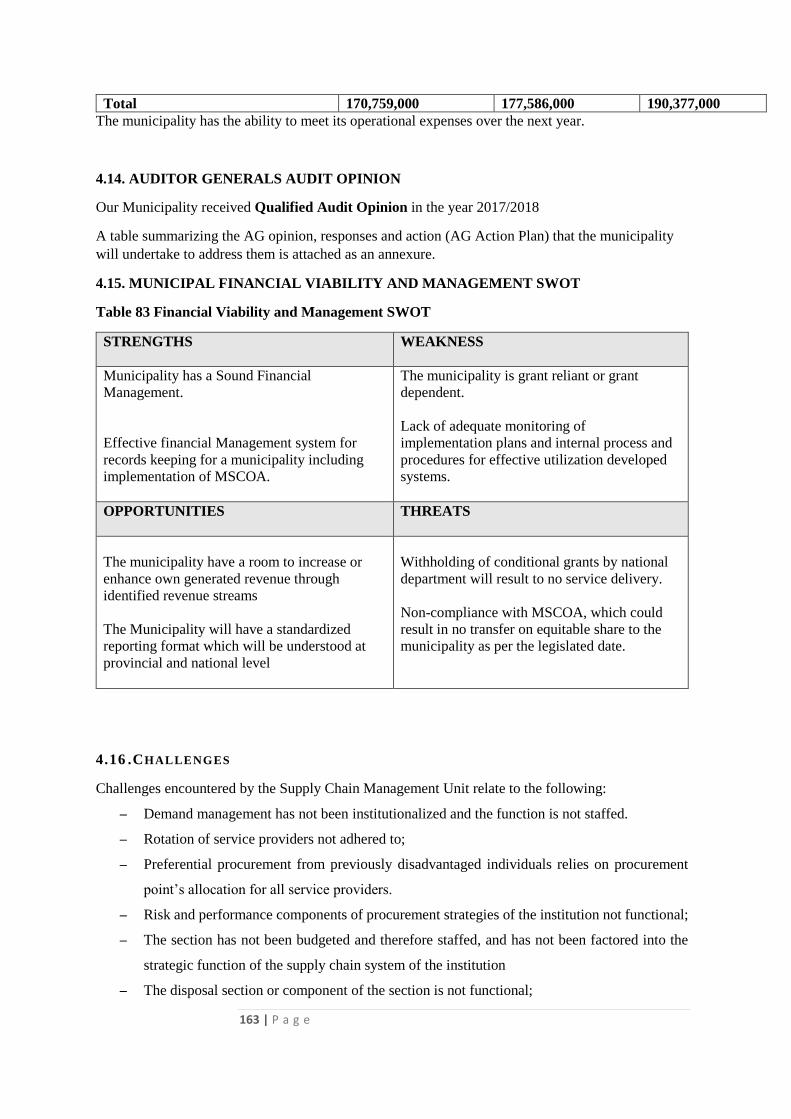
163 | P a g e
Total 170,759,000 177,586,000 190,377,000
The municipality has the ability to meet its operational expenses over the next year.
4.14. AUDITOR GENERALS AUDIT OPINION
Our Municipality received Qualified Audit Opinion in the year 2017/2018
A table summarizing the AG opinion, responses and action (AG Action Plan) that the municipality
will undertake to address them is attached as an annexure.
4.15. MUNICIPAL FINANCIAL VIABILITY AND MANAGEMENT SWOT
Table 83 Financial Viability and Management SWOT
STRENGTHS
WEAKNESS
Municipality has a Sound Financial
Management.
Effective financial Management system for
records keeping for a municipality including
implementation of MSCOA.
The municipality is grant reliant or grant
dependent.
Lack of adequate monitoring of
implementation plans and internal process and
procedures for effective utilization developed
systems.
OPPORTUNITIES
THREATS
The municipality have a room to increase or
enhance own generated revenue through
identified revenue streams
The Municipality will have a standardized
reporting format which will be understood at
provincial and national level
Withholding of conditional grants by national
department will result to no service delivery.
Non-compliance with MSCOA, which could
result in no transfer on equitable share to the
municipality as per the legislated date.
4.16 .CHALLENGES
Challenges encountered by the Supply Chain Management Unit relate to the following:
– Demand management has not been institutionalized and the function is not staffed.
– Rotation of service providers not adhered to;
– Preferential procurement from previously disadvantaged individuals relies on procurement
point’s allocation for all service providers.
– Risk and performance components of procurement strategies of the institution not functional;
– The section has not been budgeted and therefore staffed, and has not been factored into the
strategic function of the supply chain system of the institution
– The disposal section or component of the section is not functional;
164 | P a g e
– There is also no system in place to detect service providers in the service of the State, hence
Auditor General does have the system and negatively affects the audit opinion.
The above analysis gives an ideal situation which will allow the output and outcomes of the Supply
Chain System of the municipality to be realized as derived from the applicable legislations and policy,
i.e. BCM SCM policy, MFMA, BBBEE and PPPFA} aimed at not only procuring services and goods
of the municipality as per the IDP strategic objectives and within the available budget and period, but
also to skew the procurement spent in a manner that will ensure a Supply Chain System that assists in
job Creation in the region, beneficiation of vulnerable groups (women, youth, disabled and historically
disadvantaged groups), promotion of skills and capacitating small businesses, circulation of the rand
spent within the municipal area to boost and encourage the economy within the region.
4.9 GOOD GOVERNANCE AND PUBLIC PARTICIPATION
165 | P a g e
4.9.2 GOOD GOVERNANCE ANALYSIS
The Municipality values the participation of its residents in governance. To this end, the Municipality
has established Ward Committees in all 13 wards. Ward Committees provide an important vehicle for
the Municipality to consult with its communities. In addition to Ward Committees, the Municipality
has initiated other mechanisms of deepening and broadening public participation. The residents are
also engaged through their participation in sectorial and other forums. The Municipality’s public
participation is occasionally reinforced by District izimbizo particularly IDP/Budget consultative
meetings and outreach programmes. The Municipality are currently reviewing our public participation
strategy so as to reflect an integrated approach.
The Anti – corruption strategy is in place and the Municipality has not experienced incidents of fraud
and corruption. As one of its priority areas, the Municipality recognises the importance of the
previously marginalised sectors, including youth, women, children, aged and people with disabilities.
One of the key challenges facing the Municipality with regard to sector development is the integration
of sector activities with the municipal planning systems.
4.9.3 NATIONAL AND PROVINCIAL PROGRAMMES
1. OPERATION SUKUMA SAKHE (OSS)
The Municipality embraces Sukuma Sakhe as platform to address issues at a ward level. It is
institutionalized within the municipality and chaired by the Mayor. The war rooms were fully
established in all wards and chaired by the ward councilors. Sectorial representation has improved.
The municipality will further strengthen institutional arrangement of OSS under Community Services
Department. This programme serves as a vehicle between all sectors in development planning and
wellbeing of the communities. Briefly issues ranging from poverty alleviation and social ills are
addressed by the municipality and spheres of government. The municipality also participates in the
annual Public Service Week as part of OSS intervention.
2. PROGRESS MADE WITH THE ROLL OUT OF OPERATION SUKUMA SAKHE
CONSOLIDATION MUNICIPAL AREA OF JURISDICTION
The OSS program was rolled out in all 13 wards as from the project launch during the Service Deliver
Week launched by the Premier in 2018.
The Local Task Team resolved to visit all wards for the purpose of electing Ward Task Teams to meet
on regular basis so that the profiling of all families with cases to be referred to Sector Departments is
done accordingly at a ward level. All WTT were established in all ward and the Municipality allocated
166 | P a g e
a Manager in each ward to offer support and resources. These WTT meets monthly. Even though there
are challenges caused by other department not attending such WTT meeting but the profiling has
happened and cases were referred to various department for interventions.
Ward 4 has been entered to the Premiers Services Excellence Awards because of the activities and
effective interventions they have done in their area of operation. The Local Task Team meets every
quarter to listen to reports from Ward Task Teams so that issues beyond local control will be elevated
to the District Task Team for their intervention.
3. INTERGOVERNMENTAL RELATIONS (IGR)
Big 5 Hlabisa Local Municipality is responsible for facilitating inter-governmental relations within its
area of jurisdiction. In line with the Intergovernmental Relations Framework Act, the municipality has
taken upon itself to improve intergovernmental engagements to ensure that proper intergovernmental
planning guide public, private and donor investment in the municipality.
Intergovernmental Relations were revived and some were established in 2013, with the purpose of
addressing issues of common interest within the district and beyond. The functionality has however
not been satisfactory during 2018. The IGR structures are coordinated at a District Level, however we
as the local municipality monitor the attendance and collect the resolutions from different structures
for implementation.
The District Municipality send the calendar on meetings for such structures and there are as follows
4.9.4 DISTRICT IGR STRUCTURES
A. DISTRICT MAYOR’S FORUM
The Forum consists of all the Mayors within the Family of Municipalities and chaired by the District
Mayor. Issues of common alignment and common interest are deliberated upon in this forum
B. MUNICIPAL MANAGERS FORUM
The Forum consist of all Municipal Managers within the Family of Municipalities and forum is chaired
by District Municipal Manager “a key forum for strategic alignment, co-ordination and integration”
that serves as an inter-governmental structure where Municipal Managers in the district meet and
deliberate on issues of common interest and integration.
C. CHIEF F INANCIAL OFFICERS FORUM
The Forum consists of all Chief Financial Officers within the Family of Municipalities. The forum
mainly deliberates on matters of financial management and sustainability with the family. Best
practices are also shared. This forum is chaired by the CFO from uMkhanyakude District Municipality
167 | P a g e
D. TECHNICAL FORUM
The Forum consists of all Technical Directors within the Family of Municipalities and chaired by
Municipal Manager from Jozini Municipal
E. PLANNING DEVELOPMENT FORUM
The Forum consist of all IDP, PMS, LED and Development Planning, Environmental Planning and
Management within the Family of Municipalities
F. COMMUNITY FORUM
The Forum consist of all Community and Social Services within the Family of Municipalities
G. COMMUNICATION (DCF)
The Forum consist of all Communication representatives within the Family of Municipalities.
H. CORPORATE SERVICES FORUM
The Forum consists of all Corporate Services Directors representatives within the Family of
Municipalities and is chaired by the Director Corporate Services from uMkhanyakude District
Municipality.
I.PROVINCIAL COMMUNICATION FORUM
The Forum consist of all Communication representatives within the Province.
J.MUNIMEC
The Forum consists of all Municipal managers and the Mayors within the Province and chaired by the
Cogta MEC.
I. WASTE MANAGEMENT FORUM
A district- wide waste management forum was established. The issues of waste management within
uMkhanyakude family are further deliberated upon to ensure environmental sustainability and that
development of the future generation is not compromised. The forum comprises of the following
stakeholders:
UMkhanyakude District
Department of Agriculture & Environmental Affairs
Mtubatuba Municipality
Jozini Municipality
Big 5 Hlabisa Municipality
International Labour Organization
168 | P a g e
J. DEVELOPMENT PLANNING SHARED SERVICES (DPSS)
The Development Planning Shared Service is in place and has been functional since its inception in.
The following issues for uMkhanyakude Family are addressed by DPSS:
Spatial Planning
Environmental Management
Development Administration
Geographic Information System
Strategic Planning(IDP)
Performance Management System
K. DISTRICT TECHNICAL ADVISOR COMMITTEE (DTAC) ON PMS
The District Technical Advisor Committee is also in place. It comprises of all IDP Managers, PMS
Managers, GTA PMS Specialist of uMkhanyakude family. The issues of performance management
are deliberated upon to promote and strengthen performance management culture within the family
municipality. Issues of capacity to cascade PMS to all levels have not been adequately addressed as
some municipality do not have enough staff to execute the task adequately. The committee meets
quarterly.
4.9.5 LOCAL MUNICIPAL STRUCTURES
The following governance structures are in existence for proper coordination of the development
planning issues. The IDP process plan is in place and guides and informs development from planning
to drafting of the document and its implementation as well as monitoring and evaluation.
1. IDP STEERING COMMITTEE (IDP SC)
The IDP SC is in place and functional and there has been a tremendous improvement since 2018/2019.
The Directorates are all participative in the IDP process and the municipality would further enrol staff
at levels for a better improved participation, though the subject has become standard agenda in some
departments
2. IDP REPRESENTATIVE FORUM
The IDP RF is in place and serves the purpose to deliberate on development strategic agenda for the
Municipality. The stakeholder participation is still a challenge. The Representation in the forum still
needs to be strengthened. The issue is raised on IDP meetings at levels of Government but to date no
improvements have been realised, but it is hope that it will be collectively resolved in the future.
3. COUNCIL
169 | P a g e
The Big 5-Hlabisa Council is responsible the strategic direction in line with the Municipal vision and
approves the IDP upon its completion. The Municipality is keeping a good relationship with the
Traditional leaders. Traditional leaders usually does not sit to the Municipal council meetings. The
Municipality has an arrangement of meeting them at traditional leaders forum that is coordinated by
the Municipality with an aim of updating them regarding service delivery.
4. MUNICIPAL PUBLIC ACCOUNTS COMMITTEE (MPAC)
The MPAC is in existence in terms of chapter 12 of the Municipal Finance Management Act section
129 (MFMA). The committee is functional and its oversight role is improving. Capacity building is
ongoing to further enhance its functionality
5. AUDIT COMMITTEE
Big 5 and Hlabisa both have audit committees in terms of chapter 14, section 166 of the Municipal
Finance Management Act No. 56 (MFMA). The current audit committees are functional since the term
of the audit committees end 30 June however transitional arrangements are on –going to ensure
continuity, therefore.
4.9.6 STATUS OF MUNICIPAL POLICIES AND SECTOR PLANS
Policy Development was undertaken by Big 5 Hlabisa as one of the transitional measures to ensure
continuity. The Corporate Service Department has been strengthened to ensure that policies are
developed and reviewed annually. The municipality has capacity to develop and workshop policies.
This will be further improved during 2019/20 to ensure that staff and council are in same understanding
of policies and procedures.
The Municipality cannot operate in the absence of Bylaws. Some of the bylaws are in place, but there
is still a gap due to financial constrain some of the Bylaws were developed but could not be gazette.
Further information on the status of municipal by-laws is articulated in table below. The Municipality
will source funding from potential funders and it has been included in the Implementation plan. The
table will be updated and be detailed in the final document
4.9.7 MUNICIPAL RISK MANAGEMENT
Risk Management is considered as a crucial aspect at Big 5-Hlabisa to implement and maintain
effective, efficient and transparent systems of risk management and control. The Municipality receives
support from Provincial Treasury to conduct risk assessment and the workshop was conducted in July
2018. The municipality was able to get assistance in identification of risk and come up with strategies
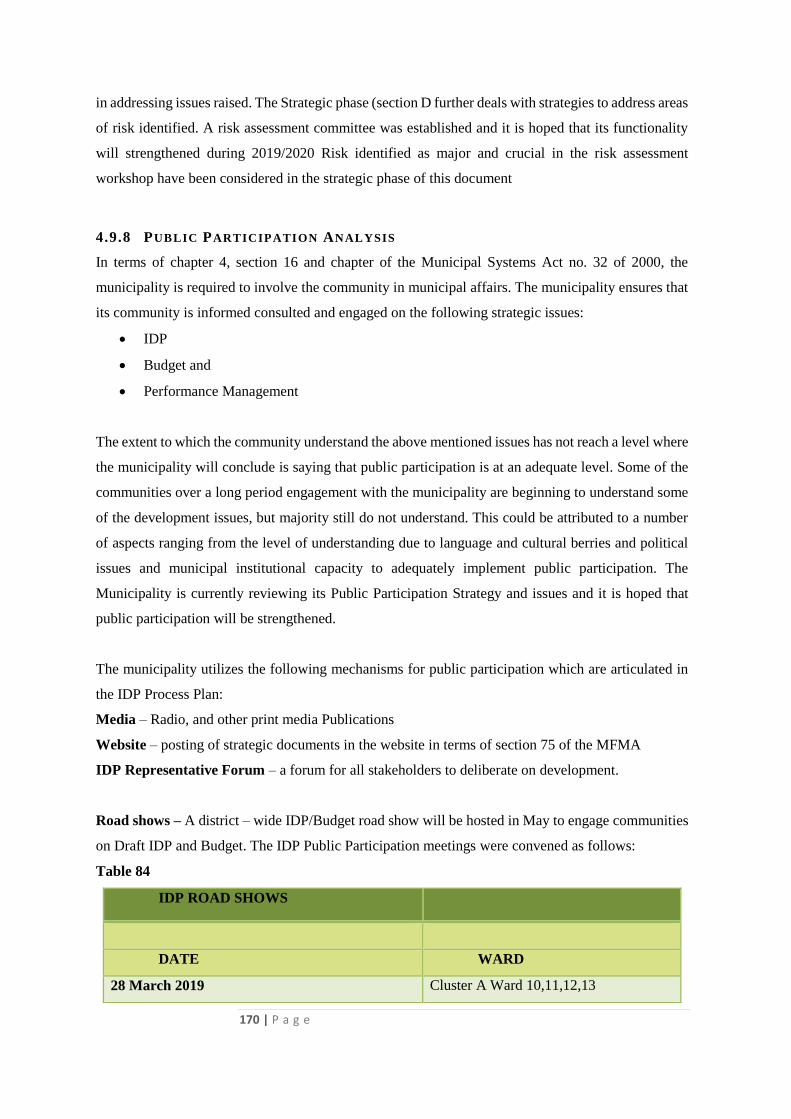
170 | P a g e
in addressing issues raised. The Strategic phase (section D further deals with strategies to address areas
of risk identified. A risk assessment committee was established and it is hoped that its functionality
will strengthened during 2019/2020 Risk identified as major and crucial in the risk assessment
workshop have been considered in the strategic phase of this document
4.9.8 PUBLIC PARTICIPATION ANALYSIS
In terms of chapter 4, section 16 and chapter of the Municipal Systems Act no. 32 of 2000, the
municipality is required to involve the community in municipal affairs. The municipality ensures that
its community is informed consulted and engaged on the following strategic issues:
IDP
Budget and
Performance Management
The extent to which the community understand the above mentioned issues has not reach a level where
the municipality will conclude is saying that public participation is at an adequate level. Some of the
communities over a long period engagement with the municipality are beginning to understand some
of the development issues, but majority still do not understand. This could be attributed to a number
of aspects ranging from the level of understanding due to language and cultural berries and political
issues and municipal institutional capacity to adequately implement public participation. The
Municipality is currently reviewing its Public Participation Strategy and issues and it is hoped that
public participation will be strengthened.
The municipality utilizes the following mechanisms for public participation which are articulated in
the IDP Process Plan:
Media – Radio, and other print media Publications
Website – posting of strategic documents in the website in terms of section 75 of the MFMA
IDP Representative Forum – a forum for all stakeholders to deliberate on development.
Road shows – A district – wide IDP/Budget road show will be hosted in May to engage communities
on Draft IDP and Budget. The IDP Public Participation meetings were convened as follows:
Table 84
IDP ROAD SHOWS
DATE WARD
28 March 2019 Cluster A Ward 10,11,12,13
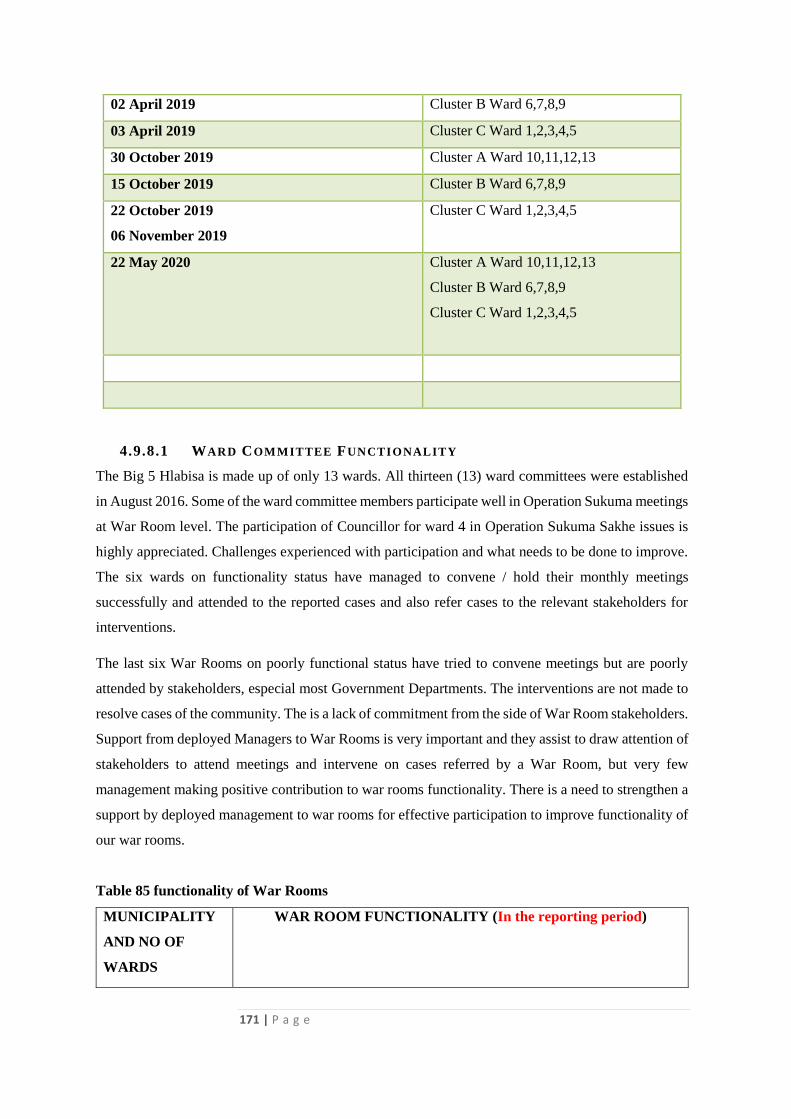
171 | P a g e
4.9.8.1 WARD COMMITTEE FUNCTIONALITY
The Big 5 Hlabisa is made up of only 13 wards. All thirteen (13) ward committees were established
in August 2016. Some of the ward committee members participate well in Operation Sukuma meetings
at War Room level. The participation of Councillor for ward 4 in Operation Sukuma Sakhe issues is
highly appreciated. Challenges experienced with participation and what needs to be done to improve.
The six wards on functionality status have managed to convene / hold their monthly meetings
successfully and attended to the reported cases and also refer cases to the relevant stakeholders for
interventions.
The last six War Rooms on poorly functional status have tried to convene meetings but are poorly
attended by stakeholders, especial most Government Departments. The interventions are not made to
resolve cases of the community. The is a lack of commitment from the side of War Room stakeholders.
Support from deployed Managers to War Rooms is very important and they assist to draw attention of
stakeholders to attend meetings and intervene on cases referred by a War Room, but very few
management making positive contribution to war rooms functionality. There is a need to strengthen a
support by deployed management to war rooms for effective participation to improve functionality of
our war rooms.
Table 85 functionality of War Rooms
MUNICIPALITY
AND NO OF
WARDS
WAR ROOM FUNCTIONALITY (In the reporting period)
02 April 2019 Cluster B Ward 6,7,8,9
03 April 2019 Cluster C Ward 1,2,3,4,5
30 October 2019 Cluster A Ward 10,11,12,13
15 October 2019 Cluster B Ward 6,7,8,9
22 October 2019
06 November 2019
Cluster C Ward 1,2,3,4,5
22 May 2020 Cluster A Ward 10,11,12,13
Cluster B Ward 6,7,8,9
Cluster C Ward 1,2,3,4,5
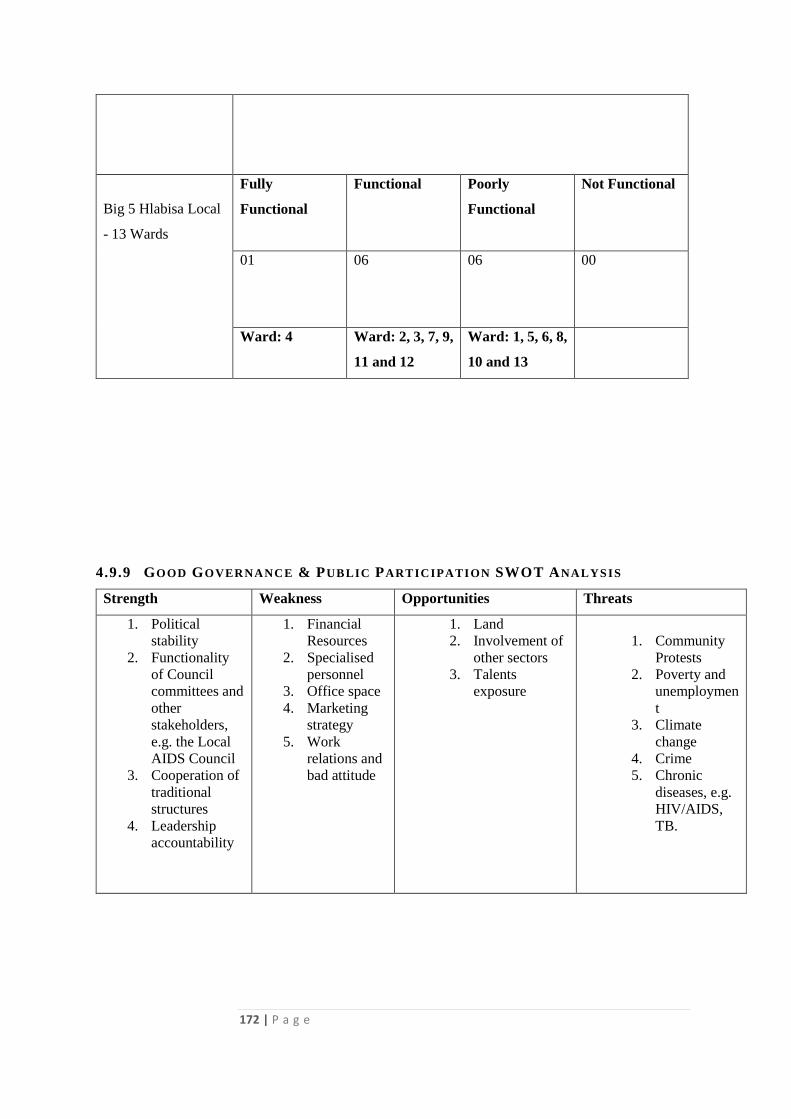
172 | P a g e
Big 5 Hlabisa Local
- 13 Wards
Fully
Functional
Functional Poorly
Functional
Not Functional
01
06 06 00
Ward: 4 Ward: 2, 3, 7, 9,
11 and 12
Ward: 1, 5, 6, 8,
10 and 13
4.9.9 GOOD GOVERNANCE & PUBLIC PARTICIPATION SWOT ANALYSIS
Strength Weakness Opportunities Threats
1. Political
stability
2. Functionality
of Council
committees and
other
stakeholders,
e.g. the Local
AIDS Council
3. Cooperation of
traditional
structures
4. Leadership
accountability
1. Financial
Resources
2. Specialised
personnel
3. Office space
4. Marketing
strategy
5. Work
relations and
bad attitude
1. Land
2. Involvement of
other sectors
3. Talents
exposure
1. Community
Protests
2. Poverty and
unemploymen
t
3. Climate
change
4. Crime
5. Chronic
diseases, e.g.
HIV/AIDS,
TB.
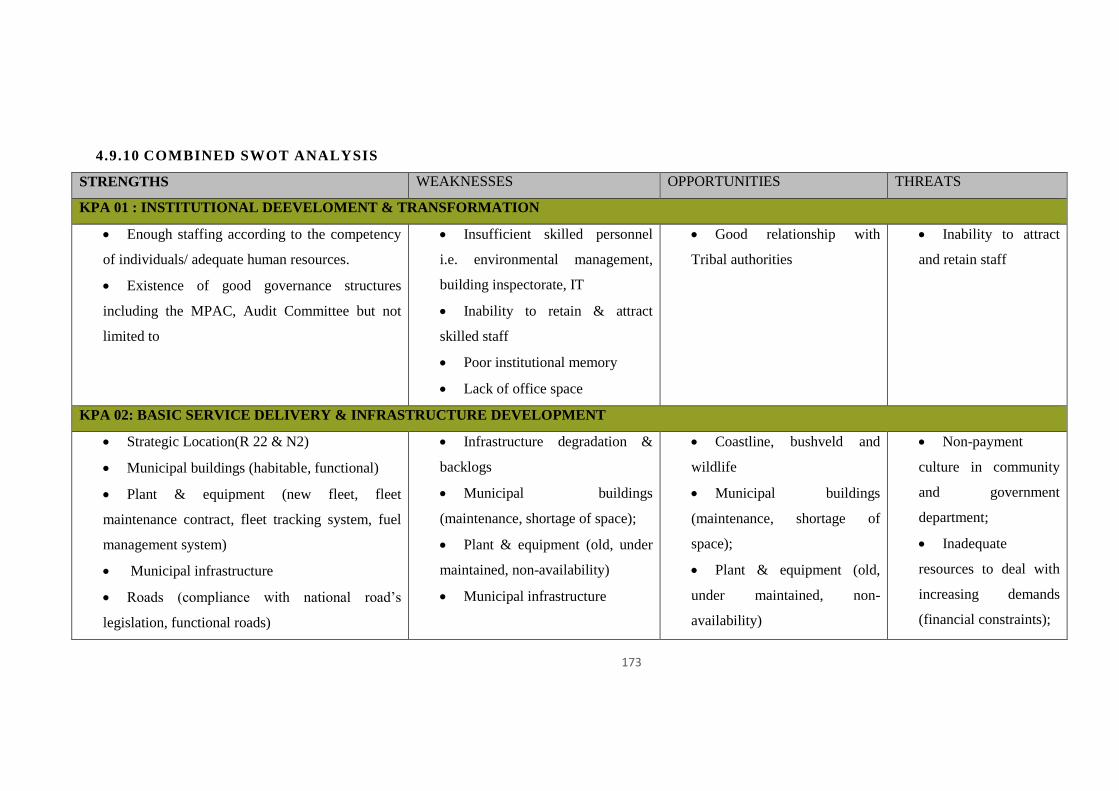
173
4.9.10 COMBINED SWOT ANALYSIS
STRENGTHS WEAKNESSES OPPORTUNITIES THREATS
KPA 01 : INSTITUTIONAL DEEVELOMENT & TRANSFORMATION
Enough staffing according to the competency
of individuals/ adequate human resources.
Existence of good governance structures
including the MPAC, Audit Committee but not
limited to
Insufficient skilled personnel
i.e. environmental management,
building inspectorate, IT
Inability to retain & attract
skilled staff
Poor institutional memory
Lack of office space
Good relationship with
Tribal authorities
Inability to attract
and retain staff
KPA 02: BASIC SERVICE DELIVERY & INFRASTRUCTURE DEVELOPMENT
Strategic Location(R 22 & N2)
Municipal buildings (habitable, functional)
Plant & equipment (new fleet, fleet
maintenance contract, fleet tracking system, fuel
management system)
Municipal infrastructure
Roads (compliance with national road’s
legislation, functional roads)
Infrastructure degradation &
backlogs
Municipal buildings
(maintenance, shortage of space);
Plant & equipment (old, under
maintained, non-availability)
Municipal infrastructure
Coastline, bushveld and
wildlife
Municipal buildings
(maintenance, shortage of
space);
Plant & equipment (old,
under maintained, non-
availability)
Non-payment
culture in community
and government
department;
Inadequate
resources to deal with
increasing demands
(financial constraints);
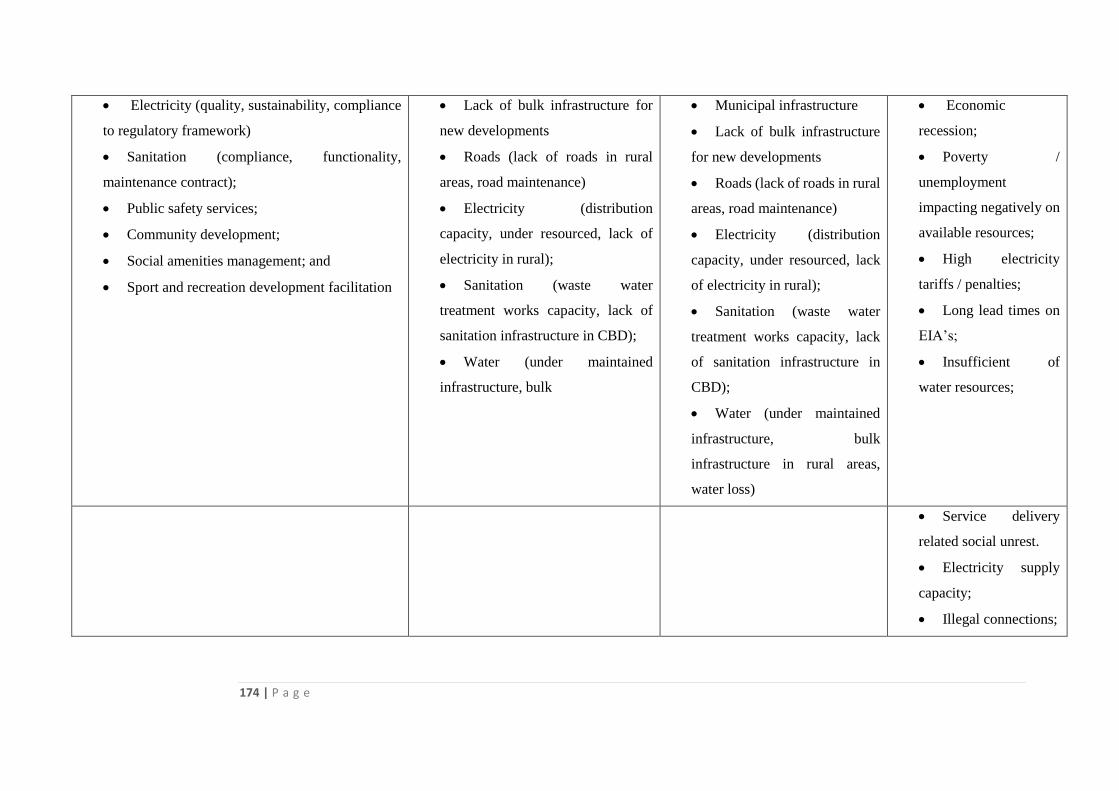
174 | P a g e
Electricity (quality, sustainability, compliance
to regulatory framework)
Sanitation (compliance, functionality,
maintenance contract);
Public safety services;
Community development;
Social amenities management; and
Sport and recreation development facilitation
Lack of bulk infrastructure for
new developments
Roads (lack of roads in rural
areas, road maintenance)
Electricity (distribution
capacity, under resourced, lack of
electricity in rural);
Sanitation (waste water
treatment works capacity, lack of
sanitation infrastructure in CBD);
Water (under maintained
infrastructure, bulk
Municipal infrastructure
Lack of bulk infrastructure
for new developments
Roads (lack of roads in rural
areas, road maintenance)
Electricity (distribution
capacity, under resourced, lack
of electricity in rural);
Sanitation (waste water
treatment works capacity, lack
of sanitation infrastructure in
CBD);
Water (under maintained
infrastructure, bulk
infrastructure in rural areas,
water loss)
Economic
recession;
Poverty /
unemployment
impacting negatively on
available resources;
High electricity
tariffs / penalties;
Long lead times on
EIA’s;
Insufficient of
water resources;
Service delivery
related social unrest.
Electricity supply
capacity;
Illegal connections;
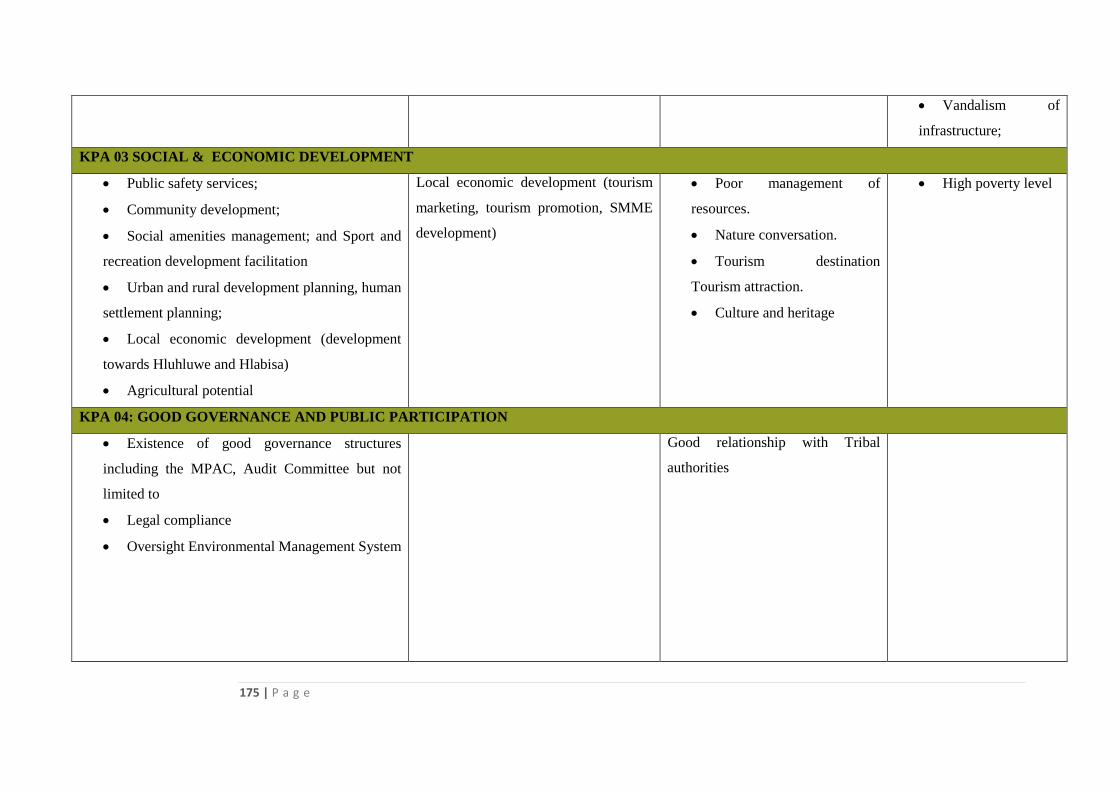
175 | P a g e
Vandalism of
infrastructure;
KPA 03 SOCIAL & ECONOMIC DEVELOPMENT
Public safety services;
Community development;
Social amenities management; and Sport and
recreation development facilitation
Urban and rural development planning, human
settlement planning;
Local economic development (development
towards Hluhluwe and Hlabisa)
Agricultural potential
Local economic development (tourism
marketing, tourism promotion, SMME
development)
Poor management of
resources.
Nature conversation.
Tourism destination
Tourism attraction.
Culture and heritage
High poverty level
KPA 04: GOOD GOVERNANCE AND PUBLIC PARTICIPATION
Existence of good governance structures
including the MPAC, Audit Committee but not
limited to
Legal compliance
Oversight Environmental Management System
Good relationship with Tribal
authorities
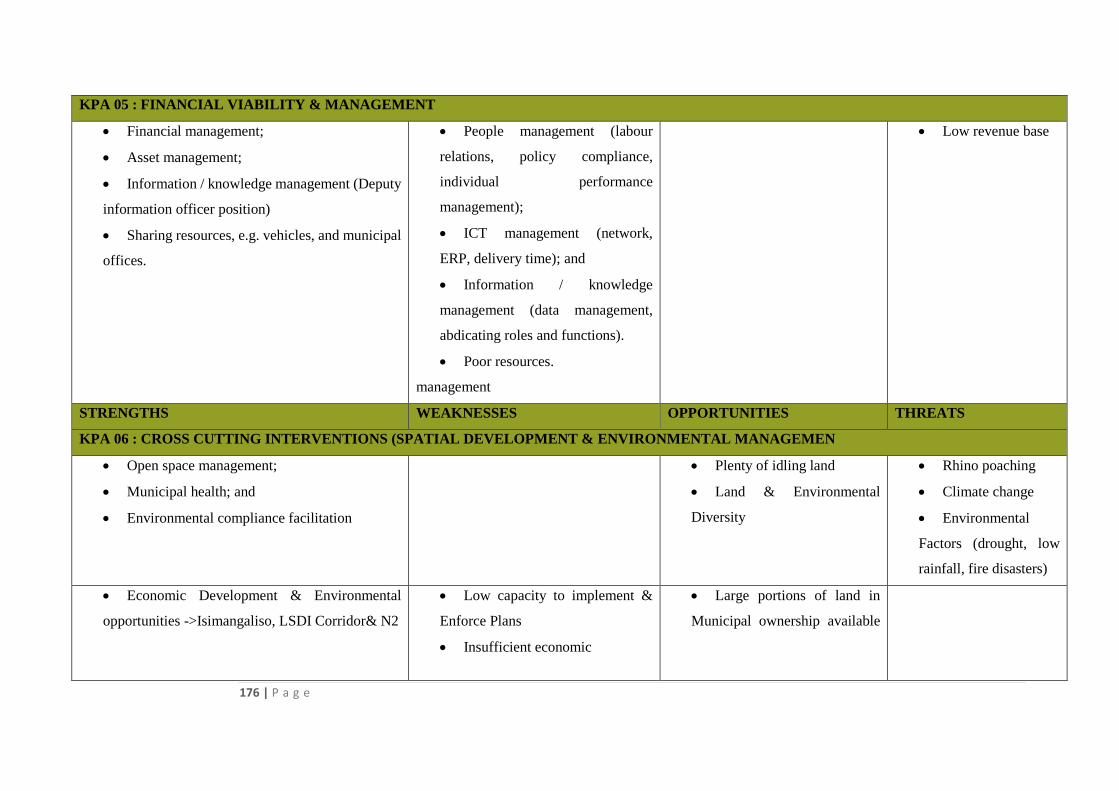
176 | P a g e
KPA 05 : FINANCIAL VIABILITY & MANAGEMENT
Financial management;
Asset management;
Information / knowledge management (Deputy
information officer position)
Sharing resources, e.g. vehicles, and municipal
offices.
People management (labour
relations, policy compliance,
individual performance
management);
ICT management (network,
ERP, delivery time); and
Information / knowledge
management (data management,
abdicating roles and functions).
Poor resources.
management
Low revenue base
STRENGTHS WEAKNESSES OPPORTUNITIES THREATS
KPA 06 : CROSS CUTTING INTERVENTIONS (SPATIAL DEVELOPMENT & ENVIRONMENTAL MANAGEMEN
Open space management;
Municipal health; and
Environmental compliance facilitation
Plenty of idling land
Land & Environmental
Diversity
Rhino poaching
Climate change
Environmental
Factors (drought, low
rainfall, fire disasters)
Economic Development & Environmental
opportunities ->Isimangaliso, LSDI Corridor& N2
Low capacity to implement &
Enforce Plans
Insufficient economic
Large portions of land in
Municipal ownership available
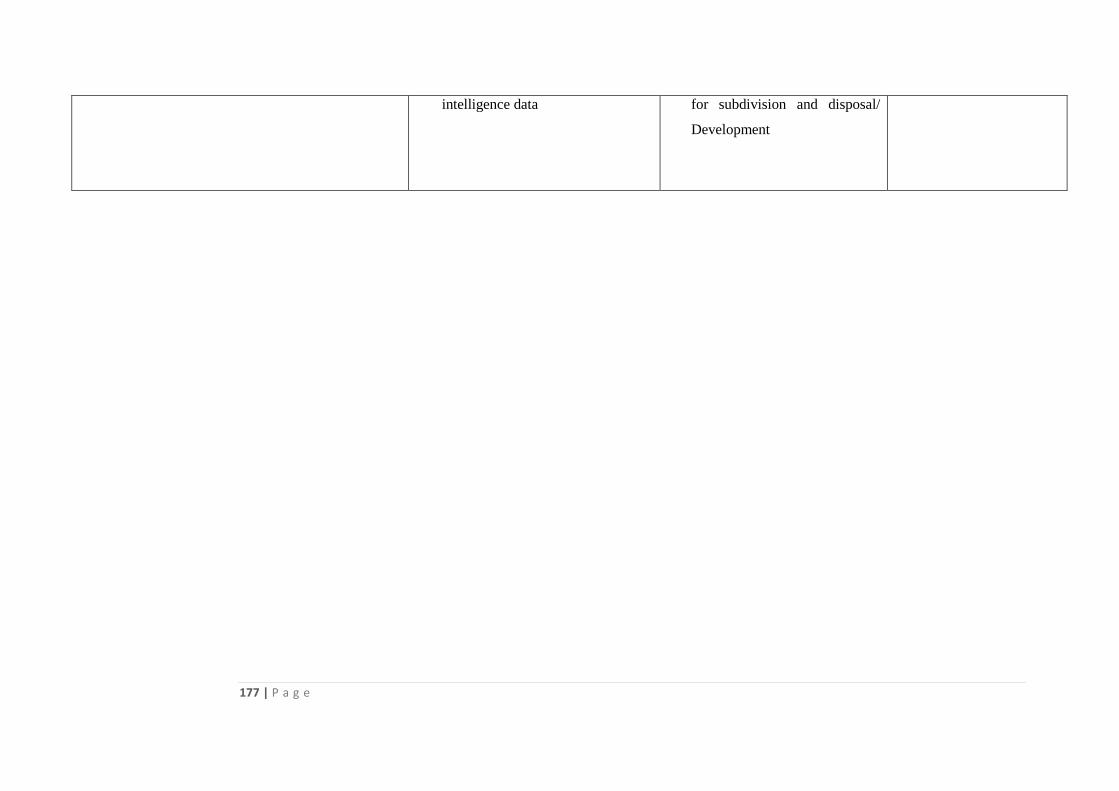
177 | P a g e
intelligence data
for subdivision and disposal/
Development
178 | P a g e
SECTION D
5.1 DEVELOPMENT STRATEGY
INTRODUCTION
Strategic Planning is fundamental to the long-term sustainable management of a municipality. In this
regard, the municipality has to prepare a 5-year IDP to serve as a framework for all development and
investment decisions within the municipal area. To realize the Vision and to ensure sustainable growth
within the municipality in accordance with its priorities aligned to national and provincial targets, the
following strategies and objectives seek to unravel some of the key challenges which, if not adequately
addressed will have an adverse impact in terms of improving the wellbeing of the residents and on
which the details of the key performance areas were expounded on and on which the plans,
programmes and projects of the municipality are based.
This section highlights on Big 5-Hlabisa Municipality’s Long Term Growth and Development Goals.
It will therefore highlight on the components of the Long Term Growth and Development Goals as
follows:
National Development Plan
KZN Provincial Priorities
National and Provincial Policy Perspective
Vision, Mission and Core Values
Big 5-Hlabisa Municipality Strategic Issues
Strategic Objectives and Strategies
The Strategic Objectives and Strategies are structured in line with the Key Performance Areas (KPAs)
of the Five Year Local Government Strategic Agenda as indicated below:
Spatial Development Framework
Service Delivery
Sustainable Economic Growth and Development and LED
Financial Viability
Institutional Arrangements
Performance Management System
Governance
179 | P a g e
d. NATIONAL AND PROVINCIAL POLICY PERSPECTIVE
NATIONAL DEVELOPMENT PLAN
The National Development Plan highlights the following:
1. Key drivers of change
2. Demographic trends
3. Economy and employment
4. Economic infrastructure
5. Transitioning to a low carbon economy
6. Inclusive rural economy
7. Positioning South Africa in the world
8. Human settlements
9. Improving education, innovation and training
10. Promoting health
11. Social protection
12. Building safer communities
13. Building a capable state
14. Promoting accountability and fighting corruption
15. Transforming society and uniting the count
In alignment of the National Plan the Big 5 Hlabisa has identified the following priorities as they are
relevant to the a municipal context as a results the municipal strategic objectives are influenced by the
following in the third generation . This is further articulated in the strategic objectives.
Inclusive rural economy
Human settlement
Social protection
Building safer communities
Building a capable state
Promoting accountability and fighting corruption
e. KZN PROVINCIAL PRIORITIES
The following provincial priorities are highlighted and the municipality has been aligned its strategic
goals to following five highlighted provincial priorities
1. To maximize KZN position as a gateway to South and Southern Africa;
2. To ensure human and utilization of natural resources are in harmony;
3. To create safe, healthy and sustainable living environments;
4. To aspire to healthy and educated communities;
5. To ensure all employable people are employed;
180 | P a g e
6. To develop a more equitable society;
7. To ensure that all people have access to basic services;
8. To offer world class infrastructure;
9. To boost investors’ confidence to invest in KZN;
10. To develop a skilled labour force aligned to economic growth needs;
11. To create options for people on where and how they opt to live, work and play;
12. To entrench people centeredness;
13. To provide strong and decisive leadership; and
14. To foster social compacts.
f . PROVINCIAL GROWTH AND DEVELOPMENT STRATEGY (PGDS)
The PGDS is a vehicle to address the legacies of the apartheid space economy, to promote sustainable
development and to ensure poverty eradication and employment creation. The PGDS offers a tool
through which national government can direct and articulate its strategy and similarly for local
government to reflect the necessary human, financial and fiscal support it needs to achieve these
outcomes. It facilitates proper coordination between different spheres of government and aims to
prevent provincial departments from acting out of concert with local municipalities. It enables
intergovernmental alignment and guides activities of various role players and agencies (provincial
sector departments, parastatals, district and municipalities). The PGDS will enhance service delivery.
It is a framework for public and private sector investment, indicating areas of opportunities and
development priorities. It addresses key issues of implementation blockages whilst providing strategic
direction.
The PGDS on the one hand involves preparing policies, strategies and guidelines and on the other
hand it involves preparing mechanisms to align and facilitate the implementation, monitoring and
evaluation of key growth and development priorities.
2.9 OBJECTIVES OF DISTRICT GROWTH AND DEVELOPMENT PLAN FOR
UMKHANYAKUDE DISTRICT
The overall objectives of the District Growth and Development Plan for UMkhanyakude can be
summarized as follows: o Set a long term (20 year+) vision and direction for development in the
District; o Serve as an overarching strategic framework for development in the district and it family
of local municipalities applying the 80/20 principle (it is not intended to be a detailed inventory of all
181 | P a g e
potential projects and actions); Provide a spatial context and prioritization for these strategic
interventions;
Guide the activities and resource allocation of the district and other spheres of government, business
sectors, organized labour and other role players from civil society that can contribute to development
in the district by defining a clear set of priority objectives and implementation targets; o Identify
institutional arrangements to secure buy-in and ownership in the formulation and implementation of
the plan; o To facilitate alignment and integration of the DGDP objectives with Departmental strategic
plans, municipal IDP's, and sector strategies and plans; o Provide a common platform for resource
commitments and budget alignment of departments and municipal entities through the agreed set of
objectives and targets of the DGDP.
2.10 DISTRICT ECONOMIC STRUCTURE AND TRENDS
The key economic structure and trends in the district can be summarized as follows:
Small size of district economy in provincial comparative terms (eg. less than 5% of the size
of the eThekwini municipality in 2011)
Although growing from a small base, the economy experienced significant growth in excess
of 9% per annum, especially in the period from 2000 onwards;
Two dominant local economies within the district are the Mtubatuba and Jozini LMs
accounting for approximately R1.9 and R1.7 billion of GVA in 2011 respectively;
Dominant economic sectors in UKDM as measured by GVA is the retail, catering and
accommodation sector accounting for R1.45 billion in 2011, the manufacturing sector (R1.37
billion), and the general government services sector (R1.34 billion);
The manufacturing sector increased its contribution to total GVA from 10.3% to 19.1%, and
the retail, catering and accommodation sector its contribution from 13.5% to 20.3%;
Agricultural sector has shown some significant growth of approximately 5.5% per annum over
the period 1995 to 2011, but represents the third lowest output amongst the districts within the
province; The number of formal employment opportunities in the agricultural sector remained
relatively stable at approximately 9000 over the period from 2000 to 2005 but thereafter
decreased significantly to a total estimated figure of 4983 by 2010;
The district economy became more concentrated in a select number of sectors with the Tress
index increasing from a value of 36.7 in 2000 to 42.2 in 2011
The vision underpins an integrated approach to improving the standard of living of all people in the
area of Big 5 Hlabisa Municipality area. In order to achieve this vision, the municipality will have to
182 | P a g e
persist functioning in an accountable and financial sound manner. The vision for the Big 5 Hlabisa
municipality is as follows:
VISION
A sustainable economy achieved through service delivery and development facilitation for
prosperity and improved quality of life.
MISSION
In light of the vision
We are visionary leaders who serve through community driven initiatives, high performance, sound
work ethic, innovation, cutting edge resources and synergistic partnerships.
OUR VALUES
Professionalism
Integrity
Competency
Team work
g. STRATEGIC ISSUES
The municipality finalized its analysis phase as the most important phase of the IDP and forms basis
for strategic phase. Various sessions were held on the, 20 and 21 February 2019 to come up with
strategies that could impact positively on people’s lives, issues of concern ranges from basic services,
social issues more especially the nation building programs and initiatives. Infrastructure development
is being addressed. Nation building and embracing culture are also the main focus in this IDP. The
municipality also has recognized the existence of tribal authorities in the area and will therefore ensure
that issues of planning are addressed jointly.
The agricultural potential can never be underestimated. The municipality will ensure that poverty is
alleviated and that its communities are empowered on agricultural interventions; however this cannot
be achieved without cooperative governance with all the relevant sectors and all stakeholders.
The Organizational Performance Management has focused on the issues at strategic level and the
Individual PMS will further articulate on all Key Performance Areas in detail and target will be clearly
183 | P a g e
defined Operation Sukuma Sakhe (OSS) has been acknowledged as good initiative and platform that
tackles issues affecting our communities at grass-root level The municipality relies heavily on MIG
funding for infrastructure development.
Highlight on the Municipality’s strategic issues:
To strengthen IGR structures implementation
Capacity building for Traditional authorities in terms of IDP, PMS, Budget
Forging partnerships within traditional authorities to enhance joint planning
Sustainability of IGR structure.
To mainstream and integrate issues of poverty, unemployment, environment and HIV/AIDS
within the
To address issues of youth, women, disable and vulnerable sectors of society on integrated
bases.
1. STRATEGIC PLANNING SESSIONS
Strategic planning sessions on the Big 5 Hlabisa Municipality was held on the 30 and 31 January 2019,
Deliberations were aimed at institutionalizing a culture of planning, strategies, budgeting, monitoring,
and evaluation, reporting and aiming at improving its performance as well as service excellence. The
session indeed served the purpose; uMkhanyakude District Municipality was present in the session
and tremendously supported the municipality.
2. STRATEGIC OBJECTIVES
The following are the strategic objectives for the municipality for the period 2018/19-2021/2022
FY and focus is made on sustainable development.
GOALS STRATEGIC
OBJECTIVES
KEY
PERFORMANCE
INDICATOR
IDP REF. TARGET2019/20
KPA 01: INSTITUTIONAL DEVELOPMENT
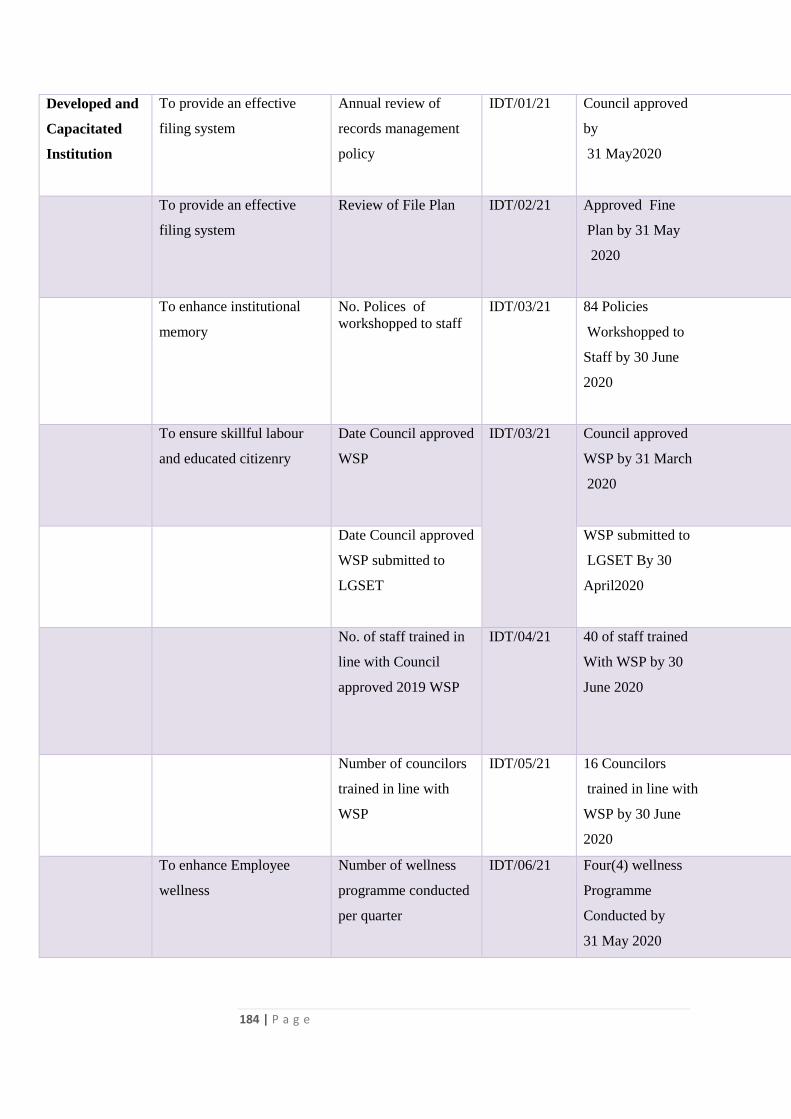
184 | P a g e
Developed and
Capacitated
Institution
To provide an effective
filing system
Annual review of
records management
policy
IDT/01/21 Council approved
by
31 May2020
To provide an effective
filing system
Review of File Plan
IDT/02/21 Approved Fine
Plan by 31 May
2020
To enhance institutional
memory
No. Polices of
workshopped to staff
IDT/03/21 84 Policies
Workshopped to
Staff by 30 June
2020
To ensure skillful labour
and educated citizenry
Date Council approved
WSP
IDT/03/21
Council approved
WSP by 31 March
2020
Date Council approved
WSP submitted to
LGSET
WSP submitted to
LGSET By 30
April2020
No. of staff trained in
line with Council
approved 2019 WSP
IDT/04/21 40 of staff trained
With WSP by 30
June 2020
Number of councilors
trained in line with
WSP
IDT/05/21 16 Councilors
trained in line with
WSP by 30 June
2020
To enhance Employee
wellness
Number of wellness
programme conducted
per quarter
IDT/06/21 Four(4) wellness
Programme
Conducted by
31 May 2020
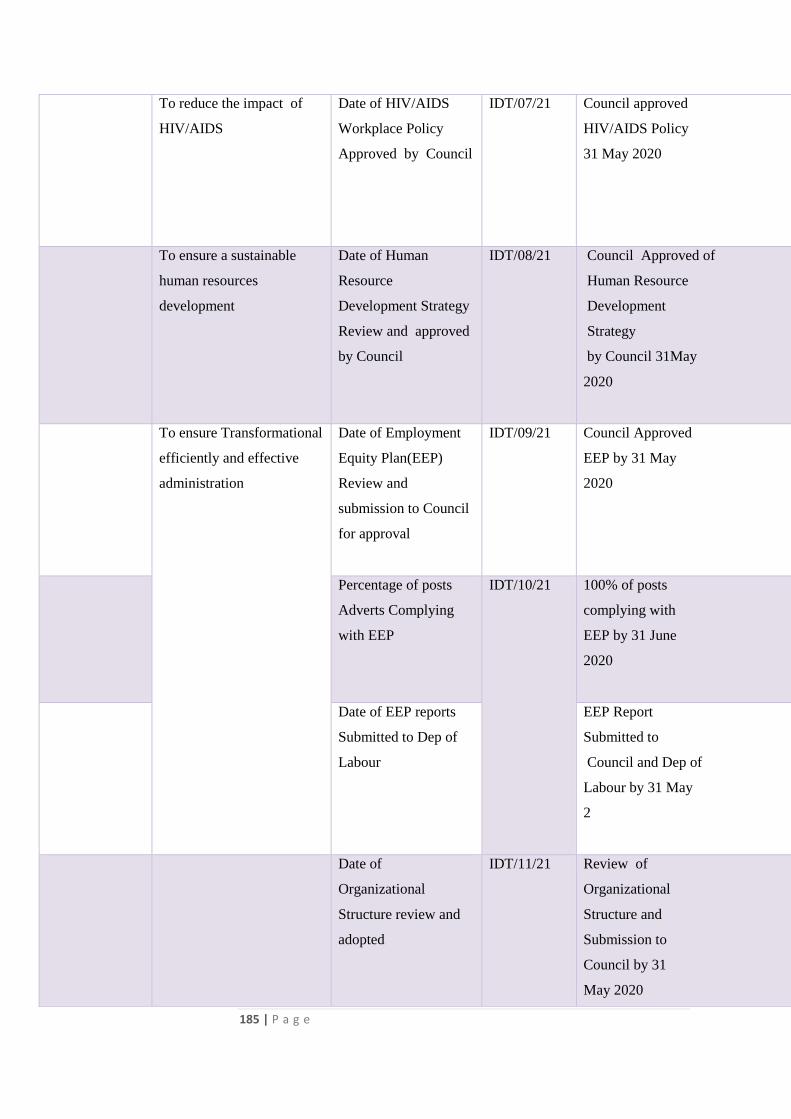
185 | P a g e
To reduce the impact of
HIV/AIDS
Date of HIV/AIDS
Workplace Policy
Approved by Council
IDT/07/21 Council approved
HIV/AIDS Policy
31 May 2020
To ensure a sustainable
human resources
development
Date of Human
Resource
Development Strategy
Review and approved
by Council
IDT/08/21 Council Approved of
Human Resource
Development
Strategy
by Council 31May
2020
To ensure Transformational
efficiently and effective
administration
Date of Employment
Equity Plan(EEP)
Review and
submission to Council
for approval
IDT/09/21 Council Approved
EEP by 31 May
2020
Percentage of posts
Adverts Complying
with EEP
IDT/10/21 100% of posts
complying with
EEP by 31 June
2020
Date of EEP reports
Submitted to Dep of
Labour
EEP Report
Submitted to
Council and Dep of
Labour by 31 May
2
Date of
Organizational
Structure review and
adopted
IDT/11/21 Review of
Organizational
Structure and
Submission to
Council by 31
May 2020
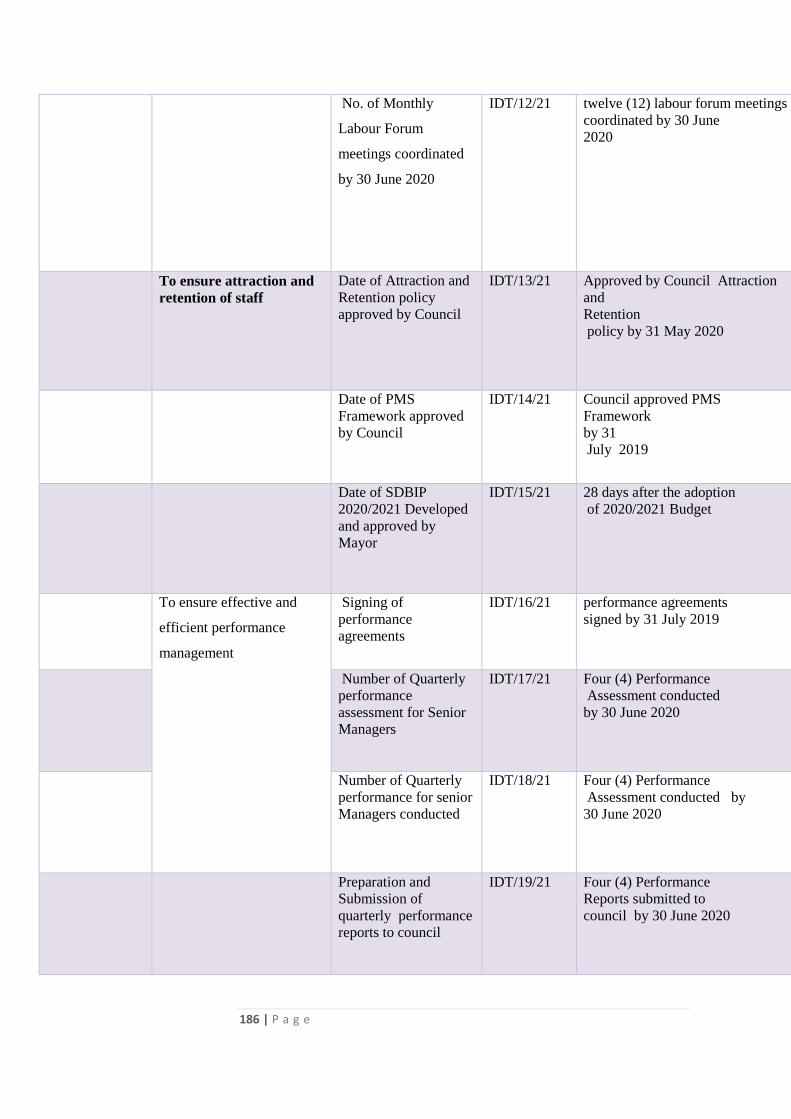
186 | P a g e
No. of Monthly
Labour Forum
meetings coordinated
by 30 June 2020
IDT/12/21 twelve (12) labour forum meetings
coordinated by 30 June
2020
To ensure attraction and
retention of staff
Date of Attraction and
Retention policy
approved by Council
IDT/13/21 Approved by Council Attraction
and
Retention
policy by 31 May 2020
Date of PMS
Framework approved
by Council
IDT/14/21 Council approved PMS
Framework
by 31
July 2019
Date of SDBIP
2020/2021 Developed
and approved by
Mayor
IDT/15/21 28 days after the adoption
of 2020/2021 Budget
To ensure effective and
efficient performance
management
Signing of
performance
agreements
IDT/16/21 performance agreements
signed by 31 July 2019
Number of Quarterly
performance
assessment for Senior
Managers
IDT/17/21 Four (4) Performance
Assessment conducted
by 30 June 2020
Number of Quarterly
performance for senior
Managers conducted
IDT/18/21 Four (4) Performance
Assessment conducted by
30 June 2020
Preparation and
Submission of
quarterly performance
reports to council
IDT/19/21 Four (4) Performance
Reports submitted to
council by 30 June 2020
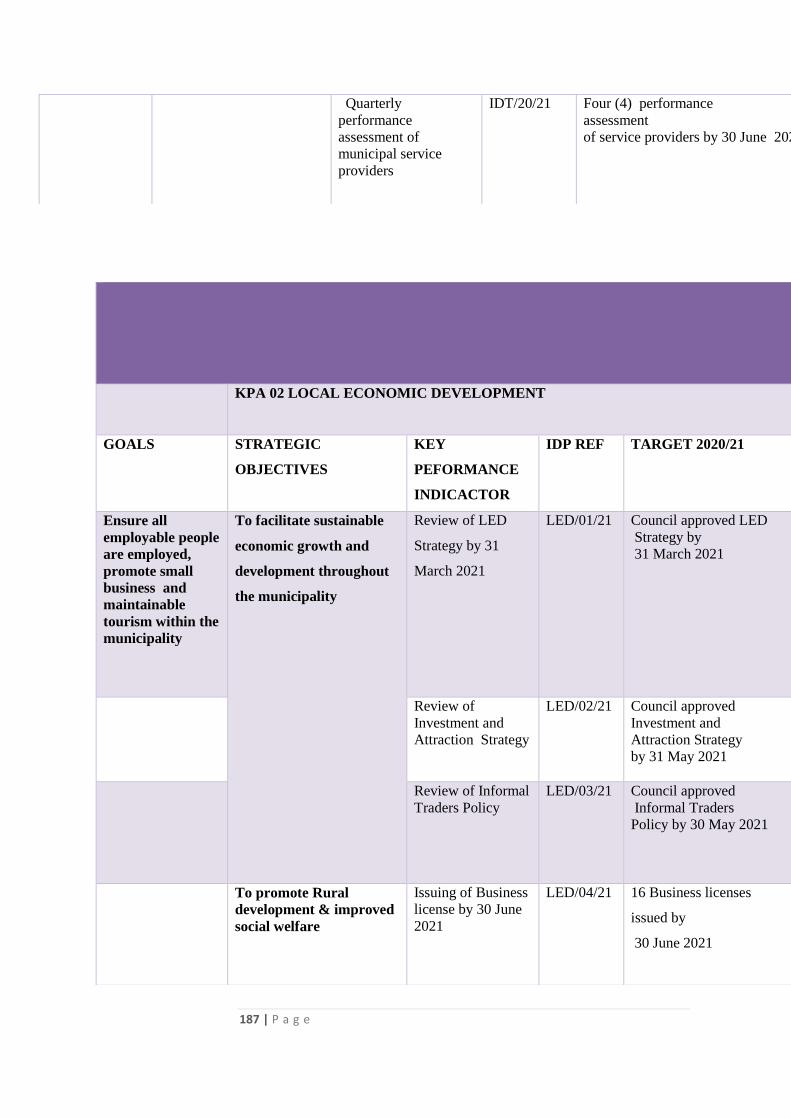
187 | P a g e
Quarterly
performance
assessment of
municipal service
providers
IDT/20/21 Four (4) performance
assessment
of service providers by 30 June 2020
KPA 02 LOCAL ECONOMIC DEVELOPMENT
GOALS STRATEGIC
OBJECTIVES
KEY
PEFORMANCE
INDICACTOR
IDP REF TARGET 2020/21
Ensure all
employable people
are employed,
promote small
business and
maintainable
tourism within the
municipality
To facilitate sustainable
economic growth and
development throughout
the municipality
Review of LED
Strategy by 31
March 2021
LED/01/21 Council approved LED
Strategy by
31 March 2021
Review of
Investment and
Attraction Strategy
LED/02/21 Council approved
Investment and
Attraction Strategy
by 31 May 2021
Review of Informal
Traders Policy
LED/03/21 Council approved
Informal Traders
Policy by 30 May 2021
To promote Rural
development & improved
social welfare
Issuing of Business
license by 30 June
2021
LED/04/21 16 Business licenses
issued by
30 June 2021
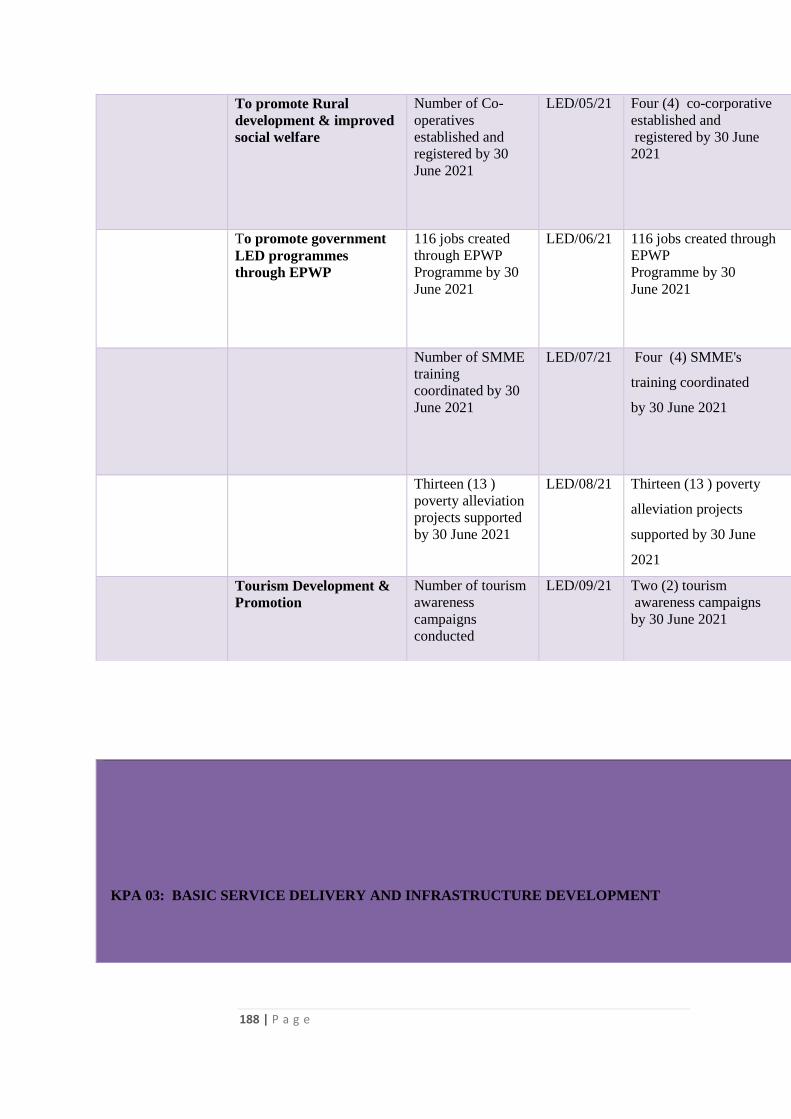
188 | P a g e
To promote Rural
development & improved
social welfare
Number of Co-
operatives
established and
registered by 30
June 2021
LED/05/21 Four (4) co-corporative
established and
registered by 30 June
2021
To promote government
LED programmes
through EPWP
116 jobs created
through EPWP
Programme by 30
June 2021
LED/06/21 116 jobs created through
EPWP
Programme by 30
June 2021
Number of SMME
training
coordinated by 30
June 2021
LED/07/21 Four (4) SMME's
training coordinated
by 30 June 2021
Thirteen (13 )
poverty alleviation
projects supported
by 30 June 2021
LED/08/21 Thirteen (13 ) poverty
alleviation projects
supported by 30 June
2021
Tourism Development &
Promotion
Number of tourism
awareness
campaigns
conducted
LED/09/21 Two (2) tourism
awareness campaigns
by 30 June 2021
KPA 03: BASIC SERVICE DELIVERY AND INFRASTRUCTURE DEVELOPMENT
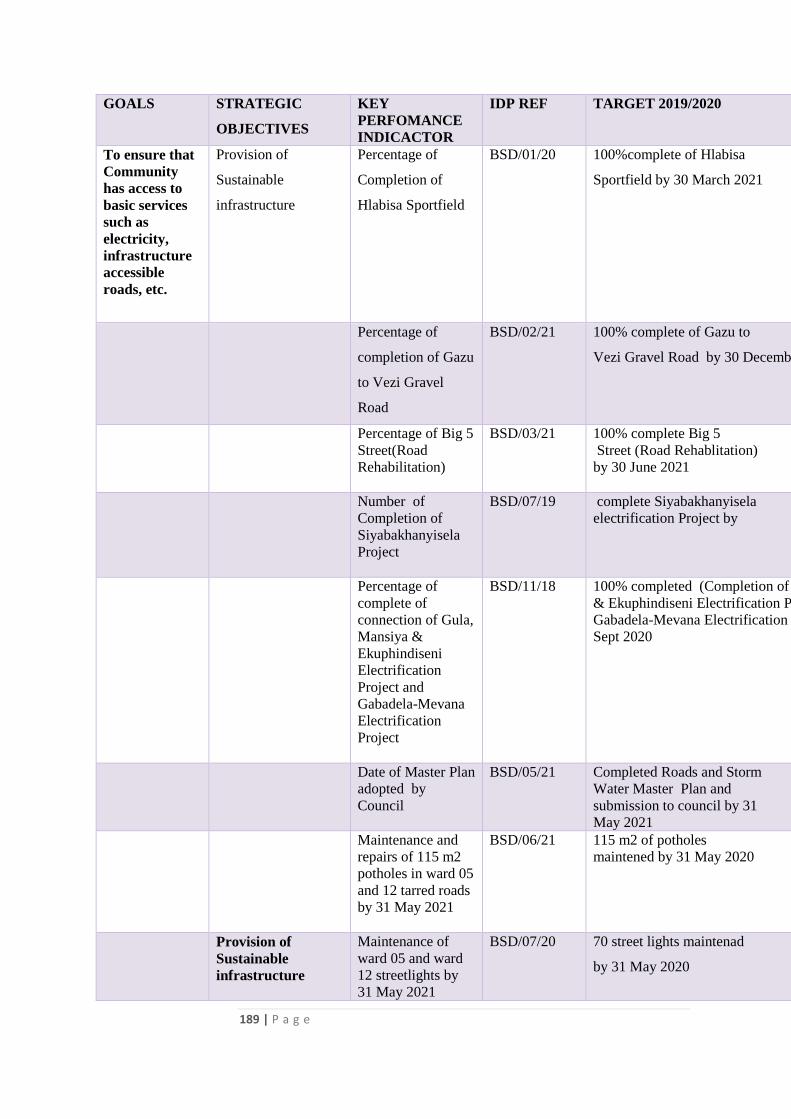
189 | P a g e
GOALS STRATEGIC
OBJECTIVES
KEY
PERFOMANCE
INDICACTOR
IDP REF TARGET 2019/2020
To ensure that
Community
has access to
basic services
such as
electricity,
infrastructure
accessible
roads, etc.
Provision of
Sustainable
infrastructure
Percentage of
Completion of
Hlabisa Sportfield
BSD/01/20 100%complete of Hlabisa
Sportfield by 30 March 2021
Percentage of
completion of Gazu
to Vezi Gravel
Road
BSD/02/21 100% complete of Gazu to
Vezi Gravel Road by 30 December 2020
Percentage of Big 5
Street(Road
Rehabilitation)
BSD/03/21 100% complete Big 5
Street (Road Rehablitation)
by 30 June 2021
Number of
Completion of
Siyabakhanyisela
Project
BSD/07/19 complete Siyabakhanyisela
electrification Project by
Percentage of
complete of
connection of Gula,
Mansiya &
Ekuphindiseni
Electrification
Project and
Gabadela-Mevana
Electrification
Project
BSD/11/18 100% completed (Completion of Gula, Mansiya
& Ekuphindiseni Electrification Project and
Gabadela-Mevana Electrification Project by 30
Sept 2020
Date of Master Plan
adopted by
Council
BSD/05/21 Completed Roads and Storm
Water Master Plan and
submission to council by 31
May 2021
Maintenance and
repairs of 115 m2
potholes in ward 05
and 12 tarred roads
by 31 May 2021
BSD/06/21 115 m2 of potholes
maintened by 31 May 2020
Provision of
Sustainable
infrastructure
Maintenance of
ward 05 and ward
12 streetlights by
31 May 2021
BSD/07/20 70 street lights maintenad
by 31 May 2020
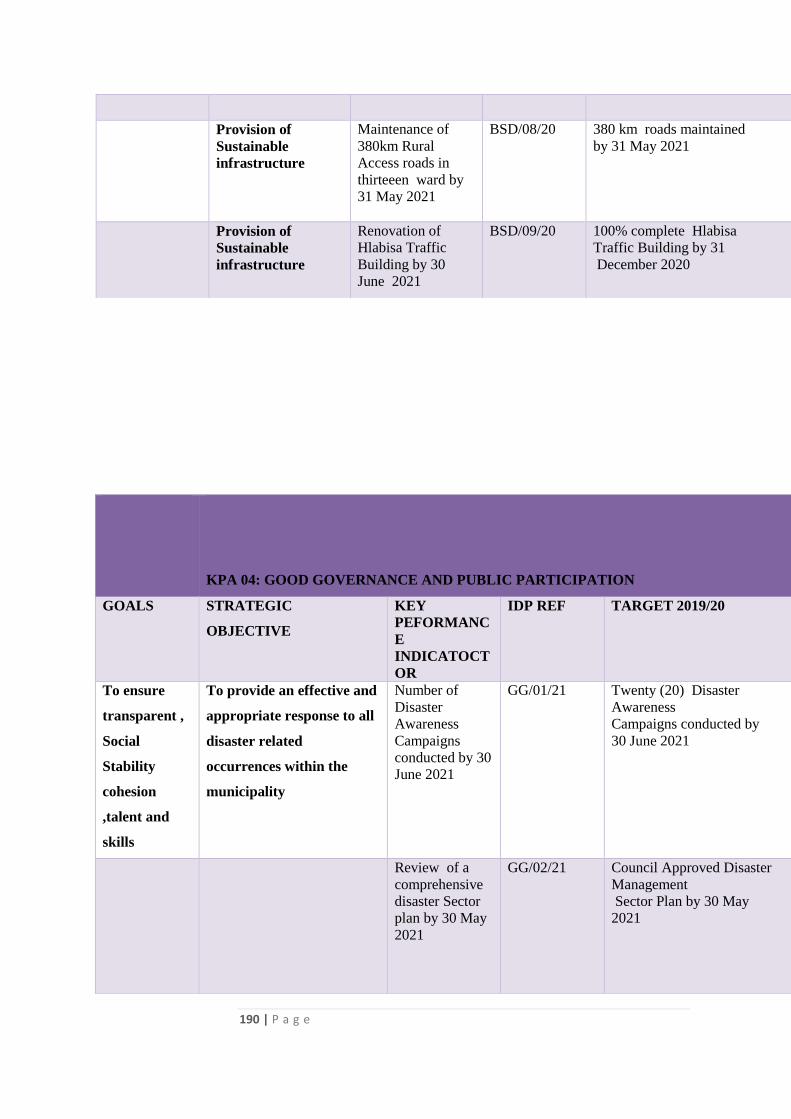
190 | P a g e
Provision of
Sustainable
infrastructure
Maintenance of
380km Rural
Access roads in
thirteeen ward by
31 May 2021
BSD/08/20 380 km roads maintained
by 31 May 2021
Provision of
Sustainable
infrastructure
Renovation of
Hlabisa Traffic
Building by 30
June 2021
BSD/09/20 100% complete Hlabisa
Traffic Building by 31
December 2020
KPA 04: GOOD GOVERNANCE AND PUBLIC PARTICIPATION
GOALS STRATEGIC
OBJECTIVE
KEY
PEFORMANC
E
INDICATOCT
OR
IDP REF TARGET 2019/20
To ensure
transparent ,
Social
Stability
cohesion
,talent and
skills
To provide an effective and
appropriate response to all
disaster related
occurrences within the
municipality
Number of
Disaster
Awareness
Campaigns
conducted by 30
June 2021
GG/01/21 Twenty (20) Disaster
Awareness
Campaigns conducted by
30 June 2021
Review of a
comprehensive
disaster Sector
plan by 30 May
2021
GG/02/21 Council Approved Disaster
Management
Sector Plan by 30 May
2021
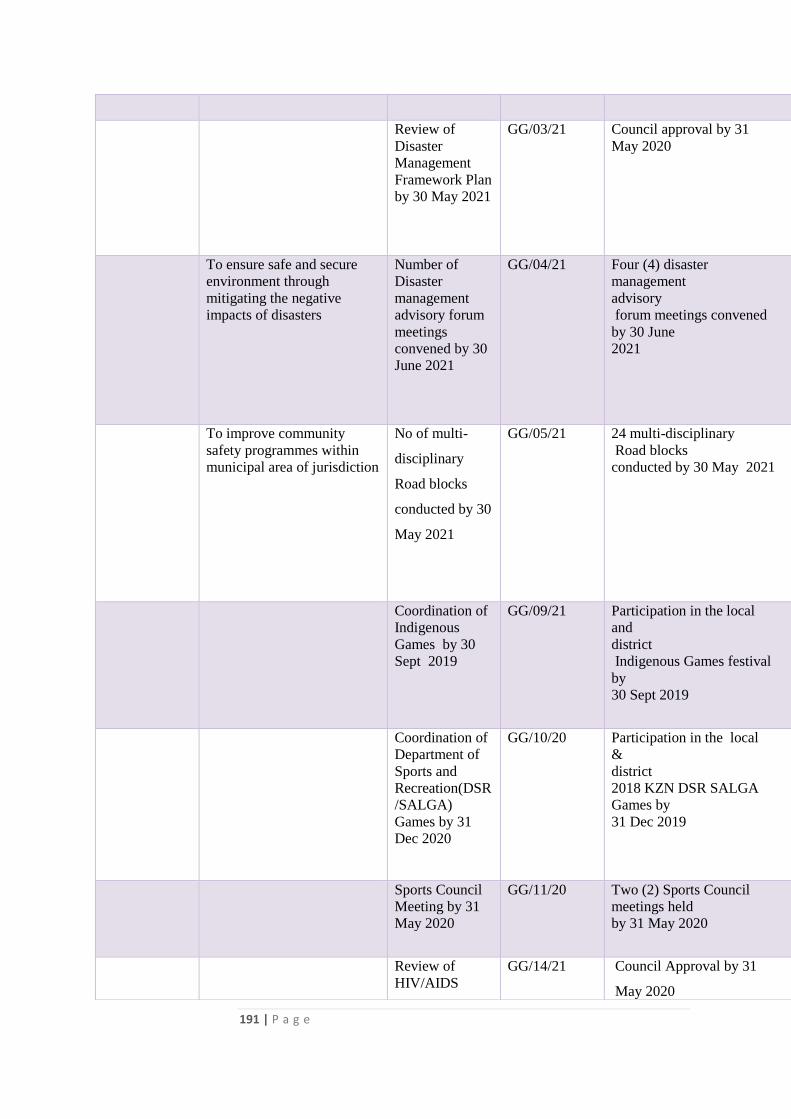
191 | P a g e
Review of
Disaster
Management
Framework Plan
by 30 May 2021
GG/03/21 Council approval by 31
May 2020
To ensure safe and secure
environment through
mitigating the negative
impacts of disasters
Number of
Disaster
management
advisory forum
meetings
convened by 30
June 2021
GG/04/21 Four (4) disaster
management
advisory
forum meetings convened
by 30 June
2021
To improve community
safety programmes within
municipal area of jurisdiction
No of multi-
disciplinary
Road blocks
conducted by 30
May 2021
GG/05/21 24 multi-disciplinary
Road blocks
conducted by 30 May 2021
Coordination of
Indigenous
Games by 30
Sept 2019
GG/09/21 Participation in the local
and
district
Indigenous Games festival
by
30 Sept 2019
Coordination of
Department of
Sports and
Recreation(DSR
/SALGA)
Games by 31
Dec 2020
GG/10/20 Participation in the local
&
district
2018 KZN DSR SALGA
Games by
31 Dec 2019
Sports Council
Meeting by 31
May 2020
GG/11/20 Two (2) Sports Council
meetings held
by 31 May 2020
Review of
HIV/AIDS
GG/14/21 Council Approval by 31
May 2020
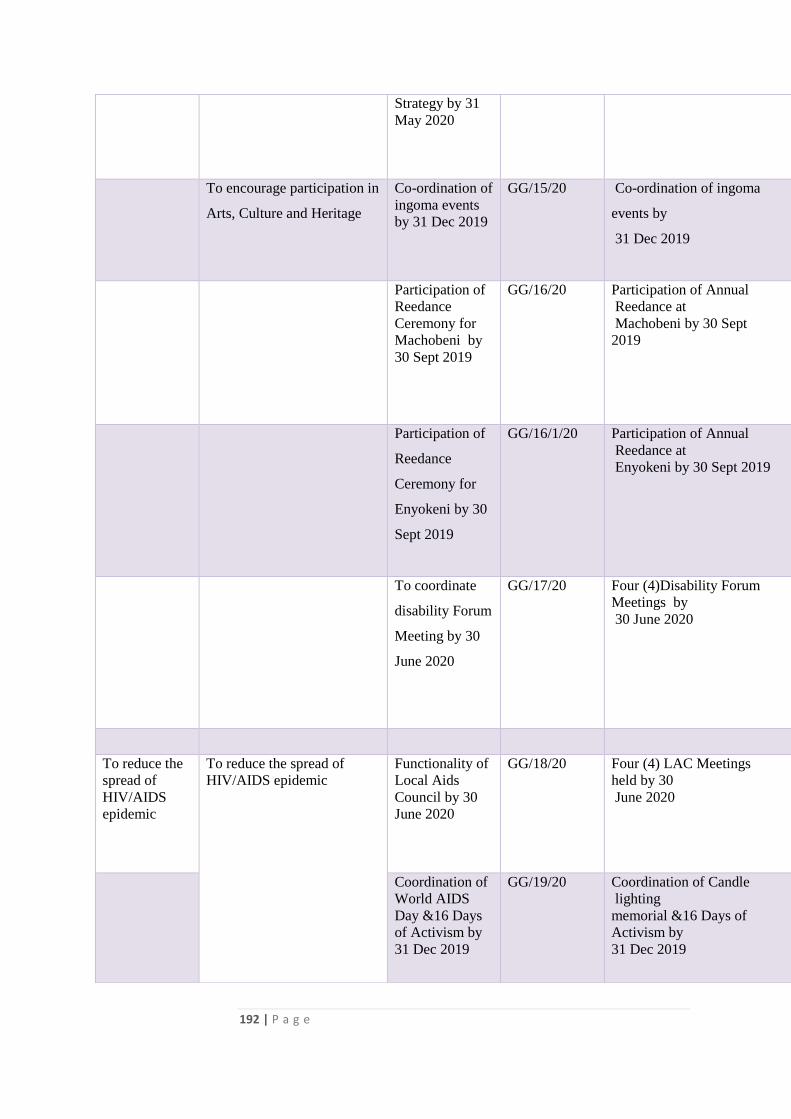
192 | P a g e
Strategy by 31
May 2020
To encourage participation in
Arts, Culture and Heritage
Co-ordination of
ingoma events
by 31 Dec 2019
GG/15/20 Co-ordination of ingoma
events by
31 Dec 2019
Participation of
Reedance
Ceremony for
Machobeni by
30 Sept 2019
GG/16/20 Participation of Annual
Reedance at
Machobeni by 30 Sept
2019
Participation of
Reedance
Ceremony for
Enyokeni by 30
Sept 2019
GG/16/1/20 Participation of Annual
Reedance at
Enyokeni by 30 Sept 2019
To coordinate
disability Forum
Meeting by 30
June 2020
GG/17/20 Four (4)Disability Forum
Meetings by
30 June 2020
To reduce the
spread of
HIV/AIDS
epidemic
To reduce the spread of
HIV/AIDS epidemic
Functionality of
Local Aids
Council by 30
June 2020
GG/18/20 Four (4) LAC Meetings
held by 30
June 2020
Coordination of
World AIDS
Day &16 Days
of Activism by
31 Dec 2019
GG/19/20 Coordination of Candle
lighting
memorial &16 Days of
Activism by
31 Dec 2019
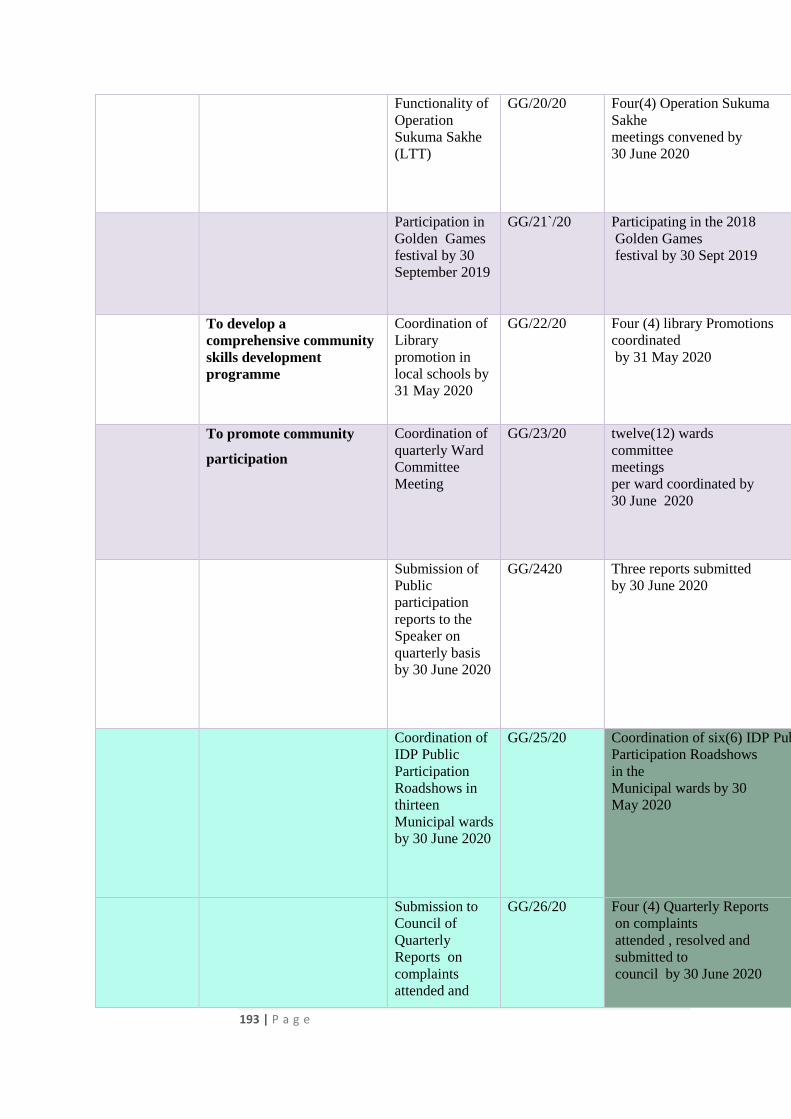
193 | P a g e
Functionality of
Operation
Sukuma Sakhe
(LTT)
GG/20/20 Four(4) Operation Sukuma
Sakhe
meetings convened by
30 June 2020
Participation in
Golden Games
festival by 30
September 2019
GG/21`/20 Participating in the 2018
Golden Games
festival by 30 Sept 2019
To develop a
comprehensive community
skills development
programme
Coordination of
Library
promotion in
local schools by
31 May 2020
GG/22/20 Four (4) library Promotions
coordinated
by 31 May 2020
To promote community
participation
Coordination of
quarterly Ward
Committee
Meeting
GG/23/20 twelve(12) wards
committee
meetings
per ward coordinated by
30 June 2020
Submission of
Public
participation
reports to the
Speaker on
quarterly basis
by 30 June 2020
GG/2420 Three reports submitted
by 30 June 2020
Coordination of
IDP Public
Participation
Roadshows in
thirteen
Municipal wards
by 30 June 2020
GG/25/20 Coordination of six(6) IDP Public
Participation Roadshows
in the
Municipal wards by 30
May 2020
Submission to
Council of
Quarterly
Reports on
complaints
attended and
GG/26/20 Four (4) Quarterly Reports
on complaints
attended , resolved and
submitted to
council by 30 June 2020
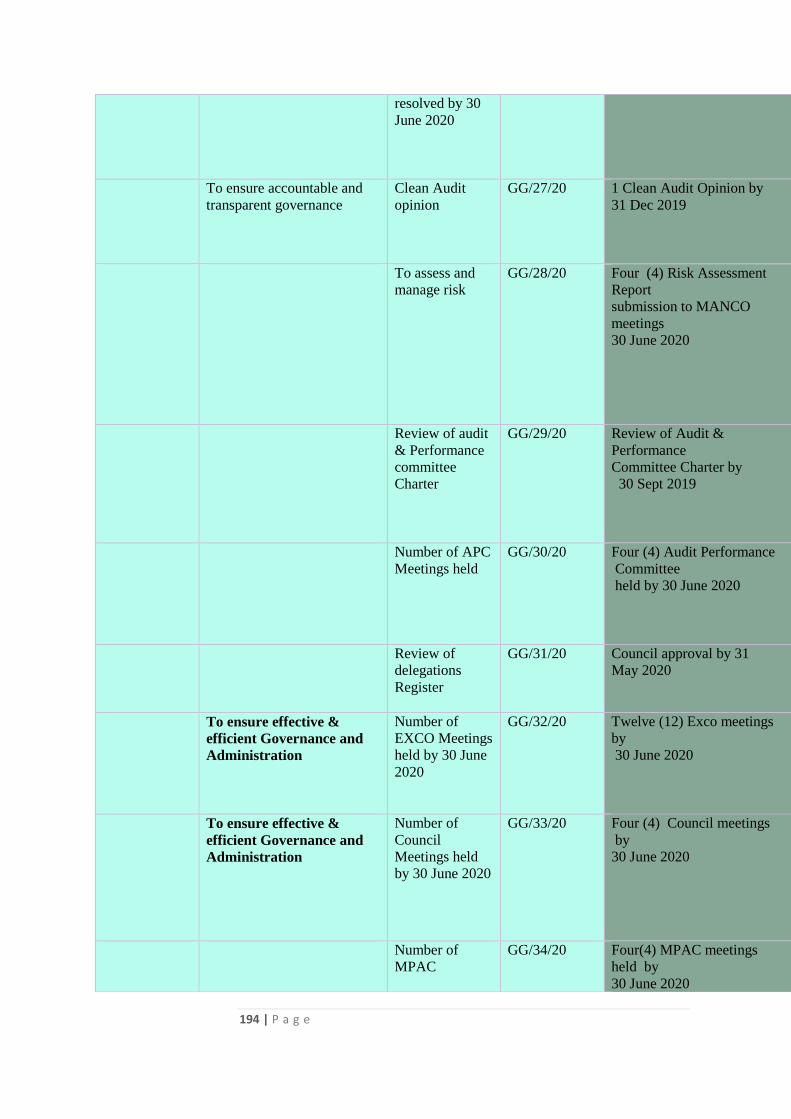
194 | P a g e
resolved by 30
June 2020
To ensure accountable and
transparent governance
Clean Audit
opinion
GG/27/20 1 Clean Audit Opinion by
31 Dec 2019
To assess and
manage risk
GG/28/20 Four (4) Risk Assessment
Report
submission to MANCO
meetings
30 June 2020
Review of audit
& Performance
committee
Charter
GG/29/20 Review of Audit &
Performance
Committee Charter by
30 Sept 2019
Number of APC
Meetings held
GG/30/20 Four (4) Audit Performance
Committee
held by 30 June 2020
Review of
delegations
Register
GG/31/20 Council approval by 31
May 2020
To ensure effective &
efficient Governance and
Administration
Number of
EXCO Meetings
held by 30 June
2020
GG/32/20 Twelve (12) Exco meetings
by
30 June 2020
To ensure effective &
efficient Governance and
Administration
Number of
Council
Meetings held
by 30 June 2020
GG/33/20 Four (4) Council meetings
by
30 June 2020
Number of
MPAC
GG/34/20 Four(4) MPAC meetings
held by
30 June 2020
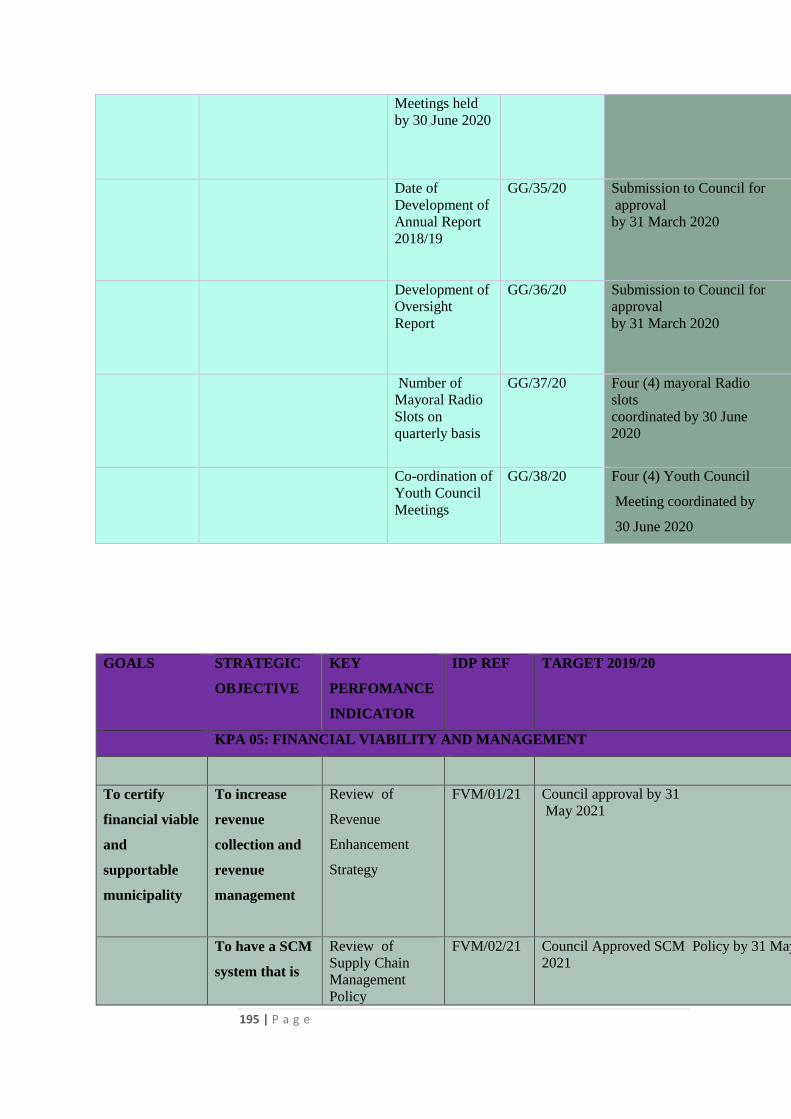
195 | P a g e
GOALS STRATEGIC
OBJECTIVE
KEY
PERFOMANCE
INDICATOR
IDP REF TARGET 2019/20
KPA 05: FINANCIAL VIABILITY AND MANAGEMENT
To certify
financial viable
and
supportable
municipality
To increase
revenue
collection and
revenue
management
Review of
Revenue
Enhancement
Strategy
FVM/01/21 Council approval by 31
May 2021
To have a SCM
system that is
Review of
Supply Chain
Management
Policy
FVM/02/21 Council Approved SCM Policy by 31 May
2021
Meetings held
by 30 June 2020
Date of
Development of
Annual Report
2018/19
GG/35/20 Submission to Council for
approval
by 31 March 2020
Development of
Oversight
Report
GG/36/20 Submission to Council for
approval
by 31 March 2020
Number of
Mayoral Radio
Slots on
quarterly basis
GG/37/20 Four (4) mayoral Radio
slots
coordinated by 30 June
2020
Co-ordination of
Youth Council
Meetings
GG/38/20 Four (4) Youth Council
Meeting coordinated by
30 June 2020
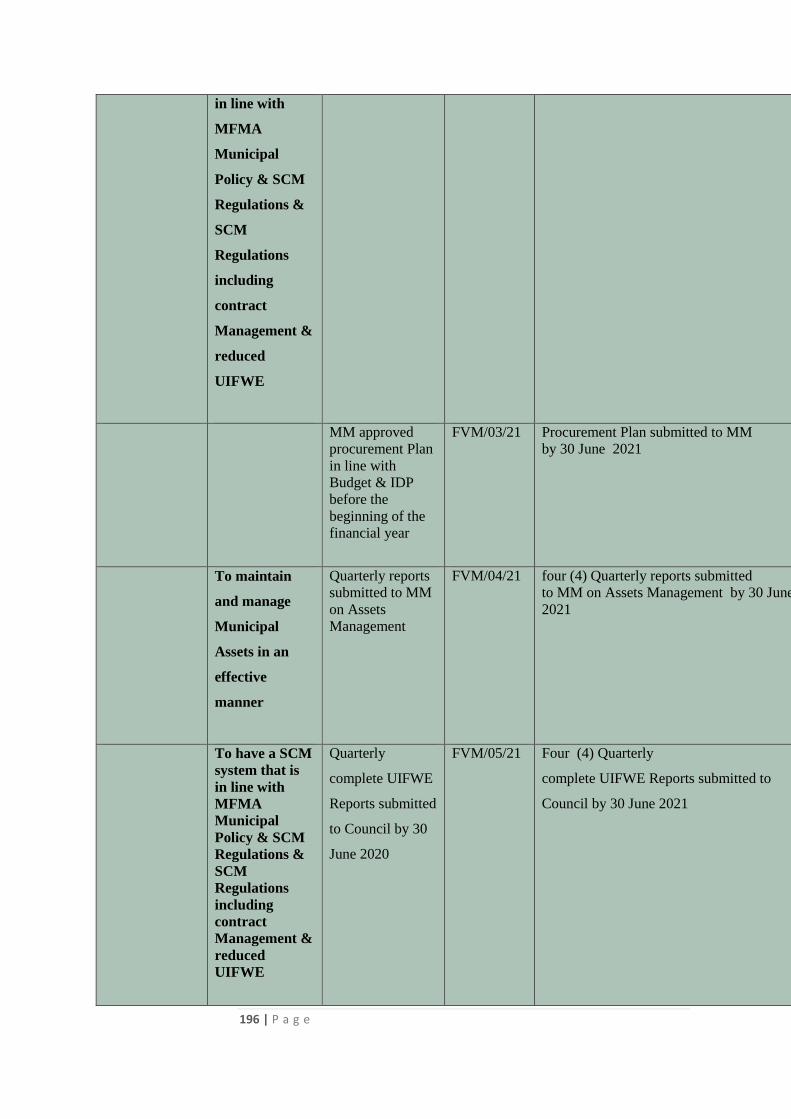
196 | P a g e
in line with
MFMA
Municipal
Policy & SCM
Regulations &
SCM
Regulations
including
contract
Management &
reduced
UIFWE
MM approved
procurement Plan
in line with
Budget & IDP
before the
beginning of the
financial year
FVM/03/21 Procurement Plan submitted to MM
by 30 June 2021
To maintain
and manage
Municipal
Assets in an
effective
manner
Quarterly reports
submitted to MM
on Assets
Management
FVM/04/21 four (4) Quarterly reports submitted
to MM on Assets Management by 30 June
2021
To have a SCM
system that is
in line with
MFMA
Municipal
Policy & SCM
Regulations &
SCM
Regulations
including
contract
Management &
reduced
UIFWE
Quarterly
complete UIFWE
Reports submitted
to Council by 30
June 2020
FVM/05/21 Four (4) Quarterly
complete UIFWE Reports submitted to
Council by 30 June 2021
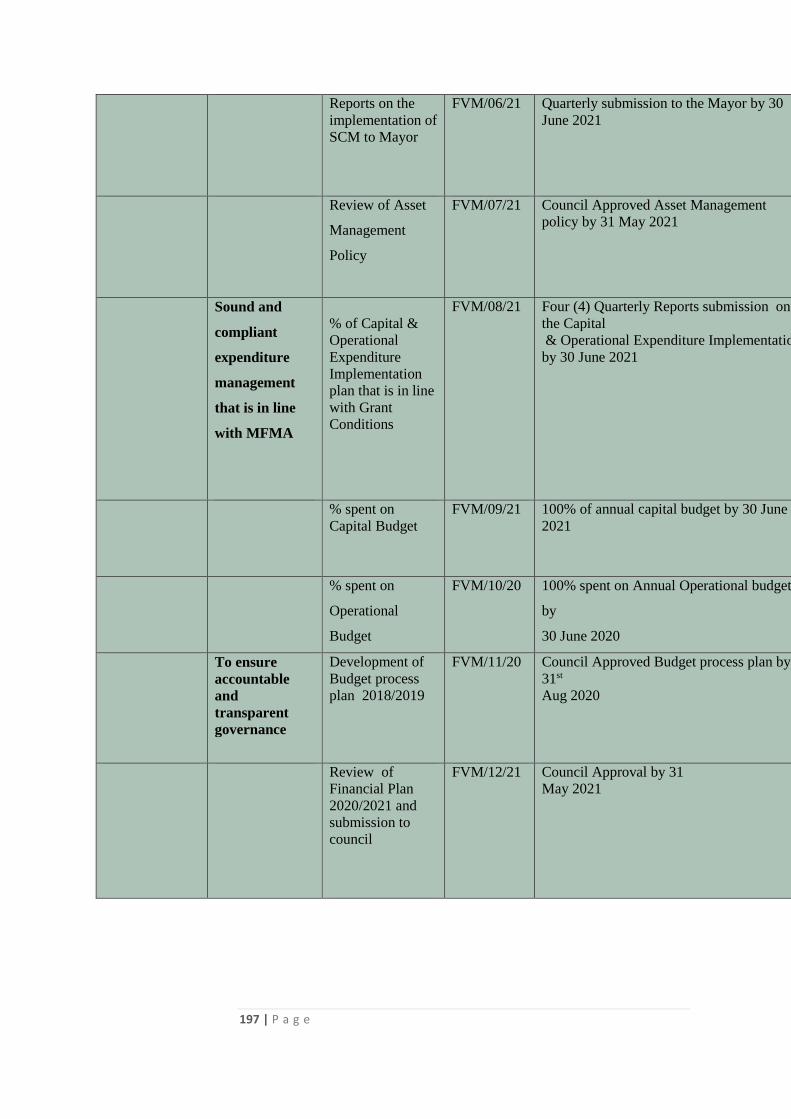
197 | P a g e
Reports on the
implementation of
SCM to Mayor
FVM/06/21 Quarterly submission to the Mayor by 30
June 2021
Review of Asset
Management
Policy
FVM/07/21 Council Approved Asset Management
policy by 31 May 2021
Sound and
compliant
expenditure
management
that is in line
with MFMA
% of Capital &
Operational
Expenditure
Implementation
plan that is in line
with Grant
Conditions
FVM/08/21 Four (4) Quarterly Reports submission on
the Capital
& Operational Expenditure Implementation
by 30 June 2021
% spent on
Capital Budget
FVM/09/21 100% of annual capital budget by 30 June
2021
% spent on
Operational
Budget
FVM/10/20 100% spent on Annual Operational budget
by
30 June 2020
To ensure
accountable
and
transparent
governance
Development of
Budget process
plan 2018/2019
FVM/11/20 Council Approved Budget process plan by
31st
Aug 2020
Review of
Financial Plan
2020/2021 and
submission to
council
FVM/12/21 Council Approval by 31
May 2021
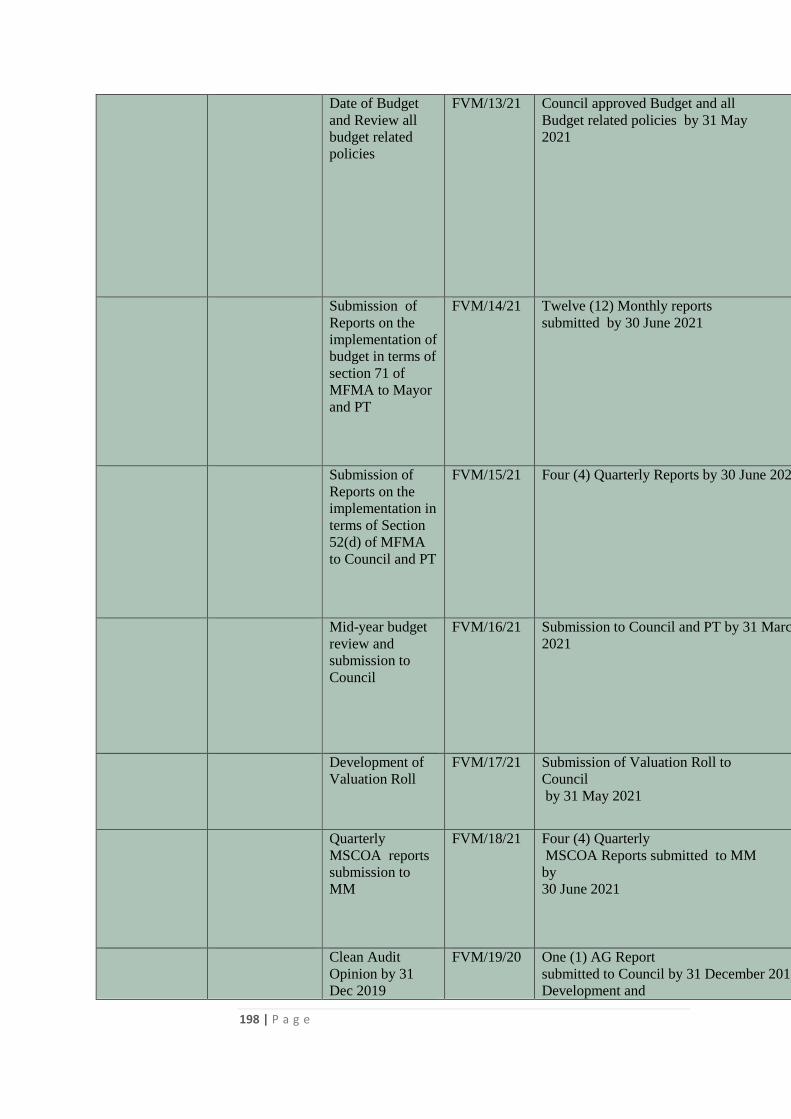
198 | P a g e
Date of Budget
and Review all
budget related
policies
FVM/13/21 Council approved Budget and all
Budget related policies by 31 May
2021
Submission of
Reports on the
implementation of
budget in terms of
section 71 of
MFMA to Mayor
and PT
FVM/14/21 Twelve (12) Monthly reports
submitted by 30 June 2021
Submission of
Reports on the
implementation in
terms of Section
52(d) of MFMA
to Council and PT
FVM/15/21 Four (4) Quarterly Reports by 30 June 2021`
Mid-year budget
review and
submission to
Council
FVM/16/21 Submission to Council and PT by 31 March
2021
Development of
Valuation Roll
FVM/17/21 Submission of Valuation Roll to
Council
by 31 May 2021
Quarterly
MSCOA reports
submission to
MM
FVM/18/21 Four (4) Quarterly
MSCOA Reports submitted to MM
by
30 June 2021
Clean Audit
Opinion by 31
Dec 2019
FVM/19/20 One (1) AG Report
submitted to Council by 31 December 2019
Development and
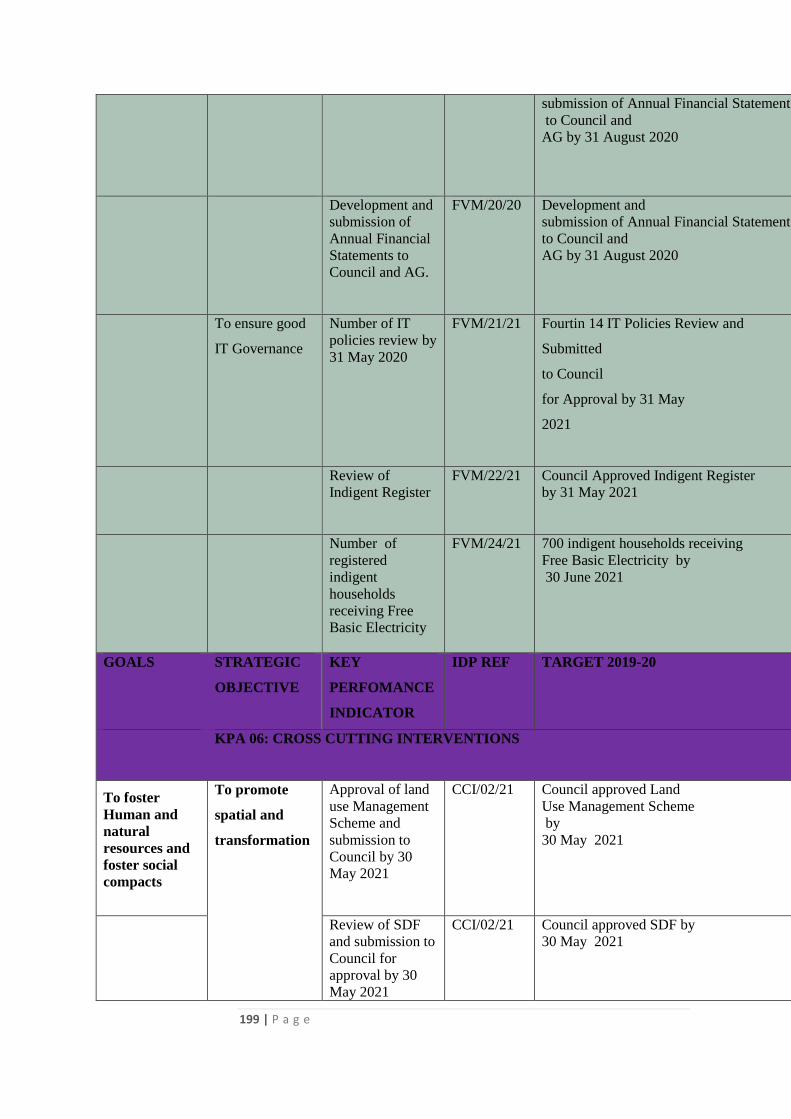
199 | P a g e
submission of Annual Financial Statements
to Council and
AG by 31 August 2020
Development and
submission of
Annual Financial
Statements to
Council and AG.
FVM/20/20 Development and
submission of Annual Financial Statements
to Council and
AG by 31 August 2020
To ensure good
IT Governance
Number of IT
policies review by
31 May 2020
FVM/21/21 Fourtin 14 IT Policies Review and
Submitted
to Council
for Approval by 31 May
2021
Review of
Indigent Register
FVM/22/21 Council Approved Indigent Register
by 31 May 2021
Number of
registered
indigent
households
receiving Free
Basic Electricity
FVM/24/21 700 indigent households receiving
Free Basic Electricity by
30 June 2021
GOALS STRATEGIC
OBJECTIVE
KEY
PERFOMANCE
INDICATOR
IDP REF TARGET 2019-20
KPA 06: CROSS CUTTING INTERVENTIONS
To foster
Human and
natural
resources and
foster social
compacts
To promote
spatial and
transformation
Approval of land
use Management
Scheme and
submission to
Council by 30
May 2021
CCI/02/21 Council approved Land
Use Management Scheme
by
30 May 2021
Review of SDF
and submission to
Council for
approval by 30
May 2021
CCI/02/21 Council approved SDF by
30 May 2021
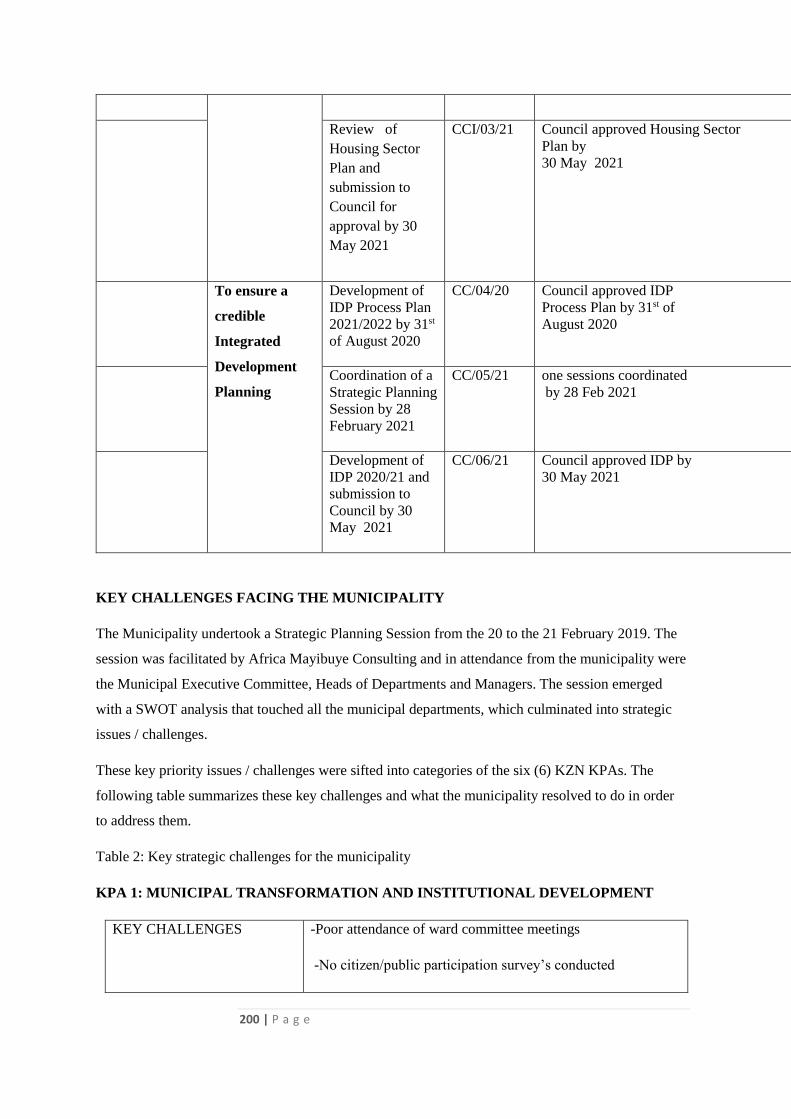
200 | P a g e
Review of
Housing Sector
Plan and
submission to
Council for
approval by 30
May 2021
CCI/03/21 Council approved Housing Sector
Plan by
30 May 2021
To ensure a
credible
Integrated
Development
Planning
Development of
IDP Process Plan
2021/2022 by 31st
of August 2020
CC/04/20 Council approved IDP
Process Plan by 31st of
August 2020
Coordination of a
Strategic Planning
Session by 28
February 2021
CC/05/21 one sessions coordinated
by 28 Feb 2021
Development of
IDP 2020/21 and
submission to
Council by 30
May 2021
CC/06/21 Council approved IDP by
30 May 2021
KEY CHALLENGES FACING THE MUNICIPALITY
The Municipality undertook a Strategic Planning Session from the 20 to the 21 February 2019. The
session was facilitated by Africa Mayibuye Consulting and in attendance from the municipality were
the Municipal Executive Committee, Heads of Departments and Managers. The session emerged
with a SWOT analysis that touched all the municipal departments, which culminated into strategic
issues / challenges.
These key priority issues / challenges were sifted into categories of the six (6) KZN KPAs. The
following table summarizes these key challenges and what the municipality resolved to do in order
to address them.
Table 2: Key strategic challenges for the municipality
KPA 1: MUNICIPAL TRANSFORMATION AND INSTITUTIONAL DEVELOPMENT
KEY CHALLENGES -Poor attendance of ward committee meetings
-No citizen/public participation survey’s conducted
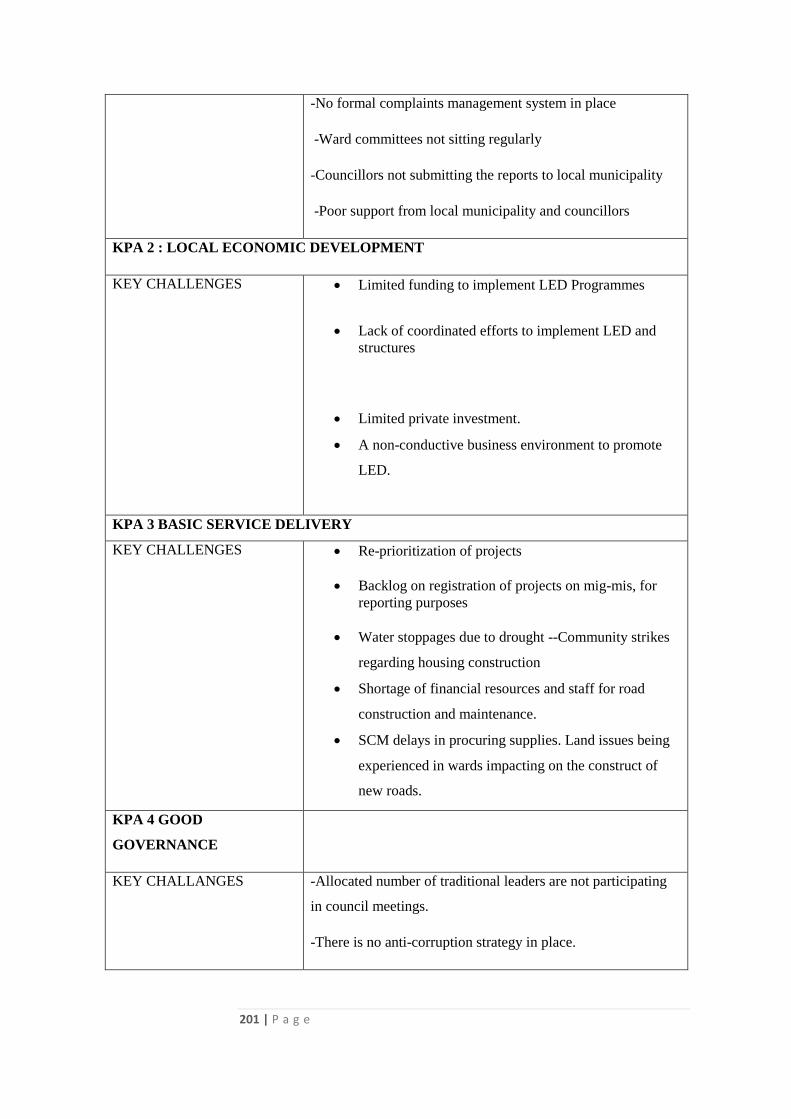
201 | P a g e
-No formal complaints management system in place
-Ward committees not sitting regularly
-Councillors not submitting the reports to local municipality
-Poor support from local municipality and councillors
KPA 2 : LOCAL ECONOMIC DEVELOPMENT
KEY CHALLENGES Limited funding to implement LED Programmes
Lack of coordinated efforts to implement LED and
structures
Limited private investment.
A non-conductive business environment to promote
LED.
KPA 3 BASIC SERVICE DELIVERY
KEY CHALLENGES Re-prioritization of projects
Backlog on registration of projects on mig-mis, for
reporting purposes
Water stoppages due to drought --Community strikes
regarding housing construction
Shortage of financial resources and staff for road
construction and maintenance.
SCM delays in procuring supplies. Land issues being
experienced in wards impacting on the construct of
new roads.
KPA 4 GOOD
GOVERNANCE
KEY CHALLANGES -Allocated number of traditional leaders are not participating
in council meetings.
-There is no anti-corruption strategy in place.
202 | P a g e
- IGR: Lack of attendance by District Municipality at public
report back meeting (water service delivery)
KPA 5 SOUND FINANCIAL
MANAGEMENT
KEY CHALLANGES -Indigent register to be created and maintained.
-Non-payment of services.
-No revenue enhancement strategy.
-Revenue collection rate is below the target.
- Municipality does not have a risk register.
KPA 6 CROSS CUTTING
KEY CHALLANGES
-Environmental Sensitive areas
administrative facilities
-Ageing infrastructure
-Shortage and unavailability of proper jobs.
-Small portion within the municipality as a whole is made up
of rural settlements
-Lack of Skills and internal capacity
-Distance from- major centers increases project cost due to
higher supply-costs
203 | P a g e
V. SECTION E1: STRATEGIC MAPPING
5.3 SPATIAL DEVELOPMENT FRAMEWORK
The Municipal Structures Act (Act No. 23 of 2001) requires that, as part of the IDP, a spatial
development framework needs to be developed which “must include the provision of basic guidelines
for a land use management system for the municipality” (Municipal Structures Act, 2001: Section E).
Hlabisa Municipality has initiated a process towards the formulation of a detailed spatial development
framework (refer to Annexure A). The information included herein will be reviewed and amplified
and refined where necessary.
The aim of the Spatial Development Framework (SDF) is to identify areas suitable for various types
of integrated development in a formalised and extensive manner. Furthermore, a Spatial Development
Framework (SDF) is a sector plan of a municipal IDP (Integrated Development Plan). The SDF is the
visual representation of a municipality’s vision, goals and strategies. As such, it is essentially a
forward planning document that should not only reflect the current reality but also future development
options, i.e. the SDF should be used to guide decision making as well.
Big 5 False Bay and Hlabisa Local Municipality finalized the development of a comprehensive Spatial
Development Framework during the past financial years, The1st review will be done during
2016/2017, which will take cognizance of the imminent merger between Hlabisa and Big 5 False Bay
Municipality.
The SDFs for both municipalities which articulates the broad spatial vision of the municipality,
development corridors and nodes. It also encompasses issues of what environmental sensitivities and
protected area. The SDFs are represented below separately as a comprehensive one for Big 5 Hlabisa
has not been developed as yet.

204 | P a g e
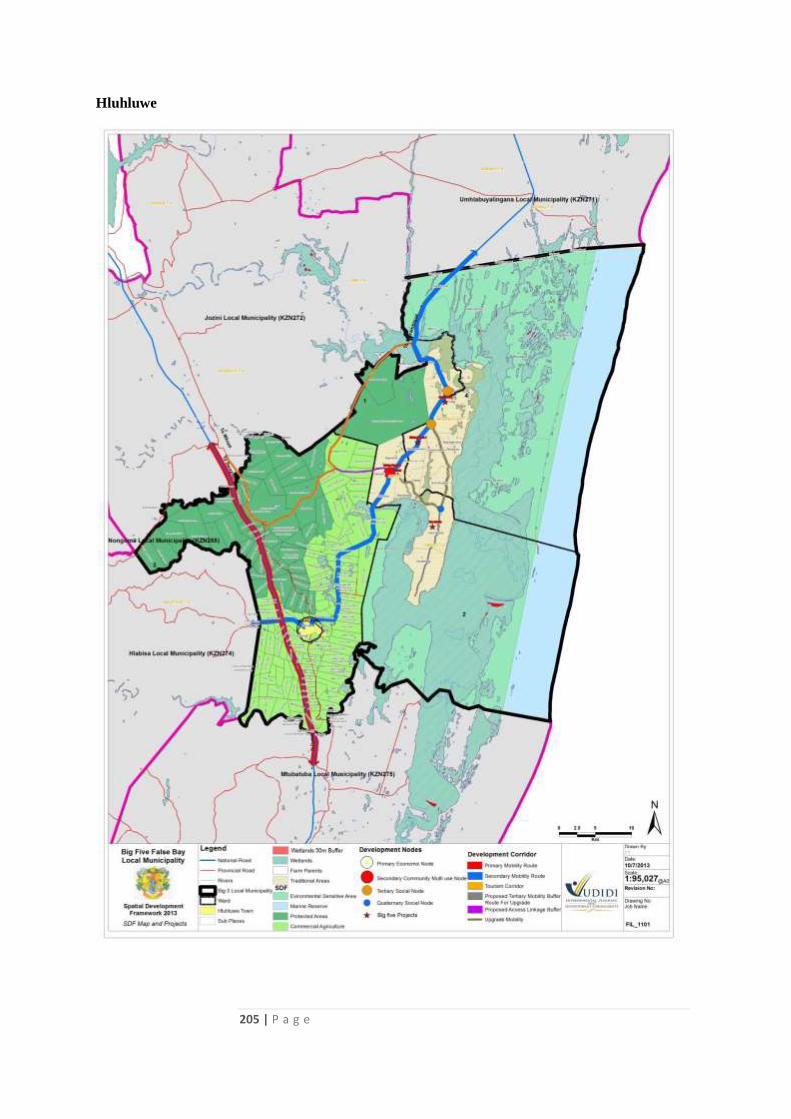
205 | P a g e
Hluhluwe
206 | P a g e
Location
The Big 5 is situated directly north of the Mtubatuba Municipality and it stretches as far north as the
Mkuze game Reserve, with the Hlabisa Municipality comprising its western boundary and the Greater
St Lucia Wetland Park/False Bay Park its eastern boundary. Hluhluwe is accessible from the N2 it is
the main between the KZN Coast Gauteng and Mpumalanga. It traverses the area on the west. The
SDI road to Mbazwana and Manguzi is the main access to the eastern portion of the municipality.
Sandy soil conditions in the Big 5 Hlabisa area complicate access and many roads are not accessible
during the rainy season.
The Big 5 Hlabisa Municipal area can be divided into three distinct portions, namely. The private
game farms, the three tribal authorities and the commercial farm land.
Spatial Development Framework Development
The Big 5 Hlabisa Local Municipality was assisted by the KwaZulu-Natal Department of Co-
Operative Governance and Traditional Affairs (KZNCOGTA) to compiled a detailed Spatial
Development Framework (SDF) that is sustainable, legally, compliant and provides clear guidance for
the development of the land use scheme through the land use framework. As such Big 5 Hlabisa Local
municipality appointed Black Cubans Project Development Company to facilitate this process.
The SDF sets objectives, strategies and policy guidelines, that direct development and development
options to ensure that the envisaged long-term urban and rural structure and target deliverables are
realised.
The SDF complies with the following pieces of legislation:
Municipal Systems Act and the Municipal Planning and Performance Management
Regulations, 2001,
Strategic Environmental Assessment (SEA) Guidelines developed by CSIR,
Provincial Spatial Planning Guidelines, 2009.
Spatial Planning Land Use Management Act 16 of 2013 (SPLUMA)
Kwa - Zulu Planning & Development Act 2008

207 | P a g e
Hluhluwe
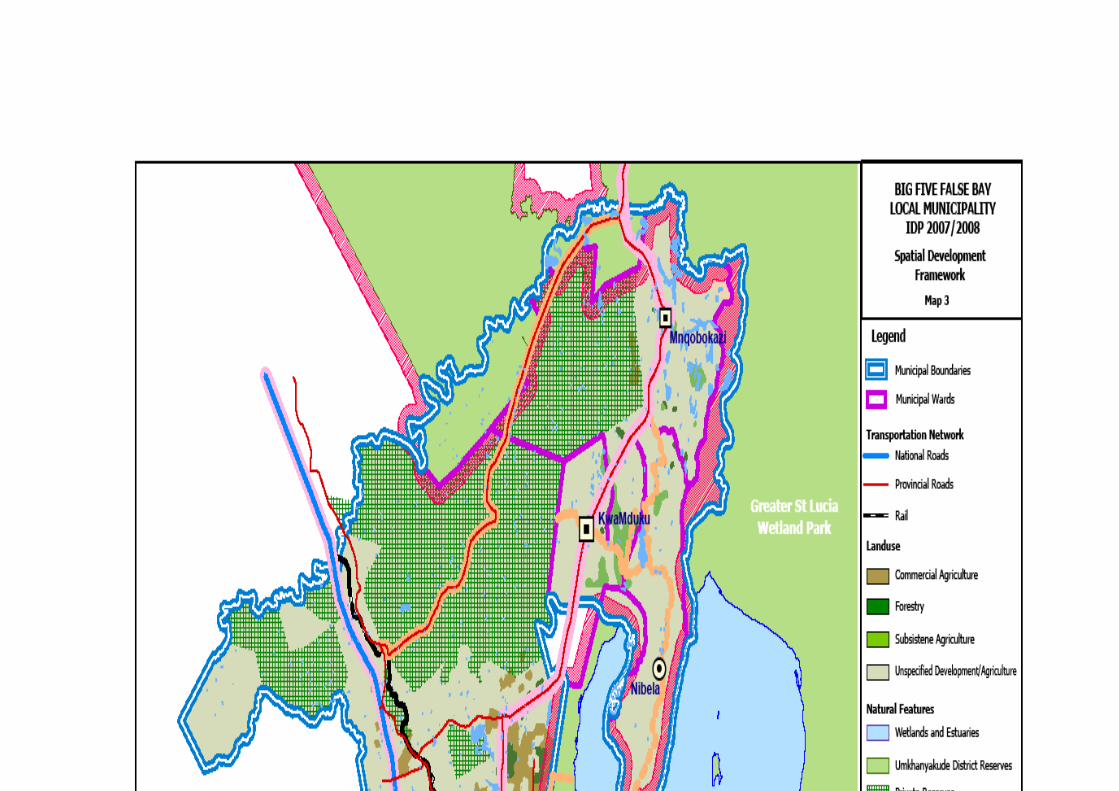
208 | P a g e

209 | P a g e
Hlabisa SDF
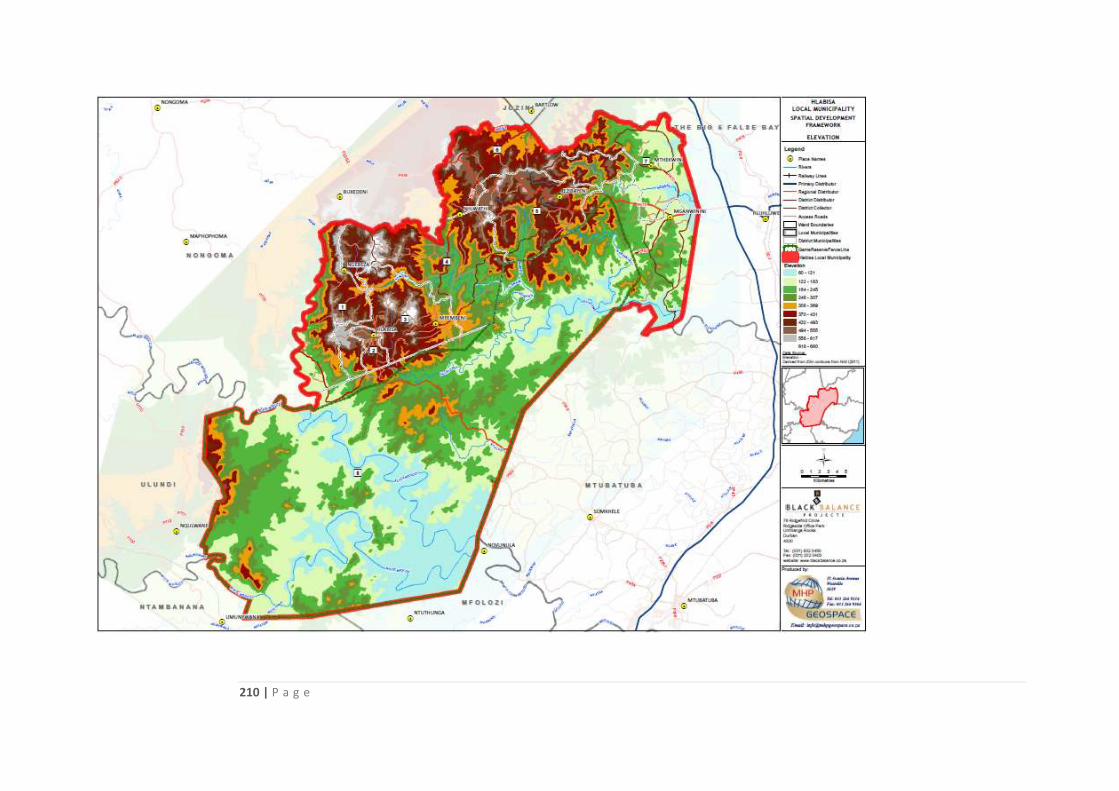
210 | P a g e
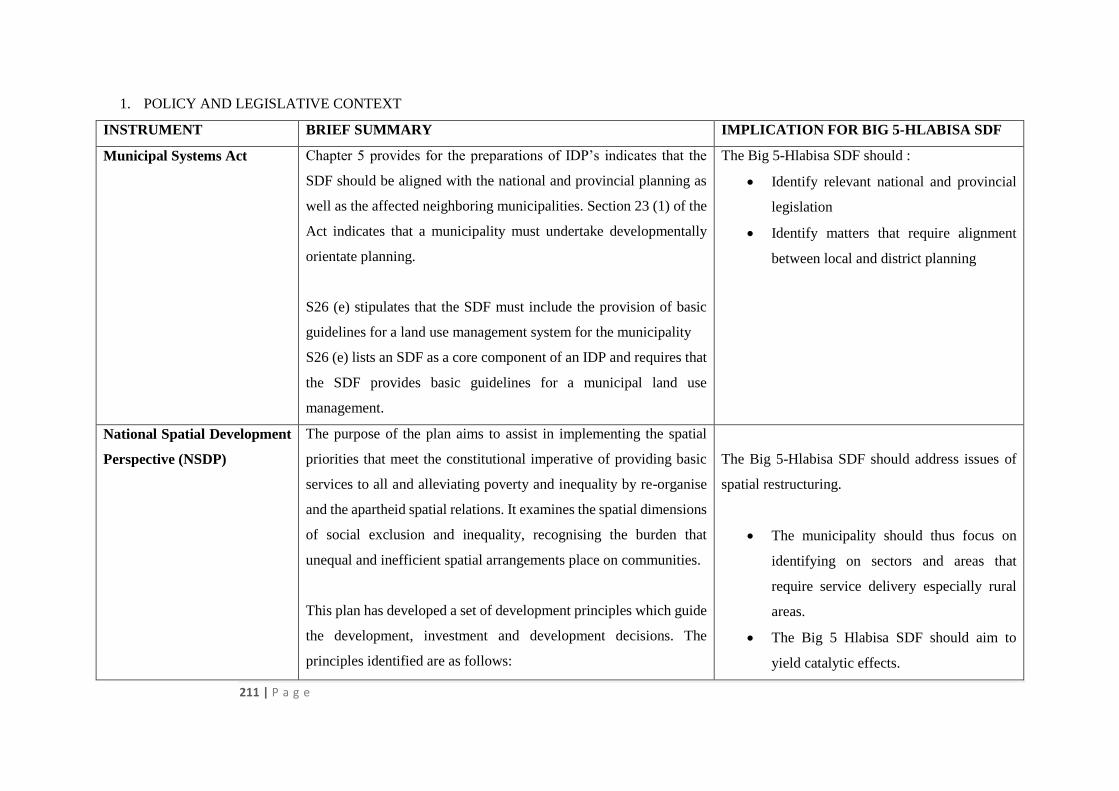
211 | P a g e
1. POLICY AND LEGISLATIVE CONTEXT
INSTRUMENT BRIEF SUMMARY IMPLICATION FOR BIG 5-HLABISA SDF
Municipal Systems Act Chapter 5 provides for the preparations of IDP’s indicates that the
SDF should be aligned with the national and provincial planning as
well as the affected neighboring municipalities. Section 23 (1) of the
Act indicates that a municipality must undertake developmentally
orientate planning.
S26 (e) stipulates that the SDF must include the provision of basic
guidelines for a land use management system for the municipality
S26 (e) lists an SDF as a core component of an IDP and requires that
the SDF provides basic guidelines for a municipal land use
management.
The Big 5-Hlabisa SDF should :
Identify relevant national and provincial
legislation
Identify matters that require alignment
between local and district planning
National Spatial Development
Perspective (NSDP)
The purpose of the plan aims to assist in implementing the spatial
priorities that meet the constitutional imperative of providing basic
services to all and alleviating poverty and inequality by re-organise
and the apartheid spatial relations. It examines the spatial dimensions
of social exclusion and inequality, recognising the burden that
unequal and inefficient spatial arrangements place on communities.
This plan has developed a set of development principles which guide
the development, investment and development decisions. The
principles identified are as follows:
The Big 5-Hlabisa SDF should address issues of
spatial restructuring.
The municipality should thus focus on
identifying on sectors and areas that
require service delivery especially rural
areas.
The Big 5 Hlabisa SDF should aim to
yield catalytic effects.
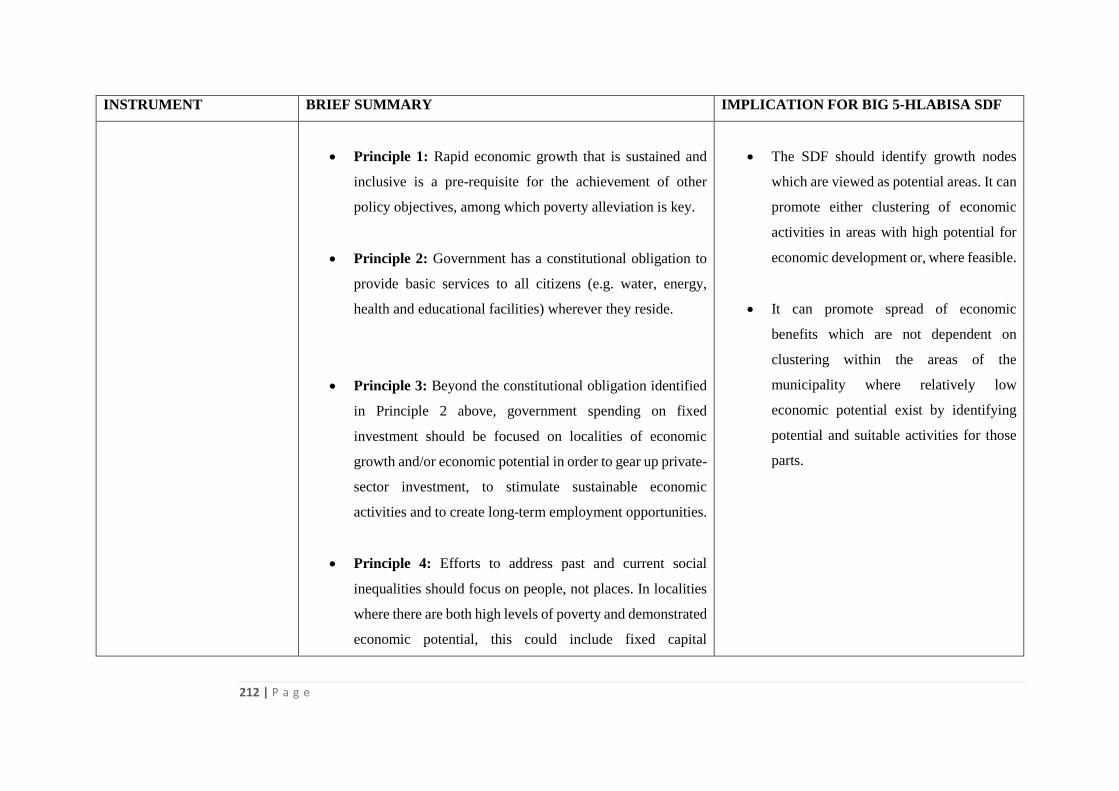
212 | P a g e
INSTRUMENT BRIEF SUMMARY IMPLICATION FOR BIG 5-HLABISA SDF
Principle 1: Rapid economic growth that is sustained and
inclusive is a pre-requisite for the achievement of other
policy objectives, among which poverty alleviation is key.
Principle 2: Government has a constitutional obligation to
provide basic services to all citizens (e.g. water, energy,
health and educational facilities) wherever they reside.
Principle 3: Beyond the constitutional obligation identified
in Principle 2 above, government spending on fixed
investment should be focused on localities of economic
growth and/or economic potential in order to gear up private-
sector investment, to stimulate sustainable economic
activities and to create long-term employment opportunities.
Principle 4: Efforts to address past and current social
inequalities should focus on people, not places. In localities
where there are both high levels of poverty and demonstrated
economic potential, this could include fixed capital
The SDF should identify growth nodes
which are viewed as potential areas. It can
promote either clustering of economic
activities in areas with high potential for
economic development or, where feasible.
It can promote spread of economic
benefits which are not dependent on
clustering within the areas of the
municipality where relatively low
economic potential exist by identifying
potential and suitable activities for those
parts.
213 | P a g e
INSTRUMENT BRIEF SUMMARY IMPLICATION FOR BIG 5-HLABISA SDF
investment beyond basic services to exploit the potential of
those localities.
Principle 5: In In order to overcome the spatial distortions
of apartheid, future settlement and economic development
opportunities should be channeled into activity corridors and
nodes that are adjacent to or that link the main growth centers
These guidelines are regarded or recognized as critical tools for
bringing about coordinated government action and alignment to meet
social, economic and environmental objectives.
Provincial Growth
Development Strategy
(PGDS)
The PGDS aims to build this gateway by growing the economy for
the development and the improvement of the quality of life of all
people living in the Province. Whilst the Provincial Government of
KZN is leading this process, its success depends on strong compacts
with labour, civil society and business. Thus it is critical that all
stakeholders be synchronized in the single-minded pursuit of shifting
KZN’s growth path towards shared growth and integrated,
sustainable development. The strategy indicated strategic goals to be
achieved for the province (See the Strategic Framework )
The adopted vision for the province reads as follows:
The Big 5 Hlabisa should make use of the PGDS
informant’s maps and data available.
The PGDS has made use of the Provincial
SDF, therefore the Big 5 Hlabisa SDF
output should provide similar framework
at a local scale for public and private sector
investment by highlighting areas of
development opportunity.
In that sense, the developed SDF will
structure and develop a sensible
214 | P a g e
INSTRUMENT BRIEF SUMMARY IMPLICATION FOR BIG 5-HLABISA SDF
The “By 2030 KwaZulu-Natal will be a prosperous Province with
a healthy, secure and skilled population, acting as a gateway to
Africa and the World”
The purpose of the PGDS in KwaZulu-Natal is to:
Be the primary growth and development strategy for
KwaZulu-Natal to 2030;
Mobilise and synchronise strategic plans and investment
priorities in all spheres of government, state owned entities,
business, higher education institutions, labour, civil society
and all other social partners in order to achieve the desired
growth and development goals, objectives and outcomes;
Spatially contextualise and prioritise interventions so as to
achieve greater spatial equity;
Develop clearly defined institutional arrangements that
ensure decisive leadership, robust management, thorough
implementation and on-going review of the growth and
development plan.
development that works towards a
common goal and ensure that development
on local level does not take place in an ad
hoc silo on its own.
It also should address key issues of
implementation blockages whilst
providing strategic direction.
It should provide a constructive vision
formulated by relevant stakeholders and
the community in order to achieve
It should identify development corridors
and nodes aligned with the PGDS and
PSEDS development corridors and
activity nodes.
It should address development issues
found in the municipality and achieve
objectives as required by the municipality.
215 | P a g e
INSTRUMENT BRIEF SUMMARY IMPLICATION FOR BIG 5-HLABISA SDF
The strategy further stated that in order for the 2011 KZN PGDS to
deliver on shared growth and integrated, sustainable development
through its interventions, all spheres of government must commit to
the following:
The implementation of catalytic projects and interventions,
Effective participation in the institutional implementation
framework,
The incorporation of the strategic goals and objectives in
their priorities and programmes,
The reporting of progress, and
The provision and allocation of the required support and
resources.
New Growth Path
The New Growth identifies the employment issues as its main focus
point. The development of descent work and improvement and
reducing inequality and defeating poverty has been discovered
through the New Growth Path. The policy then aims to restructure
the South African economy to improve its performance in terms of
labour absorption as well as the composition and rate of growth. The
Government is committed to forging such a consensus and leading
the way by:
The SDF should introduce development projects
which will bring about job opportunities.
The SDF must create and delineate potential areas
for development which attract people to
216 | P a g e
INSTRUMENT BRIEF SUMMARY IMPLICATION FOR BIG 5-HLABISA SDF
National Development Plan
2030
The National Development Plan is a broad strategic framework
which aims to set out a coherent and holistic approach to confronting
poverty and inequality based some of the interlinked priorities on the
following:
Faster and more inclusive economic growth
Building the capabilities
A capable and developmental state
The plan presents a long-term strategy which include but not limited
to the following :
Aims to increase employment and broaden opportunities
through education, vocational training and work experience,
public employment programmes, health and nutrition, public
transport and access to information.
Expand welfare services and public employment schemes,
enabling the state to service and support poor communities,
particularly those with high levels of crime and violence.
Improve the quality of education in underperforming schools
and further education and training colleges.
The Big 5-Hlabisa SDF should consider propose
future development which includes the need for
housing, proper social facilities, proper
infrastructure where it is highly required.
Rural areas in Hluhluwe lack of adequate road
network thus the framework will aim to improve
such development issues by means of introducing
potential corridors and infrastructure projects.
With the substantial focus on job creation and
economic development spatial planners will have
to ensure that adequate space is available to
accommodate the required economic growth. It is
therefore essential to estimate the contributions of
the various sectors and the related space
requirements.
217 | P a g e
INSTRUMENT BRIEF SUMMARY IMPLICATION FOR BIG 5-HLABISA SDF
Promote mixed housing strategies and more compact urban
development to help people access public spaces and
facilities, state agencies, and work and business
opportunities.
Invest in public transport, which will benefit low-income
households by facilitating mobility the plan emphasises the
urgent need to make faster progress on several fronts to
sustainably reduce poverty and inequality.
Spatial Planning Land Use
Management Act 16 of 2013
The act introduces provision to:
• promote a uniform planning and development system
• promote spatial justice, resilience, sustainability and redress
• facilitate spatial alignment and coordination
• provide for the establishment of MPT and other tools
The Municipality must, in order to determine land
use and development applications within its
municipal area, establish a Municipal Planning
Tribunal.
Designate a municipal official to act as an
inspector for the purpose of enforcing the
provisions of the land use scheme and undertake
inspections
Make a determination on the type of Appeal
Authority, which can be, the executive committee
or the executive mayor of the municipality
218 | P a g e
INSTRUMENT BRIEF SUMMARY IMPLICATION FOR BIG 5-HLABISA SDF
Comprehensive Rural
Development Programme
(CRDP)
This framework was approved in 2009 by the Cabinet. The CRDP is
a programme which adopts a participatory community based
planning that is aims at being effective in rural areas to improve rural
development. It aims to respond and addressing poverty and food
insecurities by maximising the use and management of natural
resources to create vibrant, equitable and sustainable rural
communities.
This can be achieved through coordinated and integrated broad-based
agrarian transformation as well as strategic investment in the relevant
economic and social infrastructure to the benefit of all rural
communities and not only those involved in agriculture. The success
of rural development will culminate in sustainable and vibrant rural
communities. Integrated rural development is a concept for planning
and thus a strategy for multi-sectorial and multi-facetted
interventions designed to ensure sustained improvements in the lives
of rural dwellers and rural economies.
Rural development programmes are more effective and with
sustainable impact if implemented in combination with community-
based traditional knowledge. Public participation is therefore a
suitable approach to address rural development issues therefore
The SDF should ensure that the elements of rural
development, sustainability and integration are
taken into account and should also promote
investment in the rural parts of the municipality.
The SDF should aim at promoting public
participation to gain consensus on decision making
regarding the development needs proposed by the
community or municipality in order to achieve a
credible SDF for the municipality.
The SDF should address land reform issues for Big
5-Hlabisa e.g. rural areas which fall under the
Ingonyama Trust, it is therefore required that the
municipality has to liaise with the Ingonyama
Trust Board in order to proclaim the land. PDA
Application for development within these areas
may be required for the purpose of following the
stipulated regulations.
219 | P a g e
INSTRUMENT BRIEF SUMMARY IMPLICATION FOR BIG 5-HLABISA SDF
achieve a successful and acceptable rural development to
communities.
This programme aim to achieve the mandate which was raised by the
Ministry and Department of Rural and Land Reform. The mandate
introduced includes the following:
Intensify the land reform programme to ensure that more
land is made available to the rural poor, while providing them
with technical skills and financial resources to productively
use the land to create sustainable livelihoods and decent work
in rural areas.
Review the appropriateness of the existing land
redistribution programme, introduce measures aimed at
speeding up the pace of land reform and promote land
ownership by South Africans.
Expand the agrarian reform programme, which will focus on
the systematic promotion of agricultural cooperatives
throughout the value chain, including agro-processing in the
agricultural areas.
Support measures will be developed to ensure improved
access to markets and finance by small farmers, including
fencing and irrigation systems.
220 | P a g e
INSTRUMENT BRIEF SUMMARY IMPLICATION FOR BIG 5-HLABISA SDF
Establish a much stronger link between land and agrarian
reform programmes, as well as water resource allocation to
ensure that the best quality of water resources are available
to all our people, especially the poor.
Ensure that all schools and health facilities have access to
basic infrastructure such as water and electricity by 2014.
Introduce the provision of proper sanitation systems in rural
areas.
Strengthen the partnership between government and the
institution of traditional leadership to focus on rural
development and the fight against poverty.
Work together with farming communities to improve the
living conditions of farm dwellers, including the provision of
subsidised houses and other basic services.
The development programme further identifies development
priorities and land reform issues to be addressed for rural
development which include but no limited to the following:
Improved economic infrastructure, social infrastructure,
increasing the pace of land distribution and increasing the
pace of land tenure for rural areas.
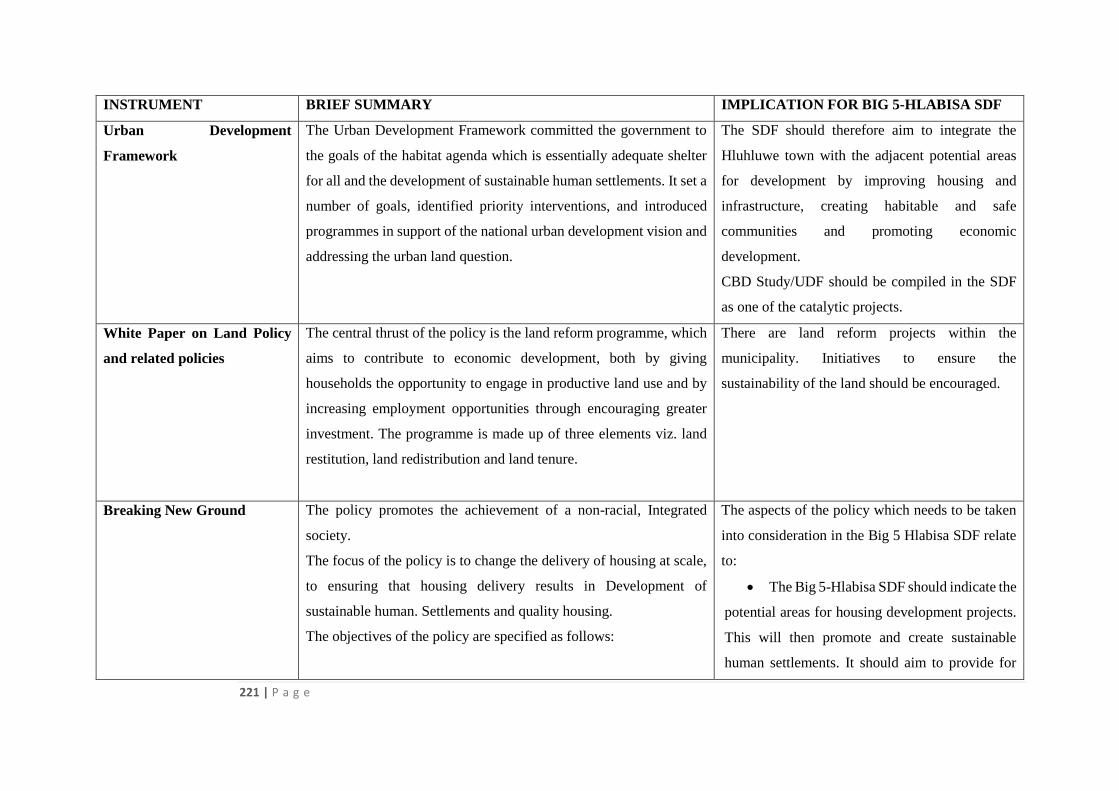
221 | P a g e
INSTRUMENT BRIEF SUMMARY IMPLICATION FOR BIG 5-HLABISA SDF
Urban Development
Framework
The Urban Development Framework committed the government to
the goals of the habitat agenda which is essentially adequate shelter
for all and the development of sustainable human settlements. It set a
number of goals, identified priority interventions, and introduced
programmes in support of the national urban development vision and
addressing the urban land question.
The SDF should therefore aim to integrate the
Hluhluwe town with the adjacent potential areas
for development by improving housing and
infrastructure, creating habitable and safe
communities and promoting economic
development.
CBD Study/UDF should be compiled in the SDF
as one of the catalytic projects.
White Paper on Land Policy
and related policies
The central thrust of the policy is the land reform programme, which
aims to contribute to economic development, both by giving
households the opportunity to engage in productive land use and by
increasing employment opportunities through encouraging greater
investment. The programme is made up of three elements viz. land
restitution, land redistribution and land tenure.
There are land reform projects within the
municipality. Initiatives to ensure the
sustainability of the land should be encouraged.
Breaking New Ground
The policy promotes the achievement of a non-racial, Integrated
society.
The focus of the policy is to change the delivery of housing at scale,
to ensuring that housing delivery results in Development of
sustainable human. Settlements and quality housing.
The objectives of the policy are specified as follows:
The aspects of the policy which needs to be taken
into consideration in the Big 5 Hlabisa SDF relate
to:
The Big 5-Hlabisa SDF should indicate the
potential areas for housing development projects.
This will then promote and create sustainable
human settlements. It should aim to provide for
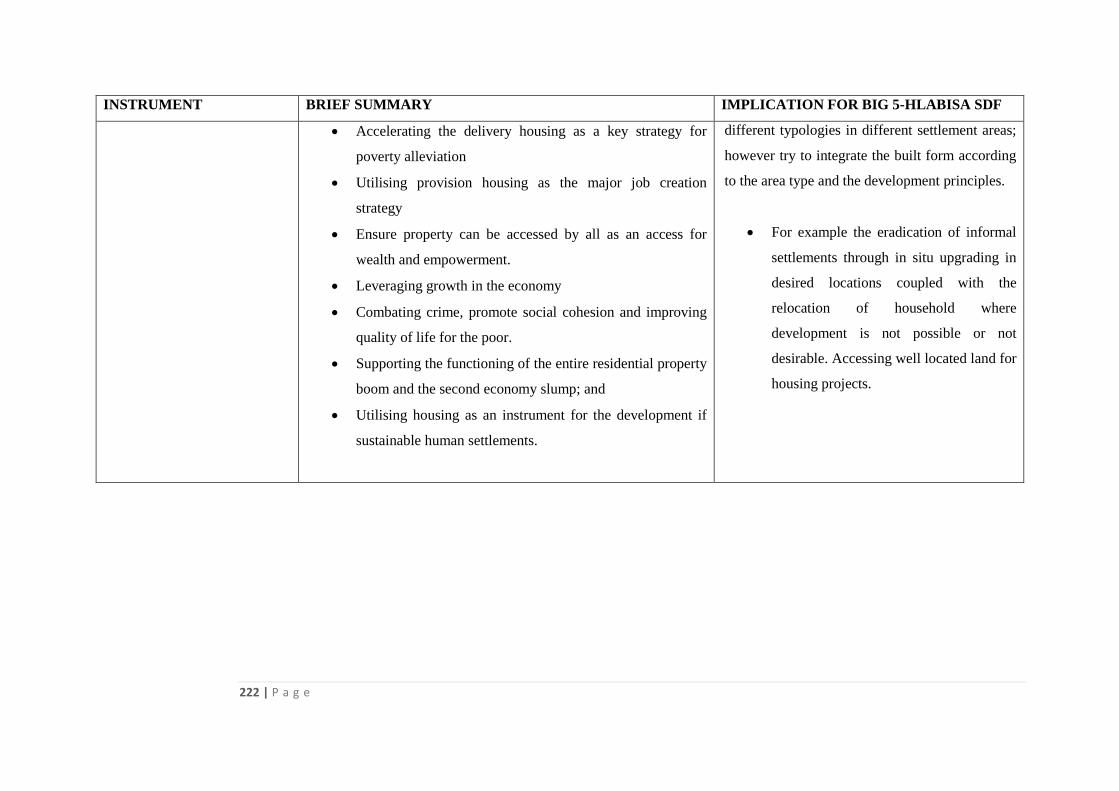
222 | P a g e
INSTRUMENT BRIEF SUMMARY IMPLICATION FOR BIG 5-HLABISA SDF
Accelerating the delivery housing as a key strategy for
poverty alleviation
Utilising provision housing as the major job creation
strategy
Ensure property can be accessed by all as an access for
wealth and empowerment.
Leveraging growth in the economy
Combating crime, promote social cohesion and improving
quality of life for the poor.
Supporting the functioning of the entire residential property
boom and the second economy slump; and
Utilising housing as an instrument for the development if
sustainable human settlements.
different typologies in different settlement areas;
however try to integrate the built form according
to the area type and the development principles.
For example the eradication of informal
settlements through in situ upgrading in
desired locations coupled with the
relocation of household where
development is not possible or not
desirable. Accessing well located land for
housing projects.
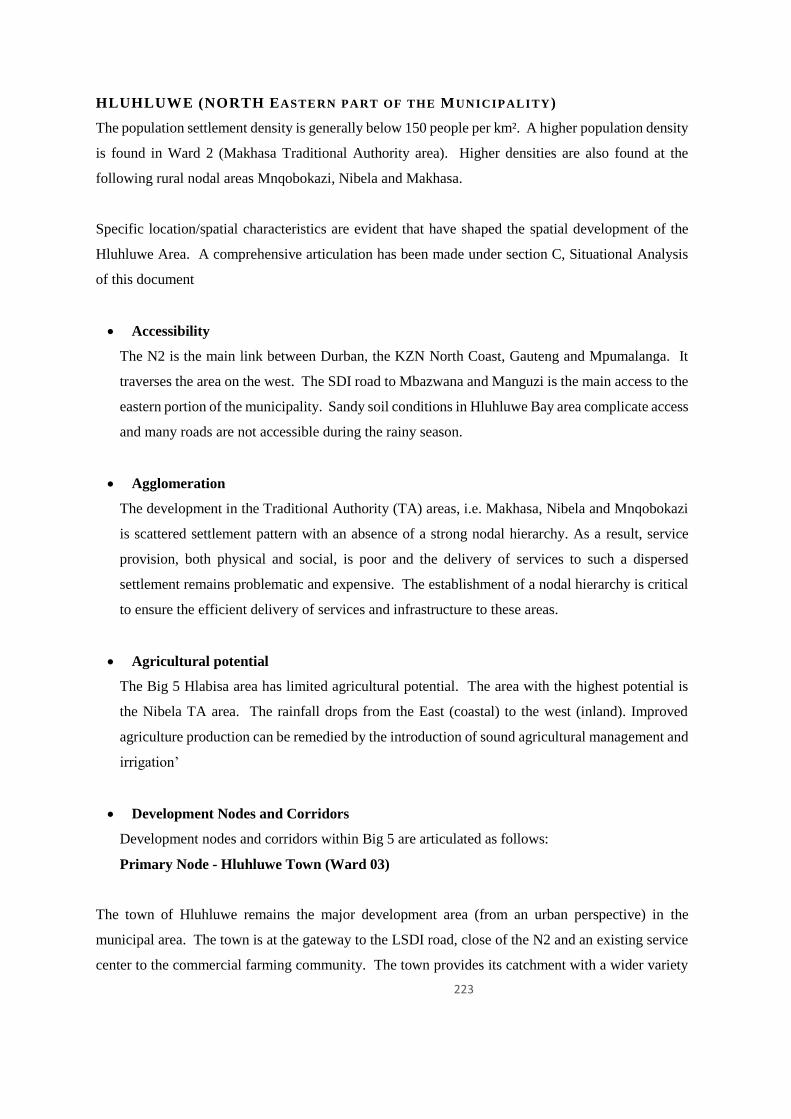
223
HLUHLUWE (NORTH EASTERN PART OF THE MUNICIPALITY)
The population settlement density is generally below 150 people per km². A higher population density
is found in Ward 2 (Makhasa Traditional Authority area). Higher densities are also found at the
following rural nodal areas Mnqobokazi, Nibela and Makhasa.
Specific location/spatial characteristics are evident that have shaped the spatial development of the
Hluhluwe Area. A comprehensive articulation has been made under section C, Situational Analysis
of this document
Accessibility
The N2 is the main link between Durban, the KZN North Coast, Gauteng and Mpumalanga. It
traverses the area on the west. The SDI road to Mbazwana and Manguzi is the main access to the
eastern portion of the municipality. Sandy soil conditions in Hluhluwe Bay area complicate access
and many roads are not accessible during the rainy season.
Agglomeration
The development in the Traditional Authority (TA) areas, i.e. Makhasa, Nibela and Mnqobokazi
is scattered settlement pattern with an absence of a strong nodal hierarchy. As a result, service
provision, both physical and social, is poor and the delivery of services to such a dispersed
settlement remains problematic and expensive. The establishment of a nodal hierarchy is critical
to ensure the efficient delivery of services and infrastructure to these areas.
Agricultural potential
The Big 5 Hlabisa area has limited agricultural potential. The area with the highest potential is
the Nibela TA area. The rainfall drops from the East (coastal) to the west (inland). Improved
agriculture production can be remedied by the introduction of sound agricultural management and
irrigation’
Development Nodes and Corridors
Development nodes and corridors within Big 5 are articulated as follows:
Primary Node - Hluhluwe Town (Ward 03)
The town of Hluhluwe remains the major development area (from an urban perspective) in the
municipal area. The town is at the gateway to the LSDI road, close of the N2 and an existing service
center to the commercial farming community. The town provides its catchment with a wider variety
224 |
P a g e
of social and administrative services as well as community facilities than the other urban nodes in the
municipality. From a spatial development perspective, development in and around the town of
Hluhluwe should focus on infill and densification, thereby ensuring the maximum use of infrastructure
and services. It is also important that critical maintenance to the town’s infrastructure is done to ensure
it maintains its important development role.
Secondary Node – Makhasa (Ward 02)
The Makhasa Rural Node is the major economic (from a commercial and value adding perspective)
and social node in the rural areas of the municipality. It is classified as such given its locality on the
LSDI road and the fact that access to both the Nibela Peninsula and the Phinda Game Reserve is gained
from it. There already a number of developments in the node with a major sport stadium being
developed. There is also increasing pressure for the further development of the node as its economic
and social role is recognized by the community and investors alike. As such, it is imperative that a
framework for the development of the Makhasa Node be prepared in the short term to ensure the
orderly (and sustainable) development of the node. This framework plan will also have to provide
guidelines in terms of access to developments adjoining the LSDI road.
225 |
P a g e
Tertiary Node - Mnqobokazi (Ward 01)
The Mnqobokazi Rural Node is the minor economic (commercial and value adding) and social node
in the municipality. It has similar characteristics than the Makhasa Node but does not have the same
development pressure and extent. It is also located along the LSDI road but is not at such an important
intersection of the Makhasa Node. While the development of a framework for the node is also
important it should follow the Makhasa node framework. As with the Makhasa Node, the node has a
large catchment community that relies on the social services accessible at the node
Tertiary Node Nibela (Ward 04)
With regard to the nodal development of Nibela it is important to recognize that, although many people
live in the area, the area is more isolated (in terms of access) than the economic and social nodes.
However, the area has significant tourism development potential. As such, the Nibela node is
classified as a social and tourism node. The node has a definite role to provide social services to the
community while it is likely that only limited economic activity would be sustainable in the node given
its location. At present, a process is underway to investigate and propose delineation for the node
along with land use management guidelines.
The SDF for the municipality, as a forward planning document, is informed by a number of current
trends as well as the municipal strategic focus areas. The strategic focus areas of the municipality that
have an impact that can be affected and presented spatially are depicted hereunder:
To create an enabling environment for effective service delivery
To actively pursue social and economic development
To maintain a strong environmental focus
The SDF for Big 5 Hlabisa is based on land use and natural features (as well as existing community
facilities), the transportation network and nodes, i.e. areas of development or investment. Future
development proposals around these are informed by the strategic focus areas listed above
Land uses and natural features in and adjoining the municipal area that are significant from a spatial
development perspective are the Greater St Lucia Wetland Park, Private Game Reserves as well as
District Reserves ( Umkhanyakude DMA).
226 |
P a g e
The population density map shows that the areas listed above have very low population densities as
well. The distribution of community facilities (namely schools and clinics) clearly follows the areas
of highest population density and is not located in these areas of environmental significance. From a
spatial development perspective these areas are protected by way of an Interface Area that buffers the
areas of environmental significance from extensive development intrusion. Rather, limited agriculture
and eco-tourism is suggested to be undertaken in these interface areas.
With regard to the Transportation Network the SDF does not indicate corridors but rather transport
routes with a distinction between the types of transport network. Thus, there is caution not to identify
corridors that may be perceived to be promoting ribbon development. The following type of transport
routes are identified in the SDF
The N2 and the LSDI Road are national roads. They present the municipal area with development
potential in that they provide access to areas with development potential by way of other non-
national roads that intersect with them. Access off these roads is not readily attained /permissible.
The N2 in particular (and the LSDI road to a smaller degree) carries larger volumes of traffic than
the other roads through the municipal area at higher traveling speeds. As such, the N2 and the
LSDI are classified in terms of the SDF as Main Transport Routes. Importantly, these routes have
limitations on the distance (not only access) of development from them by way of road building
lines. These have to be abided by for safety purposes and the fact the infrastructure services are
in the road reserve of the LSDI road in particular.
There are a number of Tourism Routes identified in the SDF as well.
The first one is the P466. It primarily provides access to the various private game reserves
located in the northern portion of the municipal area between the N2 and the LSDI road.
This area described above is referred to as a “Management Area” in the draft rural LUMS.
A variety of tourism and recreational related activities take place in this area that need to
be managed in terms of the appropriate legislation.
The R22 route is a gateway route for Hluhluwe and a tourism corridor
227 |
P a g e
Secondly, the route from Hluhluwe in a westerly direction, across the N2, towards the
northern entrance of the Hluhluwe Umfolozi Game Reserve is proposed as a tourism route
in the SDF. A portion of this route is the entrance into Hluhluwe town from the N2.
The circular route that provides access to the False Bay and numerous private resorts to
the west of Lake St Lucia is also a very important tourism route in the SDF.
A further route that is considered to be a tourism route is the route that provides access
from Makhasa to Nibela (in a south easterly direction) and towards Mnqobokazi in the
north. It is the proximity of the area that is served by this route to Lake St Lucia and the
Greater St Lucia Wetland Park that has contributed to is proposed tourism route status.
The area referred to has inherent tourism potential.
Access to the various private game reserves is also gained from Makhasa in a westerly
direction as shown on the SDF map as well.
I. HLABISA AREA
The following nodal hierachy is proposed to be implemented in the Hlabisa Municipality. The nodes
and their functions are mentioned here whilst the proposed spatial development of the nodes are
discussed as part of future land Uses.
Nodal Development Classification
Primary Development Nodes
The study also identified the following complex consisting of the following areas as the primary
development nodes in Hlabisa:
Hlabisa
The main economic centre of the Municipality. With a densely populated residential area on the
southern and south easter parts of the Municipality.
The following interventions/developments are envisaged within this node:
– Low Intensity Industrial development based on local manufacturing skills as proposed in the
LED Strategy;
– Commercial Development;
– Decentralization point for local adminitration of provincial and local government services;
– Higher order social and commercial services;
228 |
P a g e
– Integration with major urban centres
– Housing development
Secondary Development Nodes/Services Centres
The following areas were identified as secondary development nodes, based on the presence of large
population densities, and servises delivered via the present of government departments. These
localities have existing social infrastructure that consist of primarily of education facilities or clinics,
which are unfortunalely not always linked to the Traditional Courts in the area.
Secondary Nodal Devlopments
Node Nodal Development
Mpembeni Mpembeni serves a large (but dispersed) community to
the east of Hlabisa Town. This Node houses the
Mpembeni Taditional Court situated there and therefore
this node serves as the Seat of the Mpembeni Area.
Subsequently this is a central and well place3d area for
the provision and distribution of social infrasturcture to
the Mpembeni Community
Ezibayeni Ezibayeni is the largest of the two nodes serving the
eastern part of the Municipality. This note also houses the
Traditional Office of the Mdletshe Traditional Council,
and is cetrally situated to disseminate social services to
the surrounding
The following interventions/developments are envisaged within this node:
– Provision of social infrastructure to communities
– Limited commercial development to serve in needs of communities being serviced
– Decentralization point for local administration of provincial and local government services
Tertiary Development Nodes
Tertiary nodes are the second lowest order nodes which may develop a nucleus and emerge into higher
order nodes over time. A range of services for local communities could be concentrated within these
nodes in a sustainable way. In identifying suitable/optimal locations. These include, amonst other
factore:
229 |
P a g e
– Density and distributed of population to be served
– Level of existing economic activity
– Proximity of transport routes and modes of transport
– Topography of locality
– Land Tenure arrangements
– Level of service infrastructure
The following nodes were identified as tertiary nodes:
– Ngebeza
– Nhlwathi
– Mthekwini
– Mganwini
Rural Settlement Clusters
Rural Clusters are the lowest order nodes found within the Municipality. High level services cannot
be provided cost-effectively within these areas and initiatives will be aimed at basic service delivery.
Intended Future Land Uses
The table below depicts the land use topics that are discussed and which land use categories are
proposed for each of the nodes. Detail is given in the section below.
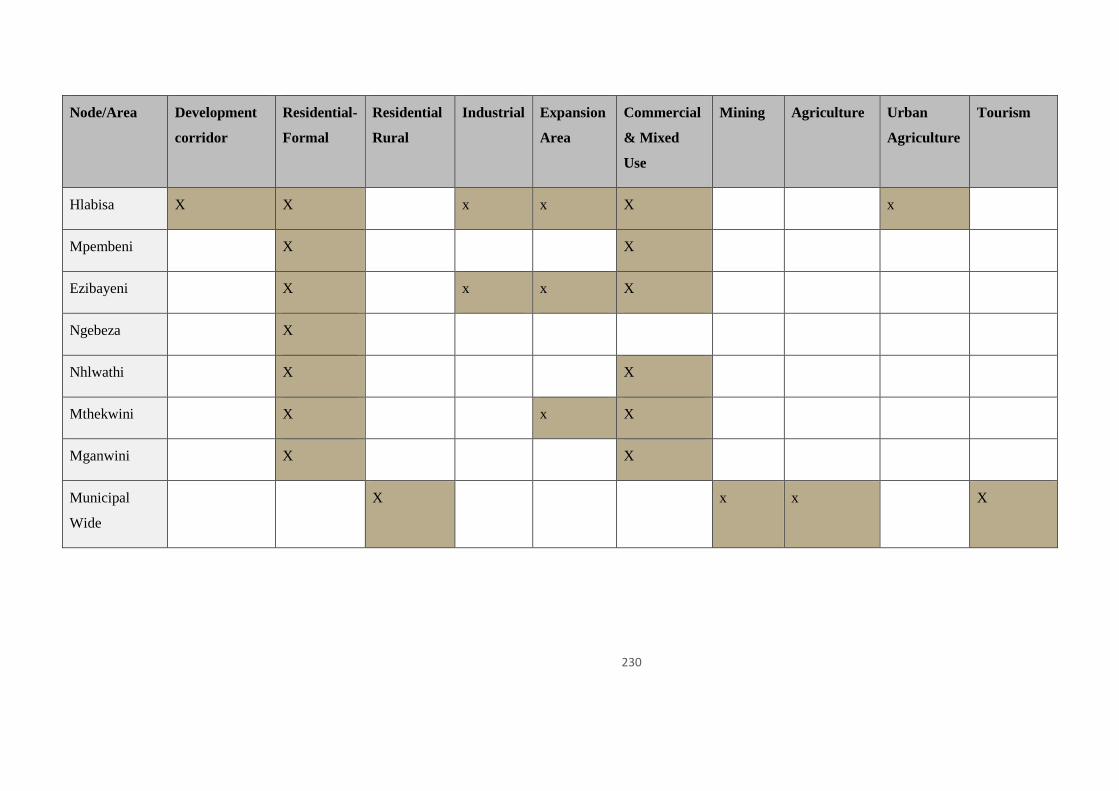
230
Node/Area Development
corridor
Residential-
Formal
Residential
Rural
Industrial Expansion
Area
Commercial
& Mixed
Use
Mining Agriculture Urban
Agriculture
Tourism
Hlabisa X X x x X x
Mpembeni X X
Ezibayeni X x x X
Ngebeza X
Nhlwathi X X
Mthekwini X x X
Mganwini X X
Municipal
Wide
X x x X
231 |
P a g e
5.4 ENVIRONMENTAL SENSITIVE AREAS
The municipal area contains sites of environmental sensitivity which should be afforded protection so
as to be preserved for future generations. The municipality’s IDP recognizes the importance of these
areas and the adoption of the LUMS for the municipality will identify priority areas for management
and types of development and will suggest appropriate management techniques to ensure that these
assets are not undermined during development. In this regard the areas identified by KZN Wildlife as
mandatory reserves need to be protected from developments which may have a negative impact as it
contains flora and fauna which are found/breed only in these areas.
In addition uMkhanyakude District Municipality’s (UDM) and the KwaZulu-Natal Department of
Agriculture, Environmental Affairs and Rural Development (DAEARD) embarked on a process to
develop an Environmental Management Framework (EMF) for the district. Nemai Consulting was
appointed to prepare the uMkhanyakude EMF. The projects were successfully done and seek to ensure
that issues of environmental management are considered and any development happening in the
district does compromise development of future generations
According to the EMF Regulations (Government Notice No. R547 of 18 June 2010), an EMF is a
study of the biophysical and socio-cultural systems of a geographically defined area to reveal where
specific land uses may best be practiced and to offer performance standards for maintaining
appropriate use of such land.
An EMF includes a framework of spatially represented information connected to significant
environmental (i.e. ecological, social and economic) parameters, such as ecology, hydrology,
infrastructure and services. A key function of an EMF is to proactively identify areas of potential
conflict between development proposals and critical/sensitive environments (DEAT, 1998).
232
VI. SECTION E2: IMPLEMEMENTATION PLAN
THE SERVICE DELIVERY AND BUDGET IMPLEMENTATION PLAN (PLAN
2020/2021(SDBIP)
Introduction
The Service Delivery and Budget Implementation Plan (SDBIP) is prepared in terms of the
Municipal Finance Management Act (MFMA), section 53. The SDBIP gives effect to the Integrated
Development Plan (IDP) and budget of the municipality and will be possible if the IDP and budget
are fully aligned with each other, as required by the MFMA. The budget gives effect to the strategic
priorities of the municipality and is not a management or implementation plan. The SDBIP therefore
serves as a “contract” between the administration, council and community expressing the goals and
objectives set by the council as quantifiable outcomes that can be implemented by the administration
over the next twelve months. This provides the basis for measuring performance in service delivery
against end of-year targets and implementing the budget.
The SDBIP provides the vital link between the mayor, council (executive) and the administration, and
facilitates the process for holding management accountable for its performance. The SDBIP is a
management, implementation and monitoring tool that will assist the mayor, councillors, municipal
manager, senior managers and community. A properly formulated SDBIP will ensure that appropriate
information is circulated internally and externally for purposes of monitoring the execution of the
budget, performance of senior management and achievement of the strategic objectives set by council.
It enables the municipal manager to monitor the performance of senior managers, the mayor to monitor
the performance of the municipal manager, and for the community to monitor the performance of the
municipality.
The SDBIP should therefore determine (and be consistent with) the performance agreements between
the mayor and the municipal manager and the municipal manager and senior managers determined at
the start of every financial year and approved by the mayor. It must also be consistent with outsourced
service delivery agreements such as municipal entities, public-private partnerships, service contracts
and the like.
233 |
P a g e
2020/2021
FINANCIAL PLAN
1. FINANCIAL PLAN
1.1. PURPOSE
The purpose of this document is to outline the comprehensive multi-year financial plan that
will ensure long-term financial sustainability for the Municipality.
A multi-year financial plan is essential to ensure that the Municipality continues to implement
its mandate effectively without impairing its capital base. It will also enable the Municipality
to move towards self-sufficiency in meeting the growing demands of service delivery.
The focus here is to outline the role forecasting as a critical tool of local government finance
and to provide guidelines to strengthen local public finances in improving the financial
management. In particular, proper financial management must: adequately control the total
level of revenue and expenditure, appropriately allocate public resources among functional
areas and programs, and, ensure that departments operate as efficiently as possible. This Plan
is prepared in terms of section 26(h) of the Local Government Municipal Systems Act, as
amended, which stipulates that municipalities must prepare a financial plan as part of their
Integrated Development Plan. The three-year Financial Plan includes an operating Budget and
Capital budget, informed by the IDP priorities. It takes into account the key performance areas
of the IDP. All programmes contained in the budget are reflected in the IDP. The key benefit
of financial planning and budgeting is that it gives stakeholders the opportunity to stand back
and review their organizational performance and the factors affecting operational
requirements.
These can include:
Greater ability to make continuous improvements and anticipate problems
Sound financial information on which to base decisions
Improved clarity and focus
A greater confidence in your decision making
In contrast with accounting records, which are retrospective, a financial planning or in simple
terms budgeting is generally a projection of future revenues and expenditures. At a minimum,
a financial plan is used to control financial transactions as well as a management and planning
tool. Because local government provides services, forecasts are needed to plan for and control
the receipt and expenditure of monies to meet these ends.
1.2. BACKGROUND
234 |
P a g e
A financial plan is prepared and considers for a period of at least three years with specific
reference to the year being budgeted for, however it is preferred that it should be for over a
period of five or more years.
A multi-year financial plan is prepared to ensure financial sustainability of the Municipality,
paying particular attention to the Municipality’s infrastructure requirements.
It is also an important component of the Municipality’s Integrated Development Plan.
A prudent multi-year financial plan identifies and prioritizes expected needs based on the
Municipality’s Five-year Integrated Development Plan and details estimated amounts of
funding from various sources
The multi-year financial plan will also ensure that the Municipality has greater financial health
and sustainability, making it easier to collaborate on projects with other levels of government
and various public and private stakeholders. This will further enhance the ability of the
Municipality to have access to more financing, funding and grants.
Municipalities require access to adequate resources and budgetary powers to fulfil their
assigned functions. Municipalities need to have access to adequate sources of revenue – either
own resources or intergovernmental transfers – to enable them to carry out the functions that
have been assigned to them. Municipalities should be encouraged to fully exploit these sources
of revenue to allow for realistic planning and should ensure efficient allocation of these
financial resources. The rural nature of the Municipality and the fact that 95% of all land are
under Tribal Management have a serious impact on the revenue base. Tribal land is exempted
from property rates with the effect that the Councils revenue collected from property rates are
very limited.
Linking the IDP and the Budget
The general principle in constructing a municipal budget is that the developmental policy
proposals that are contained in the IDP of the Municipality must be costed and budgeted for.
Having looked at the Municipality’s IDP, you may want to verify whether priority issues have
also been budgeted for in alignment with the IDP documentation. This information should, at
least to some extent, be found in the Municipality’s budget.
Alignment for the capital budget to the IDP occurred mostly at a project level and not
necessarily at a strategic level. Having undertaken an assessment of spending patterns against
IDP Priorities, it was found that the IDP and the Budget (Operating and capital) is actually
more aligned to the IDP than originally expected. But, the allocation of the budget (operating
and capital), is something that need to be addressed through the development of a
prioritization/allocation model against IDP priorities aligned to financial strategies.
1.3. FINANCIAL STRATEGY FRAMEWORK
Big 5 Hlabisa Municipality is striving for service delivery excellence. The Municipality is
facing many challenges with regards to finances.
The priority for the Municipality, from the financial perspective is to ensure viability and
sustainability of the Municipality. The multi-year financial plan and related strategies will
235 |
P a g e
therefore need to address a number of key areas in order to achieve this priority. These
strategies are detailed below:
1.3.1 Revenue Enhancement Strategy
To seek alternative sources of funding;
Expand income base through implementation of new valuation roll;
The ability of the community to pay for services;
Identification and pursuance of government grants;
Tightening credit control measures and debt collection targets;
Improve customer relations and promote a culture of payment;
Realistic revenue estimates;
The impact of inflation, the municipal cost index and other cost increases; and
The creation of an environment which enhances growth, development and service
delivery.
1.3.2 Asset Management Strategy
The implementation of a GRAP compliant asset management system;
Adequate budget provision for asset maintenance over their economic lifespan;
Maintenance of asset according to an infrastructural asset maintenance plan;
Maintain a system of internal control of assets to safeguard assets; and
Ensure all assets owned and/or controlled except specific exclusions are covered by
insurance.
1.3.3 Financial Management Strategies
To maintain an effective system of expenditure control including procedures for the
approval, authorization, withdrawal and payment of funds;
Preparation of the risk register and application of risk control;
Implement controls, procedures, policies and by-laws to regulate fair, just and transparent
transactions;
Continuous training and development of senior and all financial staff to comply with
prescribed minimum competency levels;
Other continuous training and development for all financial staff to develop staff from
time to time;
Implement GRAP standards as gazette by National Treasury; and
Prepare annual financial statements timeously and review performance and achievements
for past financial years.
1.3.4 Operational Financing Strategies
Effective cash flow management to ensure continuous, sufficient and sustainable cash
position;
Enhance budgetary controls and financial reporting;
Direct available financial resources towards meeting the projects as identified in the IDP;
To improve Supply Chain Management processes in line with regulations.; and
236 |
P a g e
Conservative spending patterns that are in line with cost containment measures and
circulars issued by Treasuries from time to time and expenditure management.
1.3.5 Capital Financing Strategies
Ensure service delivery needs are in line with multi-year financial plan;
Careful consideration/prioritization on utilizing available resources in line with the IDP;
Analyse feasibility and impact on operating budget before capital projects are approved;
Determine affordable limits for borrowing;
Source external funding in accordance with affordability;
Improve capital budget spending to achieve full spending; and
Maximizing of infrastructural development through the utilisation of all available
resources.
1.3.6 Cost-Effective Strategy
Invest surplus cash not immediately required at the best available rates;
Restrict capital and operating expenditure increases in relation to the inflation rate taking
into consideration the macro economic growth limit guideline and municipal cost
increases.
To remain as far as possible within the following selected key budget assumptions:
Provision of bad debts;
Overall cost escalation to be linked to the average inflation rate;
Tariff increases to be in line with inflation plus municipal growth except when
regulated;
Reasonable budget maintenance of Municipal assets;
1.3.7 Measurable Performance Objectives for Revenue
To maintain the debtors to revenue ratio below 10%;
To maintain a debtor’s payment ratio of at least 70%;
To ensure that the debtors return remain under 60 days;
It should also be noted that the National state of disaster declared by RSA President in March 2020
following COVID-19 will have a negative impact on the payment of services by Municipal customers
and realizing the rates indicated above might not be feasible as it was previously.
1.4 Financial Management Policies
The purpose of financial policies is to provide a sound environment to manage the financial
affairs of the Municipality. The following are key budget related policies:
1.4.1 Tariff Policy – the policy prescribes the procedures for calculating tariffs. This policy is
required in terms of Section 74 of the Local Government Municipal System Act, Act 32 of
2000;
Status: working on the 2020/2021
237 |
P a g e
1.4.2 Rates Policy – a policy required by the Municipal Property Rates Act, Act 6 of 2004. This
policy provides the framework for the determination of rates;this has been implemented with
the Municipal Property Rates Act with effect from 1 July 2009. Policy has to be reviewed
annually when the draft budget is submitted. Status: working on the 2020/2021
1.4.3 Indigent Support Policy – The criterion for benefits under this scheme is part of the credit
control policy. An indigent is kept up to date in a form of a monthly register and a separate
indigent policy has been developed in line with this. The survey forms to qualify for the
indigent support must be completed annually. The Municipality may annually as part of its
budgetary process, determine the municipal services and levels thereof which will be
subsidized in respect of indigent customers in accordance with the national policy but subject
to principles of sustainability and affordability. An indigent customer shall automatically be
deregistered if an audit or verification concludes that the financial circumstances of the
indigent customer have changed to the extent that he/she no longer meets the qualifications.
The indigent customer may at any time request de-registration. This category might increase
during 2020/2021 financial as a result of COVID-19 pandemic job losses.
Status: working on the 2020/2021
1.4.4 Budget Policy – The annual budget is the central financial planning document that entails all
revenue and expenditure decisions. It establishes the level of services to be provided by each
department. The accounting officer confirms the municipal’s priorities in the formulation of
the draft and the final budget document proposal. A budget, as per S71 of the MFMA, is
subject to monthly control and be reported to Council with recommendations of action to be
taken to achieve the budget’s goals. The budget is also subject to a mid-term review which
might result in a revised budget, thereby resulting in the adjustments budget, which is in terms
of S28 of the MFMA. Unfinished capital project budgets shall not be carried forward to future
fiscal years unless the project expenditure is committed or funded from grant funding, which
will require the rolling over of those funds together with the project this policy set out the
principles which must be followed in preparing a Medium-Term Revenue and Expenditure
Framework Budget. It further ensures that the budget reflects the strategic outcomes embodied
in the IDP and related strategic policies. Status: working on the 2020/2021
1.4.5 Asset Management Policy – the objective of the policy is to prescribe the accounting and
administrative procedures relating to property, plant and equipment; Status: working on the
2020/2021
1.4.6 Accounting Policy – the policy prescribes the basis of presentation of the Annual Financial
Statements in accordance with the Generally Recognized Accounting Practices and
Accounting Standards; Status: working on the 2020/2021
1.4.7 Supply Chain Management Policy – this policy is developed in terms of Section 11 of the
Municipal Finance Management Act, Act 56 of 2003. The principles of this policy is to give
effect to a fair, equitable, transparent, competitive and cost effective system for the procuring
238 |
P a g e
of goods and services, disposing of goods and selecting of contractors in the provision of
municipal services Status: working on the 2020/2021
1.4.8 Subsistence and Travel Policy – this policy regulates the reimbursement of travelling and
subsistence cost to officials and councillors attending official business activities.
Status: working on the 2020/2021
1.4.9 Credit Control and Debt Collection Policy – this policy provides for credit and debt
collection procedures and mechanisms to ensure that all consumers pay for the services that
are supplied. Status: working on the 2020/2021
1.4.10 Investment Policy – this policy was compiled in accordance with the Municipal Investment
Regulation R308 and ensures that cash resources are managed in the most efficient and
effective manner possible Status: working on the 2020/2021
1.4.11 Short-term Insurance Policy – the objective of the policy is to ensure the safeguarding of
Council’s assets. Status: working on the 2020/2021
1.4.12. Principles and Policy on Borrowings- The purpose of this policy is to ensure that borrowing
forms part of the financial management procedures of the Municipality and to ensure that
prudent borrowing procedures are applied consistently. Status: working on the 2020/2021
239 |
P a g e
1.5. REVENUE FRAMEWORK
In order to serve the community and to render the services needed, revenue generation is
fundamental to financial sustainability of every Municipality.
The reality is that we are faced with developmental backlogs and poverty, challenging our
revenue generation capacity. The requests always exceed the available funds. This becomes
more obvious when compiling the Municipality’s annual budget.
Municipalities must table a balanced and more credible budget, based on realistic estimation
of revenue that is consistent with their budgetary resources and collection experience.
Revenue collection from municipal rates is expected to be negatively affected during
2020/2021 as a result of expected report on job losses caused the declared National state of
disaster.
The revenue strategy is a function of key components such as:
o Growth in town and economic development;
o Revenue enhancement;
o Achievement of above 90% annualized collection rate for consumer revenue;
o National Treasury guidelines;
o Approval of full cost recovery of specific department;
o Determining tariff escalation rate by establishing/calculating revenue requirement;
and
o Ensuring ability to extent new services and recovering of costs thereof
The South African economy is currently not doing well economically. Consequently, cash
flows are expected to remain under pressure for the 2020/21 financial year and a conservative
approach is followed to project expected revenues and cash receipts.
240 |
P a g e
1.6. GRANT FUNDING
The Division of Revenue Act contains allocations from National and Provincial, which
allocations are recognized as government grants and factored as follows over the medium
term:
The Equitable share allocation to the local sphere of government is an important supplement
to existing municipal revenue and takes account of the fiscal capacity, fiscal efficiency,
developmental needs, extent of poverty and backlogs in municipalities
It is an unconditional grant and allocations are contained in the Division of Revenue Act
(DORA)
The structure and components of the formula are summarized as follows:
Grant = BS + D + I + R+ (-) C where:
BS = Basic Service Component
D = Development component
I = Institutional Support Component
R = Revenue-raising Capacity Correction
C = Correction and stabilization factor
A Municipality is prioritizing its budget towards poor households and national priorities such
as free basic services and the expanded public works programmes.
Operating grants for 2020/2021 comprises a large percentage of the total government grants
than capital grants (Refer to draft budget).
Government grants contributes a large percentage on the total revenue of the Municipality.
1.7 TARIFF SETTING
Big 5-Hlabisa Municipality derives its revenue from the provision of services such refuse
removal. A considerable portion of the revenue is also derived from property rates and grants
by national governments as well as other minor charges such as traffic fines.
As in the past, increase cost primarily driven by the Consumer Price Index (CPIX), dictates
an increase in the tariffs charged to the consumers and the ratepayers.
It is realised that the ability of the community to pay for services rendered is also under
tremendous pressure and that the economic outlook for the near future require everybody to
make sacrifices.
The additional revenue that will be generated through tariff increase has to ensure continued
service delivery.
The figures released by Stats SA indicate contractions in several spheres of the economy and
this confirms that the disposable income of households remain under a lot of strain.
241 |
P a g e
By drastically increasing tariffs on essential commodities, more strain will be added for the
already cash stripped resident households.
Increases beyond the CPIX included in the medium term will only add to bad debt which is
already high and a decline in the cash flow.
It must be kept in mind that households cash flow will definitely be strained by a continuous
tariff increase of electricity by ESKOM.
242 |
P a g e
Credit Control and Debt Collection Policy needs to be implemented particularly with regards to the
appointment of the Debt Collection Agency will aid in ensuring that the Municipality increase the
collection rate. It is however envisaged that with the pressure on tariff increases to fund the medium
term budget, the payment rate will become under pressure and special attention will have to be paid
on managing all revenue and cash streams especially debtors.
Indigent allocation is mainly used to provide free basic services and burial support to indigents.
1.8. EXPENDITURE FRAMEWORK
Some of the salient features and best practice methodologies relating to expenditure include the
following:
Asset renewal strategy (infrastructure repairs and maintenance a priority)
Balanced budget constraint (expenditure cannot exceed revenue)
Capital programme aligned to asset renewal strategy
Operational gains and efficiencies resulting in additional funding capacity on the capital
programme as well are direction of funding to other critical areas, and
Strict principle of no project plan (business plan) no budget allocation (funding allocation)
1.8.1 In terms of the projections for the 2020/2021 financial year, indicative salary increase is 6.25%
per annum.
1.8.2 The total employee related costs is estimated to be plus or minus 50% of total operating
expenditure.
1.8.3 The cost associated with the remuneration of councillors will be determined and informed
directly by way of the Remuneration of Public Office Bearers Act 1998 (Act No. 20 of 1998)
as per the municipal grading.
1.8.4 Aligned to the best practice methodology of preserving and maintaining current infrastructure,
the expenditure framework has essentially catered for infrastructure maintenance.
1.8.5 Repairs and maintenance budget in future years should be given a priority as per the approved
maintenance plan.
1.8.6 Expenditure Framework in Major sources.
1.10. CAPITAL REQUIREMENTS & FUNDING
243 |
P a g e
1.10.1 The above figures are based on the projects identified through the IDP process project phase
and reflect estimated amounts based on the availability of funding. It is clear that other projects
do not have funding hence only funded projects are listed in the above
1.10.2 It is imperative that capital budgets are prioritized to reflect consistent efforts to address
backlogs in basic services and the refurbishment and expanding of existing infrastructure.
1.10.3 It is important to realize that these figures are only indicative of the different services and may
vary as priorities change.
1.10.4 From the above it is clear that for the next three years many challenges lie ahead to appropriate
capital expenditure towards available sources of funding and to obtain alternative funding
sources to address the needs as identified in the IDP.
1.10.5 In terms of infrastructure development and to reach the government service delivery targets,
100% of the Municipal Infrastructure Grant (R21 239 000,00) has been allocated and
R10 250 000,00 allocated for sports and recreation. Also internally generated Capital
budgeted at R2,9 million which totals to 1.8% of total operating revenue.
1.10.6 The projected sources of funding over the medium term have been carefully considered.
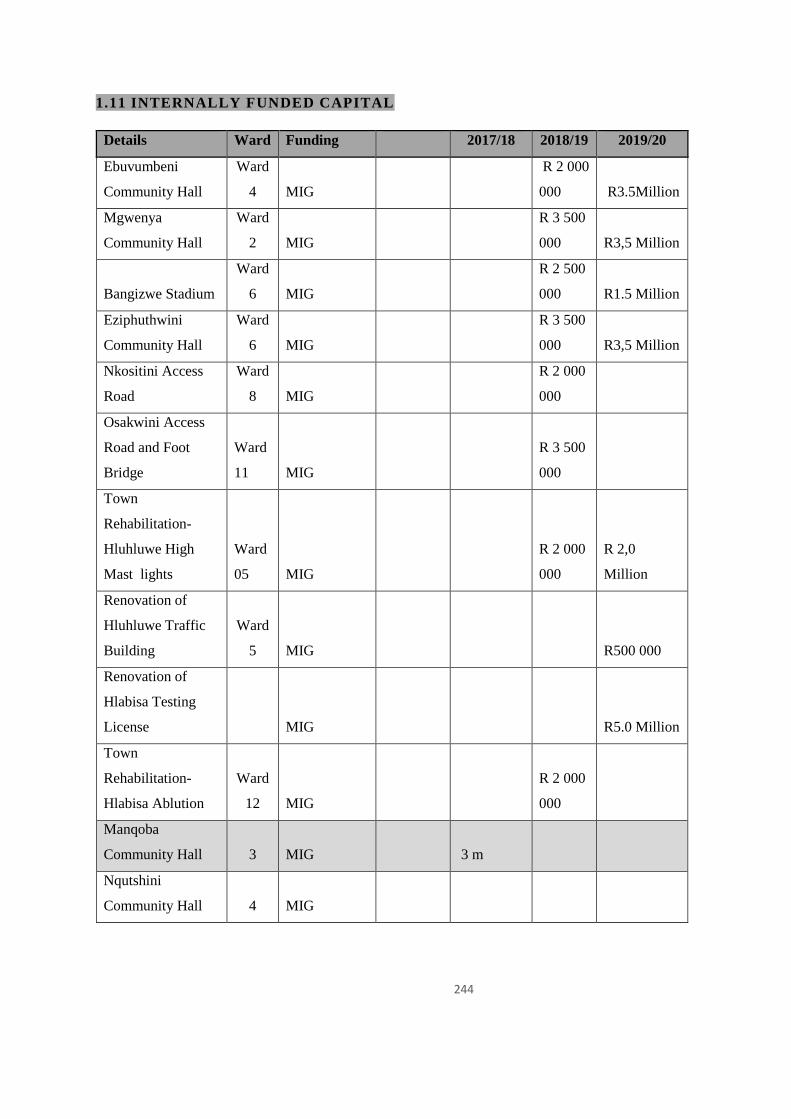
244
1.11 INTERNALLY FUNDED CAPITAL
Details Ward Funding 2017/18 2018/19 2019/20
Ebuvumbeni
Community Hall
Ward
4 MIG
R 2 000
000 R3.5Million
Mgwenya
Community Hall
Ward
2 MIG
R 3 500
000 R3,5 Million
Bangizwe Stadium
Ward
6 MIG
R 2 500
000 R1.5 Million
Eziphuthwini
Community Hall
Ward
6 MIG
R 3 500
000 R3,5 Million
Nkositini Access
Road
Ward
8 MIG
R 2 000
000
Osakwini Access
Road and Foot
Bridge
Ward
11 MIG
R 3 500
000
Town
Rehabilitation-
Hluhluwe High
Mast lights
Ward
05 MIG
R 2 000
000
R 2,0
Million
Renovation of
Hluhluwe Traffic
Building
Ward
5 MIG R500 000
Renovation of
Hlabisa Testing
License MIG R5.0 Million
Town
Rehabilitation-
Hlabisa Ablution
Ward
12 MIG
R 2 000
000
Manqoba
Community Hall 3 MIG 3 m
Nqutshini
Community Hall 4 MIG
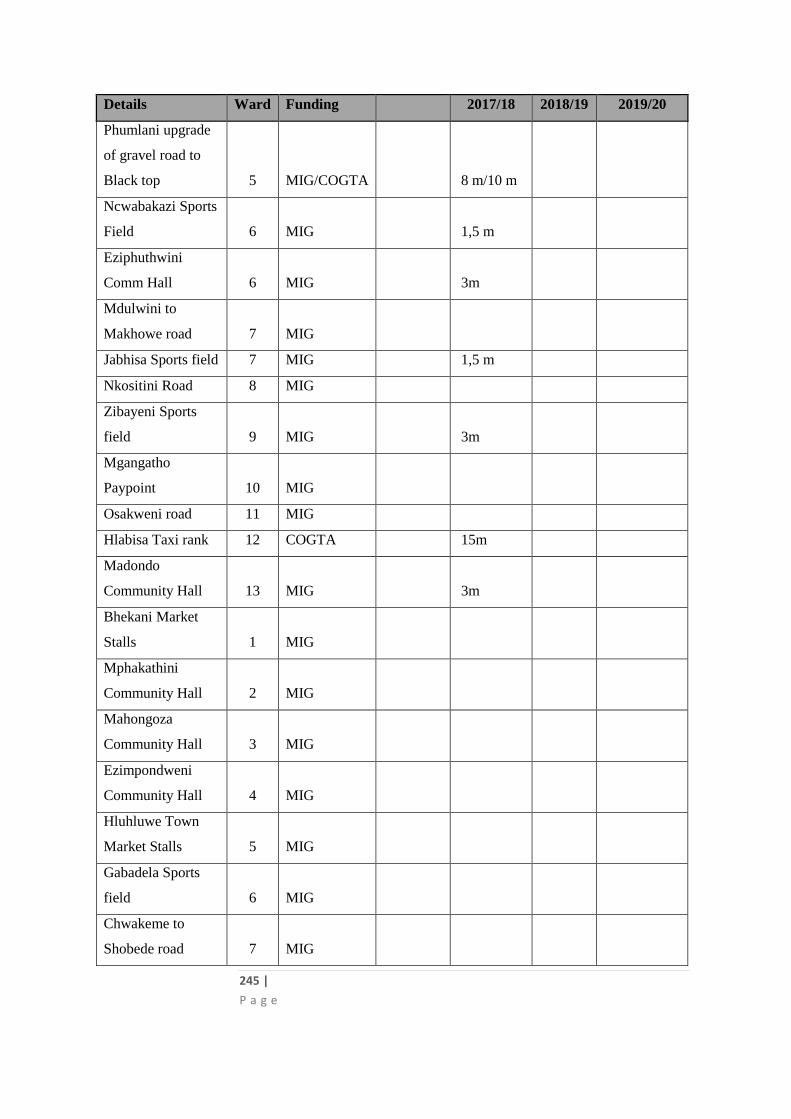
245 |
P a g e
Details Ward Funding 2017/18 2018/19 2019/20
Phumlani upgrade
of gravel road to
Black top 5 MIG/COGTA 8 m/10 m
Ncwabakazi Sports
Field 6 MIG 1,5 m
Eziphuthwini
Comm Hall 6 MIG 3m
Mdulwini to
Makhowe road 7 MIG
Jabhisa Sports field 7 MIG 1,5 m
Nkositini Road 8 MIG
Zibayeni Sports
field 9 MIG 3m
Mgangatho
Paypoint 10 MIG
Osakweni road 11 MIG
Hlabisa Taxi rank 12 COGTA 15m
Madondo
Community Hall 13 MIG 3m
Bhekani Market
Stalls 1 MIG
Mphakathini
Community Hall 2 MIG
Mahongoza
Community Hall 3 MIG
Ezimpondweni
Community Hall 4 MIG
Hluhluwe Town
Market Stalls 5 MIG
Gabadela Sports
field 6 MIG
Chwakeme to
Shobede road 7 MIG
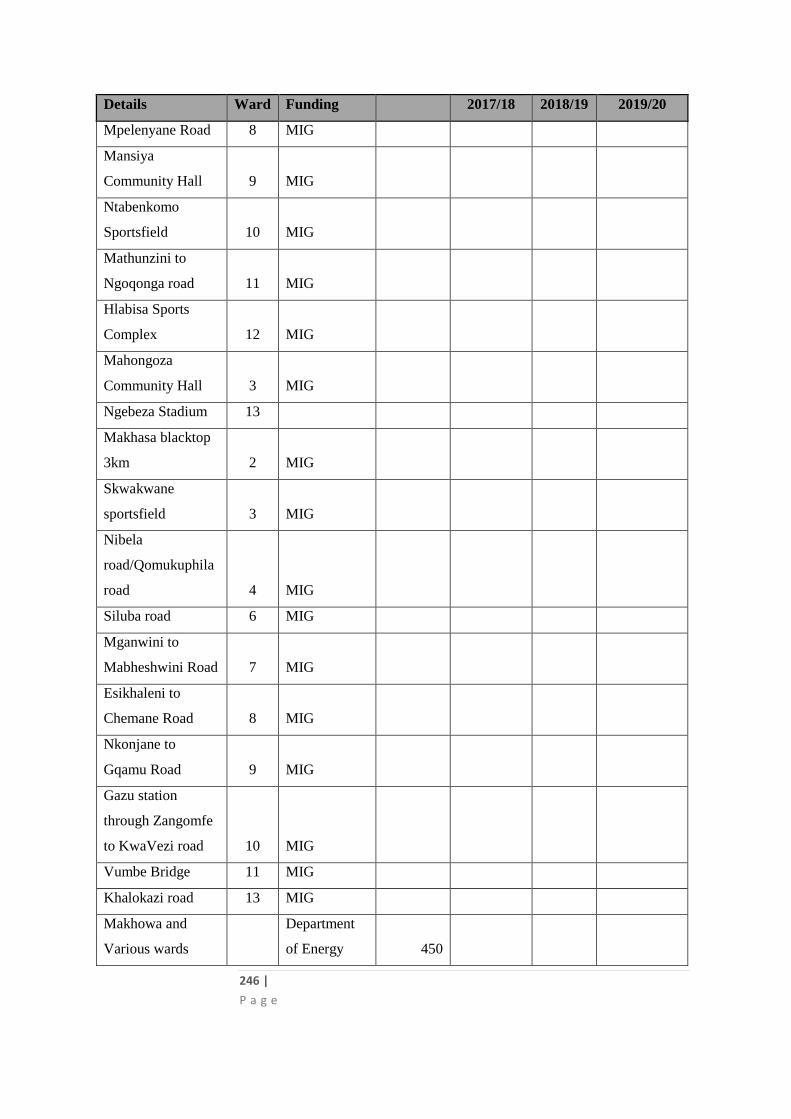
246 |
P a g e
Details Ward Funding 2017/18 2018/19 2019/20
Mpelenyane Road 8 MIG
Mansiya
Community Hall 9 MIG
Ntabenkomo
Sportsfield 10 MIG
Mathunzini to
Ngoqonga road 11 MIG
Hlabisa Sports
Complex 12 MIG
Mahongoza
Community Hall 3 MIG
Ngebeza Stadium 13
Makhasa blacktop
3km 2 MIG
Skwakwane
sportsfield 3 MIG
Nibela
road/Qomukuphila
road 4 MIG
Siluba road 6 MIG
Mganwini to
Mabheshwini Road 7 MIG
Esikhaleni to
Chemane Road 8 MIG
Nkonjane to
Gqamu Road 9 MIG
Gazu station
through Zangomfe
to KwaVezi road 10 MIG
Vumbe Bridge 11 MIG
Khalokazi road 13 MIG
Makhowa and
Various wards
Department
of Energy 450
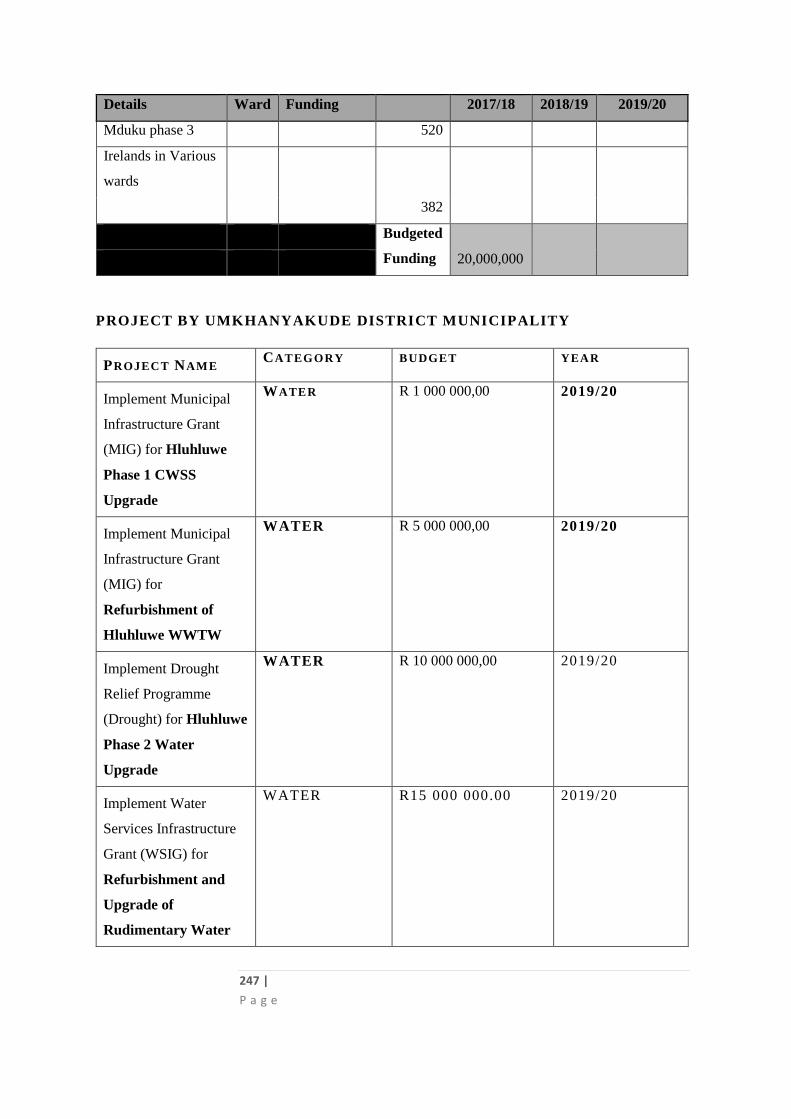
247 |
P a g e
Details Ward Funding 2017/18 2018/19 2019/20
Mduku phase 3 520
Irelands in Various
wards
382
Budgeted
Funding
20,000,000
PROJECT BY UMKHANYAKUDE DISTRICT MUNICIPALITY
PROJECT NAME CATEGORY BUDGET YEAR
Implement Municipal
Infrastructure Grant
(MIG) for Hluhluwe
Phase 1 CWSS
Upgrade
WATER R 1 000 000,00 2019/20
Implement Municipal
Infrastructure Grant
(MIG) for
Refurbishment of
Hluhluwe WWTW
WATER R 5 000 000,00 2019/20
Implement Drought
Relief Programme
(Drought) for Hluhluwe
Phase 2 Water
Upgrade
WATER R 10 000 000,00 2019/20
Implement Water
Services Infrastructure
Grant (WSIG) for
Refurbishment and
Upgrade of
Rudimentary Water
WATER R15 000 000.00 2019/20
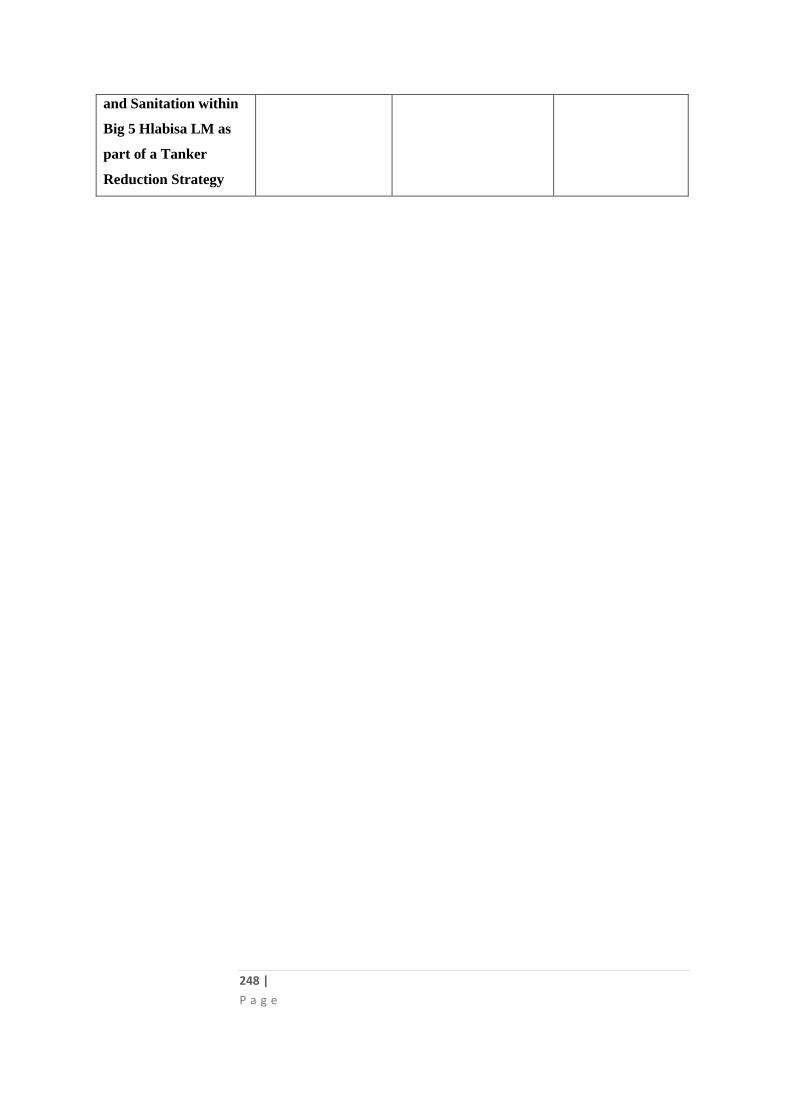
248 |
P a g e
and Sanitation within
Big 5 Hlabisa LM as
part of a Tanker
Reduction Strategy
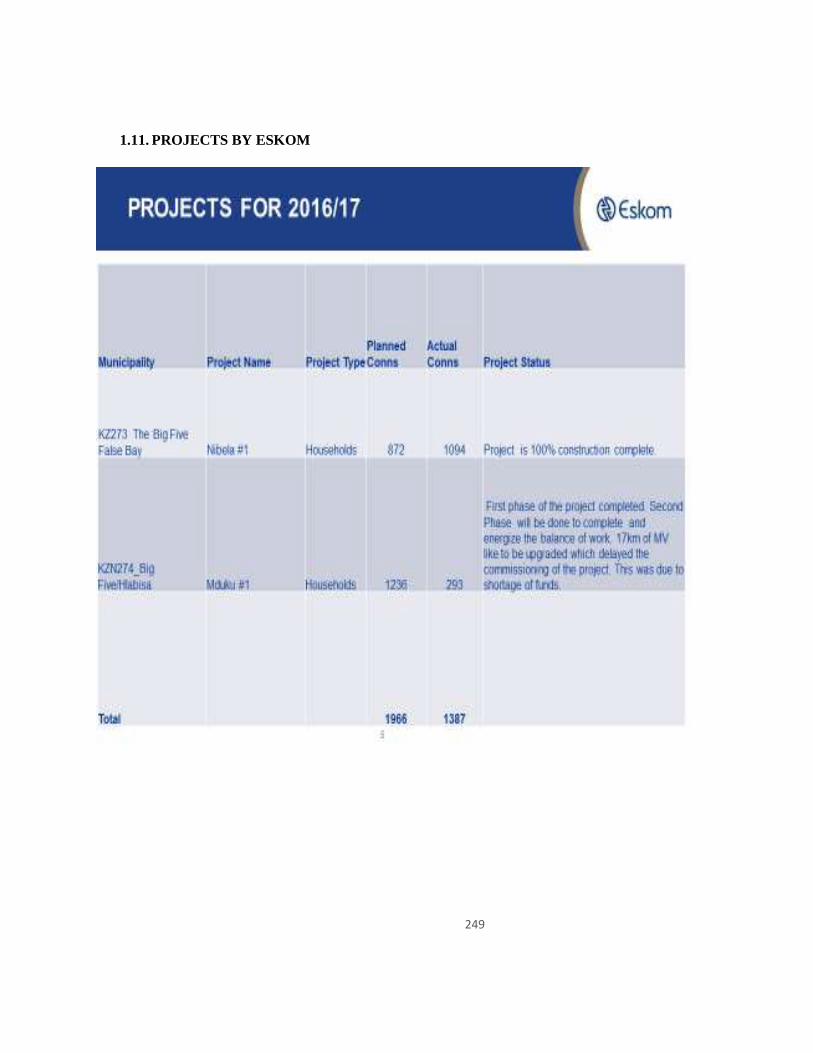
249
1.11. PROJECTS BY ESKOM
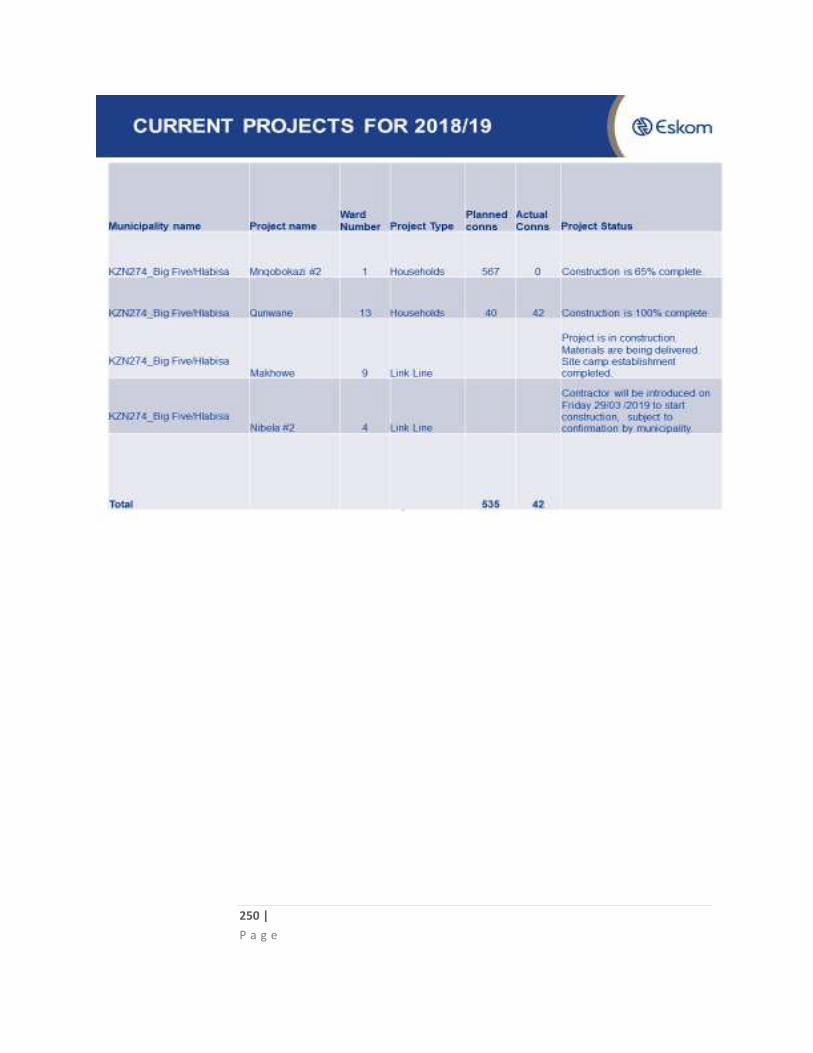
250 |
P a g e
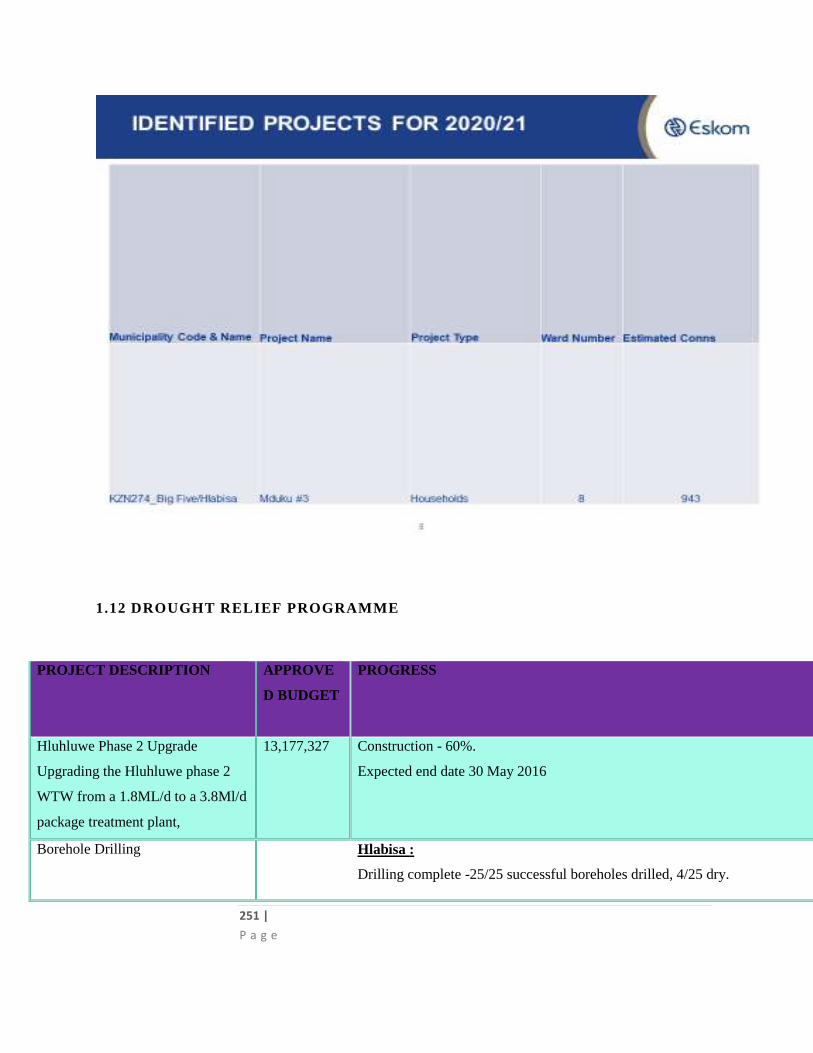
251 |
P a g e
1.12 DROUGHT RELIEF PROGRAMME
PROJECT DESCRIPTION APPROVE
D BUDGET
PROGRESS TARGET NO OF
HOUSEHOLDS TO BE
SERVED
Hluhluwe Phase 2 Upgrade
Upgrading the Hluhluwe phase 2
WTW from a 1.8ML/d to a 3.8Ml/d
package treatment plant,
13,177,327 Construction - 60%.
Expected end date 30 May 2016
5250
Borehole Drilling
Hlabisa :
Drilling complete -25/25 successful boreholes drilled, 4/25 dry.
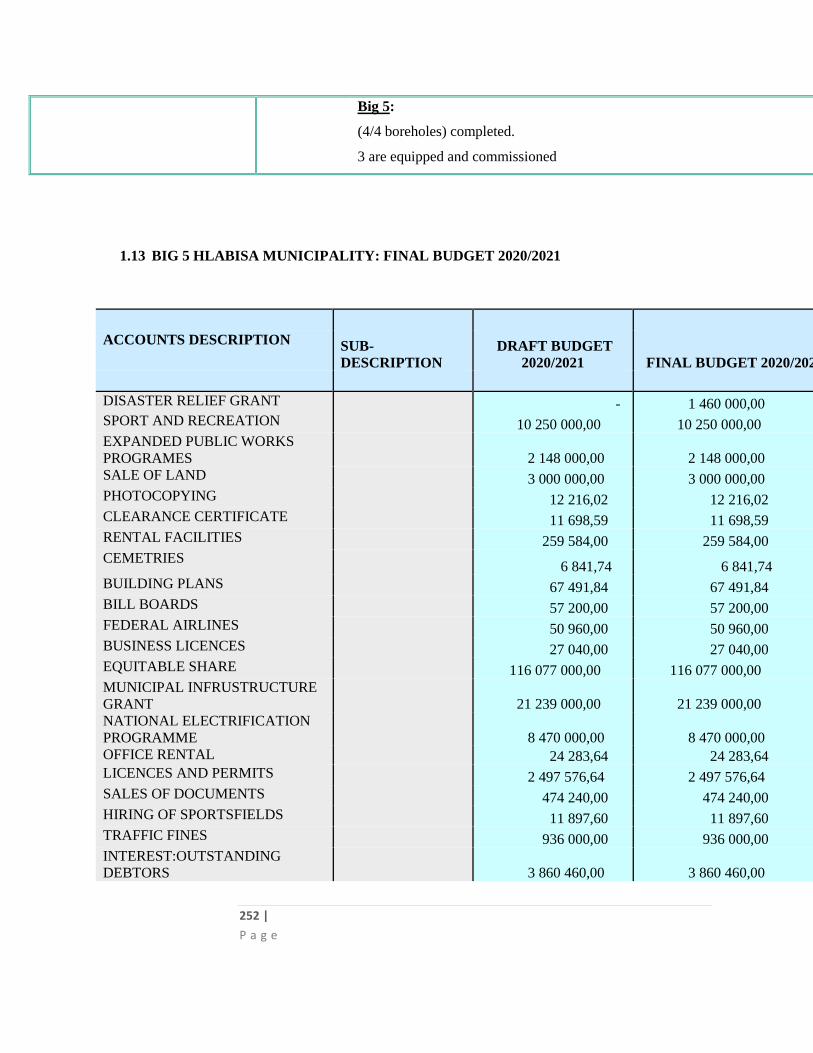
252 |
P a g e
Big 5:
(4/4 boreholes) completed.
3 are equipped and commissioned
1.13 BIG 5 HLABISA MUNICIPALITY: FINAL BUDGET 2020/2021
ACCOUNTS DESCRIPTION SUB-
DESCRIPTION
DRAFT BUDGET
2020/2021 FINAL BUDGET 2020/2021 DISASTER RELIEF GRANT - 1 460 000,00 SPORT AND RECREATION 10 250 000,00 10 250 000,00 EXPANDED PUBLIC WORKS
PROGRAMES 2 148 000,00 2 148 000,00 SALE OF LAND 3 000 000,00 3 000 000,00 PHOTOCOPYING 12 216,02 12 216,02 CLEARANCE CERTIFICATE 11 698,59 11 698,59 RENTAL FACILITIES 259 584,00 259 584,00 CEMETRIES
6 841,74 6 841,74 BUILDING PLANS 67 491,84 67 491,84 BILL BOARDS 57 200,00 57 200,00 FEDERAL AIRLINES 50 960,00 50 960,00 BUSINESS LICENCES 27 040,00 27 040,00 EQUITABLE SHARE 116 077 000,00 116 077 000,00 MUNICIPAL INFRUSTRUCTURE
GRANT 21 239 000,00 21 239 000,00 NATIONAL ELECTRIFICATION
PROGRAMME 8 470 000,00 8 470 000,00 OFFICE RENTAL 24 283,64 24 283,64 LICENCES AND PERMITS 2 497 576,64 2 497 576,64 SALES OF DOCUMENTS 474 240,00 474 240,00 HIRING OF SPORTSFIELDS 11 897,60 11 897,60 TRAFFIC FINES 936 000,00 936 000,00 INTEREST:OUTSTANDING
DEBTORS 3 860 460,00 3 860 460,00
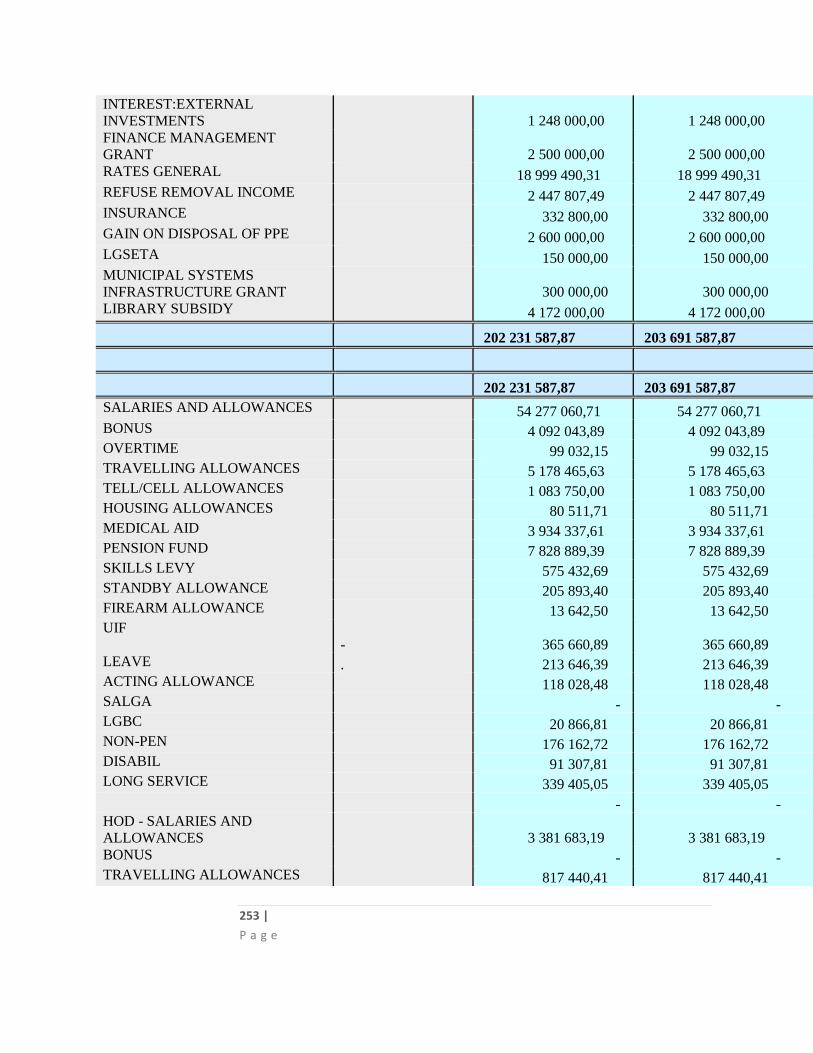
253 |
P a g e
INTEREST:EXTERNAL
INVESTMENTS 1 248 000,00 1 248 000,00 FINANCE MANAGEMENT
GRANT 2 500 000,00 2 500 000,00 RATES GENERAL 18 999 490,31 18 999 490,31 REFUSE REMOVAL INCOME 2 447 807,49 2 447 807,49 INSURANCE 332 800,00 332 800,00 GAIN ON DISPOSAL OF PPE 2 600 000,00 2 600 000,00 LGSETA 150 000,00 150 000,00 MUNICIPAL SYSTEMS
INFRASTRUCTURE GRANT 300 000,00 300 000,00 LIBRARY SUBSIDY 4 172 000,00 4 172 000,00 202 231 587,87 203 691 587,87 202 231 587,87 203 691 587,87 SALARIES AND ALLOWANCES 54 277 060,71 54 277 060,71 BONUS 4 092 043,89 4 092 043,89 OVERTIME 99 032,15 99 032,15 TRAVELLING ALLOWANCES 5 178 465,63 5 178 465,63 TELL/CELL ALLOWANCES 1 083 750,00 1 083 750,00 HOUSING ALLOWANCES 80 511,71 80 511,71 MEDICAL AID 3 934 337,61 3 934 337,61 PENSION FUND 7 828 889,39 7 828 889,39 SKILLS LEVY 575 432,69 575 432,69 STANDBY ALLOWANCE 205 893,40 205 893,40 FIREARM ALLOWANCE 13 642,50 13 642,50 UIF
- 365 660,89 365 660,89 LEAVE . 213 646,39 213 646,39 ACTING ALLOWANCE 118 028,48 118 028,48 SALGA - - LGBC 20 866,81 20 866,81 NON-PEN 176 162,72 176 162,72 DISABIL 91 307,81 91 307,81 LONG SERVICE 339 405,05 339 405,05 - - HOD - SALARIES AND
ALLOWANCES 3 381 683,19 3 381 683,19 BONUS - - TRAVELLING ALLOWANCES 817 440,41 817 440,41
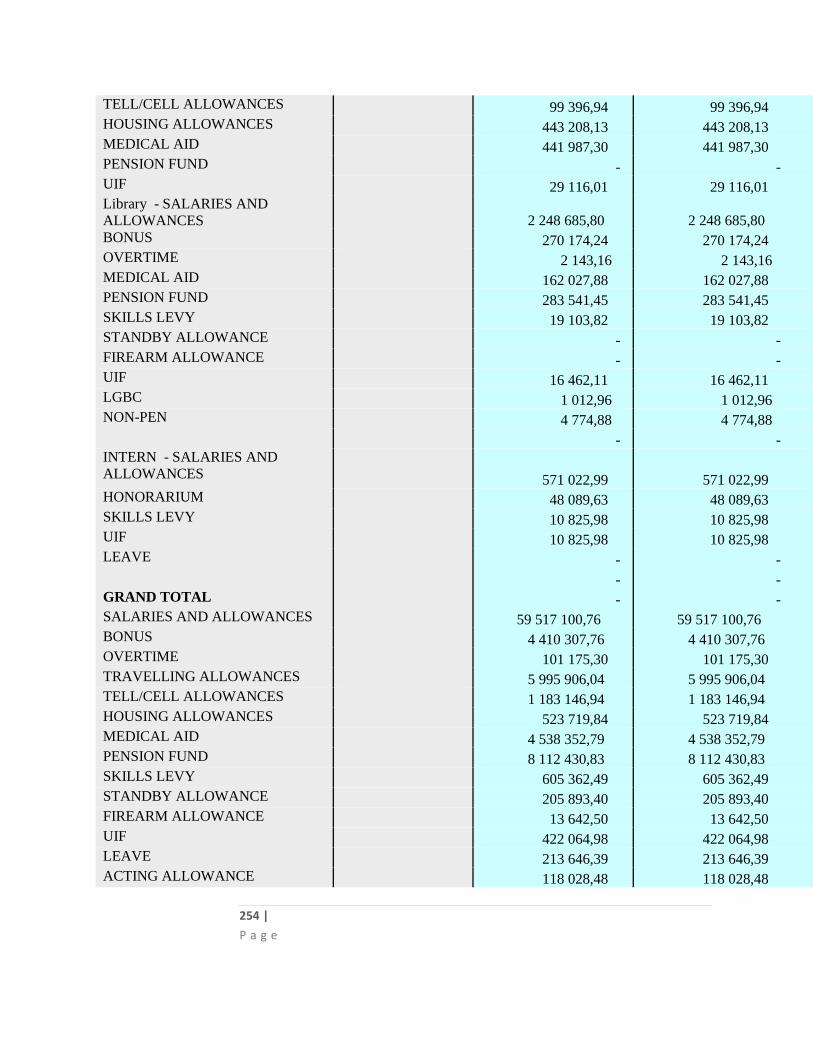
254 |
P a g e
TELL/CELL ALLOWANCES 99 396,94 99 396,94 HOUSING ALLOWANCES 443 208,13 443 208,13 MEDICAL AID 441 987,30 441 987,30 PENSION FUND - - UIF 29 116,01 29 116,01 Library - SALARIES AND
ALLOWANCES 2 248 685,80 2 248 685,80 BONUS 270 174,24 270 174,24 OVERTIME 2 143,16 2 143,16 MEDICAL AID 162 027,88 162 027,88 PENSION FUND 283 541,45 283 541,45 SKILLS LEVY 19 103,82 19 103,82 STANDBY ALLOWANCE - - FIREARM ALLOWANCE - - UIF 16 462,11 16 462,11 LGBC 1 012,96 1 012,96 NON-PEN 4 774,88 4 774,88 - - INTERN - SALARIES AND
ALLOWANCES 571 022,99 571 022,99 HONORARIUM 48 089,63 48 089,63 SKILLS LEVY 10 825,98 10 825,98 UIF 10 825,98 10 825,98 LEAVE - - - - GRAND TOTAL - - SALARIES AND ALLOWANCES 59 517 100,76 59 517 100,76 BONUS 4 410 307,76 4 410 307,76 OVERTIME 101 175,30 101 175,30 TRAVELLING ALLOWANCES 5 995 906,04 5 995 906,04 TELL/CELL ALLOWANCES 1 183 146,94 1 183 146,94 HOUSING ALLOWANCES 523 719,84 523 719,84 MEDICAL AID 4 538 352,79 4 538 352,79 PENSION FUND 8 112 430,83 8 112 430,83 SKILLS LEVY 605 362,49 605 362,49 STANDBY ALLOWANCE 205 893,40 205 893,40 FIREARM ALLOWANCE 13 642,50 13 642,50 UIF 422 064,98 422 064,98 LEAVE 213 646,39 213 646,39 ACTING ALLOWANCE 118 028,48 118 028,48
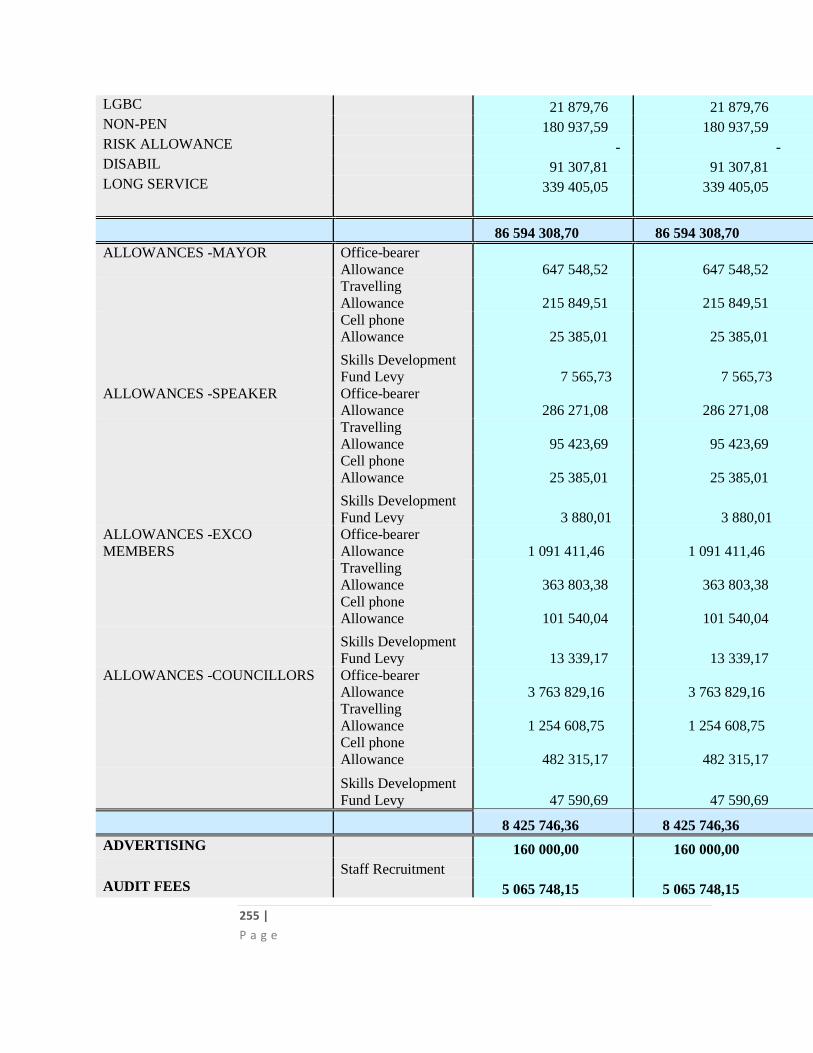
255 |
P a g e
LGBC 21 879,76 21 879,76 NON-PEN 180 937,59 180 937,59 RISK ALLOWANCE - - DISABIL 91 307,81 91 307,81 LONG SERVICE 339 405,05 339 405,05 86 594 308,70 86 594 308,70 ALLOWANCES -MAYOR Office-bearer
Allowance 647 548,52 647 548,52 Travelling
Allowance 215 849,51 215 849,51 Cell phone
Allowance 25 385,01 25 385,01 Skills Development
Fund Levy 7 565,73 7 565,73 ALLOWANCES -SPEAKER Office-bearer
Allowance 286 271,08 286 271,08 Travelling
Allowance 95 423,69 95 423,69 Cell phone
Allowance 25 385,01 25 385,01 Skills Development
Fund Levy 3 880,01 3 880,01 ALLOWANCES -EXCO
MEMBERS
Office-bearer
Allowance 1 091 411,46 1 091 411,46 Travelling
Allowance 363 803,38 363 803,38 Cell phone
Allowance 101 540,04 101 540,04 Skills Development
Fund Levy 13 339,17 13 339,17 ALLOWANCES -COUNCILLORS Office-bearer
Allowance 3 763 829,16 3 763 829,16 Travelling
Allowance 1 254 608,75 1 254 608,75 Cell phone
Allowance 482 315,17 482 315,17
Skills Development
Fund Levy 47 590,69 47 590,69 8 425 746,36 8 425 746,36 ADVERTISING 160 000,00 160 000,00 Staff Recruitment AUDIT FEES 5 065 748,15 5 065 748,15
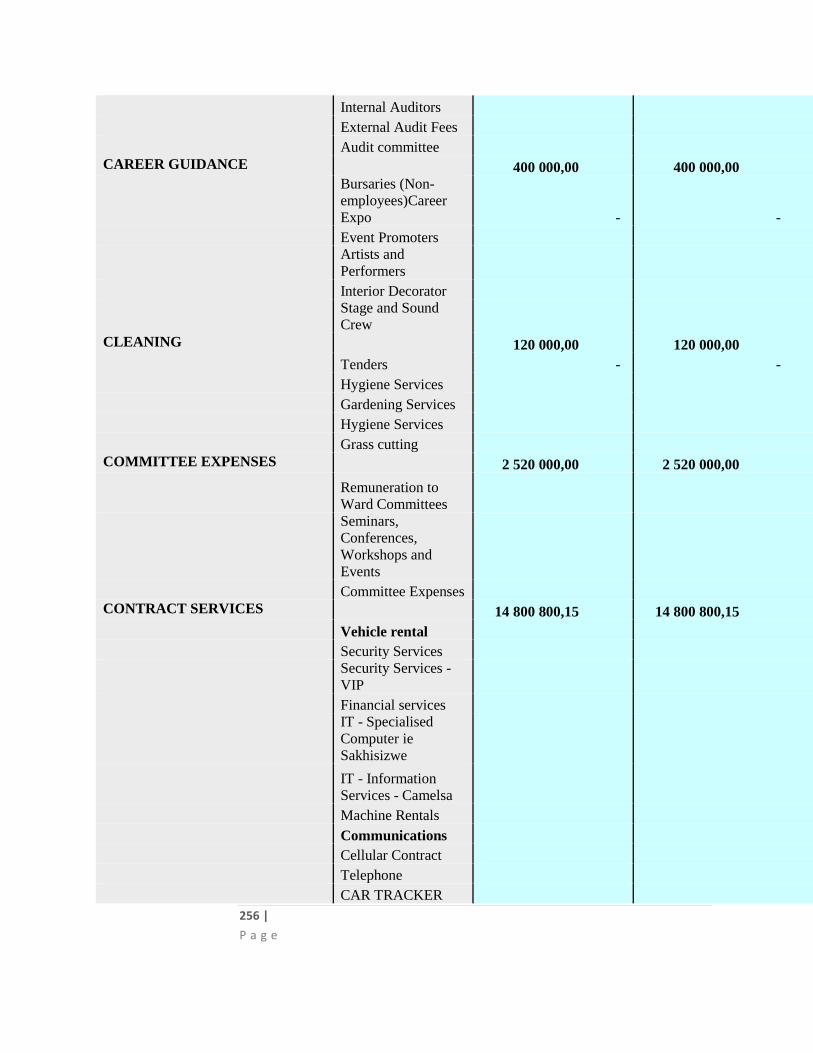
256 |
P a g e
Internal Auditors External Audit Fees Audit committee CAREER GUIDANCE 400 000,00 400 000,00 Bursaries (Non-
employees)Career
Expo - - Event Promoters Artists and
Performers Interior Decorator Stage and Sound
Crew CLEANING 120 000,00 120 000,00 Tenders - - Hygiene Services Gardening Services Hygiene Services Grass cutting COMMITTEE EXPENSES 2 520 000,00 2 520 000,00 Remuneration to
Ward Committees Seminars,
Conferences,
Workshops and
Events Committee Expenses CONTRACT SERVICES 14 800 800,15 14 800 800,15 Vehicle rental Security Services Security Services -
VIP Financial services IT - Specialised
Computer ie
Sakhisizwe IT - Information
Services - Camelsa Machine Rentals Communications Cellular Contract Telephone CAR TRACKER
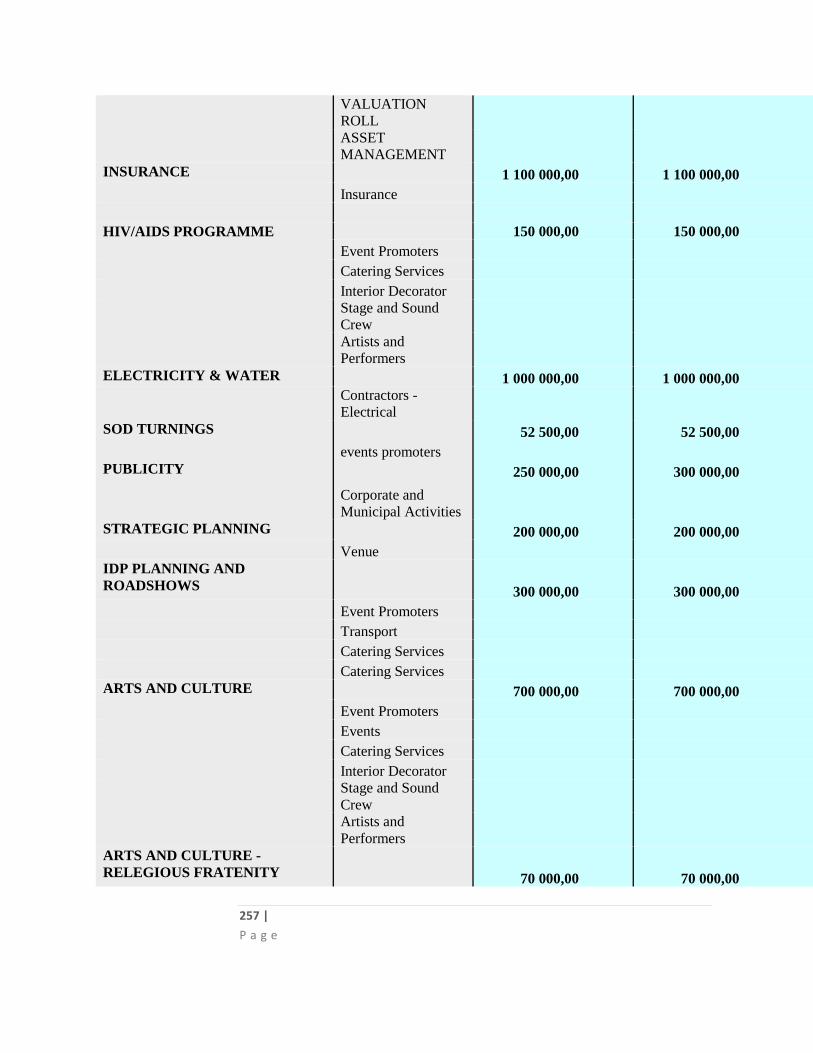
257 |
P a g e
VALUATION
ROLL ASSET
MANAGEMENT INSURANCE 1 100 000,00 1 100 000,00 Insurance HIV/AIDS PROGRAMME 150 000,00 150 000,00 Event Promoters Catering Services Interior Decorator Stage and Sound
Crew Artists and
Performers ELECTRICITY & WATER 1 000 000,00 1 000 000,00 Contractors -
Electrical SOD TURNINGS 52 500,00 52 500,00 events promoters PUBLICITY 250 000,00 300 000,00 Corporate and
Municipal Activities STRATEGIC PLANNING 200 000,00 200 000,00 Venue IDP PLANNING AND
ROADSHOWS 300 000,00 300 000,00 Event Promoters Transport Catering Services Catering Services ARTS AND CULTURE 700 000,00 700 000,00 Event Promoters Events Catering Services Interior Decorator Stage and Sound
Crew Artists and
Performers ARTS AND CULTURE -
RELEGIOUS FRATENITY 70 000,00 70 000,00
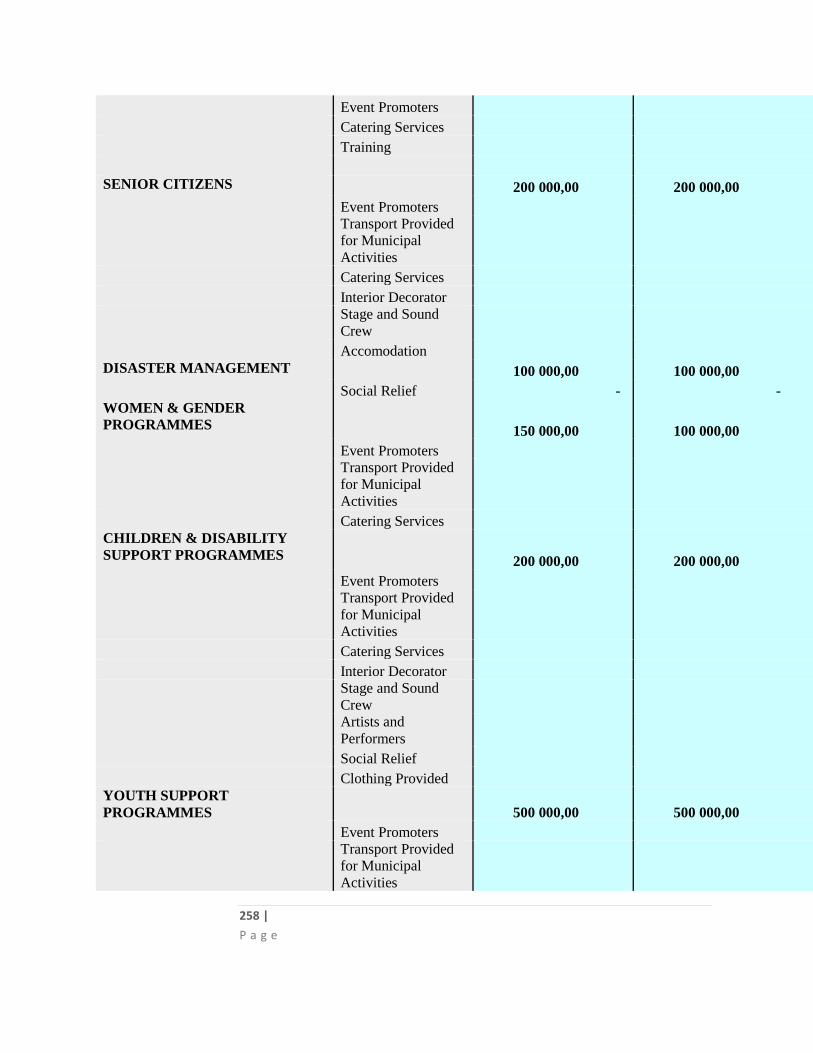
258 |
P a g e
Event Promoters Catering Services Training SENIOR CITIZENS 200 000,00 200 000,00 Event Promoters Transport Provided
for Municipal
Activities Catering Services Interior Decorator Stage and Sound
Crew Accomodation DISASTER MANAGEMENT 100 000,00 100 000,00 Social Relief - - WOMEN & GENDER
PROGRAMMES 150 000,00 100 000,00 Event Promoters Transport Provided
for Municipal
Activities Catering Services CHILDREN & DISABILITY
SUPPORT PROGRAMMES 200 000,00 200 000,00 Event Promoters Transport Provided
for Municipal
Activities Catering Services Interior Decorator Stage and Sound
Crew Artists and
Performers Social Relief Clothing Provided YOUTH SUPPORT
PROGRAMMES 500 000,00 500 000,00 Event Promoters Transport Provided
for Municipal
Activities
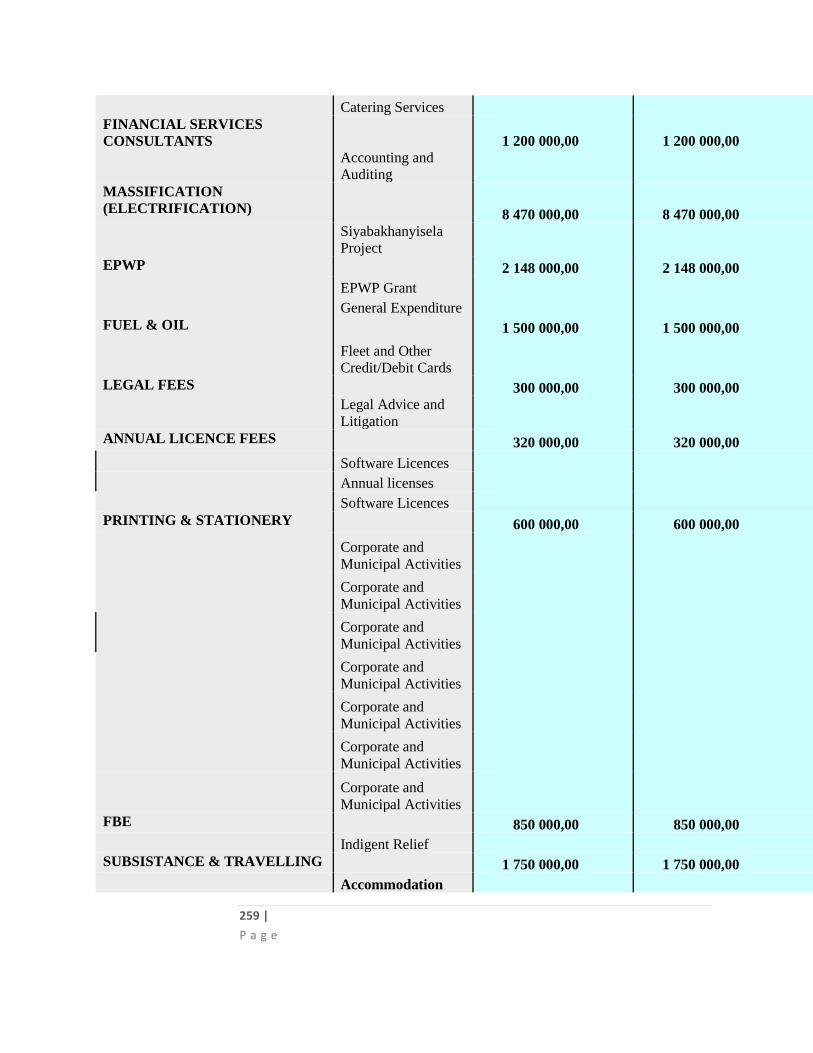
259 |
P a g e
Catering Services FINANCIAL SERVICES
CONSULTANTS 1 200 000,00 1 200 000,00 Accounting and
Auditing MASSIFICATION
(ELECTRIFICATION) 8 470 000,00 8 470 000,00 Siyabakhanyisela
Project EPWP 2 148 000,00 2 148 000,00 EPWP Grant General Expenditure FUEL & OIL 1 500 000,00 1 500 000,00 Fleet and Other
Credit/Debit Cards LEGAL FEES 300 000,00 300 000,00 Legal Advice and
Litigation ANNUAL LICENCE FEES 320 000,00 320 000,00 Software Licences Annual licenses Software Licences PRINTING & STATIONERY 600 000,00 600 000,00 Corporate and
Municipal Activities Corporate and
Municipal Activities Corporate and
Municipal Activities Corporate and
Municipal Activities Corporate and
Municipal Activities Corporate and
Municipal Activities
Corporate and
Municipal Activities FBE 850 000,00 850 000,00 Indigent Relief SUBSISTANCE & TRAVELLING 1 750 000,00 1 750 000,00 Accommodation
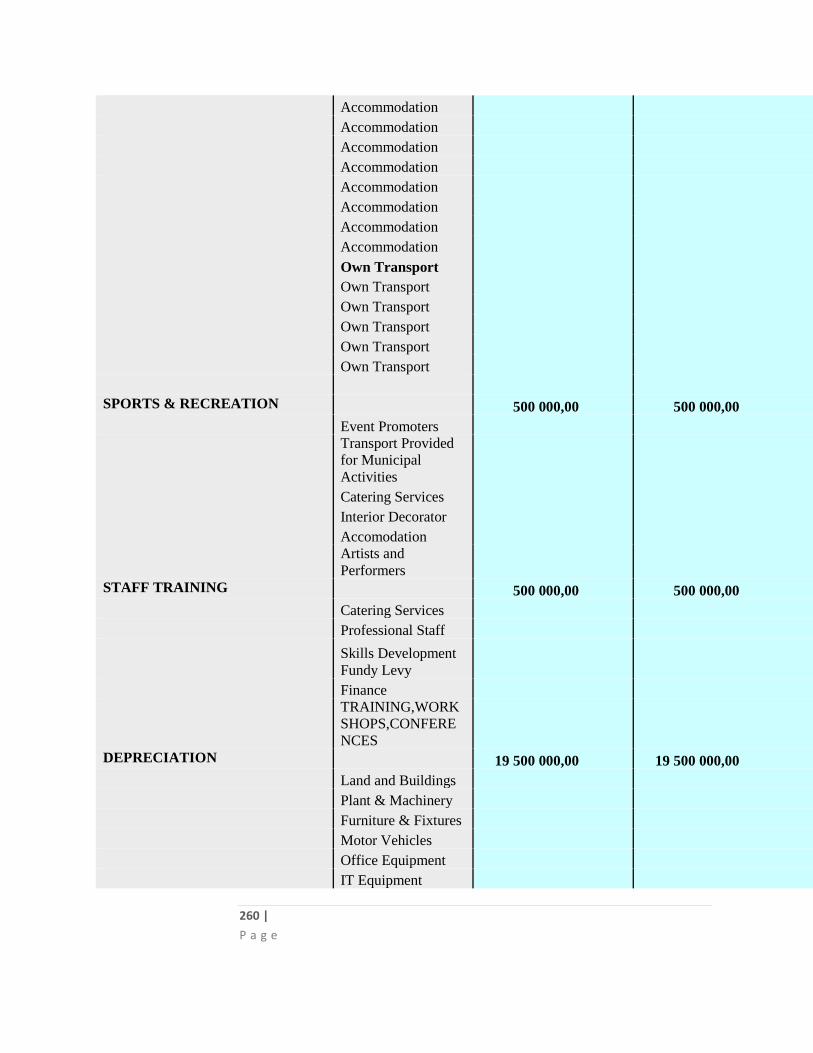
260 |
P a g e
Accommodation Accommodation Accommodation Accommodation Accommodation Accommodation Accommodation Accommodation Own Transport Own Transport Own Transport Own Transport Own Transport Own Transport SPORTS & RECREATION 500 000,00 500 000,00 Event Promoters Transport Provided
for Municipal
Activities Catering Services Interior Decorator Accomodation Artists and
Performers STAFF TRAINING 500 000,00 500 000,00 Catering Services Professional Staff Skills Development
Fundy Levy Finance TRAINING,WORK
SHOPS,CONFERE
NCES DEPRECIATION 19 500 000,00 19 500 000,00 Land and Buildings Plant & Machinery Furniture & Fixtures Motor Vehicles Office Equipment IT Equipment
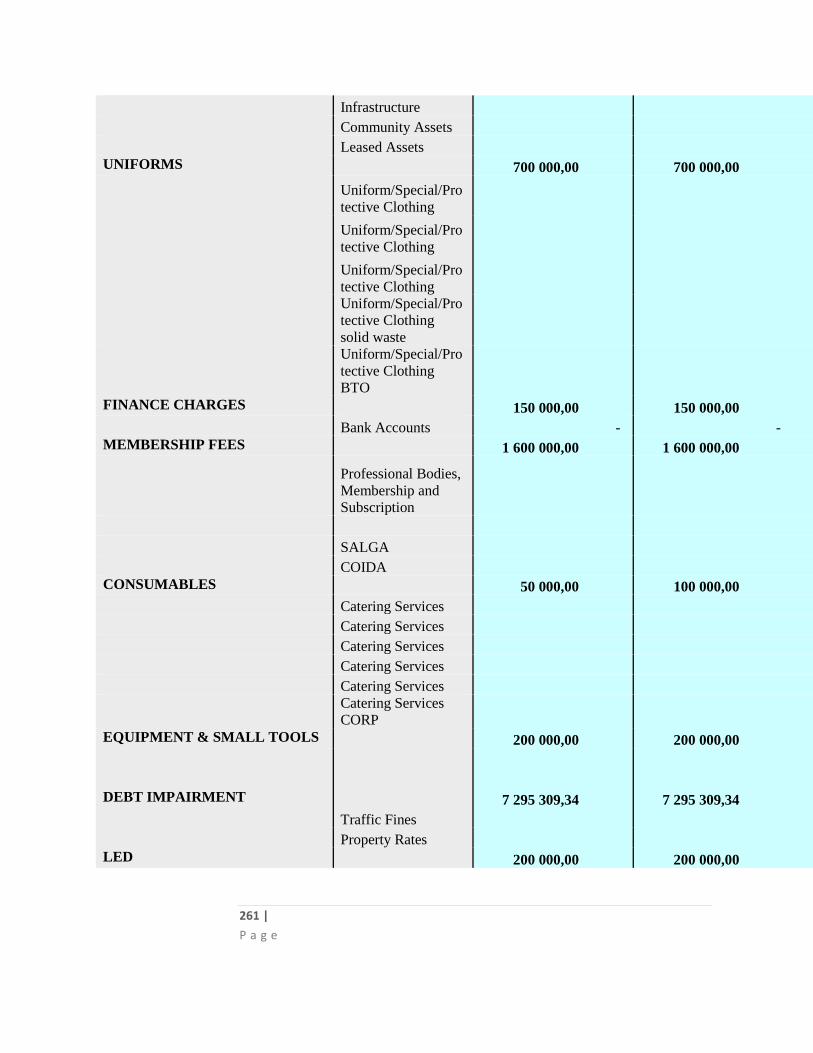
261 |
P a g e
Infrastructure Community Assets Leased Assets UNIFORMS 700 000,00 700 000,00 Uniform/Special/Pro
tective Clothing Uniform/Special/Pro
tective Clothing Uniform/Special/Pro
tective Clothing Uniform/Special/Pro
tective Clothing
solid waste Uniform/Special/Pro
tective Clothing
BTO FINANCE CHARGES 150 000,00 150 000,00 Bank Accounts - - MEMBERSHIP FEES 1 600 000,00 1 600 000,00
Professional Bodies,
Membership and
Subscription SALGA COIDA CONSUMABLES 50 000,00 100 000,00 Catering Services Catering Services Catering Services Catering Services Catering Services Catering Services
CORP EQUIPMENT & SMALL TOOLS 200 000,00 200 000,00 DEBT IMPAIRMENT 7 295 309,34 7 295 309,34 Traffic Fines Property Rates LED 200 000,00 200 000,00
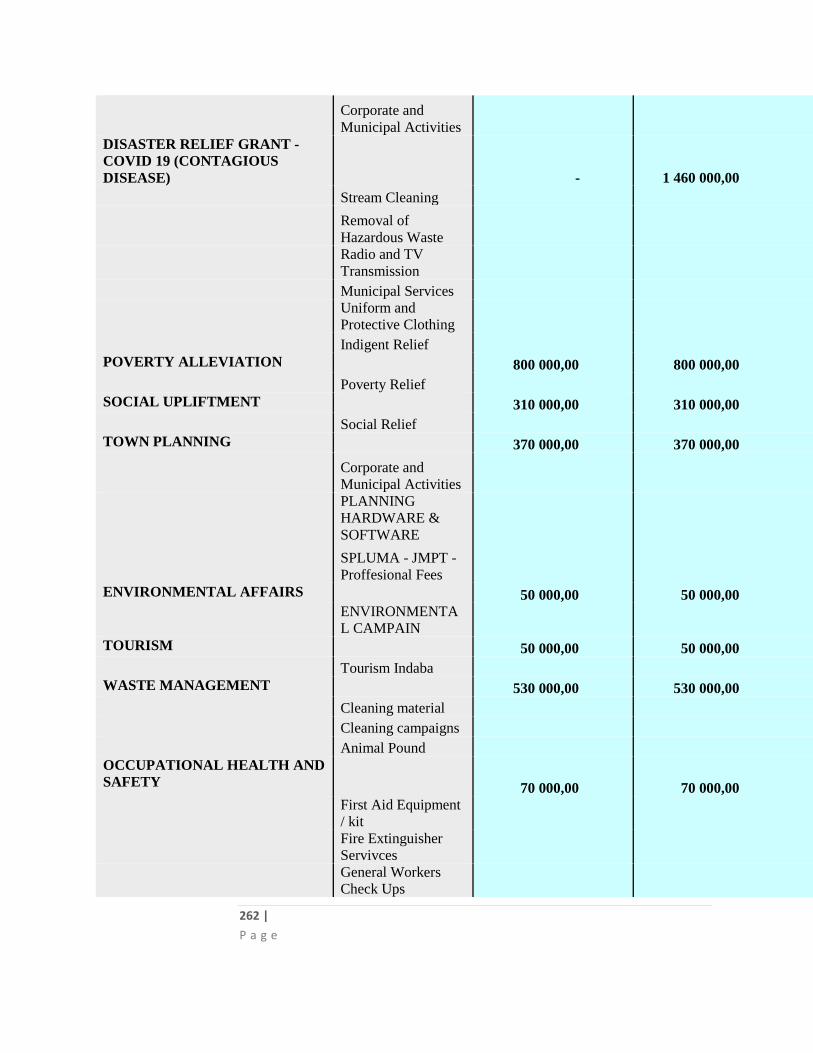
262 |
P a g e
Corporate and
Municipal Activities DISASTER RELIEF GRANT -
COVID 19 (CONTAGIOUS
DISEASE) - 1 460 000,00 Stream Cleaning
Removal of
Hazardous Waste
Radio and TV
Transmission Municipal Services
Uniform and
Protective Clothing Indigent Relief POVERTY ALLEVIATION 800 000,00 800 000,00 Poverty Relief SOCIAL UPLIFTMENT 310 000,00 310 000,00 Social Relief TOWN PLANNING 370 000,00 370 000,00 Corporate and
Municipal Activities PLANNING
HARDWARE &
SOFTWARE SPLUMA - JMPT -
Proffesional Fees ENVIRONMENTAL AFFAIRS 50 000,00 50 000,00 ENVIRONMENTA
L CAMPAIN TOURISM 50 000,00 50 000,00 Tourism Indaba WASTE MANAGEMENT 530 000,00 530 000,00 Cleaning material Cleaning campaigns Animal Pound OCCUPATIONAL HEALTH AND
SAFETY 70 000,00 70 000,00 First Aid Equipment
/ kit Fire Extinguisher
Servivces General Workers
Check Ups
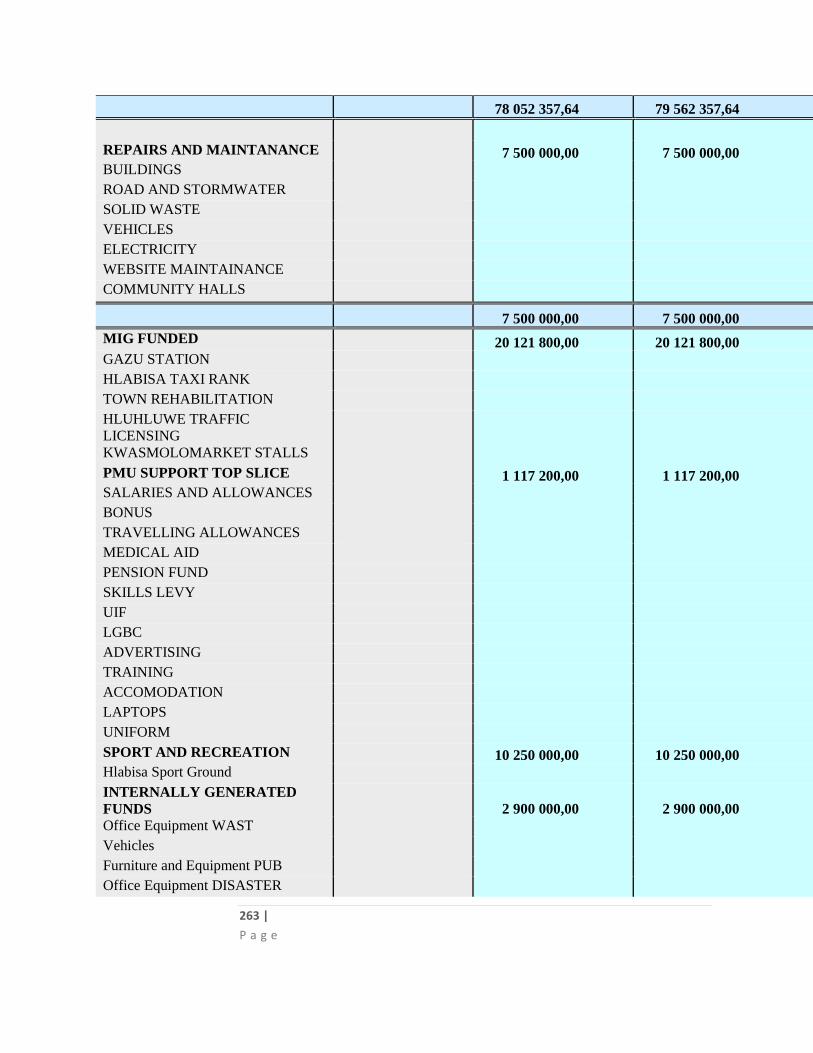
263 |
P a g e
78 052 357,64 79 562 357,64 REPAIRS AND MAINTANANCE 7 500 000,00 7 500 000,00 BUILDINGS ROAD AND STORMWATER SOLID WASTE VEHICLES ELECTRICITY WEBSITE MAINTAINANCE COMMUNITY HALLS 7 500 000,00 7 500 000,00 MIG FUNDED 20 121 800,00 20 121 800,00 GAZU STATION HLABISA TAXI RANK TOWN REHABILITATION HLUHLUWE TRAFFIC
LICENSING KWASMOLOMARKET STALLS PMU SUPPORT TOP SLICE 1 117 200,00 1 117 200,00 SALARIES AND ALLOWANCES BONUS TRAVELLING ALLOWANCES MEDICAL AID PENSION FUND SKILLS LEVY UIF LGBC ADVERTISING TRAINING ACCOMODATION LAPTOPS UNIFORM SPORT AND RECREATION 10 250 000,00 10 250 000,00 Hlabisa Sport Ground INTERNALLY GENERATED
FUNDS 2 900 000,00 2 900 000,00 Office Equipment WAST Vehicles Furniture and Equipment PUB Office Equipment DISASTER
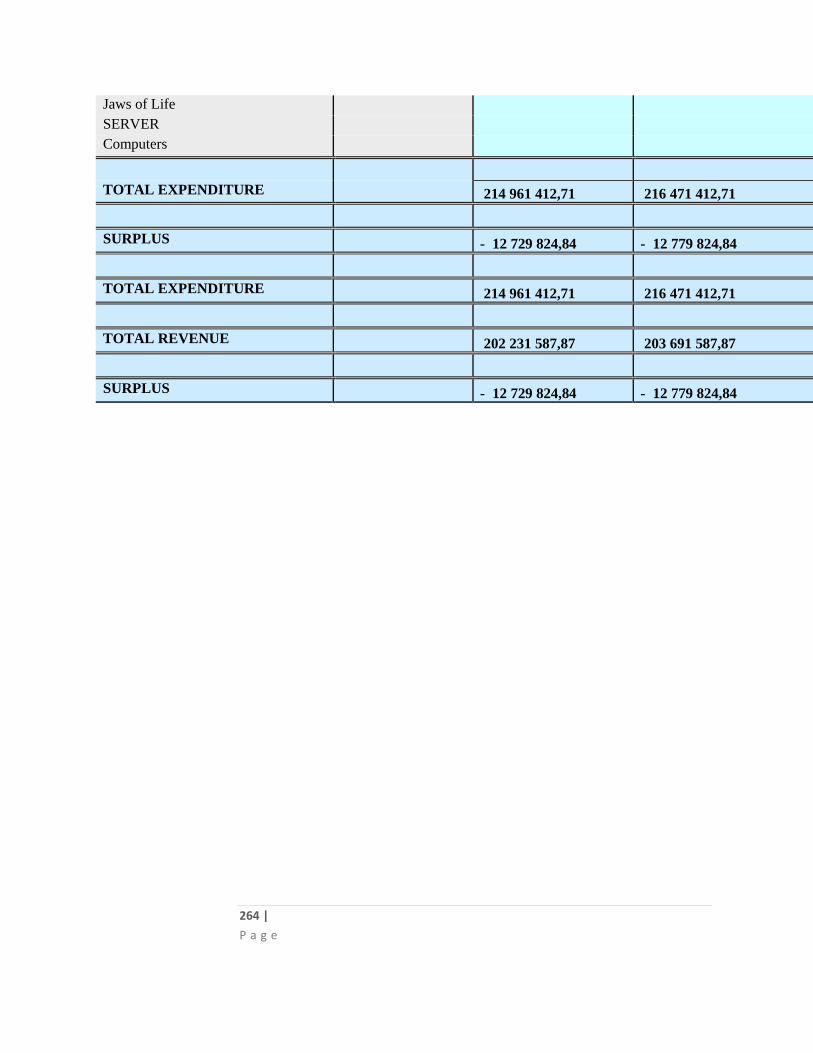
264 |
P a g e
Jaws of Life SERVER Computers TOTAL EXPENDITURE 214 961 412,71 216 471 412,71 SURPLUS - 12 729 824,84 - 12 779 824,84 TOTAL EXPENDITURE 214 961 412,71 216 471 412,71 TOTAL REVENUE 202 231 587,87 203 691 587,87 SURPLUS - 12 729 824,84 - 12 779 824,84
265 |
P a g e
1.11. CONCLUSION
1.11.1 The continued improvement and development of an effective financial planning process aids the
actualization of fulfilling its facilitating role to capacitate the community to build a prosperous
future for all.
1.11.2 The Financial planning imperatives contribute to ensuring that the Municipality remains
financially viable and that municipal services are provided economically to all communities.
1.11.3 The Multi-year Financial Plan contains realistic and credible revenue and expenditure forecasts
which should provide a sound basis for improved financial management and institutional
development as well as service delivery improvements and implementation.
1.11.4 The strategy towards cash backing will certainly ensure the sustainability of the Municipality over
the medium-to long-term.
1.11.5 The Municipality is currently fully reliant on grant funding to address the huge backlog in
infrastructure. It is not possible at this point in time to take up further loans due to the high level
of outstanding debtors. This then also impacts on the Council’s ability to address revenue
allocation for previously un-serviced areas from internal revenue.
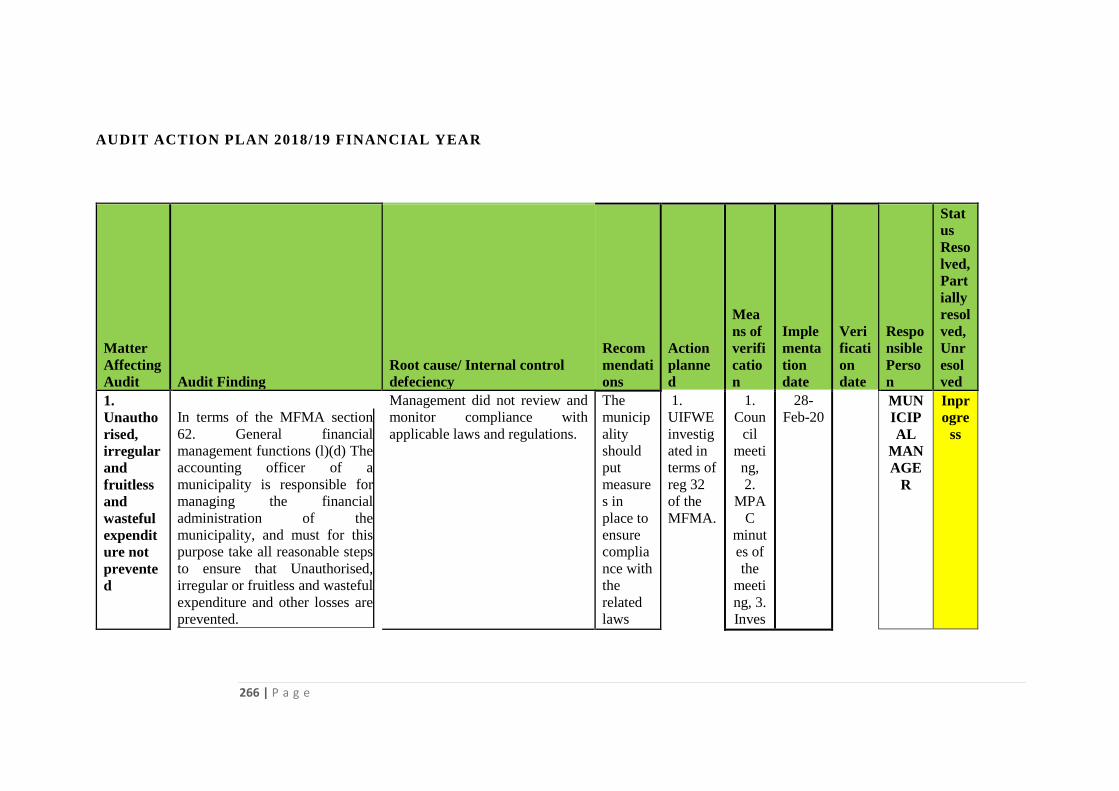
266 | P a g e
AUDIT ACTION PLAN 2018/19 FINANCIAL YEAR
Matter
Affecting
Audit Audit Finding
Root cause/ Internal control
defeciency
Recom
mendati
ons
Action
planne
d
Mea
ns of
verifi
catio
n
Imple
menta
tion
date
Veri
ficati
on
date
Respo
nsible
Perso
n
Stat
us
Reso
lved,
Part
ially
resol
ved,
Unr
esol
ved 1.
Unautho
rised,
irregular
and
fruitless
and
wasteful
expendit
ure not
prevente
d
In terms of the MFMA section
62. General financial
management functions (l)(d) The
accounting officer of a
municipality is responsible for
managing the financial
administration of the
municipality, and must for this
purpose take all reasonable steps
to ensure that Unauthorised,
irregular or fruitless and wasteful
expenditure and other losses are
prevented.
Management did not review and
monitor compliance with
applicable laws and regulations.
The
municip
ality
should
put
measure
s in
place to
ensure
complia
nce with
the
related
laws
1.
UIFWE
investig
ated in
terms of
reg 32
of the
MFMA.
1.
Coun
cil
meeti
ng,
2.
MPA
C
minut
es of
the
meeti
ng, 3.
Inves
28-
Feb-20
MUN
ICIP
AL
MAN
AGE
R
Inpr
ogre
ss
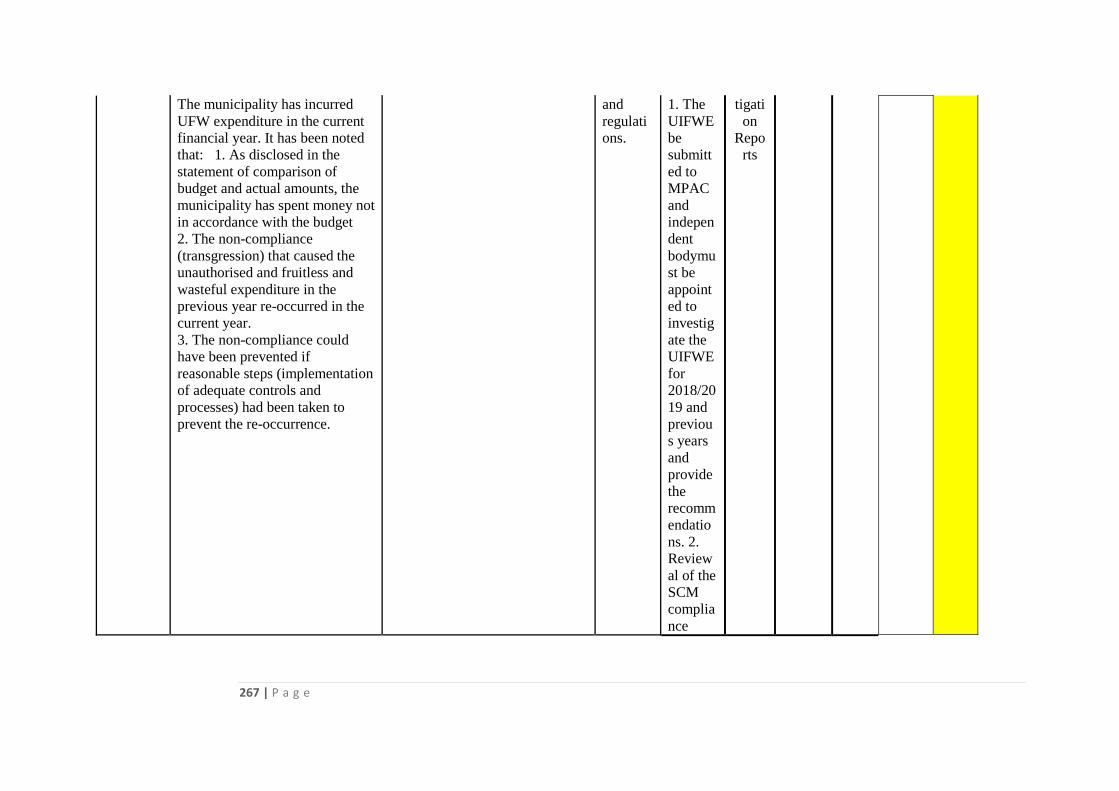
267 | P a g e
The municipality has incurred
UFW expenditure in the current
financial year. It has been noted
that: 1. As disclosed in the
statement of comparison of
budget and actual amounts, the
municipality has spent money not
in accordance with the budget
2. The non-compliance
(transgression) that caused the
unauthorised and fruitless and
wasteful expenditure in the
previous year re-occurred in the
current year.
3. The non-compliance could
have been prevented if
reasonable steps (implementation
of adequate controls and
processes) had been taken to
prevent the re-occurrence.
and
regulati
ons.
1. The
UIFWE
be
submitt
ed to
MPAC
and
indepen
dent
bodymu
st be
appoint
ed to
investig
ate the
UIFWE
for
2018/20
19 and
previou
s years
and
provide
the
recomm
endatio
ns. 2.
Review
al of the
SCM
complia
nce
tigati
on
Repo
rts
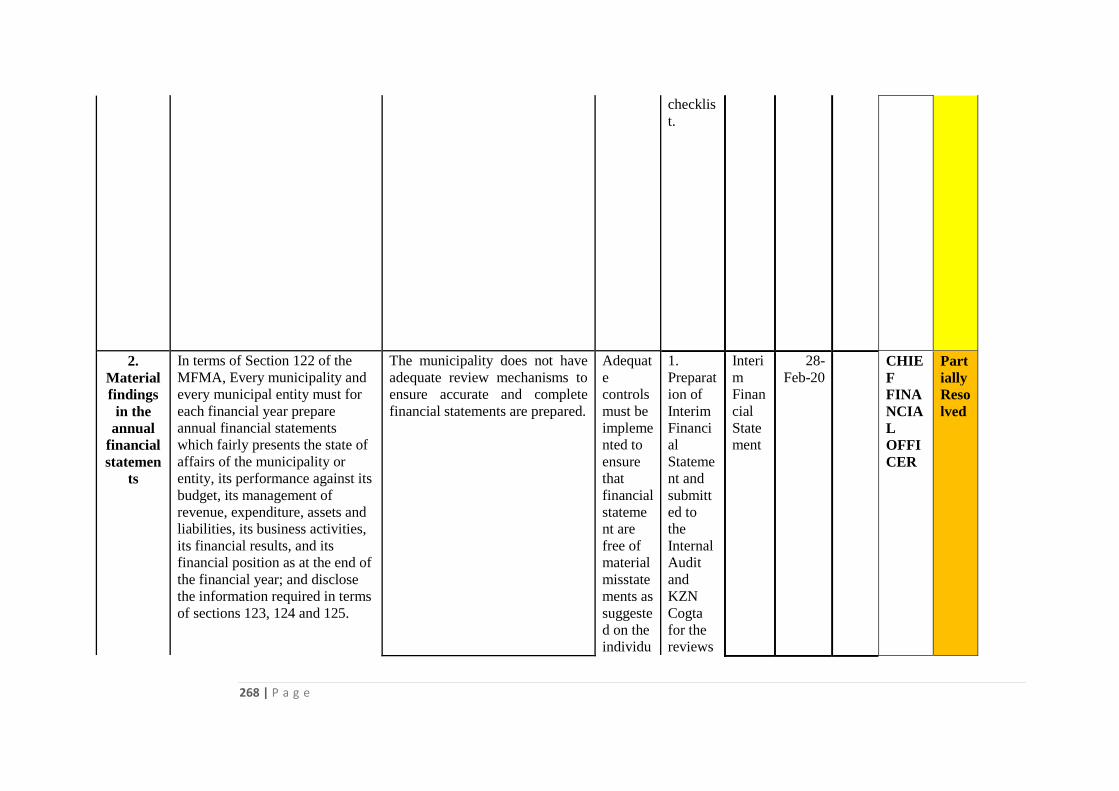
268 | P a g e
checklis
t.
2.
Material
findings
in the
annual
financial
statemen
ts
In terms of Section 122 of the
MFMA, Every municipality and
every municipal entity must for
each financial year prepare
annual financial statements
which fairly presents the state of
affairs of the municipality or
entity, its performance against its
budget, its management of
revenue, expenditure, assets and
liabilities, its business activities,
its financial results, and its
financial position as at the end of
the financial year; and disclose
the information required in terms
of sections 123, 124 and 125.
The municipality does not have
adequate review mechanisms to
ensure accurate and complete
financial statements are prepared.
Adequat
e
controls
must be
impleme
nted to
ensure
that
financial
stateme
nt are
free of
material
misstate
ments as
suggeste
d on the
individu
1.
Preparat
ion of
Interim
Financi
al
Stateme
nt and
submitt
ed to
the
Internal
Audit
and
KZN
Cogta
for the
reviews
Interi
m
Finan
cial
State
ment
28-
Feb-20
CHIE
F
FINA
NCIA
L
OFFI
CER
Part
ially
Reso
lved
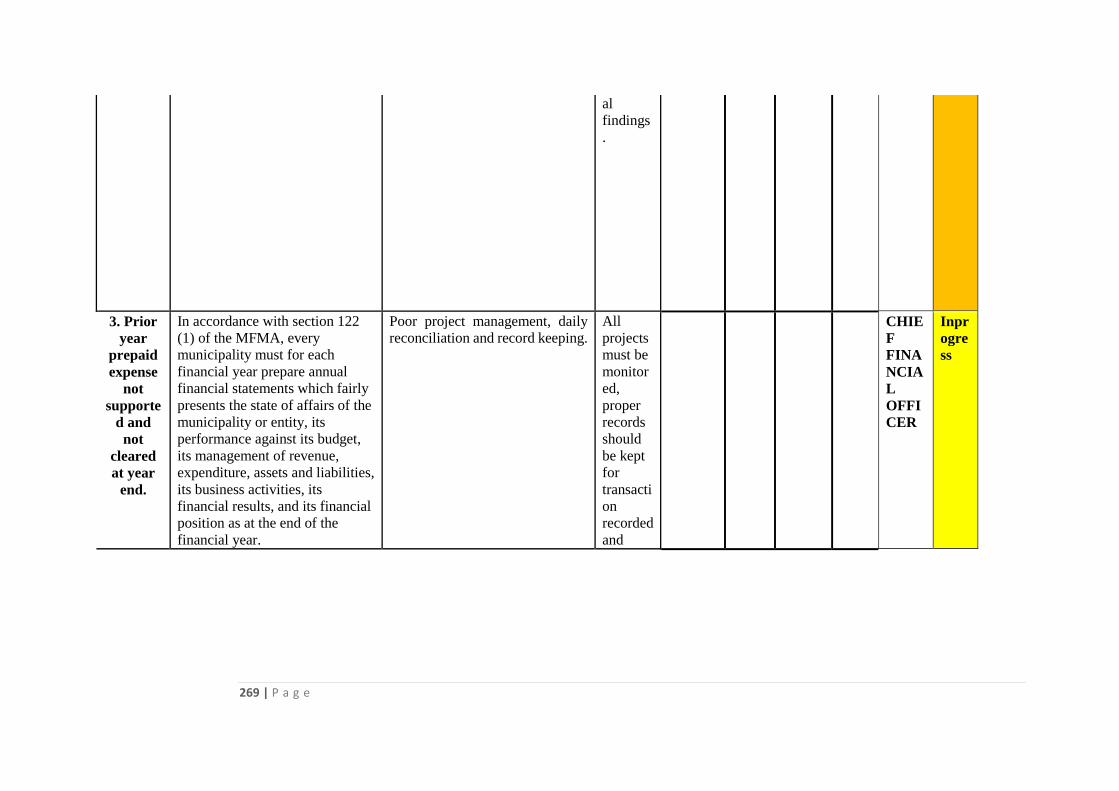
269 | P a g e
al
findings
.
3. Prior
year
prepaid
expense
not
supporte
d and
not
cleared
at year
end.
In accordance with section 122
(1) of the MFMA, every
municipality must for each
financial year prepare annual
financial statements which fairly
presents the state of affairs of the
municipality or entity, its
performance against its budget,
its management of revenue,
expenditure, assets and liabilities,
its business activities, its
financial results, and its financial
position as at the end of the
financial year.
Poor project management, daily
reconciliation and record keeping.
All
projects
must be
monitor
ed,
proper
records
should
be kept
for
transacti
on
recorded
and
CHIE
F
FINA
NCIA
L
OFFI
CER
Inpr
ogre
ss
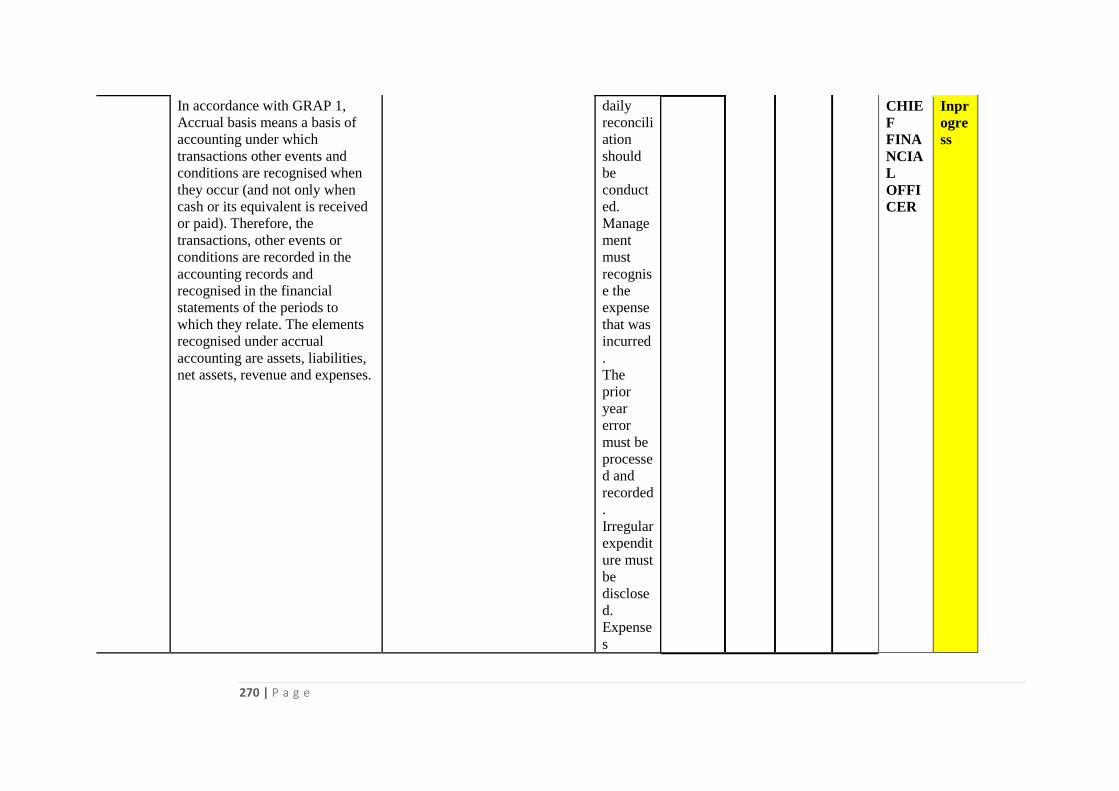
270 | P a g e
In accordance with GRAP 1,
Accrual basis means a basis of
accounting under which
transactions other events and
conditions are recognised when
they occur (and not only when
cash or its equivalent is received
or paid). Therefore, the
transactions, other events or
conditions are recorded in the
accounting records and
recognised in the financial
statements of the periods to
which they relate. The elements
recognised under accrual
accounting are assets, liabilities,
net assets, revenue and expenses.
daily
reconcili
ation
should
be
conduct
ed.
Manage
ment
must
recognis
e the
expense
that was
incurred
.
The
prior
year
error
must be
processe
d and
recorded
.
Irregular
expendit
ure must
be
disclose
d.
Expense
s
CHIE
F
FINA
NCIA
L
OFFI
CER
Inpr
ogre
ss
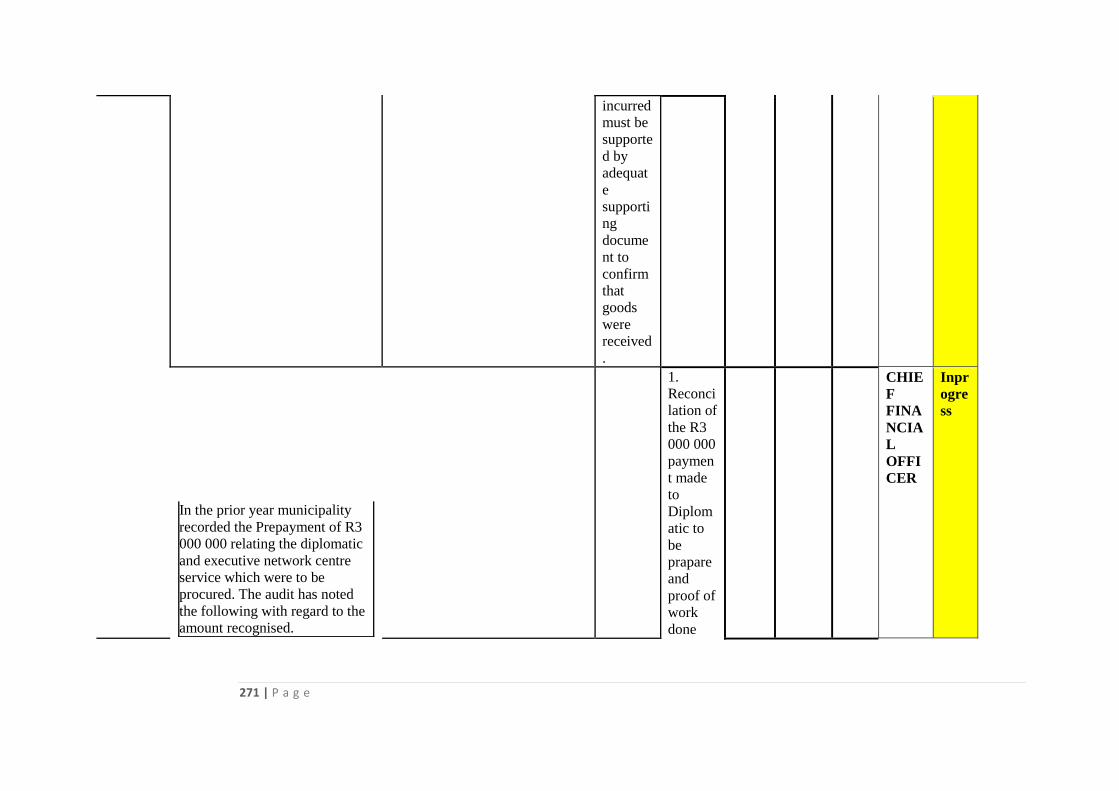
271 | P a g e
incurred
must be
supporte
d by
adequat
e
supporti
ng
docume
nt to
confirm
that
goods
were
received
.
In the prior year municipality
recorded the Prepayment of R3
000 000 relating the diplomatic
and executive network centre
service which were to be
procured. The audit has noted
the following with regard to the
amount recognised.
1.
Reconci
lation of
the R3
000 000
paymen
t made
to
Diplom
atic to
be
prapare
and
proof of
work
done
CHIE
F
FINA
NCIA
L
OFFI
CER
Inpr
ogre
ss
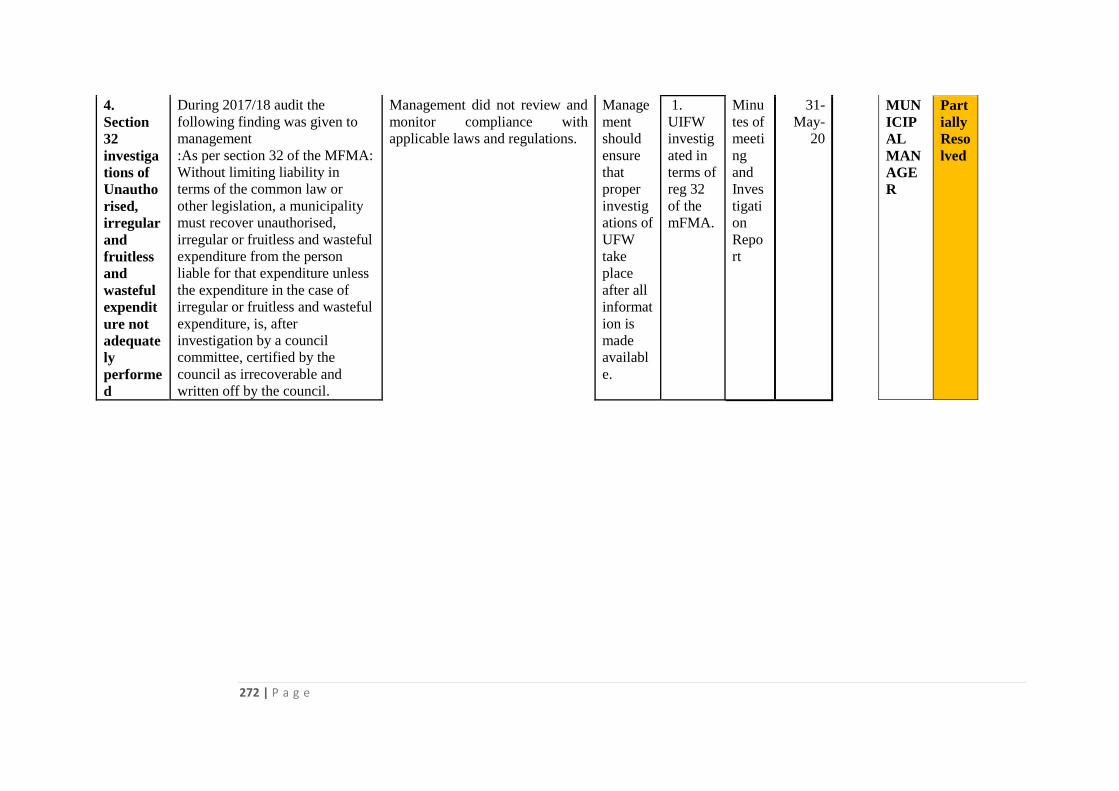
272 | P a g e
4.
Section
32
investiga
tions of
Unautho
rised,
irregular
and
fruitless
and
wasteful
expendit
ure not
adequate
ly
performe
d
During 2017/18 audit the
following finding was given to
management
:As per section 32 of the MFMA:
Without limiting liability in
terms of the common law or
other legislation, a municipality
must recover unauthorised,
irregular or fruitless and wasteful
expenditure from the person
liable for that expenditure unless
the expenditure in the case of
irregular or fruitless and wasteful
expenditure, is, after
investigation by a council
committee, certified by the
council as irrecoverable and
written off by the council.
Management did not review and
monitor compliance with
applicable laws and regulations.
Manage
ment
should
ensure
that
proper
investig
ations of
UFW
take
place
after all
informat
ion is
made
availabl
e.
1.
UIFW
investig
ated in
terms of
reg 32
of the
mFMA.
Minu
tes of
meeti
ng
and
Inves
tigati
on
Repo
rt
31-
May-
20
MUN
ICIP
AL
MAN
AGE
R
Part
ially
Reso
lved
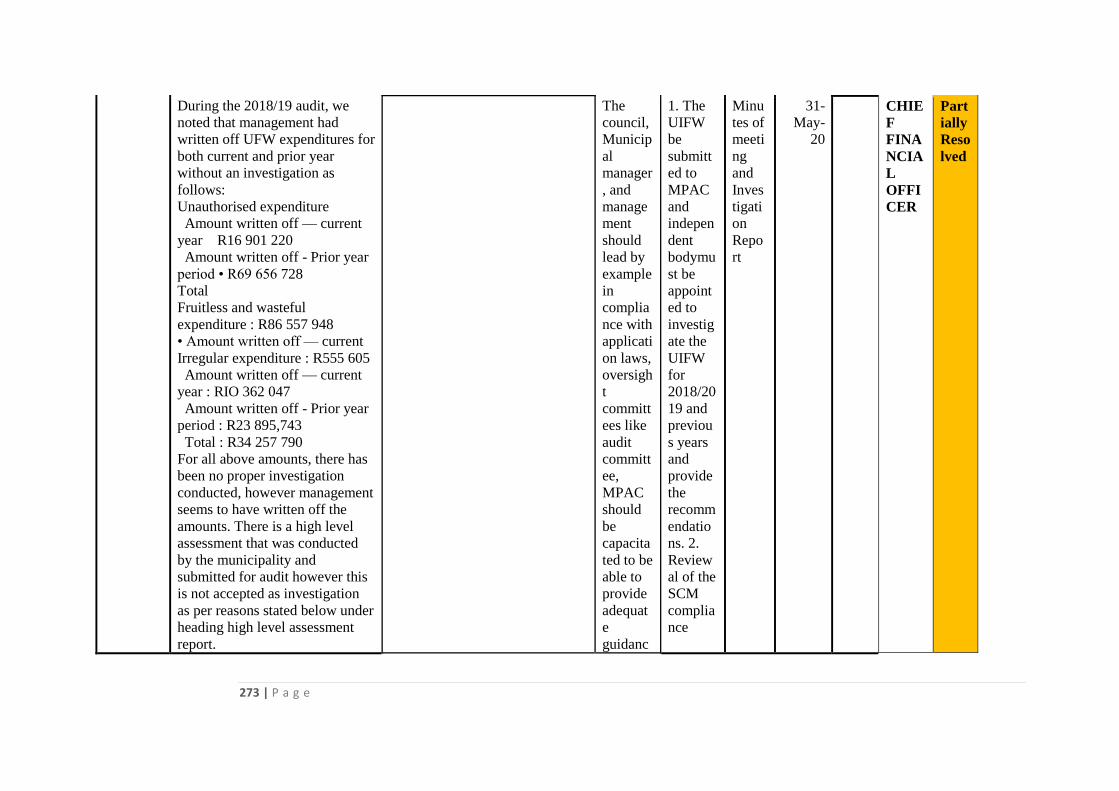
273 | P a g e
During the 2018/19 audit, we
noted that management had
written off UFW expenditures for
both current and prior year
without an investigation as
follows:
Unauthorised expenditure
Amount written off — current
year R16 901 220
Amount written off - Prior year
period • R69 656 728
Total
Fruitless and wasteful
expenditure : R86 557 948
• Amount written off — current
Irregular expenditure : R555 605
Amount written off — current
year : RIO 362 047
Amount written off - Prior year
period : R23 895,743
Total : R34 257 790
For all above amounts, there has
been no proper investigation
conducted, however management
seems to have written off the
amounts. There is a high level
assessment that was conducted
by the municipality and
submitted for audit however this
is not accepted as investigation
as per reasons stated below under
heading high level assessment
report.
The
council,
Municip
al
manager
, and
manage
ment
should
lead by
example
in
complia
nce with
applicati
on laws,
oversigh
t
committ
ees like
audit
committ
ee,
MPAC
should
be
capacita
ted to be
able to
provide
adequat
e
guidanc
1. The
UIFW
be
submitt
ed to
MPAC
and
indepen
dent
bodymu
st be
appoint
ed to
investig
ate the
UIFW
for
2018/20
19 and
previou
s years
and
provide
the
recomm
endatio
ns. 2.
Review
al of the
SCM
complia
nce
Minu
tes of
meeti
ng
and
Inves
tigati
on
Repo
rt
31-
May-
20
CHIE
F
FINA
NCIA
L
OFFI
CER
Part
ially
Reso
lved
274 | P a g e
e.
Municip
ality
should
reverse
all
expendit
ure
write off
without
a proper
investig
ation.
Municip
ality
must
conduct
the
investig
ation in
accorda
nce with
require
ment of
section
32, the
properly
conduct
ed
investig
ation
should
be sent
checklis
t.
275 | P a g e
to
council
for
adoption
.
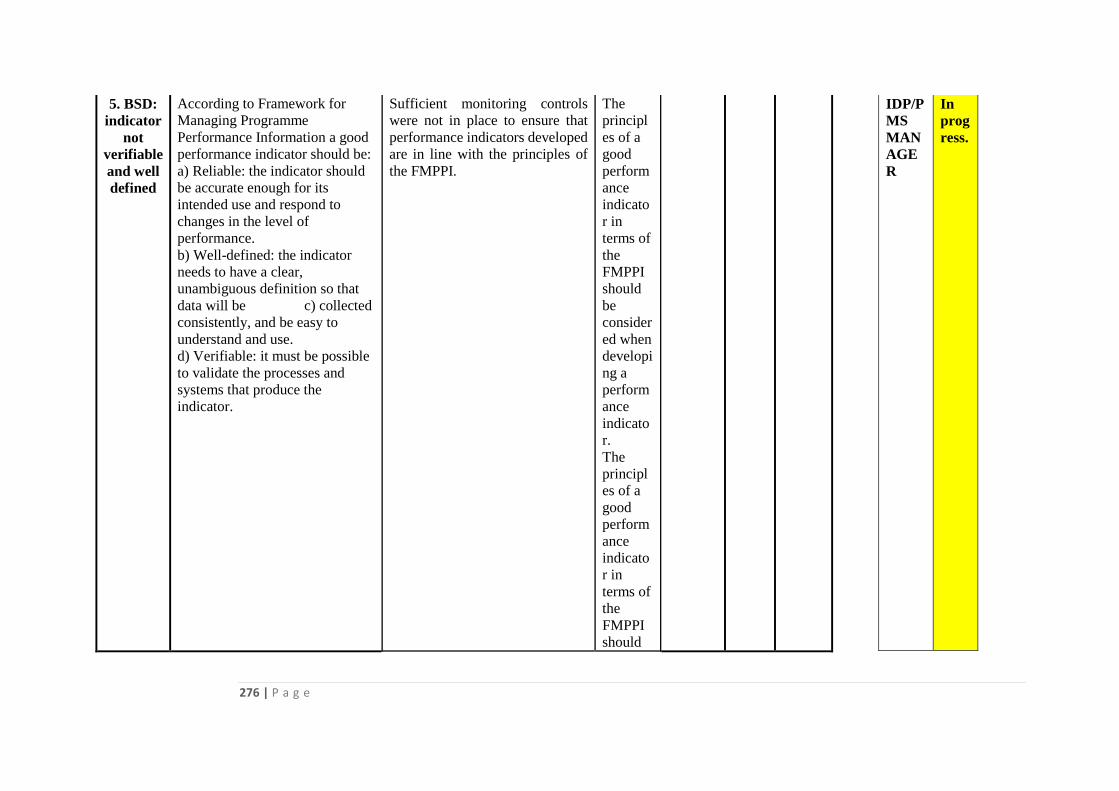
276 | P a g e
5. BSD:
indicator
not
verifiable
and well
defined
According to Framework for
Managing Programme
Performance Information a good
performance indicator should be:
a) Reliable: the indicator should
be accurate enough for its
intended use and respond to
changes in the level of
performance.
b) Well-defined: the indicator
needs to have a clear,
unambiguous definition so that
data will be c) collected
consistently, and be easy to
understand and use.
d) Verifiable: it must be possible
to validate the processes and
systems that produce the
indicator.
Sufficient monitoring controls
were not in place to ensure that
performance indicators developed
are in line with the principles of
the FMPPI.
The
principl
es of a
good
perform
ance
indicato
r in
terms of
the
FMPPI
should
be
consider
ed when
developi
ng a
perform
ance
indicato
r.
The
principl
es of a
good
perform
ance
indicato
r in
terms of
the
FMPPI
should
IDP/P
MS
MAN
AGE
R
In
prog
ress.
277 | P a g e
be
consider
ed when
developi
ng a
perform
ance
indicato
r.
The
perform
ance
manage
ment
section
should
perform
an
assessm
ent of
all
perfoma
nce
indicato
rs
develop
ed by
the
municip
ality to
ensure
that
these
278 | P a g e
indicato
rs are in
line
with the
principl
es of a
good
perform
ance
indicato
r in
terms of
the
FMPPI.
Technic
al
indicato
r
descripti
on
should
be
develop
ed and
adequat
e
measure
of
output
should
be
identifie
d.
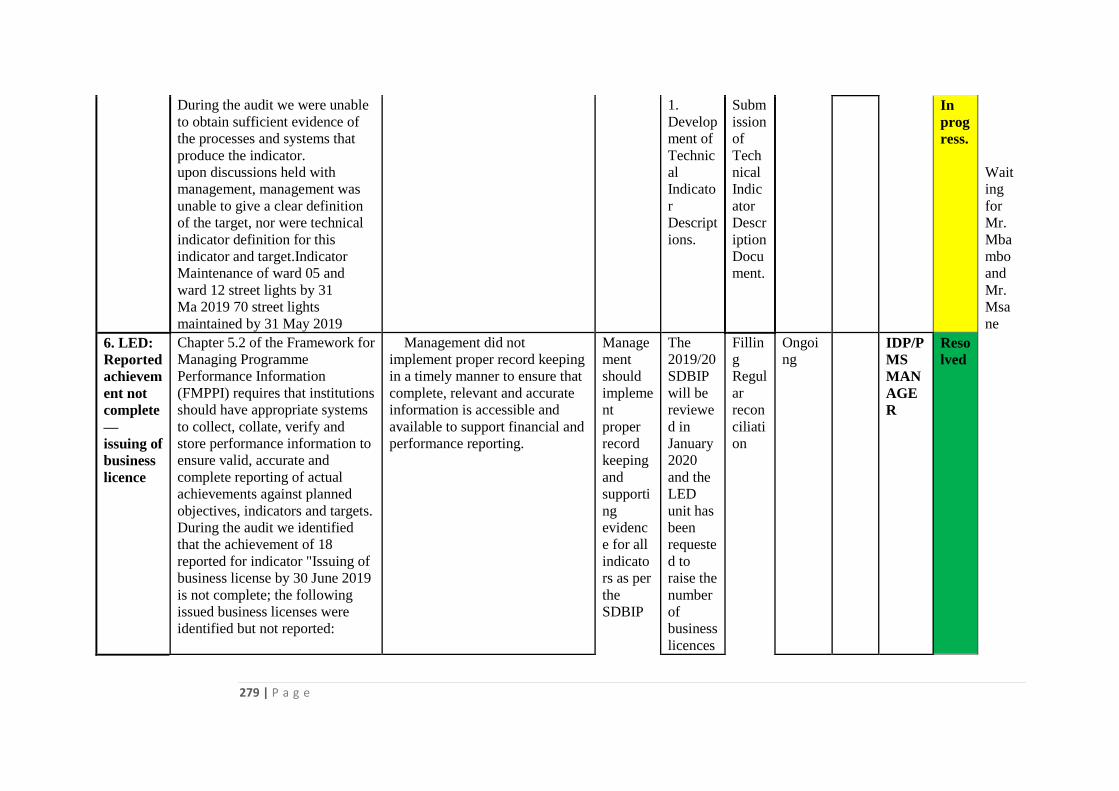
279 | P a g e
During the audit we were unable
to obtain sufficient evidence of
the processes and systems that
produce the indicator.
upon discussions held with
management, management was
unable to give a clear definition
of the target, nor were technical
indicator definition for this
indicator and target.Indicator
Maintenance of ward 05 and
ward 12 street lights by 31
Ma 2019 70 street lights
maintained by 31 May 2019
1.
Develop
ment of
Technic
al
Indicato
r
Descript
ions.
Subm
ission
of
Tech
nical
Indic
ator
Descr
iption
Docu
ment.
In
prog
ress.
Wait
ing
for
Mr.
Mba
mbo
and
Mr.
Msa
ne
6. LED:
Reported
achievem
ent not
complete
—
issuing of
business
licence
Chapter 5.2 of the Framework for
Managing Programme
Performance Information
(FMPPI) requires that institutions
should have appropriate systems
to collect, collate, verify and
store performance information to
ensure valid, accurate and
complete reporting of actual
achievements against planned
objectives, indicators and targets.
During the audit we identified
that the achievement of 18
reported for indicator "Issuing of
business license by 30 June 2019
is not complete; the following
issued business licenses were
identified but not reported:
Management did not
implement proper record keeping
in a timely manner to ensure that
complete, relevant and accurate
information is accessible and
available to support financial and
performance reporting.
Manage
ment
should
impleme
nt
proper
record
keeping
and
supporti
ng
evidenc
e for all
indicato
rs as per
the
SDBIP
The
2019/20
SDBIP
will be
reviewe
d in
January
2020
and the
LED
unit has
been
requeste
d to
raise the
number
of
business
licences
Fillin
g
Regul
ar
recon
ciliati
on
Ongoi
ng
IDP/P
MS
MAN
AGE
R
Reso
lved
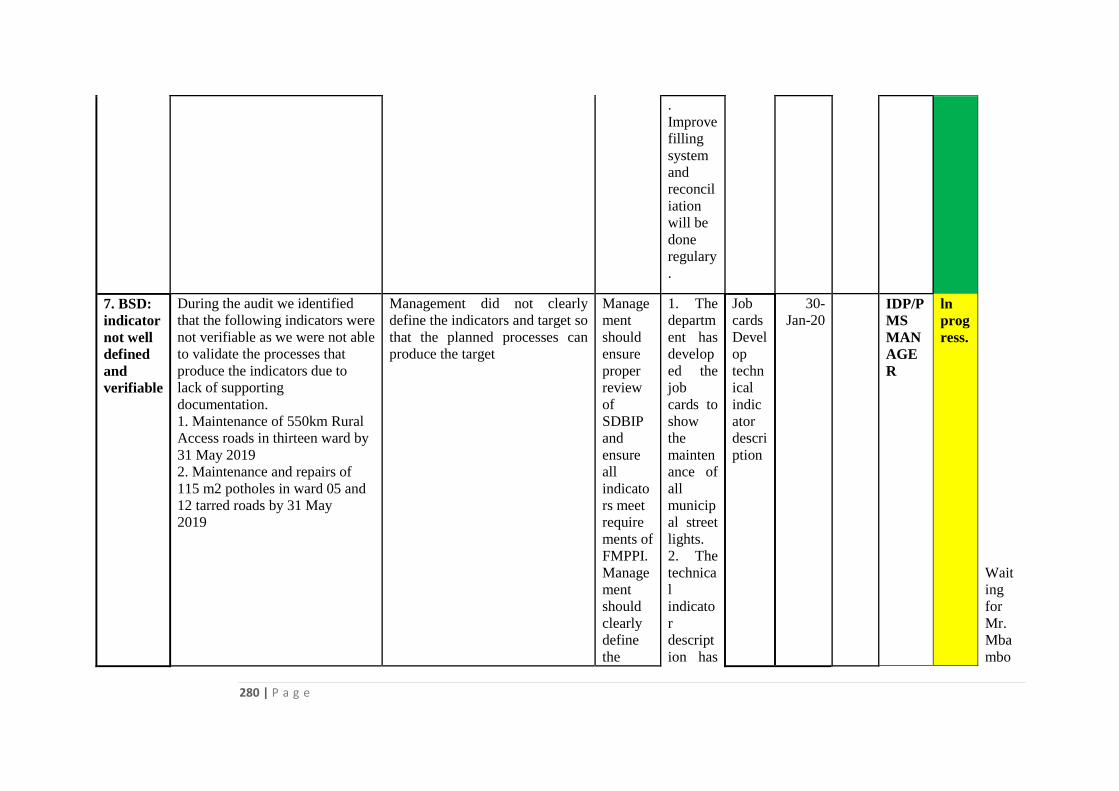
280 | P a g e
.
Improve
filling
system
and
reconcil
iation
will be
done
regulary
.
7. BSD:
indicator
not well
defined
and
verifiable
During the audit we identified
that the following indicators were
not verifiable as we were not able
to validate the processes that
produce the indicators due to
lack of supporting
documentation.
1. Maintenance of 550km Rural
Access roads in thirteen ward by
31 May 2019
2. Maintenance and repairs of
115 m2 potholes in ward 05 and
12 tarred roads by 31 May
2019
Management did not clearly
define the indicators and target so
that the planned processes can
produce the target
Manage
ment
should
ensure
proper
review
of
SDBIP
and
ensure
all
indicato
rs meet
require
ments of
FMPPI.
Manage
ment
should
clearly
define
the
1. The
departm
ent has
develop
ed the
job
cards to
show
the
mainten
ance of
all
municip
al street
lights.
2. The
technica
l
indicato
r
descript
ion has
Job
cards
Devel
op
techn
ical
indic
ator
descri
ption
30-
Jan-20
IDP/P
MS
MAN
AGE
R
ln
prog
ress.
Wait
ing
for
Mr.
Mba
mbo
281 | P a g e
supporti
ng
evidenc
e that
will be
used to
report
on the
indicato
rs and
the
evidenc
e must
relate
logically
to the
indicato
r and
target
planned.
Manage
ment
should
consider
developi
ng
technica
l
indicato
r
descripti
ons for
each of
been
develop
ed and
Cogta
promise
us to
help to
check
the
credibili
ty of it.
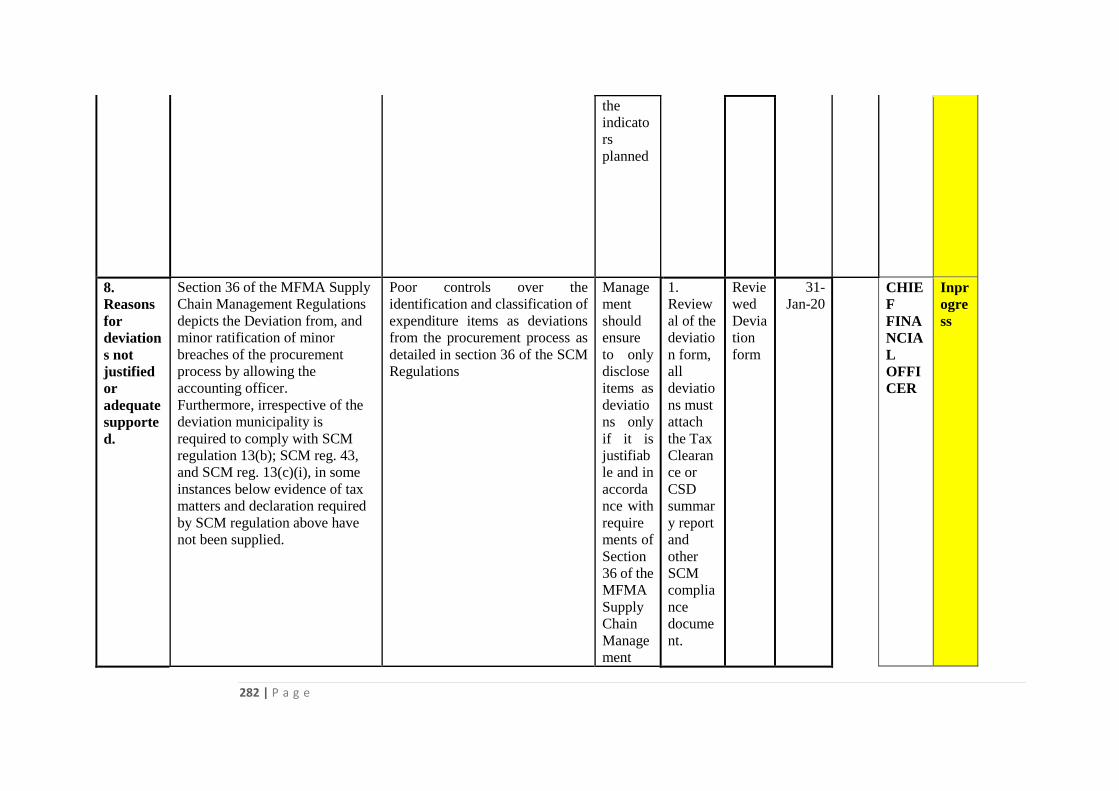
282 | P a g e
the
indicato
rs
planned
8.
Reasons
for
deviation
s not
justified
or
adequate
supporte
d.
Section 36 of the MFMA Supply
Chain Management Regulations
depicts the Deviation from, and
minor ratification of minor
breaches of the procurement
process by allowing the
accounting officer.
Furthermore, irrespective of the
deviation municipality is
required to comply with SCM
regulation 13(b); SCM reg. 43,
and SCM reg. 13(c)(i), in some
instances below evidence of tax
matters and declaration required
by SCM regulation above have
not been supplied.
Poor controls over the
identification and classification of
expenditure items as deviations
from the procurement process as
detailed in section 36 of the SCM
Regulations
Manage
ment
should
ensure
to only
disclose
items as
deviatio
ns only
if it is
justifiab
le and in
accorda
nce with
require
ments of
Section
36 of the
MFMA
Supply
Chain
Manage
ment
1.
Review
al of the
deviatio
n form,
all
deviatio
ns must
attach
the Tax
Clearan
ce or
CSD
summar
y report
and
other
SCM
complia
nce
docume
nt.
Revie
wed
Devia
tion
form
31-
Jan-20
CHIE
F
FINA
NCIA
L
OFFI
CER
Inpr
ogre
ss
283 | P a g e
Regulati
ons. The
above
must be
disclose
d as
irregular
expendit
ure
OTHER IMPORTANT MATTERS -
ANNEXURE B
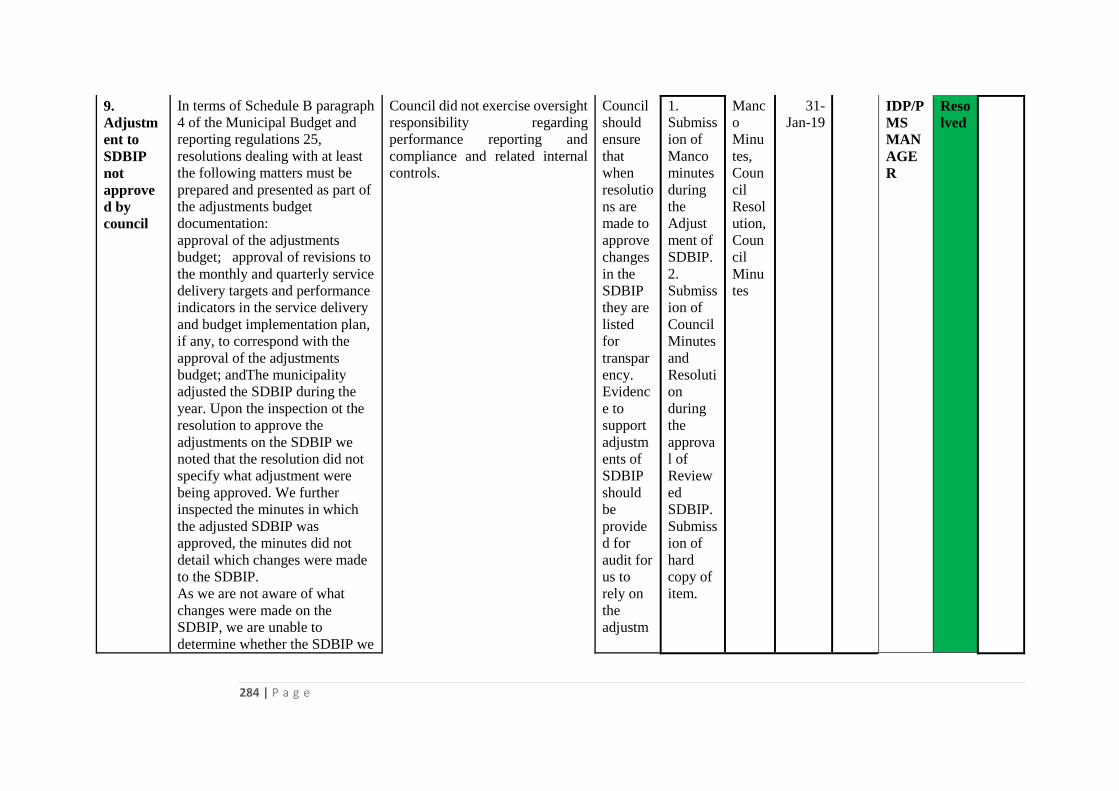
284 | P a g e
9.
Adjustm
ent to
SDBIP
not
approve
d by
council
In terms of Schedule B paragraph
4 of the Municipal Budget and
reporting regulations 25,
resolutions dealing with at least
the following matters must be
prepared and presented as part of
the adjustments budget
documentation:
approval of the adjustments
budget; approval of revisions to
the monthly and quarterly service
delivery targets and performance
indicators in the service delivery
and budget implementation plan,
if any, to correspond with the
approval of the adjustments
budget; andThe municipality
adjusted the SDBIP during the
year. Upon the inspection ot the
resolution to approve the
adjustments on the SDBIP we
noted that the resolution did not
specify what adjustment were
being approved. We further
inspected the minutes in which
the adjusted SDBIP was
approved, the minutes did not
detail which changes were made
to the SDBIP.
As we are not aware of what
changes were made on the
SDBIP, we are unable to
determine whether the SDBIP we
Council did not exercise oversight
responsibility regarding
performance reporting and
compliance and related internal
controls.
Council
should
ensure
that
when
resolutio
ns are
made to
approve
changes
in the
SDBIP
they are
listed
for
transpar
ency.
Evidenc
e to
support
adjustm
ents of
SDBIP
should
be
provide
d for
audit for
us to
rely on
the
adjustm
1.
Submiss
ion of
Manco
minutes
during
the
Adjust
ment of
SDBIP.
2.
Submiss
ion of
Council
Minutes
and
Resoluti
on
during
the
approva
l of
Review
ed
SDBIP.
Submiss
ion of
hard
copy of
item.
Manc
o
Minu
tes,
Coun
cil
Resol
ution,
Coun
cil
Minu
tes
31-
Jan-19
IDP/P
MS
MAN
AGE
R
Reso
lved
285 | P a g e
are auditing is the correct version
and whether all changes that
were approved are included in
the SDBIP submitted for audit.
ent
budget.
286 | P a g e
10.
Relevant
indicator
s and
targets
not
reported
on
As per Municipal System Act
para 26. Core components of
integrated development plans. An
integrated development plan
must reflect the council's
development priorities and
objectives for its elected term,
including its local economic
development aims and its internal
transformation needs.
Upon review of the planning and
reporting documents for local
economic development, it was
identified that relevant indicators
and targets are not included. The
indicators and targets include
development of strategies and
policies which are of an
operational nature and excludes
indicators and targets that
indicate service delivery.
An example is that the
municipality has spent R2
million on poverty alleviation
projects (subsidies and donations
to the public) in the current
financial year yet there is no
disclosure of this service delivery
in the performance information.
This results in the public not
being informed of relevant
information relating to service
delivery and municipal officials
Management should ensure that
all relevant information is
reported in the performance
information documents of the
municipality.
Manage
ment
should
ensure
that all
relevant
informat
ion is
reported
in the
perform
ance
informat
ion
docume
nts of
the
municip
ality.
1. The
KPI
will be
include
d during
the
SDBIP
review
period.
Revie
wed
SDBI
P
Ongoi
ng
IDP/P
MS
MAN
AGE
R
Reso
lved
287 | P a g e
not being measured on items that
impact actual service delivery.
288 | P a g e
11.
Reason
for non-
achievem
ent of
target is
not
supporte
d by
valid
evidence.
In terms of Section 46 of the
Municipal systems act, a
municipality must prepare for
each financial year a
performance report reflecting -
The performance of the
municipality and of each external
service provider during that
financial year;
A comparison of the
performances referred to in
paragraph (a) with targets set for
and performances in the previous
financial year; and Measures
taken to improve performance.
During the audit we noted that
the reason for variance disclosed
is not supported by valid
evidence. The reason for
variance as disclosed is "No
budgeted in this financial year"
The calculations below
demonstrate that the budget for
the year was not fully utilised.
Remaining budget is 28% of
allocated amount for the period
while remaining work is only
15%, this clearly shows that
budget was available in the
current period.
Management did not ensure that
regular and accurate performance
reports were prepared, which
were supported and evidenced by
reliable information.
The
municip
ality is
not
required
to
disclose
reasons
for
variance
s; the
national
treasury
annual
report
guide
only
requires
the
municip
ality to
disclose
measure
s taken
or to be
taken to
improve
perform
ance.
Howeve
r, as the
municip
ality has
SDBIP
will be
reviewe
d.
IDP/P
MS
MAN
AGE
R
Reso
lved
289 | P a g e
chosen
to
disclose
the
reasons
for
deviatio
n, the
reasons
disclose
d must
be
supporte
d valid
evidenc
e.
Manage
ment
should
properly
review
the
annual
perform
ance
report to
ensure
the that
reasons
for
variance
s
disclose
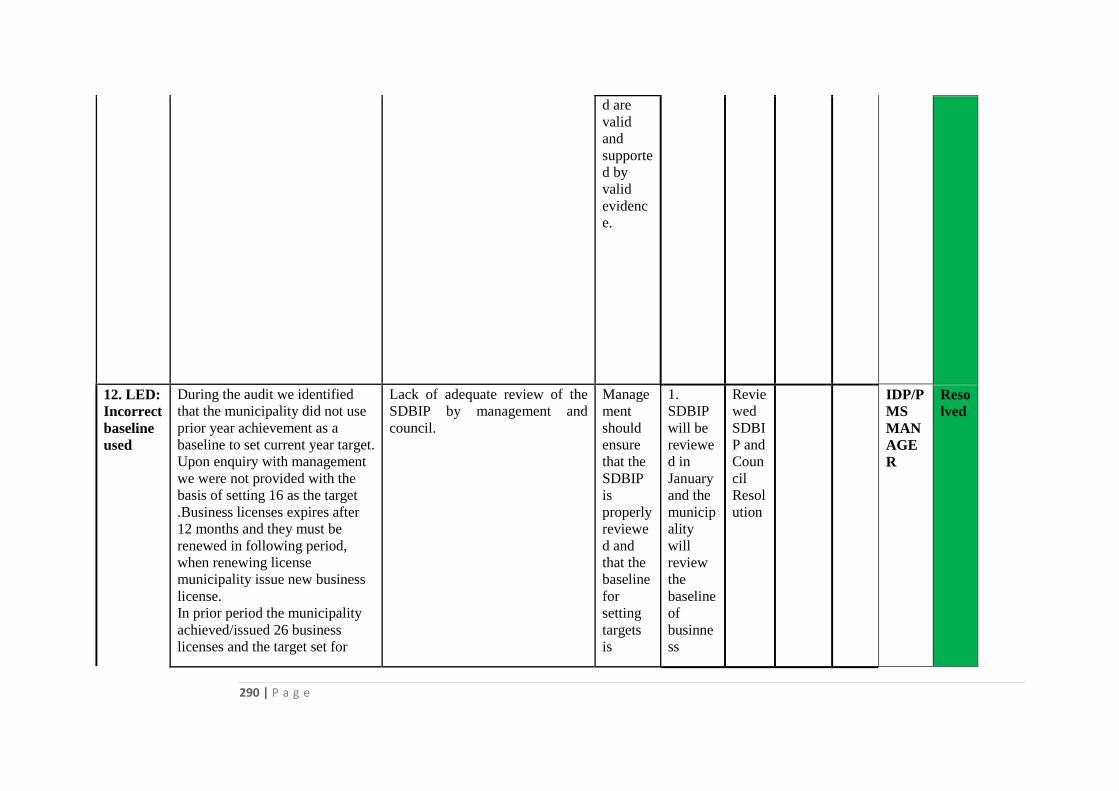
290 | P a g e
d are
valid
and
supporte
d by
valid
evidenc
e.
12. LED:
Incorrect
baseline
used
During the audit we identified
that the municipality did not use
prior year achievement as a
baseline to set current year target.
Upon enquiry with management
we were not provided with the
basis of setting 16 as the target
.Business licenses expires after
12 months and they must be
renewed in following period,
when renewing license
municipality issue new business
license.
In prior period the municipality
achieved/issued 26 business
licenses and the target set for
Lack of adequate review of the
SDBIP by management and
council.
Manage
ment
should
ensure
that the
SDBIP
is
properly
reviewe
d and
that the
baseline
for
setting
targets
is
1.
SDBIP
will be
reviewe
d in
January
and the
municip
ality
will
review
the
baseline
of
businne
ss
Revie
wed
SDBI
P and
Coun
cil
Resol
ution
IDP/P
MS
MAN
AGE
R
Reso
lved
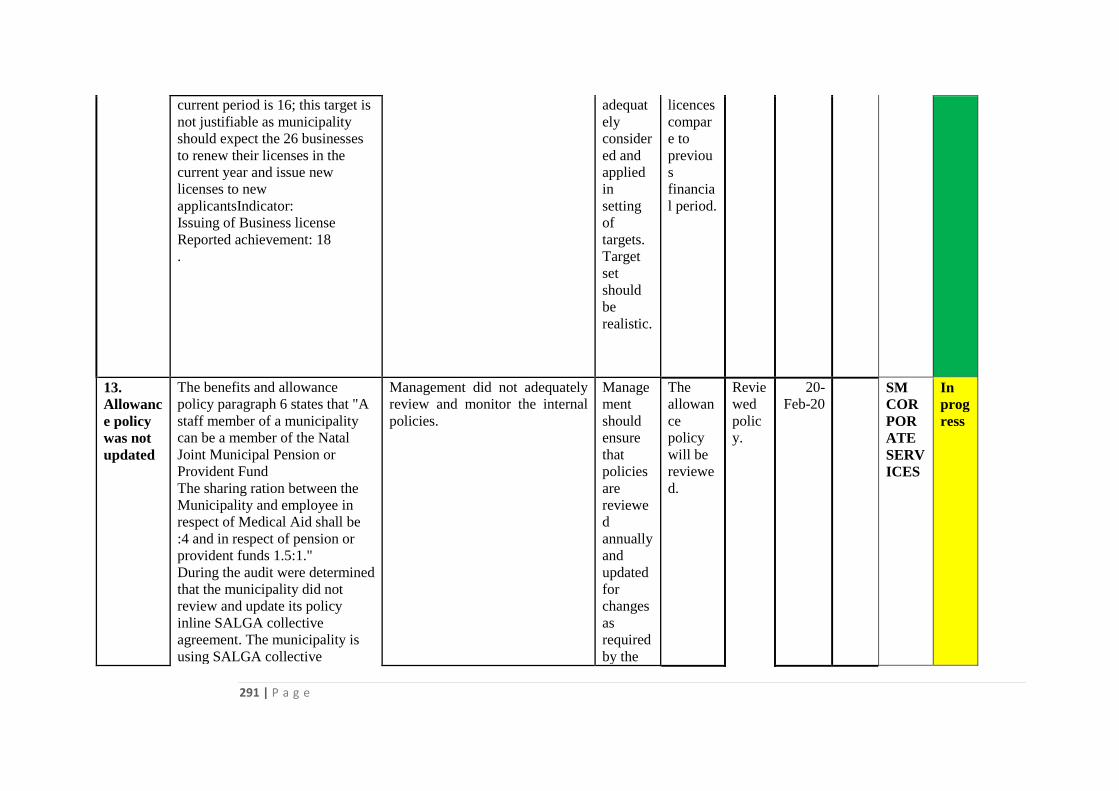
291 | P a g e
current period is 16; this target is
not justifiable as municipality
should expect the 26 businesses
to renew their licenses in the
current year and issue new
licenses to new
applicantsIndicator:
Issuing of Business license
Reported achievement: 18
.
adequat
ely
consider
ed and
applied
in
setting
of
targets.
Target
set
should
be
realistic.
licences
compar
e to
previou
s
financia
l period.
13.
Allowanc
e policy
was not
updated
The benefits and allowance
policy paragraph 6 states that "A
staff member of a municipality
can be a member of the Natal
Joint Municipal Pension or
Provident Fund
The sharing ration between the
Municipality and employee in
respect of Medical Aid shall be
:4 and in respect of pension or
provident funds 1.5:1."
During the audit were determined
that the municipality did not
review and update its policy
inline SALGA collective
agreement. The municipality is
using SALGA collective
Management did not adequately
review and monitor the internal
policies.
Manage
ment
should
ensure
that
policies
are
reviewe
d
annually
and
updated
for
changes
as
required
by the
The
allowan
ce
policy
will be
reviewe
d.
Revie
wed
polic
y.
20-
Feb-20
SM
COR
POR
ATE
SERV
ICES
In
prog
ress
292 | P a g e
agreement to determine company
contributions for medical aid,
which stipulate that employer
will contribute 60% of
membership contribution and
employee will contribute 40% of
total contribution.
We have determined that the
municipality did not review and
update its policy to be inline
SALGA collective agreement.
legislati
on.
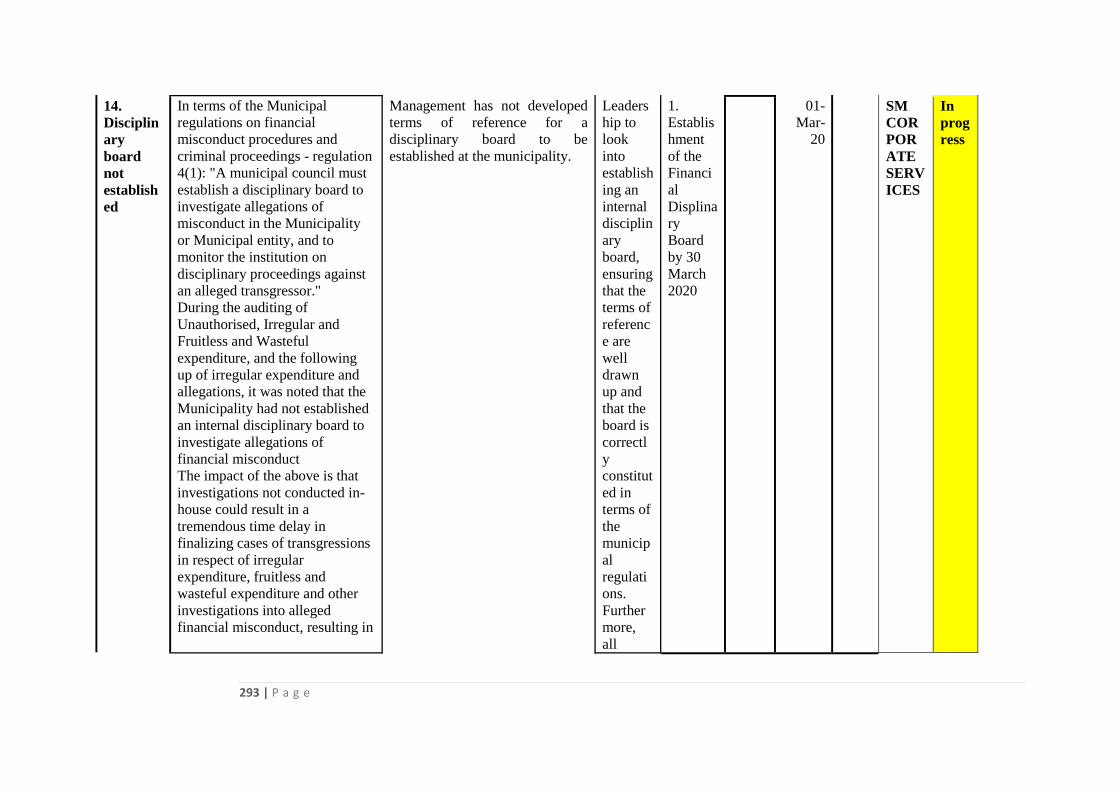
293 | P a g e
14.
Disciplin
ary
board
not
establish
ed
In terms of the Municipal
regulations on financial
misconduct procedures and
criminal proceedings - regulation
4(1): "A municipal council must
establish a disciplinary board to
investigate allegations of
misconduct in the Municipality
or Municipal entity, and to
monitor the institution on
disciplinary proceedings against
an alleged transgressor."
During the auditing of
Unauthorised, Irregular and
Fruitless and Wasteful
expenditure, and the following
up of irregular expenditure and
allegations, it was noted that the
Municipality had not established
an internal disciplinary board to
investigate allegations of
financial misconduct
The impact of the above is that
investigations not conducted in-
house could result in a
tremendous time delay in
finalizing cases of transgressions
in respect of irregular
expenditure, fruitless and
wasteful expenditure and other
investigations into alleged
financial misconduct, resulting in
Management has not developed
terms of reference for a
disciplinary board to be
established at the municipality.
Leaders
hip to
look
into
establish
ing an
internal
disciplin
ary
board,
ensuring
that the
terms of
referenc
e are
well
drawn
up and
that the
board is
correctl
y
constitut
ed in
terms of
the
municip
al
regulati
ons.
Further
more,
all
1.
Establis
hment
of the
Financi
al
Displina
ry
Board
by 30
March
2020
01-
Mar-
20
SM
COR
POR
ATE
SERV
ICES
In
prog
ress
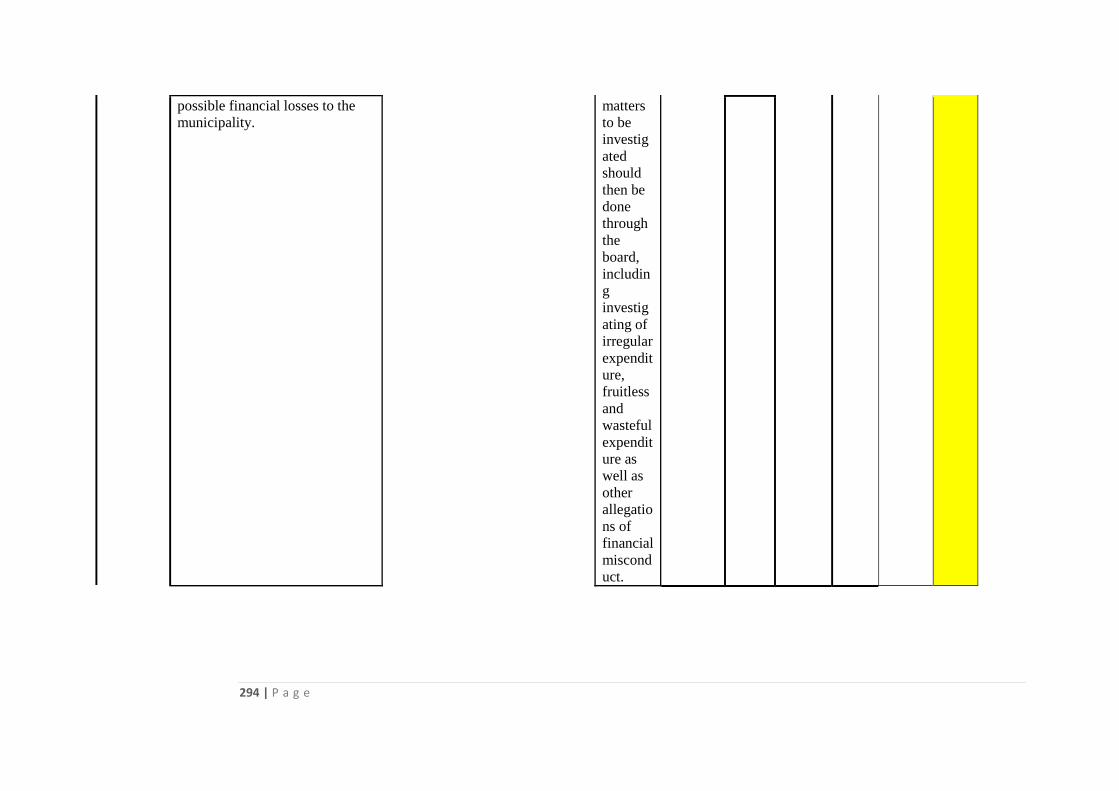
294 | P a g e
possible financial losses to the
municipality.
matters
to be
investig
ated
should
then be
done
through
the
board,
includin
g
investig
ating of
irregular
expendit
ure,
fruitless
and
wasteful
expendit
ure as
well as
other
allegatio
ns of
financial
miscond
uct.
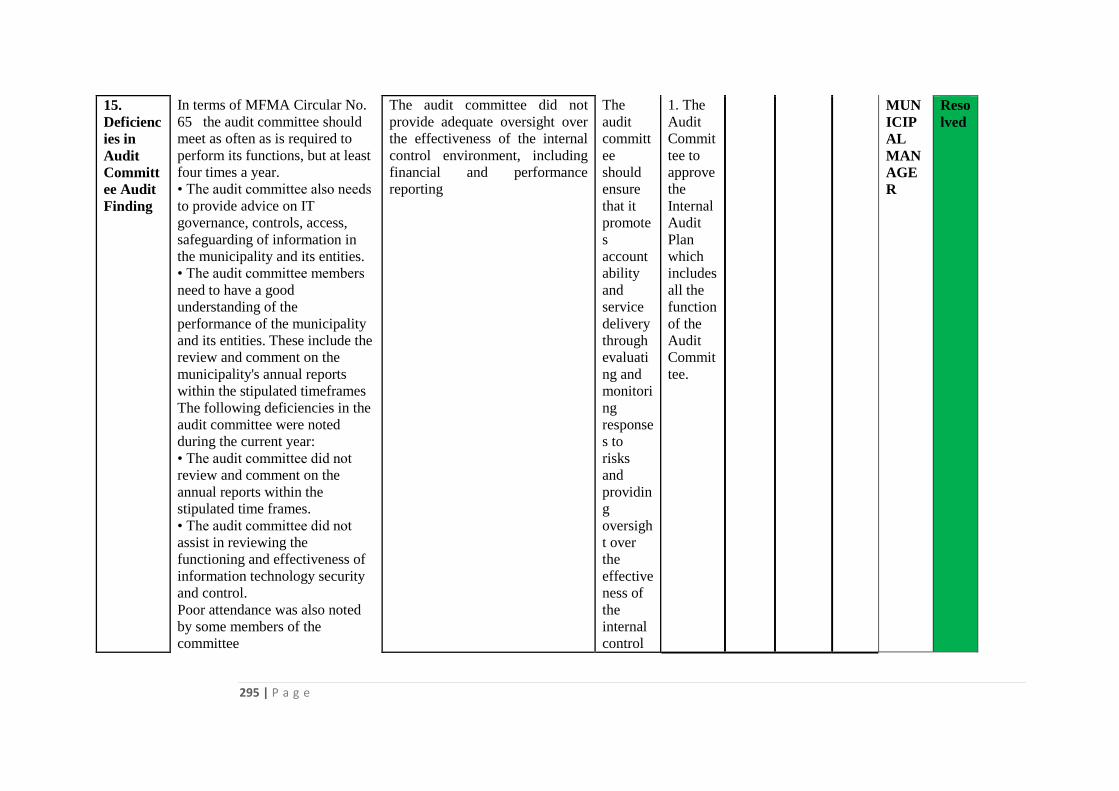
295 | P a g e
15.
Deficienc
ies in
Audit
Committ
ee Audit
Finding
In terms of MFMA Circular No.
65 the audit committee should
meet as often as is required to
perform its functions, but at least
four times a year.
• The audit committee also needs
to provide advice on IT
governance, controls, access,
safeguarding of information in
the municipality and its entities.
• The audit committee members
need to have a good
understanding of the
performance of the municipality
and its entities. These include the
review and comment on the
municipality's annual reports
within the stipulated timeframes
The following deficiencies in the
audit committee were noted
during the current year:
• The audit committee did not
review and comment on the
annual reports within the
stipulated time frames.
• The audit committee did not
assist in reviewing the
functioning and effectiveness of
information technology security
and control.
Poor attendance was also noted
by some members of the
committee
The audit committee did not
provide adequate oversight over
the effectiveness of the internal
control environment, including
financial and performance
reporting
The
audit
committ
ee
should
ensure
that it
promote
s
account
ability
and
service
delivery
through
evaluati
ng and
monitori
ng
response
s to
risks
and
providin
g
oversigh
t over
the
effective
ness of
the
internal
control
1. The
Audit
Commit
tee to
approve
the
Internal
Audit
Plan
which
includes
all the
function
of the
Audit
Commit
tee.
MUN
ICIP
AL
MAN
AGE
R
Reso
lved
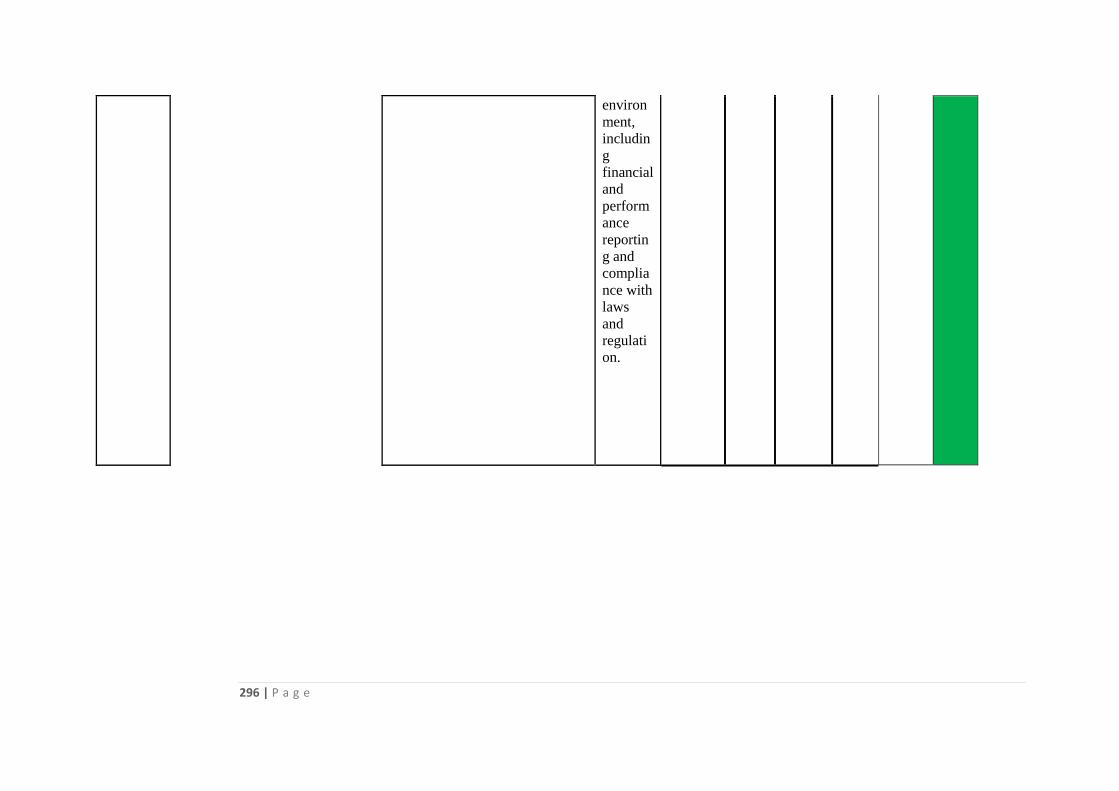
296 | P a g e
environ
ment,
includin
g
financial
and
perform
ance
reportin
g and
complia
nce with
laws
and
regulati
on.
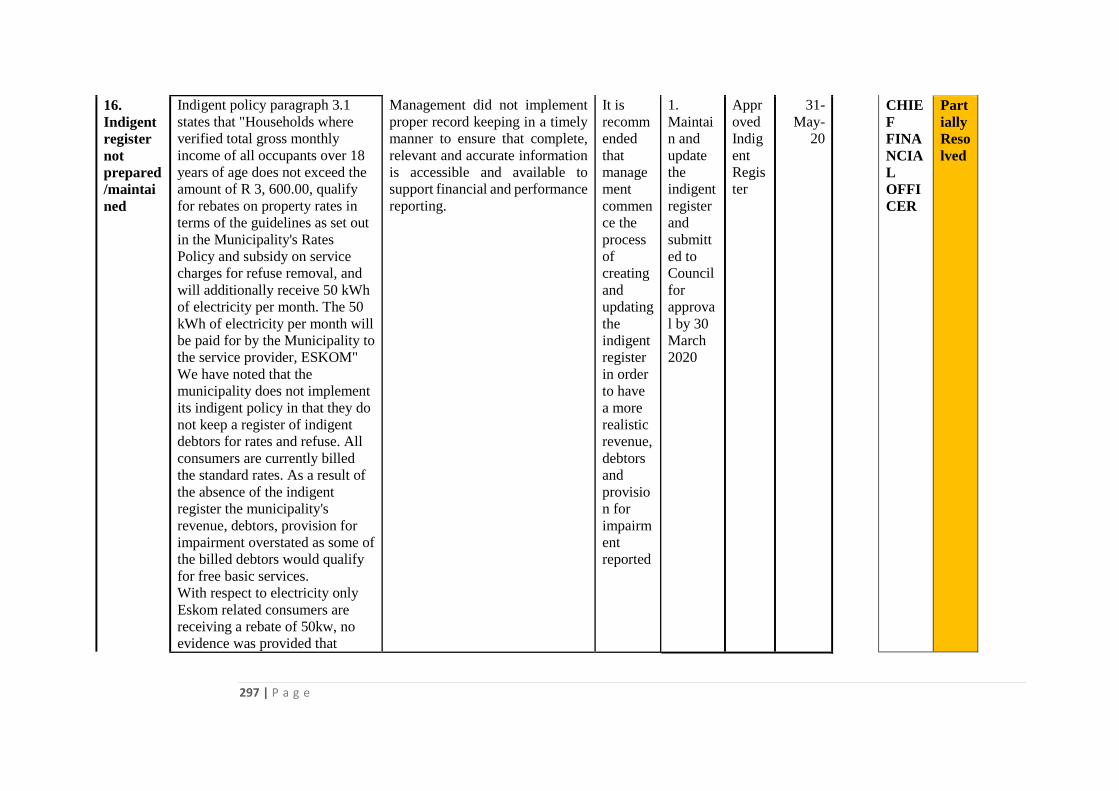
297 | P a g e
16.
Indigent
register
not
prepared
/maintai
ned
Indigent policy paragraph 3.1
states that "Households where
verified total gross monthly
income of all occupants over 18
years of age does not exceed the
amount of R 3, 600.00, qualify
for rebates on property rates in
terms of the guidelines as set out
in the Municipality's Rates
Policy and subsidy on service
charges for refuse removal, and
will additionally receive 50 kWh
of electricity per month. The 50
kWh of electricity per month will
be paid for by the Municipality to
the service provider, ESKOM"
We have noted that the
municipality does not implement
its indigent policy in that they do
not keep a register of indigent
debtors for rates and refuse. All
consumers are currently billed
the standard rates. As a result of
the absence of the indigent
register the municipality's
revenue, debtors, provision for
impairment overstated as some of
the billed debtors would qualify
for free basic services.
With respect to electricity only
Eskom related consumers are
receiving a rebate of 50kw, no
evidence was provided that
Management did not implement
proper record keeping in a timely
manner to ensure that complete,
relevant and accurate information
is accessible and available to
support financial and performance
reporting.
It is
recomm
ended
that
manage
ment
commen
ce the
process
of
creating
and
updating
the
indigent
register
in order
to have
a more
realistic
revenue,
debtors
and
provisio
n for
impairm
ent
reported
1.
Maintai
n and
update
the
indigent
register
and
submitt
ed to
Council
for
approva
l by 30
March
2020
Appr
oved
Indig
ent
Regis
ter
31-
May-
20
CHIE
F
FINA
NCIA
L
OFFI
CER
Part
ially
Reso
lved
298 | P a g e
customers which are receiving
electricity from uMkhanyakude
district municipality are
receiving rebates and that
municipality is paying for such
rebates.
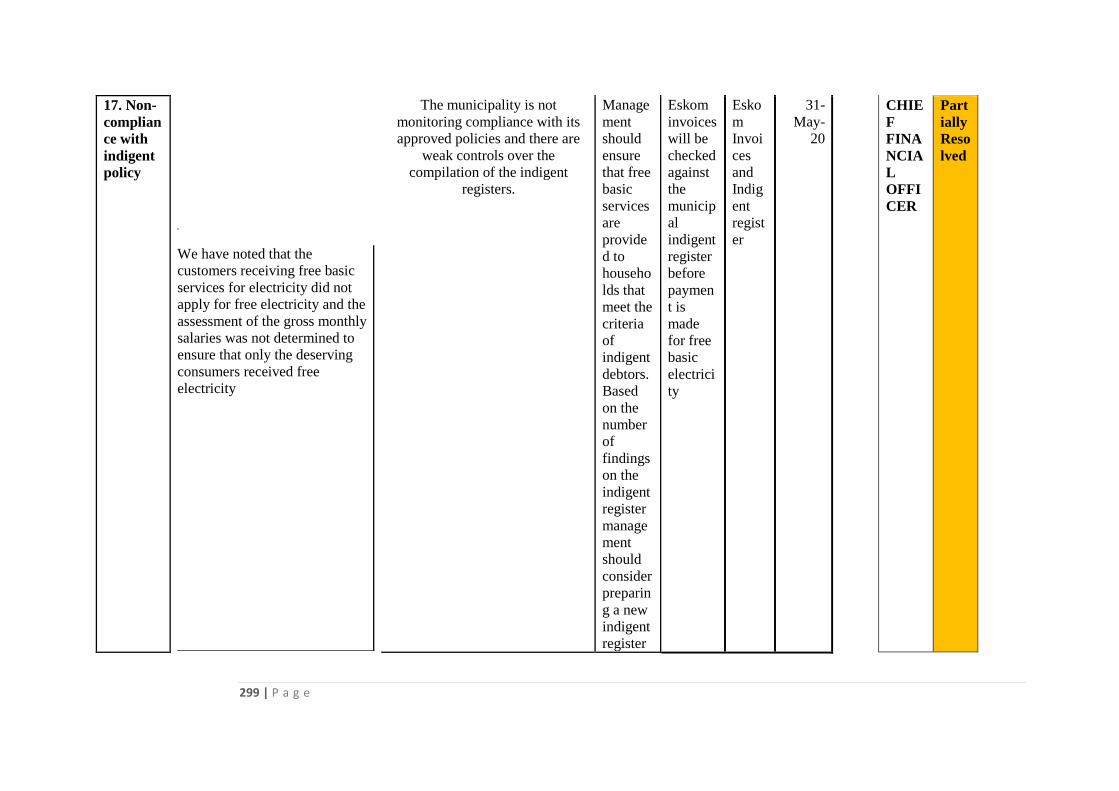
299 | P a g e
17. Non-
complian
ce with
indigent
policy
We have noted that the
customers receiving free basic
services for electricity did not
apply for free electricity and the
assessment of the gross monthly
salaries was not determined to
ensure that only the deserving
consumers received free
electricity
The municipality is not
monitoring compliance with its
approved policies and there are
weak controls over the
compilation of the indigent
registers.
Manage
ment
should
ensure
that free
basic
services
are
provide
d to
househo
lds that
meet the
criteria
of
indigent
debtors.
Based
on the
number
of
findings
on the
indigent
register
manage
ment
should
consider
preparin
g a new
indigent
register
Eskom
invoices
will be
checked
against
the
municip
al
indigent
register
before
paymen
t is
made
for free
basic
electrici
ty
Esko
m
Invoi
ces
and
Indig
ent
regist
er
31-
May-
20
CHIE
F
FINA
NCIA
L
OFFI
CER
Part
ially
Reso
lved
300 | P a g e
that will
be
maintain
ed and
reviewe
d on a
regular
basis.
The
indigent
register
submitte
d for
audit
must be
reconcil
ed to the
register
used at
uMkhan
yakude
district
municip
ality and
Eskom
and any
discrepa
ncies
should
be
followe
d up
Fruitless
301 | P a g e
and
wasteful
expendit
ure
should
be
disclose
d
resulting
from the
payment
s for
invalid
indigent
debtors
as per
the
CAATS
results
above.
Manage
ment
should
prepare
and
submit
for audit
the
payment
s made
that will
be
disclose
302 | P a g e
d as
fruitless
and
wasteful
expendit
ure for
audit
consider
ation.
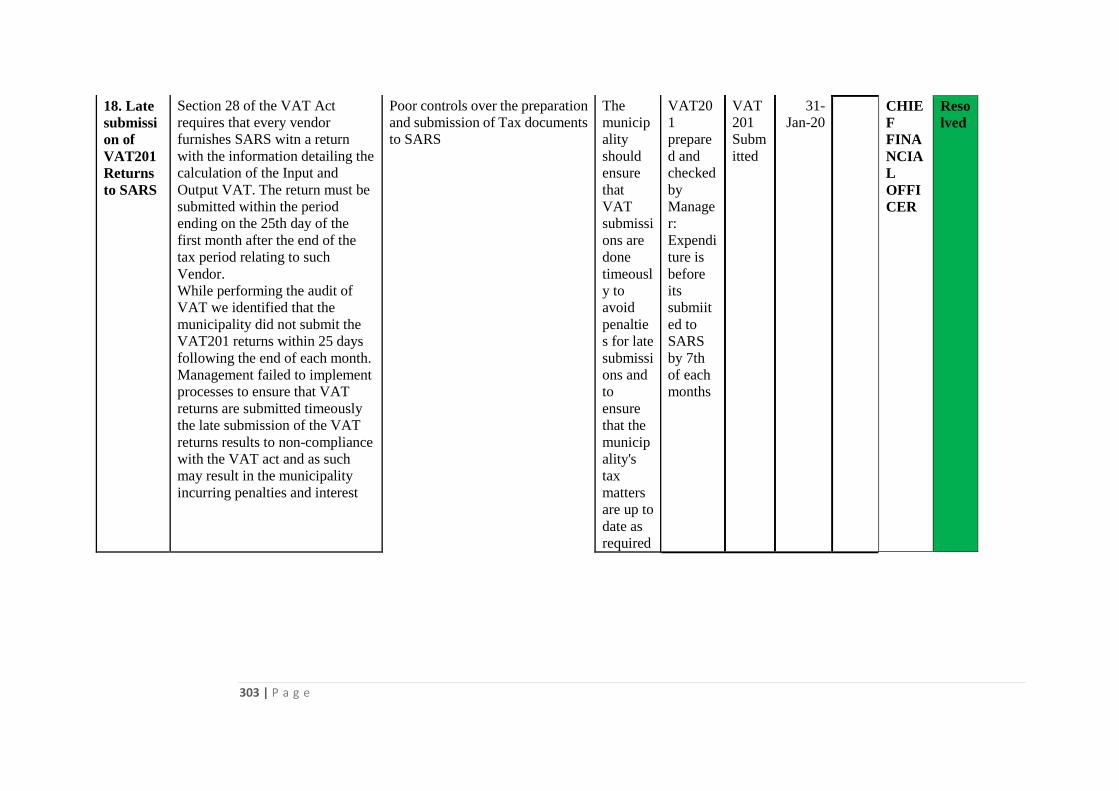
303 | P a g e
18. Late
submissi
on of
VAT201
Returns
to SARS
Section 28 of the VAT Act
requires that every vendor
furnishes SARS witn a return
with the information detailing the
calculation of the Input and
Output VAT. The return must be
submitted within the period
ending on the 25th day of the
first month after the end of the
tax period relating to such
Vendor.
While performing the audit of
VAT we identified that the
municipality did not submit the
VAT201 returns within 25 days
following the end of each month.
Management failed to implement
processes to ensure that VAT
returns are submitted timeously
the late submission of the VAT
returns results to non-compliance
with the VAT act and as such
may result in the municipality
incurring penalties and interest
Poor controls over the preparation
and submission of Tax documents
to SARS
The
municip
ality
should
ensure
that
VAT
submissi
ons are
done
timeousl
y to
avoid
penaltie
s for late
submissi
ons and
to
ensure
that the
municip
ality's
tax
matters
are up to
date as
required
VAT20
1
prepare
d and
checked
by
Manage
r:
Expendi
ture is
before
its
submiit
ed to
SARS
by 7th
of each
months
VAT
201
Subm
itted
31-
Jan-20
CHIE
F
FINA
NCIA
L
OFFI
CER
Reso
lved
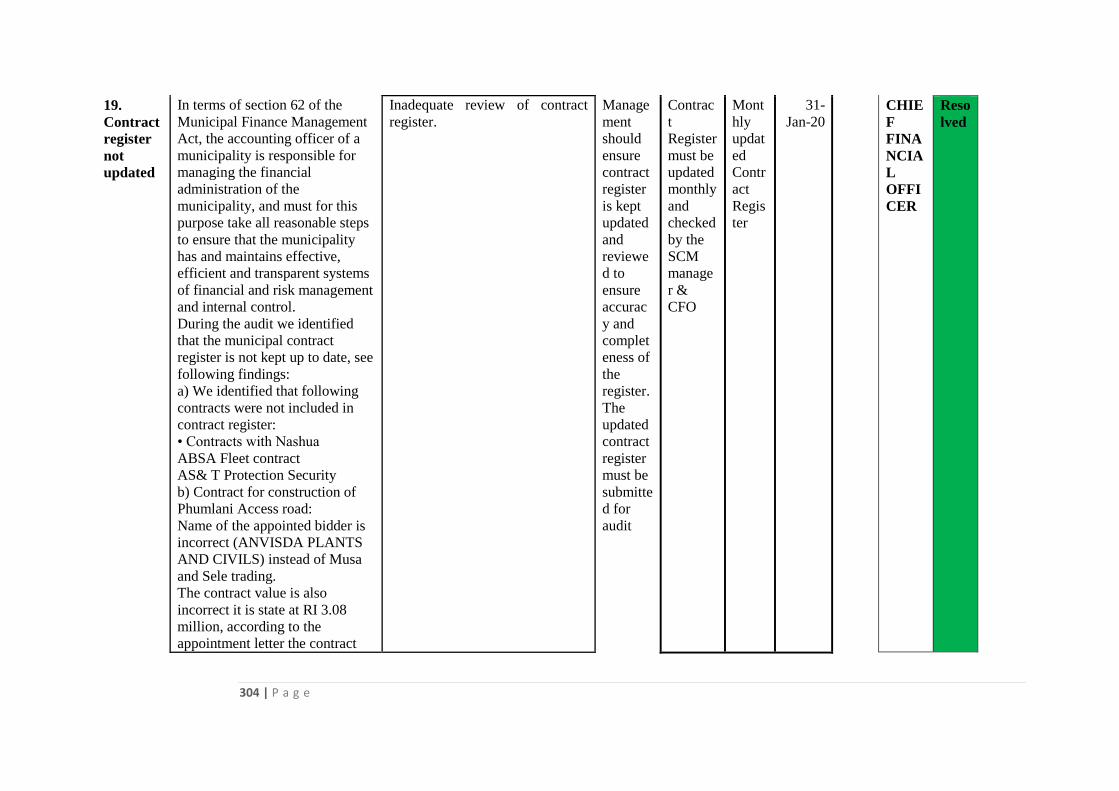
304 | P a g e
19.
Contract
register
not
updated
In terms of section 62 of the
Municipal Finance Management
Act, the accounting officer of a
municipality is responsible for
managing the financial
administration of the
municipality, and must for this
purpose take all reasonable steps
to ensure that the municipality
has and maintains effective,
efficient and transparent systems
of financial and risk management
and internal control.
During the audit we identified
that the municipal contract
register is not kept up to date, see
following findings:
a) We identified that following
contracts were not included in
contract register:
• Contracts with Nashua
ABSA Fleet contract
AS& T Protection Security
b) Contract for construction of
Phumlani Access road:
Name of the appointed bidder is
incorrect (ANVISDA PLANTS
AND CIVILS) instead of Musa
and Sele trading.
The contract value is also
incorrect it is state at RI 3.08
million, according to the
appointment letter the contract
Inadequate review of contract
register.
Manage
ment
should
ensure
contract
register
is kept
updated
and
reviewe
d to
ensure
accurac
y and
complet
eness of
the
register.
The
updated
contract
register
must be
submitte
d for
audit
Contrac
t
Register
must be
updated
monthly
and
checked
by the
SCM
manage
r &
CFO
Mont
hly
updat
ed
Contr
act
Regis
ter
31-
Jan-20
CHIE
F
FINA
NCIA
L
OFFI
CER
Reso
lved
305 | P a g e
value is R8 million. The total
amount spent on the contract per
contract register is not accurate,
it is stated at RIO million
however the total amount paid
per general ledger is R13 million.
c) Contracts with zero contract
value in contract register, this is
not correct and there was
expenditure incurred for these
projects (it is also reflected in
work in progress):
The Construction of Nkositini
Gravel Road Hlabisa Town
Refurbishment
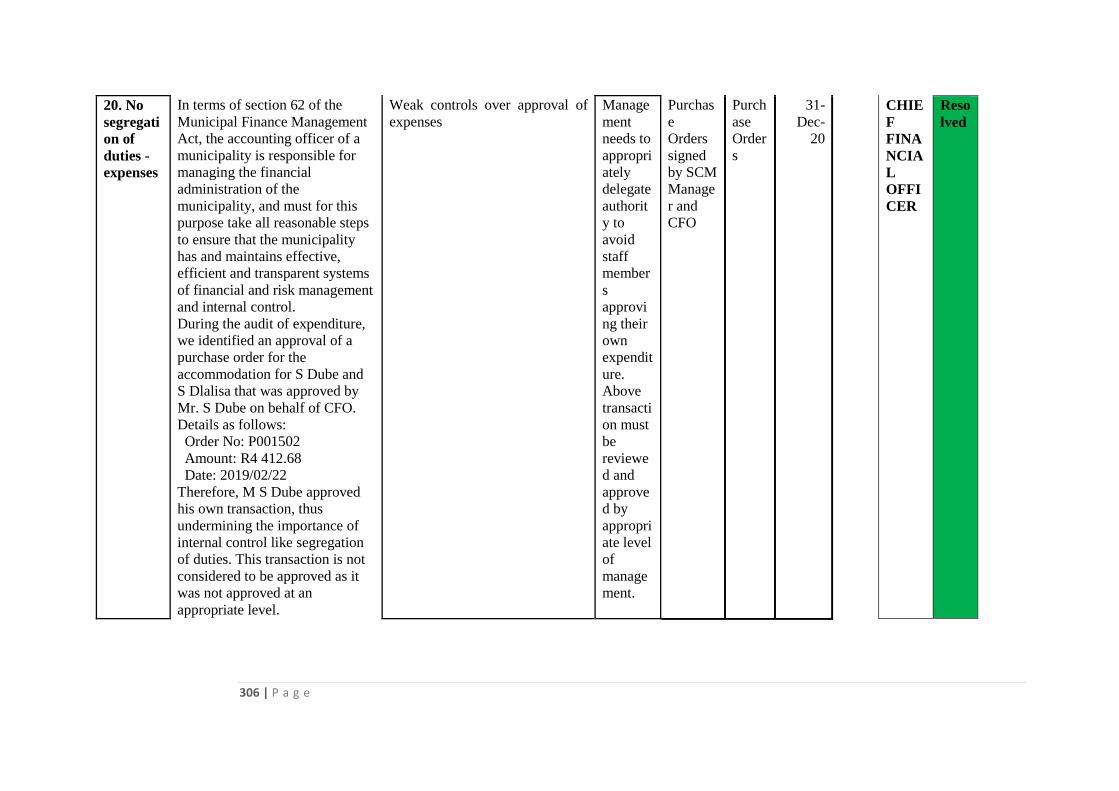
306 | P a g e
20. No
segregati
on of
duties -
expenses
In terms of section 62 of the
Municipal Finance Management
Act, the accounting officer of a
municipality is responsible for
managing the financial
administration of the
municipality, and must for this
purpose take all reasonable steps
to ensure that the municipality
has and maintains effective,
efficient and transparent systems
of financial and risk management
and internal control.
During the audit of expenditure,
we identified an approval of a
purchase order for the
accommodation for S Dube and
S Dlalisa that was approved by
Mr. S Dube on behalf of CFO.
Details as follows:
Order No: P001502
Amount: R4 412.68
Date: 2019/02/22
Therefore, M S Dube approved
his own transaction, thus
undermining the importance of
internal control like segregation
of duties. This transaction is not
considered to be approved as it
was not approved at an
appropriate level.
Weak controls over approval of
expenses
Manage
ment
needs to
appropri
ately
delegate
authorit
y to
avoid
staff
member
s
approvi
ng their
own
expendit
ure.
Above
transacti
on must
be
reviewe
d and
approve
d by
appropri
ate level
of
manage
ment.
Purchas
e
Orders
signed
by SCM
Manage
r and
CFO
Purch
ase
Order
s
31-
Dec-
20
CHIE
F
FINA
NCIA
L
OFFI
CER
Reso
lved
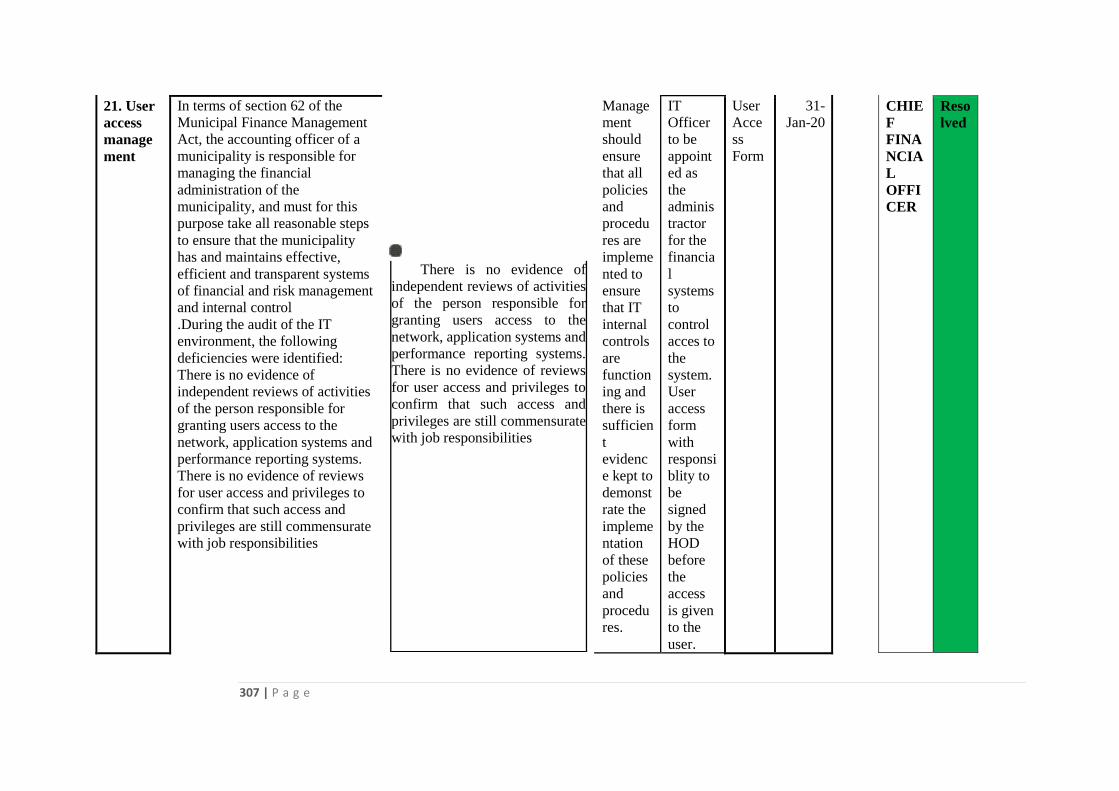
307 | P a g e
21. User
access
manage
ment
In terms of section 62 of the
Municipal Finance Management
Act, the accounting officer of a
municipality is responsible for
managing the financial
administration of the
municipality, and must for this
purpose take all reasonable steps
to ensure that the municipality
has and maintains effective,
efficient and transparent systems
of financial and risk management
and internal control
.During the audit of the IT
environment, the following
deficiencies were identified:
There is no evidence of
independent reviews of activities
of the person responsible for
granting users access to the
network, application systems and
performance reporting systems.
There is no evidence of reviews
for user access and privileges to
confirm that such access and
privileges are still commensurate
with job responsibilities
Manage
ment
should
ensure
that all
policies
and
procedu
res are
impleme
nted to
ensure
that IT
internal
controls
are
function
ing and
there is
sufficien
t
evidenc
e kept to
demonst
rate the
impleme
ntation
of these
policies
and
procedu
res.
IT
Officer
to be
appoint
ed as
the
adminis
tractor
for the
financia
l
systems
to
control
acces to
the
system.
User
access
form
with
responsi
blity to
be
signed
by the
HOD
before
the
access
is given
to the
user.
User
Acce
ss
Form
31-
Jan-20
CHIE
F
FINA
NCIA
L
OFFI
CER
Reso
lved
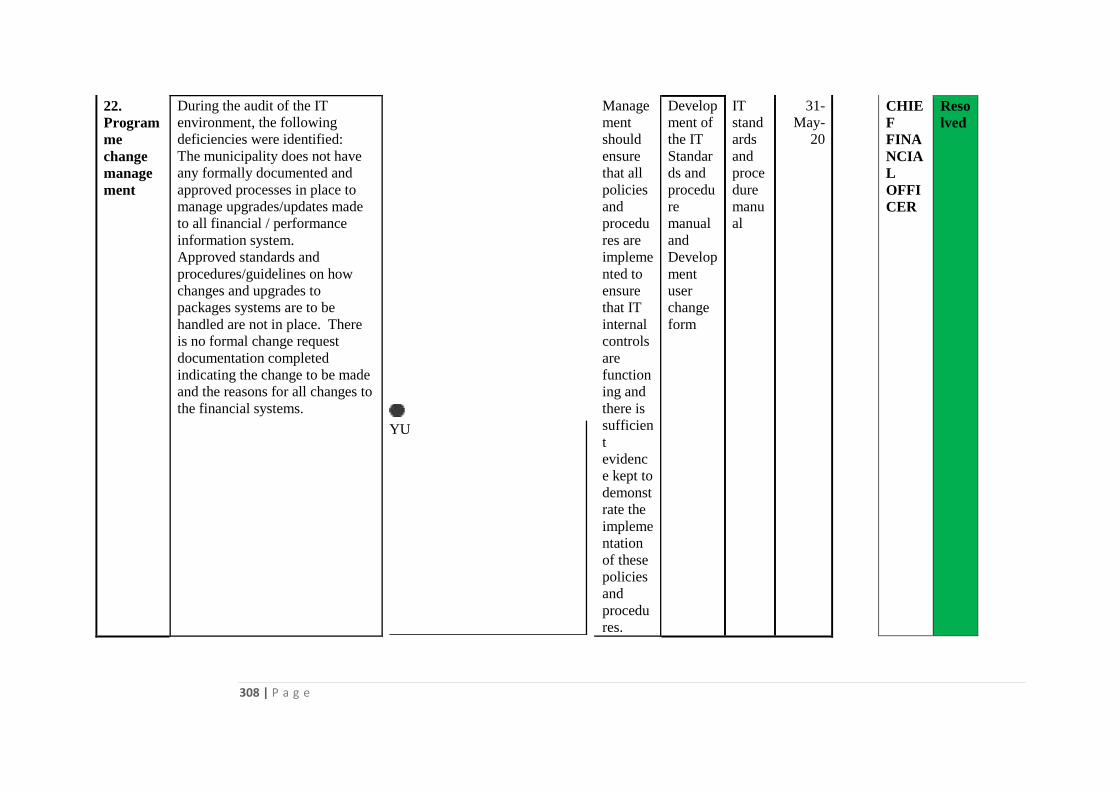
308 | P a g e
22.
Program
me
change
manage
ment
During the audit of the IT
environment, the following
deficiencies were identified:
The municipality does not have
any formally documented and
approved processes in place to
manage upgrades/updates made
to all financial / performance
information system.
Approved standards and
procedures/guidelines on how
changes and upgrades to
packages systems are to be
handled are not in place. There
is no formal change request
documentation completed
indicating the change to be made
and the reasons for all changes to
the financial systems.
YU
Manage
ment
should
ensure
that all
policies
and
procedu
res are
impleme
nted to
ensure
that IT
internal
controls
are
function
ing and
there is
sufficien
t
evidenc
e kept to
demonst
rate the
impleme
ntation
of these
policies
and
procedu
res.
Develop
ment of
the IT
Standar
ds and
procedu
re
manual
and
Develop
ment
user
change
form
IT
stand
ards
and
proce
dure
manu
al
31-
May-
20
CHIE
F
FINA
NCIA
L
OFFI
CER
Reso
lved
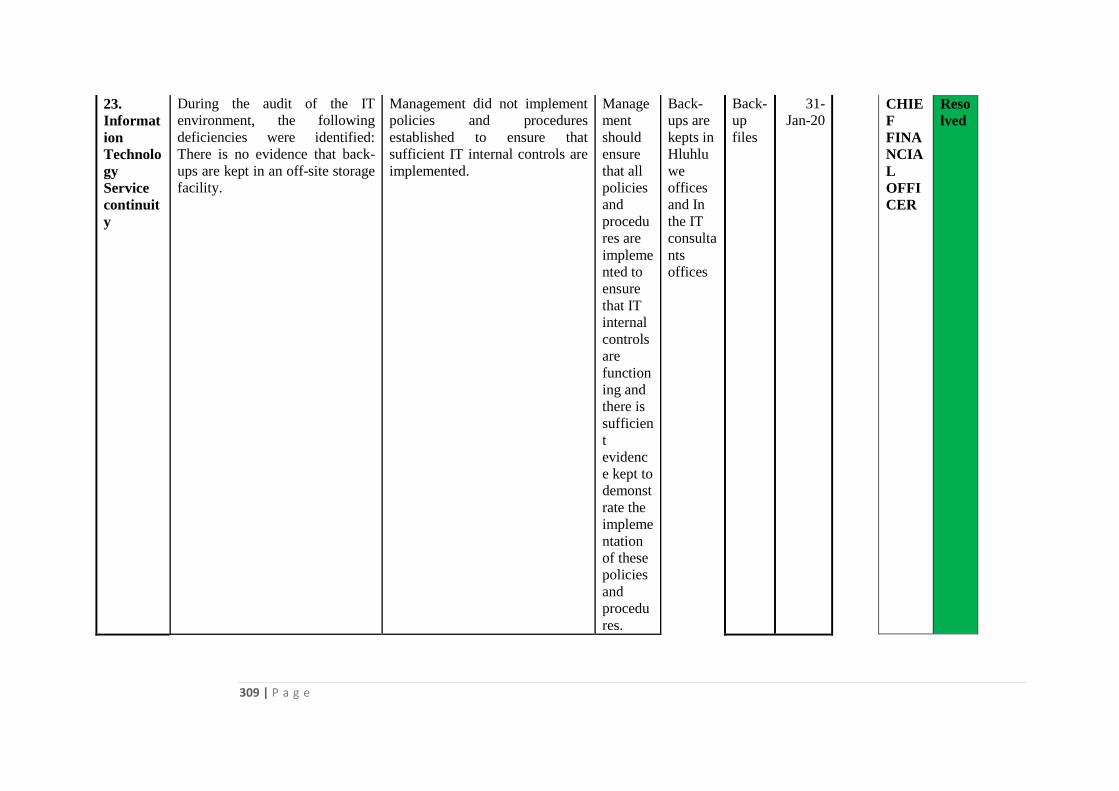
309 | P a g e
23.
Informat
ion
Technolo
gy
Service
continuit
y
During the audit of the IT
environment, the following
deficiencies were identified:
There is no evidence that back-
ups are kept in an off-site storage
facility.
Management did not implement
policies and procedures
established to ensure that
sufficient IT internal controls are
implemented.
Manage
ment
should
ensure
that all
policies
and
procedu
res are
impleme
nted to
ensure
that IT
internal
controls
are
function
ing and
there is
sufficien
t
evidenc
e kept to
demonst
rate the
impleme
ntation
of these
policies
and
procedu
res.
Back-
ups are
kepts in
Hluhlu
we
offices
and In
the IT
consulta
nts
offices
Back-
up
files
31-
Jan-20
CHIE
F
FINA
NCIA
L
OFFI
CER
Reso
lved
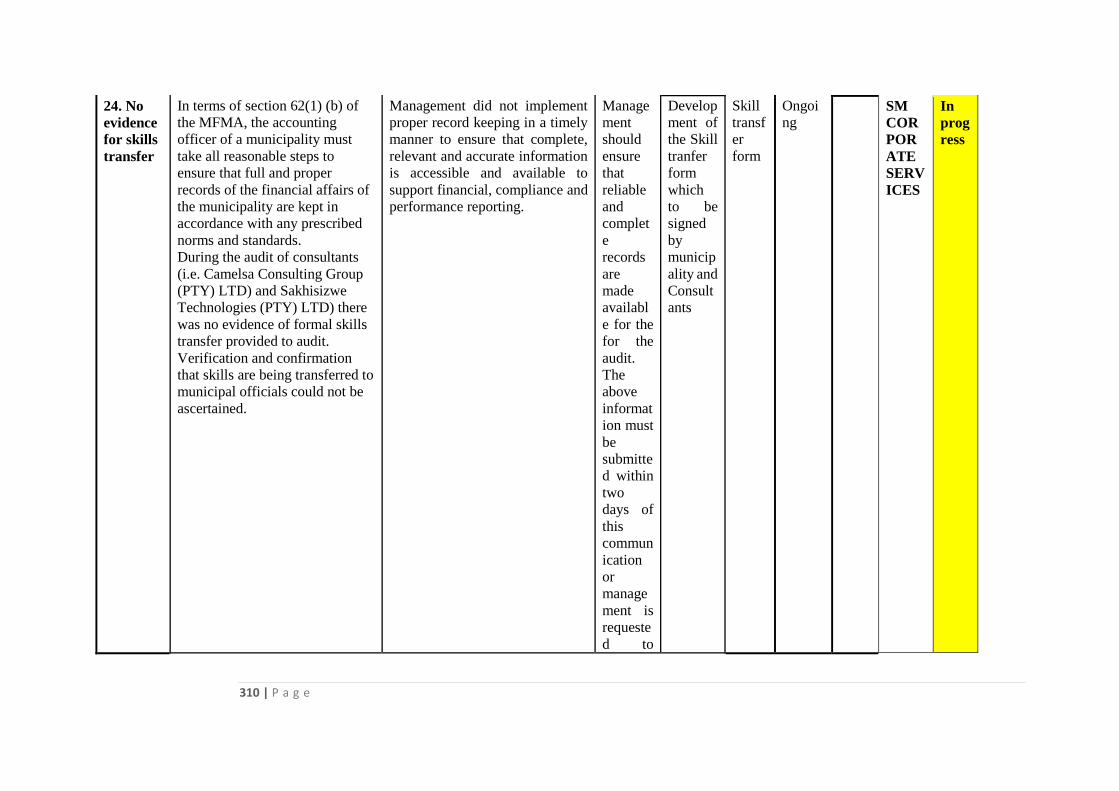
310 | P a g e
24. No
evidence
for skills
transfer
In terms of section 62(1) (b) of
the MFMA, the accounting
officer of a municipality must
take all reasonable steps to
ensure that full and proper
records of the financial affairs of
the municipality are kept in
accordance with any prescribed
norms and standards.
During the audit of consultants
(i.e. Camelsa Consulting Group
(PTY) LTD) and Sakhisizwe
Technologies (PTY) LTD) there
was no evidence of formal skills
transfer provided to audit.
Verification and confirmation
that skills are being transferred to
municipal officials could not be
ascertained.
Management did not implement
proper record keeping in a timely
manner to ensure that complete,
relevant and accurate information
is accessible and available to
support financial, compliance and
performance reporting.
Manage
ment
should
ensure
that
reliable
and
complet
e
records
are
made
availabl
e for the
for the
audit.
The
above
informat
ion must
be
submitte
d within
two
days of
this
commun
ication
or
manage
ment is
requeste
d to
Develop
ment of
the Skill
tranfer
form
which
to be
signed
by
municip
ality and
Consult
ants
Skill
transf
er
form
Ongoi
ng
SM
COR
POR
ATE
SERV
ICES
In
prog
ress
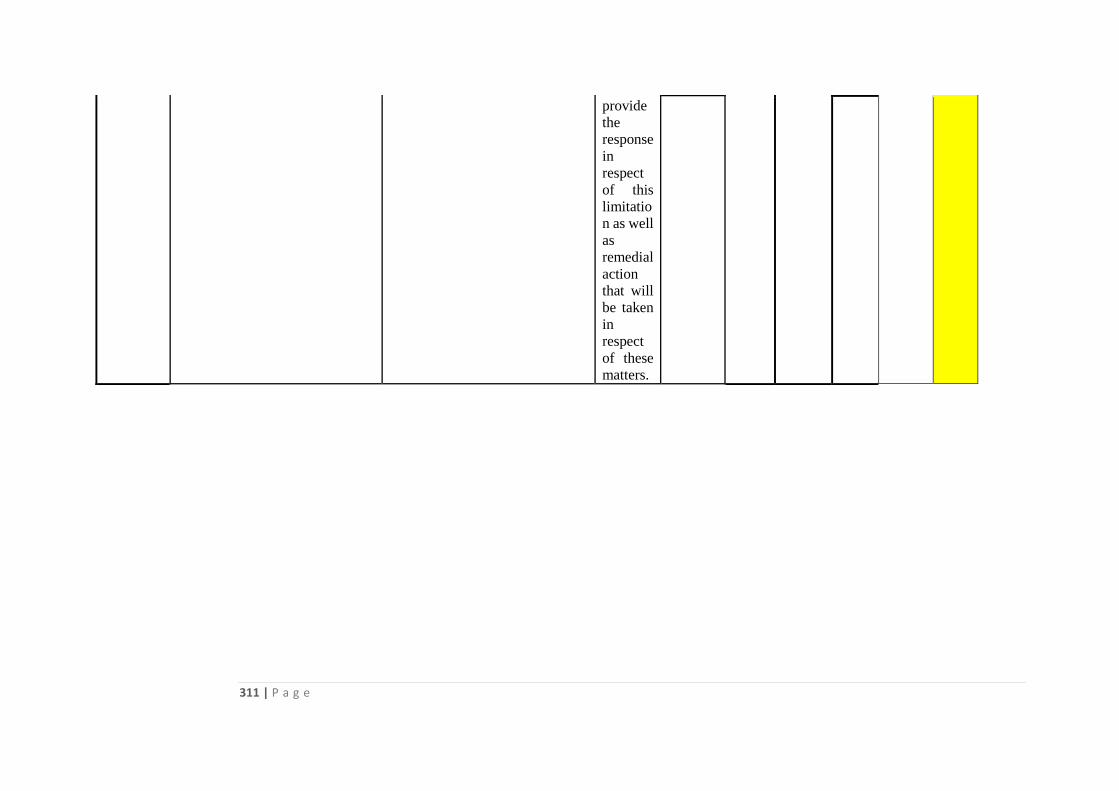
311 | P a g e
provide
the
response
in
respect
of this
limitatio
n as well
as
remedial
action
that will
be taken
in
respect
of these
matters.
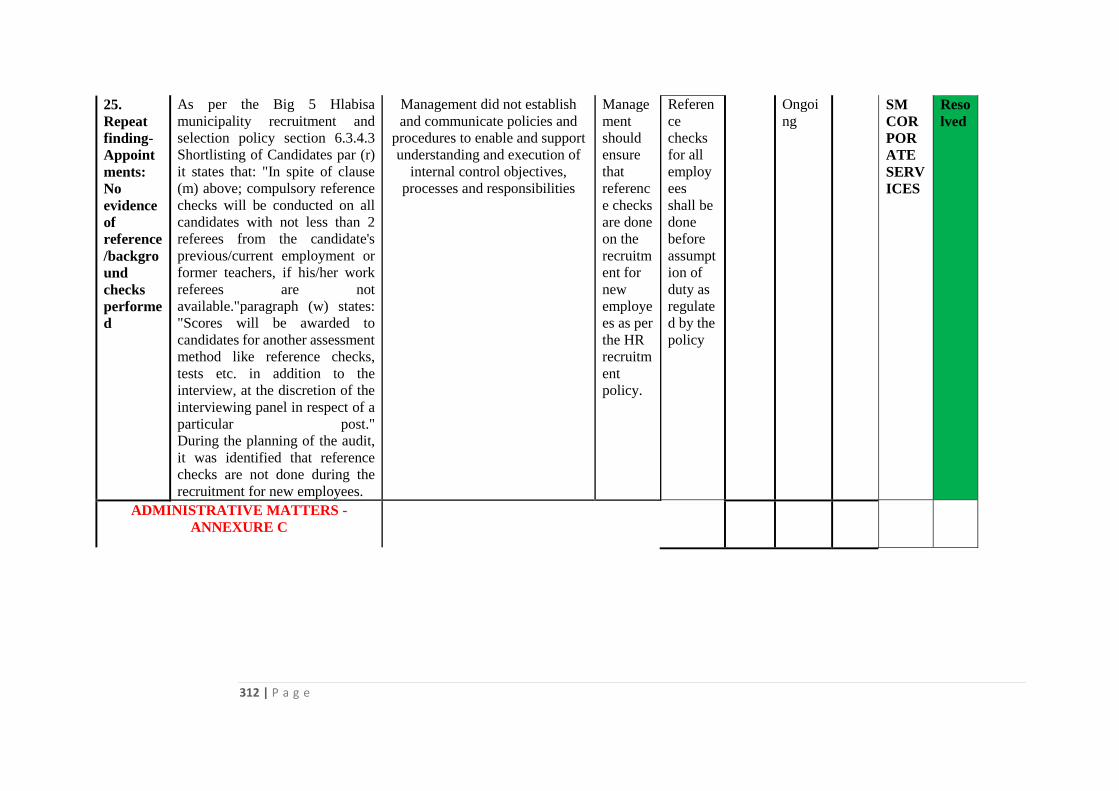
312 | P a g e
25.
Repeat
finding-
Appoint
ments:
No
evidence
of
reference
/backgro
und
checks
performe
d
As per the Big 5 Hlabisa
municipality recruitment and
selection policy section 6.3.4.3
Shortlisting of Candidates par (r)
it states that: "In spite of clause
(m) above; compulsory reference
checks will be conducted on all
candidates with not less than 2
referees from the candidate's
previous/current employment or
former teachers, if his/her work
referees are not
available."paragraph (w) states:
"Scores will be awarded to
candidates for another assessment
method like reference checks,
tests etc. in addition to the
interview, at the discretion of the
interviewing panel in respect of a
particular post."
During the planning of the audit,
it was identified that reference
checks are not done during the
recruitment for new employees.
Management did not establish
and communicate policies and
procedures to enable and support
understanding and execution of
internal control objectives,
processes and responsibilities
Manage
ment
should
ensure
that
referenc
e checks
are done
on the
recruitm
ent for
new
employe
es as per
the HR
recruitm
ent
policy.
Referen
ce
checks
for all
employ
ees
shall be
done
before
assumpt
ion of
duty as
regulate
d by the
policy
Ongoi
ng
SM
COR
POR
ATE
SERV
ICES
Reso
lved
ADMINISTRATIVE MATTERS -
ANNEXURE C
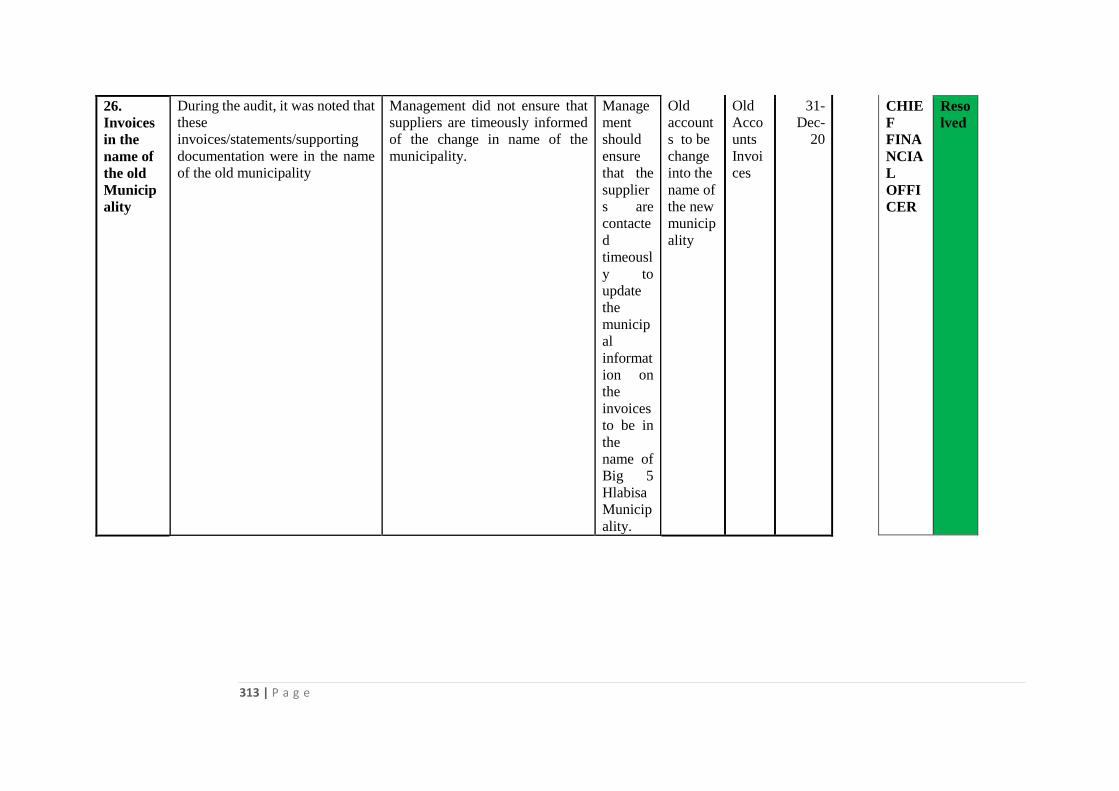
313 | P a g e
26.
Invoices
in the
name of
the old
Municip
ality
During the audit, it was noted that
these
invoices/statements/supporting
documentation were in the name
of the old municipality
Management did not ensure that
suppliers are timeously informed
of the change in name of the
municipality.
Manage
ment
should
ensure
that the
supplier
s are
contacte
d
timeousl
y to
update
the
municip
al
informat
ion on
the
invoices
to be in
the
name of
Big 5
Hlabisa
Municip
ality.
Old
account
s to be
change
into the
name of
the new
municip
ality
Old
Acco
unts
Invoi
ces
31-
Dec-
20
CHIE
F
FINA
NCIA
L
OFFI
CER
Reso
lved
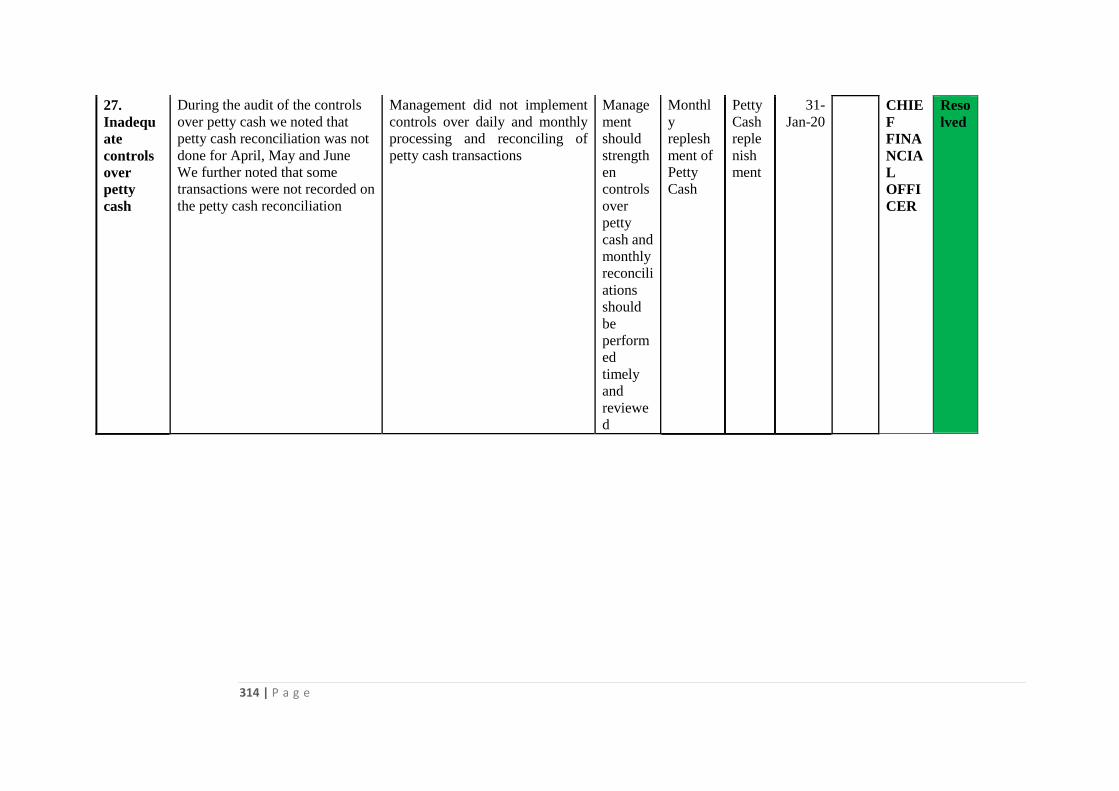
314 | P a g e
27.
Inadequ
ate
controls
over
petty
cash
During the audit of the controls
over petty cash we noted that
petty cash reconciliation was not
done for April, May and June
We further noted that some
transactions were not recorded on
the petty cash reconciliation
Management did not implement
controls over daily and monthly
processing and reconciling of
petty cash transactions
Manage
ment
should
strength
en
controls
over
petty
cash and
monthly
reconcili
ations
should
be
perform
ed
timely
and
reviewe
d
Monthl
y
replesh
ment of
Petty
Cash
Petty
Cash
reple
nish
ment
31-
Jan-20
CHIE
F
FINA
NCIA
L
OFFI
CER
Reso
lved

315 | P a g e
316 | P a g e
SECTION G
ORGANISATIONAL SDBIP 2020/2021
SERVICE DELIVERY AND BUDGET IMPLEMENTATION PLAN
INTRODUCTION
The Service Delivery and Budget Implementation Plan (SDBIP) is prepared in terms of the Municipal Finance Management Act (MFMA), section 53. The
SDBIP gives effect to the Integrated Development Plan (IDP) and budget of the municipality and will be possible if the IDP and budget are fully aligned with
each other, as required by the MFMA. The budget gives effect to the strategic priorities of the municipality and is not a management or implementation plan.
The SDBIP therefore serves as a “contract” between the administration, council and community expressing the goals and objectives set by the council as
quantifiable outcomes that can be implemented by the administration over the next twelve months. This provides the basis for measuring performance in service
delivery against end of-year targets and implementing the budget.
The SDBIP provides the vital link between the mayor, council (executive) and the administration, and facilitates the process for holding management
accountable for its performance. The SDBIP is a management, implementation and monitoring tool that will assist the mayor, councillors, municipal manager,
317 | P a g e
senior managers and community. A properly formulated SDBIP will ensure that appropriate information is circulated internally and externally for purposes of
monitoring the execution of the budget, performance of senior management and achievement of the strategic objectives set by council. It enables the municipal
manager to monitor the performance of senior managers, the mayor to monitor the performance of the municipal manager, and for the community to monitor
the performance of the municipality.
The SDBIP should therefore determine (and be consistent with) the performance agreements between the mayor and the municipal manager and the municipal
manager and senior managers determined at the start of every financial year and approved by the mayor. It must also be consistent with outsourced service
delivery agreements such as municipal entities, public-private partnerships, service contracts and the like.
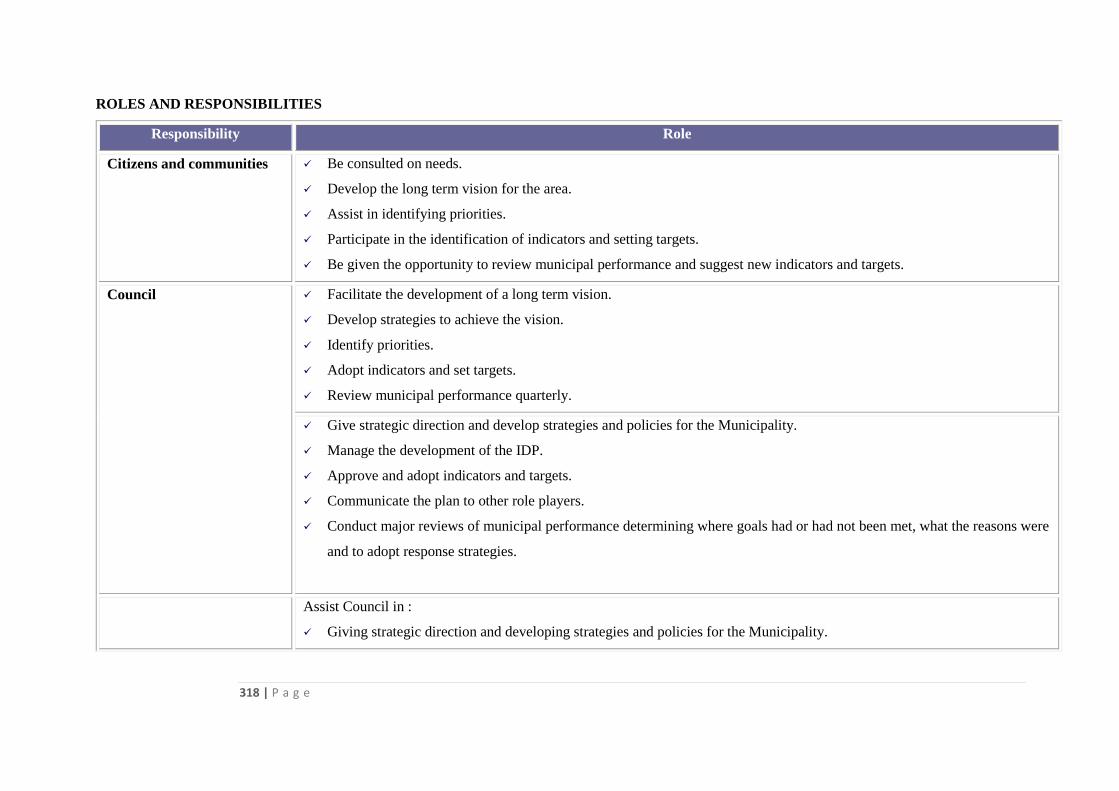
318 | P a g e
ROLES AND RESPONSIBILITIES
Responsibility Role
Citizens and communities Be consulted on needs.
Develop the long term vision for the area.
Assist in identifying priorities.
Participate in the identification of indicators and setting targets.
Be given the opportunity to review municipal performance and suggest new indicators and targets.
Council Facilitate the development of a long term vision.
Develop strategies to achieve the vision.
Identify priorities.
Adopt indicators and set targets.
Review municipal performance quarterly.
Give strategic direction and develop strategies and policies for the Municipality.
Manage the development of the IDP.
Approve and adopt indicators and targets.
Communicate the plan to other role players.
Conduct major reviews of municipal performance determining where goals had or had not been met, what the reasons were
and to adopt response strategies.
Assist Council in :
Giving strategic direction and developing strategies and policies for the Municipality.
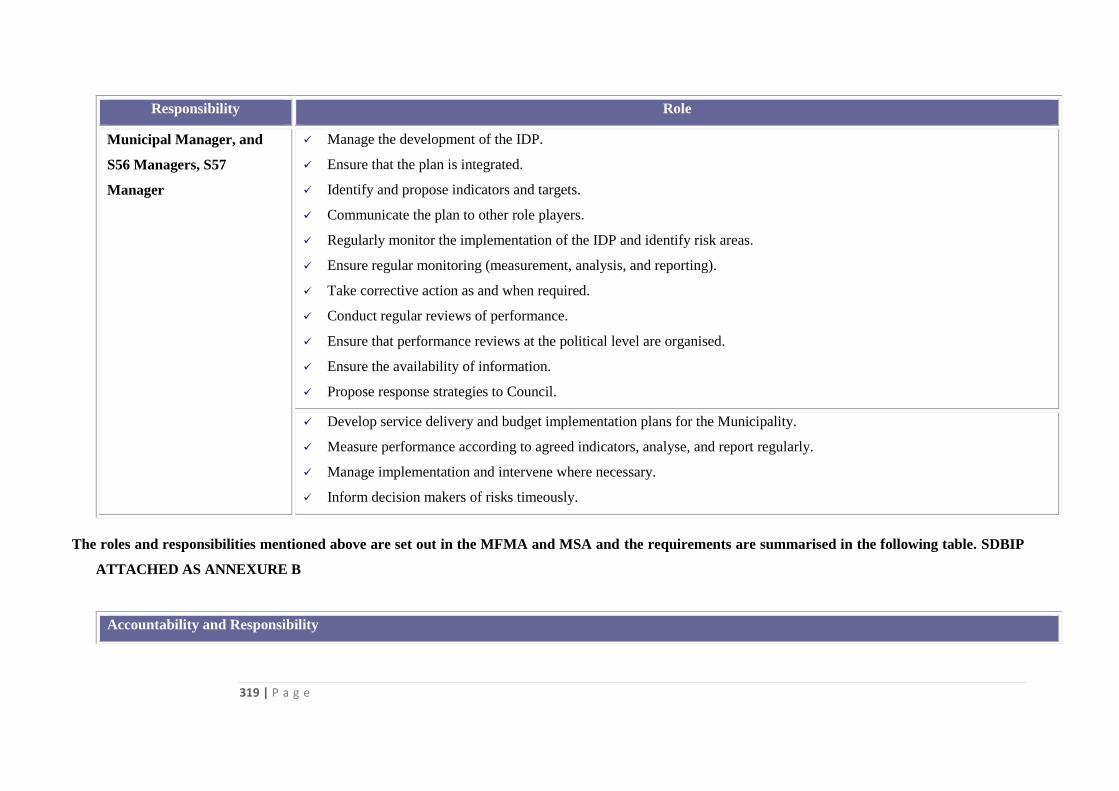
319 | P a g e
Responsibility Role
Municipal Manager, and
S56 Managers, S57
Manager
Manage the development of the IDP.
Ensure that the plan is integrated.
Identify and propose indicators and targets.
Communicate the plan to other role players.
Regularly monitor the implementation of the IDP and identify risk areas.
Ensure regular monitoring (measurement, analysis, and reporting).
Take corrective action as and when required.
Conduct regular reviews of performance.
Ensure that performance reviews at the political level are organised.
Ensure the availability of information.
Propose response strategies to Council.
Develop service delivery and budget implementation plans for the Municipality.
Measure performance according to agreed indicators, analyse, and report regularly.
Manage implementation and intervene where necessary.
Inform decision makers of risks timeously.
The roles and responsibilities mentioned above are set out in the MFMA and MSA and the requirements are summarised in the following table. SDBIP
ATTACHED AS ANNEXURE B
Accountability and Responsibility
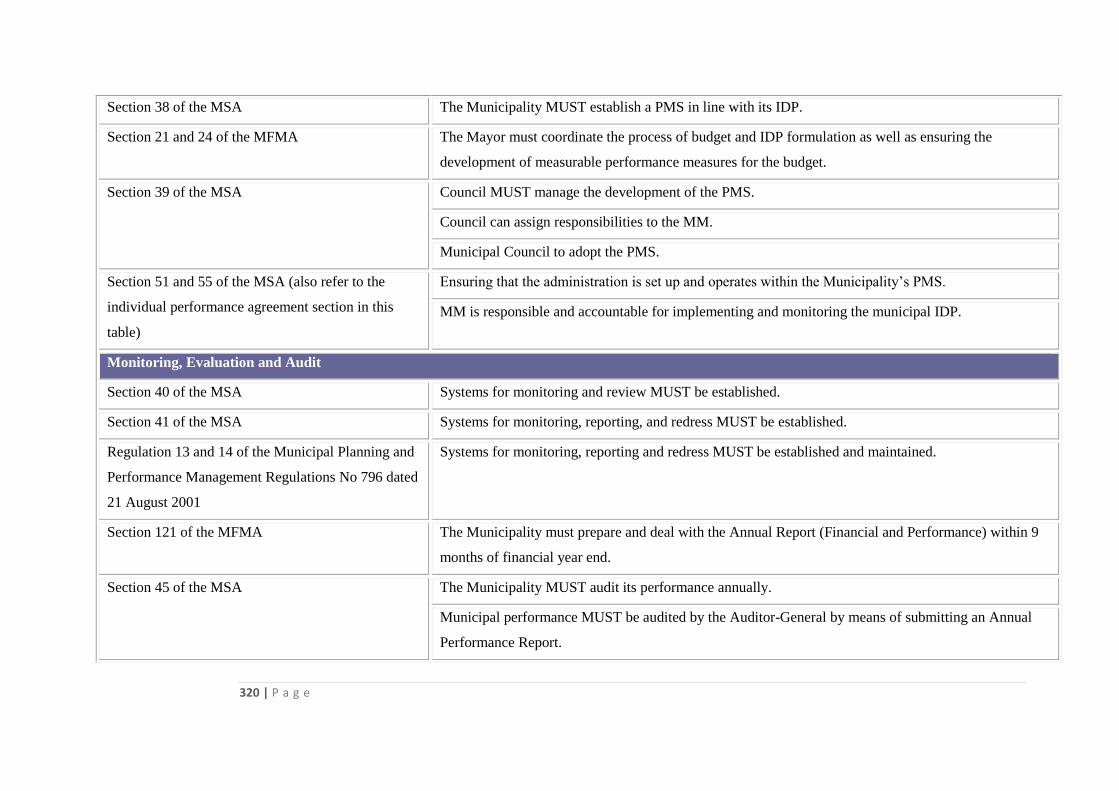
320 | P a g e
Section 38 of the MSA The Municipality MUST establish a PMS in line with its IDP.
Section 21 and 24 of the MFMA The Mayor must coordinate the process of budget and IDP formulation as well as ensuring the
development of measurable performance measures for the budget.
Section 39 of the MSA Council MUST manage the development of the PMS.
Council can assign responsibilities to the MM.
Municipal Council to adopt the PMS.
Section 51 and 55 of the MSA (also refer to the
individual performance agreement section in this
table)
Ensuring that the administration is set up and operates within the Municipality’s PMS.
MM is responsible and accountable for implementing and monitoring the municipal IDP.
Monitoring, Evaluation and Audit
Section 40 of the MSA Systems for monitoring and review MUST be established.
Section 41 of the MSA Systems for monitoring, reporting, and redress MUST be established.
Regulation 13 and 14 of the Municipal Planning and
Performance Management Regulations No 796 dated
21 August 2001
Systems for monitoring, reporting and redress MUST be established and maintained.
Section 121 of the MFMA The Municipality must prepare and deal with the Annual Report (Financial and Performance) within 9
months of financial year end.
Section 45 of the MSA The Municipality MUST audit its performance annually.
Municipal performance MUST be audited by the Auditor-General by means of submitting an Annual
Performance Report.
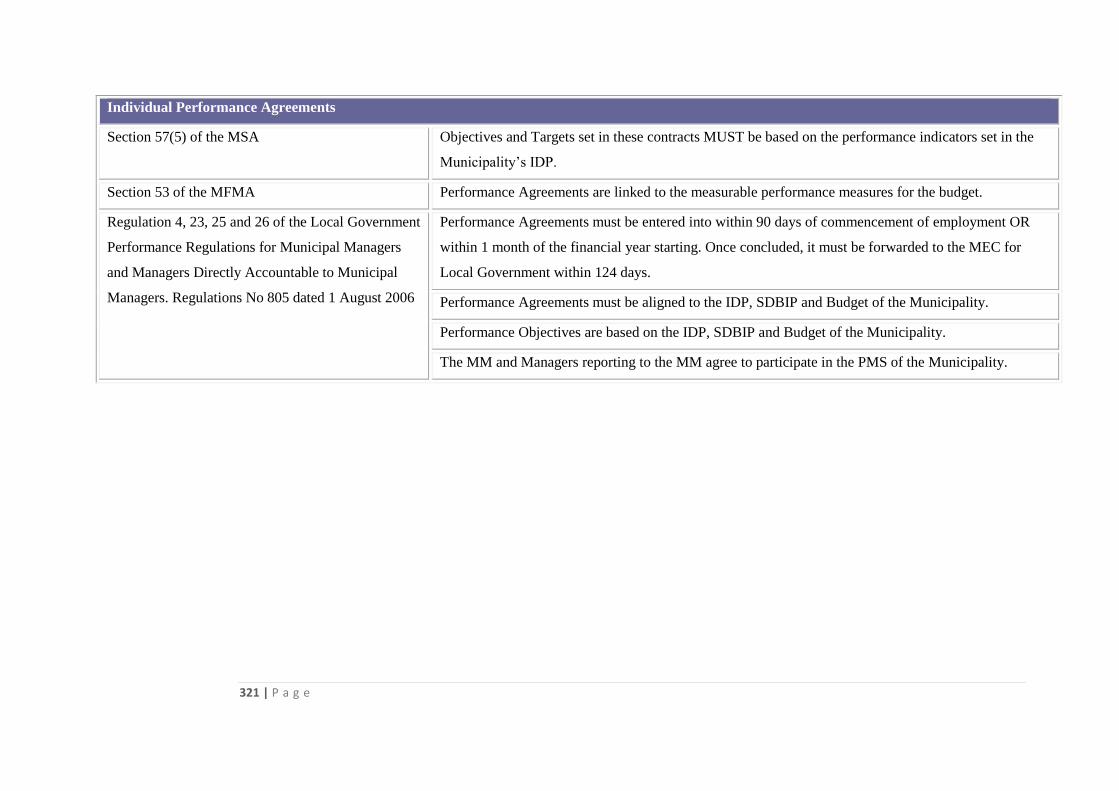
321 | P a g e
Individual Performance Agreements
Section 57(5) of the MSA Objectives and Targets set in these contracts MUST be based on the performance indicators set in the
Municipality’s IDP.
Section 53 of the MFMA Performance Agreements are linked to the measurable performance measures for the budget.
Regulation 4, 23, 25 and 26 of the Local Government
Performance Regulations for Municipal Managers
and Managers Directly Accountable to Municipal
Managers. Regulations No 805 dated 1 August 2006
Performance Agreements must be entered into within 90 days of commencement of employment OR
within 1 month of the financial year starting. Once concluded, it must be forwarded to the MEC for
Local Government within 124 days.
Performance Agreements must be aligned to the IDP, SDBIP and Budget of the Municipality.
Performance Objectives are based on the IDP, SDBIP and Budget of the Municipality.
The MM and Managers reporting to the MM agree to participate in the PMS of the Municipality.

322 | P a g e
323 | P a g e
SECTION H
ORGANISATIONAL SCORECARD 2020/2021
ORGANIZATIONAL PERFORMANCE MANAGEMENT SYSTEM
The system allows for departmental performance reviews monthly, quarterly, bi-annually and annually. The Executive Committee performance reviews will
be conducted .Quarterly and the Council and public review will be done annually.
The Municipal Manager will coordinate and ensure good quality of reporting and reviews and will also ensure conformity to reporting formats and check the
reliability of reported information where possible. In terms of auditing of performance reports, the municipality is established an Internal Audit Unit in a
form of Shared Services Model. Also the Audit Committee was
Established in terms of section 166 of the Municipal Finance Management Act (No 56 of 2003).
The Municipal System Act No. 32 of 2000 holds that a municipality must-
-
grated development plan;
te a culture of performance management among its political structures, political office bearers and councilors and in its administration and administer
its affairs in an economical, effective, efficient and accountable manner.
324 | P a g e
Development of performance management system
The executive committee or executive mayor of a municipality or, if the municipality does not have an executive committee or executive mayor, a committee
of
Councilors appointed by the municipal council must- Manage the development of the municipality's performance management system and Assign
responsibilities in this regard to the municipal manager and Submit the proposed system to the municipal council for adoption.
Progress with regard to development / Implementation of PMS
The District prides itself for managing to develop a system that is functionally and that is used by all concern as a tool that helps to measure the organizations
Performance. The Big 5 Hlabisa Municipality has revised its Performance Management System and as such has developed the Organizational Scorecard that
will assist to measure the performance of the organization. Please see the attached scorecard document. Annexure 3