Embed Size (px)
Citation preview

50-Year Lifecycle Capital Cost Model DocumentationD R A F T 2014 B U S I N E S S P L A N
Section 3: Capital and Lifecycle Costs
Prepared by
for the California High-Speed Rail Authority
California High-Speed Rail System
DRAFT 2014 BUSINESS PLAN TECHNICAL SUPPORTING DOCUMENT
50-Year Lifecycle Capital Cost Model Documentation
February 2014


California High-Speed Rail System Technical Supporting Document
v
Table of Contents
1 Introduction ................................................................................................................................1
1.1 The California High Speed Rail System ......................................................................................... 1
1.2 Model Scope ................................................................................................................................. 1
2 Purpose of the Model ..................................................................................................................2
3 Forecasting and Costing Methodology ..........................................................................................3
3.1 Model Components ...................................................................................................................... 3
3.2 Capital Rehabilitation and Replacement Costs 50-Year Forecasting Methodology ..................... 4 3.2.1 Step 1: Determine applicable asset categories ............................................................... 4 3.2.2 Step 2: Determine # of units and initial capital costs by segment .................................. 4 3.2.3 Step 3: Determine lifecycle requirements ....................................................................... 5 3.2.4 Step 4: Calculate total rehabilitation and replacement costs ......................................... 6 3.2.5 Step 5: Validate model .................................................................................................... 6
3.3 Model Functionality ...................................................................................................................... 6
4 Literature Review ........................................................................................................................7
4.1 Model Framework ........................................................................................................................ 7
4.2 Track Cost ..................................................................................................................................... 7
4.3 Asset Lifecycles ............................................................................................................................. 8
5 Universal Assumptions .................................................................................................................9
6 Track Structures and Track ......................................................................................................... 12
6.1 Assumptions and Model Inputs .................................................................................................. 12
6.2 Unit Quantities............................................................................................................................ 17
7 Stations, Terminals, Intermodal .................................................................................................. 18
7.1 Assumptions and Model Inputs .................................................................................................. 18
7.2 Unit Quantities............................................................................................................................ 29
8 Support Facilities, Yards, Shops, Administration Buildings ........................................................... 30
8.1 Assumptions and Model Inputs .................................................................................................. 31
8.2 Unit Quantities............................................................................................................................ 36
9 Sitework, Right of Way, Land, Existing Improvements ................................................................. 37
9.1 Assumptions and Model Inputs .................................................................................................. 37
10 Communications and Signaling ................................................................................................... 38
10.1 Assumptions and Model Inputs .................................................................................................. 38
11 Electric Traction ......................................................................................................................... 42
11.1 Assumptions and Model Inputs .................................................................................................. 42
11.2 Unit Quantities............................................................................................................................ 45
California High-Speed Rail System Technical Supporting Document
vi
12 Vehicles ..................................................................................................................................... 46
12.1 Assumptions and Model Inputs .................................................................................................. 46
12.2 Unit Quantities............................................................................................................................ 48
13 Professional Services .................................................................................................................. 49
14 Contingency ............................................................................................................................... 50
14.1 Unallocated Contingency ............................................................................................................ 50
14.2 Allocated Contingency ................................................................................................................ 50
15 Monte Carlo Risk Analysis .......................................................................................................... 51
Figures
Figure 1. Capital Rehabilitation and Replacement Model Components....................................................... 3
Figure 2. Development of Rehabilitation and Replacement Costs ............................................................... 4
Figure 3. Risk exposure associated with O&M, Lifecycle, and Capital Expenditure Curves ....................... 53
Tables
Table 1. System Route Segments as Proposed in the 2012 Business Plan ................................................... 5
Table 2. Lifecycle Requirements Comparison ............................................................................................... 8
Table 3. Track and Track Structure Inputs .................................................................................................. 15
Table 4. Stations, Terminals, Intermodal Inputs ......................................................................................... 26
Table 5. Support Facilities, Yards, Shops, Administration Buildings Inputs ................................................ 33
Table 6. Communications and Signaling Inputs .......................................................................................... 41
Table 7. Electric Traction Inputs .................................................................................................................. 44
Table 8. Vehicles Inputs .............................................................................................................................. 47
Table 9. Number of Trainsets and Start Dates ............................................................................................ 48
Table 10. Professional Services Cost Allowances for Categories 10, 20, 30, and 40 .................................. 49
Table 11. Allocated contingency percentages by cost category ................................................................. 50
Table 12. Probabilistic outcomes of Monte Carlo simulations for each phase and combined (‘All’). ........ 54
California High-Speed Rail System Technical Supporting Document
vii
Acronyms
Authority California High Speed Rail Authority
CTRL Channel Tunnel Rail Link
O&M Operations and Maintenance
SCC Standard Cost Category
UK United Kingdom
YOE Year of Expenditure

California High-Speed Rail System Technical Supporting Document
1
1 Introduction
1.1 The California High Speed Rail System
The California High-Speed Rail Authority (Authority) is responsible for developing and implementing
California’s high-speed rail system. The system will consist of over 800 miles of track and up to 24
stations. Electrically-powered trains will travel speeds of up to 220 miles per hour, with a travel time of
less than 2 hours and 40 minutes between San Francisco and Los Angeles. Initial service will serve San
Francisco to Los Angeles via the Central Valley; service will then be added to Sacramento and San Diego.
The system will also be integrated with existing rail systems to enhance rail service and improve
efficiency. Funding will be provided by a mix of federal, state, and private sources and the project will be
a partnership between the public and private sectors.
1.2 Model Scope
This Technical Memorandum documents the inputs, assumptions, and methodologies used to develop
an Excel-based spreadsheet model that forecasts the 50-year capital rehabilitation and replacement
costs for the infrastructure and assets of California’s high-speed rail system.
California High-Speed Rail System Technical Supporting Document
2
2 Purpose of the Model
The purpose of the model is to develop a capital replacement estimate that forecasts the 50-year capital
rehabilitation and replacement costs for the infrastructure and assets of California’s high-speed rail
system. The Excel-based spreadsheet model presents the rehabilitation and replacement costs in two
ways:
Constant dollars—Estimates are provided in 2012 dollars
Year-of-expenditure dollars—Estimates can be inflated to year-of-expenditure dollars, using
2012 dollars as a baseline
The team worked closely with subject matter experts for various system components to compile the
technical data and used the 2012 Business Plan and Draft Concept of Operations to establish system and
service assumptions. The model results are an early stage forecast and represent an order of magnitude
cost estimate, based on industry standards, guidelines, experience, and expertise.

California High-Speed Rail System Technical Supporting Document
3
3 Forecasting and Costing Methodology
The cost estimates include all the resources and activities necessary to perform the rehabilitation and
replacements of the assets in the high-speed rail system that will be necessary in its first 50 years of
operation. The inputs and assumptions are compiled based on assets’ design lives, international and
domestic experience with the rehabilitation and replacement of system components, and industry best
practices with regard to asset management. The 2012 Business Plan and the Draft Concept of Operations
were used as references for service level and other system assumptions. Various procurement options
and contracting arrangements were not considered in the development of the model but can be
appropriately applied to adjust model results.
3.1 Model Components
The 50-year capital rehabilitation and replacement model consists of two major components:
1. Asset rehabilitation costs refer to significant investments (that go beyond routine
maintenance) associated with achieving a state of good repair during the first 50 years of
operations. Rehabilitation activities include part upgrades, tie replacements, major upkeep
projects, etc.
2. Asset replacement costs refer to the costs to replace an asset or major asset component in
full during the first 50 years of operations.
The costs are calculated by route segment, based on lifecycle inputs for each asset category to allow for
the analysis to adapt to phasing and implementation assumptions. Allocated contingency, professional
services, and unallocated contingency are then added to the costs to produce the 50-year capital
rehabilitation and replacement forecast (Figure 1).
Figure 1. Capital Rehabilitation and Replacement Model Components
Rehabilitation and replacement costs were calculated based on lifecycle activity requirements provided
by each asset class specialist, as described below.
Lifecycle Inputs for Each Asset Category
Rehabilitation and
Replacement Costs by
Route Segment
Allocated Contingency
and Unallocated Contingency
Professional Services
50-Year Capital
Rehabilitation and
Replacement Forecast

California High-Speed Rail System Technical Supporting Document
4
3.2 Capital Rehabilitation and Replacement Costs 50-Year Forecasting Methodology
The team took the following steps (Figure 2) to develop a 50-year forecast of rehabilitation and
replacement costs.
Figure 2. Development of Rehabilitation and Replacement Costs
3.2.1 Step 1: Determine applicable asset categories
In step 1, the team worked with the engineering and capital cost estimating teams to identify the
second level FRA standard cost categories (SCC) that are part of the system’s design (and corresponding
unit quantities and initial capital costs) from within the first level categories as follows:
10 Track structures and track—includes bridges, tunnels, viaducts, and conventional ballasted
and non-ballasted track
20 Stations, terminals, and intermodal—includes station buildings, accessways, and parking
lots
30 Support facilities, yards, shop, admin buildings—includes light maintenance facility, heavy
maintenance facility, storage/maintenance of way building, and yard and track
40 Sitework, right of way, land, existing improvements—includes retaining walls and sound
walls
50 Communications and signaling—includes wayside signaling equipment and
communications
60 Electric traction—includes traction power supply and distribution
70 Vehicles—includes revenue vehicles, non-revenue vehicles, and spare parts
The capital cost team extracted those cost categories that were part of the estimate prepared for the
2012 Business Plan.
3.2.2 Step 2: Determine # of units and initial capital costs by segment
In step 2, the team identified the unit quantities and initial capital costs (in 2012 dollars) by stop
segment for the corresponding asset categories identified in step 1. These inputs were extracted from
the capital cost estimate model prepared for the 2012 Business Plan. Since initial capital costs for some
asset categories vary slightly between various stop segments, a uniform weighted average of all the
costs reported for each asset category is used for the capital rehabilitation and replacement model.
Step 1: Determine applicable
asset categories
Step 2: Determine # of units and initial capital costs by stop
segment
Step 3: Determine
lifecycle requirements
Step 4: Calculate
total rehab and
replacement costs
Step 5: Validate and
QA/QC Model
California High-Speed Rail System Technical Supporting Document
5
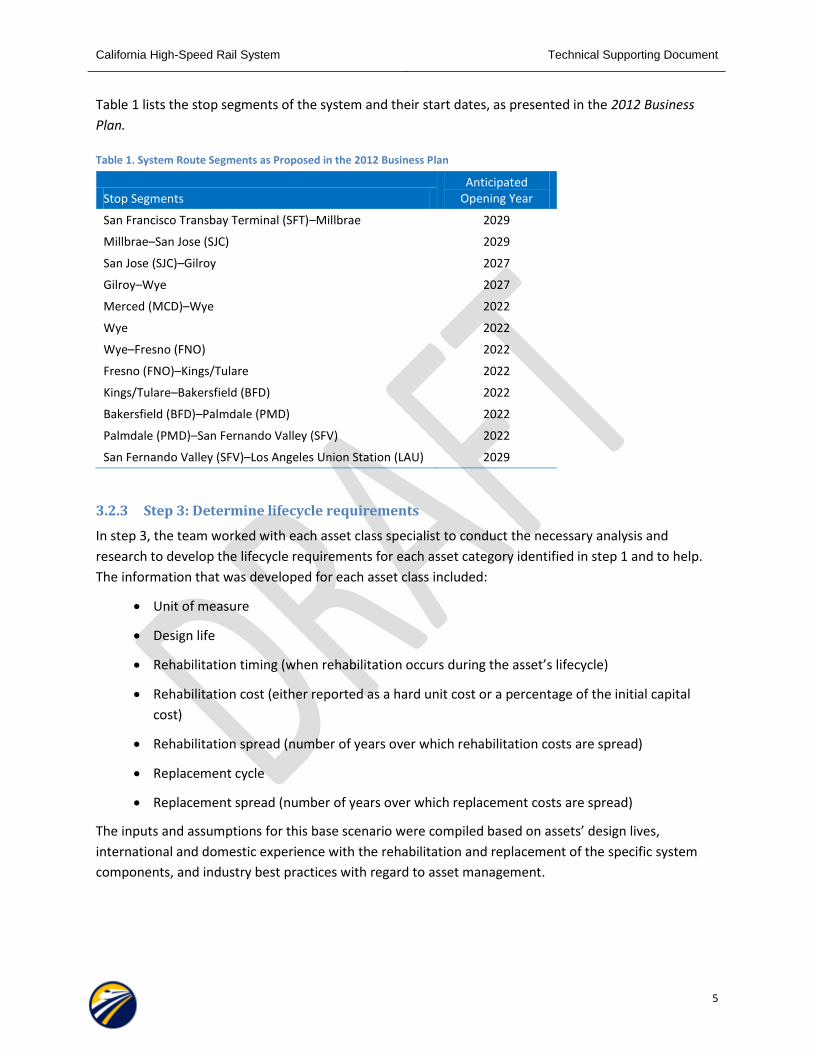
Table 1 lists the stop segments of the system and their start dates, as presented in the 2012 Business
Plan.
Table 1. System Route Segments as Proposed in the 2012 Business Plan
Stop Segments Anticipated
Opening Year
San Francisco Transbay Terminal (SFT)–Millbrae 2029
Millbrae–San Jose (SJC) 2029
San Jose (SJC)–Gilroy 2027
Gilroy–Wye 2027
Merced (MCD)–Wye 2022
Wye 2022
Wye–Fresno (FNO) 2022
Fresno (FNO)–Kings/Tulare 2022
Kings/Tulare–Bakersfield (BFD) 2022
Bakersfield (BFD)–Palmdale (PMD) 2022
Palmdale (PMD)–San Fernando Valley (SFV) 2022
San Fernando Valley (SFV)–Los Angeles Union Station (LAU) 2029
3.2.3 Step 3: Determine lifecycle requirements
In step 3, the team worked with each asset class specialist to conduct the necessary analysis and
research to develop the lifecycle requirements for each asset category identified in step 1 and to help.
The information that was developed for each asset class included:
Unit of measure
Design life
Rehabilitation timing (when rehabilitation occurs during the asset’s lifecycle)
Rehabilitation cost (either reported as a hard unit cost or a percentage of the initial capital
cost)
Rehabilitation spread (number of years over which rehabilitation costs are spread)
Replacement cycle
Replacement spread (number of years over which replacement costs are spread)
The inputs and assumptions for this base scenario were compiled based on assets’ design lives,
international and domestic experience with the rehabilitation and replacement of the specific system
components, and industry best practices with regard to asset management.

California High-Speed Rail System Technical Supporting Document
6
3.2.4 Step 4: Calculate total rehabilitation and replacement costs
In step 4, the initial capital costs of each asset category for each stop segment were calculated by
multiplying the initial capital cost by the number of units and a unit conversion factor. A unit conversion
factor was created where it was necessary to create cost categories consistent with the rehabilitation
and replacement assumptions (for example, a double-track section unit cost would be divided by two to
create a unit-cost per track-mile if the rehabilitation and replacement cost categories relied on track
miles). The initial capital cost was then used to calculate rehabilitation and replacement costs for each
stop segment, based on the lifecycle requirements for each asset category that were collected in step 3.
The evaluation period for each stop segment begins at the start of the anticipated opening year. The
two approaches used to calculate these costs are summarized in more detail in the next section.
The sum of all costs for rehabilitation and replacement in each year for each stop segment is the total
capital rehabilitation and replacement cost, which is calculated in both 2012 dollars or in nominal YOE
dollars. A variable inflation rate can be assigned by the model user to calculate costs in year-of-
expenditure dollars.
Rehabilitation and replacement costs that will occur beyond the 50-year timeframe were not included in
the estimate.
3.2.5 Step 5: Validate model
In step 5, the team worked with the asset class specialists to thoroughly review the model framework
and calculations for validity and confirm that model inputs and results are within a reasonable order of
magnitude. A thorough QA/QC process was conducted on the model to assure calculations were being
made correctly and model inputs/assumptions were logically consistent.
3.3 Model Functionality
The model functionality includes the following:
Inputs—The model easily allows for changes to the asset classes’ rehabilitation costs,
rehabilitation timing and spread, replacement costs, replacement timing and spread, and
number of units in each geographical segment. However, the model does not easily allow for
any changes to the asset class hierarchy.
Scenario testing—The model was developed to handle scenario testing related to the timing of
when assets come online in each stop segment and the timing, cost, and spread of
replacement.
Transparency—The model was developed to transparently present which methodologies are
used for each asset class and all associated data sources. The model also allows for changes to
forecasting approaches. Specific approaches are discussed in further detail in the next section.
Outputs—The model generates tables and graphs that summarize the 50-year lifecycle costs in
real and inflated dollars, annual and total costs, costs by asset categories, rehabilitation versus
replacement costs, etc.

California High-Speed Rail System Technical Supporting Document
7
4 Literature Review
4.1 Model Framework
The framework to develop the lifecycle cost estimate methodology is based on established research and
practice; the team conducted a literature review prior to the development of the model to extract any
relevant guidance for development of the model. This model uses a framework based on a similar
process produced by MAINtenance, renewaL, and Improvement of rail transport iNfrastructure to
reduce Economic and environmental impacts (MAINLINE), which is part of the European Union-funded
research program on a variety of topics, to analyze lifecycle cost estimates. MAINLINE’s methodology is
documented in Proposed methodology for a Life Cycle Assessment Tool (LCAT) and aims to capture all
costs involved throughout the life of an asset: construction, operation, maintenance, and end-of-life.
This model excludes operation and maintenance costs, but extracts the relevant philosophy from
MAINLINE’s methodology to develop a process to analyze lifecycle costs:
Asset type and classification needs to be defined for the evaluation process
Lifecycle costs include the initial cost to acquire and install assets and the cost of ownership
throughout the lifecycle, as a result of asset degradation
Calculating total costs requires consideration for system operations and any other key
parameters necessary for a lifecycle cost analysis
Maintenance and rehabilitation are needed to keep an asset in safe condition or to extend its
service life; corrective maintenance/rehabilitation work is necessary when a structure is
considered to be structurally inadequate (e.g., major concrete repairs, replacements of
structural elements, etc.)
Replacement is necessary when the structure is considered to be functionally obsolete
4.2 Track Cost
UIC’s International Benchmarking of Track Cost compares track cost between different projects. UIC
conducted a benchmarking exercise using twelve Western-European, five US-Class I, and four selected
East-Asian Railways. The main objectives of the exercise were to compare the cost of investment and
maintenance and identify and analyze individual cost drivers. The results of the benchmarking exercise
include:
Major track and catenary renewal is as expensive as new construction of track and catenary
Slab track and subgrade works are important cost-drivers for track
Slab track has lower maintenance cost but due to special roadbed and civil engineering, the
impact of its cost is more pronounced than on superstructure cost alone

California High-Speed Rail System Technical Supporting Document
8
Renewal costs from the study participants are broken down as follows:
– Overhead: 15%
– Labor: 12%
– Material: 22%
– Machinery: 3%
– Miscellaneous: 2%
– Contractors (External): 46%
However, the 2014 lifecycle model does not breakout costs into these categories so it is hard to
compare “apples to apples.”
4.3 Asset Lifecycles
Lifecycle estimates align with best practice where guidance is available. The International Union of
Railways (UIC) and the European Investment Bank (EIB) provide the following guidance for the
Maintenance of high speed lines components outlined in Table 2.
Table 2. Lifecycle Requirements Comparison
Asset UIC Lifecycle
(years) EIB Lifecycle
(years) 2014 Model
(years)
Track Structure (e.g., tunnels, viaducts, etc.) — 80-100 1001
Concrete Ties 40 40 501
Slab Track 60 — >50
Fastenings 40 — 40
Ballast 35 20 501,2
Overhead Contact System Piles and Portals 40 — 503
Signaling Systems 15 — 304
Vehicles — 15-25 25
Access Facilities: Structural Elements — 10-50 40-45
1 Higher RAMS targets are being applied to California’s greenfield application, combined with relatively light usage of the track
structure, ties, and ballast is anticipated to lead to useful lifecycles beyond those found in older European systems. 2 Ballast is assumed to have two rehabilitation cycles (i.e., mid-life cleanings) instead of one (the first cycle starting at year 16 of
the asset’s lifecycle and the second starting at year 33), helping extend the anticipated lifecycle to 50 years. 3 The overhead contact system is assumed to have at least one rehabilitation cycle at approximately 30 years, or when the wire
cross section reaches 25 percent wear. This will prolong the lifecycle of the system and therefore the entire system does not need to be replaced until after 50 years. 4 Rehabilitation for signaling systems is assumed to occur every 10 years (throughout the 50 year lifecycle) and includes UPS
battery replacement and COTS and other hardware replacement. Since component parts are replaced often (as reflected in the rehabilitation portion of the Communications and Signaling estimates), the entire system can be maintained in place for a longer period.
California High-Speed Rail System Technical Supporting Document
9
5 Universal Assumptions
The following assumptions are applicable across the entire model:
1. Assets were analyzed at the second level of the FRA standard cost categories (referred to as
“asset classes”) for capital projects/programs.5
2. In some cases, new second level categories were defined to enable a rational lifecycle analysis
of pertaining costs when the lifecycle variables were derived at levels that were different
from the SCC categories. These new second level categories are demarcated with a letter
(e.g., 20.02 A Station structure).
3. The rehabilitation and replacement costs of these new second level categories are calculated
independently then added together to generate the original second level rehabilitation and
replacement costs.
4. Each asset class will have a number of units associated with a geographical segment (defined
from one stop to the next) of the CA HSR line. It is assumed that the geographical segment
will be associated with a phase, which will provide each asset class’ start date (this is
necessary for calculating the asset’s rehabilitation and replacement timing).
5. CA HSR asset classes, quantities, and initial capital costs were pulled directly from the CA HSR
capital cost model for the 2012 Business Plan. Since initial capital costs in the CA HSR capital
cost model are priced at the third level, the second level asset class unit costs are calculated
as a sum of all costs from the third level.
6. When unit costs vary by stop segment, a weighted average of the costs is used to represent
the initial capital cost.
7. The base year for model cost estimates is 2012; meaning real costs are reported in 2012
dollars.
8. Model outputs are designed to reflect both real (year 2012) and nominal (year of
expenditure) dollars. Costs in nominal dollars will increase (or decrease) from costs in real
dollars depending on the variable inflation rate, assigned by the model user. If the inflation
rate is set to zero then the real and nominal costs will be the same.
9. Capital costs are assumed to include all labor, materials, and contractor costs associated with
the asset’s construction and subsequent rehabilitation or replacement.
10. Assets are procured as close as possible to specifications.
11. The O&M cost model estimates are designed to allow for all costs necessary to maintain a
state of good repair through adequate preventive maintenance. Thus the capital replacement
model assumes that preventive maintenance will occur on schedule so the effects of deferred
maintenance are not considered.
5 The first level of SCC categories is, for example, 10: Track structures and track. The second level is, for example, 10.01: Track
structures: Viaduct. The third level is, for example, 10.01.122: Elevated structures—1 track (30’ average pier height). There are a number of codes consisting of “NC” followed by three digits; these are considered as part of the third level.
California High-Speed Rail System Technical Supporting Document
10
12. Rehabilitation and replacement costs are assumed to be spread over one or more years (this
is a model input). Rehabilitation and replacement “spread” refers to the number of years over
which rehabilitation and replacement costs are incurred. The spread is designed to allow for
rehabilitation and replacement programs that last more than one year.
13. Rehabilitation and replacement costs are cyclical and spread evenly before and after the
target year for odd-numbered spreads. For even-numbered spreads that cannot be split in
half to be before and after the target year, the spread is weighted backwards (e.g., 2 years
before target year, 1 year after for a 4-year spread). In some cases, the spread is irregular and
is entered as a row input (see 18.b below).
14. Rehabilitation and replacement cycles will not overlap (i.e. if an asset is being replaced in a
given time period, then rehabilitation will not occur in that time period).
15. Replacement costs are reported as a percentage of initial capital cost (plus inflation, where
applicable) to reflect only the portions of the asset that will be replaced throughout the 50-
year timeframe, unless otherwise noted.
16. Rehabilitation and replacement costs are either reported as a per-unit dollar amount, or as a
percentage of the initial capital cost.
17. Model inputs are based on industry standards and experience of existing systems when
applicable; sources were documented accordingly.
18. Rehabilitation and replacement inputs are reported using the two approaches below:
a. For rehabilitation and replacement costs that follow a standard, cyclical pattern, costs are
entered directly into the input sheet. For example, when an asset is replaced every 20
years and costs are spread over three years.
b. For rehabilitation and replacement costs that do not follow a standard, cyclical, or
consistent pattern, costs are entered as row inputs, as either a dollar amount, or as a
percentage of the initial capital cost. For example, when an asset is rehabilitated in year 10
with a spread of 2 years, and again in year 25 with a spread of 4 years.
19. Row inputs are entered by year of the asset’s operation. If a given stop segment’s operations
begin in 2030, that year represents “year 1” for rehabilitation and replacement purposes.
20. Unit quantities by stop segment for each asset category were taken from the capital cost
model prepared for the 2012 Business Plan.
21. The Evaluation Period refers to the 50-year timeframe, spanning from 2022-2071.
22. For many asset classes, the unit for rehabilitation and replacement cost estimates is track
miles. A factor has been built into the model for unit conversion (e.g., route miles to track
miles). If no factor is needed, the default value of 1.0 is used.
23. An unallocated contingency of 5 percent has been applied to each second level asset
category. The total unallocated contingency for all second level asset categories is included as
a separate first level cost category (“90 Unallocated Contingency”).
California High-Speed Rail System Technical Supporting Document
11
24. Allocated contingency (15 to 25 percent based on the capital cost model) has also been
applied to each second level asset category, and is included in each second level category’s
cost estimate.
25. An allowance for professional services of 10 percent of total costs has been applied to
10 Track and Track Structures, 20 Stations, Terminals, Intermodal, 30 Support Facilities, Yards,
Shops, Admin Building, and 40 Sitework, Right of Way, Land, Existing Improvements and 20
percent of total costs has been applied to 50 Communications and Signaling and 60 Electric
Traction.6 Professional services is not applicable to 70 Vehicles. The total professional services
costs for all second level asset categories are included as a separate first-level cost category
(“80 Professional Services”). For a breakdown of the components of the professional services,
see Section 13, Professional Services, of this memo.
26. Four additional segments have been included in the model as placeholders in the event new
stop segments are added (or existing stop segments are split in half).
27. The results were escalated from 2012 $ (as presented here) to 2013 $ (as presented in the
Draft 2014 Business Plan) using the Engineering News Record Construction Cost Index from
the average of the 3rd quarter of 2012 to the 3rd quarter of 2013. This amounted to an
escalation rate of 0.19 percent.
The following sections describe in detail the assumptions and estimation methods for each asset
category of the high-speed rail system.
6 No costs were included for 40 Sitework, right of way, land, existing improvements since rehabilitation and replacement is not
anticipated during the 50-year timeframe. However, the 10 percent allowance for professional services was still applied to this category in the event the lifecycle information is updated.
California High-Speed Rail System Technical Supporting Document
12
6 Track Structures and Track
Category 10 Track Structures and Track includes the following asset classes:
10.01 Track structure: Viaduct
10.02 Track structure: Major/movable bridge
10.05 Track structure: Cut and fill (>4’ height/depth)
10.06 Track structure: At-grade (grading and subgrade stabilization)
10.07 Track structure: Tunnel
10.08 Track structure: Retaining walls and systems
10.09 Track new construction: Conventional ballasted
– 10.09 A Ditching and drainage
– 10.09 B Ballast
– 10.09 C Ties
– 10.09 D Rail
10.10 Track new construction: Non-ballasted
– 10.10 A Ditching and drainage
– 10.10 B Track fasteners
– 10.10 C Rail
10.14 Track: Special track work (switches, turnouts, insulated joints)
– 10.14 A Turnouts
– 10.14 B Crossovers
– 10.14 C Switch heaters
6.1 Assumptions and Model Inputs
The following assumptions were made for category 10 Track Structures and Track:
New second level categories were defined to enable a rational lifecycle analysis of pertaining
costs. These new second level categories are demarcated with a letter (e.g., 10.09A Ditching
and drainage)
Asset categories 10.01 Track structure: Viaduct, 10.02 Track structure: Major/movable bridge,
10.05 Track structure: Cut and fill (> 4’ height/depth), 10.06 Track structure: At-grade (grading
and subgrade stabilization), 10.07 Track structure: Tunnel, and 10.08 Track structure: Retaining
walls and systems have a design life of 100 years and will not have any rehabilitation or
replacement costs during the 50-year timeframe
The rehabilitation of joints and bearings are included as part of regular operations and
maintenance costs and are not included as part of rehabilitation costs for 10.01 Track
structure: Viaduct and 10.02 Track structure: Major/Movable bridge

California High-Speed Rail System Technical Supporting Document
13
10.09 Track Structure Conventional ballasted
Track structure has a lifecycle greater than 50 years, but track components will need to be
rehabilitated and/or replaced within the 50-year timeframe
– 10.09 A Ditching and drainage
Ditching and drainage is considered an O&M activity and is not included as part of
capital costs.
– 10.09 B Ballast
Rehabilitation will occur during year 16 and 33 of the asset’s lifecycle
The first rehabilitation cycle will occur during years 16-21 and the second cycle will
occur during years 33-38
Rehabilitation will cost 20% of the replacement cost, or $80,000
Replacement will occur every 50 years and is spread over 10 years
Replacement will cost $400,000 per track mile
Ballast replacement will ideally coincide with the timing of rail renewal
– 10.09 C Ties (replacement only)
No rehabilitation is anticipated during the 50-year timeframe
Replacement will occur every 50 years and is spread over 10 years
Replacement will cost $260,000 per track mile
Concrete ties are imputed to have a 50-year life expectancy. The extremely light vehicle
weights should also lengthen the span of wood ties owing to less stress.
– 10.09 D Rail (replacement only)
No rehabilitation is anticipated during the 50-year timeframe
Lifecycle is 50 years, spread over 10 years
The cost to replace each track mile is equal to $500,000
The Authority will not be responsible for the rehabilitation and replacement of ballasted
freight track and ballasted track relocation (cost categories 10.09.810—10.09.924); the costs
for these asset classes are not included in this analysis/report
Estimates are based on HSR experience in France, Germany, and conventional American
railroad operations
10.10 Track new construction: Non-ballasted
Track structure has a lifecycle of greater than 50 years, but track components will need to be
rehabilitated and/or replaced within 50-year timeframe (see below)
– 10.10 A Ditching and drainage
Ditching and drainage is considered an O&M activity and is not included as part of
capital costs
– 10.10 B Track fasteners (replacement only)
No rehabilitation is anticipated during the 50-year timeframe

California High-Speed Rail System Technical Supporting Document
14
Replacement will occur every 40 years, spread over 30 years
Replacement will cost $500,000 per track mile
– 10.10 C Rail (replacement only)
No rehabilitation is anticipated during 50-year timeframe
Lifecycle is 50 years, spread over 10 years
The cost to replace each track mile is equal to $500,000
Estimates are based on HSR experience in France, Germany, and Taiwan, and conventional
American railroad operations
10.14 Track: Special track work (switches, turnouts, insulated joints)
10.14 A Turnouts
– Rehabilitation will occur every 25 years, spread over 10 years
– Rehabilitation will cost 30% of the initial capital cost
– Replacement will occur every 50 years, spread over 20 years
– Replacement will cost 100 percent of the initial capital cost for turnouts per stop segment
10.14 B Crossovers
– Rehabilitation will occur every 50 years, spread over 10 years
– Rehabilitation will cost 30% of the initial capital cost
– Replacement will occur every 100 years and cost 100 percent of the initial capital cost for
crossovers per stop segment
10.14 C Switch heaters
– In the event switch heaters are used, costs will be accounted for as a percentage of the
initial capital cost of 10.014 A and 10.14 B
Estimates are based on HSR experience in France, Germany, and Taiwan, and conventional
American railroad operations
Model inputs are presented in Table 3.

California High-Speed Rail System Technical Supporting Document
15
Table 3. Track and Track Structure Inputs
FRA Standard Cost Categories for Capital Projects/Programs
Unit (measure)
Lifecycle (years)
Rehab Timing (years)
Rehab Cost (per unit)
Rehab Spread (years)
Replacement Spread (years)
Replacement Cost (per unit)
10.01 Track structure: Viaduct — 100 70 — — — —
10.02 Track structure: Major/movable bridge
— 100 70 — — — —
10.05 Track structure: Cut and fill (>4’ height/depth)
— 100 70 — — — —
10.06 Track structure: At-grade (grading and subgrade stabilization)
— 100 70 — — — —
10.07 Track structure: Tunnel — 100 70 — — — —
10.08 Track structure: Retaining walls and systems
— 100 70 — — — —
10.09 Track new construction: Conventional ballasted
track mile >50 at full life see below see below see below see below
A Ditching and drainage track mile — — — — — —
B Ballast track mile 50 Year 16 and Year 33
$80,000 First cycle between years 16-21, second cycle between
33-38
10 $400,000
C Ties track mile 50 — — — 10 $260,000
D Rail track mile 50 — — — 10 $500,000
10.10 Track new construction: Non-ballasted
track mile >50 at full life see below see below see below see below
A Ditching and drainage track mile — — — — — —
B Track fasteners track mile 40 — — — 30 $500,000
C Rail track mile 50 — — — 10 $500,000

California High-Speed Rail System Technical Supporting Document
Table 3. Track and Track Structure Inputs (continued)
16
FRA Standard Cost Categories for Capital Projects/Programs
Unit (measure)
Lifecycle (years)
Rehab Timing (years)
Rehab Cost (per unit)
Rehab Spread (years)
Replacement Spread (years)
Replacement Cost (per unit)
10.14 Track: Special track work (switches, turnouts, insulated joints)—Crossovers, each
see below see below see below see below see below see below see below
A Turnouts each 50 25 30% of initial capital cost
10 20 100 % of initial capital cost
B Crossovers each 100 50 30% of initial capital cost
10 — 100 % of initial capital cost
C Switch heaters each Included in 10.14 A and B
— Included in 10.14 A and B
— Included in 10.14 A and B
Included in 10.14 A and B
California High-Speed Rail System Technical Supporting Document
17
6.2 Unit Quantities
The following unit conversion assignments were applied:
10.09.110-10.09.162
– The unit conversion factors were set based on the number of tracks per route segment; for
example, 10.09.120 Ballasted Track—2 track represents a route segment with 2 tracks and
the unit conversion factor to convert route miles to track miles is set to 2
– The unit quantities in route miles were converted to track miles by multiplying the unit
conversion factor with the unit quantity
10.10.110-10.10.240
– The unit conversion factors were set based on number of tracks per route segment; for
example, 10.10.120 Slab track tunnel/viaduct—2 track represents a route segment with 2
tracks and the unit conversion factor to convert route miles to track miles is set to 2
– The unit quantities in route miles were converted to track miles by multiplying the unit
conversion factor with the unit quantity
The following unit quantity calculations were applied:
10.09 A Ditching and drainage—10.09 D Rail
– Since ditching and drainage, ballast, tie, and rail replacement applies to each track mile of
ballasted track, the unit quantity is equal to the sum of the following quantities under
10.09: 10.09.110, 10.09.112, 10.09.120, 10.09.122, 10.09.132, 10.09.142, 10.09.152,
10.09.162
10.10 A Ditching and drainage—10.09 C Rail
– Since ditching and drainage, track fasteners, and rail replacement applies to each track mile
of non-ballasted track, the unit quantity is equal to the sum of all quantities under 10.10
10.14 A Turnouts
– The unit quantities for the number of turnouts were calculated by adding up the applicable
FRA third-level categories for turnouts under 10.14; these FRA third-level categories are
10.14.100, 10.14.105, 10.14.110, 10.14.115, 10.14.199, 10.14.200, 10.12.205, 10.12.210,
and 10.14.215, NC 004, NC015, NC024
10.14 B Crossovers
– The unit quantities for the number of turnouts were calculated by adding up the applicable
FRA third-level categories for crossovers under 10.14; these FRA third-level categories are
10.14.130, 10.14.135,10.14.140, 10.14.145, 10.14.146, 10.14.300, 10.14.305, 10.14.310,
and 10.14.315, NC009, NC010
10.14 C Switch heaters
– The FRA third-level categories under 10.14 do not include switch heaters; however, the
rehabilitation and replacement costs for switch heaters have been included in 10.14 A and
10.14 B
California High-Speed Rail System Technical Supporting Document
18
7 Stations, Terminals, Intermodal
Category 20 Stations, Terminals, Intermodal includes the following asset classes:
20.01 Station buildings: Intercity passenger rail only
– 20.01 A Station structure
– 20.01 B Station architecture (finishes, glazing, roofing, etc.)
– 20.01 C Station mechanical ductwork and piping (plumbing, fire protection)
– 20.01 D Station mechanical HVAC
– 20.01 E Station electrical, lighting
– 20.01 F Station site elements
– 20.01 G Escalators—Trusses
– 20.01 H Escalators—Moving Parts
– 20.01 I Escalators—Elevators
20.02 Station buildings: Joint use (commuter rail, intercity bus)
– 20.02 A Station structure
– 20.02 B Station architecture (finishes, glazing, roofing, etc.)
– 20.02 C Station mechanical ductwork and piping (plumbing, fire protection)
– 20.02 D Station mechanical HVAC
– 20.02 E Station electrical, lighting
– 20.02 F Station site elements
– 20.02 G Escalators—Trusses
– 20.02 H Escalators—Moving Parts
– 20.02 I Escalators—Elevators
20.06 Pedestrian / bike access and accommodation, landscaping parking lots
20.07 Automobile, bus, van accessways including roads
7.1 Assumptions and Model Inputs
The following assumptions were made to 20 Stations, Terminals, Intermodal:
20.01 Station buildings: Intercity passenger rail only
The following sub-classes were defined to enable a rational lifecycle analysis of pertaining
costs:
– A Station structure (27 percent of initial capital cost of 20.01)
– B Station architecture (finishes, glazing, roofing, etc.; 22 percent of initial capital cost of
20.01)
– C-D Station mechanical, plumbing, fire protection (9 percent of initial capital cost of 20.01)
– E Station electrical, lighting (9 percent of initial capital cost of 20.01)
– F Station site elements (30 percent of initial capital cost of 20.01)
– G-I Escalators (3 percent of initial capital cost of 20.01)
Station modernization programs for 20.01 Station buildings: Intercity passenger rail only
should be a continuous rotation after 20 years of operations
California High-Speed Rail System Technical Supporting Document
19
Lifecycle estimates are based on TM 1.1.2, references from BART, Caltrain, Metrolink, the
French HSR system, CTRL (UK), and additional sources listed below
20.01 A Station structure
The lifecycle of the structure is 100 years; the station structure will only be replaced and not
rehabilitated
Replacement will be spread over 30 years, during years 100-129 (0.9 percent each year)
Replacement of station structure is estimated to cost 27 percent of the initial capital cost of
20.01
Lifecycle estimates are based on TM 1.1.2
20.01 B Station architecture (finishes, glazing, roofing, etc.)
Rehabilitation of station architecture will occur every 20 years
Rehabilitation will cost 6.6 percent of the initial capital cost (30 percent of replacement, which
is 22 percent of the initial capital cost of 20.01), spread over 10 years, during years 20-29 (0.66
percent each year)
Rehabilitation will include finish materials, minor reconfiguration of spaces, glazing, etc.
Replacement will occur every 40 years
Replacement of station architecture is estimated to cost 22 percent of the initial capital cost of
20.01, spread over 10 years, during years 40-49 (2.2 percent each year)
Lifecycle estimates are based on BART
20.01 C Station mechanical ductwork and piping (plumbing, fire protection)
Rehabilitation of mechanical ductwork and piping will include equipment and fixtures
No rehabilitation is anticipated during the 50-year timeframe
The initial capital cost of station mechanical work (including ductwork and piping and HVAC) is
estimated to be 9 percent of the initial capital cost of 20.01
Replacement of ductwork and piping will occur every 40 years
Replacement of ductwork and piping is estimated to cost 20 percent of the station mechanical
cost, which is 9 percent of the initial capital cost of 20.01, spread over 10 years, during years
40-49 (0.18 percent each year)
Lifecycle estimates are based on relevant experience with applicable transit stations
California High-Speed Rail System Technical Supporting Document
20
20.01 D Station mechanical HVAC (plumbing, fire protection)
Rehabilitation of HVAC will occur every 20 years
Rehabilitation will cost 7.2 percent of the initial capital cost (which is 80 percent of the station
mechanical cost, which is 9 percent of the initial capital cost of 20.01), spread over 10 years
during years 20-29 (0.72 percent each year)
The initial capital cost of station mechanical work (including ductwork and piping and HVAC) is
estimated to be 9 percent of the initial capital cost of 20.01
Lifecycle estimates are based on relevant experience with applicable transit stations
20.01 E Station electrical, lighting
Rehabilitation will occur every 15 years
Rehabilitation will cost 50 percent of the replacement cost, which is 9 percent of the initial
capital cost of 20.01, spread over 10 years during years 15-24 (0.45 percent each year)
Rehabilitation will including lighting, connection boxes, etc. but not wiring or transformers,
etc.
Replacement will occur every 30 years
Replacement of station lighting is estimated to cost 9 percent of the initial capital cost of
20.01, spread over 10 years, during years 30-39 (0.9 percent each year)
Lifecycle estimates are based on BART experience with relevant station examples
20.01 F Station site elements
Rehabilitation will occur every 15 years
Rehabilitation will cost 30 percent of the replacement cost, which is 30 percent of the initial
capital cost of 20.01, spread over 10 years during years 20-29 (0.09 percent each year)
Replacement will occur every 50 years
Replacement of station site elements is estimated to cost 30 percent of the initial capital cost
of 20.01, spread over 15 years during years 50-64 (2 percent each year)
Lifecycle estimates are based on BART
20.01 G Escalators—Trusses
Trusses will not be rehabilitated during the 50-year timeframe
Replacement will occur every 50 years
Trusses account for 30 percent of the cost of escalators, which is 70 percent of the total cost of
elevators and escalators, which is 3 percent of the initial capital cost of 20.01
California High-Speed Rail System Technical Supporting Document
21
The cost to replace trusses will be spread over 10 years during years 40-49 (0.147 percent each
year)
Lifecycle estimates are based on Kone Elevator Co. and Schindler Elevator Co.
20.01 H Escalators—Moving parts
20.04 Elevators/escalators was redefined as 20.01 H Escalators—Moving parts and 20.01 I
Elevators to enable a rational lifecycle analysis of pertaining costs
Rehabilitation occurs every 20 years
Rehabilitation will cost 50 percent of the replacement cost (which is 70 percent of the cost of
escalators, which is 70 percent of the total cost of elevators and escalators, which is 3 percent
of the initial capital cost of 20.01), spread over 10 years during years 20-29 (0.0735 percent
each year)
Rehabilitation includes all moving equipment including treads, rails, finishes, controls, excludes
structural components such as shaftways, trusses, etc.
Replacement will occur every 40 years
Moving parts account for 70 percent of the cost of escalators, which is 70 percent of the total
cost of elevators and escalators, which is 3 percent of the initial capital cost of 20.01
The cost to replace moving parts will be spread over 10 years during years 40-49 (0.147
percent each year)
Lifecycle estimates are based on Kone Elevator Co. and Schindler Elevator Co.
20.01 I Elevators
20.04 Elevators/escalators was redefined as 20.01 H Escalators—Moving parts and 20.01 I
Elevators to enable a rational lifecycle analysis of pertaining costs
Rehabilitation occurs every 20 years
Rehabilitation will cost 50 percent of the replacement cost (which is 30 percent of the total
cost of elevators and escalators, which is 3 percent of the initial capital cost of 20.01), spread
over 10 years during years 20-29 (0.045 percent each year)
Rehabilitation includes all moving equipment including treads, rails, finishes, controls, excludes
structural components such as shaftways, trusses, etc.
Replacement will occur every 40 years
Elevators account for 30 percent of the total cost of elevators and escalators, which is 3
percent of the initial capital cost of 20.01
The cost to replace elevators will be spread over 10 years during years 40-49 (0.09 percent
each year)
Lifecycle estimates are based on Kone Elevator Co. and Schindler Elevator Co.
California High-Speed Rail System Technical Supporting Document
22
20.02 Station buildings: Joint Use (Commuter rail, intercity bus)
The following sub-classes were defined to enable a rational lifecycle analysis of pertaining
costs:
– A Station structure (27 percent of initial capital cost of 20.02)
– B Station architecture (finishes, glazing, roofing, etc.; 22 percent of initial capital cost of
20.02)
– C-D Station mechanical, plumbing, fire protection (9 percent of initial capital cost of 20.02)
– E Station electrical, lighting (9 percent of initial capital cost of 20.02)
– F Station site elements (30 percent of initial capital cost of 20.02)
– G-I Escalators (3 percent of initial capital cost of 20.02)
Station modernization programs for 20.02 Station buildings: Joint Use (Commuter rail, intercity
bus) should be a continuous rotation after 20 years of operations
Lifecycle estimates are based on TM 1.1.2, references from BART, Caltrain, Metrolink, the
French HSR system, CTRL (UK), and additional sources listed below
20.02 A Station structure
The lifecycle of the structure is 100 years; the station structure will only be replaced and not
rehabilitated
Replacement will be spread over 30 years, during years 100-129 (0.9 percent each year)
Replacement of station structure is estimated to cost 27 percent of the initial capital cost of
20.02
Lifecycle estimates are based on TM 1.1.2
20.02 B Station architecture (finishes, glazing, roofing, etc.)
Rehabilitation of station architecture will occur every 20 years
Rehabilitation will cost 6.6 percent of the initial capital cost (30 percent of replacement, which
is 22 percent of the initial capital cost of 20.02), spread over 10 years, during years 20-29 (0.66
percent each year)
Rehabilitation will include finish materials, minor reconfiguration of spaces, glazing, etc.
Replacement will occur every 40 years
Replacement of station architecture is estimated to cost 22 percent of the initial capital cost of
20.02, spread over 10 years , during years 40-49 (2.2 percent each year)
Lifecycle estimates are based on BART
20.02 C Station mechanical ductwork and piping (plumbing, fire protection)
Rehabilitation of mechanical ductwork and piping will include equipment and fixtures
No rehabilitation is anticipated during the 50-year timeframe

California High-Speed Rail System Technical Supporting Document
23
The initial capital cost of station mechanical work (including ductwork and piping and HVAC) is
estimated to be 9 percent of the initial capital cost of 20.02
Replacement of ductwork and piping will occur every 40 years
Replacement of ductwork and piping is estimated to cost 20 percent of the station mechanical
cost, which is 9 percent of the initial capital cost of 20.02, spread over 10 years, during years
40-49 (0.18 percent each year)
Lifecycle estimates are based on relevant experience with applicable transit stations
20.02 D Station mechanical HVAC (plumbing, fire protection)
Rehabilitation of HVAC will occur every 20 years
Rehabilitation will cost 7.2 percent of the initial capital cost (which is 80 percent of the station
mechanical cost, which is 9 percent of the initial capital cost of 20.02), spread over 10 years
during years 20-29 (0.72 percent each year)
The initial capital cost of station mechanical work (including ductwork and piping and HVAC) is
estimated to be 9 percent of the initial capital cost of 20.02
Lifecycle estimates are based on relevant experience with applicable transit stations
20.02 E Station electrical, lighting
Rehabilitation will occur every 15 years
Rehabilitation will cost 50 percent of the replacement cost, which is 9 percent of the initial
capital cost of 20.02, spread over 10 years during years 15-24 (0.45 percent each year)
Rehabilitation will including lighting, connection boxes, etc. but not wiring or transformers,
etc.
Replacement will occur every 30 years
Replacement of station lighting is estimated to cost 9 percent of the initial capital cost of
20.02, spread over 10 years, during years 30-39 (0.9 percent each year)
Lifecycle estimates are based on BART
20.02 F Station site elements
Rehabilitation will occur every 15 years
Rehabilitation will cost 30 percent of the replacement cost, which is 30 percent of the initial
capital cost of 20.02, spread over 10 years during years 20-29 (0.09 percent each year)
Replacement will occur every 50 years
Replacement of station site elements is estimated to cost 30 percent of the initial capital cost
of 20.02, spread over 15 years during years 50-64 (2 percent each year)
Lifecycle estimates are based on BART

California High-Speed Rail System Technical Supporting Document
24
20.02 G Escalators—Trusses
Trusses will not be rehabilitated during the 50-year timeframe
Replacement will occur every 50 years
Trusses account for 30 percent of the cost of escalators, which is 70 percent of the total cost of
elevators and escalators, which is 3 percent of the initial capital cost of 20.02
The cost to replace trusses will be spread over 10 years during years 40-49 (0.147 percent each
year)
Lifecycle estimates are based on Kone Elevator Co. and Schindler Elevator Co.
20.02 H Escalators—Moving parts
20.04 Elevators/escalators was redefined as 20.02 H Escalators—Moving parts and 20.02 I
Elevators to enable a rational lifecycle analysis of pertaining costs
Rehabilitation occurs every 20 years
Rehabilitation will cost 50 percent of the replacement cost (which is 70 percent of the cost of
escalators, which is 70 percent of the total cost of elevators and escalators, which is 3 percent
of the initial capital cost of 20.02), spread over 10 years during years 20-29 (0.0735 percent
each year)
Rehabilitation includes all moving equipment including treads, rails, finishes, controls, excludes
structural components such as shaftways, trusses, etc.
Replacement will occur every 40 years
Moving parts account for 70 percent of the cost of escalators, which is 70 percent of the total
cost of elevators and escalators, which is 3 percent of the initial capital cost of 20.02
The cost to replace moving parts will be spread over 10 years during years 40-49 (0.147
percent each year)
Lifecycle estimates are based on Kone Elevator Co. and Schindler Elevator Co.
20.02 I Elevators
20.04 Elevators/escalators was redefined as 20.02 H Escalators—Moving parts and 20.02 I
Elevators to enable a rational lifecycle analysis of pertaining costs
Rehabilitation occurs every 20 years
Rehabilitation will cost 50 percent of the replacement cost (which is 30 percent of the total
cost of elevators and escalators, which is 3 percent of the initial capital cost of 20.02), spread
over 10 years during years 20-29 (0.045 percent each year)
Rehabilitation includes all moving equipment including treads, rails, finishes, controls, excludes
structural components such as shaftways, trusses, etc.
Replacement will occur every 40 years
California High-Speed Rail System Technical Supporting Document
25
Elevators account for 30 percent of the total cost of elevators and escalators, which is 3
percent of the initial capital cost of 20.02
The cost to replace elevators will be spread over 10 years during years 40-49 (0.09 percent
each year)
Lifecycle estimates are based on Kone Elevator Co. and Schindler Elevator Co.
20.06 Pedestrian / bike access and accommodation, landscaping, parking lots
Assuming average use of the asset, rehabilitation will occur every 10 years, and will cost 50
percent of the initial capital cost, spread over 2 years
Replacement will occur every 50 years, over 2 years
Lifecycle estimates are based on CHSTP TM 1.1.2 and Caltrain and Caltrans
20.07 Automobile, bus, van accessways including roads
Assuming average use of the asset, rehabilitation will occur every 10 years, and will cost 50
percent of the initial capital cost, spread over 2 years
Replacement will occur every 50 years, over 2 years
Lifecycle estimates are based on CHSTP TM 1.1.2 and Caltrain and Caltrans
Model inputs are presented in Table 4.
California High-Speed Rail System Technical Supporting Document
26
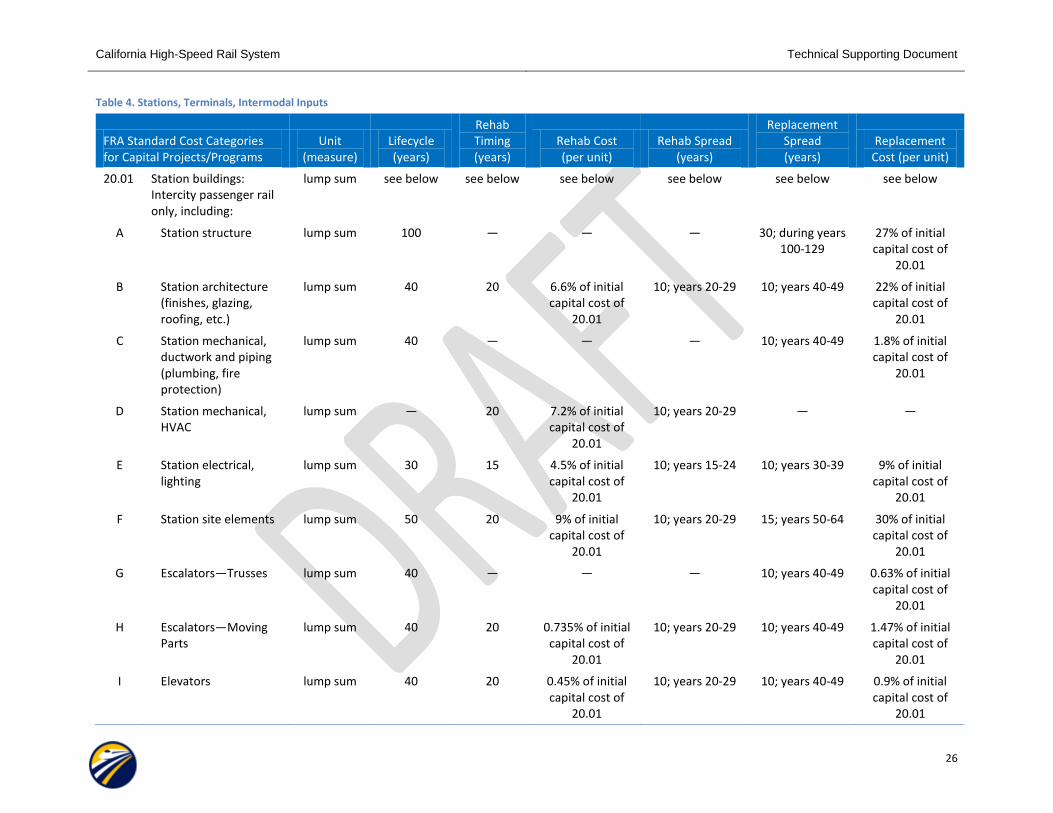
Table 4. Stations, Terminals, Intermodal Inputs
FRA Standard Cost Categories for Capital Projects/Programs
Unit (measure)
Lifecycle (years)
Rehab Timing (years)
Rehab Cost (per unit)
Rehab Spread (years)
Replacement Spread (years)
Replacement Cost (per unit)
20.01 Station buildings: Intercity passenger rail only, including:
lump sum see below see below see below see below see below see below
A Station structure lump sum 100 — — — 30; during years 100-129
27% of initial capital cost of
20.01
B Station architecture (finishes, glazing, roofing, etc.)
lump sum 40 20 6.6% of initial capital cost of
20.01
10; years 20-29 10; years 40-49 22% of initial capital cost of
20.01
C Station mechanical, ductwork and piping (plumbing, fire protection)
lump sum 40 — — — 10; years 40-49 1.8% of initial capital cost of
20.01
D Station mechanical, HVAC
lump sum — 20 7.2% of initial capital cost of
20.01
10; years 20-29 — —
E Station electrical, lighting
lump sum 30 15 4.5% of initial capital cost of
20.01
10; years 15-24 10; years 30-39 9% of initial capital cost of
20.01
F Station site elements lump sum 50 20 9% of initial capital cost of
20.01
10; years 20-29 15; years 50-64 30% of initial capital cost of
20.01
G Escalators—Trusses lump sum 40 — — — 10; years 40-49 0.63% of initial capital cost of
20.01
H Escalators—Moving Parts
lump sum 40 20 0.735% of initial capital cost of
20.01
10; years 20-29 10; years 40-49 1.47% of initial capital cost of
20.01
I Elevators lump sum 40 20 0.45% of initial capital cost of
20.01
10; years 20-29 10; years 40-49 0.9% of initial capital cost of
20.01
California High-Speed Rail System Technical Supporting Document
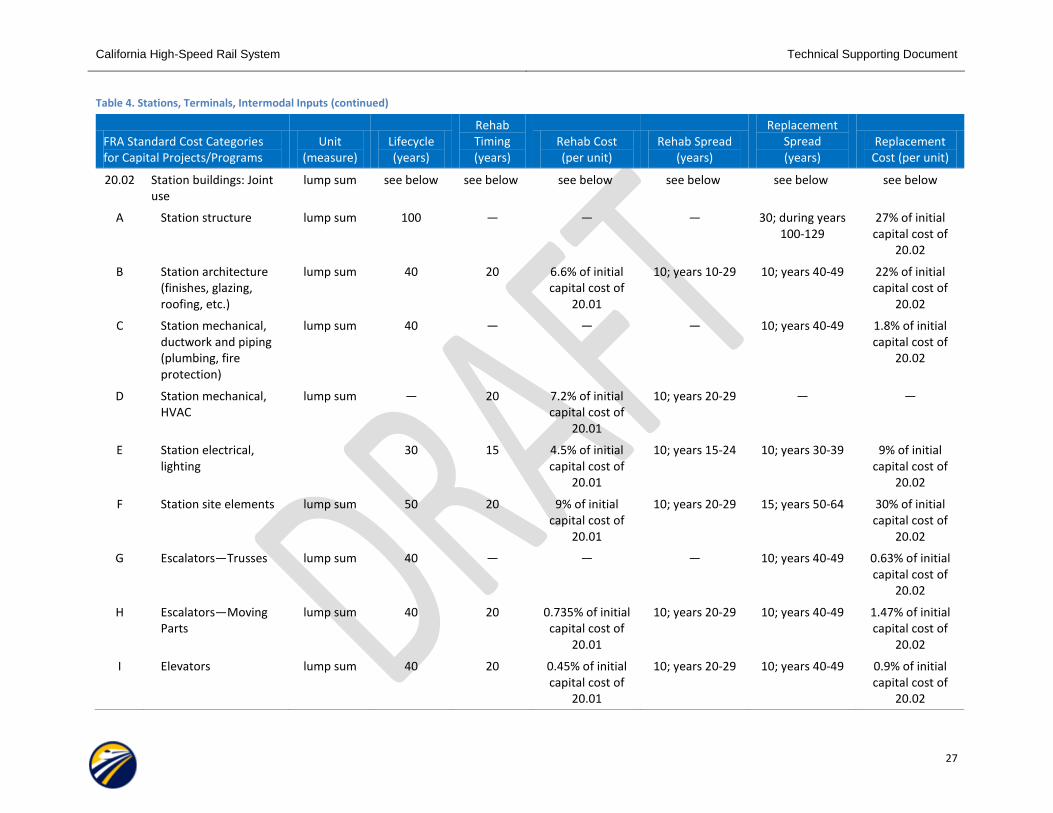
Table 4. Stations, Terminals, Intermodal Inputs (continued)
27
FRA Standard Cost Categories for Capital Projects/Programs
Unit (measure)
Lifecycle (years)
Rehab Timing (years)
Rehab Cost (per unit)
Rehab Spread (years)
Replacement Spread (years)
Replacement Cost (per unit)
20.02 Station buildings: Joint use
lump sum see below see below see below see below see below see below
A Station structure lump sum 100 — — — 30; during years 100-129
27% of initial capital cost of
20.02
B Station architecture (finishes, glazing, roofing, etc.)
lump sum 40 20 6.6% of initial capital cost of
20.01
10; years 10-29 10; years 40-49 22% of initial capital cost of
20.02
C Station mechanical, ductwork and piping (plumbing, fire protection)
lump sum 40 — — — 10; years 40-49 1.8% of initial capital cost of
20.02
D Station mechanical, HVAC
lump sum — 20 7.2% of initial capital cost of
20.01
10; years 20-29 — —
E Station electrical, lighting
30 15 4.5% of initial capital cost of
20.01
10; years 15-24 10; years 30-39 9% of initial capital cost of
20.02
F Station site elements lump sum 50 20 9% of initial capital cost of
20.01
10; years 20-29 15; years 50-64 30% of initial capital cost of
20.02
G Escalators—Trusses lump sum 40 — — — 10; years 40-49 0.63% of initial capital cost of
20.02
H Escalators—Moving Parts
lump sum 40 20 0.735% of initial capital cost of
20.01
10; years 20-29 10; years 40-49 1.47% of initial capital cost of
20.02
I Elevators lump sum 40 20 0.45% of initial capital cost of
20.01
10; years 20-29 10; years 40-49 0.9% of initial capital cost of
20.02
California High-Speed Rail System Technical Supporting Document
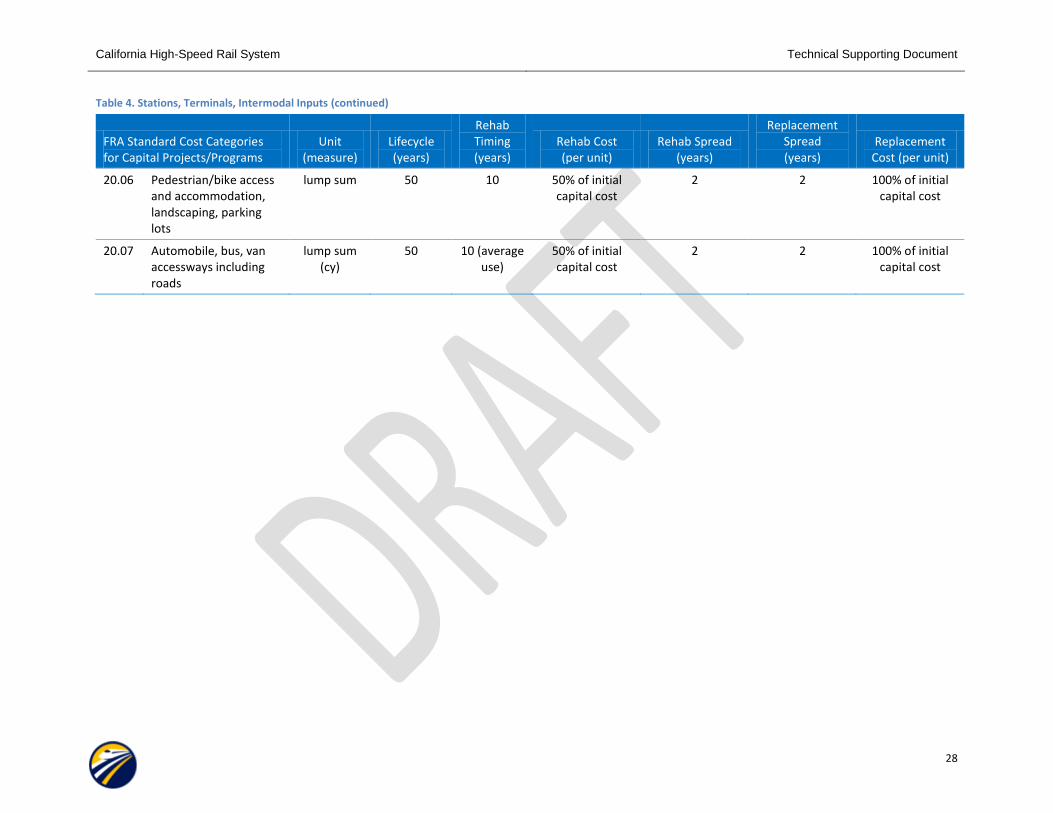
Table 4. Stations, Terminals, Intermodal Inputs (continued)
28
FRA Standard Cost Categories for Capital Projects/Programs
Unit (measure)
Lifecycle (years)
Rehab Timing (years)
Rehab Cost (per unit)
Rehab Spread (years)
Replacement Spread (years)
Replacement Cost (per unit)
20.06 Pedestrian/bike access and accommodation, landscaping, parking lots
lump sum 50 10 50% of initial capital cost
2 2 100% of initial capital cost
20.07 Automobile, bus, van accessways including roads
lump sum (cy)
50 10 (average use)
50% of initial capital cost
2 2 100% of initial capital cost
California High-Speed Rail System Technical Supporting Document
29
7.2 Unit Quantities
The following unit quantity calculations were applied:
20.01 A Station Structure -20.01 I Elevators
– Unit quantities were calculated by adding the quantities for all applicable FRA third-level
categories for 20.01, excluding FRA third-level categories for Site Elements
20.02 A Station Structure -20.02 I Elevators
– Unit quantities were calculated by adding the quantities for all applicable FRA third-level
categories for 20.02, excluding FRA third-level categories for Site Elements
California High-Speed Rail System Technical Supporting Document
30
8 Support Facilities, Yards, Shops, Administration Buildings
Category 30 Support Facilities, Yards, Shops, Administration Buildings includes the following asset
classes:
30.02 Light maintenance facility
– 30.02 A Roof
– 30.02 B Exterior
– 30.02 C Track
– 30.02 D Inspection pits/drainage
– 30.02 E OCS catenary
– 30.02 F Drop table
– 30.02 G Overhead cranes
– 30.02 H Toilet evac. system
– 30.02 I Auto wheel inspection system
– 30.02 J Auto trainset car wash
– 30.02 K Water recycling plant
– 30.02 L Pantograph repair platform
– 30.02 M Undercar vehicle inspection system
30.03 Heavy maintenance facility
– 30.03 A Roof
– 30.03 B Exterior
– 30.03 C Track
– 30.03 D Inspection pits/drainage
– 30.03 E OCS catenary
– 30.03 F Drop tables
– 30.03 G Wheel lathe
– 30.03 H Overhead cranes
– 30.03 I Toilet evac. system
– 30.03 J Auto wheel inspection system
– 30.03 K Auto trainset car wash
– 30.03 L Pantograph repair platform
– 30.03 M Water recycling plant
– 30.03 N Undercar vehicle inspection system
– 30.03 O Paint shop complete
– 30.03 P Trainset lifting system
– 30.03 Q Bogie turntable system
– 30.03 R Bogie wash system
– 30.03 S Shop cranes
– 30.03 T Wheel press

California High-Speed Rail System Technical Supporting Document
31
30.04 Storage or maintenance of way building/bases
– 30.04 A Roof
– 30.04 B Exterior
– 30.04 C Track
– 30.04 D Inspection pits/drainage
– 30.04 E Overhead cranes
30.05 Yard and yard track
– 30.05 A Track rehab, ballast, and surface
– 30.05 B Yard turnouts/crossovers
8.1 Assumptions and Model Inputs
The following assumptions were made for 30 Support Facilities, Yards, Shops, Administration Buildings:
Facilities in 30 Support Facilities, Yards, Shops, Administration Buildings are designed to remain
in service for more than 50 years but generally less than 100 years; this is contingent upon a
systematic plan for building maintenance
Inputs for the model are outlined in Table 5
30.02 Light maintenance facility—30.03 Heavy maintenance facility
New second level categories were defined to enable a rational lifecycle analysis of pertaining
costs; these new second level categories are demarcated with a letter (e.g., 30.02A Roof)
Rehabilitation costs may be higher than the original capital cost since many manufacturers
figure a 2 percent per year or higher costs on the remanufacture or replacement of new
equipment7
No replacement will occur during the 50-year timeframe for any of these new second level
categories
Lifecycle estimates are based on the following manufacturers:
– Drop tables—Whiting Corp. (USA), SAFOP Machinery (Italy), Hegenscheidt, Inc. (Germany)
– Wheel lathes—Simmons Machine Tool Corp. (USA), SAFOP Machinery (Italy)
– Overhead cranes—Spanco, Inc. (USA), North American Industries (USA), GEMAG, Inc.
(Germany)
– Auto wheel inspection system—Hegenscheidt, Inc. (Germany)
– Auto trainset carwash—Century Group (USA), Ross-White Inc. (USA)
– Trainset lifting system—Macton, Inc. (USA), Whiting Corp. (USA)
– Turntables—SAFOP Machinery (Italy), Macton, Inc. (USA)
– Toilet evacuation systems—EVAC North America (USA)
7 For example, the refurbishment of an in-ground axle wheel lathe may be less costly than procuring a new wheel lathe
(regardless of age) because to replace the entire lathe will require excavation, removal of the old and replacement with the new machinery. The labor costs will be greater versus a refurbishment involving the replacement of some major components, upgrading of electronics, etc.

California High-Speed Rail System Technical Supporting Document
32
– Wheel presses/machinery—SAFOP Machinery (Italy)
– Simmons Machine Tool Corp. (USA)
30.05 Yard and yard track
30.05 A Track rehab, ballast, and surface
– Yard track material will last 2-3 times that of main track (50 years), therefore requiring one
replacement after 50 years, or possibly no replacement at all
30.05 B Yard turnouts/crossovers
– Includes 30.05.200—Ballasted turnout no. 15 and 30.05.210—Ballasted diamond crossover
no. 15
– No rehabilitation is anticipated during 50-year timeframe
– Replacement will occur every 20 years, spread over 5 years
– Replacement will cost 100 percent of the initial capital cost per stop segment
Estimates are based on HSR experience in France, Germany, and Taiwan, and conventional
American railroad operations
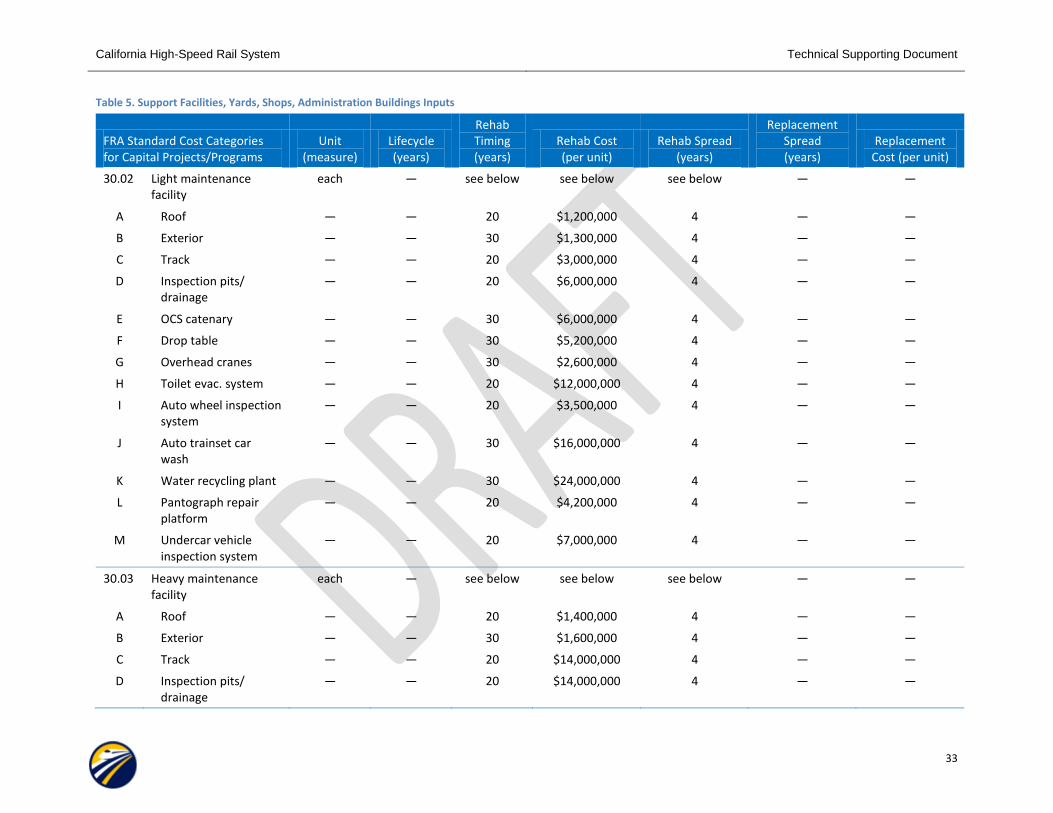
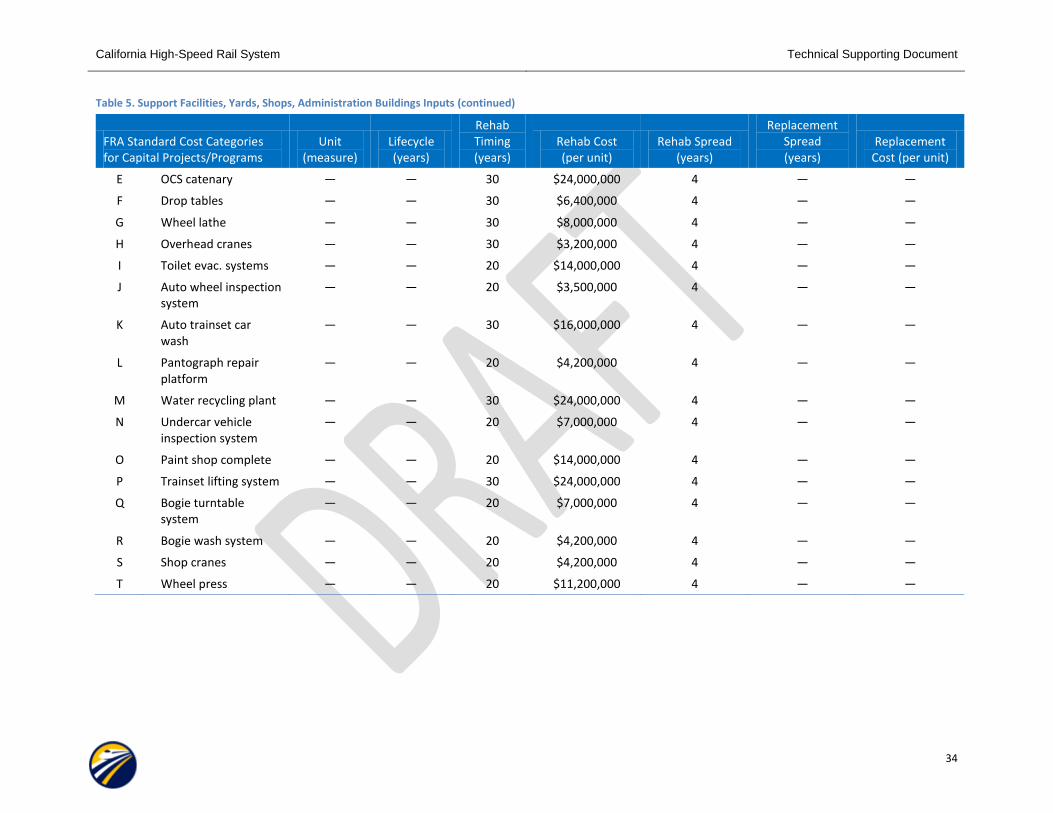
Model inputs are presented in Table 5.
California High-Speed Rail System Technical Supporting Document
33
Table 5. Support Facilities, Yards, Shops, Administration Buildings Inputs
FRA Standard Cost Categories for Capital Projects/Programs
Unit (measure)
Lifecycle (years)
Rehab Timing (years)
Rehab Cost (per unit)
Rehab Spread (years)
Replacement Spread (years)
Replacement Cost (per unit)
30.02 Light maintenance facility
each — see below see below see below — —
A Roof — — 20 $1,200,000 4 — —
B Exterior — — 30 $1,300,000 4 — —
C Track — — 20 $3,000,000 4 — —
D Inspection pits/drainage
— — 20 $6,000,000 4 — —
E OCS catenary — — 30 $6,000,000 4 — —
F Drop table — — 30 $5,200,000 4 — —
G Overhead cranes — — 30 $2,600,000 4 — —
H Toilet evac. system — — 20 $12,000,000 4 — —
I Auto wheel inspection system
— — 20 $3,500,000 4 — —
J Auto trainset car wash
— — 30 $16,000,000 4 — —
K Water recycling plant — — 30 $24,000,000 4 — —
L Pantograph repair platform
— — 20 $4,200,000 4 — —
M Undercar vehicle inspection system
— — 20 $7,000,000 4 — —
30.03 Heavy maintenance facility
each — see below see below see below — —
A Roof — — 20 $1,400,000 4 — —
B Exterior — — 30 $1,600,000 4 — —
C Track — — 20 $14,000,000 4 — —
D Inspection pits/drainage
— — 20 $14,000,000 4 — —
California High-Speed Rail System Technical Supporting Document
Table 5. Support Facilities, Yards, Shops, Administration Buildings Inputs (continued)
34
FRA Standard Cost Categories for Capital Projects/Programs
Unit (measure)
Lifecycle (years)
Rehab Timing (years)
Rehab Cost (per unit)
Rehab Spread (years)
Replacement Spread (years)
Replacement Cost (per unit)
E OCS catenary — — 30 $24,000,000 4 — —
F Drop tables — — 30 $6,400,000 4 — —
G Wheel lathe — — 30 $8,000,000 4 — —
H Overhead cranes — — 30 $3,200,000 4 — —
I Toilet evac. systems — — 20 $14,000,000 4 — —
J Auto wheel inspection system
— — 20 $3,500,000 4 — —
K Auto trainset car wash
— — 30 $16,000,000 4 — —
L Pantograph repair platform
— — 20 $4,200,000 4 — —
M Water recycling plant — — 30 $24,000,000 4 — —
N Undercar vehicle inspection system
— — 20 $7,000,000 4 — —
O Paint shop complete — — 20 $14,000,000 4 — —
P Trainset lifting system — — 30 $24,000,000 4 — —
Q Bogie turntable system
— — 20 $7,000,000 4 — —
R Bogie wash system — — 20 $4,200,000 4 — —
S Shop cranes — — 20 $4,200,000 4 — —
T Wheel press — — 20 $11,200,000 4 — —

California High-Speed Rail System Technical Supporting Document
Table 5. Support Facilities, Yards, Shops, Administration Buildings Inputs (continued)
35
FRA Standard Cost Categories for Capital Projects/Programs
Unit (measure)
Lifecycle (years)
Rehab Timing (years)
Rehab Cost (per unit)
Rehab Spread (years)
Replacement Spread (years)
Replacement Cost (per unit)
30.04 Storage or maintenance-or-way building/bases
each — see below see below see below — —
A Roof — — 20 $700,000 4 — —
B Exterior — — 30 $700,000 4 — —
C Track — — 20 $350,000 4 — —
D Inspection pits/drainage
— — 20 $2,800,000 4 — —
E Overhead cranes — — 30 $3,200,000 ea 4 — —
30.05 Yard track see below see below — — — see below —
A Track rehab, ballast, and surface
track mile > 50 years — — — — —
B Yard turnouts/crossovers
per turnout 20 — — — 5 100% of initial capital cost

California High-Speed Rail System Technical Supporting Document
36
8.2 Unit Quantities
The following unit quantity assumptions apply to 30.02 Light maintenance facility, 30.03 Heavy
maintenance facility, and 30.04 Maintenance of way facility:
Unit quantities for 30.02 A Roof—30.02 M Undercar vehicle inspection system were calculated
by adding the quantities for all FRA third level categories for 30.02 Light maintenance facility
Unit quantities for 30.03 A Roof—30.03 T Wheel press were calculated by adding the
quantities for all FRA third level categories for 30.03 Heavy maintenance facility
Unit quantities for 30.04 A Roof—30.04 E Overhead cranes were calculated by adding the
quantities for all FRA third level categories for 30.04 Maintenance of way facility
The following unit quantity calculations apply to 30.05 Yard track
The unit conversion factor for 30.05.210 Ballasted diamond crossover, no. 15 was set to two to
reflect the fact that a diamond crossover consists of two turnouts. This was done to capture
the costs under 30.05 B Yard turnouts/crossovers, the unit for which is turnouts.
The unit quantities for 30.05 A Track rehab, ballast, and surface were calculated by adding up
the quantities for the applicable FRA third level categories under 30.05. This FRA third level
category is 30.05.110 Ballasted track—Yard track
The unit quantities for 30.05 B Yard turnouts/crossovers were calculated by adding up the
quantities for the applicable FRA third level categories under 30.05 (30.05.200 Ballasted
turnout no. 15, 30.05.210 Ballasted diamond crossover, no. 15)
California High-Speed Rail System Technical Supporting Document
37
9 Sitework, Right of Way, Land, Existing Improvements
Category 40 Sitework, right of way, land, existing improvements includes the following asset class:
40.05 Site structures including retaining walls, sound walls
9.1 Assumptions and Model Inputs
The following assumptions were made to 40 Stations Sitework, Right of Way, Land, Existing
Improvements:
Cost categories 40.01–40.04 and 40.06–40.09 have been excluded since they are not
applicable to capital rehabilitation and replacement
There are no costs for category 40 Sitework, right of way, land, existing improvements; assets
in 40.05 Site structures including retaining walls, sound walls are designed for 100 years, as
referenced in Technical Memorandum 1.1.2, and no rehabilitation or replacement is
anticipated during 50-year timeframe; inspections and repairs are part of O&M costs
California High-Speed Rail System Technical Supporting Document
38
10 Communications and Signaling
Category 50 Communications and signaling asset category includes the following asset classes:
50.01 Wayside signaling equipment
50.05 Communication
– 50.05 A: Shelters, cabinets, towers, ductbanks, manholes, fiber optic, HVAC, radiax
– 50.05 B: Wide area networking, networked storage, etc.
– 50.05 C: Radio systems (operations radio system, broadband radio system)
– 50.05 D: Application systems: CCTV, FAS, EACS, IDS, PA/CIS, etc.
10.1 Assumptions and Model Inputs
The following assumptions were made to 50 Communications and signaling:
50.01 Wayside signaling equipment
Rehabilitation costs include an average of UPS battery replacement and COTS hardware
replacement for every 10 years; the cost of these items on average is approximately 20
percent of the total capital cost (15 percent for COTS hardware and 5 percent for switch
machines)
Rehabilitation will occur every 10 years and is spread over 3 years
Replacement will occur every 30 years, spread over 5 years
Replacement will cost 80 percent of initial capital cost
Contingencies, testing and commissioning, systems engineering, warranty, spectrum, etc. are
not included in replacement and rehabilitation cost percentages
Lifecycle estimates are based on Building Industry Consulting Service International
Telecommunications Distribution Methods Manual and IT standard practice
50.05 Communications
The following sub-classes were defined to enable a rational lifecycle analysis of pertaining
costs:
– 50.05 A: Shelters, cabinets, towers, ductbanks, manholes, fiber optic, HVAC, radiax (40
percent of initial capital cost of 50.05)
– 50.05 B: Wide area networking, networked storage, etc. (15 percent of initial capital cost of
50.05)
– 50.05 C: Radio systems (operations radio system, broadband radio system) (20 percent of
initial capital cost of 50.05)
– 50.05 D: Application systems: CCTV, FAS, EACS, IDS, PA/CIS, etc. (15 percent of initial capital
cost of 50.05)
10 percent of the initial capital cost has been withheld to account for items that would never
be replaced
California High-Speed Rail System Technical Supporting Document
39
50.05 A: Shelters, cabinets, towers, ductbanks, manholes, fiber optic, HVAC, radiax
Rehabilitation occurs every 10 years and is spread over 10 years
– The first cycle occurs during years 10-19, the second cycle occurs during years 20-29
Rehabilitation costs 2 percent of the replacement cycle
– Rehabilitation will cost 0.08 percent each year rehabilitation takes place for both cycles
Replacement occurs every 25 years, spread over 15 years
– Replacement will occur during years 25-39
Replacement will cost 40 percent of the initial capital cost for each cycle
– Replacement will cost 2.67 percent each year replacement takes places for the one cycle
that occurs during the 50-year timeframe
50.05 B: Wide area networking, networked storage, etc.
This asset category will not be rehabilitated, only replaced
Replacement will occur every 10 years, spread over 2 years
– There will be 5 replacement cycles during the 50-year timeframe: during years 10-11, 20-
21, 30-31, 40-41, 50-51
Replacement will cost 15 percent of the initial capital cost for each cycle
– Replacement will cost 7.5 percent each year replacement takes place for the one cycle that
occurs during the 50-year timeframe
50.05 C: Radio systems (operations radio system, broadband radio system)
Rehabilitation will occur every 10 years and is spread over 10 years during the first cycle and 5
years during the second cycle
– The first cycle occurs during years 10-19, the second cycle occurs during years 20-24
Rehabilitation costs 2 percent of the replacement cycle
– Rehabilitation will cost 0.04 percent each year rehabilitation takes place for the first cycle
and 0.08 percent each year for the second cycle
Replacement occurs every 25 years, spread over 2 years
– Replacement will occur during years 25-26
Replacement will cost 20 percent of the initial capital cost for each cycle
– Replacement will cost 10 percent each year replacement takes place for the one cycle that
occurs during the 50-year timeframe
50.05 D: Application systems: CCTV, FAS, EACS, IDS, PA/CIS, etc.
Rehabilitation will occur every 10 years, spread over 10 years for the first cycle and 5 years
during the second cycle
– The first cycle occurs during years 10-19, the second cycle occurs during years 20-24
California High-Speed Rail System Technical Supporting Document
40
Rehabilitation costs 10 percent of the replacement cost for each cycle
– Rehabilitation will cost 0.15 percent each year rehabilitation takes place for the first cycle
and 0.3 percent for the second cycle
Replacement occurs every 25 years, spread over 10 years
– Replacement will occur during years 25-34
Replacement costs 15 percent of initial capital cost for each cycle
– Replacement will cost 1.5 percent each year replacement takes places for the one cycle
that occurs during the 50-year timeframe
Model inputs are presented in Table 6.

California High-Speed Rail System Technical Supporting Document
41
Table 6. Communications and Signaling Inputs
FRA Standard Cost Categories for Capital Projects/Programs
Unit (measure)
Lifecycle (years)
Rehab Timing (years)
Rehab Cost (per unit)
Rehab Spread (years)
Replacement Spread (years)
Replacement Cost (per unit)
50.01 Wayside signaling equipment
lump sum 30 10 20% 3 5 80% of initial capital cost
50.05 Communications lump sum see below see below see below see below see below see below
A Shelters, cabinets, towers, ductbanks, manholes, fiber optic, HVAC, radiax
lump sum 25 10 2% of replacement cost for each cycle (0.08% each year rehab takes place,
for both cycles)
First cycle is spread during years 10-19,
second cycle is spread during 20-
29
Replacement cycle is spread
during years 25-39
40%
(2.67% each year for one cycle)
B Wide Area Networking, Networked Storage, etc.
lump sum 10 — — — 5 cycles during 50-year
timeframe: during years 10-11, 20-
21, 30-31, 40-411 50-51
15%
(7.5% each year for one cycle)
C Radio Systems (Operations Radio System, Broadband Radio System)
lump sum 25 10 2% of replacement cost for each cycle (0.04% each year rehab takes place
for first cycle; 0.08% each year for second cycle)
First cycle occurs during years 10-19,
second cycle occurs during years 20-24
Replacement cycle is spread during years 25
and 26
20%
(10% each year for one cycle)
D Application Systems: CCTV. FAS, EACS, IDS, PA/CIS, etc.
lump sum 25 10 10% of replacement cost for each cycle (0.15% each year rehab takes place
for first cycle; 0.3% each year for second cycle)
First cycle occurs during years 10-19,
second cycle occurs during years 20-24
Replacement cycle is during
years 25 and 34
15%
(1.5% each year for one cycle)

California High-Speed Rail System Technical Supporting Document
42
11 Electric Traction
Category 60 Electric traction includes the following asset classes:
60.02 Traction power supply: Substations
60.03 Traction power distribution: Catenary and third rail
11.1 Assumptions and Model Inputs
The following assumptions were made to 60 Electric Traction:
60.02 Traction power supply: Substations
This asset category includes switching stations and paralleling stations, and wayside power
control cubicles
This asset category excludes the cost of land for traction power facilities, captive traction
substation at rolling stock maintenance facilities, grading and paving, layer of gravel,
prefabricated structures, buildings, gantries, and testing and commissioning
Rehabilitation cost encompasses replacement of low maintenance storage batteries and
assemblies with moving components such as switchgear, circuit breakers, and disconnect
switches that have a design life of less than 40 years
Rehabilitation costs assumes that the Authority will not have any obligation for replacement
cost for HV utility assets created especially for the California high-speed rail system
Rehabilitation will cost 6.5 percent of the initial capital cost (15 percent of the 43 percent of
the initial capital cost to replace asset)
For the first rehabilitation cycle, rehabilitation will occur during years 16-25 of the asset’s
lifecycle (0.65 percent each year)
– For all subsequent rehabilitation cycles, rehab will be spread over 15 years (0.43 percent
each year)
Rehabilitation timing for 60.02 Traction power supply: Substations is based on experience from
international HSR systems and domestic conventional rail systems
Lifecycle estimates are based on experience of international HSR systems and TM 1.1.2 of
CHSTP
– Replacement will occur during years 31-50 of the asset’s lifecycle, spread evenly
throughout the 20 years (2.15 percent each year)
– For all subsequent replacement cycles, replacement will be spread over 30 years (1.43
percent each year)
60.03 Traction power distribution: Catenary and third rail
Rehabilitation will consist of replacing contact wire when the wear reaches 25 percent of the
wire cross section (approximately 30 years)

California High-Speed Rail System Technical Supporting Document
43
Rehabilitation will cost $20 per foot or $105,600 per mile
Rehabilitation will occur every 30 years, spread over 20 years ($5,280 per mile per year)
Lifecycle estimates are based on TM 1.1.2 and Design Criteria Chapter 1 of the CHSTP book
“Contact Lines for Electric Railways,” discussion with other experts, experience of other
systems, and a literature survey
The design life of OCS wire and assemblies is 50 years; replacement will not occur during the
50-year timeframe; replacement will begin at year 51 of asset age and costs will be spread
uniformly over 20 years after that
Replacement will cost 61 percent of the initial capital cost for OCS assemblies
Lifecycle estimates are based on TM 1.1.2 and Design Criteria Chapter 1 of the CHSTP Book
“Contact Lines for Electric Railways,” discussion with other experts, experience of other
systems, and a literature survey
60.04 Traction power control is not included because it has been accounted for in 60.02
Traction power supply: Substations
Model inputs are presented in Table 7.

California High-Speed Rail System Technical Supporting Document
44
Table 7. Electric Traction Inputs
FRA Standard Cost Categories for Capital Projects/Programs
Unit (measure)
Lifecycle (years)
Rehab Timing (years)
Rehab Cost (per unit)
Rehab Spread (years)
Replacement Spread (years)
Replacement Cost (per unit)
60.02 Traction power supply: Substations
Route mile 40 20 6.5% of initial capital cost
First cycle, between 16-25;
subsequent cycles, 15 years
thereafter
First cycle, between 31-50;
subsequent cycles, 30 years
thereafter
43% of initial capital cost
60.03 Traction power distribution: Catenary and third rail
— 50 30 $20 per ft 20 years for contact wire
20 from 51st
year
61% of initial capital cost for OCS assemblies
California High-Speed Rail System Technical Supporting Document
45
11.2 Unit Quantities
The following unit quantity calculations are applicable to 60.03 Traction power distribution: Catenary
and third rail
The unit conversion factors for 60.03.100-60.03.400 were set based on number of track miles
per route segment. For example, 60.03.100—Traction power distribution represents a route
segment with 2 tracks, the unit conversion factor to convert route miles to track miles is set
to 2
The unit quantities for 60.03 Traction power distribution: Catenary and third rail were
converted from route miles to track miles by multiplying the unit conversion factor with the
unit quantity
California High-Speed Rail System Technical Supporting Document
46
12 Vehicles
Category 70 Vehicles includes the following asset classes:
70.02 Vehicle acquisition: Electric multiple unit
70.06 Vehicle acquisition: Maintenance of way vehicles
70.07 Vehicle acquisition: Non-railroad support vehicles
12.1 Assumptions and Model Inputs
The following assumptions were made for 70 Vehicles:
70.02 Vehicle acquisition: Electric multiple unit
Daily inspections, servicing and cleaning, bogey inspections, and general inspections are
considered as part of regular operations and maintenance costs and not accounted for in the
capital replacement costs (they are accounted for in the operations and maintenance costs)
Each trainset will cost $45 million
Replacement will occur every 30 years spread over 5 years
Lifecycle estimates are based on the 2012 Business Plan Capital Cost model
Model inputs are presented in Table 8.
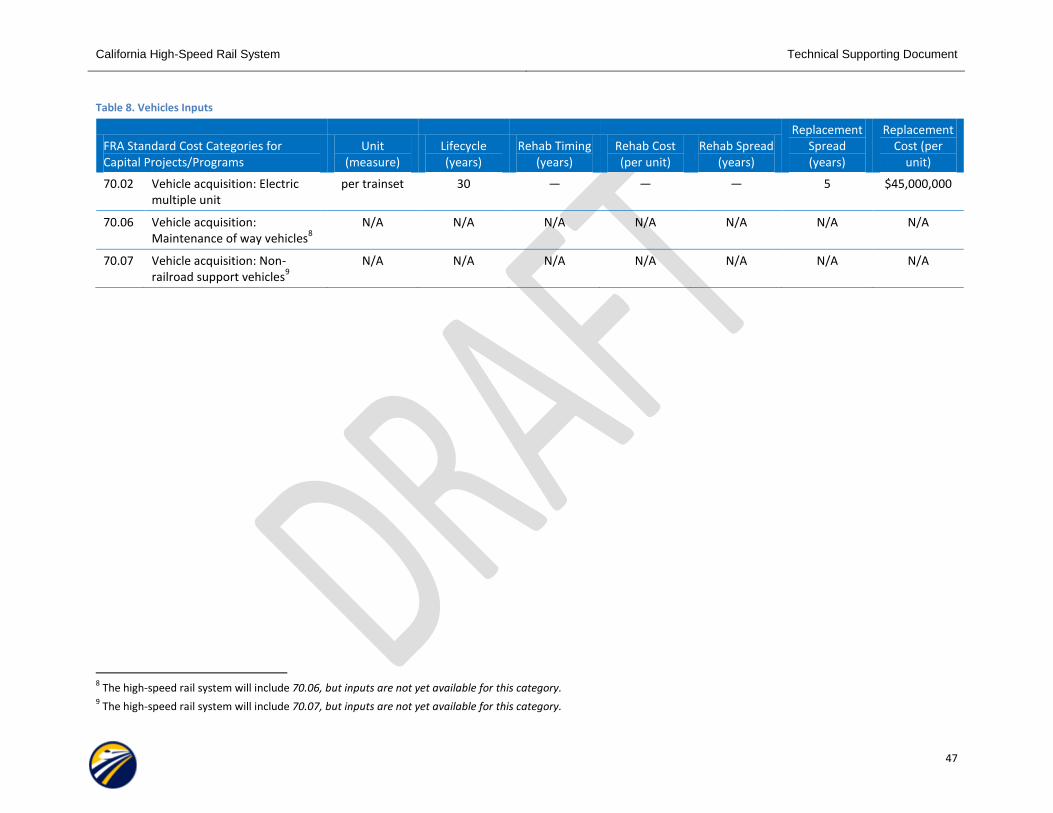
California High-Speed Rail System Technical Supporting Document
47
Table 8. Vehicles Inputs
FRA Standard Cost Categories for Capital Projects/Programs
Unit (measure)
Lifecycle (years)
Rehab Timing (years)
Rehab Cost (per unit)
Rehab Spread (years)
Replacement Spread (years)
Replacement Cost (per
unit)
70.02 Vehicle acquisition: Electric multiple unit
per trainset 30 — — — 5 $45,000,000
70.06 Vehicle acquisition: Maintenance of way vehicles
8
N/A N/A N/A N/A N/A N/A N/A
70.07 Vehicle acquisition: Non-railroad support vehicles
9
N/A N/A N/A N/A N/A N/A N/A
8 The high-speed rail system will include 70.06, but inputs are not yet available for this category.
9 The high-speed rail system will include 70.07, but inputs are not yet available for this category.
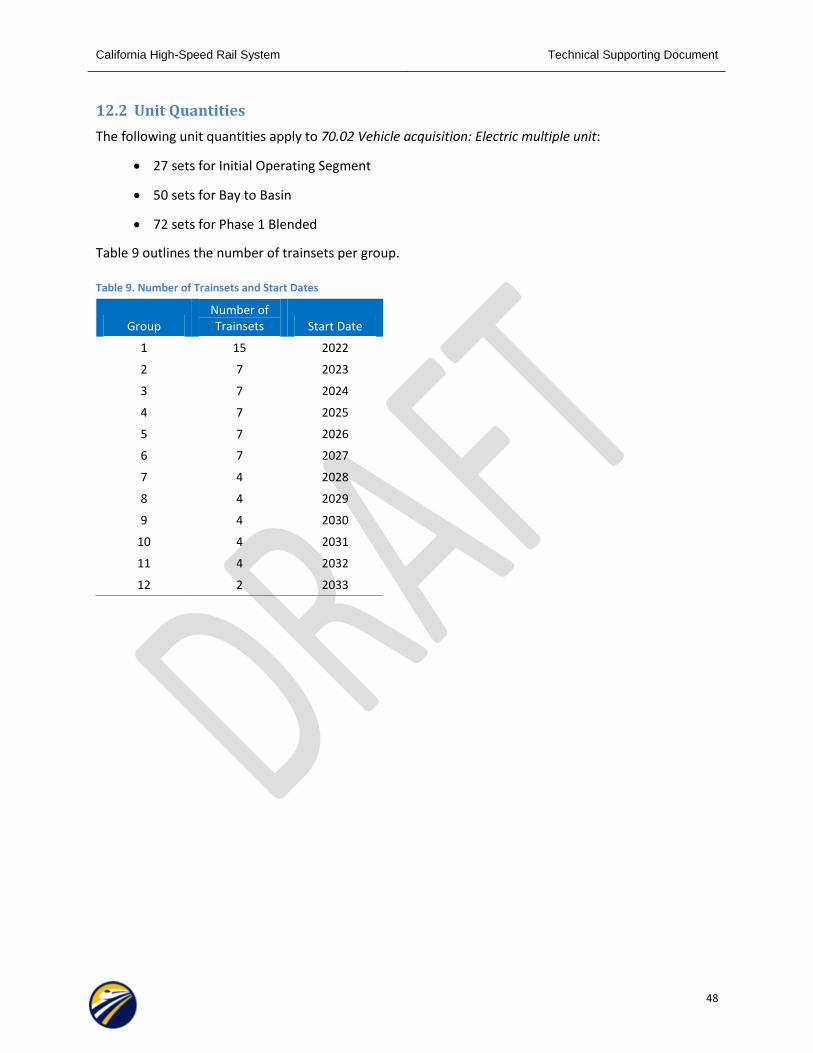
California High-Speed Rail System Technical Supporting Document
48
12.2 Unit Quantities
The following unit quantities apply to 70.02 Vehicle acquisition: Electric multiple unit:
27 sets for Initial Operating Segment
50 sets for Bay to Basin
72 sets for Phase 1 Blended
Table 9 outlines the number of trainsets per group.
Table 9. Number of Trainsets and Start Dates
Group Number of Trainsets Start Date
1 15 2022
2 7 2023
3 7 2024
4 7 2025
5 7 2026
6 7 2027
7 4 2028
8 4 2029
9 4 2030
10 4 2031
11 4 2032
12 2 2033

California High-Speed Rail System Technical Supporting Document
49
13 Professional Services
80 Professional services includes all professional, technical, and management services related to the
design and construction of infrastructure (categories 10-60) during the preliminary engineering, final
design, and construction phases of the project/program (as applicable). These services include
environmental work, design, engineering and architectural services; specialty services such as safety or
security analyses; value engineering, risk assessment, cost estimating, scheduling, ridership modeling
and analyses, auditing, legal services, administration and management, etc. by agency staff or outside
consultants.10
Table 10 shows the professional cost allowances as percentages of construction costs, adjusted from
category 80 in the capital cost model to reflect only those costs that would be relevant for capital
rehabilitation and replacement.
Table 10. Professional Services Cost Allowances for Categories 10, 20, 30, and 40
Category Assumptions
Percentage of Construction
Costs
Program Management PM costs will not include the environmental approval process or oversight of planning development.
1.0%
Final Design Level of design and planning will be less than for a new facility provided there is no upgrading of components in the rehabs/renewals.
4.0%11
Construction Management Field oversight of all replacement work is assumed (no self-certification).
5.0%
Agency Costs No agency permits or approvals would be required for rehabs/renewals.
0.0%
Total 10.0%12
Final design for categories 50 and 60 is assumed to be 20.0 percent, consisting of 15.0 percent for
system engineering and 5.0 percent for integration, testing, and commissioning. A higher amount of
integration and coordination is needed for high tech components of the CA HSR system. These are
consistent with inputs for the capital cost model.
10
As defined by the FRA Standard Cost Categories (SCC) for Capital Projects: http://www.fta.dot.gov/13070_2580.html. However, not all of these categories would apply to the rehabilitation or replacement of assets. 11
Only applicable to categories 10-40. Final design for categories 50-60 is 20.0 percent, 15.0 percent for system engineering and 5.0 percent for integration, testing, and commissioning. 12
The total professional services allocation for categories 50-60 is 26.0 percent.

California High-Speed Rail System Technical Supporting Document
50
14 Contingency
The model contains two sets of contingencies: unallocated contingency to account for unknown
unknowns that may arise in the rehabilitation and replacement of system assets and allocated
contingency to account for known risks, uncertainties, and unknowns associated with individual cost
categories.
14.1 Unallocated Contingency
Unallocated contingency was set at 5 percent of costs before contingency. This is the same as the
unallocated contingency applied in the capital cost estimates and the operations and maintenance cost
estimates and is designed to account for unknown unknowns that cannot be anticipated.
14.2 Allocated Contingency
Allocated contingency percentages ranging from 15 percent to 25 percent were applied to account for
unknowns, risk, and uncertainties that are specific to each asset category. The range for allocated
contingencies mirror the same percentages applied the initial capital cost of each asset category in the
capital cost model. The allocated contingency percentages are presented in Table 11.
Table 11. Allocated contingency percentages by cost category
FRA Standard Cost Categories for Capital Projects/Programs Allocated
Contingency %
10 Track Structures and Track
10.09 Track new construction: Conventional ballasted 15.0
10.10 Track new construction: Non-ballasted 15.0
10.14 Track: Special track work (switches, turnouts, insulated joints)—Crossovers, each 15.0
20 Stations, Terminals, Intermodal
20.01 Station buildings: Intercity passenger rail only, including: 25.0
20.02 Station buildings: Joint use (commuter rail, intercity bus) 25.0
20.06 Pedestrian/bike access and accommodation, landscaping, parking lots 25.0
20.07 Automobile, bus, van accessways including roads 25.0
30 Support Facilities, Yards, Shops, Admin Bldgs
30.02 Light maintenance facility 25.0
30.03 Heavy maintenance facility 25.0
30.04 Storage or maintenance-or-way building/bases 25.0
30.05 Yard track 25.0
50 Communications and Signaling
50.01 Wayside signaling equipment 15.0
50.05 Communications 15.0
60 Electric Traction
60.02 Traction power supply: Substations 15.0
60.03 Traction power distribution: Catenary and third rail 15.0
70 Vehicles
70.02 Vehicle acquisition: Electric multiple unit 0.0
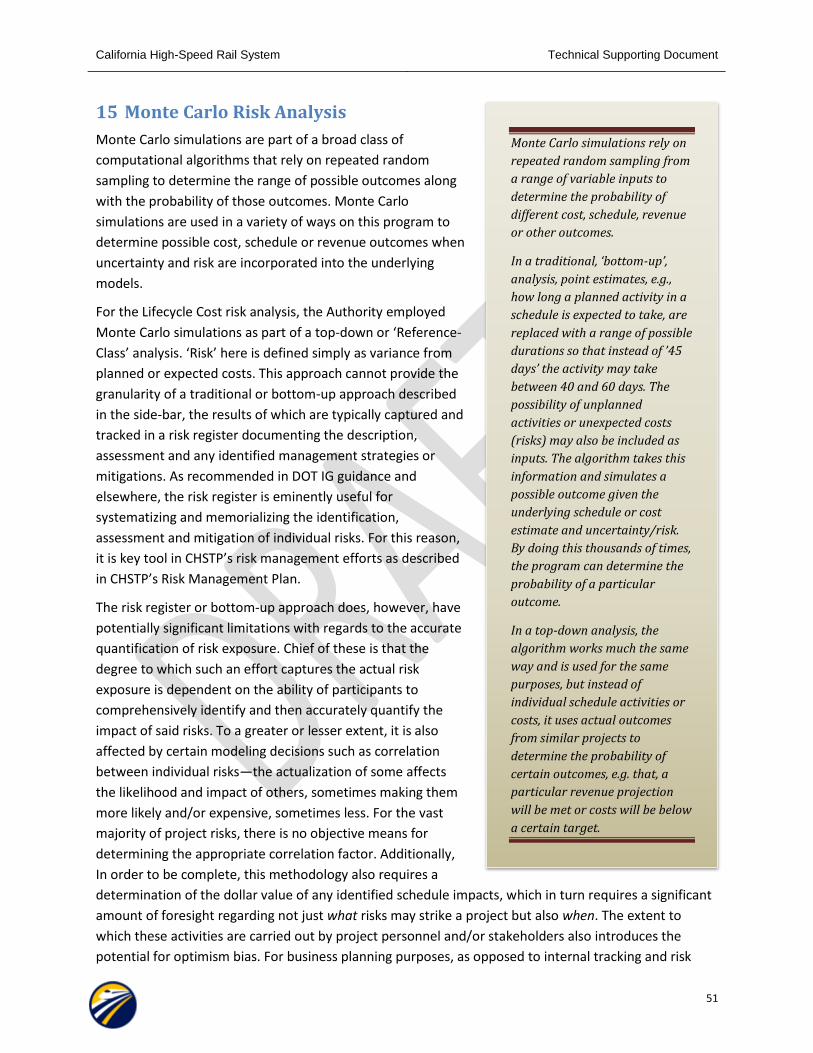
California High-Speed Rail System Technical Supporting Document
51
15 Monte Carlo Risk Analysis
Monte Carlo simulations are part of a broad class of
computational algorithms that rely on repeated random
sampling to determine the range of possible outcomes along
with the probability of those outcomes. Monte Carlo
simulations are used in a variety of ways on this program to
determine possible cost, schedule or revenue outcomes when
uncertainty and risk are incorporated into the underlying
models.
For the Lifecycle Cost risk analysis, the Authority employed
Monte Carlo simulations as part of a top-down or ‘Reference-
Class’ analysis. ‘Risk’ here is defined simply as variance from
planned or expected costs. This approach cannot provide the
granularity of a traditional or bottom-up approach described
in the side-bar, the results of which are typically captured and
tracked in a risk register documenting the description,
assessment and any identified management strategies or
mitigations. As recommended in DOT IG guidance and
elsewhere, the risk register is eminently useful for
systematizing and memorializing the identification,
assessment and mitigation of individual risks. For this reason,
it is key tool in CHSTP’s risk management efforts as described
in CHSTP’s Risk Management Plan.
The risk register or bottom-up approach does, however, have
potentially significant limitations with regards to the accurate
quantification of risk exposure. Chief of these is that the
degree to which such an effort captures the actual risk
exposure is dependent on the ability of participants to
comprehensively identify and then accurately quantify the
impact of said risks. To a greater or lesser extent, it is also
affected by certain modeling decisions such as correlation
between individual risks—the actualization of some affects
the likelihood and impact of others, sometimes making them
more likely and/or expensive, sometimes less. For the vast
majority of project risks, there is no objective means for
determining the appropriate correlation factor. Additionally,
In order to be complete, this methodology also requires a
determination of the dollar value of any identified schedule impacts, which in turn requires a significant
amount of foresight regarding not just what risks may strike a project but also when. The extent to
which these activities are carried out by project personnel and/or stakeholders also introduces the
potential for optimism bias. For business planning purposes, as opposed to internal tracking and risk
Monte Carlo simulations rely on
repeated random sampling from
a range of variable inputs to
determine the probability of
different cost, schedule, revenue
or other outcomes.
In a traditional, ‘bottom-up’,
analysis, point estimates, e.g.,
how long a planned activity in a
schedule is expected to take, are
replaced with a range of possible
durations so that instead of ’45
days’ the activity may take
between 40 and 60 days. The
possibility of unplanned
activities or unexpected costs
(risks) may also be included as
inputs. The algorithm takes this
information and simulates a
possible outcome given the
underlying schedule or cost
estimate and uncertainty/risk.
By doing this thousands of times,
the program can determine the
probability of a particular
outcome.
In a top-down analysis, the
algorithm works much the same
way and is used for the same
purposes, but instead of
individual schedule activities or
costs, it uses actual outcomes
from similar projects to
determine the probability of
certain outcomes, e.g. that, a
particular revenue projection
will be met or costs will be below
a certain target.
California High-Speed Rail System Technical Supporting Document
52
management purposes, the key objective for CHSTP was and is to develop an accurate, objective
measure of the risk exposure as measured by the potential variance between actual (eventual) and
estimated costs together with the probability of a given variance. Given the relative weaknesses of a
bottom-up approach for such a determination, CHSTP is employing a reference-class methodology to
quantify the risk exposure associated with Lifecycle costs.
In reference-class analysis, the algorithm is given a set of outcomes from other, similar projects and then
uses these in a Monte Carlo simulation to, in a sense, work backwards to determine a probability
distribution that would lead to the given set of outcomes. From this resulting distribution, we can
determine how likely a particular outcome is for this project based on the outcomes of other similar
projects. This is akin to asking a number of people who live in your town how long it takes them to drive
to another town. From this sample, you could develop a general idea of what’s a reasonable amount of
time to allot for your trip and what is not. The Monte Carlo simulation simply allows for much more
specific predictions, e.g. ‘there is a 75% chance that your trip will take between 41 and 57 minutes’ or
‘there is a 2% chance that your trip will take longer than 80 minutes’.
Unlike the reference-class analysis done for O&M costs, there were no direct cases comparing projected
versus actual lifecycle costs on HSR systems from which to derive risk exposure curves since many
systems have not reached the ends of their assets’ useful lives and where they have, the assets are not
always comparable. To develop a risk exposure curve for Lifecycle costs, the Authority first developed
distributions believed to bracket the area describing Lifecycle Cost risk exposure. Three risk exposure
curves were developed for this purpose:
1. The O&M Curve, based on six reference cases comparing planned versus actual costs, as a
percentage
2. Rail Capital Expenditure curve without outliers, based on 54 of an original 58 Rail projects
with the two best and two worst cases excluded from the data set13
3. Rail Capital Expenditure curve with outliers, based on 58 Rail projects
The determination of the O&M and both Rail Capital Expenditure risk curves employed the actual
project outcomes in Monte Carlo simulations to develop probabilistic estimates of cost under- or
overruns and the results were normalized for comparison with one another. Using these three curves,
the ultimate specification of an appropriate Lifecycle Cost risk exposure curve was based on three
premises:
1. There is greater risk/uncertainty in Lifecycle cost than in O&M due to lack of data on HSR
systems, larger time interval between when costs are estimated and when they are realized
and because current Lifecycle costs are largely based on current capital cost estimates.
2. There is a less risk/uncertainty in Lifecycle costs than that indicated by Rail Capital
Expenditure risk curves and underlying project outcomes because the largest drivers of cost
overruns in capital expenditure (e.g. time to achieve political consensus, acquisition of ROW,
stakeholder issues) are largely or completely resolved by the time Lifecycle costs are realized.
13
These cases were collected and presented in Megaprojects and Risk: An Anatomy of Ambition by Bent Flyvbjerg, Nils Bruzelius and Werner Rothengatter, 2003 by Cambridge University Press
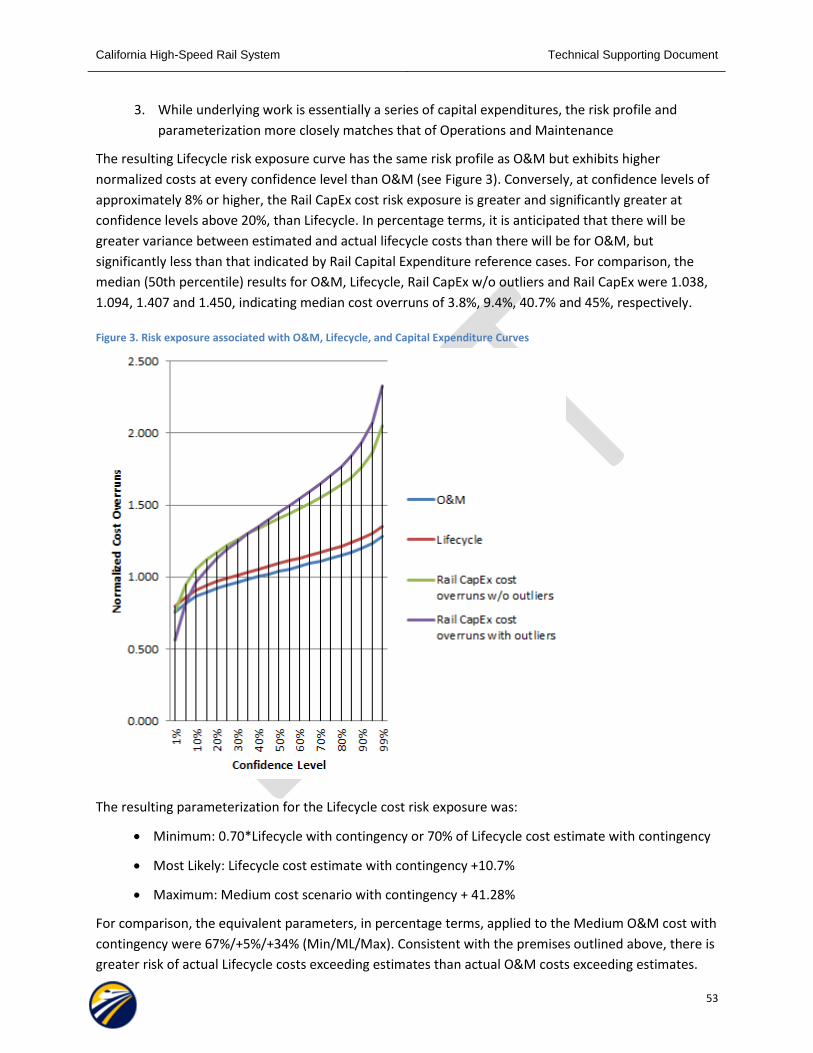
California High-Speed Rail System Technical Supporting Document
53
3. While underlying work is essentially a series of capital expenditures, the risk profile and
parameterization more closely matches that of Operations and Maintenance
The resulting Lifecycle risk exposure curve has the same risk profile as O&M but exhibits higher
normalized costs at every confidence level than O&M (see Figure 3). Conversely, at confidence levels of
approximately 8% or higher, the Rail CapEx cost risk exposure is greater and significantly greater at
confidence levels above 20%, than Lifecycle. In percentage terms, it is anticipated that there will be
greater variance between estimated and actual lifecycle costs than there will be for O&M, but
significantly less than that indicated by Rail Capital Expenditure reference cases. For comparison, the
median (50th percentile) results for O&M, Lifecycle, Rail CapEx w/o outliers and Rail CapEx were 1.038,
1.094, 1.407 and 1.450, indicating median cost overruns of 3.8%, 9.4%, 40.7% and 45%, respectively.
Figure 3. Risk exposure associated with O&M, Lifecycle, and Capital Expenditure Curves
The resulting parameterization for the Lifecycle cost risk exposure was:
Minimum: 0.70*Lifecycle with contingency or 70% of Lifecycle cost estimate with contingency
Most Likely: Lifecycle cost estimate with contingency +10.7%
Maximum: Medium cost scenario with contingency + 41.28%
For comparison, the equivalent parameters, in percentage terms, applied to the Medium O&M cost with
contingency were 67%/+5%/+34% (Min/ML/Max). Consistent with the premises outlined above, there is
greater risk of actual Lifecycle costs exceeding estimates than actual O&M costs exceeding estimates.
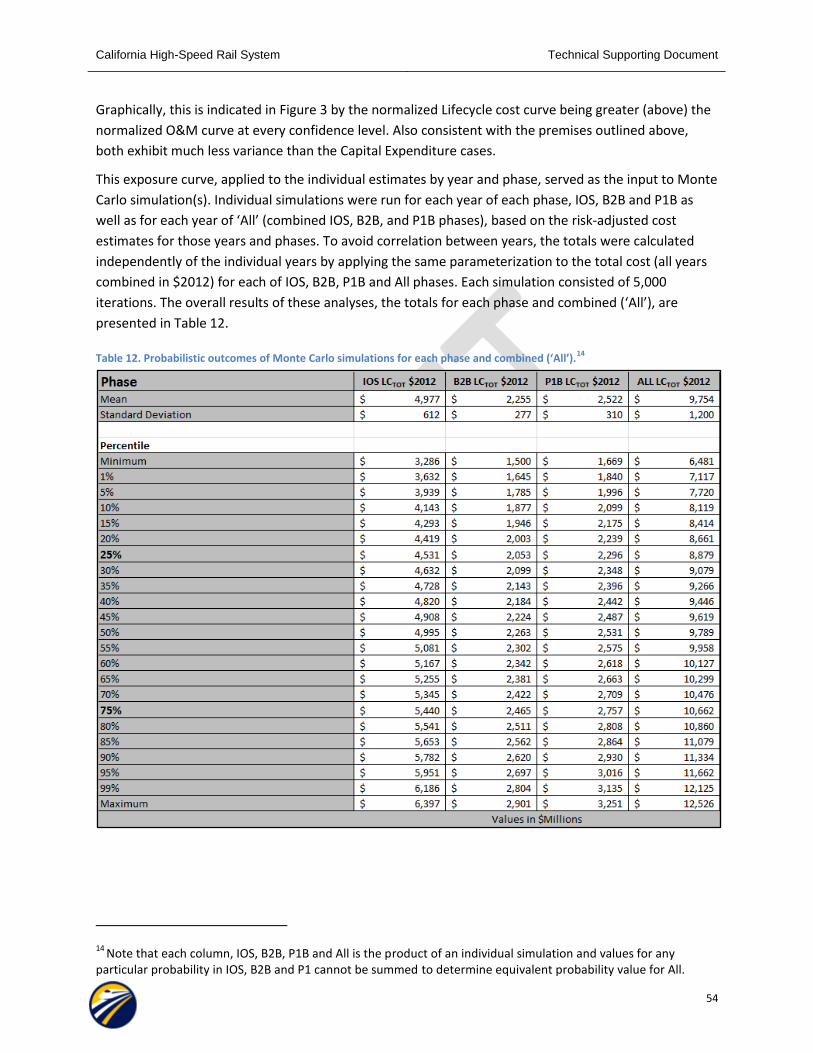
California High-Speed Rail System Technical Supporting Document
54
Graphically, this is indicated in Figure 3 by the normalized Lifecycle cost curve being greater (above) the
normalized O&M curve at every confidence level. Also consistent with the premises outlined above,
both exhibit much less variance than the Capital Expenditure cases.
This exposure curve, applied to the individual estimates by year and phase, served as the input to Monte
Carlo simulation(s). Individual simulations were run for each year of each phase, IOS, B2B and P1B as
well as for each year of ‘All’ (combined IOS, B2B, and P1B phases), based on the risk-adjusted cost
estimates for those years and phases. To avoid correlation between years, the totals were calculated
independently of the individual years by applying the same parameterization to the total cost (all years
combined in $2012) for each of IOS, B2B, P1B and All phases. Each simulation consisted of 5,000
iterations. The overall results of these analyses, the totals for each phase and combined (‘All’), are
presented in Table 12.
Table 12. Probabilistic outcomes of Monte Carlo simulations for each phase and combined (‘All’).14
14 Note that each column, IOS, B2B, P1B and All is the product of an individual simulation and values for any
particular probability in IOS, B2B and P1 cannot be summed to determine equivalent probability value for All.