Embed Size (px)
Citation preview

AN
NU
AL REPO
RT AN
D A
CC
OU
NTS 2017
50 YEARS OF INNOVATIONANNUAL REPORT AND ACCOUNTS 2017
WWW.AVEVA.COM

AVEVA GROUP PLC ANNUAL REPORT AND ACCOUNTS 2017
To find out more, please visit our website
WWW.AVEVA.COM
AVEVA GROUP PLC ANNUAL REPORT AND ACCOUNTS 201706 STRATEGIC REPORT 07
2010AVEVA acquires Logimatic MARS and ADB Systemer AS.
2011AVEVA acquires Z+F UK Ltd (LFM Software), adding next-generation laser-scanning capability to our product suite.
2012AVEVA acquires Bocad, adding advanced structural detailing software to AVEVA’s plant and marine solutions.
2012AVEVA acquires the class-leading 3D visualisation technology of Global Majic Software Inc.
2013AVEVA Everything3D™ (AVEVA E3D™) launched, the next generation of plant design software.
2014AVEVA launches AVEVA E3D Insight™, the world’s first tablet app for project review and approval.
2015AVEVA acquires 8over8, provider of contractual risk management solutions for organisations that design, build and operate high value assets.
2015AVEVA acquires FabTrol, a provider of fabrication management software for structural steel fabricators.
2015AVEVA releases AVEVA Engage™, a ground-breaking new class of decision support solution.
2016 AVEVA announces AVEVA Connect, its delivery platform for the Digital Asset in the Cloud.
2006
-200
9
2010
-201
2
2013
-201
6
2006AVEVA enters the FTSE 250 on the London Stock Exchange.
2006AVEVA launches Laser Model Interface™, providing the world’s first direct interaction with laser-scanned 3D plant models.
2008AVEVA announces world’s first open standards-based integration of P&ID and 3D design modelling.
2009AVEVA combines its information management solutions into the single brand AVEVA NET™.
2009AVEVA acquires iDesignOffice Pty Ltd.
CADCentre changed its name to AVEVA in 2001.
AVEVA pioneered the development of laser scanning technology.
AVEVA Engage utilises a uniquely simple touch-driven interface to provide unrivalled decision support through the life of an industrial asset.
AVEVA E3D Insight was the world’s first Windows 8.1 touchscreen app for project review and approval of AVEVA design models.
AVEVA Everything3D is the Company’s next- generation process plant design system.
50 YEARS OF INNOVATIONAVEVA IS NOW INTO ITS 50TH YEAR, HAVING BEEN FOUNDED IN 1967 AS A GOVERNMENT-FUNDED RESEARCH INSTITUTE CREATED BY THE THEN UK MINISTRY OF TECHNOLOGY AT CAMBRIDGE UNIVERSITY.
The Company’s original mission, to develop computer-aided design techniques for use by British industry, has been achieved and indeed greatly exceeded. The Group now operates in 30 countries across the globe and provides the design technology that has created countless engineering assets.
1967Established as CADCentre.
1976World’s first 3D Plant Design and Management System (PDMS™) – with object-based engineering database.
1979World’s first intelligent P&ID system (PEGS) launched at ACHEMA.
1983CADCentre becomes a private company.
1988World’s first plant walk-through visualisation system.
1992World’s first interactive full colour shaded plant design system.
1994CADCentre management buyout.
1996CADCentre Group plc listed on London Stock Exchange.
1997World’s first Internet-based collaborative plant design solution (HyperPlant).
1967
-197
9 2000
-200
5
1980
-199
9
Installed at CADCentre in 1967, the Atlas 2 computer represented the state-of-the-art in processing power both in British and in worldwide computing.
A model of a process plant being interactively designed in PDMS.
The ground-breaking REVIEW system provided real-time interactive 3D graphics, enabling project teams to quickly become familiar with a design.
HyperPlant pioneered the use of Internet technology to provide remote online access to plant models created in PDMS.
2001World’s first plant design system for concurrent global project execution (PDMS Global).
2001CADCentre changes its name to AVEVA.
2002AVEVA introduces 3D streaming technology to view plant models.
2004AVEVA acquires Tribon Solutions, the leading marine design software and services provider.
AVEVA GROUP PLC ANNUAL REPORT AND ACCOUNTS 201704 STRATEGIC REPORT 05
£32.9M
£106.6M
£76.3MAMERICAS
EMEA
ASIA PACIFICOil & Gas
Marine
Power
Petrochemical & Chemical
Other
Petrochemical & ChemicalPetrochemical & Chemical account for approximately 10% of revenue. Our customers include many of the world’s leading chemical companies.
Other marketsOther markets account for approximately 10% of revenue. In these markets AVEVA’s products drive efficiencies in complex and more technically sophisticated projects.
OUR GLOBAL FOOTPRINTAVEVA OPERATES IN 30 COUNTRIES, ENABLING US TO SUPPORT CUSTOMERS LOCALLY ACROSS ALL OF THE WORLD’S MAJOR ECONOMIES.
OUR MARKETS
Our products are most applicable in industries where scale and complexity are the greatest challenge. These include: Oil & Gas, Marine, Power, Petrochemical & Chemical, and other markets such as AEC Fabrication, Paper & Pulp, Mining and Pharmaceuticals.
Key
Oil & GasOil & Gas accounts for around 40–45% of revenue. Our customers include nine out of ten of the world’s leading Oil & Gas EPCs and the majority of the largest Oil & Gas companies.
MarineMarine accounts for approximately 20% of revenue. Our customers include nine out of ten of the world’s largest shipyards.
PowerPower accounts for some 15–20% of revenue. Our customers include many leading EPCs and power generation companies.
CUSTOMER PROPOSITION
Our products are most applicable in industries where scale and complexity are the greatest challenge. Our success has been built on strong, long-term relationships with our customers, often spanning several decades. These relationships enable us to fully understand the industries we serve and ensure that our technology development strategy meets and anticipates our customers’ developing needs.
Engineering & DesignOur software enables effective collaboration, increased confidence in engineering decisions, and the ability to manage change fast. For example, all collaborators can access and update one integrated system, change is managed quickly to avoid unnecessary iterations, and zero-clash modelling can be achieved by including laser data directly within the design.
ProcureOur customers can keep information consistent across global engineering, design, materials management and procurement teams. For example, it is possible to define and control materials efficiently to avoid reworks, as well as the ability to share procurement contract management details within a centralised system to avoid disputes.
BuildCustomers can increase the transparency of their construction processes with integration at all levels of the workforce. Our tools give managers better control through integrated workforce planning, enabling the right resources and the materials to be in place to maximise time, and accommodating changes easily.
Revamp and refitOur tools make planning and implementing modifications quicker and easier, increasing efficiency and minimising downtime. The immersive 3D environment and real-time, integrated laser scanning capabilities allow asset and project information to be integrated, so revamps can be planned and deployed confidently.
OperateCustomers can minimise operational risk, improve change management and increase asset intelligence using one easily accessible contextual digital information source. Change is managed effectively, as the physical asset is synchronised with its digital equivalent. This gives engineers a clear picture of full information context for all decisions in both normal and critical situations.
HandoverOur customers can save time during familiarisation and streamline project handover from the EPC-managed phase to commissioning and start-up. For example, information is contextualised within the 3D world, saving valuable time during familiarisation and the cost of information handover management is reduced to near zero.
SUMMARY
HIGHLIGHTS
AVEVA’S PERFORMANCE HAS BEEN RESILIENT IN THE CONTEXT OF CHALLENGING CONDITIONS IN OUR CORE OIL & GAS AND MARINE END MARKETS. This demonstrated the strength of our business model, with high levels of recurring revenue and continued strong cash generation. We made good progress in delivering against our growth strategy, with significant new order wins from Owner Operators, an acceleration in sales of our More than 3D products and success in broadening our end market exposure.

STRATEGIC REPORT 01
£215.8MRevenue
Up 7.1% (2016 – £201.5m)
£166.0MRecurring revenue
Up 7.8% (2016 – £154.0m)
£55.0MAdjusted profit before tax
Up 7.4% (2016 – £51.2m)
More than 3D (MT3D)AVEVA’s MT3D sales grew strongly during the year, increasing 13%. MT3D products represented 26% of total revenue, increasing from 25% in the prior year.
Owner Operators (OOs)AVEVA’s sales to OOs also grew strongly during the year, increasing 17%. OOs represented 16% of total revenue, increasing from 15% in the prior year.
Organisational structureTo sharpen our execution, greater decision-making capabilities and direct accountability for performance have been allocated to our regions.
Enhanced Research & DevelopmentWhile our R&D costs fell by 1.0% on a constant currency basis during 2016/17, this reflected efficiencies achieved through expanding our presence in Hyderabad, India and reducing costs in other locations. Overall capabilities were not reduced.
For further details of our operations see pages 22 and 23.
Growth marketsAVEVA performed well in our target growth markets during the year. We enjoyed particular success in North America, where our local strategy of leading with sales to OOs and of MT3D products is working well.
Software as a Service (SaaS)We launched our first public Cloud products AVEVA Connect™ and AVEVA NET Connect™ at the AVEVA World Summit in October 2016.
For further details of our strategy see pages 8 and 9.
£47.9MNet cash from operating activities
Up 97% (2016 – £24.3m)
£130.9MNet cash
Up 21.3% (2016 – £107.9m)
40.0 PENCETotal dividend
Up 11.1% (2016 – 36.0 pence)
FINANCIALS
STRATEGIC
OPERATIONAL
CONTENTS
Strategic Report01 Summary, Mission, Highlights02 Our Business Explained04 Our Global Footprint06 50 Years of Innovation08 Strategic Framework10 Chairman’s Statement12 Market Review14 Chief Executive’s Strategic Review21 Key Performance Indicators22 CTO’S Review24 Finance Review29 Principal Risks and Uncertainties32 Corporate Responsibility
Governance Report36 Corporate Governance41 Nominations Committee Report42 Board of Directors44 Audit Committee Report47 Remuneration
Committee Report67 Other Statutory Information
Financial Statements72 Independent Auditor’s Report 77 Consolidated Income Statement78 Consolidated Statement of
Comprehensive Income79 Consolidated Balance Sheet80 Consolidated Statement of
Changes in Shareholders’ Equity81 Consolidated Cash
Flow Statement82 Notes to the Consolidated
Financial Statements107 Company Balance Sheet108 Company Statement of Changes
in Shareholders’ Equity109 Notes to the Company
Financial Statements112 Five Year Record113 Statement of Group
Accounting Policies123 Company Information
and Advisers
SUMMARY, MISSION, HIGHLIGHTSAVEVA IS A LEADING GLOBAL PROVIDER OF ENGINEERING DESIGN AND INFORMATION MANAGEMENT SOFTWARE.
WE GIVE CUSTOMERS THE POWER TO CREATE, VISUALISE AND MANAGE THEIR ASSETS DIGITALLY, WHICH SIGNIFICANTLY LOWERS THEIR TOTAL COST OF OWNERSHIP THROUGHOUT THE ASSET LIFE CYCLE.

02 AVEVA GROUP PLC ANNUAL REPORT AND ACCOUNTS 2017
…TO POWER OUR BUSINESS…
RESILIENT RECURRING REVENUERight-to-use licensing model
ONGOING INNOVATIONWe create and develop mission-critical, differentiated products
LONG-TERM GROWTHWe aim to deliver solid organic growth into the long term
VALUE CREATIONWe aim to deliver profitable growth
WE DRAW ON OUR STRENGTHS…
TECHNOLOGYAt the core of AVEVA’s business is the intellectual property in our software products.
PEOPLEAVEVA has highly skilled employees across the globe, ranging from those with decades of technical experience to talented graduates.
GLOBAL FOOTPRINTAVEVA has a global network of 50 offices in 30 countries, meaning that we can provide customers with local sales and support in all of the world’s major economies.
CUSTOMER RELATIONSHIPSWe have over 4,000 customers including many of the world’s leading Owner Operators, EPCs, shipbuilders and industrial conglomerates. Many of these customers have relied on our technology for decades.
RESEARCH & DEVELOPMENTAVEVA has a 50 year track record of developing industry-leading products.
OUR VALUES
OUR BUSINESS EXPLAINEDOUR VISION OF A CONSTANTLY-EVOLVING DIGITAL ASSET ENABLES OUR CUSTOMERS TO MANAGE THE PROCESS OF CONTINUAL CHANGE AS THEY DESIGN, BUILD AND OPERATE SOME OF THE WORLD’S MOST COMPLEX PHYSICAL ASSETS ACROSS THE PROCESS, PLANT AND MARINE INDUSTRIES.
ACCESSIBLEWe are accessible and respond effectively to our customers’ needs.
FLEXIBLEWe are responsive and quick to react to the changing requirements of our customers.
Customers license our software for a specified number of users by paying an initial licence fee followed by an obligatory annual fee or by paying a rental fee over a fixed period of time. In both cases, the customer has to continue to pay a fee in order to use the software. This model continues to provide a strong recurring revenue base for AVEVA which allows us to invest in a future roadmap of our products.
AVEVA has 637 highly skilled research and development staff, primarily based in our core Cambridge and Hyderabad centres. We delivered a number of important new products and product upgrades in 2017.
Our investments in innovation have delivered solid growth across end market cycles.
The value that our products add to our customers allows AVEVA to achieve high operating margins, high returns on capital and strong cash generation.

STRATEGIC REPORT 03
Oil & Gas Marine Power
Petrochemical & Chemical
Other
… AND DELIVER VALUE TO OUR STAKEHOLDERS
CUSTOMERSAVEVA’s innovation means that our customers can make informed, confident decisions at every stage of the project life cycle with our Digital Asset approach. Every step of an asset’s life cycle is an opportunity to work faster, act smarter, reduce risk and save costs.
AVEVA Connect and AVEVA NET Connect
Our first public Cloud products launched at the AVEVA World Summit in October 2016.
INVESTORSAVEVA has consistently delivered value for its investors.
11%Proposed increase in AVEVA’s 2017 total dividend
180%Total Shareholder Return achieved in the ten years to 31 March 2017
EMPLOYEESOur well-established learning and development programmes continue to provide a range of opportunities for our employees.
1,707AVEVA employees globally
COMMUNITYWe are proud of our AVEVA colleagues who continue to support many local, national and international charities. We match the funding raised by employees who support local charities.
£45KDonations to charity from AVEVA and its employees in 2017
INNOVATIVEWe continually create innovative products and services to maximise the success of our customers.
INSPIRINGOur enthusiasm and energy are an inspiration for our customers.
TRUSTWORTHYWe have credibility in the market and are trusted by our customers.
77%Recurring revenue in 2017
8.6%2017 revenue CAGR in the ten years to 2017
122%Conversion of net profit into cash in 2017
£31.9M2017 Research & Development spend
For more information see pages 24 to 28
For more information see pages 14 to 20
For more information see pages 22 to 23
For more information see pages 24 to 28
Pages 32 to 34

04 AVEVA GROUP PLC ANNUAL REPORT AND ACCOUNTS 2017
£32.9M
£106.6M
£76.3MAMERICAS
EMEA
ASIA PACIFICOil & Gas
Marine
Power
Petrochemical & Chemical
Other
OUR GLOBAL FOOTPRINTAVEVA OPERATES IN 30 COUNTRIES, ENABLING US TO SUPPORT CUSTOMERS LOCALLY ACROSS ALL OF THE WORLD’S MAJOR ECONOMIES.
OUR MARKETS
Our products are most applicable in industries where scale and complexity are the greatest challenge. These include: Oil & Gas, Marine, Power, Petrochemical & Chemical, and other markets such as AEC Fabrication, Paper & Pulp, Mining and Pharmaceuticals.
Key
Oil & GasOil & Gas accounts for around 40–45% of revenue. Our customers include nine out of ten of the world’s leading Oil & Gas EPCs and the majority of the largest Oil & Gas companies.
MarineMarine accounts for approximately 20% of revenue. Our customers include nine out of ten of the world’s largest shipyards.
PowerPower accounts for some 15–20% of revenue. Our customers include many leading EPCs and power generation companies.

STRATEGIC REPORT 05
£32.9M
£106.6M
£76.3MAMERICAS
EMEA
ASIA PACIFIC
Petrochemical & ChemicalPetrochemical & Chemical account for approximately 10% of revenue. Our customers include many of the world’s leading chemical companies.
Other marketsOther markets account for approximately 10% of revenue. In these markets AVEVA’s products drive efficiencies in complex and more technically sophisticated projects.
CUSTOMER PROPOSITION
Our products are most applicable in industries where scale and complexity are the greatest challenge. Our success has been built on strong, long-term relationships with our customers, often spanning several decades. These relationships enable us to fully understand the industries we serve and ensure that our technology development strategy meets and anticipates our customers’ developing needs.
Engineering & DesignOur software enables effective collaboration, increased confidence in engineering decisions, and the ability to manage change fast. For example, all collaborators can access and update one integrated system, change is managed quickly to avoid unnecessary iterations, and zero-clash modelling can be achieved by including laser data directly within the design.
ProcureOur customers can keep information consistent across global engineering, design, materials management and procurement teams. For example, it is possible to define and control materials efficiently to avoid reworks, as well as the ability to share procurement contract management details within a centralised system to avoid disputes.
BuildCustomers can increase the transparency of their construction processes with integration at all levels of the workforce. Our tools give managers better control through integrated workforce planning, enabling the right resources and the materials to be in place to maximise time, and accommodating changes easily.
Revamp and refitOur tools make planning and implementing modifications quicker and easier, increasing efficiency and minimising downtime. The immersive 3D environment and real-time, integrated laser scanning capabilities allow asset and project information to be integrated, so revamps can be planned and deployed confidently.
OperateCustomers can minimise operational risk, improve change management and increase asset intelligence using one easily accessible contextual digital information source. Change is managed effectively, as the physical asset is synchronised with its digital equivalent. This gives engineers a clear picture of full information context for all decisions in both normal and critical situations.
HandoverOur customers can save time during familiarisation and streamline project handover from the EPC-managed phase to commissioning and start-up. For example, information is contextualised within the 3D world, saving valuable time during familiarisation and the cost of information handover management is reduced to near zero.

06 AVEVA GROUP PLC ANNUAL REPORT AND ACCOUNTS 2017
50 YEARS OF INNOVATIONAVEVA IS NOW INTO ITS 50TH YEAR, HAVING BEEN FOUNDED IN 1967 AS A GOVERNMENT-FUNDED RESEARCH INSTITUTE CREATED BY THE THEN UK MINISTRY OF TECHNOLOGY AT CAMBRIDGE UNIVERSITY.
The Company’s original mission, to develop computer-aided design techniques for use by British industry, has been achieved and indeed greatly exceeded. The Group now operates in 30 countries across the globe and provides the design technology that has created countless engineering assets.
1967Established as CADCentre.
1976World’s first 3D Plant Design and Management System (PDMS™) – with object-based engineering database.
1979World’s first intelligent P&ID system (PEGS) launched at ACHEMA.
1983CADCentre becomes a private company.
1988World’s first plant walk-through visualisation system.
1992World’s first interactive full colour shaded plant design system.
1994CADCentre management buyout.
1996CADCentre Group plc listed on London Stock Exchange.
1997World’s first Internet-based collaborative plant design solution (HyperPlant).
1967
-197
9 2000
-200
5
1980
-199
9
Installed at CADCentre in 1967, the Atlas 2 computer represented the state-of-the-art in processing power both in British and in worldwide computing.
A model of a process plant being interactively designed in PDMS.
The ground-breaking REVIEW system provided real-time interactive 3D graphics, enabling project teams to quickly become familiar with a design.
HyperPlant pioneered the use of Internet technology to provide remote online access to plant models created in PDMS.
2001World’s first plant design system for concurrent global project execution (PDMS Global).
2001CADCentre changes its name to AVEVA.
2002AVEVA introduces 3D streaming technology to view plant models.
2004AVEVA acquires Tribon Solutions, the leading marine design software and services provider.

STRATEGIC REPORT 07
2010AVEVA acquires Logimatic MARS and ADB Systemer AS.
2011AVEVA acquires Z+F UK Ltd (LFM Software), adding next-generation laser-scanning capability to our product suite.
2012AVEVA acquires Bocad, adding advanced structural detailing software to AVEVA’s plant and marine solutions.
2012AVEVA acquires the class-leading 3D visualisation technology of Global Majic Software Inc.
2013AVEVA Everything3D™ (AVEVA E3D™) launched, the next generation of plant design software.
2014AVEVA launches AVEVA E3D Insight™, the world’s first tablet app for project review and approval.
2015AVEVA acquires 8over8, provider of contractual risk management solutions for organisations that design, build and operate high value assets.
2015AVEVA acquires FabTrol, a provider of fabrication management software for structural steel fabricators.
2015AVEVA releases AVEVA Engage™, a ground-breaking new class of decision support solution.
2016 AVEVA announces AVEVA Connect, its delivery platform for the Digital Asset in the Cloud.
2006
-200
9
2010
-201
2
2013
-201
62006AVEVA enters the FTSE 250 on the London Stock Exchange.
2006AVEVA launches Laser Model Interface™, providing the world’s first direct interaction with laser-scanned 3D plant models.
2008AVEVA announces world’s first open standards-based integration of P&ID and 3D design modelling.
2009AVEVA combines its information management solutions into the single brand AVEVA NET™.
2009AVEVA acquires iDesignOffice Pty Ltd.
CADCentre changed its name to AVEVA in 2001.
AVEVA pioneered the development of laser scanning technology.
AVEVA Engage utilises a uniquely simple touch-driven interface to provide unrivalled decision support through the life of an industrial asset.
AVEVA E3D Insight was the world’s first Windows 8.1 touchscreen app for project review and approval of AVEVA design models.
AVEVA Everything3D is the Company’s next- generation process plant design system.
08 AVEVA GROUP PLC ANNUAL REPORT AND ACCOUNTS 2017
Strategic priority What we said What we did
1 MT3DMore than 3D
AVEVA’s core sales are in the area of 3D Plant and Marine design. We aim to grow sales of other design tools such as AVEVA Electrical, AVEVA Engineering and information management tools such as AVEVA NET to address the whole life cycle of industrial assets.
– We see a major market opportunity in leveraging our customer base by selling additional engineering software tools, outside of AVEVA’s core 3D design platforms.
– We grew MT3D sales strongly during the year with an increase of 2.1% on a constant currency basis. Sales of our wider product suite have been a feature of this year’s key customer wins, with, for example, the AVEVA NET and AVEVA Engage information management tools helping to strengthen our offer to OOs.
26%Revenues from MT3D in 2017
2 OWNER OPERATORS
OOs such as energy and power generation companies currently account for only 16% of our revenue.
– A significant market opportunity is developing as OOs increasingly adopt Digital Assets to help them manage their physical assets throughout their life cycles.
– AVEVA’s sales to OOs also grew strongly during the year, increasing 5.4% on a constant currency basis.
– We won some impressive new customer logos from our competitors during the year, which demonstrates the strength of our technology offering for OOs.
16%Revenues from Owner Operators in 2017
3 GROWTH MARKETS
AVEVA generates almost 50% of its revenue from EMEA. This largely reflects our heritage as a UK-based company and indicates an opportunity to take a larger share of the global market.
– We intend to grow our revenues in key markets such as the USA, the Middle East and China, using the competitive advantages that our products offer.
– AVEVA performed well in our target growth markets during the year. We enjoyed success in North America, where our local strategy of leading with sales to OOs and of MT3D products is working well and resulted in key new customer wins, including Southern Company and one of the world’s leading industrial conglomerates. Although we continue to see growth potential in China, our business there performed less well during the year, while achieving a solid performance in the Middle East.
18.9%Constant currency revenue growth in North America
4 BROADENING MARKET EXPOSURE
AVEVA’s core heritage is Oil & Gas and particularly upstream, offshore. However, our technology is well suited to a wide range of industries, offering exciting growth opportunities.
– We aim to grow our market share in industries beyond our core Oil & Gas and Marine markets.
– We achieved key new customer wins in the Power market.
– We grew revenues from Fabrication strongly.10.0%Constant currency increase in steel fabrication revenue in 2017
5 SAAS AND THE CLOUD
We intend to unify all of our applications onto a common Cloud platform to enhance ease of customer adoption and address a wider customer base.
– While AVEVA’s business model already has the high level of recurring subscription revenues typically associated with Cloud delivery, we aim to be technologically ready to offer our products on a SaaS model in response to customer demand.
– We launched our first public Cloud products AVEVA Connect and AVEVA NET Connect at the AVEVA World Summit in October 2016.
– We will soon be launching our Information Standards Management (ISM) software in the Cloud.
77%AVEVA’s recurring revenues in 2017
STRATEGIC FRAMEWORKNOTWITHSTANDING THE CYCLICAL HEADWINDS IN END MARKETS THAT AVEVA HAS EXPERIENCED IN THE RECENT PAST, WE EXPECT OUR STRATEGY TO DELIVER SOLID ORGANIC GROWTH INTO THE LONG TERM.
Our strategy is to increase revenues by expanding the addressable market as the concept of the Digital Asset is more widely adopted, to sell a wider range of products, and to grow in industry and geographic verticals where the Group’s market share is underweight, versus the strength of its product offering.
This strategy is organised around the pillars shown opposite of More than 3D, Owner Operators, Growth Markets, Broadening Market Exposure and Software as a Service (SaaS) and the Cloud.
Link to KPIsOur success in executing our strategy ultimately feeds into our KPIs (see page 21) which track our long-term aim of delivering sustainable, profitable growth.
James KiddChief Executive Officer

STRATEGIC REPORT 09
Strategic priority What we said What we did
1 MT3DMore than 3D
AVEVA’s core sales are in the area of 3D Plant and Marine design. We aim to grow sales of other design tools such as AVEVA Electrical, AVEVA Engineering and information management tools such as AVEVA NET to address the whole life cycle of industrial assets.
– We see a major market opportunity in leveraging our customer base by selling additional engineering software tools, outside of AVEVA’s core 3D design platforms.
– We grew MT3D sales strongly during the year with an increase of 2.1% on a constant currency basis. Sales of our wider product suite have been a feature of this year’s key customer wins, with, for example, the AVEVA NET and AVEVA Engage information management tools helping to strengthen our offer to OOs.
26%Revenues from MT3D in 2017
2 OWNER OPERATORS
OOs such as energy and power generation companies currently account for only 16% of our revenue.
– A significant market opportunity is developing as OOs increasingly adopt Digital Assets to help them manage their physical assets throughout their life cycles.
– AVEVA’s sales to OOs also grew strongly during the year, increasing 5.4% on a constant currency basis.
– We won some impressive new customer logos from our competitors during the year, which demonstrates the strength of our technology offering for OOs.
16%Revenues from Owner Operators in 2017
3 GROWTH MARKETS
AVEVA generates almost 50% of its revenue from EMEA. This largely reflects our heritage as a UK-based company and indicates an opportunity to take a larger share of the global market.
– We intend to grow our revenues in key markets such as the USA, the Middle East and China, using the competitive advantages that our products offer.
– AVEVA performed well in our target growth markets during the year. We enjoyed success in North America, where our local strategy of leading with sales to OOs and of MT3D products is working well and resulted in key new customer wins, including Southern Company and one of the world’s leading industrial conglomerates. Although we continue to see growth potential in China, our business there performed less well during the year, while achieving a solid performance in the Middle East.
18.9%Constant currency revenue growth in North America
4 BROADENING MARKET EXPOSURE
AVEVA’s core heritage is Oil & Gas and particularly upstream, offshore. However, our technology is well suited to a wide range of industries, offering exciting growth opportunities.
– We aim to grow our market share in industries beyond our core Oil & Gas and Marine markets.
– We achieved key new customer wins in the Power market.
– We grew revenues from Fabrication strongly.10.0%Constant currency increase in steel fabrication revenue in 2017
5 SAAS AND THE CLOUD
We intend to unify all of our applications onto a common Cloud platform to enhance ease of customer adoption and address a wider customer base.
– While AVEVA’s business model already has the high level of recurring subscription revenues typically associated with Cloud delivery, we aim to be technologically ready to offer our products on a SaaS model in response to customer demand.
– We launched our first public Cloud products AVEVA Connect and AVEVA NET Connect at the AVEVA World Summit in October 2016.
– We will soon be launching our Information Standards Management (ISM) software in the Cloud.
77%AVEVA’s recurring revenues in 2017

10 AVEVA GROUP PLC ANNUAL REPORT AND ACCOUNTS 2017
CHAIRMAN’S STATEMENTAVEVA DELIVERED A RESILIENT PERFORMANCE DURING THE YEAR. WE WILL CONTINUE TO TARGET GROWTH, STRENGTHENING CUSTOMER RELATIONSHIPS, WINNING NEW CUSTOMERS AND DEVELOPING OUR PRODUCT PORTFOLIO.
I am pleased to report that AVEVA delivered a resilient performance during 2016/17, despite two of our key end markets, Oil & Gas and Marine, remaining subdued. Revenue increased 7.1% to £215.8 million (2016 – £201.5 million) assisted by currency translation and profit before tax was £46.9 million (2016 – £29.4 million), supported by strong cost discipline. On an adjusted basis, profit before tax grew 7.4% to £55.0 million (2016 – £51.2 million).
The Group also increased cash from operating activities by 58.2% to £57.2 million (2016 – £36.1 million). We are maintaining our progressive dividend policy and propose to increase the total dividend for the year to 40.0 pence per share (2016 – 36.0 pence). This represents an increase of 11.1% over the prior year, underpinned by our confidence in the long-term prospects for the business.
AVEVA’s net cash position at the year end grew to £130.9 million (2016 – £107.9 million). The Board believes that it is important to maintain a strong balance sheet. This gives our customers confidence in the strength of our business and allows us to have at hand sufficient resources to invest in AVEVA’s future growth, for example, by investing in Research & Development and capitalising on acquisition opportunities as they become available.
Delivering on our strategyIn addition to delivering solid results, we have remained focused on executing upon our strategy, in order to position AVEVA to achieve growth well into the future.
AVEVA achieved good momentum in sales of products beyond the core 3D design software that currently makes up the majority of our revenue. We also made good progress with our strategy of increasing our sales to Owner Operators (OOs), growth in the key North American market and in broadening our market exposure outside of Oil & Gas and Marine. For example, during the year we had considerable success in the Power market, winning contracts with companies including KEPCO E&C, Southern Company and TerraPower.
These successes were made possible by the strength of our technologies and people. We continued to enhance our existing products and develop new offerings during the year through our development centres in Cambridge and Hyderabad.
Board developmentsAt the end of 2016, after 33 years with the Group and 17 years as Chief Executive, Richard Longdon stepped down from his role as Chief Executive and as a Director of the Company. Richard oversaw the most successful phase in AVEVA’s history and was the driving force in developing it into a global company. The Board and I are grateful to Richard for his contribution to AVEVA’s success.
Philip AikenChairman
58.2%Increase in cash from operating activities before tax
11.1%Increase in total dividend
STRATEGIC REPORT 11
We were delighted to appoint James Kidd as Deputy Chief Executive in July and as Richard’s successor as Chief Executive from 1 January 2017. James had been Chief Financial Officer and a member of the Board since January 2011.
We were also pleased to appoint David Ward to the Board as James’ successor in the role of Chief Financial Officer in July. David had been Head of Finance at AVEVA since 2011.
James and David were both key to developing AVEVA’s strategy and I have been impressed with the sharp focus that they have demonstrated in executing it in their new roles.
We also had changes within our Non-Executive team. Jonathan Brooks and Philip Dayer both reached their nine-year tenures during the year. Jonathan stepped down from the Board in November 2016 and Philip will retire at the AGM in July 2017. I would like to thank them both on behalf of the Board for their contributions to AVEVA.
We welcomed two new Non-Executives to the Board. Christopher Humphrey joined the Board in July 2016 and assumed the role of Chair of the Audit Committee in November. Rohinton (Ron) Mobed was appointed to the Board in March 2017. Christopher and Ron have a wealth of technology and information management experience, which will add further breadth and depth to the skills of the Board.
SummaryAVEVA is now in its 50th year, having been founded in 1967 as a government-funded research institute created by the then UK Ministry of Technology at Cambridge University. The Company’s original mission, to develop computer-aided design techniques for use by British industry, has been achieved and indeed greatly exceeded.
The Group now operates in more than 30 countries across the globe and provides the design technology that has created some of the world’s largest and most complex engineering assets. As I look ahead, the opportunities are as exciting as they have ever been, as industries look to drive efficiencies by adopting a Digital Asset approach throughout the life cycle of the physical asset.
We will continue to target growth, strengthening customer relationships, winning new customers in new areas and developing our product portfolio.
AVEVA’s progress would not be possible without the hard work and dedication of all our employees. The Board would like to express its sincere thanks for their considerable efforts. We would also like to thank our customers, shareholders and other stakeholders for their continued support.
Philip Aiken AMChairman23 May 2017
12 AVEVA GROUP PLC ANNUAL REPORT AND ACCOUNTS 2017
Oil & Gas
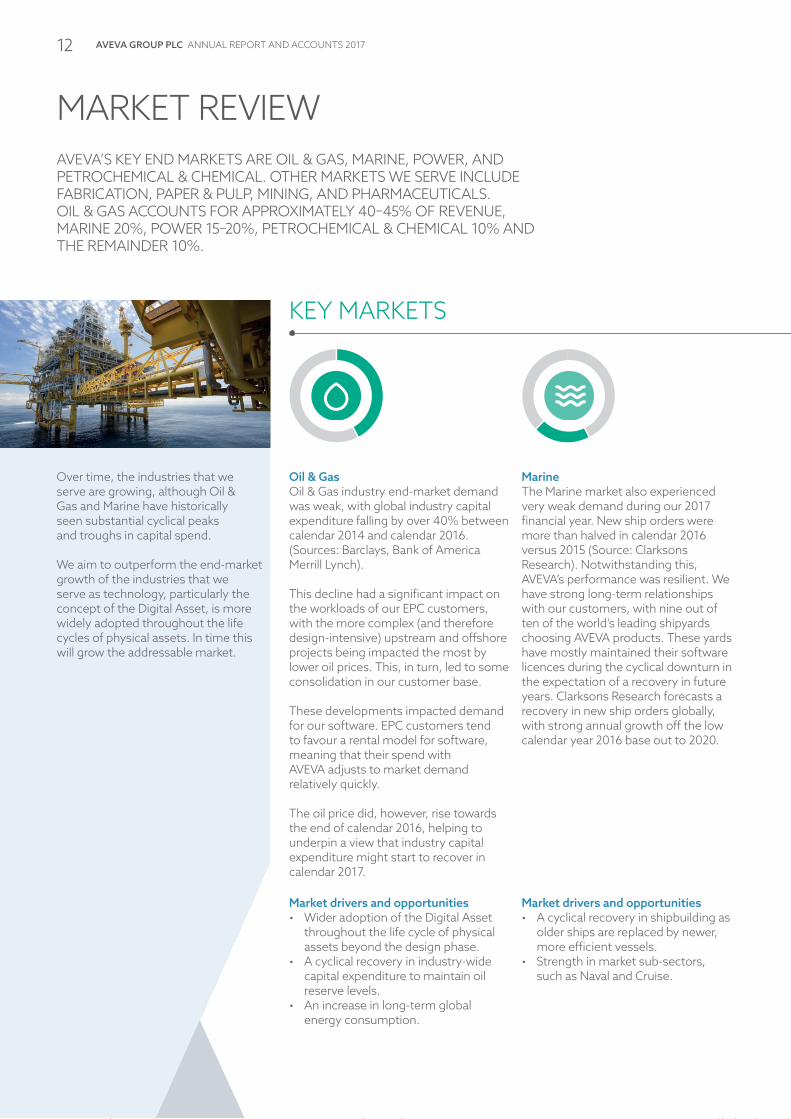
MARKET REVIEWAVEVA’S KEY END MARKETS ARE OIL & GAS, MARINE, POWER, AND PETROCHEMICAL & CHEMICAL. OTHER MARKETS WE SERVE INCLUDE FABRICATION, PAPER & PULP, MINING, AND PHARMACEUTICALS. OIL & GAS ACCOUNTS FOR APPROXIMATELY 40–45% OF REVENUE, MARINE 20%, POWER 15–20%, PETROCHEMICAL & CHEMICAL 10% AND THE REMAINDER 10%.
Oil & GasOil & Gas industry end-market demand was weak, with global industry capital expenditure falling by over 40% between calendar 2014 and calendar 2016. (Sources: Barclays, Bank of America Merrill Lynch).
This decline had a significant impact on the workloads of our EPC customers, with the more complex (and therefore design-intensive) upstream and offshore projects being impacted the most by lower oil prices. This, in turn, led to some consolidation in our customer base.
These developments impacted demand for our software. EPC customers tend to favour a rental model for software, meaning that their spend with AVEVA adjusts to market demand relatively quickly.
The oil price did, however, rise towards the end of calendar 2016, helping to underpin a view that industry capital expenditure might start to recover in calendar 2017.
Over time, the industries that we serve are growing, although Oil & Gas and Marine have historically seen substantial cyclical peaks and troughs in capital spend.
We aim to outperform the end-market growth of the industries that we serve as technology, particularly the concept of the Digital Asset, is more widely adopted throughout the life cycles of physical assets. In time this will grow the addressable market.
MarineThe Marine market also experienced very weak demand during our 2017 financial year. New ship orders were more than halved in calendar 2016 versus 2015 (Source: Clarksons Research). Notwithstanding this, AVEVA’s performance was resilient. We have strong long-term relationships with our customers, with nine out of ten of the world’s leading shipyards choosing AVEVA products. These yards have mostly maintained their software licences during the cyclical downturn in the expectation of a recovery in future years. Clarksons Research forecasts a recovery in new ship orders globally, with strong annual growth off the low calendar year 2016 base out to 2020.
KEY MARKETS
Market drivers and opportunities• A cyclical recovery in shipbuilding as
older ships are replaced by newer, more efficient vessels.
• Strength in market sub-sectors, such as Naval and Cruise.
Market drivers and opportunities• Wider adoption of the Digital Asset
throughout the life cycle of physical assets beyond the design phase.
• A cyclical recovery in industry-wide capital expenditure to maintain oil reserve levels.
• An increase in long-term global energy consumption.

STRATEGIC REPORT 13
PowerWe saw strength in the Power market with several significant new contract wins during the year. Longer-term trends in Power are positive as the world’s emerging economies invest in their power-generation requirements and the ageing infrastructure of the developed world is maintained or replaced.
In the shorter term, AVEVA has benefited from market share gains and more demanding technology requirements from operators in the sector for both design and information management tools, as they seek to improve asset efficiency.
Petrochemical & ChemicalWe saw stability in the Petrochemical & Chemical markets during the year, with AVEVA achieving some key customer wins. We expect to see moderate growth over the medium term.
We saw ongoing investment in the sector during the year, particularly in Asia, with stable market conditions on a global basis. AVEVA enjoyed success in winning new OO customers in Asia during the year in the refining sector.
Other marketsThese markets include Fabrication, Paper & Pulp, Mining and Pharmaceutical.
We enjoyed good customer wins in the Paper & Pulp, Pharmaceutical and Fabrication sectors.
Market drivers and opportunities• Growing demand for power in
emerging economies.• Replacement of end-of-life power
stations in developed markets.• Wider adoption of the Digital Asset
throughout the life cycle of physical assets beyond the design phase.
Market drivers and opportunities• Wider adoption of the Digital Asset
throughout the life cycle of physical assets beyond the design phase.
• Growth in demand in emerging economies.
• Long-term global GDP growth.
Market drivers and opportunities• Wider adoption of the Digital Asset
throughout the life cycle of physical assets beyond the design phase.
• Greater adoption of the Digital Asset within industries such as Architecture, Engineering and Construction.
• Long-term global GDP growth and cyclical strength in industries such as Mining.
Oil & Gas
Power
Marine
Petrochemical & Chemical
Other
Key
14 AVEVA GROUP PLC ANNUAL REPORT AND ACCOUNTS 2017
CHIEF EXECUTIVE’S STRATEGIC REVIEWWHILST CONDITIONS REMAIN CHALLENGING IN OUR CORE OIL & GAS AND MARINE MARKETS, OUR BUSINESS HAS SEEN EXCELLENT SUCCESSES IN OUR KEY GROWTH INDUSTRIES.
As expected, AVEVA’s financial performance was resilient despite the challenging conditions in our core end markets. In addition to delivering solid results, we made good progress in delivering against our strategy during the year and in structuring the business to enable future growth. Revenue increased 7.1% to £215.8 million (2016 – £201.5 million), assisted by a currencytranslation benefit of 11.4%. Profitbefore tax grew to £46.9 million (2016– £29.4 million), supported by a strongfocus on cost control. On an adjustedbasis, profit before tax grew 7.4% to £55.0 million (2016 – £51.2 million).
On a regional basis, revenue in the Americas grew due to a strong performance in North America, partly offset by difficult market conditions in Latin America, specifically in Brazil. AVEVA’s performance in EMEA and Asia Pacific was robust in the context of the subdued Oil & Gas and Marine markets. Overall Group revenue declined in constant currency terms by 3.8%, although we did see an improvement in the second half. Excluding Latin America, Group revenue declined only 2.3% in constant currency terms for the full year, and was flat in the second half.
We made good progress in executing our strategy. On a constant currency basis, we delivered good growth with More Than 3D (MT3D), Owner Operators and sales to the Power sector.
The strength of our product offering was demonstrated by several key new business wins during the year. These included wins in both markets that offer growth opportunities for us and in our more mature product and geographic areas.
During the year, I took over as CEO and David Ward transitioned to the post of CFO. We have both been in the business for many years and were core to formulating AVEVA’s strategy. We plan to continue to pursue this strategy, with a sharp focus on execution and getting closer to our customers. As part of this, I have simplified AVEVA’s management structure with greater decision-making capabilities and direct accountability for performance being allocated to our regions. I have also added more customer-facing people to our Executive team, including a recently recruited Chief Revenue Officer, who will take overall responsibility for leading Global Sales, Partnership Management and Marketing.
James KiddChief Executive Officer
“ WE MADE GOOD PROGRESS IN DELIVERING AGAINST OUR STRATEGY DURING THE YEAR AND IN STRUCTURING THE BUSINESS TO ENABLE FUTURE GROWTH”
11.4%Constant currency growth in Power revenue
5.4%Constant currency growth in Owner Operator revenue

STRATEGIC REPORT 15STRATEGIC REPORT 15
Delivery against our strategy AVEVA’s strategy is to increase revenues by growing the addressable market for its products as the concept of the Digital Asset is more widely adopted; to sell a wider range of products; and to grow in industry and geographic verticals where the Group’s market share is underweight, versus the strength of its product offering.
Notwithstanding the cyclical headwinds in end markets that AVEVA has experienced in the recent past, we expect our strategy to deliver solid organic growth in the long term, across end market cycles.
The building blocks of this strategy are as follows.
• More than 3D: We see a major market opportunity in leveraging our customer base and market position by selling additional engineering software tools, extending beyond our core 3D design platforms. Further to this, information management tools such as AVEVA NET, can generate revenue throughout the operation life cycle of assets, therefore expanding the market that we address.
• Owner Operators: OOs such as energy and power generation companies currently only account for approximately 16% of our revenue. However, a significant market opportunity is developing as OOs increasingly adopt the Digital Asset concept to help them manage their physical assets throughout their life cycles.
• Growth markets: AVEVA generates approximately half of its revenue from EMEA. This largely relates to our heritage as a UK-based company. Over time, we intend to grow our revenues in key markets such as the USA and China, using the competitive advantages that our products offer.
• Broaden market exposure: We aim to grow our market share in industries beyond our core Oil & Gas and Marine markets, with a particular focus, in the short term, on Power, by applying the strength of our core technology and the rich knowledge of our people in these markets.
• Software as a Service (SaaS) and the Cloud: We intend to unify all of our applications onto a common Cloud platform to provide greater value to our customers and address a wider customer base.
CASE STUDY
GROWTH MARKETSAVEVA is an established global company with 50 offices in 30 countries. As such, we can provide customers with local sales and support in all of the world’s major economies. Notwithstanding this, AVEVA was not the first mover in some of the world’s key growth markets and therefore has underweight positions due to the ‘stickiness’ of customers to incumbent providers.
We believe that our products offer a strong advantage over competing offerings, due to their inherent integration based on our leading object-modelling technology, which reduces complexity and lowers the total cost of ownership for our customers. Our strategy is therefore to apply our competitive advantage to gain share in key target markets. We are enjoying considerable success in North America, where our strategy of leading with sales to Owner Operators, often with innovative MT3D product offerings, is delivering strong results.
18.9%AVEVA’s constant currency growth in North America
“ KEY GROWTH MARKET SUCCESSES DURING THE YEAR INCLUDED EXPANDING OUR BUSINESS WITH SOUTHERN COMPANY IN THE USA AND SINOPEC ENGINEERING GROUP IN CHINA.”
For details of our strategy see pages 8 to 9.
WWW.AVEVA.COM
16 AVEVA GROUP PLC ANNUAL REPORT AND ACCOUNTS 2017
CHIEF EXECUTIVE’S STRATEGIC REVIEW CONTINUED
More than 3D ‘MT3D’AVEVA’s MT3D sales grew during the year, increasing 2.1% on a constant currency basis. MT3D products represented 26.5% of total revenue, increasing from 25.2% in the prior year. Sales of our wider product suite have been a feature of this year’s key customer wins, with for example the AVEVA NET and AVEVA Engage information management tools helping to strengthen our offer to OOs.
We are also achieving success in leveraging our existing EPC (Engineering, Procurement and Construction) customer base to sell MT3D products. We have developed our technology to help deliver Building Information Management (BIM) projects in Infrastructure – not only to help satisfy any BIM mandate, but also to support faster, more effective project execution and handover through improved data management. A good example is Jacobs, who have used AVEVA technologies (AVEVA NET, AVEVA Engineering™ and AVEVA Information Standards Manager™) to meet their client’s information management and BIM level 2 requirements, and to achieve efficiency improvements for a UK highways project.
Owner OperatorsAVEVA’s sales to OOs also grew during the year, increasing 5.4% on a constant currency basis. OOs represented 16.2% of total revenue, increasing from 14.9% in the prior year. We had particular success in North America and Asia, where we won contracts in the Petrochemical & Chemical and Power sectors. These included KEPCO E&C, a leading global energy solutions provider based in South Korea, which chose AVEVA for a full range of 3D and MT3D design and information management products for its new nuclear power plant projects. Similarly, another leading power generation OO, Southern Company, in the USA, selected our design and information management tools to help improve project execution efficiency and asset information access. Meanwhile, we strengthened our relationship with Eastman, a global speciality chemical company.
Growth marketsWe enjoyed success in North America, where our local strategy of leading with sales to OOs and of MT3D products is working well, and we achieved significant new business wins. The business grew by 18.9% during the year on a constant currency basis. We continue to see growth potential in China, where successes during the year included expanding our business with Sinopec Engineering Group, which adopted AVEVA’s Integrated Engineering and Design solution for effective design, collaboration and improved efficiency. However, overall our business there was broadly flat during the year, being impacted by tougher market conditions, particularly in shipbuilding.
Broaden market exposureWe made good progress during the year in broadening our market exposure away from the cyclical Oil & Gas and Marine end markets. We enjoyed particular success in Power where revenue increased 11.4% on a constant currency basis during the year. Our software is well suited to creating and managing large complex projects, such as gas powered and nuclear power stations. During the year, we achieved several key wins within the Power market with Southern Company and TerraPower in the USA, KEPCO EPC in Korea and Japan Nuclear Fuel. We also achieved success in Paper & Pulp, where Valmet, the leading global developer and supplier of technologies, automation and services for the pulp, paper and energy industries, signed a multi-year agreement for AVEVA E3D.
AVEVA also enjoyed success in the steel fabrication market where sales increased by 10.0% on a constant currency basis as we continue to integrate and leverage the Bocad and FabTrol acquisitions.

STRATEGIC REPORT 17
“ ON A CONSTANT CURRENCY BASIS, WE DELIVERED GOOD GROWTH WITH MORE THAN 3D (MT3D), OOs AND SALES TO THE POWER SECTOR”
SaaS and the CloudWhile AVEVA’s business model already has the high level of recurring subscription revenues typically associated with Cloud delivery, we aim to be technologically ready to offer our products on a SaaS model in response to customer demand.
For the industries we serve, there are several challenges facing our customers which need to be overcome before there is a full transition to Cloud. However, over time we do expect that customers will want to explore ways of using the Cloud to drive efficiency and improve collaboration through the supply chain and operating cycle of their assets.
We launched our Cloud platform AVEVA Connect together with our first SaaS offering, Asset Visualisation, at the AVEVA World Summit in October 2016. AVEVA Connect is our SaaS ecosystem for Engineering, Design and Information Management solutions. Asset Visualisation is our new Information Management as a Service offering. There is a willingness from the OOs to move towards SaaS for the provision of the Digital Asset and we expect these products to gain traction with major customers in the medium term.
In April this year, we launched a second SaaS offering on AVEVA Connect, Information Standards Management. The Sales team has now been equipped to sell these solutions and we have brought on board several major oil Owner Operators as early adopters. Both Asset Visualisation and Information Standards Management provide entry points for our Owner Operator customers to access Digital Asset-as-a-Service solutions flexibly and cost effectively.
Our technologyOur software is used by customers as they design, build and operate large capital-intensive assets, mainly in the Process, Power and Marine industries. Our vision is for the widespread adoption of constantly-evolving Digital Assets, enabling our customers to manage continual change as they design, build and operate some of the world’s most complicated physical assets.
We believe that our products offer a strong advantage over competing offerings, due to their inherent integration based on our leading object modelling technology, which reduces complexity and lowers the total cost of ownership for our customers.
AVEVA’s heritage is in 3D design, where our core products are AVEVA PDMS (Plant Design Management System), AVEVA E3D and AVEVA Marine products. These products represented 73.5% of 2016/17 revenues. AVEVA E3D is the latest generation 3D product which carries a price premium reflecting its higher productivity and advanced feature set.
AVEVA E3D grew strongly during the year as existing customers continued to migrate towards it and new contracts were won. It contributed almost 13% of total revenue, up from below 10% in the prior year.
Within More than 3D, the largest product sets are schematics applications such as Piping and Instrumentation Diagram (P&ID), Instrumentation & Electrical applications and our unique multi-discipline AVEVA Engineering solution; together with information management applications such as AVEVA NET. These areas grew during the year with strong growth in information management sales particularly to the Owner Operators.

18 AVEVA GROUP PLC ANNUAL REPORT AND ACCOUNTS 2017
CHIEF EXECUTIVE’S STRATEGIC REVIEW CONTINUED
Our markets and our customersAVEVA’s key end markets are Oil & Gas, Marine, Power and Petrochemical & Chemical. Other markets we serve include Architecture, Construction & Steel Fabrication, Mining & Minerals Processing, Paper & Pulp and Pharmaceuticals. Oil & Gas accounts for 40–45% of revenue, Marine 20%, Power 15–20%, Petrochemical & Chemical 10% and the remainder 10%.
AVEVA has four main groups of customers. These are EPCs, shipyards, OOs and Fabricators.
EPCs primarily use AVEVA’s software to design and build industrial assets, such as oil platforms, power stations and process plants for OOs. Demand from EPCs for AVEVA’s products is therefore impacted by end market demand and particularly the level of capital expenditure on new installations and brownfield projects. AVEVA has strong long-standing relationships with many leading EPCs. The large, global EPCs are managed as strategic partnerships through AVEVA’s Global Accounts programme.
OOs are key to achieving AVEVA’s vision of a constantly-evolving Digital Asset. Whereas historically the Digital Asset was core only to the design phase of physical assets, it is now widely accepted that Digital Assets can help OOs to drive efficiency and reduce risk through minimising downtime and unplanned outages, while complying with ever more stringent environmental and safety legislation.
We won 9 new OO customers during the year and significantly expanded our business with several existing OO customers.
Oil & GasIn the Oil & Gas industry, end-market demand was weak, with global industry capital expenditure falling by over 40% between calendar 2014 and calendar 2016 (Sources: Barclays, Bank of America Merrill Lynch).
This decline had a significant impact on the workloads of our EPC customers, with the more complex (and therefore design-intensive) greenfield upstream and offshore projects being impacted most significantly. This impacted demand for our software.
EPC customers tend to favour a rental model for software, meaning that their spend with AVEVA adjusts to market demand relatively quickly and some EPCs have reduced their seat count reflecting lower activity. There was also some consolidation amongst EPCs and in the oil services sector more generally. However, as OOs seek to extend the life of existing assets, we saw an increase in revamps and modifications (known as brownfield projects), which helped to sustain a level of demand from EPCs, although these projects are typically shorter in duration and lower in value.
Due to the downturn in the Oil & Gas industry, OOs are putting pressure on EPCs to reduce the cost of capital projects, often by up to 50%. This is putting pressure on the margins of the EPCs and they have been forced to look at how they become more efficient and reduce the cost of projects. EPCs are also increasingly looking to technology to help drive efficiency in projects. Our integrated engineering and design approach, which helps manage the engineering data across the different engineering disciplines, is receiving very positive feedback, enabling customers to reduce the total cost of ownership compared to our competition.
An area of focus for EPCs has been around reducing the cost of supporting, maintaining and developing in-house systems by looking to third-party vendors such as AVEVA to replace these with commercial software products.
STRATEGIC REPORT 19
This is particularly pronounced around materials procurement and construction management, given that many still use in-house systems in these areas. As such we are seeing significant interest in our Enterprise Resource Management product.
We are also seeing EPCs start to consider standardising their engineering technology strategy on one toolset and we believe that we are well positioned to capitalise on that trend.
Oil & Gas industry capital expenditure is forecast to increase in future years as investments are made to maintain production and reserves. There are early signs of improvement in the market, however the exact timing of a market recovery is difficult to predict.
MarineAVEVA is a market leader in Marine design software, with customers including 90% of the world’s largest shipyards. The Marine market is in a cyclical trough, with a relatively low number of new ship builds ongoing. Shipyard customers typically prefer an Initial Licence Fee model, because they view software as a longer-term investment rather than being project specific. This results in annual maintenance payments continuing even in tougher market conditions. Our recurring revenue from the Marine market was broadly flat during the year.
We are also winning significant new business in the sector, with new wins in Europe, including a customer focused on cruise ships, and in Asia, where we won a major South East Asian customer focused on Marine and offshore capital projects.
As with Oil & Gas, the Marine market is forecast by commentators such as Clarksons Research to recover from the current trough conditions. We expect activity to increase as overcapacity in the world fleet reduces and demand for specialist ships such as Floating Production, Storage and Offloading vessels and naval vessels grows, although again, the exact timing of a market recovery is difficult to predict.
CASE STUDY
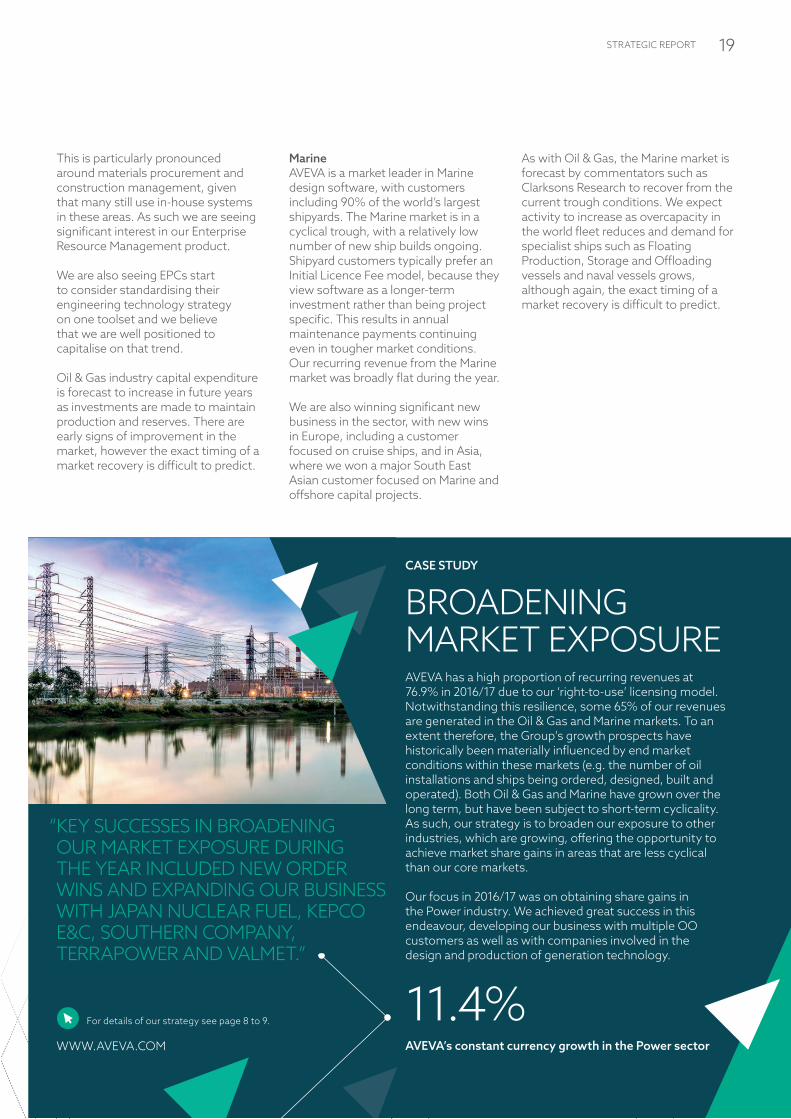
BROADENING MARKET EXPOSUREAVEVA has a high proportion of recurring revenues at 76.9% in 2016/17 due to our ‘right-to-use’ licensing model. Notwithstanding this resilience, some 65% of our revenues are generated in the Oil & Gas and Marine markets. To an extent therefore, the Group’s growth prospects have historically been materially influenced by end market conditions within these markets (e.g. the number of oil installations and ships being ordered, designed, built and operated). Both Oil & Gas and Marine have grown over the long term, but have been subject to short-term cyclicality. As such, our strategy is to broaden our exposure to other industries, which are growing, offering the opportunity to achieve market share gains in areas that are less cyclical than our core markets.
Our focus in 2016/17 was on obtaining share gains in the Power industry. We achieved great success in this endeavour, developing our business with multiple OO customers as well as with companies involved in the design and production of generation technology.
11.4%AVEVA’s constant currency growth in the Power sector
“ KEY SUCCESSES IN BROADENING OUR MARKET EXPOSURE DURING THE YEAR INCLUDED NEW ORDER WINS AND EXPANDING OUR BUSINESS WITH JAPAN NUCLEAR FUEL, KEPCO E&C, SOUTHERN COMPANY, TERRAPOWER AND VALMET.”
For details of our strategy see page 8 to 9.
WWW.AVEVA.COM

20 AVEVA GROUP PLC ANNUAL REPORT AND ACCOUNTS 2017
CHIEF EXECUTIVE’S STRATEGIC REVIEW CONTINUED
PowerWe had significant success in the Power market during the year, winning several new contracts with both utilities and power systems design companies.
Longer-term trends in the Power market are positive as the world’s emerging economies invest in their power generation requirements and the ageing infrastructure of the developed world is maintained and replaced.
In the shorter term, AVEVA benefited from market share gains and requirements from operators in the sector for both design and information management tools, as they seek to improve asset efficiency.
Petrochemical & ChemicalWe saw ongoing investment in the sector during the year, particularly in Asia, with stable market conditions on a global basis. AVEVA enjoyed success in winning new OO customers in Asia during the year in the refining sector.
Other marketsConditions in AVEVA’s other markets are less subject to cyclical volatility, meaning that AVEVA can grow in a more linear fashion through the execution of its strategy. Notable developments during the year included solid constant currency growth in sales to fabricators and a new OO customer win in the Pharmaceutical sector.
In the Fabrication sector, AVEVA provides integrated end-to-end solutions for 3D modelling, detailing and fabrication of structural steelwork. This enables rapid, high-quality fabrication and construction for on-time, on-budget, integrated project execution for customers specialising in the engineering, manufacturing and assembly of advanced steel structures. In 2016/17 our revenue from Fabricator customers increased 10.0% on a constant currency basis.
OutlookWe believe that AVEVA has both the market opportunity and the right strategy to deliver substantial growth over the longer term.
In the short term, demand cycles within our end markets have had an impact on growth. Our core markets of Oil & Gas and Marine, which together account for over 60% of Group revenue, have been in a cyclical trough over the last three years.
There are early signs of improvement in Oil & Gas. Although the timing of a full recovery in demand is still uncertain, we expect that as the headwinds lessen, the growth resulting from our strategic initiatives will begin to show at the Group level.
The Board remains confident in the long-term strength of AVEVA’s business model, the deliverability of its organic growth strategy and its positioning to benefit from a recovery in our end markets.
James KiddChief Executive Officer23 May 2017

STRATEGIC REPORT 21
KEY PERFORMANCE INDICATORSWe aim to deliver good sustainable growth, balanced by our need to continue to invest in innovation, sales and marketing in order to achieve this. The goal is to deliver profitable growth as the business expands, whilst maintaining a healthy balance sheet. We have set out a range of key performance
indicators (KPIs) that help to present a meaningful picture of how AVEVA is performing. Taken overall, we believe that this range of KPIs – which offers insights into our revenue, investment, profitability, and cash generation – illustrates the high levels of recurring revenue, strong margins and ability to convert profits to cash effectively that are features of our business.
Our markets continued to be difficult over the past year, particularly in Oil & Gas, and that is reflected in the KPI trends. It is noteworthy that our recurring revenue was relatively stable, the adjusted profit before tax margin increased, and our business remains highly profitable.
RevenueGrowth in Group revenue
£215.8M(+7%)Assisted by currency tailwinds
Recurring revenue Provides visibility
£166.0M(+8%)Resilient performance
Adjusted profit before tax We adjust to exclude non-operating items
£55.0M (+7%)Due to increased revenue
R&D expenses Investment in innovation
£31.9M (–1%)Lower cost operations but headcount up
Adjusted basic EPS We adjust to exclude certain non-cash and exceptional items
67.0p (+8%)Higher profit in year
Adjusted effective tax rate Higher than the UK rate of 21% due to overseas operations
22.1% (2016 – 22.5%)
More than 3D revenue A key strategic growth objective
£57.1M (+13%)These tools help address the whole life cycle of Digital Assets
Owner Operator revenueA key strategic end-market growth objective
£35.0M (+17%)OOs are increasingly adopting the Digital Asset concept
Employee numbersA measure of how the business is changing
1,707(2016 – 1,706)A stable workforce
Operating cash flow before taxAVEVA remains highly cash generative
£57.2M (+58%)Prior year impacted by higher exceptional costs, but current year strong as a result of particular focus on cash management
Cash conversion A measure of our ability to turn profits into cash
122% (2016 – 123%)Strong cash collection
Adjusted profit before tax marginWe aim to deliver profitable growth
25.5% (2016 – 25.4%)Remains highly profitable

22 AVEVA GROUP PLC ANNUAL REPORT AND ACCOUNTS 2017
CTO’S REVIEWAVEVA’S SUCCESS IS DRIVEN BY THE STRENGTH OF OUR TECHNOLOGIES AND PEOPLE TO DELIVER HIGHLY-DIFFERENTIATED SOLUTIONS FOR THE MARKETS WE SERVE. WE CONTINUED TO ENHANCE OUR EXISTING PRODUCTS AND TO DEVELOP NEW OFFERINGS DURING THE YEAR THROUGH OUR DEVELOPMENT CENTRES, AND CONTINUED TO EXPAND OUR PRESENCE IN HYDERABAD TO ACCESS AN EXCELLENT POOL OF TALENT.
Overview50 years of innovation have produced industry-leading software that is used by our customers to create Digital Assets, that allow them to manage continual change as they design, build and operate some of the world’s most complicated physical assets.
As technology evolves, with ever-greater processing power, connectivity, mobility of computing platforms and the Industrial Internet of Things, our vision for the widespread adoption of constantly-evolving Digital Assets is becoming ever more compelling.
We believe that our products offer a strong advantage over competing offerings. This is due to their inherent integration based on our leading object-modelling technology, which reduces complexity and lowers the total cost of ownership for our customers. In an increasingly connected world, openness to access information sources, either third-party or customer owned, is proving business-critical to our customers.
Supporting our strategyAVEVA’s strategy is to increase revenues by growing the addressable market as the concept of the Digital Asset is more widely adopted, to sell a wider range of products, and to grow in industry and geographic verticals where the Group’s market share is underweight versus the strength of its product offering.
We are continually developing our technology to support this strategy and at the same time accommodating the needs of customers in what are inherently ‘safety first’ industries for application and data continuity.
Our heritage is in 3D design, where our core products are AVEVA PDMS, AVEVA Everything3D (AVEVA E3D) and AVEVA Marine products. AVEVA E3D is the latest-generation 3D product which carries a price premium reflecting its higher productivity and advanced feature set.
AVEVA E3D was launched in 2013 and is being developed further each year. We are now seeing real traction in customer uptake. Sales grew strongly during the year as existing customers continued to migrate towards it and new contracts were won. AVEVA E3D contributed almost 13% of total revenue, up from just below 10% in the prior year.
More than 3D (MT3D)Within MT3D, the largest product sets are schematics applications such as P&ID, Instrumentation and Electrical applications and our unique multi-discipline AVEVA Engineering solution; together with information management applications such as AVEVA NET and AVEVA Engage.
£300MResearch & Development spend over the last decade
36%Increase in AVEVA E3D revenue in the last year
Dave WheeldonChief Technology Officer and Deputy CEO

STRATEGIC REPORT 23
We have continued our focus on developing our MT3D products during 2016/17, for example with continuous improvements to AVEVA Engage and exciting developments around our Instrumentation and Electrical applications. AVEVA Engage in particular started to gain real traction in 2016/17. When it was launched in 2015, Engage created a new benchmark in information accessibility through combining ultra-high performance visualisation with application-agnostic access to information via large-format touch devices and it has now become a feature of many of our key new OO customer wins.
SaaS and the CloudWe launched our first public Cloud products AVEVA Connect™ and AVEVA NET Connect at the AVEVA World Summit in October 2016. AVEVA Connect is our SaaS ecosystem for Engineering, Design and Information Management products. AVEVA NET Connect is our new Information Management-as-a-Service offering.
AVEVA Connect will deliver new opportunities to drive down IT costs, improve flexibility to scale software usage to meet project demand, and increase focus on core business activities without compromising security or user experience. With AVEVA NET Connect, the Digital Asset will have the capability to be rapidly deployed in the Cloud, allowing cross-disciplinary teams to collaborate and share information with complete clarity on the engineered status of the entire project or operating asset. This will enable greater collaboration between all parties in the supply chain, and better decision making by asset operators.
VIRTUAL REALITYSome of our graduates using our HoloLens-compatible software
Further to this, we recently completed the development of our SaaS-based Information Standards Management tools. Throughout our history we have partnered with our customers to develop new ways in which technology can deliver business benefits and in this case we are working with several major Owner Operators as early-adopter customers. Both Asset Visualisation and Information Standards Management provide entry points for our Owner Operator customers to access Digital Asset Software-as-a-Service solutions flexibly and cost effectively.
Looking to the futureWe maintain our continued focus on delivering innovation, seeking to transform how activities are undertaken or even by eliminating entire steps in business processes. Our goal is to enhance efficiency, drive down costs and improving quality and business agility for our customers.
Over the last decade AVEVA has spent nearly £300 million on Research & Development and we will continue our investments to remain at the leading edge of technology.
While our R&D costs fell by 1.0% on a constant currency basis during 2016/17, this reflected efficiencies achieved through expanding our presence in Hyderabad, India and reducing costs in other locations. Overall capabilities were not reduced.
Our development efforts are focused on extending the competitiveness of our existing products, developing our Cloud platform, enhancing our MT3D product suite and on developing exciting new technologies to support growth in the longer term. An interesting example of this is our current development work around augmented and virtual reality, where we are developing the capacity to let customers ‘feel’ the experience of being inside their models and data.
We will continue to innovate and work closely with our customers in this coming year and I look forward to reporting back to you with our progress.
Dave WheeldonChief Technology Officer and Deputy CEO23 May 2017

24 AVEVA GROUP PLC ANNUAL REPORT AND ACCOUNTS 2017
David WardChief Financial Officer
AVEVA delivered a solid performance in the financial year ended 31 March 2017. Reported revenue and profit showed growth over the previous year and cash generation was particularly strong. We ended the year with £130.9 million in net cash and no debt (2016 – £107.9 million).
Overview of financial progressTotal revenue for the year was £215.8 million which was up 7.1% compared to the previous year (2016 – £201.5 million) and reported profit before tax was £46.9 million which was up 59.5% compared to the previous year (2016 – £29.4 million). On an adjusted basis, profit before tax was £55.0 million which was an increase of 7.4% (2016 – £51.2 million).
The weakening of Sterling had the impact of increasing reported revenues and costs by 11.4% and 9.4% respectively, reflecting the significant overseas operations of the Group. On a constant currency basis revenue declined 3.8%, although the rate of reduction decelerated during the year, with the second half being minus 2.1% on a constant currency basis, or broadly flat excluding the impact of the difficult market in Latin America.
RevenueRevenue modelThe Group sells its proprietary software products by licensing rights to use the software directly to customers through our network of global sales offices. We operate a ‘right-to-use’ licensing model. Customers can choose to pay Initial Licence Fees, followed by lower mandatory Annual Fees to cover support, maintenance and upgrades; or Rental Licence Fees. The latter are usually paid upfront on an annual basis.
Over a long period, it is usually cheaper for a customer to adopt the Initial Licence Fee model. However, many customers, particularly EPCs, prefer to view software as a more flexible operational expense which can be charged to a project, as opposed to a capital expense and therefore use the rental model.
AVEVA also generates revenue from Training and Services. This is typically associated with the implementation of new installations, customisation to meet specific customer requirements and end user training.
Revenue by categoryAVEVA generated 14.9% of revenue from Initial Licence Fees, 33.3% of revenue from Annual Fees, 43.6% of revenue from Rental Licence Fees, and 8.2% from Training and Services. Recurring revenue, which consists of Annual Fees and Rental Licence Fees, increased by 7.8% to £166.0 million (2016 – £154.0 million), representing 76.9% of revenue (2016 – 76.4%).
7.1%Increase in reported revenue
7.4%Increase in adjusted profit before tax
FINANCE REVIEWAVEVA DELIVERED A SOLID PERFORMANCE IN THE YEAR, WITH A RETURN TO GROWTH IN BOTH REVENUE AND PROFIT, AND EXCELLENT CASH CONVERSION.
STRATEGIC REPORT 25
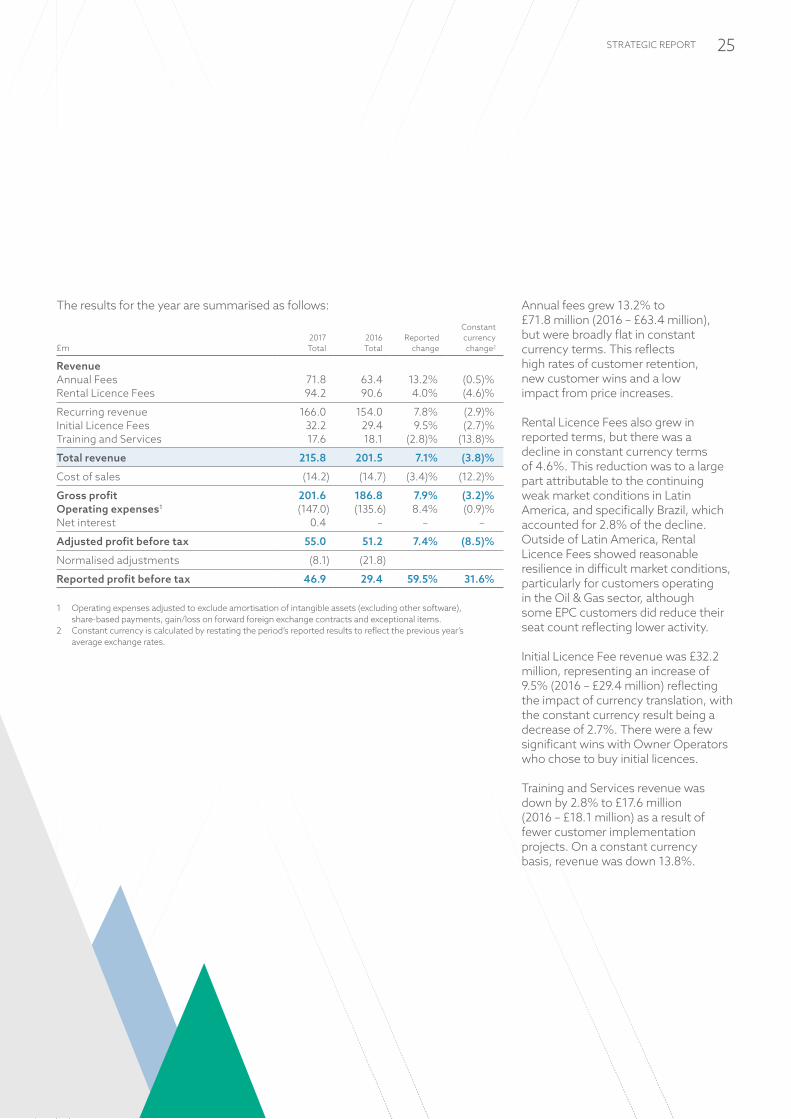
The results for the year are summarised as follows:
£m2017Total
2016Total
Reported change
Constant currency change2
RevenueAnnual Fees 71.8 63.4 13.2% (0.5)%Rental Licence Fees 94.2 90.6 4.0% (4.6)%
Recurring revenue 166.0 154.0 7.8% (2.9)%Initial Licence Fees 32.2 29.4 9.5% (2.7)%Training and Services 17.6 18.1 (2.8)% (13.8)%
Total revenue 215.8 201.5 7.1% (3.8)%
Cost of sales (14.2) (14.7) (3.4)% (12.2)%
Gross profit 201.6 186.8 7.9% (3.2)%Operating expenses1 (147.0) (135.6) 8.4% (0.9)%Net interest 0.4 – – –
Adjusted profit before tax 55.0 51.2 7.4% (8.5)%
Normalised adjustments (8.1) (21.8)
Reported profit before tax 46.9 29.4 59.5% 31.6% 1 Operating expenses adjusted to exclude amortisation of intangible assets (excluding other software),
share-based payments, gain/loss on forward foreign exchange contracts and exceptional items.2 Constant currency is calculated by restating the period’s reported results to reflect the previous year’s
average exchange rates.
Annual fees grew 13.2% to £71.8 million (2016 – £63.4 million), but were broadly flat in constant currency terms. This reflects high rates of customer retention, new customer wins and a low impact from price increases.
Rental Licence Fees also grew in reported terms, but there was a decline in constant currency terms of 4.6%. This reduction was to a large part attributable to the continuing weak market conditions in Latin America, and specifically Brazil, which accounted for 2.8% of the decline. Outside of Latin America, Rental Licence Fees showed reasonable resilience in difficult market conditions, particularly for customers operating in the Oil & Gas sector, although some EPC customers did reduce their seat count reflecting lower activity.
Initial Licence Fee revenue was £32.2 million, representing an increase of 9.5% (2016 – £29.4 million) reflecting the impact of currency translation, with the constant currency result being a decrease of 2.7%. There were a few significant wins with Owner Operators who chose to buy initial licences.
Training and Services revenue was down by 2.8% to £17.6 million (2016 – £18.1 million) as a result of fewer customer implementation projects. On a constant currency basis, revenue was down 13.8%.

26 AVEVA GROUP PLC ANNUAL REPORT AND ACCOUNTS 2017
Cost focusAVEVA has a largely fixed cost base, albeit with some annual inflation embedded within it. We exercised strong cost control during the financial year in the context of the difficult end market conditions. We have, however, maintained adequate levels of investment in R&D and sales capabilities to ensure that we can execute our strategy and grow sales over the medium and long term.
Overall, in constant currency terms, operating costs were 0.9% lower than the previous year with the effect of cost management actions more than compensating for inflationary pressures and planned areas of investment.
We continue to have a focused and disciplined approach to managing the cost base. During the year we undertook some restructuring activity, which included headcount reductions in Latin America and corporate management.
FINANCE REVIEW CONTINUED
An analysis of revenue by geography is set out below.
£m Asia Pacific EMEA Americas Total
2017 76.3 106.6 32.9 215.82016 71.6 101.6 28.3 201.5Change 6.6% 4.9% 16.3% 7.1%Constant currency change (6.4)% (4.2)% 3.9% (3.8)%
An analysis of operating expenses on a normalised basis is set out below.
£mResearch &
DevelopmentSelling and
distributionAdministrative
expenses Total
As reported 31.9 93.0 31.9 156.8Normalised adjustments (4.7) (3.8) (1.3) (9.8)
Normalised costs 27.2 89.2 30.6 147.0
2016 25.7 83.2 26.7 135.6
Change 5.8% 7.2% 14.6% 8.4%
Constant currency change (1.2)% (3.1)% 6.0% (0.9)%
Regional executionOn a regional basis, the Group performed well in the Americas. Sales were particularly strong in North America, although the difficult market conditions in Latin America caused a further decline in revenues in that region. AVEVA’s performance in EMEA and Asia Pacific was robust in the context of the subdued Oil & Gas and Marine markets.
Reported revenue was impacted by a £22.0 million (11.4%) benefit related to foreign exchange translation. Around 20% of the Group’s revenues were in each of Sterling and Euros and the US dollar was the next most material currency at around 15%.
Asia PacificRevenue from the Asia Pacific region was £76.3 million (2016 – £71.6 million) and increased 6.6% over the prior year but declined 6.4% in constant currency terms. More specifically, we saw strong performance in Japan with a few significant new wins, but marginally weaker performance in South Korea and India, in the face of a tough market for Marine. Our businesses in China and South East Asia were broadly flat when compared to the prior year.
EMEAIn EMEA revenue grew 4.9% to £106.6 million (2016 – £101.6 million). Market conditions in EMEA have been reasonably stable, but remain challenging for customers with heavy exposure to Oil & Gas. However, we saw real growth in Germany and Finland where we won business in Paper & Pulp and revenue from Central and Southern Europe was higher in reported terms but performance in constant currency terms was slightly down on the prior year. Our businesses in Russia and the Middle East performed broadly in line with last year.
Training and Services revenue declined from the prior year as a number of implementation projects were completed.
AmericasIn the Americas revenue grew 16.3% to £32.9 million (2016 – £28.3 million) with a very strong performance in North America being partly offset by ongoing weakness in Latin America, where revenues have now declined to a level that is no longer material to the Group.
Our performance in North America was very pleasing with revenue in the USA increasing 18.9% in constant currency terms, following the aforementioned customer wins with Southern Company, TerraPower and a very large global industrial company.Market conditions in Brazil remained very tough through 2016/17 and our revenues from Latin America more than halved over the prior year, on both a reported and constant currency basis. We took action during the second half of the year to right-size our team there for the reduced market size.

STRATEGIC REPORT 27
Normalised items include amortisation of intangibles (excluding other software) of £5.8 million (2016 – £5.6 million), share-based payments of £1.1 million (2016 – £0.5 million), gains on fair value of forward foreign exchange contracts of £0.7 million (2016 – loss of £0.4 million) and exceptional items of £3.6 million (2016 – £15.2 million).
Research & Development costs were broadly flat on a normalised constant currency basis reflecting a few strategic investments and efficiencies achieved through expanding our presence in Hyderabad, India and reducing costs in other locations. Overall our average R&D headcount through the year increased by 12%.
Selling and distribution expenses include the costs of our direct sales force as well as our regionally based technical support and marketing teams and in total were £89.2 million in the year 2016/17. The cost of these teams decreased by 3.1% on a constant currency basis principally due to a lower bad debt charge than in the prior year of £0.6 million (2016 – £3.4 million).
Administrative expenses increased 6.0% (or £1.6 million) on a constant currency basis, with the increase due to some minor investments in the HR team and a small increase in the cost of staff bonuses.
Exceptional itemsDuring the year, the Group incurred exceptional costs of £1.9 million (2016 – £15.2 million). These included restructuring costs of £4.2 million, which were partly offset by factors including an indemnified receivable claim relating to a previous business combination. The restructuring costs related to the rationalisation of offices and reduction in headcount in specific areas of the business. Also included are the redundancy costs incurred in eliminating the Regional Operations layer of management as part of the initiative to structure the business with clearer lines of accountability.
Prior year exceptional items included professional fees of £10.5 million, principally for legal and financial due diligence services related to the aborted Schneider Electric transaction and exceptional restructuring costs of £4.5 million.
Profit before taxAdjusted profit before tax was £55.0 million (2016 – £51.2 million), an increase of 7.4%, principally caused by the growth in revenue. This resulted in an adjusted profit margin of 25.5% (2016 – 25.4%).
Reported profit before tax was £46.9 million (2016 – £29.4 million). The growth of 59.5% was principally due to growth in revenue and reduction in exceptional items as described above.
TaxationThe Group’s effective tax rate, on an adjusted basis, has steadily declined over recent years in line with the reductions seen in UK corporation tax. The adjusted effective tax rate for the 2016/17 financial year was 22.1%, which represented a further reduction from 2016 when the rate was 22.5%. We see this trend continuing as the UK corporate rate reduces and we increasingly benefit from Patent Box relief.
The headline, or unadjusted, effective rate for the year was 18.8% (2016 – 30.4%). The prior year rate was impacted by non-deductible acquisition-related exceptional costs of £10.5 million (see above).
DividendsWith consistent and strong cash flows and no net debt, the Group retains considerable financial flexibility. The Board remains focused on delivering growth both organically and through acquisitions. Our strong cash flows underpin the Board’s sustainable, progressive dividend policy, which is balanced against keeping cash available for M&A opportunities, with excess capital being returned to shareholders from time to time.
The Board is proposing a final dividend of 27.0 pence per share, taking the total dividend for the year to 40.0 pence (2016 – 36.0 pence per share), an increase of 11.1%. The dividend will be payable on 4 August 2017, to shareholders on the register on 7 July 2017.
As announced previously, we have rebalanced the interim and final dividends, with more of the total dividend being paid at the interim. As a result, the final dividend proposed for 2016/17 of 27.0 pence is slightly lower than the final dividend paid in respect of 2015/16 (30.0 pence per share).
£57.2MOperating cash flow before tax
66.81PAdjusted diluted EPS

28 AVEVA GROUP PLC ANNUAL REPORT AND ACCOUNTS 2017
FINANCE REVIEW CONTINUED
Earnings per shareBasic earnings per share was 59.52 pence and increased 85.8% (2016 – 32.03 pence) and diluted earnings per share were 59.36 pence (2016 – 31.96 pence).
On an adjusted basis, EPS increased 8.0% to 66.98 pence (2016 – 62.04 pence) and to 66.81 pence on a diluted basis (2016 – 61.91 pence).
Balance sheet and cash flowsAVEVA continues to maintain a strong balance sheet and has no debt. Net assets at 31 March 2017 were £220.7 million compared to £201.0 million at 31 March 2016.
Non-current assets increased marginally to £89.9 million (2016 – £87.5 million) principally due to foreign currency translation effects. During the year we purchased intangible software rights for a total of £2.3 million, which provided valuable additional functionality for our products.
Working capitalGross trade receivables at 31 March 2017 were £91.1 million which was broadly in line with last year (2016 – £94.5 million). We again saw a strong finish to the year with a large number of our Global Account renewals occurring in the final quarter. This resulted in billings being more weighted towards the end of the period, although Q4 cash collections were marginally stronger than in 2015/16.
The bad debt provision at 31 March 2017 of £6.1 million was similar in scale to the level held at the previous year end of £5.9 million.
Deferred income remained stable at 31 March 2017 and was £45.9 million compared to £46.9 million at 31 March 2016. Trade and other payables were higher than the prior year at £42.9 million (2016 – £37.2 million).
Cash generationNet cash (including treasury deposits) at 31 March 2017 was £130.9 million compared to £107.9 million at 31 March 2016.
Cash generated from operating activities before tax was £57.2 million (2016 – £36.1 million), with large parts of this improvement being due to the increased profit recorded in 2016/17 and the high exceptional costs incurred and paid in 2015/16.
PensionsOn an accounting basis, the Group’s net retirement benefit obligations decreased from £5.2 million last year to £2.6 million. This was principally caused by the valuation of the UK defined benefit pension scheme moving from a deficit of £2.3 million to a surplus of £1.2 million driven by employer contributions of £1.6 million and strong asset returns over the period. Since March 2015, the UK defined benefit pension scheme has been closed to future accrual.
Capital structureAt 31 March 2017, the Group had 63,975,869 shares of 3 5/9p each in issue (2016 – 63,961,113 shares). During the year the AVEVA Group Employee Benefit Trust 2008 (‘the Trust’) purchased 2,160 ordinary shares in the Company in the open market at an average price of £18.68 per share for total consideration of £40,349 in order to satisfy awards made under the AVEVA Group Management Bonus Deferred Share Scheme 2008. At 31 March 2017, the Trust owned 10,857 ordinary shares in the Company. 13,380 shares (2016 – 26,791) with an attributable cost of £296,431 were issued to employees in satisfying share options that were exercised.
Treasury policyThe Group treasury policy aims to ensure that the capital held is not put at risk and the treasury function is managed under policies and procedures approved by the Board. These policies are designed to reduce the financial risk arising from the Group’s normal trading activities, which primarily relate to credit, interest, liquidity and currency risk. The Group is, and expects to continue to be, cash positive and at 31 March 2017 held net cash of £130.9 million. The treasury policy includes strict counterparty limits.
David WardChief Financial Officer23 May 2017

STRATEGIC REPORT 29
PrincipalrisksC
orpo
rate risk register
Fu
nctional risk registersPRINCIPAL RISKS AND UNCERTAINTIESAVEVA FACES A NUMBER OF POTENTIAL RISKS AND UNCERTAINTIES WHICH COULD HAVE A MATERIAL IMPACT ON THE GROUP’S LONG-TERM PERFORMANCE. THE BOARD IS RESPONSIBLE FOR DETERMINING THE NATURE OF THESE RISKS AND ENSURING APPROPRIATE MITIGATING ACTIONS ARE IN PLACE TO MANAGE THEM EFFECTIVELY.
Risk management processThe Board retains ultimate responsibility for the Group’s risk management and as part of this, regularly completes a review of the Group Risk Register and an assessment of the adequacy of the mitigating controls identified by management. To aid this process a Risk Committee comprising senior management from each function of the business was formed in 2015/16. The Risk Committee is chaired by the CFO and reports jointly to the Board and the Executive team.
The Risk Committee meets at least twice a year and has responsibility for considering risk appetite, risk identification, risk quantification/qualification and the determination of mitigating internal controls. The Risk Committee is not responsible for internal audit activities which remain under the responsibility of the Audit Committee. More details of AVEVA’s assessment of internal controls is included within the Audit Committee report on pages 44 to 46 of the Corporate Governance section of the Directors’ report.
The Risk Register was compiled after considering three main risk characteristics – likelihood, size of impact and timeframe for when the risk may impact the Group. Likelihood was assessed on a net risk basis (i.e. after the operation of internal controls) as the Risk Committee considered this gave a more robust view of the risks currently faced by AVEVA. Separately, the Audit Committee has responsibility for determining the appropriate level of review required to ensure that internal controls are operating as designed.
This year we have continued to improve our risk management process, by drafting departmental risk registers to supplement the Group Risk Register. Next year we intend that the highest risks from each departmental register are considered for inclusion on the Group Risk Register.
The updated Group Risk Register was ultimately reviewed and approved by the Board and in the context of the assessment of viability the Board considered which risks, and combination of risks, would threaten the viability of the Company.
The principal risks faced by the Group are set out on pages 30 to 31, and include indicators of the financial impact, likelihood and whether the risk has increased or decreased in significance since the last review.
Viability StatementIn accordance with the revised UK Corporate Governance Code, the Directors have assessed the Group’s prospects and viability over a period significantly longer than the outlook of the going concern statement of 12 months. The Directors have determined that the appropriate period is three years, corresponding with the period covered by the Group’s business planning cycle.
The Directors considered the principal risks in plausible but severe scenarios and assessed the potential impact of a decline in the Group’s revenue caused by a period of sustained low economic growth resulting in low levels of capital investment and this was combined with an unfavourable foreign exchange assumption.
Based on this assessment, the Directors have considered the Group’s current position and principal risks, and have a reasonable expectation that the Group will be able to continue in operation and meet its liabilities as they fall due over a three-year period.
In making this statement, the Directors have also made the following assumptions:• oil prices will stay relatively flat
for the next three years• Brexit will not unduly affect current
trading or existing customer contracts or relationships
• our internal controls in mitigation of a significant proportion of the risks on the register continue to operate effectively.
Going concern statementThe Group has significant financial resources, is profitable, has high levels of recurring revenue and has a strong position in the markets it serves. At 31 March 2017, the Group had cash and treasury deposit balances of £130.9 million (2016 – £107.9 million) and no debt. Therefore, after making enquiries and considering the cash flow forecasts for the Group, the Directors have a reasonable expectation that the Group has adequate resources to continue in operational existence for the foreseeable future. For this reason they continue to adopt the going concern basis of accounting in preparing the financial statements.

30 AVEVA GROUP PLC ANNUAL REPORT AND ACCOUNTS 2017
PRINCIPAL RISKS CONTINUED
STRATEGIC AND MARKET RISKS
Risk change from 2016
No change
Risk decreased
Risk increased
Risk level
Low
Medium
High
Strategies
1 More than 3D (MT3D)
2 Owner Operators
3 Growth markets
4 Broadening market exposure
5 SaaS and the Cloud
Risk Likelihood Impact Change Mitigation Strategy
Dependency on key marketsAVEVA generates a substantial amount of its income from customers whose main business is derived from capital projects in the Oil & Gas, Power and Marine markets. Currently, some of AVEVA’s vertical end markets are under pressure with lower oil prices and inevitably this is having an impact on the Group’s revenues. As the availability of capital expenditure returns to our key markets, particularly Oil & Gas, the balance may shift away from our traditional core sector of complex off-shore projects, towards simpler on-shore projects, such as shale gas extraction. The risk of this further reinforces our need for market diversification.
AVEVA is expanding into other market segments such as Power, Petrochemical & Chemical and Construction, albeit from a relatively small base. It is central to our strategy to diversify our customer offerings into Owner Operators and Plant operations. This will help secure a longer-term income stream that extends beyond the design/build phase of these capital projects. In addition, our extensive global presence provides some mitigation from over-reliance on key geographic markets.
1
2
4
CompetitionAVEVA operates in highly competitive markets that serve the Oil & Gas, Power and Marine markets. Our 3D design tools are well established in our markets and we believe that there are a relatively small number of significant competitors. However, some of these competitors could, in the future, pose a greater competitive threat to AVEVA’s revenues, particularly if they consolidate or form strategic or commercial relationships among themselves or with larger, well capitalised companies.
Further threats are posed by the entrance, into AVEVA’s markets, of a much larger technology competitor or transformational technology, such as Cloud-based solutions.
The Group’s strategy to extend the Digital Asset footprint is key to ensuring that our customer penetration is broad and that AVEVA’s sources of revenue are diversified.
We carefully monitor customers and other suppliers operating within our chosen markets. We stay close to our customers and ensure we have a strong understanding of their needs and their expectations from the AVEVA product development roadmap.
We expect that the customers we serve will, over the next 3 to 5 years, show an increased appetite or insistence on their software needs being delivered with more flexibility. AVEVA is already well progressed with its Cloud strategy and expects to be able to meet these customer demands as they develop.
1
2
5
Professional ServicesWhere AVEVA assists customers with the deployment of an enterprise solution, this involves some degree of consulting and/or implementation work. This requires specialist knowledge to be available and well managed, potentially in many geographic locations. There is a risk that the services provided do not meet the customer’s expectations or that technical difficulties are encountered.
In some instances we may opt to partner with a third party for this work and this relationship also requires careful management and maintenance to ensure that AVEVA’s strong reputation with our customers is not damaged.
We employ experienced industry professionals within our professional services team and continue to build commercial partnerships with third party systems integrators.
We have rigorous processes and controls for the appraisal of potential commercial opportunities prior to any bid being submitted. Bids are appraised on grounds of technical complexity as well as financial and commercial risk.
2
5
AcquisitionsAn acquisition by AVEVA or of AVEVA could pose a significant distraction to management and to the delivery of our business plan.
The Group expects to continue to review acquisition targets as part of its strategy. The integration of acquisitions involves a number of unique risks, including diversion of management’s attention, failure to retain key personnel of the acquired business, failure to realise the benefits anticipated to result from the acquisition, and successful integration of the acquired intellectual property.
While each acquisition and integration is unique, AVEVA now has an experienced team to appraise and complete acquisitions. The Group’s experience of previous ‘bolt-on’ acquisitions as well as the aborted transaction with Schneider Electric provides a good understanding of potential transaction and integration risks.
1
4
5

STRATEGIC REPORT 31
FINANCIAL RISKSRisk Likelihood Impact Change Mitigation Strategy
Foreign exchange riskExposure to foreign currency gains and losses can be material to the Group, with more than 80% of the Group’s revenue denominated in a currency other than Sterling, of which our two largest are US Dollar and Euro.
The result of the UK referendum on European Union membership has led to significant weakening of the British Pound, and the volatility is likely to continue until further certainty is reached over exit negotiations.
The overseas subsidiaries predominantly trade in their own local currencies, which acts as a partial natural hedge against currency movements. In addition, the Group enters into forward foreign currency contracts to manage the risk where material and practical. The Group limits its hedging of revenue to US Dollar, Euro and Japanese Yen, and its hedging of costs to Swedish Krona and Indian Rupee.
3
Risk Likelihood Impact Change Mitigation Strategy
Recruitment and retention of employeesAVEVA’s success has been built on the quality and reputation of its products and services, which rely almost entirely on the quality of the people developing and delivering them. Managing this pool of highly skilled and motivated individuals across all disciplines and geographies remains key to our ongoing success.
The Group endeavours to ensure that employees are motivated in their work and there are regular appraisals, with staff encouraged to develop their skills. Annually there is a Group-wide salary review that rewards strong performance and ensures salaries remain competitive. Commission and bonus schemes help to ensure the success of the Group and individual achievement is appropriately rewarded.
1
2
3
4
5
Protection of intellectual propertyThe Group’s success has been built upon the development of its substantial intellectual property rights and the future growth of the business requires the continual protection of these tools.
The protection of the Group’s proprietary software products is achieved by licensing rights to use the application, rather than selling or licensing the computer source code.
The Group uses third party technology to encrypt, protect and restrict access to its products. Access limitations and rights are also defined within the terms of the software licence agreement.
The Group seeks to ensure that its intellectual property rights are appropriately protected by law and seeks to vigorously assert its proprietary rights wherever possible.
1
5
Research & DevelopmentThe Group makes substantial investments in Research & Development in enhancing existing products and introducing new products and must effectively appraise its investment decisions and ensure that we continue to provide class-leading solutions that meet the needs of our markets.
Our software products are complex and new products or enhancements may contain undetected errors, failures, performance problems or defects which may impact our strong reputation with our customers.
AVEVA continually reviews the alignment of the activities of our Research & Development teams to ensure that they remain focused on areas that will meet the demands of our customers and deliver appropriate financial returns. This process is managed by developing a product roadmap that identifies the schedule for new products and the enhancements that will be made to successive versions of existing products. Products are extensively tested prior to commercial launch.
1
5
International operationsThe Group operates in over 30 countries globally and must determine how best to utilise its resources across these diverse markets. Where necessary, the business must adapt its market approach to best capitalise on local market opportunities, particularly in the strategically key growth economies.
In addition, the Group is required to comply with the local laws, regulations and tax legislation in each of these jurisdictions. Significant changes in these laws and regulations or failure to comply with them could lead to additional liabilities and penalties.
The Group manages its overseas operations by employing locally qualified personnel who are able to provide expertise in the appropriate language and an understanding of local culture, custom and practice. Local management is supported by local professional advisers and further oversight is maintained from the Group’s corporate legal, financial and internal audit functions.
3
OPERATIONAL RISKS

32 AVEVA GROUP PLC ANNUAL REPORT AND ACCOUNTS 2017
Internal StakeholdersAVEVA is a diverse organisation with employees in over 30 countries and from many different cultures.
As of 31 March 2017, we have a headcount of 1,707 (2016 – 1,706), and our male/female ratio is 75% / 25% (2016 – 75% / 25%).
Keeping employees informed of business priorities and changes remains a primary focus within AVEVA. As a global organisation, it is important that everyone feels part of AVEVA and that we share information across all teams and regions. This is achieved through regular internal communication initiatives, such as people stories, successes and competitions, with the aims to be inclusive and to celebrate our diversity.
Engagement levels remain high and we use feedback from our Global Ambassador Network to improve and develop information that both informs and motivates our employees.
Our Global Ambassador Network continues to provide a channel for our employees to provide feedback to the senior management team, and helps us to gain cultural insights from the areas in which our employees are based.
To help our largest regions stay informed on both corporate and regionally-focussed news, we operate editorial teams to manage the network’s regional communications. These updates receive excellent readership rates and feedback has shown they are a great tool to support our employees in their roles.
External StakeholdersTransparency and disclosure are fundamental to our relationships with customers, partners and suppliers.
We maintain open, honest and fair discussions with each of our stakeholders to reinforce our reputation as a trusted and ethical organisation.
To protect the interest of our customers, our expanded Anti-Piracy and Compliance team monitors the illegal use of AVEVA software and enforces compliance within our terms and conditions. AVEVA continues to invest in both people and technology to ensure compliant use of its technology. Whilst illegal use of our software is an ongoing challenge, AVEVA is becoming much more successful in the detection of such cases and the subsequent enforcement of licence terms.
To embed and reinforce our corporate policy against the acceptance or payment of bribes, we continue to enhance and improve our eLearning tools.
Each year, every employee completes the Global Corporate Governance and Group IT Compliance training to ensure that we maintain our high ethical standards. We review monthly operational challenges in the key regional hubs to ensure local governance.
Employee EngagementEmployee feedback is a priority at AVEVA, and we are constantly seeking ways to improve the way our employees provide feedback to both managers and our Executive team.
In April 2017, we introduced a new micro survey tool designed to frequently seek employee feedback and opinions on key topics. Whilst retaining our traditional full bi-annual survey, this tool will be a way of gaining supplementary employee insights on a regular basis. Due to the nature of the tool, managers will have instant access to results, and can quickly plan actions, changes or interventions as necessary.
We have also increased the accessibility and visibility of the Executive team through global roadshows and briefings for all employees. Focussed on specific business updates, these sessions are an informal way for the Executive team to meet and discuss key updates, and to answer any questions employees may have. Between April and June 2016, there were 18 meet-and-greet sessions held in various global locations, reaching nearly 75% of employees.
CORPORATE RESPONSIBILITYAVEVA IS COMMITTED TO SUPPORTING ITS EMPLOYEES AND LOCAL COMMUNITIES AROUND THE WORLD, AND THIS REPORT CONTINUES TO DEMONSTRATE THE BROAD RANGE OF ACTIVITIES AVEVA AND ITS EMPLOYEES PARTICIPATE IN.
Gender split
Directors
Executiveteam
Employees
25%
22%
11%MaleFemale

STRATEGIC REPORT 33
90%Employee retention rate
>5,000Hours of technical training completed
AVEVA TalentTo support our ambition to attract and nurture young, talented people we continue, through our graduate and award-winning apprenticeship schemes, to encourage young people to start their careers with us. In recognition of our commitment to young talent we are on the UK top 100 Apprentice Employer list.
It is also crucial we attract students from Science, Technology, Engineering and Mathematics (STEM) subjects as early as possible both through our work experience and membership of specific science and engineering groups, including the BCS and the Engineering Development Trust. AVEVA was also present at the Big Bang Fair, where over 100,000 attendees came to hear more about careers within our core industries and we have sponsored a number of innovation awards to inspire the next generation of talent to continue their projects.
AVEVA is also an active member, with our CEO as Executive signatory, of the WISE (Women in Science and Engineering) Ten Steps campaign. This membership will enable us to become widely recognised as a company supporting diversity and inclusion, fairness and equality and inspiring women into technical and senior roles.
Our well-established learning and development programmes continue to provide a range of opportunities for our employees. This includes online language studies, technical development and management & leadership programmes. We also have compliance e-learning in place which is monitored regularly.
Last year we saw:• 5,000 hours of online technical
training (PluralSight) completed• 4,688 hours of classroom training• 33 colleagues completing
management development• 42 graduates and 12 apprentices
start their careers with AVEVA• An increased uptake of coaching
opportunities for managers at all levels, including the Executive team.
AVEVA in the Community2016/17 has been a very active year for Corporate Social Responsibility at AVEVA, with colleagues from across the globe taking time out to support a variety of local, national and international causes.
At AVEVA we encourage and celebrate our employees’ charitable efforts, and share exceptional activities carried out via our corporate intranet. We operate a programme of matched funding, and in addition, during the year we donated £45,000 to local and national charitable causes. In January 2017, we were also honoured to be included in the FTSE4Good index, in recognition of our efforts to operate in an ethically responsible manner.
There have been so many highlights this past year but one that particularly demonstrates our colleagues’ enthusiasm for supporting the local communities we operate in came from our team in Hyderabad.
In October 2016, the Hyderabad office came together to support a local school, and the generosity behind their actions was truly remarkable. As well as organising a very successful clothes drive, additional items were purchased by the team for donation, such as brightly-coloured hair clips, remembering how much they had loved them as a child.
A member of the team also approached a local street seller they had frequently passed on their way to work and arranged for him to come to the school with a variety of different items so the children could be given something that fitted them. Nearly 50 new dresses were purchased that day which will have made a huge boost to the street seller’s income.
There was also a more serious side to the visit, with the team spending some time teaching the children about hygiene, and joining in on a maths lesson.

34 AVEVA GROUP PLC ANNUAL REPORT AND ACCOUNTS 2017
Scope 1 | 1,046Scope 2 | 2,223Scope 3 | 500
Tonnes of CO2e equivalent
0
200
400
600
800
1,000
1,200
1,400
1,600
1,800
2,000
Tonnes of CO2e by region
Americas Asia Pacific EMEA Greater China
Scope 1 Scope 2 Scope 3
CORPORATE RESPONSIBILITY CONTINUED
Carbon EmissionsAVEVA is committed to minimising its carbon emissions, increasing the use of recycling opportunities and reducing the use of valuable natural resources. We are continually improving the way in which we capture and record our emissions data.
For the purposes of this report, the emissions have been calculated according to the ‘Environmental Reporting Guidelines: Including mandatory greenhouse gas emissions reporting guidance’ issued by the Department for Environment, Food and Rural Affairs (DEFRA), and by applying DEFRA’s conversion factors. We have aimed for the Greenhouse Gas (GHG) emissions to be captured for all of our UK and overseas offices between April 2016 and March 2017.
Tonnes of CO2e
Emissions from: 2017 2016
Scope 1 – Combustion of fuel and operation of facilities 1,046 789Scope 2 – Electricity, heat, steam and cooling purchased for own use 2,223 2,106Scope 3 – Transmission and distribution losses 500 446
3,769 3,341Intensity measurement (Scopes 1 and 2)– Tonnes CO2e/£m revenue 15.14 13.80
This Strategic Report has been approved by the Board of Directors and is signed on its behalf by:
Philip AikenChairman23 May 2017
Scope 1Combustion of fuel and operation of facilities
Scope 2Electricity, heat, steam and cooling purchased for own use
Scope 3Transmission and distribution losses
On the rare occasion that the information was not available for a particular AVEVA office, an estimate has been produced based on the ratio between the local office size and our UK offices, which we believe offers the best available comparison.
The 2016 financial year serves as the baseline for our targets. For our carbon intensity ratio we have measured our carbon usage as it relates to our business performance, citing tonnes of CO2e/£ million of revenue. In 2017 this intensity ratio increased to 15.14 tonnes CO2e/£ million (2016 – 13.80).
35GOVERNANCE REPORT
GOVERNANCEREPORT
CONTENTS
Governance36 Corporate Governance41 Nominations Committee Report42 Board of Directors44 Audit Committee Report47 Remuneration
Committee Report67 Other Statutory Information

AVEVA GROUP PLC ANNUAL REPORT AND ACCOUNTS 201736
CORPORATE GOVERNANCE
I am pleased to introduce the 2017 Corporate Governance statement. This year has seen considerable changes in the composition of the Board. The Nominations Committee has been extensively involved in the nomination, selection and appointment of the Executive Directors and Non-Executive Directors made during the year. We are grateful for the tremendous achievements for AVEVA made by the resigning Directors.
The Company is committed to the principles of Corporate Governance contained in the UK Corporate Governance Code provided by the Financial Reporting Council and for which the Board is accountable to shareholders. The Company has complied with the provisions of the April 2016 UK Corporate Governance Code throughout the financial year ending 31 March 2017.
Further explanation of how the principles have been applied is set out below and, in connection with Directors’ remuneration, in the Remuneration Committee report on pages 47 to 66.
Composition of the BoardThe usual composition of the Board is the Chairman, three independent Non-Executive Directors and two Executive Directors. Our Senior Independent Director is Philip Dayer. In the course of the year ending 31 March 2017, and as announced by the Company at appropriate times, the Board has undergone several significant, planned changes to refresh and strengthen the Board, including the appointment of a new Chief Executive, a new Chief Financial Officer and two new independent Non-Executive Directors, with several of them having handover periods to transition into their new roles (see more in the Nominations Committee report provided on page 41).
Brief biographical details of all Board members are set out on pages 42 and 43. The chairmanship and membership of all Board Committees is set out on page 38.
Board changesThe Nominations Committee has responsibility for Board and Committee composition, particularly in relation to the diversity of background, skills and experience. The Committee oversees the nomination, selection and appointment of Non-Executive and Executive Directors and monitors succession planning for Board and senior management roles.
Details of the Board changes and the work of the Committee undertaken this year can be found set out in the Nominations Committee report on page 41.
Operation of the BoardThe Chairman, supported by the Company Secretary, ensures that the Board functions effectively and has established Board processes designed to maximise its performance and effectiveness.
Philip AikenChairman

37GOVERNANCE REPORT
THE BOARD
EXECUTIVE DIRECTORS NON-EXECUTIVE DIRECTORS
James KiddDavid Ward
Philip Aiken (Chairman)Philip Dayer
Jennifer AllertonChristopher Humphrey
Ron Mobed
EXECUTIVE TEAM
CHIEF EXECUTIVE
Chief Revenue Officer
Chief Technology Officer and Deputy CEO
Executive Vice President Global Services
Chief Financial Officer
Executive Vice PresidentBusiness Strategy
Executive Vice PresidentGroup General Counsel
Executive Vice PresidentHuman Resources
Regional Executive Americas
Regional ExecutiveAPAC and MEA
Regional Executive Global Accounts and Europe
GROUP STRUCTURE MARCH 2017Key aspects of these processes are:• The AVEVA Group Board meets
regularly in combination with the Board of AVEVA Solutions Limited, the main operating company in the Group which owns all of the Group’s trading subsidiaries. The AVEVA Solutions Limited Board includes as a member the Deputy CEO and Chief Technical Officer, as well as all the members of the Group Board. This ensures that the AVEVA Group Board is well informed on technical and market factors driving the Group’s performance as well as on financial outcomes.
• The Board had eight scheduled meetings during the year. These meetings, together with any Committee meetings, are generally held at the Group’s Head Office in Cambridge or in our London office and are approximately one day in duration.
• Each scheduled Board meeting has an over-arching theme. These include an annual technology review, business plan/strategy day, succession planning, annual budget, presentations from Executive management, and interim and final results. The Board aims that Directors visit an AVEVA office or business event outside of the UK at least once per year. The Executive Directors visit non-UK AVEVA offices on a regular basis. This year two of the Non-Executive Directors attended the AVEVA World Summit in October 2016, meeting with staff and customers throughout the event. The Chairman visited the Hyderabad offices in October 2016 and one Non-Executive Director travelled to Russia to meet with management and staff there as part of a review of operations.

AVEVA GROUP PLC ANNUAL REPORT AND ACCOUNTS 201738
• In addition, the Board holds a full-day strategy meeting every year at which Executive Directors and members of the senior management team make presentations covering progress against current strategy and objectives and ideas for future investment.
• The Board delegates the day-to-day responsibility for managing the Group to the Executive Directors.
• To enable the Board to discharge its duties, all Directors receive appropriate and timely information. Briefing papers are distributed by the Company Secretary to all Directors, usually four working days in advance of Board and Committee meetings.
• A monthly reporting pack containing management accounts with commentary and reports from each Executive Director is distributed to the Board on a monthly basis.
• Meetings were held between the Chairman and the Non-Executive Directors during the year, without the Executives being present, to discuss appropriate matters as necessary.
• The Chairman ensures that the Directors take independent professional advice where they judge it necessary to discharge their responsibilities as Directors at the Group’s expense. All members of the Board have access to the advice of the Company Secretary.
• Non-Executive Directors and Executive Directors are encouraged annually to undertake training in furtherance of their specific roles and general duties as a Director.
CORPORATE GOVERNANCE CONTINUED
Board meetings
Nominations Committee
Remuneration Committee
Audit Committee
Meetings scheduled1: 8 3 6 4
Meetings attended:Philip Aiken 8 3 n/a n/aJonathan Brooks 4 2 3 3Philip Dayer 8 3 6 4Jennifer Allerton 8 3 6 4Christopher Humphrey 7 1 4 3Ron Mobed 1 0 1 1Richard Longdon 5 n/a n/a n/aJames Kidd 8 n/a n/a n/aDavid Ward 7 n/a n/a n/a
1 Executive Directors’ and Non-Executive Directors’ attendance recorded from time of appointment to time of resignation (where applicable).
Matters reserved for the BoardThe Board is responsible to shareholders for the proper management of the Group. There is a formal schedule of matters specifically reserved for the Board’s decision that covers key areas of the Group’s affairs, which include:• overall responsibility for the strategy
of the Group; • corporate governance;• review of trading performance and
forecasts;• risk management;• Board membership; • communications with shareholders;• approval of major transactions,
including mergers and acquisitions; and
• approval of the financial statements and annual operating and capital expenditure budgets.
Independence of Non-Executive Directors and segregation of dutiesThe Board has considered the independence of the Non-Executive Directors and believes that all are currently independent of management and free from any material business or other relationships that could materially interfere with the exercise of their independent judgement. Their biographies on pages 42 and 43 demonstrate a range of experience and sufficient calibre to bring independent judgement on issues of strategy, performance, resources and standards of conduct which are vital to the Group.
The roles of the Chairman and the Chief Executive are distinct and the division of responsibility between these roles has been clearly established, set out in writing and agreed by the Board. The Chairman is responsible for the effectiveness of the Board and ensuring that it meets its obligations and responsibilities. The Chief Executive is responsible to the Board for the day-to-day management of the business, leadership of the Executive team and execution of the Group’s strategic and operating plans. The Chairman and Chief Executive meet regularly to discuss any issues pertaining to the Company’s performance, reputation and organisation. Committees of the BoardThe Board has three committees: Audit, Remuneration and Nominations. In accordance with the UK Corporate Governance Code, the duties of the Committees are set out in formal terms of reference. They are available on request from the Company’s registered office during normal business hours and are available on the Company’s website at www.aveva.com.
Details of the main responsibilities and activities during the year of the Nominations Committee are included on page 41, the Audit Committee on pages 44 to 46 and the Remuneration Committee on pages 47 to 66.
Performance evaluationThe Board undertakes a formal and rigorous review of its performance and that of its Committees and Directors each financial year. In 2014, an extensive review was externally facilitated by Armstrong Bonham Carter LLP, the independent board performance consultants. The most recent review was carried out in October 2016, led by the Chairman and conducted following one-on-one interviews with each Director.

GOVERNANCE REPORT 39
Overall, the review concluded that the Board and its Committees had demonstrated a high degree of effectiveness. The Board is considered to be of the right size and having appropriate skills representation. The October 2016 review identified five priorities in the form of broader discussion at Board level of risk management and succession planning, a greater development of the annual strategy day, formalisation of the internal audit function, the appointment of a Non-Executive Director with software development and/or end market experience and an increase in senior management presentations to the Board. Each of these areas of development has been incorporated into the Board’s schedule for the next year and into objectives for the Executive Directors or Board Committees.
Internal control and risk managementThe Board has overall responsibility for the Group’s system of internal control and for monitoring its effectiveness. However, such a system is designed to manage rather than eliminate the risk of failure and by its very nature can only provide reasonable and not absolute assurance against material misstatement or loss. The principal risks and uncertainties the Group faces are set out on pages 30 and 31. There were no significant control failures during the year.
The Board has established a continuous process for identifying, evaluating and managing the significant risks the Group faces. The Board regularly reviews the effectiveness of the Group’s internal controls, which have been in place from the start of the year to the date of approval of this report, and believes that it is in accordance with the September 2014 Financial Reporting Council Guidance on Risk Management, Internal Control and Related Financial and Business Reporting.
The key elements of the system of internal controls currently include:• each member of the Executive team
has responsibility for specific aspects of the Group’s operations. They meet on a regular basis and are responsible for the operational strategy, reviewing operating results, identification and mitigation of risks and communication and application of the Group’s policies and procedures. Where appropriate, matters are reported to the Board;
• regular reports to the Board from the Executive team on key developments, financial performance and operational issues in the business;
• operational and financial controls and procedures which include authorisation limits for expenditure, sales contracts and capital expenditure, signing authorities, IT application controls, organisation structure, Group policies, segregation of duties and reviews by management;
• an annual budget process which is reviewed, monitored and approved by the Board;
• regular meetings between the Executive team, sales area managers and key functional managers to discuss actual performance against forecast, budget and prior years. The operating results are reported on a monthly basis to the Board and compared to the budget and the latest forecast as appropriate;
• targeted internal audit reviews which focus on confirming the operation of controls in key process areas; and
• maintenance of insurance cover to insure all major risk areas of the Group based on the scale of the risk and availability of the cover in the external market.
The Board’s monitoring covers all material controls, including financial, non-financial, operational and compliance controls and risk management. It is based principally on reviewing reports from management to consider whether significant risks are identified, evaluated, managed and controlled and whether any significant weaknesses are promptly remedied and indicate a need for more extensive monitoring. The Board periodically carries out visits to the Group’s subsidiaries and receives presentations from local management on their operations.
The Board has also performed a specific assessment for the purpose of this Annual Report. This involved reviewing the Group’s risk matrix that had been reviewed/updated by the Group’s Risk Committee, with representatives involved from the Executive team and senior managers. This assessment considered all significant aspects of internal control necessary for the Company to successfully carry out the key business strategies of the Group together with more generic inherent risks of the Group’s operations. The Audit Committee assists the Board in discharging its review responsibilities.
Indemnities to DirectorsIn accordance with the Company’s Articles of Association, Directors are granted an indemnity from the Company to the extent permitted by law in respect of liabilities incurred as a result of the performance of their duties in their capacity as Directors of the Company. The indemnity would not provide any coverage to the extent the Director is proven to have acted fraudulently or dishonestly. The Company has maintained Directors’ and officers’ liability insurance cover throughout the year.

AVEVA GROUP PLC ANNUAL REPORT AND ACCOUNTS 201740
CORPORATE GOVERNANCE CONTINUED
Policy on appointment and reappointmentIn accordance with the Articles of Association, all Directors are required to retire and submit themselves for re-election at least every three years by rotation and also following their appointment. In addition, as in the prior year and in accordance with the UK Corporate Governance Code, all of the Board members are offering themselves for re-election at the Annual General Meeting (unless retiring).
Non-Executive Directors are appointed for a term of three years. The terms and conditions of appointment of Non-Executive Directors are available for inspection at the Company’s registered office during normal business hours and will be available for inspection on the day of the forthcoming Annual General Meeting.
Dialogue with institutional shareholdersCommunication with shareholders is given high priority by the Board. The Chief Executive, Chief Financial Officer and Head of Investor Relations have meetings with representatives of institutional shareholders and hold analyst briefings at least twice a year, following the announcement of the interim and full year results, but also at other times during the year as necessary. Senior managers from Product Development, Business Strategy and Finance also attended analyst and shareholder meetings during the year. In January 2017, the Executive Directors and key members of the Executive Committee hosted shareholders and sell-side analysts at a capital markets afternoon. The session was an opportunity for the Group to provide more detail as to the business strategy and key areas of focus. All of these meetings seek to build a mutual understanding of objectives with major shareholders by discussing long-term strategy and obtaining feedback.
The Board also receives formal feedback from analysts and institutional shareholders through the Company’s financial PR adviser and financial advisers. The Board is appraised of discussions with major shareholders to ensure that Executive and Non-Executive Directors consider any matter raised by shareholders and to enable all Directors to understand shareholder views. In addition, when necessary, the Group consults with shareholders in respect of proposals for the remuneration of Executive Directors. The Senior Independent Non-Executive Director, Philip Dayer, is available to shareholders if they have concerns, which contact through the normal channels of Chairman, Chief Executive or Chief Financial Officer has failed to resolve or if such contact would be inappropriate. The Chairman, Senior Independent and Non-Executive Directors are available for dialogue with shareholders at any time and attend (together with the other members of the Board) the Annual General Meeting, but are not routinely involved in investor relations or shareholder communications. Corporate information is also available on the Company’s website, www.aveva.com.
Constructive use of the Annual General MeetingThe Board seeks to use the Annual General Meeting to communicate with investors and all shareholders are encouraged to participate. The Chairmen of the Audit, Remuneration and the Nominations Committees will be available at the Annual General Meeting to answer any questions.
Philip AikenChairman23 May 2017

GOVERNANCE REPORT 41
During the financial year, the Nominations Committee comprised a majority of independent Non-Executive Directors, chaired by Philip Aiken. The Committee has responsibility for Board and Committee composition, particularly in relation to the diversity of background, skills and experience. The Committee oversees the nomination, selection and appointment of Non-Executive and Executive Directors and monitors succession planning for the Board and senior management roles.
In 2016/17, the Committee met three times and the main areas that it concentrated on were succession planning, Board refreshment and Board and senior management appointments.
Succession planning and Board refreshmentEffective succession planning is vital for the long-term success of the Company. There have been considerable changes to the composition of the Board during the financial year and the Committee has taken a lead role in the process for the appointment of both Executive and Non-Executive Directors and senior management. A key requirement of the succession planning and Board evaluation has been to ensure a balance of skills, experience, independence and knowledge that is appropriate to manage future growth and strategic plans of the Company.
With the appointments during the course of 2016 of our new Chief Executive, our new Chief Financial Officer and our two new Non-Executive Directors, the Committee considers that, at the same time as promoting very able internal people with vast Company knowledge, the Company has also gained experienced Board members who will complement and add depth to the skills and balance of the Board.
Details of Board changesOn 31 December 2016, after 33 years with the Group, 17 years of which as Chief Executive, Richard Longdon stepped down from his role as Chief Executive and Executive Director of the Company.
On 8 July 2016, James Kidd, previously Chief Financial Officer since 2011, was announced as being Richard Longdon’s successor as Chief Executive and was appointed as deputy Chief Executive with effect from that date. James assumed the role of Chief Executive with effect from 1 January 2017.
Additionally, on 8 July 2016, David Ward was appointed Chief Financial Officer, having previously held the position of Head of Finance since 2011.
In respect of these appointments as Executive Directors, the Committee considered the two internal candidates to be the most suitable candidates, bearing in mind, in particular, their knowledge of, and service with, the Company.
The Chairman of the Nominations Committee and the remainder of the Board considered the independence of Philip Dayer now that he is in his third term of office. It was concluded that he remained independent and continued to contribute to the operation of the Board. Philip Dayer will not stand for re-election at the 2017 AGM.
Jonathan Brooks resigned from the Board with effect from 8 November 2016.
In respect of the intended resignation of Jonathan Brooks in November 2016, Christopher Humphrey was duly appointed as a Non-Executive Director on 8 July 2016; this being as part of a transition process between the two Non-Executive Directors, and Christopher Humphrey became Chair
of the Audit Committee with effect from 2 November 2016. Additionally, in advance of the intent for Philip Dayer not to stand for re-election at the 2017 AGM, Ron Mobed was appointed as a Non-Executive Director on 1 March 2017. It was also decided that Jennifer Allerton should assume the position of Remuneration Committee Chair. In relation to both of these appointments, the Company consulted with a number of search firms, and retained the services of Spencer Stuart, to provide suitable candidates for consideration by the Nominations Committee. Short listed candidates were interviewed by the Chairman and other Non-Executive and Executive Directors.
On appointment, all Directors are asked to confirm that they have sufficient time to devote to the role, which is confirmed together with details of their duties in the letter of appointment. All Directors undergo an induction as soon as practical following their appointment. As part of the induction process, Directors are provided with background information on the Group and attend the Group’s headquarters in Cambridge for meetings and presentations from senior management. In addition, where appropriate, meetings are also arranged with the Group’s advisers.
Diversity policyThe Board considers that diversity, including diversity of gender, is very important when reviewing the composition of the Board and possible new appointments. That said, whilst the Board notes the 2016 Hampton/Alexander report on FTSE women leaders, it has not set targets on gender balance. The Board considers that the most important consideration is to appoint people based on merit, skills and relevant experience with a view to enhancing the balance and effectiveness of the Board.
NOMINATIONS COMMITTEE REPORT

42 AVEVA GROUP PLC ANNUAL REPORT AND ACCOUNTS 2017
BOARD OF DIRECTORSTHE BOARD HAS SEEN SIGNIFICANT CHANGES IN THE PAST 12 MONTHS, WITH A NUMBER OF NEW MEMBERS BRINGING A DIFFERENT MIX OF EXPERIENCES, ENSURING THE BOARD CONTINUES TO OPERATE EFFECTIVELY AND PROVIDES STRONG LEADERSHIP.
Philip Aiken has over 40 years’ experience in industry and commerce. From 1997 to 2006, he was President of BHP Petroleum, and then Group President Energy of BHP Billiton. Prior to that he held senior positions with BTR plc (1995 to 1997) and BOC Group (1970 to 1995). Other roles have included Non-Executive Director of National Grid plc, Chairman of Robert Walters plc, Senior Independent Director of Kazakymys plc, Senior Independent Director of Essar Energy plc, Senior Adviser for Macquarie Capital Europe, Chairman of the 2004 World Energy Congress and serving on the Boards of the Governor of Guangdong International Council, World Energy Council and Monash Mt Eliza Business School. He is a Non-Executive Director of Newcrest Mining Limited and Chairman of Balfour Beatty plc.
James Kidd is a Chartered Accountant and joined AVEVA in 2004. Prior to his appointment to the Board, James held several senior finance roles within the Group and was Head of Finance from 2006 until 2011 when he was appointed CFO. He joined the Group at the time of the Tribon acquisition and played a significant part in the completion of this transaction and the subsequent integration of the acquired business. His responsibilities have included investor relations, the development of the Group’s overseas subsidiaries, standardisation of financial processes and procedures as well as being heavily involved in the Group’s recent acquisitions. Prior to joining AVEVA James worked for both Arthur Andersen and Deloitte, serving technology clients in both transactional and audit engagements.
David Ward joined AVEVA in 2011 as the Head of Finance before being appointed to the Board as Chief Financial Officer (CFO) in July 2016. In his six years with AVEVA, he has led the development of the Group’s Finance function and AVEVA’s risk and internal controls agenda, chairing AVEVA’s management Risk Committee. He has also been heavily involved in a number of strategically important change projects for the Company, including organisation design and information systems transformation. David is a qualified Chartered Accountant and prior to joining AVEVA, he worked at Ernst & Young for 14 years in various roles within the Assurance practice and completed a secondment to easyJet plc as Group Treasurer.
Philip Dayer qualified as a Chartered Accountant and pursued a corporate finance career in investment banking, specialising in advising UK-listed companies. He was first appointed an Advisory Director in 1983 of Barclays Merchant Bank Limited and since then has held the position of Corporate Finance Director with a number of banks. He retired from Hoare Govett Limited in 2004. Philip is a Non-Executive Director of Kazmunaigas Exploration Production JSC, The Parkmead Group plc, VTB Capital plc and PAO Severstal.
PHILIP AIKENCHAIRMAN
TIME ON BOARD: 5 YEARS(APPOINTED 1 MAY 2012)
COMMITTEES: NOMINATIONS COMMITTEE (CHAIRMAN)
JAMES KIDDCHIEF EXECUTIVE
TIME ON BOARD:6 YEARS 4 MONTHS (APPOINTED 1 JANUARY 2011)
COMMITTEES: NONE
DAVID WARDCHIEF FINANCIAL OFFICER
TIME ON BOARD: 10 MONTHS (APPOINTED 8 JULY 2016)
COMMITTEES: NONE
PHILIP DAYERNON‑EXECUTIVE DIRECTOR
TIME ON BOARD: 9 YEARS 4 MONTHS (APPOINTED 7 JANUARY 2008)
COMMITTEES: REMUNERATION COMMITTEE (CHAIRMAN), AUDIT COMMITTEE, NOMINATIONS COMMITTEE

GOVERNANCE REPORT 43
Jennifer Allerton has more than 38 years of Information Technology experience, most recently as Chief Information Officer at F. Hoffmann-La Roche in Switzerland with responsibility for IT strategy and operations for the Pharma division and all Group IT operations from June 2002 to July 2012. Prior to Roche, she served as Technology Director at Barclaycard with responsibility for Fraud Operations and IT. Currently, Jennifer serves as an Independent Director on the Board of Iron Mountain and as a Non-Executive Director of Paysafe Group plc and Sandvik. She holds Bachelor degrees in Mathematics from Imperial College, London, and a Masters degree in Physics from the University of Manitoba, Canada.
Christopher Humphrey is a qualified accountant and has over 25 years’ experience managing engineering and technology companies. He is a Non-Executive Director and Chairman of the Audit Committee of Vitec Group plc. He is also a Non-Executive Director of SDL plc. Christopher was formerly Group Chief Executive Officer of Anite plc, from 2008 until August 2015. He joined Anite in 2003 as Group Finance Director. He was Group Finance Director at Critchley Group plc and held senior positions in finance at Conoco and Eurotherm International plc. He was previously a Non-Executive Director of Alterian plc between 2011 and 2012. He has a BA, MBA and is a Fellow of CIMA.
Ron Mobed has a broad range of global experience in electronic information businesses across a number of sectors and regions. He is Chief Executive Officer of the Elsevier business of RELX Plc and was a Non-Executive Director of Argus Media from 2009 until 2011. He has also held Executive positions with Cengage Learning, IHS and Schlumberger. He is a Fellow of the Institute of Directors and of the Energy Institute. He holds a Bachelor’s degree in Engineering from Trinity College, University of Cambridge and a Masters degree in Petroleum Engineering from Imperial College, University of London.
JENNIFER ALLERTONNON‑EXECUTIVE DIRECTOR
TIME ON BOARD: 3 YEARS 10 MONTHS (APPOINTED 9 JULY 2013)
COMMITTEES: AUDIT COMMITTEE, REMUNERATION COMMITTEE, NOMINATIONS COMMITTEE
CHRISTOPHER HUMPHREYNON‑EXECUTIVE DIRECTORTIME ON BOARD: 10 MONTHS (APPOINTED 1 JULY 2016)
COMMITTEES: AUDIT COMMITTEE (CHAIRMAN), REMUNERATION COMMITTEE, NOMINATIONS COMMITTEE
RON MOBEDNON‑EXECUTIVE DIRECTOR
TIME ON BOARD: 2 MONTHS (APPOINTED 1 MARCH 2017)
COMMITTEES: AUDIT COMMITTEE, REMUNERATION COMMITTEE, NOMINATIONS COMMITTEE
EXPERIENCE OF THE TEAMTENURE OF THE BOARD:
< 1 year
1-3 years
3-6 years
6+ years
3
0
2
2
<1 year: DW, CH, RM 1-3 years: – 3-6 years: PA, JA 6+ years: PD, JK
GENDER OF THE BOARD:
MaleFemale
SECTOR EXPERIENCE OF THE BOARD
Technology
57%Oil & Gas
43%Engineering
29%Construction
29%
Financial
57%Software
43%Power
29%
AVEVA GROUP PLC ANNUAL REPORT AND ACCOUNTS 201744
AUDIT COMMITTEE REPORTWE ARE COMMITTED TO ENSURING THE INTEGRITY OF THE GROUP’S FINANCIAL REPORTING, AUDIT PROCESS, KEY RISK MANAGEMENT AND INTERNAL CONTROL.
The Audit Committee has a number of responsibilities:• to undertake regular scrutiny of the Group’s financial performance;• ensuring the financial integrity of the Group is effective; • ensuring the Group has the appropriate risk management processes and
internal controls; and• ensuring that the internal and external audit processes are robust.
Committee MembershipThe Audit Committee at the date of this report comprises four Non-Executive Directors.
Christopher HumphreyAudit Committee Chairman
During 2016/17 the members were:ChairmanChristopher Humphrey (from 2 November 2016)Jonathan Brooks (until 2 November 2016)
MembersPhilip DayerJennifer AllertonChristopher Humphrey (from 8 July 2016)Ron Mobed (from 1 March 2017)
Brief biographical details for all the members of the Committee are included on pages 42 and 43.
The Audit Committee provides effective governance over external financial reporting, risk management and internal controls and reports its findings and recommendations to the Board. In my capacity as Chairman of the Audit Committee, I am pleased to report on the operations of the Committee during the past year, with emphasis on the specific matters we have considered, including compliance with the UK Corporate Governance Code (“the Code”) and associated Guidance on Audit Committees. I confirm that we have fully complied with the requirements of the Code as issued in April 2016.
I was appointed Chairman of the Committee on 2 November 2016, succeeding Jonathan Brooks who stood down from the Board in the same month.
I would like to thank Jonathan for his work as Audit Committee Chairman and also for his time in handing over this responsibility to me. The Board believes I have the necessary recent and relevant financial experience as required by the Code as I am a Chartered Management Accountant and a Fellow of CIMA, and have most recently held the role of Chief Executive Officer and previously Group Finance Director of Anite plc, a UK listed company, and previously senior positions in finance at Conoco, Eurotherm International plc and Critchley Group plc. I have maintained an up-to-date understanding of financial and corporate governance best practice by attending many training sessions and updates presented by the major accounting firms. The Board also considers that the other members of the Committee have a broad range of appropriate skills and experiences covering financial, commercial and operational matters.
My induction process involved me meeting senior members of AVEVA’s Financial Management team prior to Jonathan’s departure and I was closely involved with the half year reporting processes relating to 2016. I have met with key internal employees and representatives of Ernst & Young (EY) to learn more about the workings of the Group’s financial reporting and audit process. During the year I chaired two meetings of the Audit Committee.
Audit Committee terms of referenceThe Audit Committee monitors the integrity of the financial statements of the Group and the Committee members (as part of the full Board) review all proposed announcements to be made by the Group and consideration is given to any significant financial reporting judgements contained in them.
The Committee considers the effectiveness of financial reporting and internal controls, compliance with legal requirements, accounting standards and the Listing, Disclosure and Transparency Rules of the Financial Conduct Authority. We also review any proposed change in accounting policies and any recommendations from the Group’s auditor regarding improvements to internal controls
GOVERNANCE REPORT 45
and the adequacy of resources within the Group’s finance function. The Committee also assesses the process that has been established to ensure that the Annual Report is fair, balanced and understandable, reporting to the Board on their findings.
A full copy of the Committee’s terms of reference is available from the Company’s website at www.aveva.com.
MeetingsThe Audit Committee meets at least four times each year. The Company Chairman and CFO are invited to attend all meetings. The external auditor is also invited to attend. Members of senior management are invited from time to time to make presentations such as the Committee’s agenda necessitates.
The Committee meets quarterly with the external auditor without any members of the Executive team being present. I also meet with the external auditor from time to time away from the Company’s offices.
Risk and internal controlsThe key elements of the Group’s internal control framework and procedures are set out on page 46. The principal risks the Group faces are set out on pages 30 and 31. Annually, the Audit Committee considers the Group Risk Register and related management controls. Throughout the process, the Board or the Audit Committee:• gives consideration to whether areas
should be looked at more closely through specific control reviews;
• identifies areas where enhancement of internal controls is required; and
• agrees action plans to deliver the necessary or recommended enhancements.
Overview of the year’s activitiesIn addition to its prescribed duties the Audit Committee undertook several additional projects during the year.
Topic Activity in the year
Revenue recognition The Committee received regular updates from management as to its consideration of implications of the new accounting standard for revenue recognition – IFRS 15. The new revenue recognition standard comes into effect on 1 January 2018, and the first period for which revenue will be reported under IFRS 15 will be the interim period to September 2018. The Committee is tracking management’s progress and a presentation outlining the roadmap and expected impact assessment was presented to the Committee in March 2017.
External audit tender The Committee undertook a tender of the external audit in the summer of 2016, culminating in presentations to the Committee by the incumbent auditor Ernst & Young (EY), as well as Deloitte and PricewaterhouseCoopers (PwC). The Committee was impressed by the quality of presentations from all three firms and, ultimately, EY were successful in retaining the audit. The Committee felt that EY were in the strongest position to manage the risk associated with the Company’s transition to the new revenue recognition accounting standard, IFRS 15, and were pleased with the competitive fee proposal.
Internal audit The Committee undertook a review of the Group’s position on internal audit. An outline proposal was considered in November 2016 to create an internal audit programme, and the level of assurance that such a programme would provide. The proposal was approved by the Committee and incorporates the establishment of a minimum controls framework, against which internal audit testing will be focused.
Following this, two internal audit visits to overseas subsidiaries were conducted by members of the Group Finance team, and a further visit was conducted by PwC. More details of the Company’s new approach to internal audit is included below.
As part of our ongoing programme of controls assurance, the Committee commissioned internal audit to undertake a review of the process and controls involved in the invoicing of annual fees. Generally the findings were encouraging but some control improvements were recommended to ensure that all price increases available under the customer contracts are incorporated.
Risks and internal controls In March 2017, management presented an update on the Company Risk Register and the continual development of internal controls. The update included:• The new AVEVA RACI framework which is being enacted for 2017/18 to support the new regional
organisational structure. • The Risk Committee had updated the Corporate Risk Register and established a process of creating
functional risk registers, which will feed directly into the Corporate Risk Register for a more holistic view of corporate risks.
• In furtherance of cyber security, a dedicated IT security team has been established, and a series of mandatory e-learning courses introduced. We continue to perform periodic phishing simulations, which show an encouraging improvement over time.
Non-audit services Legislation on non-audit services came into effect on 1 April 2017 restricting what work the statutory auditor can perform. The Committee has implemented a strict policy which goes beyond the minimum requirements of legislation and shall be monitored closely. This has necessitated the Committee overseeing a transition of work from Ernst & Young to alternative professional services firms and advisers.
AVEVA GROUP PLC ANNUAL REPORT AND ACCOUNTS 201746
The Audit Committee has developed a framework to gain assurance over the system of internal financial and operational controls. This comprises: • A risk assessment performed by
operational management and the Board to identify key areas for assurance.
• Peer and head office reviews of key risk areas of financial internal control. During the year, subsidiary company control visits were undertaken in Malaysia and Germany and specific reviews were undertaken related to annual fee billing and general customer contracting terms.
• The use of qualified third parties to undertake specialist reviews in more technical areas. During 2016/17, PwC performed an internal audit of our China operations.
• An annual assessment by the Audit Committee of the whole system of internal financial and operational controls.
There is a formal whistle-blowing policy which has been communicated to employees. This policy provides information on the process to follow in the event that any employee feels it is appropriate to make a disclosure. The Audit Committee is satisfied that the process is effective and reviews key issues which are reported.
Key estimatesThe Audit Committee discusses with management and the auditor the approach that has been taken in assessing all key estimates. These include revenue recognition, provision for impairment of receivables and the valuation of retirement benefit obligations. Annually, the Committee considers the going concern principle upon which the financial statements are prepared and also the Group’s viability statement disclosures.
Internal auditAs outlined above, during the year the Company has established an internal audit function which is co-resourced using Company employees as well as third party specialists. As a Committee, we believe this resourcing model will provide the most effective approach, with some audit reviews requiring internal Company knowledge and for other audit review areas specialist input from an independent third party will
be optimal. The Company has initially chosen PwC for its internal audit partner, although this appointment is not contractual or for any fixed term.
The Group’s operations are geographically widely spread, which means that in some instances, where assurance over the operation of internal control is considered valuable, there is a clear advantage in such reviews of controls being undertaken by teams with specific local regulatory knowledge and without any local language barrier. Further, the Committee believes that such instances favour the provision of assurance from external sources, which is considered to be both more efficient and effective. This will be reviewed on a case-by-case basis, with PwC performing these visits as necessary.
External auditThe Audit Committee advises the Board on the appointment of the external auditor and during 2016/17 undertook a tender of the role of external auditor. Three firms were invited to the tender process, which involved several meetings with management and culminated in a presentation to the Audit Committee in July 2016. Ultimately EY were successful in retaining the audit. The Committee felt that EY were in the strongest position to manage the risk associated with the Company’s transition to the new revenue recognition accounting standard, IFRS 15, and were pleased with the competitive fee proposal.
The Committee also advises the Board on the auditor’s remuneration both for audit and non-audit work and discusses the nature, scope and results of the audit with the external auditor. From 1 April 2017, new, tighter non-audit services legislation came into effect, and at the same time, the Group’s updated policy. The legislation and policy severely restricts the level of non-audit work that the external auditor is able to perform and helps to safeguard the independence and objectivity of the external auditor. The Committee continues to keep under review the cost effectiveness and quality of the audit service. Pursuant to the new policy on non-audit services, the Audit Committee
is required to approve any fees paid to the auditor for permissible non-audit work and delegates the authority for approval of such work to the Chief Financial Officer where the level of fees involved are considered insignificant. During the year the auditor has ceased all prohibited non-audit work. The Group engages other independent firms of accountants to perform tax consulting work and other consulting engagements to ensure that the independence of the auditor is not compromised.
Audit partners are rotated every five years and a formal statement of independence is received from the auditor each year. The Board and the Audit Committee are satisfied that the independence of the auditor has been maintained. The current audit partner, Marcus Butler, will complete his second year with the Group this year.
Audit planning and main audit issuesAt the November 2016 meeting of the Committee the auditor presented their audit plan for 2016/17. This included a summary of the proposed audit scope for the year for each of the Group’s subsidiaries and a summary of what the auditor considered to be the most significant financial reporting risks facing the Group, together with the auditor’s proposed audit approach to these significant risk areas. The main area of audit focus for the year is the significant estimate surrounding revenue recognition.
Committee objectives for 2017/18In March 2017, the Committee considered the objectives for the year ahead and it was agreed the following would be prioritised:• Complete induction of Ron Mobed
as a new Committee member.• Completion of audited conversion
to IFRS 15 (opening balance sheet position).
• Completion of minimum control framework.
• Enhancements to product development reporting.
Christopher HumphreyAudit Committee Chairman23 May 2017
AUDIT COMMITTEE REPORT CONTINUED

GOVERNANCE REPORT 47
REMUNERATION COMMITTEE REPORTAT OUR 2017 AGM WE WILL BE SEEKING SHAREHOLDER APPROVAL TO RENEW OUR DIRECTORS’ REMUNERATION POLICY, AS THE CURRENT POLICY (WHICH WAS APPROVED BY SHAREHOLDERS AT OUR 2014 AGM) IS DUE TO EXPIRE.
IntroductionIn contemplation of this policy renewal, the Remuneration Committee conducted a full review of AVEVA’s approach to senior Executive remuneration. The key findings of this review were as follows:• The main pillars of the current
structure should be retained.• AVEVA’s past approach of offering
long-term equity alignment with shareholders solely via regular annual awards under an LTIP that vest subject to a single EPS target could be improved as follows: – by continuing to grant ‘standard’
LTIP awards each year, albeit with vesting based upon the achievement of a broader range of targets than previously applied (i.e. EPS, relative TSR and other financial/strategic targets), and
– by the facility to grant ‘restricted shares’ worth up to 35% of salary each year, with a corresponding reduction in the value of LTIP awards granted.
• The current annual bonus plan would benefit from a degree of simplification and could be made more reflective of best practice.
• Certain minor changes should be made to ensure that our policy continues to reflect AVEVA’s circumstances, is aligned to and supports achievement of the Company’s strategic objectives and takes due account of developments in best practice that have occurred since our current policy was established in 2014.
• The current shareholding guidelines of 200% of salary for the CEO and 100% of salary for the CFO should be increased to 300% of salary, should restricted share plan awards be granted.
Further details of the changes we are proposing to make to our policy are set out overleaf.
Context in which our review was undertakenAVEVA has delivered a solid performance over the last two years, achieving strong recurring revenue and cash flows in the context of tough end market conditions. There has been a focus on both cost control and the implementation of a strong strategy to drive organic growth over the medium term.
AVEVA’s long-term potential cannot be realised without the expertise and commitment of our senior Executive team, now headed by James Kidd, following Richard Longdon’s retirement from the Board, with James supported by David Ward as our new CFO. It is therefore important, and very much in the long-term interests of our shareholders, that we continue to offer remuneration packages that ensure the retention and incentivisation of our key Executives, while also ensuring that we keep the prudent approach we have adopted to such matters in the past.
Philip Dayer Remuneration Committee Chairman
“I SHALL BE STEPPING DOWN FROM THE CHAIRMANSHIP OF THE REMUNERATION COMMITTEE AT THE FORTHCOMING AGM, TO BE REPLACED BY JENNIFER ALLERTON, WHOM I WISH EVERY SUCCESS IN HER ROLE AS CHAIR OF THE COMMITTEE”
AVEVA GROUP PLC ANNUAL REPORT AND ACCOUNTS 201748
REMUNERATION COMMITTEE REPORT CONTINUED
On a more general level, when conducting its review, the Committee was also mindful of the continued focus on Executive remuneration from many quarters, including investors, the Press and Government. In formulating our new policy, we have taken due account of all relevant developments in market and best practice, while also ensuring that our policies and practices are appropriate for AVEVA and achieve our underlying objective of aligning the long-term interests of our Executive Directors and shareholders.
Summary of policy for 2017 onwardsThe structure of our new Executive Directors’ Remuneration Policy (the ‘Policy’) is summarised below, with the key changes we are proposing to make highlighted where relevant.
Base salariesNo changes are proposed to our underlying approach to base salaries save that, to reflect best practice, we will impose an overall cap on base salaries of £600,000, albeit that this does not signify any aspiration or intention to move Executive Directors’ salaries to this level over the life of the policy.
In terms of actual base salaries of our Executive Directors, James Kidd’s salary moved to £450,000 from £400,000 in April 2017 as part of the Committee’s approach to phasing James’ salary up to the intended level over a period of time. Note that this is below Richard Longdon’s salary of £495,000 when he retired as CEO on 31 December 2016. It is intended to further increase James’ salary to £500,000 for 2018/19, but only if James’ performance and the Company’s underlying circumstances warrant. Therefore, the Committee is taking a prudent approach to James’ salary progression by phasing the increases.
David Ward’s base salary when he joined the Board was £230,000. It is also intended that this be increased on a phased basis to a more appropriate level, subject to his performance. As such, David’s base salary was increased to £300,000 for 2017/18.
BenefitsNo changes are proposed to our underlying policy on benefits provision although, as with base salaries and to reflect best practice, going forward we will impose an overall cap on benefits, in this case of £50,000 (excluding pension-related benefits which will remain at 10% of salary for the Executive Directors).
Annual BonusAs noted above, our review of the structure of the current annual bonus plan identified a number of features that were unusual, not reflective of current market or best practice and which also added to the complexity of the plan:• The bonus is split between a ‘core
award’ of up to 100% of salary and an ‘outperformance award’ of a further 25% of salary.
• Only one metric (adjusted PBT) is currently used for the financial element, whereas it is now common for bonuses to operate with a wider range of financial metrics to encourage performance against a broader range of KPIs.
• Up to 10% of the financial element of the bonus can be earned based solely on interim (as opposed to full year) performance.
• The portion of bonus that is subject to deferral into shares was structured in a complex manner, with the proportion of deferral rising as the size of the bonus outturn increases.
To address these issues, the Executive Directors’ ongoing bonus opportunity will be structured as follows:• To simplify the plan, the concept of
separate ‘core’ and ‘outperformance’ awards will be removed and replaced by an overall maximum bonus opportunity of 125% of salary (i.e. no increase on the current level). Significant outperformance will still be required for a bonus approaching 125% of salary to be earned.
• To further assist in simplification, and to also bring the bonus plan more into line with typical practice, the 10% interim bonus feature will be removed. Therefore, going forward, the Executive Directors’ entire bonus opportunity will be based on full year performance.
• Flexibility will be reserved to employ a broader range of financial and non-financial metrics in the bonus, thereby reflecting common practice and also ensuring that the bonus outturn is based on a more rounded assessment of overall performance. More specifically, for 2017/18: – A bonus of up to 105% of salary
(i.e. 84% of the maximum bonus) will be payable based on performance against a sliding scale of financial targets, namely adjusted PBT (80% of salary) and recurring revenue (25% of salary) – both important financial KPIs.
– A bonus of up to 20% of salary (i.e. 16% of the maximum bonus) will be payable by reference to performance against quantifiable personal/strategic targets, details of performance against which will be retrospectively disclosed. However, to ensure affordability, this element of the bonus will be reduced by 50% if a threshold level of PBT is not delivered.
• Again in the interests of simplification, a straight 40% of any bonus earned will be deferred into shares which vest (as per the current policy) in equal tranches over a three-year deferral period.
• The existing malus and clawback provisions will be retained, with the Committee also reserving the right to adjust the bonus outturn based on a formulaic assessment of performance against the targets if this outturn does not reflect shareholders’ expectations.
Long-term incentivesHow AVEVA can best structure its long-term equity-based pay policy has been a key issue addressed by the Committee during the policy review process. The Committee considers it vital that the interests of our senior management team are genuinely aligned with the long-term interests of our shareholders.
In previous years, LTIPs were awarded at up to 150% of salary and were based solely on a single performance metric, namely EPS growth. The new policy achieves two main changes to the structure of the LTIPs; first, to use a blend of metrics to assess performance under the LTIP to provide a more rounded assessment of performance; and secondly to introduce the facility to
GOVERNANCE REPORT 49
replace a portion (worth 75% of salary) of the traditional LTIPs with restricted share plan awards of a lower quantum (worth 35% of salary). For 2017/18 and onwards, it is currently envisaged that awards will be structured as follows:
Traditional LTIPs Regular annual LTIP awards continue to be granted, albeit at a reduced quantum of 75% of salary (reflecting any grant of restricted share awards). These awards vest subject to the satisfaction of challenging targets measured over a period of not less than three years, as previously. For awards made in 2017/18, the targets will be structured as follows:• 50% of the award will be subject
to a sliding scale of adjusted EPS growth targets, maintaining the threshold and maximum targets of 5% and 15% per annum used for last year’s awards but – to reflect internal and external forecasts which suggest continuing potential headwinds in AVEVA’s end markets – with the addition of an intervening target of 10%, so that this element of the award vests as per the following table:
Adjusted EPS growth targets p.a.
Proportion of vesting (% of total award)
5% 25%10% 80%15% 100%
• 25% of the award will vest based on AVEVA’s relative TSR performance against the FTSE 250 (excluding Investment Trusts, Financial Services and Real Estate sector companies). 25% of this element will vest at median, with full vesting at the upper quartile.
• The remaining 25% of the award will vest based on performance against a sliding scale of revenue growth targets that have been developed to specifically support AVEVA’s growth strategy in certain parts of its business. Due to commercial sensitivity, the Committee does not believe it to be in shareholders’ interests to prospectively disclose details of the revenue growth targets. However, they will be objectively measurable over a three-year period, significant outperformance will be required to deliver full vesting, the targets will be disclosed retrospectively following
vesting, and vesting will only occur if the Committee is satisfied that the Company’s underlying financial performance warrants such payment. 25% of this element (for each revenue target) will vest at threshold levels of performance, with full vesting at maximum achievement. The revenue growth criteria are as follows: – Half of this portion (i.e. 12.5% of
the total LTIP award) will vest based on performance against a sliding scale of targets relating to three-year growth in revenue from Owner Operators (OOs). Revenue growth from OOs is an important strategic measure for the Group, as this will supplement the revenue streams already derived from Engineering, Procurement & Construction contractors (EPCs). Therefore it is important that we build these key relationships in order to protect and develop our existing business.
– The remaining half of this portion (i.e. 12.5% of the total LTIP award) will vest based on performance against a sliding scale of targets relating to three-year revenue growth in ‘More than 3D’. Historically AVEVA’s core strength has been in 3D engineering and design software. We wish to continue to expand our product portfolio so as to be able to offer a wider solution to customers. This is an important source of growth because we have an installed base that is still relatively unpenetrated in terms of the wider product portfolio. In addition, we can offer prospects a more complete, integrated solution which helps drive efficiency.
Restricted Share Plan (RSP)Restricted share plan awards can be granted over shares worth up to 35% of salary (i.e. replacing a portion of the traditional LTIP award that would otherwise have been granted, worth up to 75% of salary). Should restricted plan awards be granted, the shareholding guidelines will be increased to 300% of annual salary for both CEO and CFO (previously 200% and 100%, respectively). As is the case with the traditional LTIPs, restricted shares will be subject to a three-year vesting period followed by a two-year post-
vesting holding period. In the event of a change in control, awards vest subject to pro-rating (unless the Committee determines otherwise). Malus and clawback provisions would apply to this award (as they will to the LTIP awards) and awards would only be made if the Committee is satisfied that the Executive’s performance is satisfactory. The Committee will withhold the award if there is no bonus achievement.
When agreeing on the introduction of a modest restricted shares element to our remuneration policy, the Committee concluded that:• Restricted shares provide a
genuinely meaningful and tangible interest in shares.
• While a wholesale move to restricted shares (with a complete cessation of the LTIP) was an alternative approach, it remained appropriate for a significant portion of our Executive Directors’ equity pay to remain directly linked to the achievement of challenging performance conditions, thereby ensuring that the Executive Directors remain accountable to shareholders for their performance.
• Introducing a restricted share plan addresses the continuing debate surrounding overall levels of Executive remuneration head on, as the impact of a grant of restricted shares at 35% of salary and corresponding reduction in LTIP awards by 75% of salary would reduce the maximum value of our Executive Directors’ long-term incentive opportunity by 40% of salary in face value terms. Indeed, we have been particularly conservative when determining the ‘LTIP to restricted shares exchange rate’ by replacing a 75% of salary LTIP opportunity with a 35% of salary restricted share award (i.e. lower than the generally accepted 2:1 exchange rate).
• While the introduction of restricted shares could potentially be viewed as adding complexity to our pay arrangements, their introduction has been balanced by a significant simplification of the structure of our annual bonus plan (which retains the large deferred share element – further evidence of our commitment to equity-based pay and the alignment with shareholders that this brings).

AVEVA GROUP PLC ANNUAL REPORT AND ACCOUNTS 201750
REMUNERATION COMMITTEE REPORT CONTINUED
• Restricted shares are a new development for Executive remuneration and their introduction has attracted mixed views amongst the investment community. Accordingly, the Committee has decided to introduce restricted shares as a supplement to the LTIP rather than supplant it.
• The use of restricted shares for the Executive Directors would align with the structure of equity incentives throughout the wider management population, where restricted shares have been used in tandem with LTIP awards for some years without any concerns arising regarding complexity.
Therefore, by (i) the introduction of a limited restricted share plan, (ii) the continuation of the LTIP, at greatly reduced levels when made in tandem with restricted shares, with targets that encourage a reward for the delivery of performance across a broader range of metrics, and (iii) the retention of the deferred share element of the bonus, AVEVA will have a well thought-out and rounded equity-based remuneration programme that is tailored to our specific circumstances and which provides both internal and external alignment. The enhanced share ownership guidelines and use of two-year post-vesting holding periods also clearly assist in this regard.
Other Committee activities during the year In addition to conducting the policy review, the Committee undertook a number of other activities during and relating to 2016/17, including:• Agreeing the packages of James
Kidd, David Ward and Richard Longdon following their respective changes in role.
• Setting the 2016/17 bonus targets and determining the ultimate bonus outturn. Full details can be found on page 61.
• Granting the 2016 LTIP awards, further details of which can be found on page 62.
• Determining the vesting of the 2014 LTIP. Full details can be found on page 63.
Finally, our review noted that some amendments to the rules of the LTIP are required to reflect standard market practice. For example, to further strengthen alignment between Executives and shareholders, it is proposed that the LTIP be amended to enable the Committee to award an amount (in cash or shares) equal in value to any dividends that would have been paid on vested shares from the date of grant to the date on which the award is released to the participant. Certain other administrative amendments to the rules of the LTIP are also proposed to: (i) formally reflect the introduction of the two-year post-vesting holding period that has applied to recent awards granted to Executive Directors; (ii) ensure that the plan operates fairly where there is a variation of share capital; and (iii) bring within the definition of a ‘change in control’ – which could be a vesting event – the situation whereby a third party that already has a controlling interest in AVEVA acquires the entire issued share capital of the Company. We will be seeking shareholder approval for these changes at the AGM.
Summary I hope you find the contents of this Report clear and are supportive of the approach we intend to adopt going forward. We appreciate that the restricted share plan is, as practice currently stands, a relatively unusual feature. With this in mind, the Committee has included a number of safeguards that ensure our approach would be fully aligned with the long-term interests of our shareholders:• The continuation of a significant
share deferral element of the (now simplified) bonus.
• Limiting the grant of restricted shares to 35% of salary, with no award made in the event of underperformance as determined by the annual bonus objectives.
• The continuation of LTIP awards with formal three-year targets linked directly to our strategic objectives, which will be lower than past awards in quantum terms to reflect an accompanying grant of restricted shares.
• The application of a two-year post-vesting holding period for all awards.
• The enhanced share ownership guidelines of 300% of salary should restricted share plan awards be made.
This approach was subject to an extensive prior consultation with our major shareholders who I am pleased to report were generally very supportive.
Part A of this report contains full details of the new policy, in respect of which a binding shareholder resolution will be tabled at the forthcoming AGM. An advisory resolution will also be tabled in connection with Part B of this report which explains how the existing policy was implemented last year.
Finally, I shall be stepping down from the Chairmanship of the Remuneration Committee at the forthcoming AGM, to be replaced by Jennifer Allerton, who has been a member of the Remuneration Committee since 2013. I wish her every success in her role as Chair of the Committee.
Philip DayerRemuneration Committee Chairman
GOVERNANCE REPORT 51
PART A: THE DIRECTORS’ REMUNERATION POLICY
This report sets out the information required by Part 4 of Schedule 8 to the Large and Medium-Sized Companies and Groups (Accounts and Reports) Regulations 2008 (as amended) (the “Regulations”). The report also satisfies the relevant requirements of the Listing Rules of the Financial Conduct Authority, and describes how the Board has applied the principles and complied with the provisions relating to Directors’ remuneration in the UK Corporate Governance Code.
The table below summarises the Committee’s future policy on the remuneration of Executive Directors which, if approved by shareholders at the forthcoming Annual General Meeting on 7 July 2017, will replace the existing policy for which shareholder approval was obtained at the 2014 Annual General Meeting, and will become binding immediately thereafter. The material differences between the existing and proposed new policy (which has also been designed with due account taken of the UK Corporate Governance Code) are explained in the statement by the Committee Chairman and also in the table below. It is currently intended that the policy will remain valid until the 2020 Annual General Meeting.
The Remuneration Committee aims to ensure that: the Executive Directors are provided with appropriate incentives to align them with the achievement of the Company’s long-term strategy and the future creation of shareholder value; enhanced performance is encouraged; and, the Executive Directors are, in a fair and responsible manner, rewarded for their individual contributions to the success of the Group. Excessive risk-taking is neither encouraged nor rewarded.
It also aims for a combination of fixed and variable payments, benefits and share-based awards that will achieve a balance in incentives to deliver short and long-term goals. The Company’s policy is that a substantial proportion of remuneration of Executive Directors should be performance-related and should be delivered in shares to create alignment with shareholders’ interests. Remuneration for Executive Directors is set in the context of the economic environment in which the Group operates, the outcome of the wider pay review for all Group employees, as well as the financial performance of the Group. When determining remuneration arrangements, the Committee takes into consideration relevant external considerations as well as the remuneration for employees of the Group generally.
Remuneration commitments made which were consistent with the approved Remuneration Policy in force at that time shall be honoured, even if they would not otherwise be consistent with the policy prevailing when the commitment is fulfilled.
Purpose and link to strategy Operation Maximum opportunity Performance measures
Base salary• Helps recruit and retain
employees.• Reflects experience
and role.
• Base salary is normally reviewed annually with changes effective from 1 April, although salaries may be reviewed more frequently or at different times of the year if the Committee determines this is appropriate.
• The Committee determines base salary taking into account factors including, but not limited to: – the individual’s role, experience and
performance in achieving financial and non-financial goals within his areas of responsibility.
– salaries at other companies of a similar size and complexity as well as global technology peers.
– remuneration of different groups of employees within the Company.
– total organisational salary budgets.• The Committee takes a phased approach to
new salaries where appropriate. • Paid in cash.
• In determining salary increases the Committee generally considers the factors outlined in the ‘operation’ column.
• Salary increases will normally be in line with the range of increases in the broader workforce salary, although higher increases can be made in certain circumstances, for example: – an increase in the individual’s scope of
responsibilities; – in the case of Executive Directors who
are positioned on a lower initial salary while they gain experience in the role; or
– where the Committee considers that salary is behind appropriate market positioning for a company of AVEVA’s size and complexity.
• However, no salary increase will be paid to an incumbent the effect of which is that the increased salary is greater than £600,000.
None
Pensions• Provide a competitive
retirement benefit in a way that is cost effective to the Company.
• The CEO and CFO are members of the AVEVA Group Personal Pension Plan (a defined contribution scheme).
• The intention is that new appointments to the Board would also participate in the AVEVA Group Personal Pension Plan or receive an equivalent cash payment. However, if appropriate the Committee may determine that alternative arrangements for the provision of retirement benefits may apply. When determining pension arrangements for new appointments the Board will give regard to the cost of the arrangements, market practice and the pension arrangements received elsewhere in the Group.
• 10% of base salary (pension contribution and/or cash alternative).
None

AVEVA GROUP PLC ANNUAL REPORT AND ACCOUNTS 201752
REMUNERATION COMMITTEE REPORT CONTINUED
Purpose and link to strategy Operation Maximum opportunity Performance measures
Benefits• Help recruit and retain
employees• Provide a competitive
range of valued benefits
• Assist toward early return to work in the event of illness or injury
• The benefit policy is to provide an appropriate level of benefit taking into account market practice at other companies of similar size and complexity and the level of benefits provided for other employees in the Group.
• In line with benefits provided for other senior employees in the Group, Executive Directors currently receive a mobility allowance or company car, a fuel allowance and an annual allowance toward a range of benefits.
• In the event that an Executive Director was required to re-locate to undertake their role, the Committee may provide additional benefits to reflect the relevant circumstances (on a one-off or ongoing basis).
• Benefits are reviewed by the Committee in the context of market practice from time to time and the Committee may introduce or remove particular benefits if it is considered appropriate to do so.
• If the Company were to operate an all-employee share plan in the future, Executive Directors would be entitled to participate in the plan on the same terms as other employees.
• The cost of benefit provision will depend on the cost to the Company of providing individual items and the individual’s circumstances.
• However, the addition of further benefits than those already provided (excluding relocation/recruitment-related benefits and participation in any all-employee share plan) will not result in the aggregate benefit provision for any Executive Director increasing to over £50,000.
• None
Annual Incentive Scheme • Incentivises and
rewards the achievement of annual financial and strategic business targets and delivery of personal objectives.
• Deferred element encourages long-term shareholding, helps retention and discourages excessive risk-taking.
• The Committee determines an individual’s maximum incentive opportunity taking into account the responsibilities of the role and market practice at comparable companies.
• Performance targets are set by the Committee on an annual basis and ordinarily disclosed retrospectively.
• The Committee determines the level of bonus paid taking into account performance against targets, the underlying performance of the business and Executive Directors’ performance during the year.
• 40% of any bonus earned is deferred into shares under the Deferred Share Scheme(1), to which malus/clawback provisions apply(2).
• The maximum bonus opportunity is 125% of base salary.
• The performance measures applied may be financial or non-financial and corporate, divisional or individual and in such proportions as the Committee considers appropriate.
• Where a sliding scale of targets is used, attaining the threshold level of performance for any measure will not typically produce a payout of more than 20% of the maximum portion of overall annual bonus attributable to that measure, with a sliding scale to full payout for maximum performance. However, the annual bonus plan remains a discretionary arrangement and the Committee retains a standard power to apply its judgement to adjust the outcome of the annual bonus plan for any performance measure should it consider that to be appropriate (e.g. if the provisional bonus outturn does not in the Committee’s view reflect overall shareholder expectations).
GOVERNANCE REPORT 53
Purpose and link to strategy Operation Maximum opportunity Performance measures
The AVEVA Group Long-Term Incentive Plan (the LTIP) • Establishes a
motivational and performance-orientated structure to incentivise Directors to focus on the creation of shareholder value aligned with the longer term strategy for the Group.
• Awards vest based on performance over a period of three years and are subject to a subsequent two-year holding period.
• Awards under the LTIP may be granted in the form of conditional awards or nominal cost options or phantom options which will be settled in cash.
• Dividends can accrue on shares during the vesting period.
• The Committee determines targets each year to ensure that targets are stretching and represent value creation for shareholders while remaining motivational for management.
• The Committee shall determine the extent to which the awards will vest based on performance against targets and taking into consideration the wider performance of the Group.
• Malus/clawback provisions apply(2).
• Awards over shares worth no more than 75% of salary may be made each year (assuming a grant of restricted shares in the same year).
• The maximum limit under the plan rules remains 250% of base salary.
• The Committee may set such performance conditions on awards as it considers appropriate, whether financial or non-financial and whether corporate, divisional or individual.
• Performance periods may be over such periods as the Committee selects at grant, which will not normally be less than, but may be longer than, three years.
• Where a sliding scale of targets is used, attaining the threshold level of performance for any measure will not typically produce a vesting of more than 25% of the maximum portion of overall award attributable to that measure, with a sliding scale to full payout for maximum performance.
• The Committee may in its judgement adjust the vesting outturn should it consider that to be appropriate (e.g. if the provisional vesting outturn does not in the Committee’s view reflect overall shareholder experience).
The AVEVA Restricted Share Plan (RSP)• Ensures continual
alignment to shareholders’ interests.
• Awards normally vest over a period of three years and are subject to a subsequent two-year holding period.
• Dividends can accrue on shares during the vesting period.
• Malus/clawback provisions apply(2).
• Awards over shares worth no more than 35% of salary may be made each year.
• None, although the Committee reserves the right to reduce or withhold granting of restricted shares.
Policy table footnotes(1) Deferred awards will normally deliver the shares to participants in three equal tranches, one in each of the three years following the year in which an award is granted. The
Committee has discretion to determine an alternative vesting profile. Dividends can accrue on deferred shares during the deferral period.(2) Awards granted under the Deferred Share Scheme and the Restricted Share Plan and, from 2012 onwards, under the LTIP, are subject to malus and clawback provisions.
Those provisions may apply at the discretion of the Committee if accounts are corrected or published that indicate the relevant performance was materially worse than in the accounts used to assess vesting. Other elements of remuneration are not subject to malus or clawback.

AVEVA GROUP PLC ANNUAL REPORT AND ACCOUNTS 201754
REMUNERATION COMMITTEE REPORT CONTINUED
Stating maximum amounts for the Directors’ Remuneration PolicyThe Regulations and related investor guidance encourages companies to disclose a cap within which each element of the Directors’ Remuneration Policy will operate. Where maximum amounts for elements of remuneration have been set within the Directors’ Remuneration Policy, these will operate simply as caps and are not indicative of any aspiration.
Travel and hospitalityWhile the Committee does not consider it to form part of benefits in the normal usage of that term, it has been advised that corporate hospitality, whether paid for by the Company or another, and business travel for Directors and in exceptional circumstances their families may technically come within the applicable rules and so the Committee expressly reserves the right for the Committee to authorise such activities within its agreed policies.
Committee discretionThe Committee reserves the right to make any remuneration payments and payments for loss of office (including the exercise of any discretions available to it in connection with such payments) notwithstanding that they are not in line with the Policy set out above where the terms of the payment were agreed (i) before the Policy came into effect or (ii) at a time when the relevant individual was not a Director of the Company and, in the opinion of the Committee, the payment was not in consideration for the individual becoming a Director of the Company. For these purposes ‘payments’ include the Committee satisfying awards of variable remuneration and an award over shares is ‘agreed’ at the time the award is granted.
The Committee may operate the LTIP, the RSP, the annual bonus and the Deferred Share Scheme in accordance with their terms. This includes:• The selection of participants;• The timing of grant of an award/bonus opportunity;• The size of an award/bonus opportunity subject to the maximum limits set out in the policy table; • The determination of performance against targets and resultant vesting/bonus payouts;• Discretion required when dealing with a change of control or restructuring of the Group;• Determination of the treatment of leavers based on the rules of the plan and the appropriate treatment chosen;• Adjustments required in certain circumstances (e.g. rights issues, corporate restructuring events and special
dividends); and • The annual review of performance measures, weightings and targets from year-to-year.
In addition, while performance measures and targets used in the annual bonus plan and LTIP will generally remain unaltered, if events occur which, in the Committee’s opinion, would make a different or amended target a fairer measure of performance, the Committee can make such amendments to the targets as it considers appropriate.
Any use of these discretions would, where relevant, be explained in the Remuneration Committee Report and may, where appropriate and practicable, be the subject of consultation with the Company’s major shareholders. In addition, for the avoidance of doubt, in approving this policy report, authority is given to the Company to honour any commitments entered into with current or former Directors prior to the adoption of this policy. The Committee may also make minor amendments to the Policy set out above (for regulatory, exchange control, tax or administrative purposes or to take account of a change in legislation) without obtaining shareholder approval for that amendment.
Remuneration arrangements throughout the Group Throughout the Group, remuneration is determined based on the same principles: that remuneration arrangements should be appropriate for the role without paying more than is necessary and that pay should be structured to incentivise individuals to deliver the objectives of their role. AVEVA employs over 1,700 employees in over 30 locations with roles ranging from administrators to technical specialists and sales staff. The structure and level of reward therefore differs from role to role depending on skills, experience, level of seniority and market practice for the role. AVEVA’s sales employees participate in commission plans that are designed to encourage the growth objectives of the Group. Around 300 employees have annual bonus plans with 10 receiving a portion of bonus in shares which is deferred for up to three years; all other employees are eligible for a Group Discretionary Award or similar, subject primarily to the Group’s financial performance and secondarily subject to individual performance. The most senior management participate in the LTIP and RSP.

GOVERNANCE REPORT 55
Selection of performance measures The Committee’s guiding principle is that remuneration arrangements that operate throughout the Group should support the delivery of our long-term business strategy and therefore the creation of shareholder value. Our key long-term strategic priority is to deliver strong but sustainable profit streams to support the delivery of this strategic priority. The metrics used in our annual bonus arrangements and LTIP are chosen with this in mind, with the payment of bonuses and the vesting of long-term incentives subject to stretching targets established by the Committee at the beginning of each performance period. These targets are set taking account of internal forecasts of performance over the performance period, the markets in which the Group operates, our long-term growth ambitions and the expectations of the investment community on the Group’s future potential performance.
Remuneration Policy for new hires When determining the remuneration package for a newly appointed Executive Director, the Committee would seek to apply the following principles: • The package should be market competitive to facilitate the recruitment of an individual of sufficient calibre to lead the
business. At the same time, the Committee would intend to pay no more than it believes is necessary to secure the required talent.
• The structure of the ongoing remuneration package would normally include the components set out in the policy table for Executive Directors.
• Where an individual forfeits outstanding variable pay opportunities or contractual rights as a result of their appointment, the Committee may offer compensatory payments or awards, in such form as the Committee considers appropriate taking into account relevant factors, which may include the form of awards, expected value and vesting timeframe of forfeited opportunities. When determining such ‘buy-outs’ the guiding principle would be that awards would generally be on a ‘like for like’ basis to those forfeited unless not considered appropriate.
• To facilitate awards outlined above, in the event of recruitment, the Committee may grant awards to a new Executive Director in accordance with Listing Rule 9.4.2. This provision permits the granting of awards to facilitate, in unusual circumstances, the recruitment of an Executive Director, without seeking prior shareholder approval.
• The maximum level of variable remuneration which may be awarded (excluding any ‘buy-out’ awards) is in accordance with limits on the Company’s incentive plans as set out in the policy table.
• Where an Executive Director is required to relocate to take-up their role, the Committee may provide reasonable assistance with relocation (either via one-off or on-going payments or benefits) taking into account the individual’s circumstances and prevailing market practice.
• In the event that an internal candidate is promoted to the Board, legacy terms and conditions would normally be honoured, including pension entitlements and any outstanding incentive awards.
Executive Director service contracts and policy on payment for loss of office When determining leaving arrangements for an Executive Director the Committee takes into account any contractual agreements including the provisions of any incentive arrangements, typical market practice and the performance and conduct of the individual.
The service contracts for current and non-current Executive Directors include the following terms:
Name Date of Contract Date of Appointment Continuous Service Date
Current Executive DirectorsJames Kidd 17 February 2017 1 January 2017 5 January 2004
David Ward 19 July 2016 8 July 2016 17 January 2011
Non-current Executive DirectorsRichard Longdon 8 July 2010 16 August 1994 29 May 1984
AVEVA GROUP PLC ANNUAL REPORT AND ACCOUNTS 201756
REMUNERATION COMMITTEE REPORT CONTINUED
The service agreements are available to shareholders to view on request from the Company Secretary.
Notice Period The CEO’s service contract can be terminated by the Company or the Executive Director on nine months’ notice. The CFO’s service contract can be terminated by the Company or the Executive Director on six months’ notice. The service agreements provide for a period of garden leave not exceeding six months. The Committee will determine the appropriate notice period for any new Director taking into account the circumstances of the individual and market practice. Any notice period will normally be no longer than 12 months. The Committee reserves the right to provide a longer initial notice period of up to 24 months reducing to 12 months over the first 12 months of employment if it considers this to be appropriate.
Payment in lieu of notice
In the event of termination of contract without notice, the Executive Director shall be entitled to a payment in respect of salary for the period of notice. Such payment will normally be made in instalments and subject to mitigation but the Committee shall have discretion to make a single payment if this is considered appropriate.
Annual Bonus The Executive Director may, at the discretion of the Committee, remain eligible to receive an annual bonus for the financial year in which they ceased employment. Such annual bonus award will be determined by the Committee taking into account the circumstances for leaving, time in employment and performance.
Deferred Share Scheme
Death: In the event of a participant’s death unvested awards shall vest. Where awards are in the form of options they may be exercised for a period of up to 12 months from death.
Good leavers: At the discretion of the Committee, leaving by reason of injury, disability, redundancy, the Company for which the participant works leaving the Group or any other reasons determined by the Committee. Awards shall continue in full and vest on the originally anticipated vesting dates. Alternatively, the Committee may determine that awards should vest when the participant ceases employment. Awards in the form of options may be exercised in accordance with the rules of the scheme.
Leavers in other circumstances: Awards will normally lapse.
Long Term Incentive Plan
Good leavers: At the discretion of the Committee, leaving as a result of death, injury, disability, redundancy, retirement, the Company for which the participant works leaving the Group or any other reason. Unvested awards shall continue in existence for the remainder of the performance period. At the end of the performance period, the awards may be permitted to vest to the extent determined in accordance with the applicable performance conditions and, unless the Committee determines otherwise, then reduced to reflect the period that elapsed from the start of the performance period to the date of cessation as a proportion of the performance period.
Leavers in other circumstances: Awards will normally lapse. Vested but unexercised options held by participants who leave employment other than due to gross misconduct may be exercised for a period following cessation of employment.
Restricted Share Plan
Good leavers: At the discretion of the Committee, leaving as a result of death, injury, disability, redundancy, the Company for which the participant works leaving the Group or any other reason. Unvested awards shall continue in existence for the remainder of the vesting period. At the end of the vesting period, the awards may be permitted to vest, unless the Committee determines otherwise, on a pro rata basis to reflect the period that elapsed from the start of the performance period to the date of cessation as a proportion of the performance period.
Leavers in other circumstances: Awards will normally lapse. Vested but unexercised options held by participants who leave employment other than due to gross misconduct may be exercised for a period following cessation of employment.
Other payments An Executive Director who joined the Company before January 2008 and who is made redundant, may receive, in addition to a payment in lieu of notice, any statutory redundancy payment and any other payment to which he is entitled, a payment under the Company’s enhanced redundancy policy. This policy applies to all employees who joined the Company before January 2008. Under the policy, an eligible person will receive a payment calculated by reference to their length of service and weekly pay (by reference to gross annual salary) as follows:• 7 weeks’ pay for service of up to 6 years; plus• 1.5 weeks’ pay for each completed year of service over 7 years up to 20 years; plus • 2 weeks’ pay for each completed year of service over 20 years.
Under the Company’s enhanced redundancy policy, eligible participants, including Executive Directors, may also receive a payment in lieu of a 90 day redundancy consultation period. In the event of termination of an Executive Director’s employment, a payment may be made in lieu of any accrued but untaken holiday. The Remuneration Committee would be responsible for considering the circumstances of the early termination of an Executive Director’s contract and determining whether in exceptional circumstances there should be compensation payments in excess of the Company’s contractual obligations.
The Company has the power to enter into settlement agreements with Directors and to pay compensation to settle potential legal claims. In addition, and consistent with market practice, in the event of the termination of an Executive Director, the Company may make a contribution towards that individual’s legal fees and fees for outplacement services as part of a negotiated settlement. Any such fees will be disclosed as part of the detail of termination arrangements. For the avoidance of doubt, the policy does not include an explicit cap on the cost of termination payments.

GOVERNANCE REPORT 57
Change of control In the event of a change of control or a voluntary winding-up of the Company and ultimately at the discretion of the Remuneration Committee: 1. Unvested awards under the Deferred Share Scheme will vest in full at the time of change of control. 2. Unvested awards granted under the 2014 LTIP rules will vest having regard to the extent to which performance conditions
have been met and unless the Committee determines otherwise, the proportion of the performance period that has elapsed at the date of the change of control or winding-up.
3. Unvested awards granted under the Restricted Share Plan shall vest in proportion to the full vesting period which has elapsed as at the date of change of control.
Employee contextWhen setting Executive Directors’ pay, the Committee considers the remuneration arrangement of other senior managers and employees in the Group more generally to ensure that Executive remuneration arrangements are appropriate in this context. AVEVA undertakes an annual salary review in April each year and uses this opportunity to reward strong performance and ensure salaries are in line with market rates. It manages this in a competitive environment particularly in the fast-growing economic areas. When determining salary increases for Executive Directors the Committee considers the outcome of the wider pay review for the Group. The Committee does not consult directly with employees regarding Executive Directors’ remuneration. However, at regular intervals the Company conducts a survey of the views of employees in respect of their experience of working at AVEVA including their own reward.
Dialogue with shareholders The views of our shareholders on remuneration matters are important to the Committee and prior to making any material changes to remuneration arrangements the Committee consults with major shareholders and their representative bodies to obtain their views (as was the case during the Policy renewal process). The Company remains committed to engaging with shareholders in relation to remuneration issues.
External appointmentsThe Company’s policy is to permit an Executive Director to serve as a Non-Executive Director elsewhere when this does not conflict with the individual’s duties to the Company, and where an Executive Director takes such a role they may be entitled to retain any fees which they earn from that appointment.
Remuneration outcomes in different performance scenariosThe remuneration package at AVEVA is structured so that the package rewards performance over both the short and long term to ensure that reward is aligned with shareholder value creation.
The charts overleaf show hypothetical values of the remuneration package for Executive Directors under three assumed performance scenarios:
CEO CFO
Maximum award opportunities % of salary
Annual incentive schemeLong-term incentives (LTI), assuming both an LTIP and restricted shares award at 75% and 35% of salary respectively
125%110%
125%110%
Minimum • No annual incentive payout (0% of salary)• No vesting under the LTIP, no award under the Restricted Share Plan (RSP)
Mid performance – cash only • 30% of maximum annual incentive payout (38% of salary)• No vesting under the LTIP, no award under the RSP
Mid performance – cash and share options • 50% of maximum annual incentive payout (63% of salary)• 25% vesting under the LTIP plus full award under the RSP
Maximum performance • 100% of maximum annual incentive payout (125% of salary)• 100% of maximum LTI vesting/awards (110% of salary)
No share price growth has been assumed. Potential benefits under all employee share schemes and dividend equivalents have not been included.

AVEVA GROUP PLC ANNUAL REPORT AND ACCOUNTS 201758
REMUNERATION COMMITTEE REPORT CONTINUED
Remuneration Policy for Non-Executive Directors
Approach to setting fees Basis of fees Other items
• Fees for the Chairman and the Non-Executive Directors are determined taking account of the individual’s responsibilities, the expected time commitment for the role and prevalent market rates.
• The Board is responsible for setting fees for the Non-Executive Directors with the Remuneration Committee being responsible for setting fees for the Chairman.
• Fees are reviewed at appropriate intervals, usually on an annual basis.
• Basic fees are subject to the aggregate limit in the Company’s Articles of Association. Any changes in this limit would be subject to shareholder approval.
• Non-Executive Directors are paid a basic fee for membership of the Board with additional fees being paid to Non-Executive Directors who hold the position of Committee Chairman to take into account the additional responsibilities and workload. Additional fees may also be paid for other Board responsibilities or roles if this is considered appropriate.
• The Chairman receives an all-inclusive fee for the role.
• Fees are paid in cash.
• Non-Executive Directors do not receive incentive pay or share awards.
• Non-Executive Directors do not currently receive any benefits nor pension arrangements. Benefits may be provided in the future if, in the view of the Board (or, in the case of the Chairman, the Committee), this was considered appropriate.
• Travel and other reasonable expenses (including fees incurred in obtaining professional advice in the furtherance of their duties) incurred in the course of performing their duties are reimbursed to Non-Executive Directors (including any associated tax liability).
The Non-Executive Directors have appointment letters, the terms of which recognise that their appointments are subject to the Company’s Articles of Association and their services are at the direction of the shareholders.
The letters of appointment for Non-Executive Directors include the following terms:
Name Date of appointment Date of contractExpiry/review date of current contract
Notice periodmonths
Philip Aiken 1 May 2012 1 May 2015 30 April 2018 3
Philip Dayer 7 January 2008 2 January 2014 14 July 2017 3
Jennifer Allerton 9 July 2013 1 July 2016 30 June 2019 3
Christopher Humphrey 8 July 2016 27 June 2016 7 July 2019 3
Ron Mobed 1 March 2017 1 March 2017 29 February 2020 3
All Non-Executive Directors submit themselves for election at the Annual General Meeting following their appointment and subsequent intervals of no more than three years.
There are no predetermined special provisions for Non-Executive Directors with regard to compensation in the event of loss of office. Non-Executive Directors are not entitled to any payments in lieu of notice.
The letters of appointment are available for shareholders to view from the Company Secretary upon request.
33% | 36% | 31% | £1,572k
CEO – James Kidd
50% | 27% | 23% | £1,038k
75% | 25% | £683k
100% | £514k
33% | 36% | 31% | £1,055k
50% | 27% | 23% | £698k
76% | 24% | £462k
100% | £350k
Performance-related rewards (GBP) Fixed pay Annual bonus Long-term incentives
0k 500k 1,000k 1,500k 2,000k
0k 500k 1,000k 1,500k 2,000k
CFO – David Ward
Maximum
Mid
Mid – cash only
Minimum
Maximum
Mid
Mid – cash only
Minimum

GOVERNANCE REPORT 59
PART B: THE IMPLEMENTATION REPORT
The Remuneration CommitteeThe Remuneration Committee is appointed by the Board. The members are Philip Dayer (Chair), Jennifer Allerton, Christopher Humphrey and Ron Mobed. All the Committee members are regarded by the Board as independent Non-Executive Directors. Philip Dayer will be standing down at the AGM on 7 July and Jennifer Allerton will succeed him as the Chair of the Remuneration Committee. Jennifer has been a member of the Remuneration Committee since 2013.
The role of the Committee is set out in its terms of reference which are available on the Company’s website at www.aveva.com. The Committee’s primary responsibility is to determine the remuneration package of both the Company’s Executive Directors and its senior management within broad policies agreed with the Board.
FIT Remuneration Consultants (FIT) are the appointed advisors to the Committee. They provide independent advice on comparator information and general remuneration. Fees are charged on a time spent basis and the fees paid during the year to FIT in relation to the advice provided to the Committee were £61,019. FIT provide no other services to the Company and so the Committee is content that their advice is objective and independent.
By invitation, James Kidd and Clare Bye (EVP, Human Resources) attend the meetings to provide company insight and advice to help the Committee consider appropriate remuneration. Neither would be in attendance during any discussion of their own remuneration.
Six meetings were held during the year, which is higher than usual due to the revision of the Directors’ Remuneration Policy. Attendance at the meetings is shown on page 38 of the Corporate Governance section of the Annual Report.
The auditor has reported on certain sections of Part B and stated whether, in their opinion, those parts have been properly prepared in accordance with the Companies Act 2006. Those sections of Part B which have been subject to audit are clearly indicated.
Shareholder voting at the 2014 and 2016 AGMThe table below shows the results of the vote on last year’s implementation vote and the most recent policy vote in 2014.
Votes for Percentage Votes against Percentage Votes withheld
Directors’ Remuneration Policy – AGM 2014 51,530,628 97.31% 1,422,153 2.69% 53,176
Directors’ Remuneration Report – AGM 2016 54,373,504 97.79% 1,222,397 2.20% 11,938
Implementation of policy for 2017/18Base salaryWhilst salaries for the Executive Directors would normally be reviewed annually, the promotion of James Kidd to Deputy CEO (formerly CFO) in July 2016 and subsequently to CEO in January 2017 has resulted in increases to salary during the year.
Base salary with effect from James Kidd Increase David Ward Increase
1 April 2016 £306,000 n/a
8 July 2016 £350,000 14.4% £230,000 n/a
1 January 2017 £400,000 14.3% £230,000 n/a
1 April 2017 £450,000 12.5% £300,000 30.0%
BenefitsIn line with benefits provided for other senior employees, in 2017/18 Executive Directors will be provided with a company car allowance, a fuel allowance and a £600 annual allowance towards a range of flexible benefits. Pension James Kidd and David Ward are members of the AVEVA Group Personal Pension Plan (a defined contribution scheme). James Kidd receives a cash in lieu allowance in line with the detail in the policy table. Their pension contributions will remain 10% of salary.
Annual Incentive SchemeFor 2017/18, the maximum opportunity for Executive Directors under the annual incentive will continue to be 125% of base salary although the out-performance element has been incorporated into the core scheme, albeit still requiring a stretch level of performance for full payout. The half year element has been removed.

REMUNERATION COMMITTEE REPORT CONTINUED
AVEVA GROUP PLC ANNUAL REPORT AND ACCOUNTS 201760
The financial performance targets are based on (1) Group adjusted profit before tax (PBT) targets, with a maximum weighting of 80% of salary, and (2) recurring revenue, with a maximum weighting of 25% of salary. A further maximum of 20% of salary is available for the delivery of key individual performance objectives which are agreed with the Remuneration Committee at the start of each financial year, although this element will be capped at a maximum achievement of 10% should the Group adjusted PBT target not be met.
The Board believes that, given the annual incentive scheme rewards the achievement of the annual business plan, the targets are market sensitive and therefore should not be disclosed in advance, but ordinarily will be disclosed retrospectively.
As a simplification of the previous deferral calculation, 40% of any award made under the Annual Incentive Scheme, irrespective of the amount, will be payable in deferred shares as per the policy table.
Long-Term IncentivesAs described in the introduction to the Remuneration Committee report, it is currently proposed that the structure of the LTIs will change, as summarised below:
Previous LTI arrangement New LTI arrangement
Traditional LTIP: 150% of salary 75% of salary
EPS growth 150% of salary 37.5% of salary
Relative TSR performance nil 18.75% of salary
Strategic objectives nil 18.75% of salary
Restricted Share Plan nil 35% of salary
Total Long-Term Incentives 150% of salary 110% of salary
Further details of the performance conditions are as follows:
• The adjusted EPS growth targets are:
Adjusted EPS growth targets p.a.Proportion of vesting (% of total award)
5% 25%10% 80%15% 100%
• The relative TSR performance condition will measure AVEVA against the FTSE 250 (excluding Investment Trusts, Financial Services and Real Estate sector companies). 25% of this element will vest at median, with full vesting at the upper quartile.
• The strategic objectives will be a sliding scale of revenue growth targets. 25% of this element (for each revenue target) will vest at threshold levels of performance, with full vesting at maximum achievement. The revenue growth criteria are as follows: – Half of this portion will vest based on performance against a sliding scale of targets relating to three-year growth in
revenue from Owner Operators (OOs). – The remaining half of this portion will vest based on performance against a sliding scale of targets relating to three-year
revenue growth in ‘More than 3D’. – Due to commercial sensitivity, the Committee does not believe it to be in shareholders’ interests to prospectively
disclose details of the revenue growth targets. However, they will be objectively measurable over a three-year period, significant outperformance will be required to deliver full vesting, the targets will be disclosed retrospectively following vesting, and vesting will only occur if the Committee is satisfied that the Company’s underlying financial performance warrants such payment.

GOVERNANCE REPORT 61
Single total figure of remuneration for Executive Directors (audited)The following table sets out the single figure of total remuneration for Executive Directors for the 2016/17 and 2015/16 financial years.
Salary£000
Benefits£000
Annual bonus£000
LTIPs£000
Pension£000
Total£000
Richard Longdon 2016/17(resigned 31 December 2016) 371 24 — — — 395
Richard Longdon 2015/16 485 27 49 — — 561
James Kidd 2016/17 as CEO(appointed 1 January 2017) 100 5 14 — 8 127
James Kidd 2016/17 as Deputy CEO(appointed 8 July 2016) 175 10 31 — 14 230
James Kidd 2016/17 as CFO 76 5 18 — 8 107
James Kidd 2015/16 as CFO 300 20 30 — 30 380
David Ward 2016/17(appointed 8 July 2016) 168 15 31 — 17 231
David Ward 2015/16 — — — — — —
Elements of single figure of remuneration Base salaryThe base salary for Richard Longdon was £495,000 (2015/16 – £485,000) until he stepped down at the end of December 2016. James Kidd’s salary in 2016/17 was £306,000 (2015/16 – £300,000) until his promotion to Deputy CEO in July 2016 when it increased to £350,000 with a further increase to £400,000 when he became CEO in January 2017. David Ward joined the Board as CFO on 8 July 2016, with a base salary of £230,000.
BenefitsIn 2016/17 and 2015/16 Executive Directors were provided with a company car or a car allowance, a fuel allowance and a £500 annual allowance towards a range of flexible benefits. From 1 January 2017, the annual allowance for flexible benefits increased for all UK employees (including for the Executive Directors) to £600 per annum.
Pension James Kidd and David Ward are members of the AVEVA Group Personal Pension Plan (a defined contribution scheme). The Company contributed 10% of salary to the plan during 2016/17 for David Ward. In line with policy a cash alternative was paid to James Kidd.
Annual incentive This reflects the total annual incentive paid and payable in 2017 based on performance in the year ended 31 March 2017. This includes both the cash element of the bonus and the portion deferred into shares under the deferred share scheme.
The majority of the annual incentive is dependent on achieving Group adjusted profit before tax (PBT) performance targets. 10% of the core award was dependent on achieving the half year PBT target of £9.7m. This was a binary target, paying out either nothing or in full. The actual achievement was £9.1m, thereby resulting in no payout. 80% was dependent on full year adjusted PBT performance, with nothing paying out if achievement was below £54.15m, and fully paying out if achievement reached £62.70m. The actual achievement was £55.0m. This resulted in an achievement of 10.0% of the 80% PBT element, representing 8% of scheme value.
The Executive Directors were given individual performance objectives which comprise the remaining 10% of the annual incentive. When determining the level of achievement for this portion of the bonus the Committee considered that James Kidd had met this element having made some key appointments to his senior management team and introduced major organisational structure changes, along with a new operating model and responsibility matrix to underpin these. These changes will support the Company strategy in the future. A clear business plan identifying the Company’s strategic drivers and how these can be leveraged and measured has also been delivered. The Committee considered David Ward’s targets as met as he has achieved specific tasks in the areas of risk management, internal audit, the adoption of IFRS 15 and AVEVA’s commercial and contract function.

AVEVA GROUP PLC ANNUAL REPORT AND ACCOUNTS 201762
REMUNERATION COMMITTEE REPORT CONTINUED
As per the policy in force relating to 2017 annual incentive payments, for bonus achievements of less than 70% of the potential maximum core bonus, then 75% will be paid in cash and the remaining 25% will be paid in deferred shares, with no further performance conditions. The amounts are summarised in the table below.
2017Cash bonus
£000Deferred bonus
£000Total bonus
£000
Richard Longdon — — —
James Kidd 47 16 63
David Ward 23 8 31
Long-term incentives This includes the LTIP awards granted under the Long-Term Incentive Plan in 2014 that were capable of vesting based on performance in the three-year period ended 31 March 2017.
These awards were subject to the delivery of EPS growth. 0% of awards vest for diluted adjusted EPS growth of less than 12% p.a., with 100% of awards vesting for diluted adjusted EPS growth of 20% p.a. Average diluted EPS growth for the three-year performance period did not reach the minimum 12% p.a. growth needed and therefore 0% of the LTIP awards will vest for the period relating to 2016/17.
Other information in relation to 2016/17Scheme interests awarded in the year (audited)The following tables set out details of the LTIP 2014 and deferred share awards made to the Executive Directors during 2016/17:
2014 LTIPPerformance measures are based on diluted adjusted EPS growth. 25% vests for diluted adjusted EPS growth of 5% p.a. and 100% vests for diluted adjusted EPS growth of more than 15% p.a. Linear interpolation applies between these points.
Executive Director Date of grant Basis of Award Face Value of Awards1 Performance Period
Richard Longdon13 July 2016
150% of base salary £742,500 1 April 2016 – 31 March 2019James Kidd 150% of base salary £525,000David Ward 120% of base salary £276,000
1 To determine the number of shares over which these awards were made a share price of 1,780p was used which was the average share price for the five days prior to the award.
Deferred Share Awards
Executive Director Date of grant Basis of Award Face Value of Awards2 Performance Period
Richard Longdon
25 July 2016 Deferred element of2015/16 annual incentive
£12,112 No performance period. Awards vest in equal tranches on the date of announcement in May 2017, May 2018 and May 2019 James Kidd £7,488
2 This is calculated as the number of deferred shares issued in the year, multiplied by the closing share price the day before the preliminary announcement (23 May 2016) of 1,600p.
Shareholding guidelines and interests in shares (audited)Executive Directors are required to build up a shareholding from vested Long-term incentive awards. Shares are valued for these purposes at the year end price, which was 1,950p at 31 March 2017.
Share ownership
guideline as a % of base salary
Have guidelines been met?
Actual share ownership (as a % of base salary)
Shares owned outright at end of year
2016/17 2015/16 2016/17 2015/16
Richard Longdon 200% Yes 1,337% 825% 257,105 253,974James Kidd 200%1 On-target 85% 82% 17,468 15,563David Ward 100%1 On-target 5% n/a 555 n/a
1 Share ownership guidelines will be increased to 300% should Restricted Share Plan awards be granted.
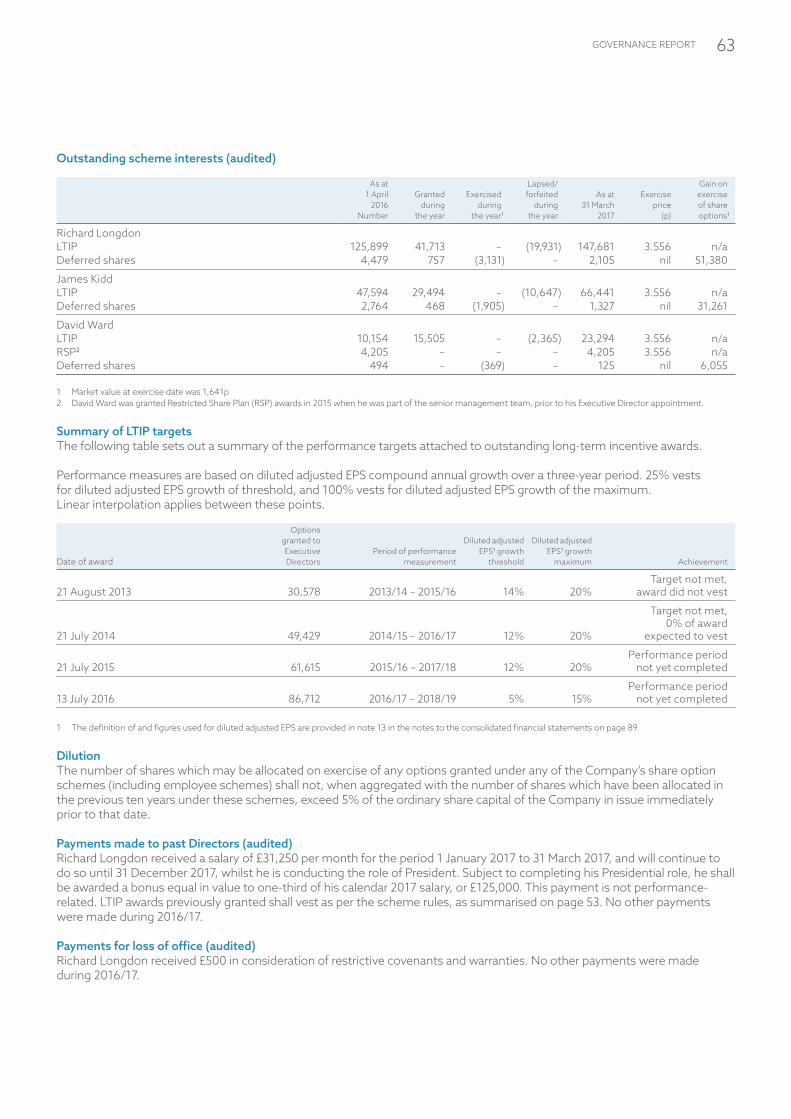
GOVERNANCE REPORT 63
Outstanding scheme interests (audited)
As at 1 April
2016Number
Granted during
the year
Exercised during
the year1
Lapsed/forfeited
during the year
As at 31 March
2017
Exercise price
(p)
Gain on exercise of share options1
Richard LongdonLTIP 125,899 41,713 – (19,931) 147,681 3.556 n/aDeferred shares 4,479 757 (3,131) – 2,105 nil 51,380
James KiddLTIP 47,594 29,494 – (10,647) 66,441 3.556 n/aDeferred shares 2,764 468 (1,905) – 1,327 nil 31,261
David WardLTIP 10,154 15,505 – (2,365) 23,294 3.556 n/aRSP2 4,205 – – – 4,205 3.556 n/aDeferred shares 494 – (369) – 125 nil 6,055
1 Market value at exercise date was 1,641p2 David Ward was granted Restricted Share Plan (RSP) awards in 2015 when he was part of the senior management team, prior to his Executive Director appointment.
Summary of LTIP targets The following table sets out a summary of the performance targets attached to outstanding long-term incentive awards.
Performance measures are based on diluted adjusted EPS compound annual growth over a three-year period. 25% vests for diluted adjusted EPS growth of threshold, and 100% vests for diluted adjusted EPS growth of the maximum. Linear interpolation applies between these points.
Date of award
Options granted to Executive Directors
Period of performance measurement
Diluted adjusted EPS1 growth
threshold
Diluted adjusted EPS1 growth
maximum Achievement
21 August 2013 30,578 2013/14 – 2015/16 14% 20%Target not met,
award did not vest
21 July 2014 49,429 2014/15 – 2016/17 12% 20%
Target not met, 0% of award
expected to vest
21 July 2015 61,615 2015/16 – 2017/18 12% 20%Performance period
not yet completed
13 July 2016 86,712 2016/17 – 2018/19 5% 15%Performance period
not yet completed
1 The definition of and figures used for diluted adjusted EPS are provided in note 13 in the notes to the consolidated financial statements on page 89.
DilutionThe number of shares which may be allocated on exercise of any options granted under any of the Company’s share option schemes (including employee schemes) shall not, when aggregated with the number of shares which have been allocated in the previous ten years under these schemes, exceed 5% of the ordinary share capital of the Company in issue immediately prior to that date.
Payments made to past Directors (audited)Richard Longdon received a salary of £31,250 per month for the period 1 January 2017 to 31 March 2017, and will continue to do so until 31 December 2017, whilst he is conducting the role of President. Subject to completing his Presidential role, he shall be awarded a bonus equal in value to one-third of his calendar 2017 salary, or £125,000. This payment is not performance-related. LTIP awards previously granted shall vest as per the scheme rules, as summarised on page 53. No other payments were made during 2016/17.
Payments for loss of office (audited)Richard Longdon received £500 in consideration of restrictive covenants and warranties. No other payments were made during 2016/17.
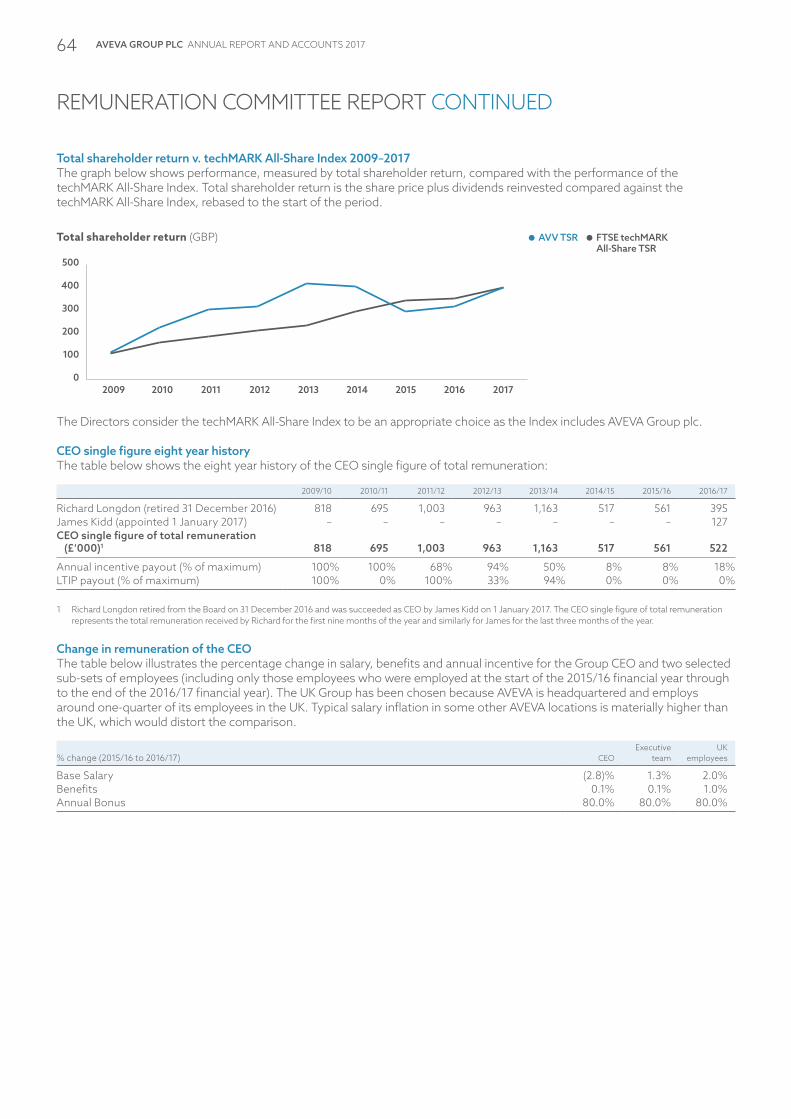
AVEVA GROUP PLC ANNUAL REPORT AND ACCOUNTS 201764
REMUNERATION COMMITTEE REPORT CONTINUED
Total shareholder return v. techMARK All-Share Index 2009–2017The graph below shows performance, measured by total shareholder return, compared with the performance of the techMARK All-Share Index. Total shareholder return is the share price plus dividends reinvested compared against the techMARK All-Share Index, rebased to the start of the period.
2009 2010 2011 2012 2013 2014 2015 201720160
100
200
300
400
500
Total shareholder return (GBP) AVV TSR FTSE techMARKAll-Share TSR
The Directors consider the techMARK All-Share Index to be an appropriate choice as the Index includes AVEVA Group plc.
CEO single figure eight year historyThe table below shows the eight year history of the CEO single figure of total remuneration:
2009/10 2010/11 2011/12 2012/13 2013/14 2014/15 2015/16 2016/17
Richard Longdon (retired 31 December 2016) 818 695 1,003 963 1,163 517 561 395James Kidd (appointed 1 January 2017) – – – – – – – 127CEO single figure of total remuneration
(£‘000)1 818 695 1,003 963 1,163 517 561 522
Annual incentive payout (% of maximum) 100% 100% 68% 94% 50% 8% 8% 18%LTIP payout (% of maximum) 100% 0% 100% 33% 94% 0% 0% 0%
1 Richard Longdon retired from the Board on 31 December 2016 and was succeeded as CEO by James Kidd on 1 January 2017. The CEO single figure of total remuneration represents the total remuneration received by Richard for the first nine months of the year and similarly for James for the last three months of the year.
Change in remuneration of the CEO The table below illustrates the percentage change in salary, benefits and annual incentive for the Group CEO and two selected sub-sets of employees (including only those employees who were employed at the start of the 2015/16 financial year through to the end of the 2016/17 financial year). The UK Group has been chosen because AVEVA is headquartered and employs around one-quarter of its employees in the UK. Typical salary inflation in some other AVEVA locations is materially higher than the UK, which would distort the comparison.
% change (2015/16 to 2016/17) CEOExecutive
teamUK
employees
Base Salary (2.8)% 1.3% 2.0%Benefits 0.1% 0.1% 1.0%Annual Bonus 80.0% 80.0% 80.0%

GOVERNANCE REPORT 65
Relative importance of spend on payThe chart below illustrates the year-on-year change in total remuneration for all employees in the Group compared to adjusted profit before tax and distributions to shareholders. The Committee determined adjusted profit before tax was an appropriate measure for this chart as it is one of the Group’s key performance indicators and is the primary measure for the annual incentive scheme.
98.2Employeestaff costs
107.0 | +9.0%
Relative importance of spend on pay (GBP) 2015/162016/17
51.2Adjusted profitbefore tax
55.0 | +7.4%
19.8Dividendspaid1
27.5 | +38.7%
1 Dividends paid during the year represent the final dividend from the previous year plus the interim dividend from the reported year. AVEVA rebalanced the weighting of its interim and final dividend in 2016/17, increasing the proportion of the interim dividend by 117% over the prior year.
Outside appointmentsThe Board believes that accepting Non-Executive appointments with other companies enhances the experience of Executive Directors and therefore they are entitled to accept appointments outside of the Company provided that Board approval is sought prior to accepting the appointment. Whether or not the Director concerned is permitted to retain their fees is considered on a case-by-case basis. Neither James nor David currently hold any outside appointments.
Total pension entitlements Richard Longdon is a deferred member of the CADCentre Pension Scheme, a defined benefit pension scheme for which AVEVA Solutions Ltd is the principal employer, and has accrued the maximum benefit he is entitled to.
The plan is a contributory, funded, occupational scheme registered with HM Revenue and Customs (HMRC) and, since 1 October 2004, Career Average Revalued Earning benefits apply. He is entitled to a pension on normal retirement, or on retirement due to ill health, equivalent to two-thirds of his pensionable salary provided he has completed (or would have completed in the case of ill health) 25 years’ service. A lower pension is payable on earlier retirement after the age of 55 by agreement with the Company and subject to HMRC guidelines. Pensions are payable to dependants on his death in retirement and a lump sum is payable if death occurs in service.
Richard’s accrued entitlements under the pension scheme are as follows:
Accumulated accrued pension at
31 December 2016 £
Accumulated accrued pension at
31 March 2016 £
Increase in accrued pension
during year £
Increase in accrued pension during the year,
after removing the effects of inflation
£
Transfer value of increase, after removing
the effects of inflation, less Director’s contributions
£
Richard Longdon 165,810 166,354 (544) – –
The pension entitlement shown is that which would be paid annually, based on service to the end of the year.
The transfer values have been calculated in accordance with the transfer value basis adopted by the Trustee Board.
31 December 2016
£
31 March 2016
£
Movement, less Director’s contributions
£
Richard Longdon 5,037,614 4,543,317 494,297
James Kidd and David Ward are both members of the AVEVA Group Personal Pension Plan. Both are subject to a cap on pension contributions of £10,000 per annum. David was able to utilise unused carryover from previous years, whereas James has no carryover available and thus elected to receive a cash alternative, as allowed under the policy. During 2016/17 in their capacity as Directors, David received employer contributions of £16,794 (2015/16 – £nil) and James received cash in lieu of contributions of £30,300 (2015/16 – £30,000).
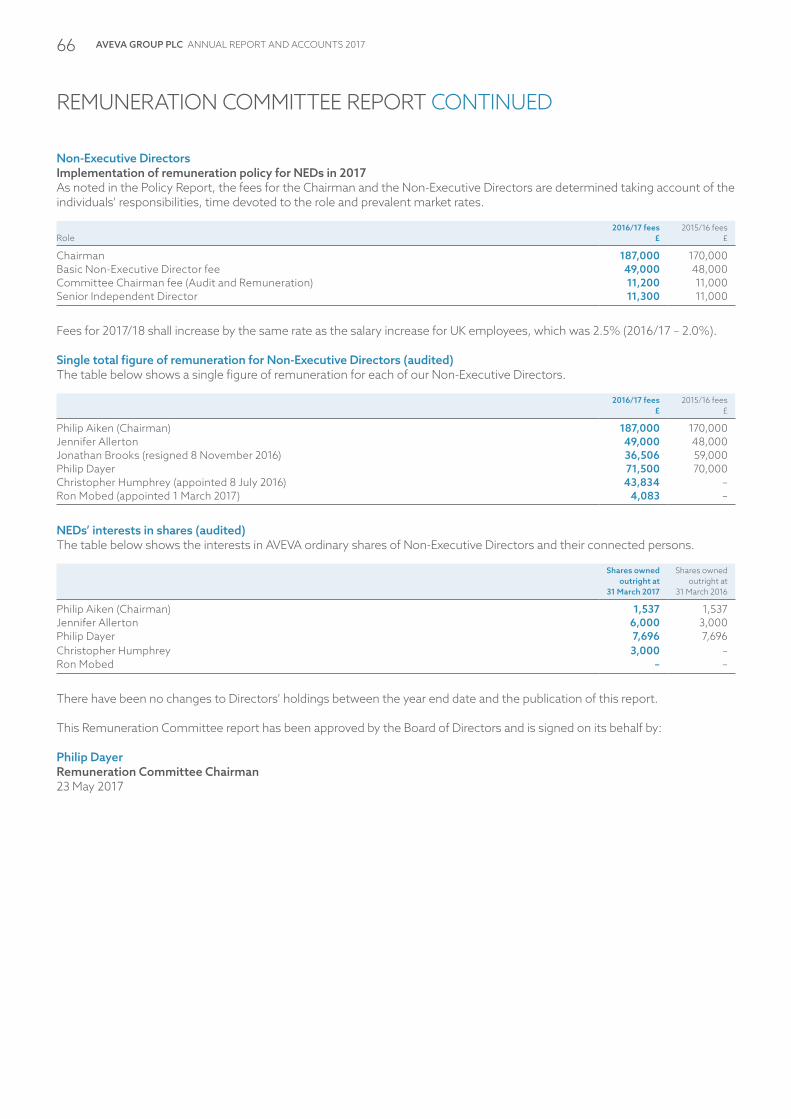
AVEVA GROUP PLC ANNUAL REPORT AND ACCOUNTS 201766
Non-Executive DirectorsImplementation of remuneration policy for NEDs in 2017As noted in the Policy Report, the fees for the Chairman and the Non-Executive Directors are determined taking account of the individuals’ responsibilities, time devoted to the role and prevalent market rates.
Role2016/17 fees
£2015/16 fees
£
Chairman 187,000 170,000Basic Non-Executive Director fee 49,000 48,000Committee Chairman fee (Audit and Remuneration) 11,200 11,000Senior Independent Director 11,300 11,000
Fees for 2017/18 shall increase by the same rate as the salary increase for UK employees, which was 2.5% (2016/17 – 2.0%).
Single total figure of remuneration for Non-Executive Directors (audited)The table below shows a single figure of remuneration for each of our Non-Executive Directors.
2016/17 fees £
2015/16 fees £
Philip Aiken (Chairman) 187,000 170,000Jennifer Allerton 49,000 48,000Jonathan Brooks (resigned 8 November 2016) 36,506 59,000Philip Dayer 71,500 70,000Christopher Humphrey (appointed 8 July 2016) 43,834 –Ron Mobed (appointed 1 March 2017) 4,083 –
NEDs’ interests in shares (audited)The table below shows the interests in AVEVA ordinary shares of Non-Executive Directors and their connected persons.
Shares owned outright at
31 March 2017
Shares owned outright at
31 March 2016
Philip Aiken (Chairman) 1,537 1,537Jennifer Allerton 6,000 3,000Philip Dayer 7,696 7,696Christopher Humphrey 3,000 –Ron Mobed – –
There have been no changes to Directors’ holdings between the year end date and the publication of this report.
This Remuneration Committee report has been approved by the Board of Directors and is signed on its behalf by:
Philip DayerRemuneration Committee Chairman23 May 2017
REMUNERATION COMMITTEE REPORT CONTINUED

GOVERNANCE REPORT 67
OTHER STATUTORY INFORMATIONResults and dividendsThe Group made a profit for the year after taxation of £38.1 million (2016 – £20.5 million). Revenue was £215.8 million (2016 – £201.5 million) and comprised software licences, software maintenance and services.
The Directors recommend the payment of a final dividend of 27.0 pence per ordinary share (2016 – 30.0 pence), bringing the total dividend for the year to 40.0 pence (2016 – 36.0 pence). If approved at the forthcoming Annual General Meeting, the final dividend will be paid on 4 August 2017 to shareholders on the register at close of business on 7 July 2017.
Business review and future developmentsA review of the Group’s operations during the year and its plans for the future are given in the Chairman’s statement, the Chief Executive’s strategic review and the Finance review.
The Key Performance Indicators used by AVEVA to measure its own performance at the Group level include total revenue, recurring revenue, adjusted profit before tax, adjusted earnings per share and headcount. The figures for the year ended 31 March 2017 are set out on page 21, together with figures for the previous year, and a discussion of the principal risks and uncertainties facing the Group is included on pages 30 to 31.
Research & DevelopmentThe Group has an active programme of Research & Development which covers the updating of, and extension to, the Group’s range of products.
Intellectual propertyThe Group owns intellectual property both in its software tools and the products derived from them. The Directors consider such properties to be of significant value to the business and have a comprehensive programme to protect it.
Financial instrumentsThe Group’s financial risk management objectives and policies are discussed in note 23 to the consolidated financial statements.
Directors and their interestsThe current Directors are shown, together with brief biographical details, on pages 42 and 43. Resolutions will be submitted to the Annual General Meeting for the re-election of all current Directors.
The interests (all of which are beneficial) in the shares of the Company of Directors who held office at 31 March 2017 in respect of transactions notifiable under Disclosure and Transparency Rule 3.1.2 that have been disclosed to the Company are as follows:
At 31 March 2017 ordinary
shares
At 31 March 2016 ordinary
shares
Philip Aiken 1,537 1,537Philip Dayer 7,696 7,696Jennifer Allerton 6,000 3,000Chris Humphrey 3,000 –Ron Mobed – –James Kidd 17,468 15,563David Ward 555 –
No changes took place in the interests of Directors in the shares of the Company between 31 March 2017 and 23 May 2017.
Directors’ share options are disclosed in the Remuneration Committee report on pages 47 to 66.
No Director had a material interest in any significant contract, other than a service contract or contract for services, with the Company or any of its subsidiaries at any time during the year.
Conflict of interestThroughout the year the Company has operated effective procedures to deal with potential or actual conflicts of interest. During the year no conflict arose requiring the Board to exercise its authority or discretion.
Share capitalDetails of the issued share capital can be found in note 27 to the consolidated financial statements. The rights attaching to the Company’s shares are set out in its Articles of Association.
Subject to any restrictions referred to in the next section, members may attend any general meeting of the Company.
There are no restrictions on the transfer of ordinary shares in the Company other than: certain restrictions which may from time to time be imposed by laws and regulations (for example, insider trading laws); and pursuant to the Listing Rules of the Financial Conduct Authority whereby Directors and certain employees of the Company require the approval of the Company to deal in the ordinary shares and pursuant to the Articles of Association where there is default in supplying the Company with information concerning interests in the Company’s shares. There are no special control rights in relation to the Company’s shares.
Voting rightsSubject to any restrictions below, on a show of hands every member who is present in person or by proxy at a general meeting has one vote on each resolution and, on a poll, every member who is present in person or by proxy has one vote on each resolution for every share of which he/she is the registered member. A proxy will have one vote for and one vote against a resolution on a show of hands in certain circumstances specified in the Articles of Association. The Notice of Annual General Meeting specifies deadlines for exercising rights.

AVEVA GROUP PLC ANNUAL REPORT AND ACCOUNTS 201768
A resolution put to the vote of a general meeting is decided on a show of hands, unless before or on the declaration of the result of the show of hands, a poll is demanded by the Chairman of the meeting. The Articles of the Company also allow members, in certain circumstances, to demand that a resolution is decided by a poll.
A member may vote personally or by proxy at a general meeting. Any form of proxy must be delivered to the Company not less than 48 hours before the time appointed for holding the meeting or adjourned meeting at which the person named in the appointment proposes to vote (for this purpose, the Directors may specify that no account shall be taken of any part of a day that is not a working day). A corporation which is a member of the Company may authorise such persons as it thinks fit to act as its representatives at any general meeting of the Company.
No member shall be entitled to attend or vote, either personally or by proxy, at a general meeting in respect of any share if any call or other sum presently payable to the Company in respect of such share remains unpaid or in certain other circumstances specified in the Articles of Association where there is default in supplying the Company with information concerning interests in the Company’s shares.
Dividends, distributions and liquidationMembers can declare final dividends by passing an ordinary resolution but the amount of the dividends cannot exceed the amount recommended by the Board. The Board can pay interim dividends provided the distributable profits of the Company justify such payment. The Board may, if authorised by an ordinary resolution of the members, offer any member the right to elect to receive new shares, which will be credited as fully paid, instead of their cash dividend. Any dividend which has not been claimed for 12 years after it became due for payment will be forfeited and will then revert to the Company. Members may share in surplus assets on a liquidation.
If the Company is wound up, the liquidator can, with the sanction of the members by special resolution and any other sanction required by law, divide among the members all or any part of the assets of the Company and he/she can value any assets and determine how the divisions shall be carried out as between the members or different classes of members. The liquidator can also transfer the whole or any part of the assets to trustees upon any trusts for the benefit of the members. No members can be compelled to accept any asset which would give them any liability.
There are no agreements between holders of securities that are known to the Company which may result in restrictions on the transfer of securities or on voting rights, save as described below in relation to the Employee Benefit Trust.
Change of controlAll of the Company’s share-based plans contain provisions relating to change of control. Outstanding awards and options normally vest and become exercisable on a change of control, subject to the satisfaction of any relevant performance conditions at that time.
There are no other significant agreements to which the Company is a party that take effect, alter or terminate upon a change of control of the Company following a takeover bid.
There are no agreements between the Company and its Directors or employees providing for compensation for loss of office or employment that occurs because of a takeover bid.
Articles of AssociationAny amendments to the Articles of Association of the Company may be made in accordance with the provisions of the Companies Act by way of special resolution.
Powers of the DirectorsThe business of the Company is managed by the Directors, who may exercise all powers of the Company, subject to the Company’s Articles of Association, relevant statutory law and to any direction that may be given by the Company in general meeting by special resolution. Subject to the Companies Act, shares may be issued by Board resolution. At the Company’s last Annual General Meeting, powers were granted to the Directors (subject to limits set out in the resolutions) to issue and to buy back its own shares; similar powers are proposed to be granted at the forthcoming Annual General Meeting. The buy-back authority was limited to 10% of the Company’s issued share capital. No shares have been bought back under this authority.
Appointment of DirectorsThe Articles of Association limit the number of Directors to not less than two and not more than ten save where members decide otherwise. Members may appoint Directors by ordinary resolution and may remove any Director (subject to the giving of special notice) and, if desired, replace such removed Director by ordinary resolution. New Directors may be appointed by the Board but are subject to election by members at the first Annual General Meeting after their appointment. A Director may be removed from office if requested by all other Directors.
The Company’s Articles of Association require that at each AGM there shall retire from office (and be subject to re-election by members) any Director who shall have been a Director at the preceding two Annual General Meetings and who was not appointed or re-appointed then or subsequently. However, in accordance with the UK Corporate Governance Code, the Company requires all Directors who held office at 31 March 2017 to stand for re-election.
OTHER STATUTORY INFORMATION CONTINUED
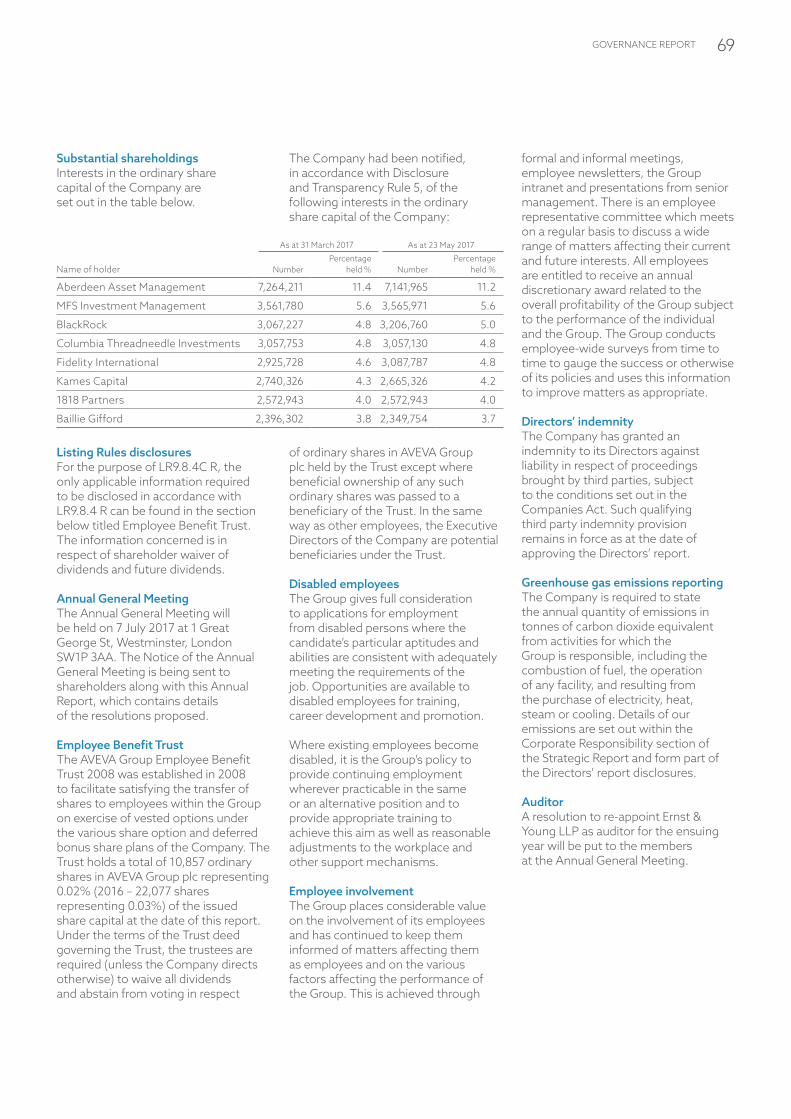
GOVERNANCE REPORT 69
Substantial shareholdingsInterests in the ordinary share capital of the Company are set out in the table below.
As at 31 March 2017 As at 23 May 2017
Name of holder NumberPercentage
held % NumberPercentage
held %
Aberdeen Asset Management 7,264,211 11.4 7,141,965 11.2
MFS Investment Management 3,561,780 5.6 3,565,971 5.6
BlackRock 3,067,227 4.8 3,206,760 5.0
Columbia Threadneedle Investments 3,057,753 4.8 3,057,130 4.8
Fidelity International 2,925,728 4.6 3,087,787 4.8
Kames Capital 2,740,326 4.3 2,665,326 4.2
1818 Partners 2,572,943 4.0 2,572,943 4.0
Baillie Gifford 2,396,302 3.8 2,349,754 3.7
Listing Rules disclosuresFor the purpose of LR9.8.4C R, the only applicable information required to be disclosed in accordance with LR9.8.4 R can be found in the section below titled Employee Benefit Trust. The information concerned is in respect of shareholder waiver of dividends and future dividends.
Annual General MeetingThe Annual General Meeting will be held on 7 July 2017 at 1 Great George St, Westminster, London SW1P 3AA. The Notice of the Annual General Meeting is being sent to shareholders along with this Annual Report, which contains details of the resolutions proposed.
Employee Benefit TrustThe AVEVA Group Employee Benefit Trust 2008 was established in 2008 to facilitate satisfying the transfer of shares to employees within the Group on exercise of vested options under the various share option and deferred bonus share plans of the Company. The Trust holds a total of 10,857 ordinary shares in AVEVA Group plc representing 0.02% (2016 – 22,077 shares representing 0.03%) of the issued share capital at the date of this report. Under the terms of the Trust deed governing the Trust, the trustees are required (unless the Company directs otherwise) to waive all dividends and abstain from voting in respect
formal and informal meetings, employee newsletters, the Group intranet and presentations from senior management. There is an employee representative committee which meets on a regular basis to discuss a wide range of matters affecting their current and future interests. All employees are entitled to receive an annual discretionary award related to the overall profitability of the Group subject to the performance of the individual and the Group. The Group conducts employee-wide surveys from time to time to gauge the success or otherwise of its policies and uses this information to improve matters as appropriate.
Directors’ indemnity The Company has granted an indemnity to its Directors against liability in respect of proceedings brought by third parties, subject to the conditions set out in the Companies Act. Such qualifying third party indemnity provision remains in force as at the date of approving the Directors’ report.
Greenhouse gas emissions reportingThe Company is required to state the annual quantity of emissions in tonnes of carbon dioxide equivalent from activities for which the Group is responsible, including the combustion of fuel, the operation of any facility, and resulting from the purchase of electricity, heat, steam or cooling. Details of our emissions are set out within the Corporate Responsibility section of the Strategic Report and form part of the Directors’ report disclosures.
AuditorA resolution to re-appoint Ernst & Young LLP as auditor for the ensuing year will be put to the members at the Annual General Meeting.
of ordinary shares in AVEVA Group plc held by the Trust except where beneficial ownership of any such ordinary shares was passed to a beneficiary of the Trust. In the same way as other employees, the Executive Directors of the Company are potential beneficiaries under the Trust.
Disabled employeesThe Group gives full consideration to applications for employment from disabled persons where the candidate’s particular aptitudes and abilities are consistent with adequately meeting the requirements of the job. Opportunities are available to disabled employees for training, career development and promotion.
Where existing employees become disabled, it is the Group’s policy to provide continuing employment wherever practicable in the same or an alternative position and to provide appropriate training to achieve this aim as well as reasonable adjustments to the workplace and other support mechanisms.
Employee involvementThe Group places considerable value on the involvement of its employees and has continued to keep them informed of matters affecting them as employees and on the various factors affecting the performance of the Group. This is achieved through
The Company had been notified, in accordance with Disclosure and Transparency Rule 5, of the following interests in the ordinary share capital of the Company:

AVEVA GROUP PLC ANNUAL REPORT AND ACCOUNTS 201770
Statement of Directors’ responsibilities in relation to the financial statementsThe Directors are responsible for preparing the Annual Report and the financial statements in accordance with applicable law and regulations.
The Directors are required to prepare consolidated financial statements for each financial year in accordance with International Financial Reporting Standards (IFRSs) as adopted by the European Union. The Directors have elected to prepare the parent company financial statements in accordance with United Kingdom General Accepted Accounting Practice (United Kingdom Accounting Standards and applicable law including FRS 101 “Reduced Disclosure Framework”). Under company law the Directors must not approve the financial statements unless they are satisfied that they give a true and fair view of the state of affairs of the Company and of the undertakings included in the consolidation as a whole as at the end of the financial year and the profit or loss of the undertakings included in the consolidation as a whole, so far as concerns members of the Company, for the financial year. In preparing those Consolidated financial statements, the Directors are required to:
• select and apply accounting policies in accordance with IAS 8;
• present information, including accounting policies, in a manner that provides relevant, reliable, comparable and understandable information; and
• provide additional disclosures when compliance with the specific requirements in IFRSs is insufficient to enable users to understand the impact of particular transactions, other events and conditions on the entity’s financial position and financial performance.
In preparing the parent company financial statements, the Directors are required to:
• select suitable accounting policies and then apply them consistently;
• make judgements and accounting estimates that are reasonable and prudent;
• state whether applicable UK accounting standards have been followed, subject to any material departures disclosed and explained in the financial statements; and
• prepare the financial statements on the going concern basis unless it is inappropriate to presume that the Company will continue in business.
The Directors are responsible for keeping adequate accounting records which are sufficient to disclose with reasonable accuracy at any time the financial position of the Company and enable them to ensure that the financial statements comply with the Companies Act 2006 and, as regards the Group financial statements, Article 4 of the IAS Regulation. They are also responsible for safeguarding the assets of the Company and hence for taking reasonable steps for the prevention and detection of fraud and other irregularities.
Disclosure of information to auditorThe Directors who were members of the Board at the time of approving the Directors’ report are listed on pages 42 and 43. Each of these Directors confirms that:
• so far as he is aware, there is no relevant audit information (as defined by Section 418 of the Companies Act 2006) of which the Company’s auditor is unaware; and
• he has taken all the steps he ought to have taken as a Director in order to make himself aware of any such relevant audit information and to establish that the Company’s auditor is aware of that information.
Fair and balanced reportingHaving taken advice from the Audit Committee, the Board considers the Annual Report and Accounts, taken as a whole, is fair, balanced and understandable and that it
provides the information necessary for shareholders to assess the Company’s position and performance, business model and strategy.
Responsibility statement pursuant to the FCA’s Disclosure and Transparency Rule 4 (DTR 4)Each Director of the Company (whose names and functions appear on pages 42 and 43) confirms that (solely for the purpose of DTR 4) to the best of their knowledge:
• the financial statements in this document, prepared in accordance with the applicable UK law and applicable accounting standards, give a true and fair view of the assets, liabilities, financial position and profit of the Company and the undertakings included in the consolidation taken as a whole; and
• the Strategic Report and the Directors’ report include a fair review of the development and performance of the business and the position of the Company and the undertakings included in the consolidation taken as a whole, together with a description of the principal risks and uncertainties that they face.
On behalf of the Board
James KiddChief Executive23 May 2017
David WardChief Financial Officer23 May 2017
This Directors’ Report has been approved by the Board of Directors and is signed on its behalf by:
Claire DentonCompany Secretary23 May 2017
OTHER STATUTORY INFORMATION CONTINUED

71FINANCIAL STATEMENTS
FINANCIALSTATEMENTS
CONTENTS
Financial Statements72 Independent Auditor’s Report 77 Consolidated Income Statement78 Consolidated Statement of
Comprehensive Income79 Consolidated Balance Sheet80 Consolidated Statement of
Changes in Shareholders’ Equity81 Consolidated Cash Flow
Statement82 Notes to the Consolidated
Financial Statements107 Company Balance Sheet108 Company Statement of Changes
in Shareholders’ Equity109 Notes to the Company Financial
Statements112 Five Year Record113 Statement of Group
Accounting Policies123 Company Information and
Advisers
AVEVA GROUP PLC ANNUAL REPORT AND ACCOUNTS 201772
Our opinion on the financial statementsIn our opinion: – AVEVA Group plc’s financial statements give a true and fair view of the state of the Group’s and of the parent
Company’s affairs as at 31 March 2017 and of the Group’s profit for the year then ended; – the Group financial statements have been properly prepared in accordance with IFRSs as adopted by the
European Union; and – the parent Company financial statements have been properly prepared in accordance with United Kingdom
Generally Accepted Accounting Practice including FRS 101 “Reduced Disclosure Framework”; and – the financial statements have been prepared in accordance with the requirements of the Companies Act 2006 and,
as regards the Group financial statements, Article 4 of the IAS Regulation.
What we have auditedAVEVA Group plc’s financial statements comprise:
Group Parent Company
Consolidated balance sheet as at 31 March 2017 Balance sheet as at 31 March 2017Consolidated income statement for the year then ended Statement of changes in equity for the year then endedConsolidated statement of comprehensive income for the year then ended Cash flow statement for the year then ended Consolidated statement of changes in equity for the year then ended Related notes 1 to 9 to the financial statementsConsolidated cash flow statement for the year then endedRelated notes 1 to 28 to the financial statementsStatement of Group accounting policies
The financial reporting framework that has been applied in the preparation of the Group financial statements is applicable law and International Financial Reporting Standards (IFRSs) as adopted by the European Union. The financial reporting framework that has been applied in the preparation of the parent company financial statements is applicable law and United Kingdom Accounting Standards (United Kingdom Generally Accepted Accounting Practice), including FRS 101 “Reduced Disclosure Framework”.
Overview of our audit approach
Risks of material misstatement
Risk of inappropriate revenue recognition on software licence contracts, in particular:– for the rental revenue stream, inappropriate application of the Group revenue recognition
policy and IAS 18 (Revenue) for licence revenue recognition, could result in, for example, revenue being recorded when performance conditions have not been satisfied, incorrect deferral of revenue for support and maintenance and other obligations; and
– for all revenue streams, inappropriate revenue recognition in relation to cut off, as revenue may not have been recognised in the correct accounting period.
Audit scope – We performed an audit of the complete financial information of six components and audit procedures on specific balances for a further six components.
– The components where we performed full or specific audit procedures accounted for 65% of adjusted pre-tax profit and 87% of revenue.
Materiality – Overall Group materiality of £2.5m which represents approximately 5% of adjusted pre-tax profit.
INDEPENDENT AUDITOR’S REPORT TO THE MEMBERS OF AVEVA GROUP PLC

FINANCIAL STATEMENTS 73
Our assessment of risk of material misstatementWe identified the risks of material misstatement described below as those that had the greatest effect on our overall audit strategy, the allocation of resources in the audit and the direction of the efforts of the audit team. In addressing these risks, we have performed the procedures below which were designed in the context of the financial statements as a whole and, consequently, we do not express any opinion on these individual areas.
Risk Risk of inappropriate revenue recognition on software licence contracts, in particular:– For the rental revenue stream, inappropriate application of the Group revenue recognition policy and IAS 18 (Revenue) for licence revenue
recognition, could result in, for example, revenue being recorded when performance conditions have not been satisfied, incorrect deferral of revenue for support and maintenance and other obligations – £94.2m (2016 – £90.6m).
– For all revenue streams, inappropriate revenue recognition in relation to cut off, as revenue may not have been recognised in the correct accounting period – £215.8m (2016 – £201.5m).
Refer to the Audit Committee Report (pages 44 to 46); Accounting policies (pages 113 to 120); and note 3 of the Consolidated Financial Statements (page 84)
Our response to the risk We have reviewed and walked through the central process over the approval and recognition of revenue contracts across the Group.
We have walked through and assessed the design effectiveness of key management controls over data input and IT.
A summary of our key procedures are:
We have performed rental licence revenue sample transaction testing at a local and Group level to ensure that revenue has been recorded in accordance with the Group’s revenue recognition policy and IAS 18 and has been appropriately recorded in the current year income statement or deferred on the balance sheet as appropriate. This was achieved by testing a sample of contracts by:– agreeing licence revenues to signed contracts or software licence agreements;– agreeing the revenue to subsequent payment as evidence of collectability;– checking evidence to support that software has been delivered to customers and prior to revenue recognition;– reviewing contract terms for any conditions that would impact the timing of revenue recognition and in turn the completeness of
deferred revenue; – ensuring appropriate allocation of the fair value and recognition of revenue for other deliverables included within the contract; and– assessing whether revenue has been recognised in line with the Group’s revenue recognition policy and IAS 18.
We selected a sample of revenue journals and assessed the appropriateness of the journal by checking to supporting evidence and ensuring compliance with the Group’s revenue recognition policy and IAS 18. The sample selected was based on risk based criteria including but not limited to manual journal entries, those close to period end and postings that are inconsistent with roles and responsibilities.
We have performed an independent assessment as to whether the fair value rate of the support and maintenance is still applicable and that any non-standard contracts have an appropriate fair value rate applied.
To better understand the nature of the contractual relationships with customers, any contractual issues or any ongoing contractual obligations, we made enquiries of management outside the finance function, including the sales team and legal counsel to ensure that appropriate obligations and commitments had been recorded in the financial statements.
We have performed a test of detail on a sample of deferred revenue and accrued revenue items to ensure it is in accordance with the revenue recognition principles.
We have performed analytical review by revenue stream and geography to access unexpected trends and patterns that could be indicative of incorrect revenue recognition.
We have performed cut-off testing for a sample of revenue items booked either side of year end to ensure that licence revenue was only recognised for software in the period where the contract was signed by both AVEVA and the customer prior to year end and the software has been made available prior to the year end.
As a primary team we gained oversight of the testing performed by the overseas teams through:– Our review of their reporting deliverables where they are required to report on any exceptions identified from their testing and unusual
contractual terms and conditions; – Reviewing contracts meeting the Board review threshold; and – Reviewing any contracts identified as having unusual terms or conditions by management and/or overseas audit teams to confirm
appropriate recognition of revenue in accordance with the contract accounting policy.
We performed full and specific scope audit procedures over this risk area in 12 locations, which covered 87% of the risk amount. At the Group level we also performed the same revenue procedures for the rest of the locations at Group materiality, which covered the remaining 13% of the risk amount.
In addition, the Group audit team performed these same procedures (to Group materiality) for the remaining components to ensure 100% coverage of revenue.
Key observations communicated to the Audit CommitteeWe conclude that revenue recognised in the year, and deferred as at 31 March 2017, is materially correct on the basis of our procedures performed both at Group and by component audit teams.

AVEVA GROUP PLC ANNUAL REPORT AND ACCOUNTS 201774
INDEPENDENT AUDITOR’S REPORT CONTINUED
The scope of our audit Tailoring the scopeOur assessment of audit risk, our evaluation of materiality and our allocation of performance materiality determine our audit scope for each entity within the Group. Taken together, this enables us to form an opinion on the consolidated financial statements. We take into account size, risk profile, the organisation of the Group and effectiveness of Group-wide controls and changes in the business environment when assessing the level of work to be performed at each entity.
In assessing the risk of material misstatement to the Group financial statements, and to ensure we had adequate quantitative coverage of significant accounts in the financial statements, of the 30 reporting components of the Group, we selected 12 components covering entities within the UK, France, Germany, Korea, USA, Brazil, India, China and Sweden, which represent the principal business units within the Group.
Of the 12 components selected, we performed an audit of the complete financial information of six components (“full scope components”) which were selected based on their size or risk characteristics. For the remaining six components (“specific scope components”), we performed audit procedures on specific accounts within that component that we considered had the potential for the greatest impact on the significant accounts in the financial statements either because of the size of these accounts or their risk profile.
The reporting components where we performed audit procedures accounted for 65% (2016 – 105%) of the Group’s adjusted pre-tax profit and 87% (2016 – 81%) of the Group’s Revenue. For the current year, the full scope components contributed 66% (2016 – 57%) of the Group’s adjusted pre-tax profit and 75% (2016 – 52%) of the Group’s revenue. The specific scope component contributed (1% – loss) (2016 – 48%) of the Group’s adjusted pre-tax profit and 12% (2016 – 29%) of the Group’s Revenue. The reduction in coverage for adjusted pre-tax profit is due to loss making components within
the specific scope category. The audit scope of these components may not have included testing of all significant accounts of the component but will have contributed to the coverage of significant testing for the Group. At the Group level we performed the revenue audit procedures described above in the risk section at Group materiality on the rest of the components of the Group which accounted for the remaining 13% of the Group’s revenue. The Group audit risk in relation to revenue recognition was subject to audit procedures over the entire Group locations with revenue.
Of the remaining 18 components that together represent 35% of the Group’s adjusted pre-tax profit, none are individually greater than 5% of the Group’s adjusted pre-tax profit. For these components, as explained above, we performed the revenue procedures at Group materiality as described in the risk section and as a result covering 100% of revenue and for the remaining accounts we performed analytical review, testing of consolidation journals, intercompany elimination and foreign currency translation recalculation to respond to any potential risks of material misstatement to the Group financial statements.
The chart below illustrates the coverage obtained from the work performed by our audit teams.
Revenue
Full scope components (75%)Specific scope components (12%)Other procedures (13%)
Changes from the prior year USA has been designated a full scope component this year, whereas it was designated as a specific scope location in the prior year. We have changed the designation as a the component has increased in proportion of the total Group. For the current year we have scoped out Malaysia and Japan from the specific scope category and scoped in Sweden as part of our rotational scope for the smaller components of the Group.
Involvement with component teams In establishing our overall approach to the Group audit, we determined the type of work that needed to be undertaken at each of the components by us, as the primary audit engagement team, or by component auditors from other EY global network firms operating under our instruction. Of the six full scope components, the audit was performed on three of these directly by the primary audit team. In addition, audit procedures were also performed by the primary audit team for one of the six specific scope components. For the remaining eight components, where the work was performed by component auditors, we determined the appropriate level of involvement to enable us to determine that sufficient audit evidence had been obtained as a basis for our opinion on the Group as a whole.
The Group audit team continued to follow a programme of planned visits that has been designed to ensure that the Senior Statutory Auditor visits and his representatives visits at least two (2016 – two) of the components each year. During the current year’s audit cycle, visits were undertaken by the primary audit team to the component teams in China, USA and France (2016 – Germany and India). These visits involved, where appropriate, discussing the audit approach with the component team and any issues arising from their work, meeting with local and regional management, attending the planning meeting in USA and the closing meetings in China and France; and reviewing key audit working papers on risk areas. The primary team interacted regularly with the component teams where appropriate during various stages of the audit, reviewed key working papers and were responsible for the scope and direction of the audit process. This, together with the additional procedures performed at Group level, gave us appropriate evidence for our opinion on the Group financial statements.
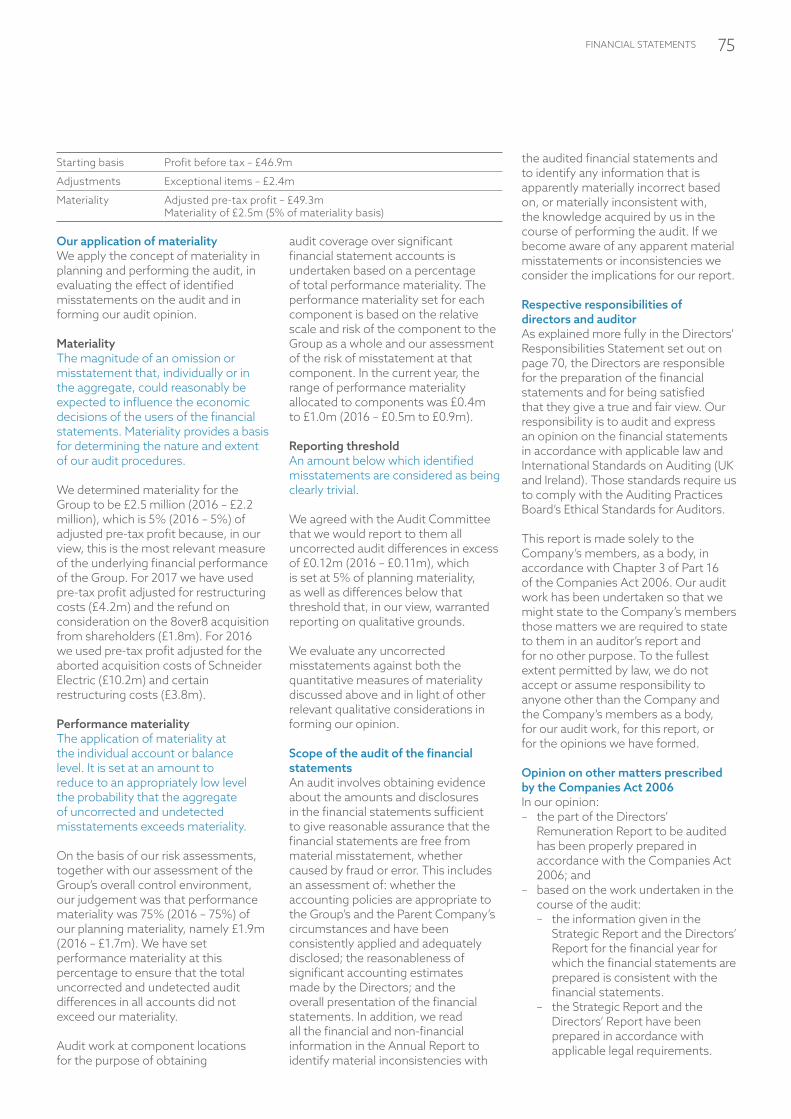
FINANCIAL STATEMENTS 75
Starting basis Profit before tax – £46.9m
Adjustments Exceptional items – £2.4m
Materiality Adjusted pre-tax profit – £49.3mMateriality of £2.5m (5% of materiality basis)
Our application of materiality We apply the concept of materiality in planning and performing the audit, in evaluating the effect of identified misstatements on the audit and in forming our audit opinion.
MaterialityThe magnitude of an omission or misstatement that, individually or in the aggregate, could reasonably be expected to influence the economic decisions of the users of the financial statements. Materiality provides a basis for determining the nature and extent of our audit procedures.
We determined materiality for the Group to be £2.5 million (2016 – £2.2 million), which is 5% (2016 – 5%) of adjusted pre-tax profit because, in our view, this is the most relevant measure of the underlying financial performance of the Group. For 2017 we have used pre-tax profit adjusted for restructuring costs (£4.2m) and the refund on consideration on the 8over8 acquisition from shareholders (£1.8m). For 2016 we used pre-tax profit adjusted for the aborted acquisition costs of Schneider Electric (£10.2m) and certain restructuring costs (£3.8m). Performance materialityThe application of materiality at the individual account or balance level. It is set at an amount to reduce to an appropriately low level the probability that the aggregate of uncorrected and undetected misstatements exceeds materiality.
On the basis of our risk assessments, together with our assessment of the Group’s overall control environment, our judgement was that performance materiality was 75% (2016 – 75%) of our planning materiality, namely £1.9m (2016 – £1.7m). We have set performance materiality at this percentage to ensure that the total uncorrected and undetected audit differences in all accounts did not exceed our materiality.
Audit work at component locations for the purpose of obtaining
audit coverage over significant financial statement accounts is undertaken based on a percentage of total performance materiality. The performance materiality set for each component is based on the relative scale and risk of the component to the Group as a whole and our assessment of the risk of misstatement at that component. In the current year, the range of performance materiality allocated to components was £0.4m to £1.0m (2016 – £0.5m to £0.9m).
Reporting thresholdAn amount below which identified misstatements are considered as being clearly trivial.
We agreed with the Audit Committee that we would report to them all uncorrected audit differences in excess of £0.12m (2016 – £0.11m), which is set at 5% of planning materiality, as well as differences below that threshold that, in our view, warranted reporting on qualitative grounds.
We evaluate any uncorrected misstatements against both the quantitative measures of materiality discussed above and in light of other relevant qualitative considerations in forming our opinion.
Scope of the audit of the financial statementsAn audit involves obtaining evidence about the amounts and disclosures in the financial statements sufficient to give reasonable assurance that the financial statements are free from material misstatement, whether caused by fraud or error. This includes an assessment of: whether the accounting policies are appropriate to the Group’s and the Parent Company’s circumstances and have been consistently applied and adequately disclosed; the reasonableness of significant accounting estimates made by the Directors; and the overall presentation of the financial statements. In addition, we read all the financial and non-financial information in the Annual Report to identify material inconsistencies with
the audited financial statements and to identify any information that is apparently materially incorrect based on, or materially inconsistent with, the knowledge acquired by us in the course of performing the audit. If we become aware of any apparent material misstatements or inconsistencies we consider the implications for our report.
Respective responsibilities of directors and auditorAs explained more fully in the Directors’ Responsibilities Statement set out on page 70, the Directors are responsible for the preparation of the financial statements and for being satisfied that they give a true and fair view. Our responsibility is to audit and express an opinion on the financial statements in accordance with applicable law and International Standards on Auditing (UK and Ireland). Those standards require us to comply with the Auditing Practices Board’s Ethical Standards for Auditors.
This report is made solely to the Company’s members, as a body, in accordance with Chapter 3 of Part 16 of the Companies Act 2006. Our audit work has been undertaken so that we might state to the Company’s members those matters we are required to state to them in an auditor’s report and for no other purpose. To the fullest extent permitted by law, we do not accept or assume responsibility to anyone other than the Company and the Company’s members as a body, for our audit work, for this report, or for the opinions we have formed.
Opinion on other matters prescribed by the Companies Act 2006In our opinion: – the part of the Directors’
Remuneration Report to be audited has been properly prepared in accordance with the Companies Act 2006; and
– based on the work undertaken in the course of the audit: – the information given in the
Strategic Report and the Directors’ Report for the financial year for which the financial statements are prepared is consistent with the financial statements.
– the Strategic Report and the Directors’ Report have been prepared in accordance with applicable legal requirements.

AVEVA GROUP PLC ANNUAL REPORT AND ACCOUNTS 201776
Matters on which we are required to report by exception
ISAs (UK and Ireland) reporting We are required to report to you if, in our opinion, financial and non-financial information in the annual report is: – materially inconsistent with the information in the audited financial statements; or – apparently materially incorrect based on, or materially inconsistent with, our knowledge of the Group acquired in the course
of performing our audit; or – otherwise misleading.
In particular, we are required to report whether we have identified any inconsistencies between our knowledge acquired in the course of performing the audit and the Directors’ statement that they consider the annual report and accounts taken as a whole is fair, balanced and understandable and provides the information necessary for shareholders to assess the entity’s performance, business model and strategy; and whether the Annual Report appropriately addresses those matters that we communicated to the Audit Committee that we consider should have been disclosed.
We have no exceptions to report.
Companies Act 2006 reporting In light of the knowledge and understanding of the Company and its environment obtained in the course of the audit, we have identified no material misstatements in the Strategic Report or Directors’ Report.
We are required to report to you if, in our opinion:– adequate accounting records have not been kept by the Parent Company, or returns adequate for our audit have not been received
from branches not visited by us; or– the Parent Company financial statements and the part of the Directors’ Remuneration Report to be audited are not in agreement with
the accounting records and returns; or– certain disclosures of Directors’ remuneration specified by law are not made; or– we have not received all the information and explanations we require for our audit.
We have no exceptions to report.
Listing Rules review requirements We are required to review:– the Directors’ statement in relation to going concern, set out on page 29, and longer-term viability, set out on page 29; and– the part of the Corporate Governance Statement relating to the Company’s compliance with the provisions of the UK Corporate
Governance Code specified for our review.
We have no exceptions to report.
Statement on the Directors’ Assessment of the Principal Risks that Would Threaten the Solvency or Liquidity of the Entity
ISAs (UK and Ireland) reporting We are required to give a statement as to whether we have anything material to add or to draw attention to in relation to:– the Directors’ confirmation in the Annual Report that they have carried out a robust assessment of the principal risks facing the entity,
including those that would threaten its business model, future performance, solvency or liquidity;– the disclosures in the Annual Report that describe those risks and explain how they are being managed or mitigated;– the Directors’ statement in the financial statements about whether they considered it appropriate to adopt the going concern basis
of accounting in preparing them, and their identification of any material uncertainties to the entity’s ability to continue to do so over a period of at least twelve months from the date of approval of the financial statements; and
– the Directors’ explanation in the Annual Report as to how they have assessed the prospects of the entity, over what period they have done so and why they consider that period to be appropriate, and their statement as to whether they have a reasonable expectation that the entity will be able to continue in operation and meet its liabilities as they fall due over the period of their assessment, including any related disclosures drawing attention to any necessary qualifications or assumptions.
We have nothing material to add or to draw attention to.
Marcus Butler (Senior statutory auditor)for and on behalf of Ernst & Young LLP, Statutory AuditorReading23 May 2017
Notes:1. The maintenance and integrity of the AVEVA Group plc web site is the responsibility of the Directors; the work carried out by the auditors does not involve consideration of
these matters and, accordingly, the auditors accept no responsibility for any changes that may have occurred to the financial statements since they were initially presented on the web site.
2. Legislation in the United Kingdom governing the preparation and dissemination of financial statements may differ from legislation in other jurisdictions.
INDEPENDENT AUDITOR’S REPORT CONTINUED

FINANCIAL STATEMENTS 77
CONSOLIDATED INCOME STATEMENTFOR THE YEAR ENDED 31 MARCH 2017
Notes2017
£0002016£000
Revenue 3, 4 215,831 201,491Cost of sales (14,233) (14,689)
Gross profit 201,598 186,802Operating expensesResearch & Development costs (31,884) (32,128)Selling and administrative expenses 5 (124,948) (125,252)
Total operating expenses (156,832) (157,380)
Profit from operations 6 44,766 29,422Other income 7 1,753 –Finance revenue 8 777 633Finance expense 9 (396) (626)
Analysed as: Adjusted profit before tax 55,004 51,201 Amortisation of intangibles (excluding other software) (5,806) (5,617) Share-based payments (1,084) (494) Gains/(losses) on fair value of forward foreign exchange contracts 669 (432) Exceptional items 7 (1,883) (15,229)
Profit before tax 46,900 29,429Income tax expense 11 (8,834) (8,955)
Profit for the year attributable to equity holders of the parent 38,066 20,474
Earnings per share (pence)– basic 13 59.52 32.03– diluted 13 59.36 31.96
Adjusted earnings per share (pence)– basic 13 66.98 62.04– diluted 13 66.81 61.91
All activities relate to continuing activities.
The accompanying notes are an integral part of this Consolidated income statement.
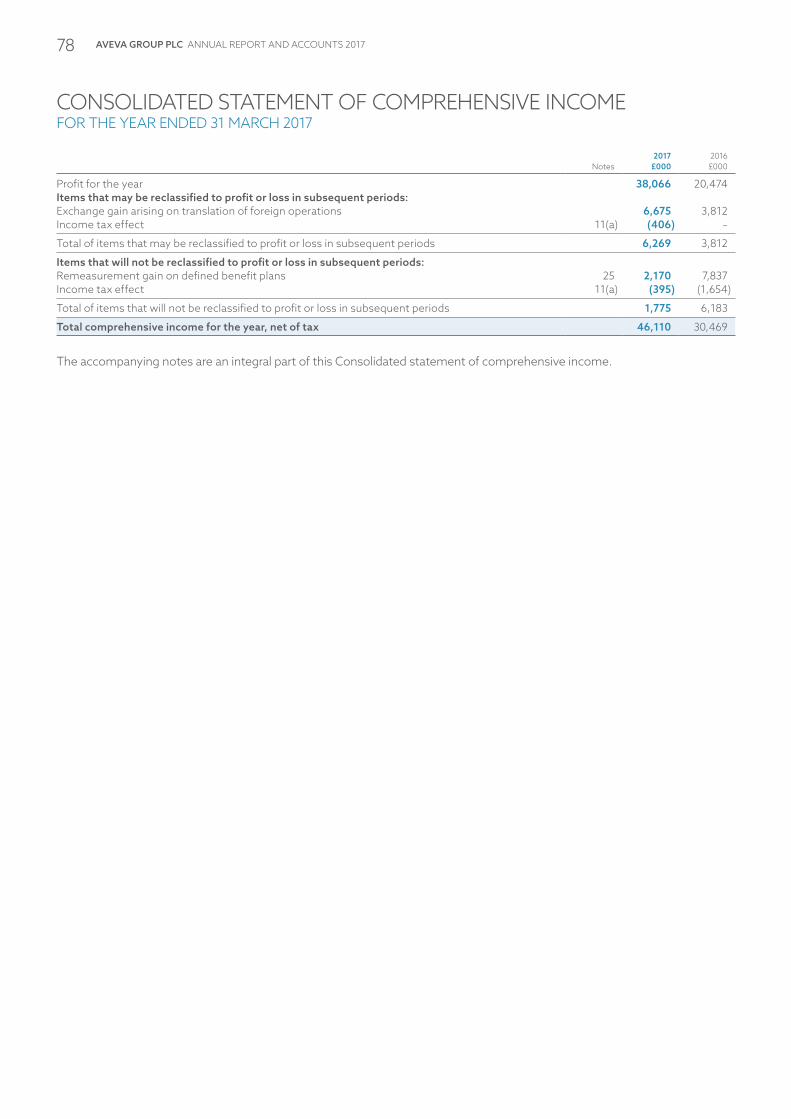
AVEVA GROUP PLC ANNUAL REPORT AND ACCOUNTS 201778
CONSOLIDATED STATEMENT OF COMPREHENSIVE INCOMEFOR THE YEAR ENDED 31 MARCH 2017
Notes2017
£0002016 £000
Profit for the year 38,066 20,474Items that may be reclassified to profit or loss in subsequent periods:Exchange gain arising on translation of foreign operations 6,675 3,812Income tax effect 11(a) (406) –
Total of items that may be reclassified to profit or loss in subsequent periods 6,269 3,812
Items that will not be reclassified to profit or loss in subsequent periods:Remeasurement gain on defined benefit plans 25 2,170 7,837Income tax effect 11(a) (395) (1,654)
Total of items that will not be reclassified to profit or loss in subsequent periods 1,775 6,183
Total comprehensive income for the year, net of tax 46,110 30,469
The accompanying notes are an integral part of this Consolidated statement of comprehensive income.

FINANCIAL STATEMENTS 79
CONSOLIDATED BALANCE SHEET31 MARCH 2017
Notes2017
£0002016 £000
Non-current assetsGoodwill 14 54,305 51,697Other intangible assets 15 21,868 24,841Property, plant and equipment 16 7,432 7,101Deferred tax assets 24 3,594 2,617Other receivables 18 1,499 1,257Retirement benefit surplus 25 1,222 –
89,920 87,513
Current assetsTrade and other receivables 18 93,279 97,138Treasury deposits 19 45,486 43,316Cash and cash equivalents 19 85,462 64,611Current tax assets 3,557 3,492
227,784 208,557
Total assets 317,704 296,070
EquityIssued share capital 27(a) 2,275 2,274Share premium 27,288 27,288Other reserves 12,896 5,965Retained earnings 178,223 165,471
Total equity 220,682 200,998
Current liabilitiesTrade and other payables 20 42,876 37,196Deferred revenue 45,894 46,874Financial liabilities 21 196 864Current tax liabilities 865 1,789
89,831 86,723
Non-current liabilitiesDeferred tax liabilities 24 3,381 3,187Retirement benefit obligations 25 3,810 5,162
7,191 8,349
Total equity and liabilities 317,704 296,070
The accompanying notes are an integral part of this Consolidated balance sheet.
The financial statements were approved by the Board of Directors and authorised for issue on 23 May 2017. They were signed on its behalf by:
Philip Aiken James Kidd Company numberChairman Chief Executive 2937296
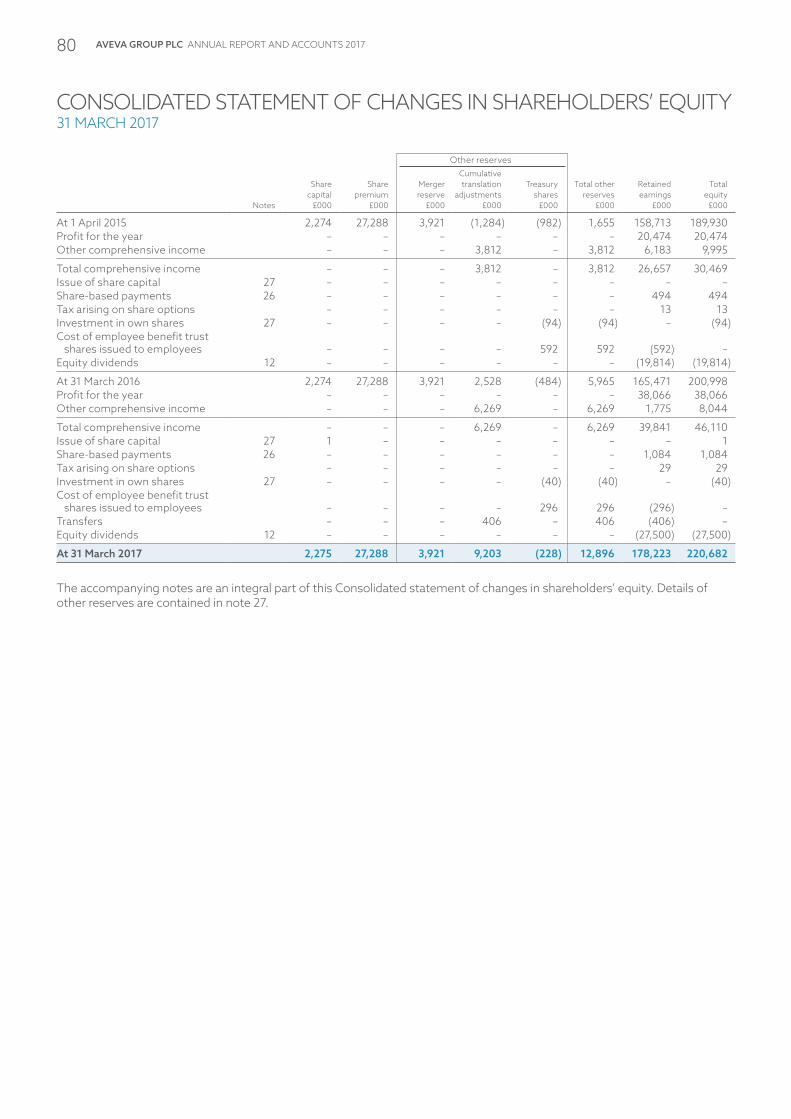
AVEVA GROUP PLC ANNUAL REPORT AND ACCOUNTS 201780
CONSOLIDATED STATEMENT OF CHANGES IN SHAREHOLDERS’ EQUITY31 MARCH 2017
Notes
Share capital
£000
Share premium
£000
Other reserves
Total other reserves
£000
Retained earnings
£000
Total equity
£000
Merger reserve
£000
Cumulative translation
adjustments £000
Treasury shares
£000
At 1 April 2015 2,274 27,288 3,921 (1,284) (982) 1,655 158,713 189,930Profit for the year – – – – – – 20,474 20,474Other comprehensive income – – – 3,812 – 3,812 6,183 9,995
Total comprehensive income – – – 3,812 – 3,812 26,657 30,469Issue of share capital 27 – – – – – – – –Share-based payments 26 – – – – – – 494 494Tax arising on share options – – – – – – 13 13Investment in own shares 27 – – – – (94) (94) – (94)Cost of employee benefit trust
shares issued to employees – – – – 592 592 (592) –Equity dividends 12 – – – – – – (19,814) (19,814)
At 31 March 2016 2,274 27,288 3,921 2,528 (484) 5,965 165,471 200,998Profit for the year – – – – – – 38,066 38,066Other comprehensive income – – – 6,269 – 6,269 1,775 8,044
Total comprehensive income – – – 6,269 – 6,269 39,841 46,110Issue of share capital 27 1 – – – – – – 1Share-based payments 26 – – – – – – 1,084 1,084Tax arising on share options – – – – – – 29 29Investment in own shares 27 – – – – (40) (40) – (40)Cost of employee benefit trust
shares issued to employees – – – – 296 296 (296) –Transfers – – – 406 – 406 (406) –Equity dividends 12 – – – – – – (27,500) (27,500)
At 31 March 2017 2,275 27,288 3,921 9,203 (228) 12,896 178,223 220,682
The accompanying notes are an integral part of this Consolidated statement of changes in shareholders’ equity. Details of other reserves are contained in note 27.

FINANCIAL STATEMENTS 81
CONSOLIDATED CASH FLOW STATEMENTFOR THE YEAR ENDED 31 MARCH 2017
Notes2017
£0002016 £000
Cash flows from operating activitiesProfit for the year 38,066 20,474Income tax 11(a) 8,834 8,955Net finance revenue 8, 9 (381) (7)Other income (indemnified receivable) 7 (1,753) –Amortisation of intangible assets 15 6,160 5,954Depreciation of property, plant and equipment 16 2,487 2,167(Profit)/loss on disposal of property, plant and equipment 6 (27) 2Share-based payments 26 1,084 494Difference between pension contributions paid and amounts charged to operating profit (1,139) (1,849)Research & Development expenditure tax credit (1,750) (2,076)Changes in working capital:Trade and other receivables 2,567 514Trade and other payables 3,711 1,076Changes to fair value of forward foreign exchange contracts (669) 432
Cash generated from operating activities before tax 57,190 36,136Income taxes paid (9,332) (11,798)
Net cash generated from operating activities 47,858 24,338
Cash flows from investing activitiesPurchase of property, plant and equipment 16 (2,419) (2,056)Purchase of intangible assets 15 (2,252) (393)Acquisition of subsidiaries and business undertakings, net of cash acquired – (2,540)Refund of consideration from business combinations 1,753 4,349Proceeds from disposal of property, plant and equipment 194 429Interest received 8 777 633(Purchase)/maturity of treasury deposits (net) 19 (2,170) 1,932
Net cash flows (used in)/from investing activities (4,117) 2,354
Cash flows from financing activitiesInterest paid 9 (58) (48)Purchase of own shares 27(b) (40) (94)Proceeds from the issue of shares 27(a) 1 –Dividends paid to equity holders of the parent 12 (27,500) (19,814)
Net cash flows used in financing activities (27,597) (19,956)
Net increase in cash and cash equivalents 16,144 6,736Net foreign exchange difference 4,707 (644)Opening cash and cash equivalents 19 64,611 58,519
Closing cash and cash equivalents 19 85,462 64,611
The accompanying notes are an integral part of this Consolidated cash flow statement.

AVEVA GROUP PLC ANNUAL REPORT AND ACCOUNTS 201782
NOTES TO THE CONSOLIDATED FINANCIAL STATEMENTS
1 Corporate informationAVEVA Group plc is a public limited Company incorporated and domiciled in the United Kingdom. The address of the registered office is given on page 123. AVEVA Group plc’s shares are publicly traded on the Official List of the London Stock Exchange.
2 Key accounting policiesExplained below are the key accounting policies of the Group. The full Statement of Group Accounting Policies is included on pages 113 to 120.
a) Basis of preparationThe accounting policies which follow set out those policies which apply in preparing the financial statements for the year ended 31 March 2017. The Consolidated financial statements are presented in Pounds Sterling (£) and all values are rounded to the nearest thousand (£000) except when otherwise indicated.
The Consolidated financial statements of AVEVA Group plc and all its subsidiaries (the Group) have been prepared in accordance with IFRS, as adopted by the European Union, as they apply to the financial statements of the Group for the year ended 31 March 2017. The Group’s financial statements are also consistent with IFRSs as issued by the IASB.
The Group presents a non-GAAP performance measure on the face of the Consolidated income statement. The Directors believe that the ‘adjusted profit before tax’ and ‘adjusted diluted and basic earnings per share’ measures presented provide a reliable and consistent presentation of the underlying performance of the Group. Adjusted profit is not defined by IFRS and therefore may not be directly comparable with the ‘adjusted’ profit measures of other companies.
The business is managed and measured on a day-to-day basis using adjusted results. To arrive at adjusted results, certain adjustments are made for normalised and exceptional items that are individually important and which could, if included, distort the understanding of the performance for the year and the comparability between periods.
Normalised itemsThese are recurring items which management considers to have a distorting effect on the underlying results of the Group, and are non-cash items.
These items relate to amortisation of intangibles (excluding other software), share-based payment charges and fair value adjustments on financial derivatives, although other types of recurring items may arise. Recurring items are adjusted each year irrespective of materiality to ensure consistent treatment.
Exceptional itemsThese are items which are non-recurring and are identified by virtue of either their size or their nature. These items can include, but are not restricted to, the costs of significant restructuring exercises, fees associated with business combinations and costs incurred in integrating acquired companies.
In the prior year, deferred revenue was presented as part of the line item ‘trade and other payables’; in the current year deferred revenue is presented as a separate line item on the balance sheet. The prior year line item ‘trade and other payables’ therefore decreased by the amount of deferred revenue of £46,874,000.
The parent Company financial statements of AVEVA Group plc are included on pages 107 to 111.
b) RevenueThe Group generates its revenue principally from licensing the rights to use its software products directly to end users and to a lesser extent indirectly through resellers. Revenue is measured at fair value of the consideration received or receivable and represents the amounts receivable for goods and services provided in the ordinary course of business, net of discounts and sales taxes. It comprises initial licence fees, annual licence fees and rental licence fees, together with income from consultancy and other related services.
For each revenue stream, revenue is not recognised unless and until:
– a clear contractual arrangement can be evidenced; – delivery has been made in accordance with that contract; – if required, contractual acceptance criteria have been met; and – the fee has been agreed and collectability is probable. Where extended payment terms beyond 90 days exist, appropriate
approvals are obtained to ensure there is sufficient comfort that collectability is probable and the fee is determinable. If approvals are not obtained, revenue is deferred until payment is due.
FINANCIAL STATEMENTS 83
Initial/annual licence agreementsUsers are charged an initial licence fee upon installation for a set number of users together with an obligatory annual fee, which is charged every year. Annual fees consist of the continuing right to use and customer support and maintenance, which includes core product upgrades and enhancements, and remote support services. Users must continue to pay annual fees in order to maintain the right to use the software.
Initial licence fees are recognised once the above conditions have been met. Annual fees are recognised on a straight-line basis over the period of the contract, which is typically 12 months. If annual fees are charged at a discount, an amount is allocated out of the initial licence fee at fair market value based on the value established when annual fees are charged separately to customers.
Rental licence agreementsAs an alternative to the initial licence fee plus annual fee model, the Group also supplies its software under three different types of rental licence agreement.
Rental licence fees which are invoiced monthly and which are cancellable by the customer are recognised on a monthly basis.Other rental licence agreements are invoiced at the start of the contracted period, which is typically one year, are non-cancellable and consist of two separate components: the initial software delivery, and the continuing right to use with customer support and maintenance. Revenue in respect of the continuing right to use and customer support and maintenance element is valued at fair market value based on the value established when annual fees are charged separately to the customer. This component is recognised on a straight-line basis over the period of the contract. The residual amount representing the implied initial fee element is recognised upfront, provided all of the above criteria have been met. Where uncertainty exists and it is not possible to reliably determine the fair value of the customer support and maintenance element, all revenue is recognised on a straight-line basis over the period of the contract.
The Group also licenses its software using a token licensing model. Under this model, a ‘basket’ of tokens representing licences to use different software products over a defined period is granted, which enables the customer to draw these down as and when required. Where the customer commits in advance to a specified number of tokens over a defined period, a proportion of revenue is recognised with an appropriate element deferred for customer support and maintenance obligations, subject to the above recognition conditions being met. Where the customer is charged in arrears, revenue is recognised based on the actual number of tokens used.
ServicesServices consist primarily of consultancy, implementation services and training, and are performed under separate service arrangements. Revenue from these services is recognised as the services are performed and stage of completion is determined by reference to the costs incurred as a proportion of the total estimated costs of the service project. If a contract cannot be reliably estimated, revenue is recognised only to the extent that costs have been incurred. Provision is made as soon as a loss is foreseen.
If an arrangement includes both licence and service elements, licence fee revenue is recognised upon delivery of the software provided that services do not include significant customisation or modification of the base product and the payment terms for licences are not subject to acceptance criteria. In all other cases, revenues from both licence and service elements are recognised as services are performed.
c) Significant accounting estimatesRevenue recognitionThe assessments and estimates used by the Group for revenue recognition could have a significant impact on the amount and timing of revenue recognised.
Revenue from sales of software licences when these are combined with the delivery of significant implementation or customisation services is recognised in line with the delivery of the services to the customer. This policy involves the assessment of which customer projects include significant customisation or implementation and also an assessment of the stage of completion of such projects.
The fair value estimate of the element of a customer rental fee attributable to the continuing right to use, and to customer support and maintenance, is reviewed periodically. On average, the element attributable to customer support and maintenance as a proportion of the initial software delivery is 17%. A 1% deviation in this percentage would not lead to a material change in revenue.
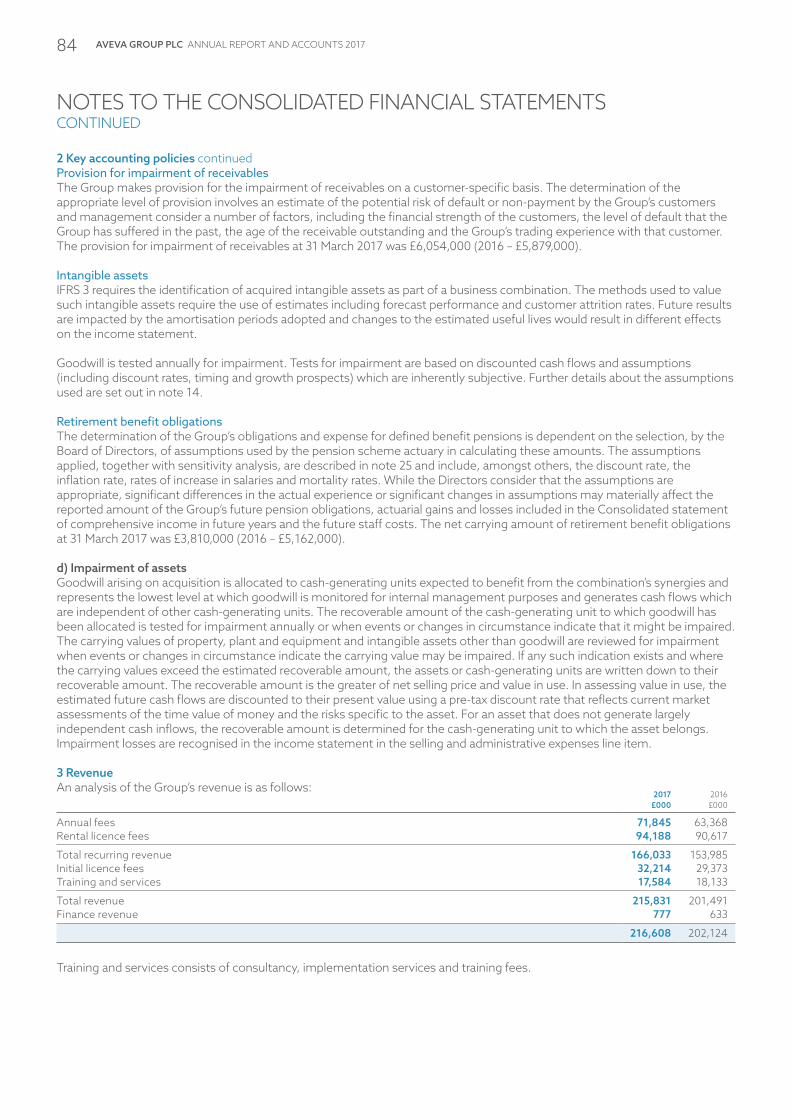
AVEVA GROUP PLC ANNUAL REPORT AND ACCOUNTS 201784
NOTES TO THE CONSOLIDATED FINANCIAL STATEMENTSCONTINUED
2 Key accounting policies continuedProvision for impairment of receivablesThe Group makes provision for the impairment of receivables on a customer-specific basis. The determination of the appropriate level of provision involves an estimate of the potential risk of default or non-payment by the Group’s customers and management consider a number of factors, including the financial strength of the customers, the level of default that the Group has suffered in the past, the age of the receivable outstanding and the Group’s trading experience with that customer. The provision for impairment of receivables at 31 March 2017 was £6,054,000 (2016 – £5,879,000).
Intangible assetsIFRS 3 requires the identification of acquired intangible assets as part of a business combination. The methods used to value such intangible assets require the use of estimates including forecast performance and customer attrition rates. Future results are impacted by the amortisation periods adopted and changes to the estimated useful lives would result in different effects on the income statement.
Goodwill is tested annually for impairment. Tests for impairment are based on discounted cash flows and assumptions (including discount rates, timing and growth prospects) which are inherently subjective. Further details about the assumptions used are set out in note 14.
Retirement benefit obligationsThe determination of the Group’s obligations and expense for defined benefit pensions is dependent on the selection, by the Board of Directors, of assumptions used by the pension scheme actuary in calculating these amounts. The assumptions applied, together with sensitivity analysis, are described in note 25 and include, amongst others, the discount rate, the inflation rate, rates of increase in salaries and mortality rates. While the Directors consider that the assumptions are appropriate, significant differences in the actual experience or significant changes in assumptions may materially affect the reported amount of the Group’s future pension obligations, actuarial gains and losses included in the Consolidated statement of comprehensive income in future years and the future staff costs. The net carrying amount of retirement benefit obligations at 31 March 2017 was £3,810,000 (2016 – £5,162,000).
d) Impairment of assetsGoodwill arising on acquisition is allocated to cash-generating units expected to benefit from the combination’s synergies and represents the lowest level at which goodwill is monitored for internal management purposes and generates cash flows which are independent of other cash-generating units. The recoverable amount of the cash-generating unit to which goodwill has been allocated is tested for impairment annually or when events or changes in circumstance indicate that it might be impaired. The carrying values of property, plant and equipment and intangible assets other than goodwill are reviewed for impairment when events or changes in circumstance indicate the carrying value may be impaired. If any such indication exists and where the carrying values exceed the estimated recoverable amount, the assets or cash-generating units are written down to their recoverable amount. The recoverable amount is the greater of net selling price and value in use. In assessing value in use, the estimated future cash flows are discounted to their present value using a pre-tax discount rate that reflects current market assessments of the time value of money and the risks specific to the asset. For an asset that does not generate largely independent cash inflows, the recoverable amount is determined for the cash-generating unit to which the asset belongs. Impairment losses are recognised in the income statement in the selling and administrative expenses line item.
3 RevenueAn analysis of the Group’s revenue is as follows:
2017 £000
2016 £000
Annual fees 71,845 63,368Rental licence fees 94,188 90,617
Total recurring revenue 166,033 153,985Initial licence fees 32,214 29,373Training and services 17,584 18,133
Total revenue 215,831 201,491Finance revenue 777 633
216,608 202,124
Training and services consists of consultancy, implementation services and training fees.

FINANCIAL STATEMENTS 85
4 Segment informationThe Executive team monitors and appraises the business based on the performance of three geographic regions: Asia Pacific; Europe, Middle East and Africa (EMEA); and Americas. These three regions are the basis of the Group’s primary operating segments reported in the financial statements. Performance is evaluated based on regional contribution using the same accounting policies as adopted for the Group’s financial statements. There is no inter-segment revenue. Balance sheet information is not included in the information provided to the Executive team. Support functions such as head office departments are controlled and monitored centrally. All regions sell all the products and services. Corporate costs include centralised functions such as Executive Management, Information Management, Finance and Legal.
Year ended 31 March 2017Asia Pacific
£000EMEA£000
Americas£000
Corporate£000
Total£000
RevenueAnnual fees 32,996 30,453 8,396 – 71,845Initial fees 18,688 8,600 4,926 – 32,214Rental fees 19,693 57,907 16,588 – 94,188Training and services 4,913 9,719 2,952 – 17,584
Regional revenue total 76,290 106,679 32,862 – 215,831Cost of sales (3,314) (8,968) (1,951) – (14,233)Selling and administrative expenses (26,938) (33,345) (18,593) (40,925) (119,801)
Regional contribution 46,038 64,366 12,318 (40,925) 81,797
Research & Development costs (27,174)Adjusted profit from operations 54,623Net finance revenue 381
Adjusted profit before tax 55,004Exceptional items and other normalised adjustments1 (8,104)
Profit before tax 46,900
1 Normalised adjustments include amortisation of intangible assets (excluding other software), share-based payments and movements on fair value of forward foreign exchange contracts.
Year ended 31 March 2016Asia Pacific
£000EMEA£000
Americas£000
Corporate£000
Total£000
RevenueAnnual fees 27,608 28,528 7,232 – 63,368Initial fees 18,403 8,787 2,183 – 29,373Rental fees 21,486 53,270 15,861 – 90,617Training and services 4,049 11,015 3,069 – 18,133
Regional revenue total 71,546 101,600 28,345 – 201,491Cost of sales (3,117) (9,514) (2,058) – (14,689)Selling and administrative expenses (24,491) (33,270) (17,965) (34,171) (109,897)
Regional contribution 43,938 58,816 8,322 (34,171) 76,905
Research & Development costs (25,711)Adjusted profit from operations 51,194Net finance revenue 7
Adjusted profit before tax 51,201Exceptional items and other normalised adjustments1 (21,772)
Profit before tax 29,429
1 Normalised adjustments include amortisation of intangible assets (excluding other software), share-based payments and movements on fair value of forward foreign exchange contracts.
Other segmental disclosuresThe Company’s country of domicile is the UK. Revenue attributed to the UK and all foreign countries amounted to £15,877,461 and £199,953,556 (2016 – £18,450,000 and £183,041,000) respectively. No individual country accounted for more than 10% of the Group’s total revenue. Revenue is allocated to countries on the basis of the location of the customer. No single external customer accounted for 10% or more of the Group’s total revenue (2016 – none).
Non-current assets (excluding deferred tax assets) held in the UK and all foreign countries amounted to £38,530,000 and £47,796,000 (2016 – £39,314,000 and £45,582,000) respectively. There are no material non-current assets located in an individual country outside of the UK.

AVEVA GROUP PLC ANNUAL REPORT AND ACCOUNTS 201786
NOTES TO THE CONSOLIDATED FINANCIAL STATEMENTSCONTINUED
5 Selling and administration expensesAn analysis of selling and administration expenses is set out below:
2017 £000
2016£000
Selling and distribution expenses 93,023 85,915Administrative expenses 31,925 39,337
124,948 125,252
6 Profit from operationsProfit from operations is stated after charging:
2017 £000
2016 £000
Depreciation of owned property, plant and equipment 2,487 2,167Amortisation of intangible assets:– included in Research & Development costs 4,219 4,186– included in selling and distribution expenses 1,587 1,430– included in administrative expenses 354 338Staff costs 106,959 98,153Operating lease rentals – minimum lease payments 6,393 5,744(Profit)/loss on disposal of property, plant and equipment (27) 2Net foreign exchange losses 710 930
During the year the Group (including its subsidiaries) obtained the following services from the Group’s auditor at costs as detailed below:
2017 £000
2016 £000
Fees payable to the Company auditor for the audit of parent Company and Consolidated financial statements 235 255Fees payable to the Company auditor and its associates for other services:– the audit of the Company’s subsidiaries pursuant to legislation 226 160– tax, compliance services 5 17– tax, advisory services 50 1– other assurance services pursuant to legislation 30 71– fees connected with the aborted transaction with Schneider Electric – 1,381
546 1,885
7 Exceptional items2017
£0002016£000
Acquisition and integration activities – 10,459Restructuring costs 4,152 4,544Indemnified receivable claim for previous business combination (1,753) –Movement in provision for sales taxes in an overseas location (516) 226
1,883 15,229
The acquisition and integration expenses for the year ended 31 March 2016 relate to fees paid to professional advisers primarily for legal and financial due diligence services related to the aborted acquisition of certain software assets from Schneider Electric and the acquisition of FabTrol Systems Inc.
As described in the 2016 Annual Report, we intended to make continued cost savings in addition to those already made in 2015/16 to mitigate the impact of cost inflation and other planned investments elsewhere in the business. During the 2016/17 financial year the Group incurred exceptional restructuring costs of £4,152,000 in connection with the rationalisation of offices and reduction in headcount in specific areas of the business. Also included are the redundancy costs incurred in eliminating the Regional Operations layer of management. These activities are a continuation of the restructuring activities of the previous year which were ultimately more protracted than initially expected due to changes in the Executive management team.
The Group has provided for a potential sales tax liability in respect of prior periods, related to the local sales of one of the Group’s subsidiary companies. The provision includes an estimate of the underpaid tax as well as related interest for late payment.
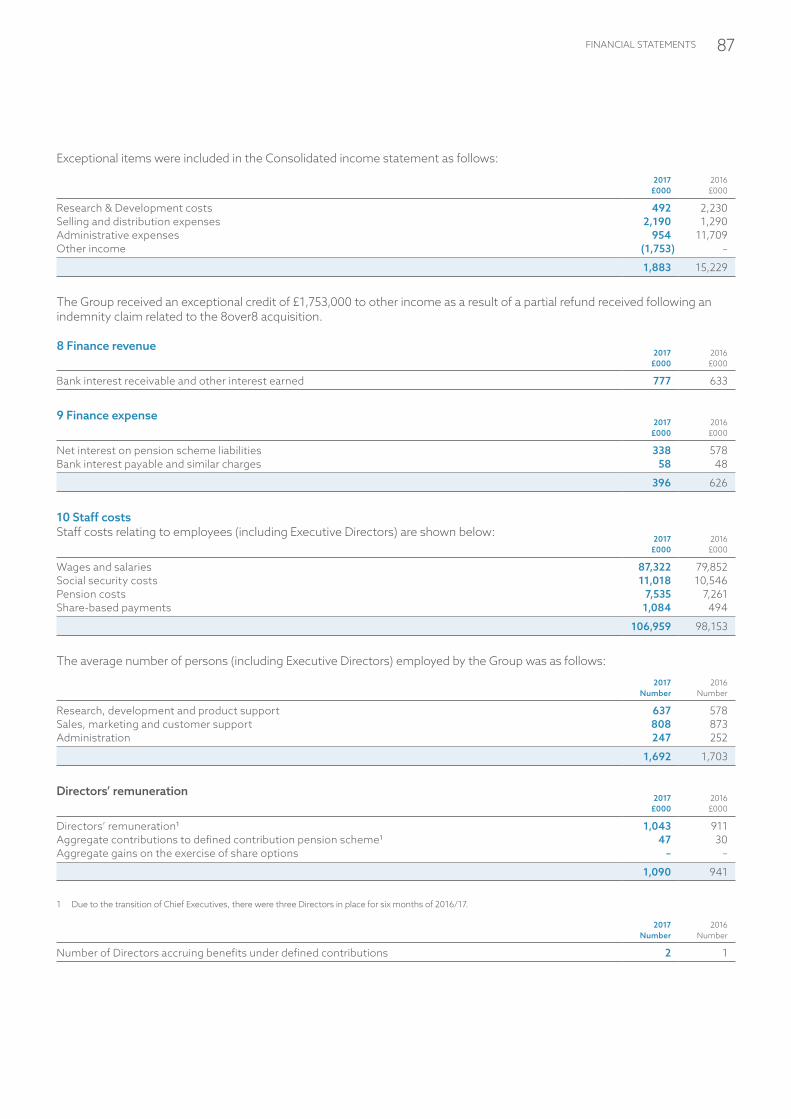
FINANCIAL STATEMENTS 87
Exceptional items were included in the Consolidated income statement as follows:
2017 £000
2016£000
Research & Development costs 492 2,230Selling and distribution expenses 2,190 1,290Administrative expenses 954 11,709Other income (1,753) –
1,883 15,229
The Group received an exceptional credit of £1,753,000 to other income as a result of a partial refund received following an indemnity claim related to the 8over8 acquisition.
8 Finance revenue2017
£0002016 £000
Bank interest receivable and other interest earned 777 633
9 Finance expense2017
£0002016 £000
Net interest on pension scheme liabilities 338 578Bank interest payable and similar charges 58 48
396 626
10 Staff costsStaff costs relating to employees (including Executive Directors) are shown below:
2017 £000
2016 £000
Wages and salaries 87,322 79,852Social security costs 11,018 10,546Pension costs 7,535 7,261Share-based payments 1,084 494
106,959 98,153
The average number of persons (including Executive Directors) employed by the Group was as follows:
2017 Number
2016 Number
Research, development and product support 637 578Sales, marketing and customer support 808 873Administration 247 252
1,692 1,703
Directors’ remuneration2017
£0002016 £000
Directors’ remuneration1 1,043 911Aggregate contributions to defined contribution pension scheme1 47 30Aggregate gains on the exercise of share options – –
1,090 941
1 Due to the transition of Chief Executives, there were three Directors in place for six months of 2016/17.
2017 Number
2016 Number
Number of Directors accruing benefits under defined contributions 2 1

AVEVA GROUP PLC ANNUAL REPORT AND ACCOUNTS 201788
NOTES TO THE CONSOLIDATED FINANCIAL STATEMENTSCONTINUED
11 Income tax expensea) Tax on profitThe major components of income tax expense are as follows:
2017 £000
2016 £000
Tax charged in Consolidated income statementCurrent taxUK corporation tax 5,129 3,863Adjustments in respect of prior periods (881) (47)
4,248 3,816
Foreign tax 5,568 5,869Adjustments in respect of prior periods 42 (704)
5,610 5,165
Total current tax 9,858 8,981
Deferred taxOrigination and reversal of temporary differences (851) (441)Adjustments in respect of prior periods (173) 415
Total deferred tax (note 24) (1,024) (26)
Total income tax expense reported in Consolidated income statement 8,834 8,955
2017 £000
2016 £000
Tax relating to items charged directly to Consolidated statement of comprehensive incomeDeferred tax on actuarial remeasurements on retirement benefit obligation 395 1,868Current tax on pension contributions – (214)Current tax on exchange gain on retranslation of foreign operations 406 –
Tax charge reported in Consolidated statement of comprehensive income 801 1,654
b) Reconciliation of the total tax chargeThe differences between the total tax charge shown above and the amount calculated by applying the standard rate of UK corporation tax to the profit before tax are as follows:
2017 £000
2016 £000
Tax on Group profit before tax at standard UK corporation tax rate of 20% (2016 – 20%) 9,380 5,886Effects of:– expenses not deductible for tax purposes 299 988– acquisition and integration activities (see note 7) – 1,935– indemnified receivable (see note 7) (351) –– patent box (500) –– irrecoverable withholding tax 64 93– movement on unprovided deferred tax balances 1,026 408– differing tax rates (72) (19)– adjustments in respect of prior years (1,012) (336)
Income tax expense reported in Consolidated income statement 8,834 8,955
The Group’s effective tax rate for the year was 18.8% (2016 – 30.4%). The Group’s effective tax rate for the year before exceptional items was 22.2% (2016 – 22.1%). The Group’s effective tax rate before exceptional and other normalised adjustments (see note 13) was 22.1% (2016 – 22.5%).
Contained within the prior year adjustment of £1,012,000 is a £1,200,000 exceptional tax credit related to the acquisition and integration activities in the previous period (see note 7).
At the previous balance sheet date, the UK government had substantively enacted a 1% reduction in the main rate of UK corporation tax to 19% from 1 April 2017 and by another 1% to 18% from 1 April 2020.
At this balance sheet date, the UK government had substantively enacted a further reduction to 17% from 1 April 2020. The effect of this reduction is immaterial to the UK net deferred tax liability.

FINANCIAL STATEMENTS 89
12 Dividends paid and proposed on equity shares2017
£0002016 £000
Declared and paid during the yearInterim 2016/17 dividend paid of 13.0 pence (2015/16 – 6.0 pence) per ordinary share 8,316 3,836Final 2015/16 dividend paid of 30.0 pence (2014/15 – 25.0 pence) per ordinary share 19,184 15,978
27,500 19,814
Proposed for approval by shareholders at the Annual General Meeting
Final proposed dividend 2016/17 of 27.0 pence (2015/16 – 30.0 pence) per ordinary share 17,271 19,182
The proposed final dividend is subject to approval by shareholders at the Annual General Meeting on 7 July 2017 and has not been included as a liability in these financial statements. If approved at the Annual General Meeting, the final dividend will be paid on 4 August 2017 to shareholders on the register at the close of business on 7 July 2017.
13 Earnings per share2017
Pence2016
Pence
Earnings per share for the year:– basic 59.52 32.03– diluted 59.36 31.96Adjusted earnings per share for the year:– basic 66.98 62.04– diluted 66.81 61.91
2017 Number
2016 Number
Weighted average number of ordinary shares for basic earnings per share 63,959,162 63,925,508Effect of dilution: employee share options 163,002 137,389
Weighted average number of ordinary shares adjusted for the effect of dilution 64,122,164 64,062,897
The calculations of basic and diluted earnings per share are based on the net profit attributable to equity holders of the parent for the year of £38,066,000 (2016 – £20,474,000). Basic earnings per share amounts are calculated by dividing the net profit attributable to equity holders of the parent by the weighted average number of ordinary shares outstanding during the year. Diluted earnings per share amounts are calculated by dividing the net profit attributable to equity holders of the parent by the weighted average number of ordinary shares outstanding during the year plus the weighted average number of ordinary shares that would be issued on the conversion of all the potentially dilutive share options into ordinary shares. Details of the terms and conditions of share options are provided in note 26.
Details of the calculation of adjusted earnings per share are set out below:2017
£0002016 £000
Profit after tax for the year 38,066 20,474Intangible amortisation (excluding software) 5,806 5,617Share-based payments 1,084 494(Gain)/loss on fair value of forward foreign exchange contracts (669) 432Exceptional items 1,883 15,229Tax effect on exceptional items (1,990) (936)Tax effect on other normalised adjustments (1,343) (1,648)
Adjusted profit after tax 42,837 39,662
The denominators used are the same as those detailed above for both basic and diluted earnings per share.
The adjustment made to profit after tax in calculating adjusted basic and diluted earnings per share has been adjusted for the tax effects of the items adjusted.
The Directors believe that adjusted earnings per share is more representative of the underlying performance of the business.
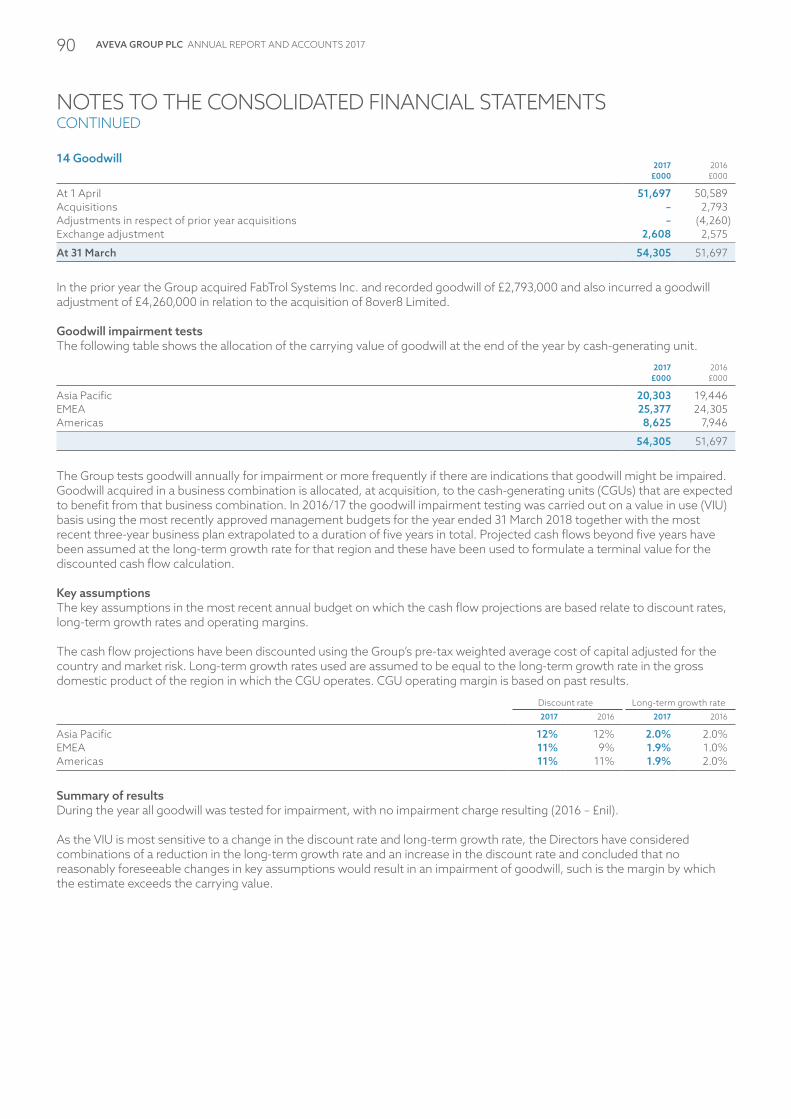
AVEVA GROUP PLC ANNUAL REPORT AND ACCOUNTS 201790
NOTES TO THE CONSOLIDATED FINANCIAL STATEMENTSCONTINUED
14 Goodwill2017
£0002016 £000
At 1 April 51,697 50,589Acquisitions – 2,793Adjustments in respect of prior year acquisitions – (4,260)Exchange adjustment 2,608 2,575
At 31 March 54,305 51,697
In the prior year the Group acquired FabTrol Systems Inc. and recorded goodwill of £2,793,000 and also incurred a goodwill adjustment of £4,260,000 in relation to the acquisition of 8over8 Limited.
Goodwill impairment testsThe following table shows the allocation of the carrying value of goodwill at the end of the year by cash-generating unit.
2017 £000
2016 £000
Asia Pacific 20,303 19,446EMEA 25,377 24,305Americas 8,625 7,946
54,305 51,697
The Group tests goodwill annually for impairment or more frequently if there are indications that goodwill might be impaired. Goodwill acquired in a business combination is allocated, at acquisition, to the cash-generating units (CGUs) that are expected to benefit from that business combination. In 2016/17 the goodwill impairment testing was carried out on a value in use (VIU) basis using the most recently approved management budgets for the year ended 31 March 2018 together with the most recent three-year business plan extrapolated to a duration of five years in total. Projected cash flows beyond five years have been assumed at the long-term growth rate for that region and these have been used to formulate a terminal value for the discounted cash flow calculation.
Key assumptionsThe key assumptions in the most recent annual budget on which the cash flow projections are based relate to discount rates, long-term growth rates and operating margins.
The cash flow projections have been discounted using the Group’s pre-tax weighted average cost of capital adjusted for the country and market risk. Long-term growth rates used are assumed to be equal to the long-term growth rate in the gross domestic product of the region in which the CGU operates. CGU operating margin is based on past results.
Discount rate Long-term growth rate2017 2016 2017 2016
Asia Pacific 12% 12% 2.0% 2.0%EMEA 11% 9% 1.9% 1.0%Americas 11% 11% 1.9% 2.0%
Summary of resultsDuring the year all goodwill was tested for impairment, with no impairment charge resulting (2016 – £nil).
As the VIU is most sensitive to a change in the discount rate and long-term growth rate, the Directors have considered combinations of a reduction in the long-term growth rate and an increase in the discount rate and concluded that no reasonably foreseeable changes in key assumptions would result in an impairment of goodwill, such is the margin by which the estimate exceeds the carrying value.

FINANCIAL STATEMENTS 91
15 Intangible assets Developed technology
£000
Customer relationships
£000
Purchased brand £000
Other software
£000
Purchased software
rights £000
Total £000
CostAt 1 April 2015 36,097 13,209 1,203 2,992 8,833 62,334Additions – – – 149 244 393Acquisitions 1,197 798 – – – 1,995Disposals – – – (30) (636) (666)Exchange adjustment 1,722 923 – 30 – 2,675
At 31 March 2016 39,016 14,930 1,203 3,141 8,441 66,731Additions – – – 56 2,196 2,252Acquisitions – – – – – –Disposals – – – (44) – (44)Exchange adjustment 2,231 715 – 42 – 2,988
At 31 March 2017 41,247 15,645 1,203 3,195 10,637 71,927
AmortisationAt 1 April 2015 20,714 5,324 60 2,150 6,580 34,828Charge for the year 3,471 1,189 241 338 715 5,954Disposals – – – (30) (636) (666)Exchange adjustment 1,249 505 – 20 – 1,774
At 31 March 2016 25,434 7,018 301 2,478 6,659 41,890Charge for the year 3,438 1,346 241 354 781 6,160Disposals – – – (44) – (44)Exchange adjustment 1,629 389 – 35 – 2,053
At 31 March 2017 30,501 8,753 542 2,823 7,440 50,059
Net book valueAt 31 March 2015 15,383 7,885 1,143 842 2,253 27,506
At 31 March 2016 13,582 7,912 902 663 1,782 24,841
At 31 March 2017 10,746 6,892 661 372 3,197 21,868
All amortisation is calculated using the straight-line method over periods of between five and twelve years for developed technology and between five and twenty years for customer relationships.
The purchased brand represents that acquired as part of the 8over8 acquisition in 2014/15 and is being amortised over five years.
For the purposes of the adjusted earnings per share calculation (note 13), intangible asset amortisation excludes the charge relating to other software of £354,000 (2016 – £338,000).

AVEVA GROUP PLC ANNUAL REPORT AND ACCOUNTS 201792
NOTES TO THE CONSOLIDATED FINANCIAL STATEMENTSCONTINUED
16 Property, plant and equipmentLong leasehold
buildings and
improvements £000
Computer equipment
£000
Fixtures, fittings
and office equipment
£000
Motor vehicles
£000Total £000
CostAt 1 April 2015 4,633 5,686 6,159 872 17,350Additions 209 1,229 427 191 2,056Acquisitions 27 23 4 – 54Disposals (456) (1,012) (523) (264) (2,255)Exchange adjustment (122) 66 163 (10) 97
At 31 March 2016 4,291 5,992 6,230 789 17,302Additions 409 1,313 504 193 2,419Acquisitions – – – – –Disposals – (521) (166) (443) (1,130)Exchange adjustment 246 1,299 495 61 2,101
At 31 March 2017 4,946 8,083 7,063 600 20,692
DepreciationAt 1 April 2015 1,301 3,849 4,166 439 9,755Charge for the year 343 1,092 553 179 2,167Disposals (237) (1,002) (423) (162) (1,824)Exchange adjustment (48) 52 100 (1) 103
At 31 March 2016 1,359 3,991 4,396 455 10,201Charge for the year 406 1,301 600 180 2,487Disposals – (515) (164) (284) (963)Exchange adjustment 95 1,068 342 30 1,535
At 31 March 2017 1,860 5,845 5,174 381 13,260
Net book valueAt 31 March 2015 3,332 1,837 1,993 433 7,595
At 31 March 2016 2,932 2,001 1,834 334 7,101
At 31 March 2017 3,086 2,238 1,889 219 7,432

FINANCIAL STATEMENTS 93
17 InvestmentsAt 31 March 2017, the Group had the following principal investments, which are held by AVEVA Solutions Limited unless stated and all of which have been included in the consolidation. AVEVA Group plc is the ultimate parent Company and owns 100% of AVEVA Solutions Limited.
The remainder of companies not disclosed below, together with their full addresses, are disclosed on pages 121 and 122.
Country of incorporation or registration Principal activity
Description and proportion of shares and voting rights held
AVEVA Solutions Limited1 United Kingdom Software development and marketing
100% ordinary shares of £1 each
AVEVA Pty Limited Australia Software marketing 100% ordinary shares of AUD$1 eachAVEVA do Brasil Informática Ltda Brazil Software marketing 100% of ordinary shares of BRL 1 eachAVEVA (Shanghai) Consultancy Co.
Limited3China Services and training 100% of issued share capital
AVEVA Solutions (Shanghai) Co. Limited China Software marketing 100% of ordinary sharesAVEVA Denmark A/S Denmark Software development
and marketing100% of ordinary shares of DKK 1 each
AVEVA SA France Software marketing 100% ordinary shares of €30 each AVEVA GmbH Germany Software marketing 100% ordinary shares of €25,565 eachAVEVA East Asia Limited Hong Kong Software marketing 100% ordinary shares of HK$1 eachAVEVA Solutions India LLP India Software development 100% ordinary shares of INR 10 eachAVEVA Information Technology India
Private LimitedIndia Software marketing 100% ordinary shares of INR 10 each
AVEVA KK Japan Software marketing 100% ordinary shares of 50,000 Yen eachAVEVA Korea Limited Korea Software marketing 100% ordinary shares of KRW 500,000 each AVEVA Sendirian Berhad2 Malaysia Software marketing 49% ordinary shares of MYR 1 eachAVEVA Asia Pacific Sendirian Berhad Malaysia Software marketing 100% ordinary shares of MYR 1 eachAVEVA AS Norway Software development
and marketing, training and consultancy
100% ordinary shares of NOK 500 each
AVEVA OOO Limited Liability Company Russia Software marketing 100% of ordinary sharesAVEVA Pte Limited3 Singapore Software marketing 100% of ordinary shares of SGD 10 eachAVEVA AB Sweden Software development
and marketing100% of ordinary shares of SEK 10 each
AVEVA Inc. USA Software marketing 100% common stock of US$1 each
1 Held by AVEVA Group plc.2 AVEVA Sendirian Berhad has been consolidated on the basis that the Group exercises control over its financial and operating policies under the terms of the shareholders’
agreement.3 Held by AVEVA AB.
18 Trade and other receivables 2017
£0002016 £000
CurrentAmounts falling due within one year:Trade receivables 85,041 88,618Prepayments and other receivables 7,465 7,384Accrued income 773 1,136
93,279 97,138
Trade receivables are non-interest bearing and generally on terms of between 30 and 90 days. The Directors consider that the carrying amount of trade and other receivables approximates their fair value.
2017 £000
2016 £000
Non-currentPrepayments and other receivables 1,499 1,257
Non-current prepayments and other receivables include rental deposits for operating leases.
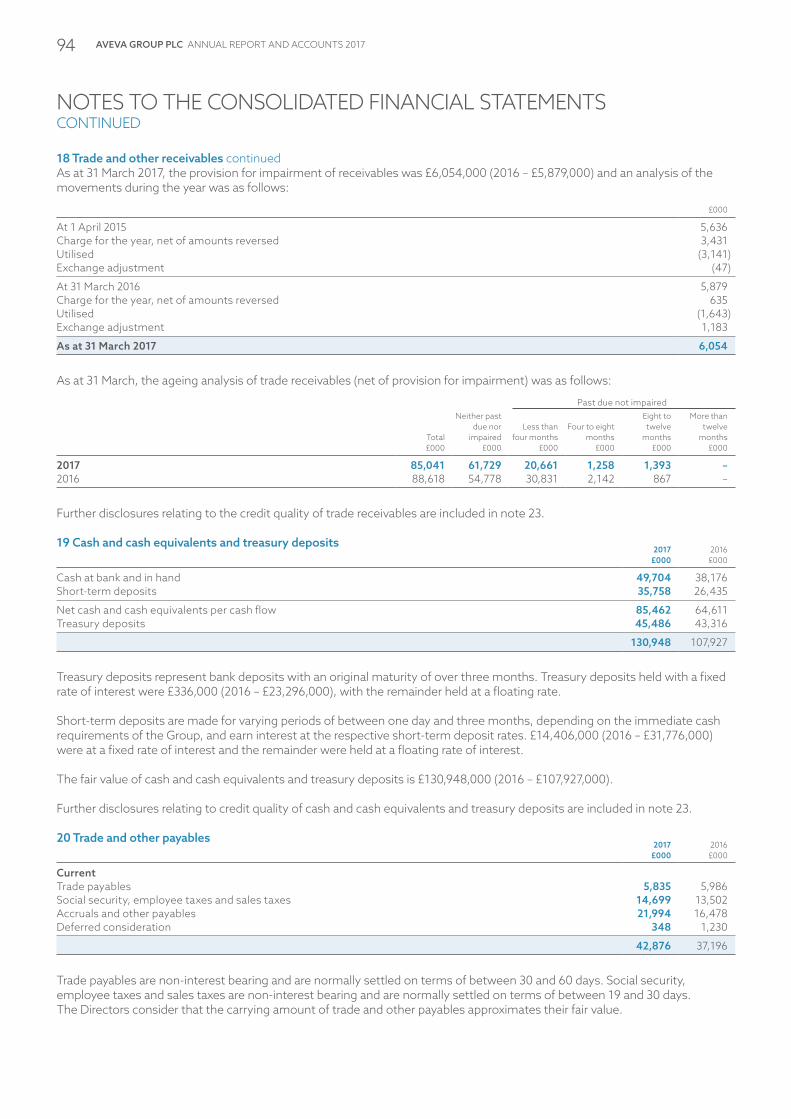
AVEVA GROUP PLC ANNUAL REPORT AND ACCOUNTS 201794
NOTES TO THE CONSOLIDATED FINANCIAL STATEMENTSCONTINUED
18 Trade and other receivables continuedAs at 31 March 2017, the provision for impairment of receivables was £6,054,000 (2016 – £5,879,000) and an analysis of the movements during the year was as follows:
£000
At 1 April 2015 5,636Charge for the year, net of amounts reversed 3,431Utilised (3,141)Exchange adjustment (47)
At 31 March 2016 5,879Charge for the year, net of amounts reversed 635Utilised (1,643)Exchange adjustment 1,183
As at 31 March 2017 6,054
As at 31 March, the ageing analysis of trade receivables (net of provision for impairment) was as follows:
Total £000
Neither past due nor
impaired £000
Past due not impaired
Less than four months
£000
Four to eight months
£000
Eight to twelve
months £000
More than twelve
months £000
2017 85,041 61,729 20,661 1,258 1,393 –2016 88,618 54,778 30,831 2,142 867 –
Further disclosures relating to the credit quality of trade receivables are included in note 23.
19 Cash and cash equivalents and treasury deposits2017
£0002016 £000
Cash at bank and in hand 49,704 38,176Short-term deposits 35,758 26,435
Net cash and cash equivalents per cash flow 85,462 64,611Treasury deposits 45,486 43,316
130,948 107,927
Treasury deposits represent bank deposits with an original maturity of over three months. Treasury deposits held with a fixed rate of interest were £336,000 (2016 – £23,296,000), with the remainder held at a floating rate.
Short-term deposits are made for varying periods of between one day and three months, depending on the immediate cash requirements of the Group, and earn interest at the respective short-term deposit rates. £14,406,000 (2016 – £31,776,000) were at a fixed rate of interest and the remainder were held at a floating rate of interest.
The fair value of cash and cash equivalents and treasury deposits is £130,948,000 (2016 – £107,927,000).
Further disclosures relating to credit quality of cash and cash equivalents and treasury deposits are included in note 23.
20 Trade and other payables 2017
£0002016 £000
CurrentTrade payables 5,835 5,986Social security, employee taxes and sales taxes 14,699 13,502Accruals and other payables 21,994 16,478Deferred consideration 348 1,230
42,876 37,196
Trade payables are non-interest bearing and are normally settled on terms of between 30 and 60 days. Social security, employee taxes and sales taxes are non-interest bearing and are normally settled on terms of between 19 and 30 days. The Directors consider that the carrying amount of trade and other payables approximates their fair value.
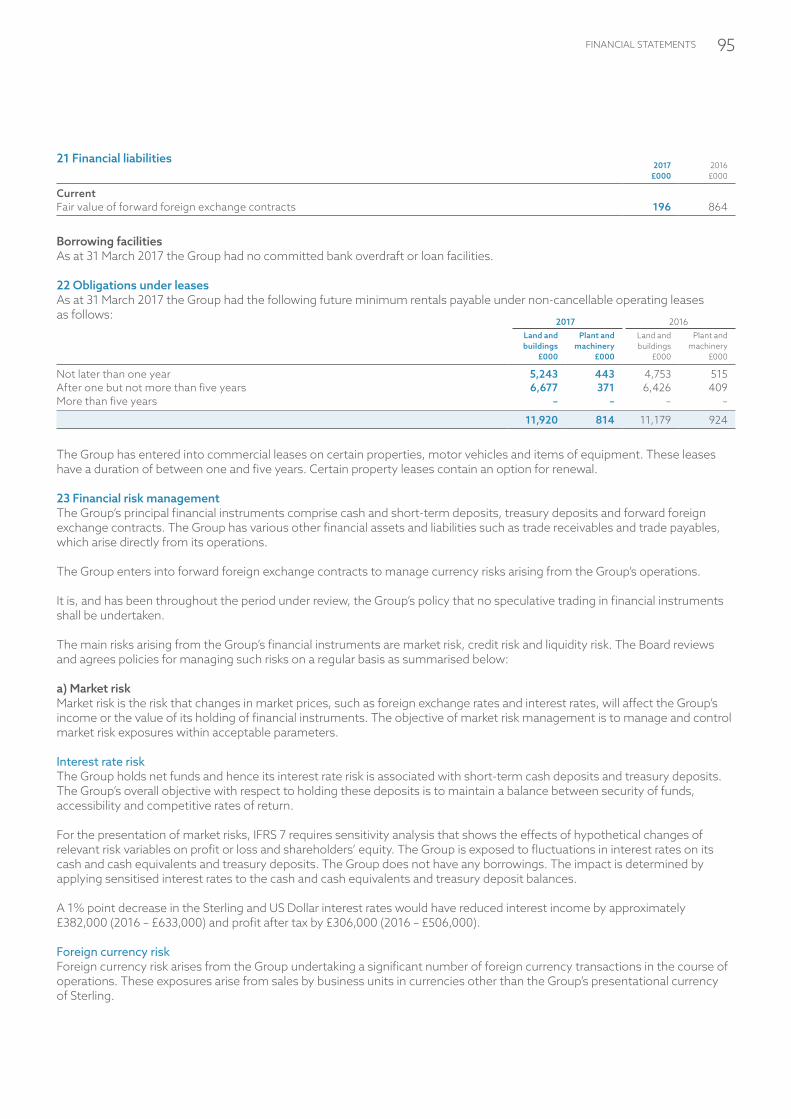
FINANCIAL STATEMENTS 95
21 Financial liabilities2017
£0002016 £000
CurrentFair value of forward foreign exchange contracts 196 864
Borrowing facilitiesAs at 31 March 2017 the Group had no committed bank overdraft or loan facilities.
22 Obligations under leases As at 31 March 2017 the Group had the following future minimum rentals payable under non-cancellable operating leases as follows:
2017 2016Land and buildings
£000
Plant and machinery
£000
Land and buildings
£000
Plant and machinery
£000
Not later than one year 5,243 443 4,753 515After one but not more than five years 6,677 371 6,426 409More than five years – – – –
11,920 814 11,179 924
The Group has entered into commercial leases on certain properties, motor vehicles and items of equipment. These leases have a duration of between one and five years. Certain property leases contain an option for renewal.
23 Financial risk managementThe Group’s principal financial instruments comprise cash and short-term deposits, treasury deposits and forward foreign exchange contracts. The Group has various other financial assets and liabilities such as trade receivables and trade payables, which arise directly from its operations.
The Group enters into forward foreign exchange contracts to manage currency risks arising from the Group’s operations.
It is, and has been throughout the period under review, the Group’s policy that no speculative trading in financial instruments shall be undertaken.
The main risks arising from the Group’s financial instruments are market risk, credit risk and liquidity risk. The Board reviews and agrees policies for managing such risks on a regular basis as summarised below:
a) Market riskMarket risk is the risk that changes in market prices, such as foreign exchange rates and interest rates, will affect the Group’s income or the value of its holding of financial instruments. The objective of market risk management is to manage and control market risk exposures within acceptable parameters.
Interest rate riskThe Group holds net funds and hence its interest rate risk is associated with short-term cash deposits and treasury deposits. The Group’s overall objective with respect to holding these deposits is to maintain a balance between security of funds, accessibility and competitive rates of return.
For the presentation of market risks, IFRS 7 requires sensitivity analysis that shows the effects of hypothetical changes of relevant risk variables on profit or loss and shareholders’ equity. The Group is exposed to fluctuations in interest rates on its cash and cash equivalents and treasury deposits. The Group does not have any borrowings. The impact is determined by applying sensitised interest rates to the cash and cash equivalents and treasury deposit balances.
A 1% point decrease in the Sterling and US Dollar interest rates would have reduced interest income by approximately £382,000 (2016 – £633,000) and profit after tax by £306,000 (2016 – £506,000).
Foreign currency riskForeign currency risk arises from the Group undertaking a significant number of foreign currency transactions in the course of operations. These exposures arise from sales by business units in currencies other than the Group’s presentational currency of Sterling.

AVEVA GROUP PLC ANNUAL REPORT AND ACCOUNTS 201796
NOTES TO THE CONSOLIDATED FINANCIAL STATEMENTSCONTINUED
23 Financial risk management continuedThe majority of costs are denominated in the functional currency of the business unit. The main exposures relate to the US Dollar, Euro, South Korean Won and Japanese Yen, reflecting the fact that a significant proportion of the Group’s revenue and cash receipts are denominated in these currencies, whilst a large proportion of its costs, such as Research & Development, are settled in Sterling, Indian Rupees and Swedish Krona.
The Group manages exchange risks, where possible, by using forward foreign exchange contracts. The Group enters into forward foreign exchange contracts to sell US Dollars and Euros to match forecast cash flows arising from its recurring revenue base. In addition, it enters into specific forward foreign exchange contracts for individually significant revenue contracts, when the timing of forecast cash flows is reasonably certain. Other currency exposures are less easy to hedge cost effectively. At 31 March 2017, the Group had outstanding currency exchange contracts to sell $14.5 million (2016 – $18 million) and €9.8 million (2016 – €10.4 million).
The Group has not applied hedge accounting during the current year and therefore all gains and losses on forward foreign exchange contracts have been included in the Consolidated income statement.
The Group has investments in foreign operations whose net assets are exposed to currency translation risk. Gains and losses arising from these structural currency exposures are recognised in the Consolidated statement of comprehensive income.
Foreign currency sensitivity analysisFor the presentation of market risks, IFRS 7 requires sensitivity analysis that shows the effects of hypothetical changes in the foreign exchange rates in profit or loss or shareholders’ equity. The impact is determined by applying the sensitised foreign exchange rate to the monetary assets and liabilities at the balance sheet date.
Currency risks as defined by IFRS 7 arise on account of financial instruments being denominated in a currency that is not the functional currency and being of a monetary nature; differences resulting from the translation of financial statements into the Group’s presentation currency are not taken into consideration.
A 10% change in the US Dollar against Sterling and Euro against Sterling would have impacted equity and profit after tax by the amounts shown below as at the reporting date shown. In management’s opinion, this is a reasonably possible change given current market conditions. Our analysis indicates that a 10% change in other currencies would not have a significant impact. This analysis assumes that all other variables, in particular interest rates and other foreign currencies, remain constant. The analysis is performed on the same basis for 2015/16.
31 March 2017
Increase/ (decrease)in average
rateProfit/(loss)
£000Equity
£000
US Dollar 10% (2,041) (2,041)(10%) 2,248 2,248
Euro 10% 59 59(10%) (65) (65)
31 March 2016
Increase/ (decrease) in average
rateProfit/(loss)
£000Equity
£000
US Dollar 10% (1,450) (1,450)(10%) 1,594 1,594
Euro 10% (267) (267)(10%) 294 294
b) Credit riskThe Group’s principal financial assets are cash equivalents, treasury deposits, trade and other receivables.
Counterparties for cash and cash equivalents and treasury deposits are governed by the treasury policy, which has been approved by the Board, and are limited to financial institutions which have a high credit rating assigned by international credit rating agencies. As set out in the Group’s treasury policy, the amount of exposure to each counterparty is subject to a specific limit, up to a maximum of 50% of the Group’s total counterparty risk. Within this overall limit, some counterparties are subject to more restrictive caps on counterparty exposure.

FINANCIAL STATEMENTS 97
The Group trades only with recognised, creditworthy third parties and provides credit to customers in the normal course of business. The amounts presented in the Consolidated balance sheet are net of allowances for doubtful receivables. An allowance for impairment is made where there is an identified loss event, which, based on previous experience, is evidence of a reduction in the recoverability of the cash flows. The Group has credit control functions to monitor receivable balances on an ongoing basis. Credit checks are performed before credit is granted to new customers. Due to the credit control procedures in place, we believe all the receivables are of good quality. The Group has no significant concentration of credit risk, with exposure spread over a large number of customers. The maximum exposure to credit risk is represented by the carrying amount of each financial asset. The exposure to credit risk is mitigated where necessary by either letters of credit or payments in advance.
The Group does not require collateral in respect of its financial assets.
c) Liquidity riskThe Group manages liquidity risk by maintaining adequate cash reserves and by continuously monitoring forecast and actual cash flows and matching the maturity of financial assets and liabilities. The Group has no borrowings from third parties and therefore liquidity risk is not considered a significant risk at this time.
The table below analyses the Group’s financial liabilities, which will be settled on a net basis, into relevant maturity groupings based on the remaining period at the balance sheet date to the contractual maturity date. The amounts disclosed in the table are the contractual undiscounted cash flows:
Less than three
months £000
Between three
months and six months
£000
Between six months and
one year £000
Greater than one year
£000
As at 31 March 2017 Trade and other payables 42,528 – – –
As at 31 March 2016Trade and other payables 35,966 – – –
The table below analyses the Group’s forward foreign exchange contracts, which will be settled on a gross basis, into relevant maturity groupings based on the remaining period at the balance sheet date to the contractual maturity date. The amounts disclosed in the table are the contractual undiscounted cash flows:
Less than three
months ‘000
Between three
months and six months
‘000
Between six months and
one year ‘000
As at 31 March 2017Forward foreign exchange contracts (GBP/EUR) Outflow €4,375 €3,425 €1,975Inflow £3,745 £2,969 £1,707
Forward foreign exchange contracts (GBP/USD)Outflow $7,450 $4,525 $2,525Inflow £5,756 £3,579 £2,012
Forward foreign exchange contracts (USD/EUR)Outflow – – –Inflow – – –
As at 31 March 2016Forward foreign exchange contracts (GBP/EUR) Outflow €4,590 €3,000 €2,755Inflow £3,379 £2,235 £2,141
Forward foreign exchange contracts (GBP/USD)Outflow $7,950 $5,575 $4,300Inflow £5,263 £3,749 £2,983
Forward foreign exchange contracts (USD/EUR)Outflow $200 – –Inflow €182 – –
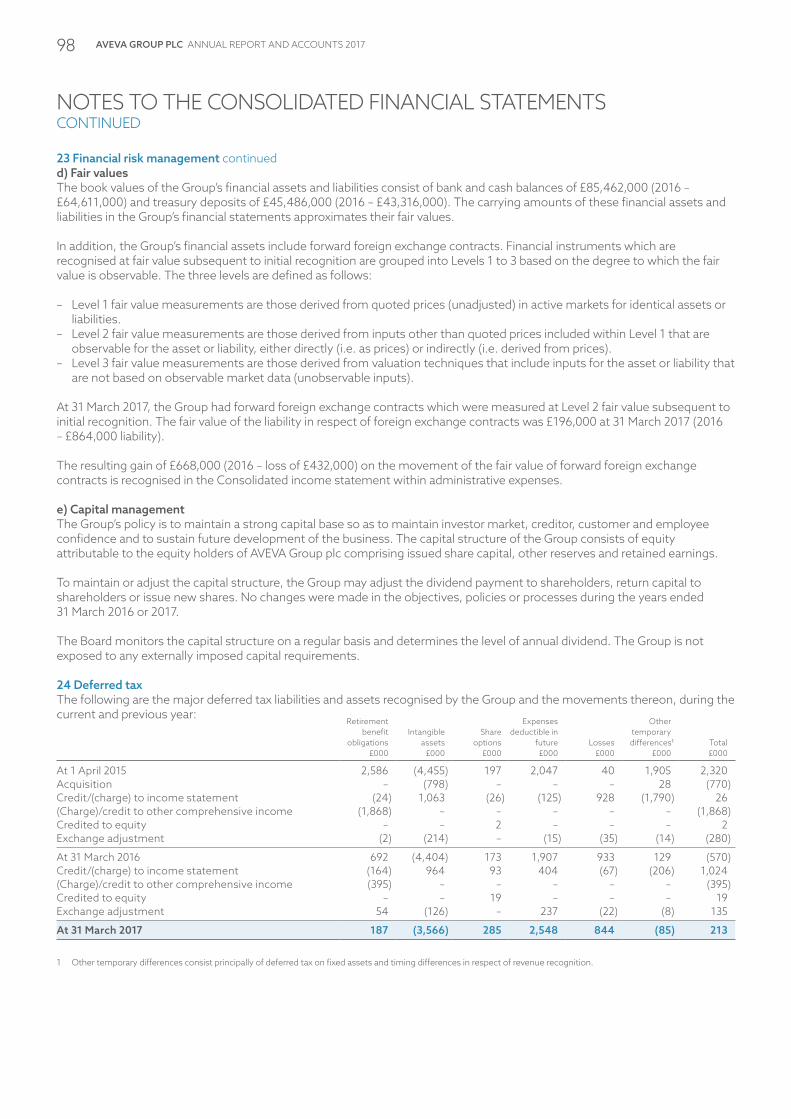
AVEVA GROUP PLC ANNUAL REPORT AND ACCOUNTS 201798
NOTES TO THE CONSOLIDATED FINANCIAL STATEMENTSCONTINUED
23 Financial risk management continuedd) Fair valuesThe book values of the Group’s financial assets and liabilities consist of bank and cash balances of £85,462,000 (2016 – £64,611,000) and treasury deposits of £45,486,000 (2016 – £43,316,000). The carrying amounts of these financial assets and liabilities in the Group’s financial statements approximates their fair values.
In addition, the Group’s financial assets include forward foreign exchange contracts. Financial instruments which are recognised at fair value subsequent to initial recognition are grouped into Levels 1 to 3 based on the degree to which the fair value is observable. The three levels are defined as follows:
– Level 1 fair value measurements are those derived from quoted prices (unadjusted) in active markets for identical assets or liabilities.
– Level 2 fair value measurements are those derived from inputs other than quoted prices included within Level 1 that are observable for the asset or liability, either directly (i.e. as prices) or indirectly (i.e. derived from prices).
– Level 3 fair value measurements are those derived from valuation techniques that include inputs for the asset or liability that are not based on observable market data (unobservable inputs).
At 31 March 2017, the Group had forward foreign exchange contracts which were measured at Level 2 fair value subsequent to initial recognition. The fair value of the liability in respect of foreign exchange contracts was £196,000 at 31 March 2017 (2016 – £864,000 liability).
The resulting gain of £668,000 (2016 – loss of £432,000) on the movement of the fair value of forward foreign exchange contracts is recognised in the Consolidated income statement within administrative expenses.
e) Capital managementThe Group’s policy is to maintain a strong capital base so as to maintain investor market, creditor, customer and employee confidence and to sustain future development of the business. The capital structure of the Group consists of equity attributable to the equity holders of AVEVA Group plc comprising issued share capital, other reserves and retained earnings.
To maintain or adjust the capital structure, the Group may adjust the dividend payment to shareholders, return capital to shareholders or issue new shares. No changes were made in the objectives, policies or processes during the years ended 31 March 2016 or 2017.
The Board monitors the capital structure on a regular basis and determines the level of annual dividend. The Group is not exposed to any externally imposed capital requirements.
24 Deferred taxThe following are the major deferred tax liabilities and assets recognised by the Group and the movements thereon, during the current and previous year:
Retirement benefit
obligations £000
Intangible assets
£000
Share options
£000
Expenses deductible in
future£000
Losses £000
Other temporarydifferences1
£000Total £000
At 1 April 2015 2,586 (4,455) 197 2,047 40 1,905 2,320Acquisition – (798) – – – 28 (770)Credit/(charge) to income statement (24) 1,063 (26) (125) 928 (1,790) 26(Charge)/credit to other comprehensive income (1,868) – – – – – (1,868)Credited to equity – – 2 – – – 2Exchange adjustment (2) (214) – (15) (35) (14) (280)
At 31 March 2016 692 (4,404) 173 1,907 933 129 (570)Credit/(charge) to income statement (164) 964 93 404 (67) (206) 1,024(Charge)/credit to other comprehensive income (395) – – – – – (395)Credited to equity – – 19 – – – 19Exchange adjustment 54 (126) – 237 (22) (8) 135
At 31 March 2017 187 (3,566) 285 2,548 844 (85) 213
1 Other temporary differences consist principally of deferred tax on fixed assets and timing differences in respect of revenue recognition.

FINANCIAL STATEMENTS 99
Certain deferred tax assets and liabilities have been offset. The following is the analysis of the deferred tax balances (after offset) for financial reporting purposes:
2017 £000
2016 £000
Deferred tax liabilities (3,381) (3,187)Deferred tax assets 3,594 2,617
213 (570)
At the balance sheet date, the Group has unused tax losses of £8,757,000 (2016 – £7,005,000) available for offset against future profits. Of the total deferred tax asset of £2,317,000 (2016 – £1,514,000), £844,000 (2016 – £933,000) has been recognised and is included above. These losses may be carried forward indefinitely.
At the balance sheet date, the aggregate amount of temporary differences associated with undistributed earnings of overseas subsidiaries for which deferred tax liabilities have not been recognised was approximately £46,570,000 (2016 – £37,134,000). No liability has been recognised in respect of these differences because the Group is in a position to control the timing of the reversal of the temporary differences and it is probable that such differences will not reverse in the foreseeable future. It is likely that the majority of the overseas earnings would qualify for the UK dividend exemption but may be subject to foreign withholding taxes.
25 Retirement benefit obligationsThe movement on the provision for retirement benefit obligations was as follows:
UK defined benefit
scheme £000
German defined benefit
schemes £000
South Korean
severance pay
£000Total £000
At 31 March 2015 11,281 1,059 1,847 14,187Current service cost – – 213 213Net interest on pension scheme liabilities 506 30 42 578Actuarial remeasurements (7,936) 211 (112) (7,837)Employer contributions (1,580) (11) (471) (2,062)Exchange adjustment – 104 (21) 83
At 31 March 2016 2,271 1,393 1,498 5,162Current service cost – – 227 227Net interest on pension scheme liabilities 274 28 36 338Actuarial remeasurements (2,187) 27 (10) (2,170)Employer contributions (1,580) 314 (100) (1,366)Exchange adjustment – 122 275 397
At 31 March 2017 (1,222) 1,884 1,926 2,588
The UK defined benefit scheme surplus has been recognised as a non-current asset as the Group has a right to any remaining surplus after all liabilities are paid. The Trustees may not distribute any surplus without the agreement of the Group. If such agreement is withheld, the Trustees are required to repay any remaining funds to the Group.
a) UK defined benefit schemeThe Group operates a UK defined benefit pension plan providing benefits based on final pensionable pay which is funded. This scheme was closed to new employees on 30 September 2002 (with the option of reopening if required) and was converted to a Career Average Revalued Earnings basis on 30 September 2004. The scheme closed to future benefit accrual with effect from 1 April 2015. Pensions are also payable to dependants on death. Administration on behalf of the members is governed by a trust deed, and the funds are held and managed by professional investment managers who are independent of the Group.
Contributions to the scheme are made in accordance with advice from an external, professionally qualified actuary, Broadstone Corporate Benefits Limited, at rates which are calculated to be sufficient to meet the future liabilities of the scheme. Scheme assets are stated at their market values at the respective balance sheet dates.
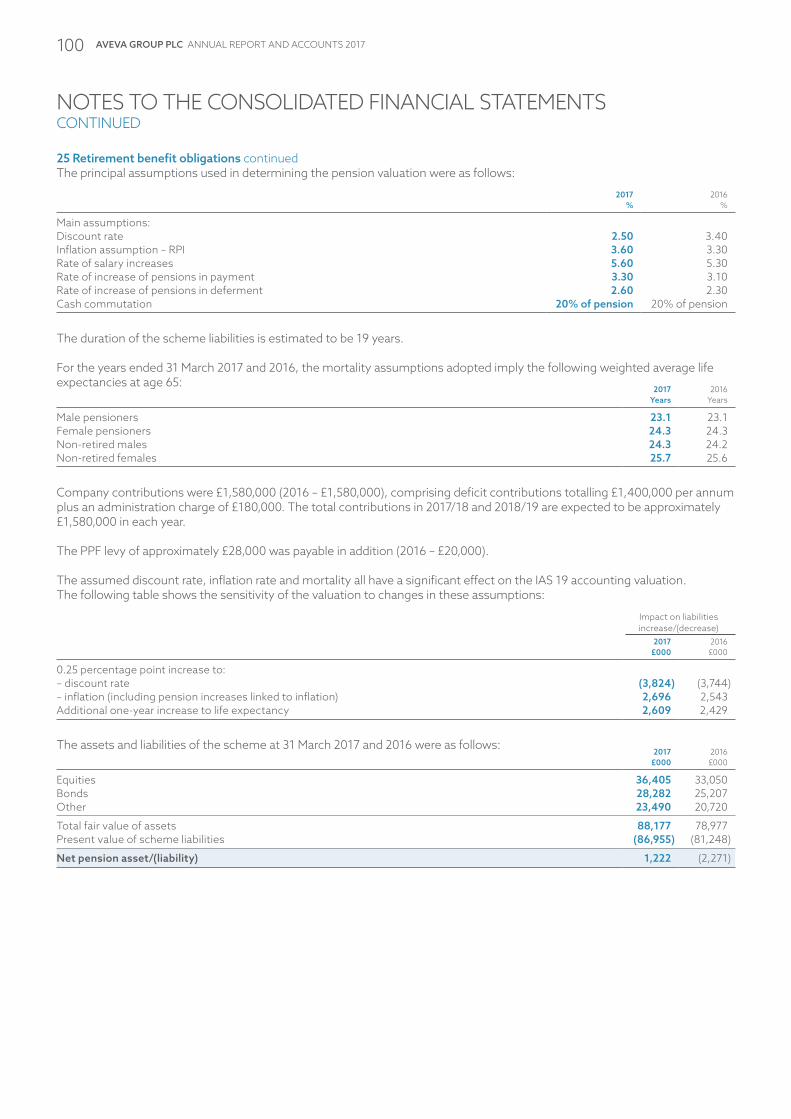
AVEVA GROUP PLC ANNUAL REPORT AND ACCOUNTS 2017100
NOTES TO THE CONSOLIDATED FINANCIAL STATEMENTSCONTINUED
25 Retirement benefit obligations continuedThe principal assumptions used in determining the pension valuation were as follows:
2017 %
2016 %
Main assumptions:Discount rate 2.50 3.40Inflation assumption – RPI 3.60 3.30Rate of salary increases 5.60 5.30Rate of increase of pensions in payment 3.30 3.10Rate of increase of pensions in deferment 2.60 2.30Cash commutation 20% of pension 20% of pension
The duration of the scheme liabilities is estimated to be 19 years.
For the years ended 31 March 2017 and 2016, the mortality assumptions adopted imply the following weighted average life expectancies at age 65:
2017 Years
2016 Years
Male pensioners 23.1 23.1Female pensioners 24.3 24.3Non-retired males 24.3 24.2Non-retired females 25.7 25.6
Company contributions were £1,580,000 (2016 – £1,580,000), comprising deficit contributions totalling £1,400,000 per annum plus an administration charge of £180,000. The total contributions in 2017/18 and 2018/19 are expected to be approximately £1,580,000 in each year.
The PPF levy of approximately £28,000 was payable in addition (2016 – £20,000).
The assumed discount rate, inflation rate and mortality all have a significant effect on the IAS 19 accounting valuation. The following table shows the sensitivity of the valuation to changes in these assumptions:
Impact on liabilities increase/(decrease)
2017 £000
2016 £000
0.25 percentage point increase to:– discount rate (3,824) (3,744)– inflation (including pension increases linked to inflation) 2,696 2,543Additional one-year increase to life expectancy 2,609 2,429
The assets and liabilities of the scheme at 31 March 2017 and 2016 were as follows:2017
£0002016 £000
Equities 36,405 33,050Bonds 28,282 25,207Other 23,490 20,720
Total fair value of assets 88,177 78,977Present value of scheme liabilities (86,955) (81,248)
Net pension asset/(liability) 1,222 (2,271)

FINANCIAL STATEMENTS 101
The amounts recognised in the Consolidated income statement and Consolidated statement of comprehensive income for the year are analysed as follows:
2017 £000
2016 £000
Finance revenueInterest income on pension scheme assets (2,446) (2,197)
Finance costsInterest on pension scheme liabilities 2,720 2,703
Taken to Consolidated statement of comprehensive incomeActual return on pension scheme assets 12,692 2,526Less: interest income on pension scheme assets (2,446) (2,197)
10,246 329Changes in assumptions and experience adjustments on liabilities (8,059) 7,607
Remeasurement gain on defined benefit plan 2,187 7,936
Analysis of movements in the present value of the defined benefit pension obligations during the year are analysed as follows:
2017 £000
2016 £000
At 1 April 81,248 88,215Interest on pension scheme liabilities 2,720 2,703Benefits paid (5,057) (2,048)Premiums paid (15) (15)Actuarial (gain)/loss due to experience (3,244) (340)Actuarial (gain)/loss due to changes in the economic assumptions 11,303 (4,656)Actuarial (gain)/loss due to changes in the demographic assumptions – (2,611)
At 31 March 86,955 81,248
The above defined benefit obligation arises from a plan that is wholly funded.
Changes in the fair value of plan assets are as follows:
2017 £000
2016 £000
At 1 April 78,977 76,934Interest income 2,446 2,197Contributions by employer 1,580 1,580Benefits paid (5,057) (2,048)Premiums paid (15) (15)Actual return less interest in income 10,246 329
At 31 March 88,177 78,977
b) German defined benefit schemesThere are three defined benefit pension schemes in AVEVA GmbH. Tribon Solutions GmbH operated an unfunded defined benefit scheme that provides benefits to three deferred members following an acquisition in 1992. No current employees participate in the scheme and it is closed to new applicants. Benefit payments are made as they fall due. The scheme was transferred to AVEVA GmbH when Tribon Solutions GmbH and AVEVA GmbH merged in 2005.
Since the acquisition of Bocad in May 2012, AVEVA Software GmbH had been responsible for the pension obligations of six former Bocad employees. At the time of the acquisition, the pension obligations were only partly financed via external funding vehicles. In March 2013, AVEVA concluded an agreement with an external insurance provider which resulted in the insurance company being obliged to provide all benefits as detailed in the individual pension commitments, with AVEVA only having an obligation if the external insurance provider defaults.
In addition, AVEVA GmbH operates a defined benefit pension scheme for one employee. This scheme is closed to new members.

AVEVA GROUP PLC ANNUAL REPORT AND ACCOUNTS 2017102
NOTES TO THE CONSOLIDATED FINANCIAL STATEMENTSCONTINUED
25 Retirement benefit obligations continuedDetails of the actuarial assumptions used to value these schemes in accordance with IAS 19 are set out below:
2017 2016
Rate of increase of pension in payment 1.25%–2.5% 1.25%–2.5%Discount rate 1.5%–1.55% 1.5%–2.5%Mortality 13–20 years 13–20 yearsRate of salary increases N/A N/A
The retirement ages for the Tribon Solutions GmbH and AVEVA GmbH schemes were 60 and 63 years of age respectively (2016 – 60 and 63 years of age).
c) South Korean severance paySouth Korean employees are entitled to a lump sum on severance of their employment equal to one month’s salary for each year of service. The IAS 19 valuation of the liability has been carried out using the following assumptions:
2017 %
2016 %
Rate of salary increases 4.00 4.00Discount rate 2.60 2.29
The retirement age for AVEVA Korea Limited employees is 60 years of age (2016 – 60 years of age).
d) Other retirement schemesAll Swedish employees employed by AVEVA AB aged 28 or over are members of the ITP, an industry scheme for salaried employees which provides benefits in addition to the state pension arrangements. The ITP scheme is managed by Alecta, a Swedish insurance company. It is a multi-employer defined benefit scheme with a supplementary defined contribution component. AVEVA AB pays monthly premiums to the insurers which vary by age, service and salary of the employee. AVEVA AB is unable to identify its share of the underlying assets and liabilities in the scheme on a fair and reasonable basis because this information is not provided by the scheme and therefore has accounted for the scheme as if it was a defined contribution pension scheme. At 31 March 2017, Alecta’s surplus in the form of collective funding level was 152% (2016 – 144%) which was calculated in accordance with the Swedish Annual Accounts Act for Insurance Companies. The total cost charged to the income statement was £879,042 (2016 – £701,550).
e) Defined contribution schemesThe Group operates defined contribution retirement schemes for certain UK, US, German, French, Norwegian and Asian employees. The assets of the schemes are held separately from those of the Group. The total cost charged to income of £6,465,670 (2016 – £6,346,000) represents contributions payable to these schemes by the Group at the rates specified in the rules of the plans.
26 Share-based payment plansThe Group has four equity-settled share schemes: the AVEVA Group plc Long-Term Incentive Plan (LTIP); the AVEVA Group Management Bonus Deferred Share Scheme; the AVEVA Group plc Senior Employee Restricted Share Plan 2015; and the AVEVA Group plc Executive Share Option Scheme 2007. No grants have been made under the 2007 scheme which was approved at the Annual General Meeting on 12 July 2007. Details of these plans are set out below.
The following table illustrates the number and weighted average exercise prices (WAEP) of, and movements in, share options for the schemes during the year:
2017 Number
2017 WAEP Pence
2016 Number
2016 WAEP Pence
Outstanding at start of year 737,609 3.46 584,643 3.28Granted during year 189,030 3.51 421,295 3.52Forfeited during year (150,892) 3.56 (228,394) 3.51Exercised during year1 (28,136) 1.86 (39,935) 1.15
Outstanding at end of year 747,611 3.52 737,609 3.46Exercisable at end of year1 42,335 3.52 56,135 3.56
1 The weighted average share price at the date of exercise for the options exercised is £16.48 (2016 – £19.16).

FINANCIAL STATEMENTS 103
Share options granted under the schemes to certain employees and which remain outstanding are as follows:
Date of grant Share option plan
Number of options
2017 Number
Number of options
2016 Number
Exercise price
Pence
7 July 2009 LTIP – 3,611 3.5626 July 2010 LTIP 9,682 9,682 3.566 July 2011 LTIP 32,263 42,842 3.5620 June 2013 Deferred Share Scheme – 8,257 –21 August 2013 LTIP – 109,145 3.564 July 2014 Deferred Share Scheme 5,004 9,539 –21 July 2014 LTIP 153,012 159,503 3.5621 July 2015 LTIP 217,818 232,025 3.5621 July 2015 Restricted Share Plan 62,112 64,372 3.566 August 2015 Deferred Share Scheme 1,271 1,859 –22 January 2016 LTIP 77,419 96,774 3.5613 July 2016 Restricted Share Plan 61,311 – 3.5613 July 2016 LTIP 125,559 – 3.5625 July 2016 Deferred Share Scheme 2,160 – –
747,611 737,609
The fair value of each of these option awards is measured at grant date using the Black-Scholes option pricing model taking into account the terms and conditions upon which the instruments were granted. The following table lists the inputs to the model used for each of the awards:
2016/17 awards
2015/16 awards
Common to all plans:Expected volatility 44% 37%Risk-free interest rate 0.17% 0.95%Expected life of option 3 years 3 yearsLTIP July and Restricted Share PlanWeighted average share price £18.40 £22.55Dividend yield 1.96% 1.35%LTIP JanuaryWeighted average share price – £13.57Dividend yield – 2.25%Deferred Share SchemeWeighted average share price £18.76 £21.53Dividend yield 1.92% 1.42%
The weighted average remaining contractual life for the options outstanding at 31 March 2017 is 5.77 years (2016 – 5.23 years).
The average fair value of options granted during the year was £17.32 (2016 – £19.55). In calculating the fair value, the expected life of the options is based on historical data and is not necessarily indicative of exercise patterns that may occur. The expected volatility reflects the assumption that the historical volatility is indicative of future trends, which may also not necessarily be the actual outcome.
The Group recognised an expense of £1,084,000 related to equity-settled share-based payment transactions in the year ended 31 March 2017 (2016 – expense of £494,000).
Details of the share option plans are as follows:
a) Long-Term Incentive Plan (LTIP)The following awards have been made under the LTIP. The exercise price is equal to the nominal value of the underlying shares, which is 3.56 pence. Options under the LTIP are normally exercisable in full or in part between the third and tenth anniversaries of the date of grant.

AVEVA GROUP PLC ANNUAL REPORT AND ACCOUNTS 2017104
NOTES TO THE CONSOLIDATED FINANCIAL STATEMENTSCONTINUED
26 Share-based payment plans continued2016/17 awardsIn 2016/17, a total of 125,559 share options were awarded to Executive Directors and senior management under the LTIP. The performance conditions attached to this award are based on EPS growth over the three years from 2016/17 to 2018/19. If average adjusted diluted Earnings Per Share (EPS) growth is more than 15% then all shares shall vest. If average adjusted diluted EPS growth over the same period is less than 5% then none of the shares will vest. For growth rates between 5% and 15% the number of shares that vest will be determined by linear interpolation between 25% and 100%.
2015/16 awardsIn 2015/16, a total of 253,610 share options were awarded to Executive Directors and senior management under the LTIP. The performance conditions attached to this award are based on EPS growth over the three years from 2015/16 to 2017/18. If average adjusted diluted EPS growth is more than 20% then all shares shall vest. If average adjusted diluted EPS growth over the same period is less than 12% then none of the shares will vest. For growth rates between 12% and 20% the number of shares that vest will be determined by linear interpolation between 25% and 100%.
2014/15 awardsIn 2014/15, a total of 189,740 share options were awarded to Executive Directors and senior management under the LTIP. The performance conditions attached to this award are based on EPS growth over the three years from 2014/15 to 2016/17. If average adjusted diluted EPS growth is more than 20% then all shares shall vest. If average adjusted diluted EPS growth over the same period is less than 12% then none of the shares will vest. For growth rates between 12% and 20% the number of shares that vest will be determined by linear interpolation between 25% and 100%.
2013/14 awardsIn 2013/14, a total of 136,886 share options were awarded to Executive Directors and senior management under the LTIP. The performance conditions attached to this award are based on EPS growth over the three years from 2013/14 to 2015/16. If average adjusted diluted EPS growth is more than 20% then all shares shall vest. If average adjusted diluted EPS growth over the same period is less than 14% then none of the shares will vest. For growth rates between 14% and 20% the number of shares that vest will be determined by linear interpolation between 25% and 100%.
b) Deferred annual bonus share planIn 2008, the Company established the AVEVA Group Management Bonus Deferred Share Scheme 2008 (the Deferred Share Scheme). Directors and senior management participate in the scheme. Subject to the achievement of performance conditions relating to a single financial year, these incentive arrangements are intended to reward the recipient partly in cash and partly in ordinary shares in the Company to be delivered on a deferred basis.
In July 2016, the AVEVA Group Employee Benefit Trust 2008 awarded 2,160 (2016 – 2,131) deferred shares to the Executive Directors and senior management in respect of the bonus earned in the year ended 31 March 2016 (2016 – bonus earned in year ended 31 March 2015).
The award of deferred shares takes the form of nil-cost options exercisable by participants in three equal tranches, one in each of the three years following the year in which the award is made. The option may be exercised in the 42-day period beginning on the announcement of the financial results of the Group in each of the three calendar years after that in which the option was granted. The last date of the exercise is the end of the 42-day period following the announcement of the financial results of the Group in the third calendar year following that in which the option was granted or (if applicable) such later date as the Remuneration Committee may specify. These awards are made solely in respect of performance in the financial year immediately prior to their grant. Delivery of the deferred shares is not subject to further performance conditions but each participant is required to remain an employee or Director of the Group during the three-year vesting period in order to receive his deferred shares in full (except in the case of death or the occurrence of a takeover, reconstruction or amalgamation, or voluntary winding up of the Company).
c) AVEVA Group plc Senior Employee Restricted Share Plan 2015In 2015, the Company established the AVEVA Group plc Senior Employee Restricted Share Plan 2015 (the Restricted Share Plan). The scheme allows awards of options to be made to senior management employees and the exercise price of awards granted is 3.56 pence, being the nominal value of the underlying shares. The right to exercise an option is subject to completion of a required period of continued employment within the Group, usually being three years. Options that are not exercised prior to the fifth anniversary (or, in the case of an award with an overall award period of more than four years, the sixth anniversary) of the date of grant shall lapse.

FINANCIAL STATEMENTS 105
In July 2016 a total of 61,311 options were granted to senior management. The shares under option are exercisable three years after the date of award.
In July 2015 a total of 66,638 options were granted to senior management. One-third of the shares under option are exercisable two years after the date of award and two-thirds of the shares under option are exercisable after three years.
27 Share capital and reservesa) Share capital
2017 £000
2016 £000
Allotted, called-up and fully paid63,975,869 (2016 – 63,961,113) ordinary shares of 3.56 pence each 2,275 2,274
Details of the shares issued during the year and the prior year are as follows:
2017 Number
2017 £000
2016 Number
2016 £000
At 1 April 63,961,113 2,274 63,948,241 2,274Exercise of share options 14,756 1 12,872 –
At 31 March 63,975,869 2,275 63,961,113 2,274
Year ended 31 March 2017
Date of issue
Number of shares
2017
Nominal value 2017
£
Share premium
2017 £
Market price
£
24 May 2016 10,579 376 – 15.2727 May 2016 566 20 – 16.0029 September 2016 3,611 128 – 20.12
14,756 524 –
Year ended 31 March 2016
Date of issue
Number of shares
2016
Nominal value 2016
£
Share premium
2016 £
Market price
£
29 July 2015 5,032 179 – 22.0524 September 2015 4,083 145 – 21.2910 February 2016 3,757 134 – 12.98
12,872 458 –
b) Other reservesOther reserves consist of the following:
Cumulative translation adjustment reserveThe cumulative translation adjustment reserve is used to record exchange differences which arose from 1 April 2004 from the translation of the financial statements of foreign subsidiaries.
Merger reserveThis represents the difference between the fair value and the nominal value of shares issued in connection with the acquisition of AVEVA AB in 2004.
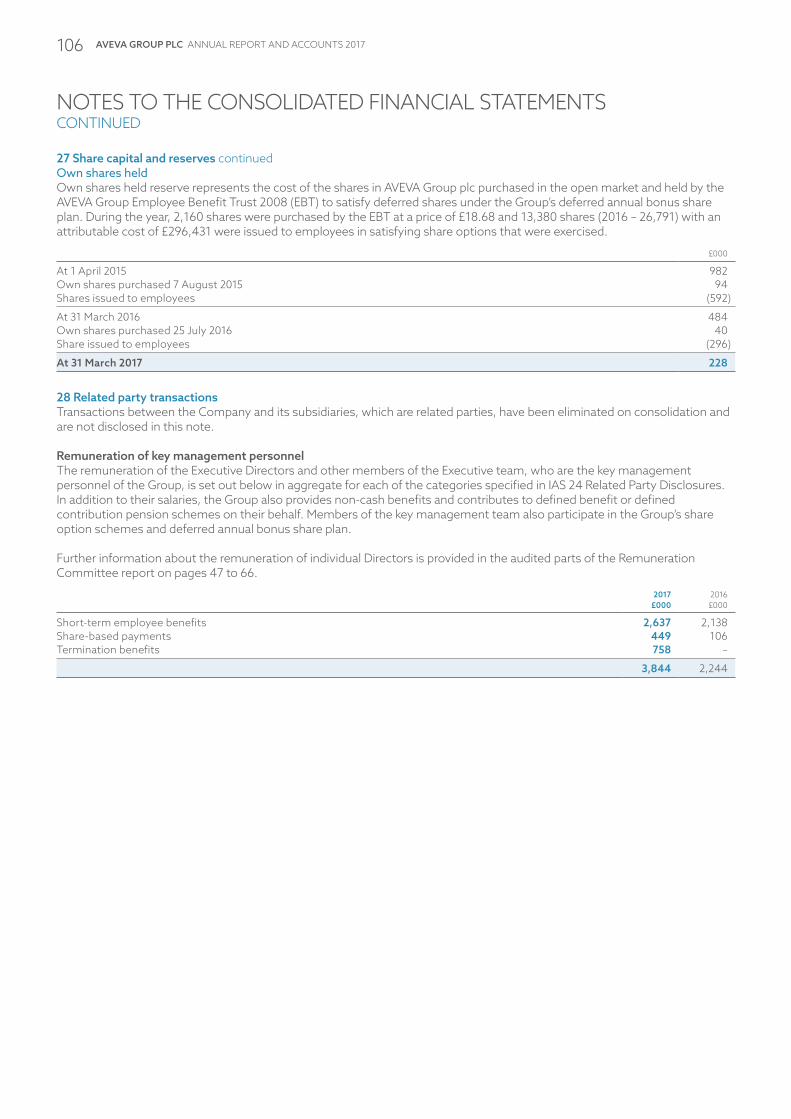
AVEVA GROUP PLC ANNUAL REPORT AND ACCOUNTS 2017106
27 Share capital and reserves continuedOwn shares heldOwn shares held reserve represents the cost of the shares in AVEVA Group plc purchased in the open market and held by the AVEVA Group Employee Benefit Trust 2008 (EBT) to satisfy deferred shares under the Group’s deferred annual bonus share plan. During the year, 2,160 shares were purchased by the EBT at a price of £18.68 and 13,380 shares (2016 – 26,791) with an attributable cost of £296,431 were issued to employees in satisfying share options that were exercised.
£000
At 1 April 2015 982Own shares purchased 7 August 2015 94Shares issued to employees (592)
At 31 March 2016 484Own shares purchased 25 July 2016 40Share issued to employees (296)
At 31 March 2017 228
28 Related party transactionsTransactions between the Company and its subsidiaries, which are related parties, have been eliminated on consolidation and are not disclosed in this note.
Remuneration of key management personnelThe remuneration of the Executive Directors and other members of the Executive team, who are the key management personnel of the Group, is set out below in aggregate for each of the categories specified in IAS 24 Related Party Disclosures. In addition to their salaries, the Group also provides non-cash benefits and contributes to defined benefit or defined contribution pension schemes on their behalf. Members of the key management team also participate in the Group’s share option schemes and deferred annual bonus share plan.
Further information about the remuneration of individual Directors is provided in the audited parts of the Remuneration Committee report on pages 47 to 66.
2017 £000
2016 £000
Short-term employee benefits 2,637 2,138Share-based payments 449 106Termination benefits 758 –
3,844 2,244
NOTES TO THE CONSOLIDATED FINANCIAL STATEMENTSCONTINUED
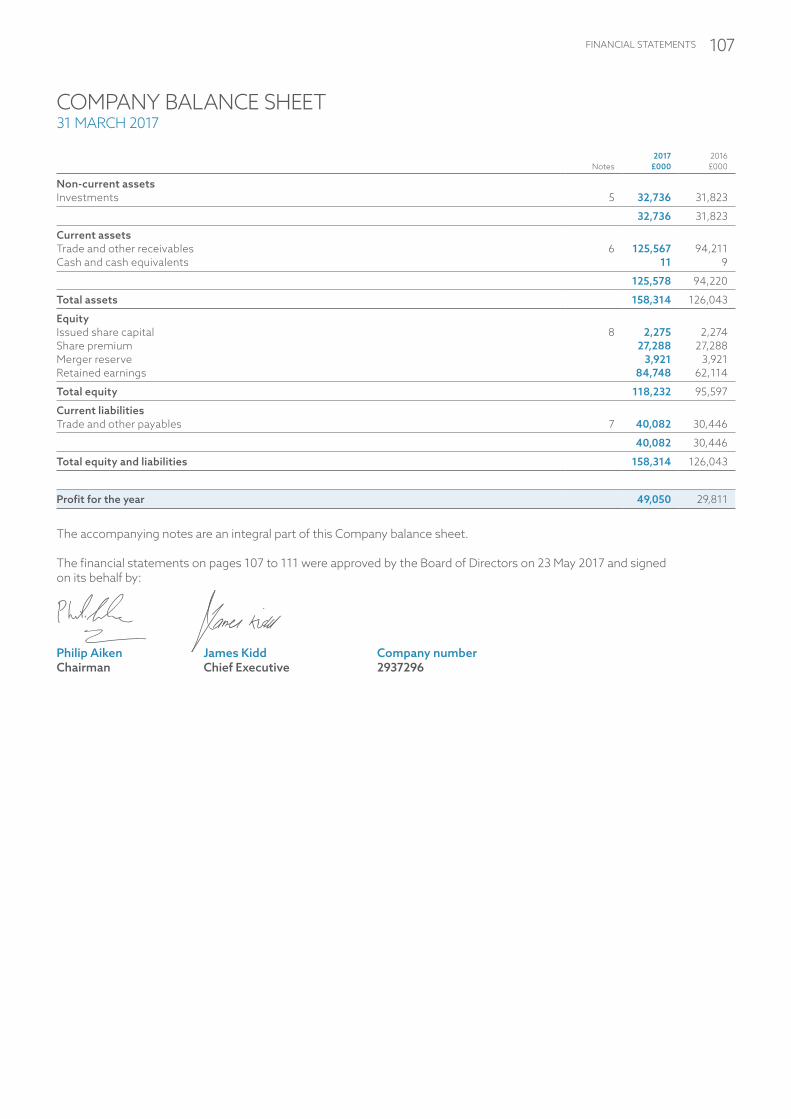
FINANCIAL STATEMENTS 107
COMPANY BALANCE SHEET31 MARCH 2017
Notes2017
£0002016 £000
Non-current assetsInvestments 5 32,736 31,823
32,736 31,823
Current assetsTrade and other receivables 6 125,567 94,211Cash and cash equivalents 11 9
125,578 94,220
Total assets 158,314 126,043
EquityIssued share capital 8 2,275 2,274Share premium 27,288 27,288Merger reserve 3,921 3,921Retained earnings 84,748 62,114
Total equity 118,232 95,597
Current liabilitiesTrade and other payables 7 40,082 30,446
40,082 30,446
Total equity and liabilities 158,314 126,043
Profit for the year 49,050 29,811
The accompanying notes are an integral part of this Company balance sheet.
The financial statements on pages 107 to 111 were approved by the Board of Directors on 23 May 2017 and signed on its behalf by:
Philip Aiken James Kidd Company numberChairman Chief Executive 2937296

AVEVA GROUP PLC ANNUAL REPORT AND ACCOUNTS 2017108
Share capital
£000
Share premium
£000
Merger reserve
£000
Profit and loss account
£000
Total shareholders’
funds£000
At 1 April 2015 2,274 27,288 3,921 51,622 85,105Profit for the year – – – 29,811 29,811Issue of share capital – – – – –Share-based payments – – – 58 58Share options granted to employees of subsidiary companies – – – 437 437Dividends paid – – – (19,814) (19,814)
At 31 March 2016 2,274 27,288 3,921 62,114 95,597Profit for the year – – – 49,050 49,050Issue of share capital 1 – – – 1Share-based payments – – – 171 171Share options granted to employees of subsidiary companies – – – 913 913Dividends paid – – – (27,500) (27,500)
At 31 March 2017 2,275 27,288 3,921 84,748 118,232
The accompanying notes are an integral part of this Company statement of changes in shareholders’ equity.
COMPANY STATEMENT OF CHANGES IN SHAREHOLDERS’ EQUITY31 MARCH 2017

FINANCIAL STATEMENTS 109
NOTES TO THE COMPANY FINANCIAL STATEMENTS
1 Authorisation of Financial Statements and Corporate informationThe financial statements of AVEVA Group plc (the Company) for the year ended 31 March 2017 were authorised for issue by the Board of Directors on 23 May 2017 and the balance sheet was signed on the Board’s behalf by Philip Aiken, the Group Chairman, and James Kidd, the CEO. AVEVA Group plc is a limited company incorporated and domiciled in England and Wales whose shares are publicly traded on the London Stock Exchange. The principal activity of the Company is that of a holding company.
These financial statements were prepared in accordance with Financial Reporting Standard 101 Reduced Disclosure Framework (FRS 101) and in accordance with applicable accounting standards. The financial statements are prepared on the historical cost basis. The accounting policies which follow set out those policies which apply in preparing the financial statements for the year ended 31 March 2017. The financial statements are presented in Sterling, rounded to the nearest thousand.
No income statement is presented by the Company as permitted by section 408 of the Companies Act 2006. The results of AVEVA Group plc are included in the Consolidated financial statements of AVEVA Group plc.
The Directors believe that the Company is well placed to manage its business risks successfully despite macroeconomic and geopolitical uncertainties. It has considerable financial resources and no borrowings. As a consequence of these factors and having reviewed the forecasts for the coming year, the Directors have a reasonable expectation that there are adequate resources to continue in operational existence for the foreseeable future. Thus, they continue to adopt the going concern basis of accounting in preparing the annual financial statements.
2 Summary of significant accounting policiesExplained below are the significant accounting policies of the Company. The full Statement of Group Accounting Policies is included on pages 113 to 120.
a) Basis of accountingThe Company has taken advantage of the following disclosure exemptions under FRS 101:
– the requirements of IAS 7: Statement of Cash Flows – the requirements of IAS 8: IFRSs issued but not effective – the requirements of IFRS 2: Share-based payments – the requirements of IFRS 7: Financial Instruments: Disclosures – the requirements of IFRS 13: Fair value measurements – the requirements of IAS 24: Related party disclosures
The basis for all of the above exemptions is because equivalent disclosures are included in the Consolidated financial statements of the Group in which the entity is consolidated.
b) TaxationCorporation tax payable is provided on taxable profits using the tax rates and laws that have been enacted or substantively enacted by the balance sheet date.
Deferred tax is recognised in respect of all timing differences that have originated but not reversed at the balance sheet date where transactions or events that result in an obligation to pay more, or a right to pay less, tax in the future have occurred at the balance sheet date. Deferred tax is measured on a non-discounted basis at the average tax rates that are expected to apply in periods in which timing differences reverse, based on tax rates and laws enacted or substantively enacted at the balance sheet date.
c) Share-based paymentsThe accounting policy in relation to share-based payment transactions is disclosed in full in the Consolidated financial statements. The Company recognises the expense relating to the Executive Directors. The Company also records a corresponding increase in its investments in subsidiaries with a credit to equity which is equivalent to the IFRS 2 cost in subsidiary undertakings.
d) Investments in subsidiariesFixed asset investments in subsidiaries are shown at cost less provision for impairment.

AVEVA GROUP PLC ANNUAL REPORT AND ACCOUNTS 2017110
NOTES TO THE COMPANY FINANCIAL STATEMENTSCONTINUED
3 Result for the yearAVEVA Group plc reported a profit for the financial year ended 31 March 2017 of £49,050,000 (2016 – £29,811,000).
Audit fees of £7,000 (2016 – £7,000) are borne by another Group company.
The Company does not have any employees (2016 – nil). Directors’ emoluments are disclosed in the Remuneration Committee report on pages 47 to 66 and in respect of the Executive Directors are paid by a UK subsidiary company.
4 Dividends2017
£0002016 £000
Declared and paid during the yearInterim 2016/17 dividend paid of 13.0 pence (2015/16 – 6.0 pence) per ordinary share 8,316 3,836Final 2015/16 dividend paid of 30.0 pence (2014/15 – 25.0 pence) per ordinary share 19,184 15,978
27,500 19,814
Proposed for approval by shareholders at the Annual General Meeting
Final 2016/17 proposed dividend of 27.0 pence (2015/16 – 30.0 pence) per ordinary share 17,271 19,182
The proposed final dividend is subject to approval by shareholders at the Annual General Meeting on 7 July 2017 and has not been included as a liability in these financial statements. If approved at the Annual General Meeting, the final dividend will be paid on 4 August 2017 to shareholders on the register at the close of business on 7 July 2017.
5 Investments£000
Cost and net book valueAt 1 April 2016 31,823Additions 913
At 31 March 2017 32,736
Details of the Company’s subsidiary undertakings are set out in note 17 in the Consolidated financial statements of the Group.
6 Trade and other receivables2017
£0002016 £000
Amounts owed by Group undertakings 125,558 94,196Prepayments 9 15
125,567 94,211
7 Trade and other payables2017
£0002016 £000
Accruals 213 252Amounts owed to Group undertakings 39,869 30,194
40,082 30,446

FINANCIAL STATEMENTS 111
8 Share capital2017
£0002016 £000
Allotted, called-up and fully paid63,975,869 (2016 – 63,961,113) ordinary shares of 3.56 pence each 2,275 2,274
Details of the shares issued during the year and the prior year are as follows:
2017 Number
2017 £000
2016 Number
2016 £000
At 1 April 63,961,113 2,274 63,948,241 2,274Exercise of share options 14,756 1 12,872 –
At 31 March 63,975,869 2,275 63,961,113 2,274
Year ended 31 March 2017
Date of issue
Number of shares
2017
Nominalvalue 2017
£
Share premium
2017 £
Market price
£
24 May 2016 10,579 376 – 15.2727 May 2016 566 20 – 16.0029 September 2016 3,611 128 – 20.12
14,756 524 –
Year ended 31 March 2016
Date of issue
Number of shares
2016
Nominalvalue 2016
£
Share premium
2016 £
Market price
£
29 July 2015 5,032 179 – 22.0524 September 2015 4,083 145 – 21.2910 February 2016 3,757 134 – 12.98
12,872 458 –
During the year the Company issued 14,756 (2016 – 12,872) ordinary shares of 3.56 pence each with a nominal value of £525 (2016 – £458) pursuant to the exercise of share options. The total proceeds were £525 (2016 – £458), which included a premium of £nil (2016 – £nil).
Details of share options awarded to Executive Directors during the year are contained in the Remuneration Committee report. Note 26 of the Consolidated financial statements for the Group includes details of share option awards made during the year.
9 Related party transactionsThere were no transactions with related parties in either the current or the preceding financial year that require disclosure within these financial statements.

AVEVA GROUP PLC ANNUAL REPORT AND ACCOUNTS 2017112
FIVE YEAR RECORD
2017 £000
2016£000
2015 £000
2014 £000
2013 £000
Summarised consolidated resultsRevenue 215,831 201,491 208,686 237,336 220,230Recurring revenue 166,033 153,985 158,213 167,020 153,224Research & Development expense (31,884) (32,128) (32,696) (38,278) (35,539)Adjusted1 profit before tax 55,004 51,201 62,098 78,257 70,562Profit before tax 46,900 29,429 54,862 68,989 63,495Income tax expense (8,834) (8,955) (13,303) (17,978) (18,098)Profit for the financial year 38,066 20,474 41,559 51,011 45,397Basic earnings per share 59.52p 32.03p 65.07p 78.12p 66.80pAdjusted1 basic earnings per share 66.98p 62.04p 74.51p 89.05p 74.70pTotal dividend per share 40.00p 36.00p 30.50p 27.00p 24.00p
Summarised consolidated balance sheetNon-current assets 89,920 87,513 90,930 74,038 82,122Cash and cash equivalents and treasury deposits (net) 130,948 107,927 103,767 117,547 190,357Net current assets 137,953 121,834 114,667 121,790 188,524Shareholders’ funds 220,682 200,998 189,930 184,977 251,606
1 Adjusted profit before tax is stated before amortisation of intangibles (excluding other software), share-based payments, adjustment to goodwill, the gain/loss on the fair value of forward foreign currency contracts and exceptional items. Adjusted basic earnings per share is also adjusted for the tax effect of these items.

FINANCIAL STATEMENTS 113
Corporate informationAVEVA Group plc is a public limited company incorporated and domiciled in the United Kingdom. The address of the registered office is given on page 123. AVEVA Group plc’s shares are publicly traded on the Official List of the London Stock Exchange.
Basis of preparationThe accounting policies which follow set out those policies which apply in preparing the financial statements for the year ended 31 March 2017. The Consolidated financial statements are presented in Pounds Sterling (£) and all values are rounded to the nearest thousand (£000) except when otherwise indicated.
The Group presents a non-GAAP performance measure on the face of the Consolidated income statement. The Directors believe that the ‘adjusted profit before tax’ and ‘adjusted diluted and basic earnings per share’ measures presented provide a reliable and consistent presentation of the underlying performance of the Group. Adjusted profit is not defined by IFRS and therefore may not be directly comparable with the ‘adjusted’ profit measures of other companies.
The business is managed and measured on a day-to-day basis using adjusted results. To arrive at adjusted results, certain adjustments are made for normalised and exceptional items that are individually important and which could, if included, distort the understanding of the performance for the year and the comparability between periods.
Normalised itemsThese are recurring items which management considers to have a distorting effect on the underlying results of the Group, and are non-cash items.
These items relate to amortisation of intangibles (excluding other software), share-based payment charges and fair value adjustments on financial derivatives, although other types of recurring items may arise. Recurring items are adjusted each year irrespective of materiality to ensure consistent treatment.
Exceptional itemsThese are items which are non-recurring and are identified by virtue of either their size or their nature. These items can include, but are not restricted to, the costs of significant restructuring exercises, fees associated with business combinations and costs incurred in integrating acquired companies.
In the prior year deferred revenue was presented as part of the line item ‘trade and other payables’; in the current year deferred revenue is presented as a separate line item on the balance sheet. The prior year item ‘trade and other payables’ therefore decreased by the amount of deferred revenue of £46,874,000.
Statement of complianceThe Consolidated financial statements of AVEVA Group plc and all its subsidiaries (the Group) have been prepared in accordance with IFRS, as adopted by the European Union, as they apply to the financial statements of the Group for the year ended 31 March 2017. The Group’s financial statements are also consistent with IFRSs as issued by the IASB.
The parent Company financial statements of AVEVA Group plc have been prepared under the FRS 101 reduced disclosure framework and are included on pages 107 to 111.
Basis of consolidationThe Consolidated financial statements comprise the financial statements of AVEVA Group plc and its subsidiaries as at 31 March each year. The financial statements of subsidiaries are prepared using existing GAAP for each country of operation. Adjustments are made to translate any differences that may exist between the respective local GAAP and IFRSs.
Inter-company balances and transactions, including unrealised profits arising from intra-Group transactions, have been eliminated in full.
Subsidiaries are consolidated from the date on which control is obtained by the Group and cease to be consolidated from the date on which control is transferred out of the Group.
On acquisition, assets and liabilities of subsidiaries are measured at their fair values at the date of acquisition, with any excess of the cost of acquisition over this value being capitalised as goodwill.
Adoption of new and revised standardsThe accounting policies adopted are consistent with those of the previous financial year. New standards and interpretations which came into force during the year did not have a significant impact on the Group’s financial statements.
STATEMENT OF GROUP ACCOUNTING POLICIES

AVEVA GROUP PLC ANNUAL REPORT AND ACCOUNTS 2017114
STATEMENT OF GROUP ACCOUNTING POLICIESCONTINUED
New standards and interpretations not yet effectiveThe IASB have issued the following standards (although in some cases not yet adopted by the EU) which are expected to have implications for the reporting of the financial position or performance of the Group or which will require additional disclosures in future financial years:
Effective for periods commencing after
IFRS 9 Financial InstrumentsIFRS 15 Revenue from Contracts with Customers 1 January 2018IFRS 16 Leases 1 January 2019IFRS 2 Amendments – Classification and Measurement of Share-based payment transactionsIAS 7 Amendments – Disclosure initiativeIAS 12 Amendments – Recognition of Deferred Tax Assets for unrealised lossesIFRS 10 and IAS 28 Amendments – Sales or Contribution of Assets between an Investor and its Associate or
Joint Venture1 January 2019
The Group intends to adopt these standards in the first accounting period after the effective date. The Directors do not expect that the adoption of the standards listed above will have a material impact on the financial statements of the Group in future periods, except as noted below:
IFRS 15 Revenue from Contracts with CustomersIFRS 15 prescribes a principles-based approach to accounting for revenue arising from contracts with customers, as well as additional reporting disclosures. The standard supersedes IAS 18 Revenue, IAS 11 Construction Contracts and several revenue-related interpretations.
IFRS 15 Revenue from Contracts with Customers outlines a single comprehensive five-step model to account for how revenue as goods or services are transferred to customers. Furthermore, it provides new guidance on whether revenue should be recognised at a point in time or over time and, more specifically, includes guidance on revenue from licensing arrangements.
IFRS 15 must be applied for periods beginning on or after 1 January 2018. It is endorsed by the EU (except for the Clarifications to IFRS 15 issued by the IASB in April 2016). The Company plans to adopt IFRS 15 in its consolidated financial statements for the year ending 31 March 2019, using the full retrospective approach.
The Company has completed an initial assessment of the potential impact of the adoption of IFRS 15 on its consolidated financial statements. The main aspects of the assessment are outlined below:
(i) Rendering of services – transfer of controlRevenue from sales of initial licences and the initial software delivery element of rental licences is currently recognised upon delivery. Delivery occurs when the customer has access to the intellectual property described in the contract. In some limited circumstances, under the current policy, AVEVA may recognise revenue from a licence agreement rateably over the contract period. This assessment is based on whether AVEVA can reliably estimate the maintenance and support element of the contract.
Under IFRS 15, revenue is recognised when a customer obtains control of the services. All distinct performance obligations relating to licences for software are transferred to the customer at a ‘point in time’. Therefore, under IFRS 15, all revenue from software licences which are distinct performance obligations will be recognised at a ‘point in time’ and not ‘over time’.
Based on the initial assessment, and in the absence of an uptake in AVEVA’s Cloud offerings, the Company does not anticipate material differences between the current policy and the requirement under IFRS 15 to recognise software licences at a ‘point in time’.
(ii) Stand-alone selling pricesRevenue from contracts with separately-identifiable components (multiple-element arrangements) are currently recognised based on the relative fair value of the components. Under IFRS 15, the total consideration of a customer arrangement will be allocated based on their relative stand-alone selling prices. Stand-alone selling prices are determined based on list prices (with standard discounts where appropriate), the adjusted market assessment approach and the residual approach.
The Company has performed an initial comparison of the fair value approach under IAS 18 and the stand-alone selling prices under IFRS 15. Based on the initial assessment, these amounts are broadly the same, therefore the Company at this stage does not anticipate material differences in the revenue recognition based on stand-alone selling prices.

FINANCIAL STATEMENTS 115
(iii) Providing extended payment terms to customersUnder IAS 18, where AVEVA provides a customer with extended payment terms, the revenue is deferred until the consideration is due in accordance with the contract. Under IFRS 15, all the contractual payments are included in the transaction price and allocated to the performance obligations at the start of the contract.
Based on the initial assessment, the Company has identified a potential impact on revenues for a limited number of contracts which, under IFRS 15, could be recognised in the Income Statement at an earlier point in time rather than deferring recognition until the stage payments are invoiced. The Company is currently performing a detailed analysis on a contract-by-contract basis to assess the related impact.
IFRS 16 LeasesIFRS 16 Leases (effective for the year ending 31 March 2020, not yet endorsed by the EU) will require all leases to be recognised on the balance sheet. Currently, IAS 17 Leases only requires leases categorised as finance leases to be recognised on the balance sheet, with leases categorised as operating leases not recognised. Lessees will recognise a ‘right of use’ asset and a corresponding liability on the balance sheet. The asset will be amortised over the length of the lease and the liability measured at amortised cost. It is currently not practicable to quantify the effect at the date of the publication of these financial statements. Existing operating lease commitments are set out in note 22.
Beyond the information above, it is not practicable to provide a reasonable estimate of the effect of these standards until a detailed review has been completed.
Significant accounting estimatesThe key assumptions concerning the future and other key sources of estimation uncertainty at the balance sheet date that have a significant risk of causing a material adjustment to the carrying amounts of assets and liabilities within the next financial year are discussed below:
Retirement benefit obligationsThe determination of the Group’s obligations and expense for defined benefit pensions is dependent on the selection, by the Board of Directors, of assumptions used by the pension scheme actuary in calculating these amounts. The assumptions applied, together with sensitivity analysis, are described in note 25 and include, amongst others, the discount rate, the inflation rate, rates of increase in salaries and mortality rates. While the Directors consider that the assumptions are appropriate, significant differences in the actual experience or significant changes in assumptions may materially affect the reported amount of the Group’s future pension obligations, actuarial gains and losses included in the Consolidated statement of comprehensive income in future years and the future staff costs. The net carrying amount of retirement benefit obligations at 31 March 2017 was £3,810,000 (2016 – £5,162,000). This year for the first time there is also a net surplus on the UK defined benefit scheme of £1,222,000 (2016 – nil).
Provision for impairment of receivablesThe Group makes provision for the impairment of receivables on a customer-specific basis. The determination of the appropriate level of provision involves an estimate of the potential risk of default or non-payment by the Group’s customers and management consider a number of factors, including the financial strength of the customers, the level of default that the Group has suffered in the past, the age of the receivable outstanding and the Group’s trading experience with that customer. The provision for impairment of receivables at 31 March 2017 was £6,054,000 (2016 – £5,879,000).
Revenue recognitionThe assessments and estimates used by the Group for revenue recognition could have a significant impact on the amount and timing of revenue recognised.
Revenue from sales of software licences when these are combined with the delivery of significant implementation or customisation services is recognised in line with the delivery of the services to the customer. This policy involves the assessment of which customer projects include significant customisation or implementation and also an assessment of the stage of completion of such projects.
The fair value estimate of the element of a customer rental fee attributable to the continuing right to use, and to customer support and maintenance, is reviewed periodically. On average, the element attributable to customer support and maintenance as a proportion of the initial software delivery is 17%. A 1% deviation in this percentage would not lead to a material change in revenue.

AVEVA GROUP PLC ANNUAL REPORT AND ACCOUNTS 2017116
STATEMENT OF GROUP ACCOUNTING POLICIESCONTINUED
Intangible assetsIFRS 3 requires the identification of acquired intangible assets as part of a business combination. The methods used to value such intangible assets require the use of estimates including forecast performance and customer attrition rates. Future results are impacted by the amortisation periods adopted and changes to the estimated useful lives would result in different effects on the income statement.
Goodwill is tested annually for impairment. Tests for impairment are based on discounted cash flows and assumptions (including discount rates, timing and growth prospects) which are inherently subjective. Further details about the assumptions used are set out in note 14.
RevenueThe Group generates its revenue principally from licensing the rights to use its software products directly to end users and to a lesser extent indirectly through resellers. Revenue is measured at fair value of the consideration received or receivable and represents the amounts receivable for goods and services provided in the ordinary course of business, net of discounts and sales taxes. It comprises initial licence fees, annual fees and rental licence fees, together with income from consultancy and other related services.
For each revenue stream, revenue is not recognised unless and until:
– a clear contractual arrangement can be evidenced; – delivery has been made in accordance with that contract; – if required, contractual acceptance criteria have been met; and – the fee has been agreed and collectability is probable. Where extended payment terms beyond 90 days exist, appropriate
approvals are obtained to ensure there is sufficient comfort that collectability is probable and the fee is determinable. If approvals are not obtained, revenue recognition is deferred until payment is due.
Initial/annual licence agreementsUsers are charged an initial licence fee upon installation for a set number of users together with an obligatory annual fee, which is charged every year. Annual fees consist of the continuing right to use and customer support and maintenance, which includes core product upgrades and enhancements, and remote support services. Users must continue to pay annual fees in order to maintain the right to use the software.
Initial licence fees are recognised once the above conditions have been met. Annual fees are recognised on a straight-line basis over the period of the contract, which is typically 12 months. If annual fees are charged at a discount, an amount is allocated out of the initial licence fee at fair market value based on the value established when annual fees are charged separately to customers.
Rental licence agreementsAs an alternative to the initial licence fee plus annual fee model, the Group also supplies its software under three different types of rental licence agreement.
Rental licence fees which are invoiced monthly and which are cancellable by the customer are recognised on a monthly basis. Other rental licence agreements are invoiced at the start of the contracted period, which is typically one year, are non-cancellable and consist of two separate components; the initial software delivery, and the continuing right to use with customer support and maintenance. Revenue in respect of the continuing right to use and customer support and maintenance element is valued at fair market value based on the value established when annual fees are charged separately to the customer. This component is recognised on a straight-line basis over the period of the contract. The residual amount representing the implied initial fee element is recognised upfront, provided all of the above criteria have been met. Where uncertainty exists and it is not possible to reliably determine the fair value of the customer support and maintenance element, all revenue is recognised on a straight-line basis over the period of the contract.
The Group also licenses its software using a token licensing model. Under this model, a ‘basket’ of tokens representing licences to use different software products over a defined period is granted, which enables the customer to draw these down as and when required. Where the customer commits in advance to a specified number of tokens over a defined period, a proportion of revenue is recognised with an appropriate element deferred for customer support and maintenance obligations, subject to the above recognition conditions being met. Where the customer is charged in arrears, revenue is recognised based on the actual number of tokens used.

FINANCIAL STATEMENTS 117
ServicesServices consist primarily of consultancy, implementation services and training and are performed under separate service arrangements. Revenue from these services is recognised as the services are performed and stage of completion is determined by reference to the costs incurred as a proportion of the total estimated costs of the service project. If a contract cannot be reliably estimated, revenue is recognised only to the extent that costs have been incurred. Provision is made as soon as a loss is foreseen.
If an arrangement includes both licence and service elements, licence fee revenue is recognised upon delivery of the software provided that services do not include significant customisation or modification of the base product and the payment terms for licences are not subject to acceptance criteria. In all other cases, revenues from both licence and service elements are recognised as services are performed.
Foreign currenciesThe functional and presentational currency of AVEVA Group plc is Pounds Sterling (£). Transactions in foreign currencies are initially recorded at the functional currency rate ruling at the date of the transaction. Monetary assets and liabilities denominated in foreign currencies are retranslated at the functional currency rate of exchange ruling at the balance sheet date. All differences are taken to the Consolidated income statement.
Non-monetary items that are measured in terms of historical cost in a foreign currency are translated using the exchange rate as at the date of the initial transaction.
The subsidiaries have a number of different functional currencies. As at the reporting date, the assets and liabilities of these overseas subsidiaries are translated into Pounds Sterling (£) at the rate of exchange ruling at the balance sheet date, and their income statements are translated at the weighted average exchange rates for the year. Exchange differences arising on the retranslation are taken directly to the Consolidated statement of comprehensive income.
GoodwillGoodwill on acquisitions is initially measured at cost, being the excess of the cost of the business combination over the acquirer’s interest in the net fair value of the identifiable assets, liabilities and contingent liabilities. Following initial recognition, goodwill is measured at cost less any accumulated impairment losses.
Where goodwill forms part of a cash-generating unit and part of the operation within that unit is disposed of, the goodwill associated with the operation disposed of is included in the carrying amount of the operation when determining the gain or loss on disposal of the operation. Goodwill disposed of in this circumstance is measured on the basis of the relative values of the operation disposed of and the portion of the cash-generating unit retained.
If the potential benefit of tax losses or other deferred tax assets does not satisfy the criteria in IFRS 3 for separate recognition when a business combination is initially accounted for but is subsequently realised, the Group recognises the deferred tax income in the Consolidated income statement.
Intangible assetsIntangible assets acquired separately are capitalised at cost and from a business acquisition are capitalised at fair value as at the date of acquisition. Following initial recognition, the cost model is applied to each class of intangible asset as set out below.
Expenditure on internally developed intangible assets, excluding development costs, is taken to the Consolidated income statement in the year in which it is incurred. Internal software development expenditure is recognised as an intangible asset only after its technical feasibility and commercial viability can be demonstrated.
Useful lives are also examined on an annual basis and adjustments, where applicable, are made on a prospective basis. Amortisation is calculated on a straight-line basis over the estimated useful economic lives of the asset, which are as follows:
Years
Developed technology 5–12Customer relationships 5–20Purchased brand 5Other software 3Purchased software rights 5–10
Research expenditureResearch expenditure is written off in the year of expenditure.
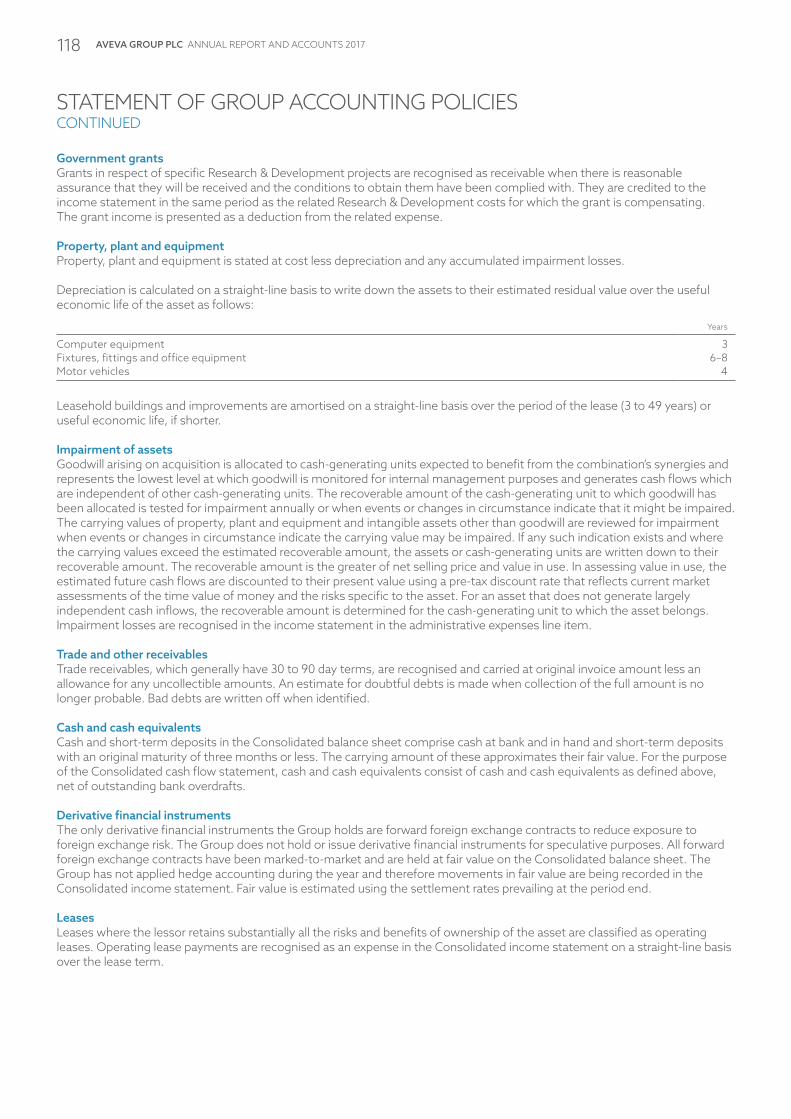
AVEVA GROUP PLC ANNUAL REPORT AND ACCOUNTS 2017118
STATEMENT OF GROUP ACCOUNTING POLICIESCONTINUED
Government grantsGrants in respect of specific Research & Development projects are recognised as receivable when there is reasonable assurance that they will be received and the conditions to obtain them have been complied with. They are credited to the income statement in the same period as the related Research & Development costs for which the grant is compensating. The grant income is presented as a deduction from the related expense.
Property, plant and equipmentProperty, plant and equipment is stated at cost less depreciation and any accumulated impairment losses.
Depreciation is calculated on a straight-line basis to write down the assets to their estimated residual value over the useful economic life of the asset as follows:
Years
Computer equipment 3Fixtures, fittings and office equipment 6–8Motor vehicles 4
Leasehold buildings and improvements are amortised on a straight-line basis over the period of the lease (3 to 49 years) or useful economic life, if shorter.
Impairment of assetsGoodwill arising on acquisition is allocated to cash-generating units expected to benefit from the combination’s synergies and represents the lowest level at which goodwill is monitored for internal management purposes and generates cash flows which are independent of other cash-generating units. The recoverable amount of the cash-generating unit to which goodwill has been allocated is tested for impairment annually or when events or changes in circumstance indicate that it might be impaired. The carrying values of property, plant and equipment and intangible assets other than goodwill are reviewed for impairment when events or changes in circumstance indicate the carrying value may be impaired. If any such indication exists and where the carrying values exceed the estimated recoverable amount, the assets or cash-generating units are written down to their recoverable amount. The recoverable amount is the greater of net selling price and value in use. In assessing value in use, the estimated future cash flows are discounted to their present value using a pre-tax discount rate that reflects current market assessments of the time value of money and the risks specific to the asset. For an asset that does not generate largely independent cash inflows, the recoverable amount is determined for the cash-generating unit to which the asset belongs. Impairment losses are recognised in the income statement in the administrative expenses line item.
Trade and other receivablesTrade receivables, which generally have 30 to 90 day terms, are recognised and carried at original invoice amount less an allowance for any uncollectible amounts. An estimate for doubtful debts is made when collection of the full amount is no longer probable. Bad debts are written off when identified.
Cash and cash equivalentsCash and short-term deposits in the Consolidated balance sheet comprise cash at bank and in hand and short-term deposits with an original maturity of three months or less. The carrying amount of these approximates their fair value. For the purpose of the Consolidated cash flow statement, cash and cash equivalents consist of cash and cash equivalents as defined above, net of outstanding bank overdrafts.
Derivative financial instrumentsThe only derivative financial instruments the Group holds are forward foreign exchange contracts to reduce exposure to foreign exchange risk. The Group does not hold or issue derivative financial instruments for speculative purposes. All forward foreign exchange contracts have been marked-to-market and are held at fair value on the Consolidated balance sheet. The Group has not applied hedge accounting during the year and therefore movements in fair value are being recorded in the Consolidated income statement. Fair value is estimated using the settlement rates prevailing at the period end.
LeasesLeases where the lessor retains substantially all the risks and benefits of ownership of the asset are classified as operating leases. Operating lease payments are recognised as an expense in the Consolidated income statement on a straight-line basis over the lease term.

FINANCIAL STATEMENTS 119
TaxationThe Group is subject to income tax in numerous jurisdictions. The Group recognises provisions for tax based on estimates of taxes that are likely to become due. Where the final tax outcome is different from the amounts that were initially recorded, such differences will impact the current income tax and deferred tax provisions in the period in which such determinations are made.
Deferred income tax is provided, using the liability method, on all temporary differences at the balance sheet date between the tax bases of assets and liabilities and their carrying amounts for financial reporting purposes.
Legislation has been enacted to allow UK companies to elect for the Research & Development Expenditure Credit (RDEC) on qualifying expenditure incurred since 1 April 2013, instead of the super-deduction rules. At the balance sheet date, management has concluded that the election will be made and therefore the RDEC is recorded as income included in profit before tax, netted against Research & Development expenses as the RDEC is of the nature of a government grant.
Deferred income tax liabilities are recognised for all taxable temporary differences:
– except where the deferred income tax liability arises from goodwill amortisation or the initial recognition of an asset or liability in a transaction that is not a business combination and, at the time of the transaction, affects neither the accounting profit nor taxable profit or loss; and
– in respect of taxable temporary differences associated with investments in subsidiaries, except where the timing of the reversal of the temporary differences can be controlled and it is probable that the temporary differences will not reverse in the foreseeable future.
Deferred income tax assets are recognised for all deductible temporary differences, carry-forward of unused tax assets and unused tax losses to the extent that it is probable that taxable profit will be available against which the deductible temporary differences, carry-forward of unused tax assets and unused tax losses can be utilised:
– except where the deferred income tax asset relating to the deductible temporary difference arises from the initial recognition of an asset or liability in a transaction that is not a business combination and, at the time of the transaction, affects neither the accounting profit nor taxable profit or loss; and
– in respect of deductible temporary differences associated with investments in subsidiaries, deferred tax assets are only recognised to the extent that it is probable that the temporary differences will reverse in the foreseeable future and taxable profit will be available against which the temporary differences can be utilised.
The carrying amount of deferred income tax assets is reviewed at each balance sheet date and reduced to the extent that it is no longer probable that sufficient taxable profit will be available to allow all or part of the deferred income tax asset to be utilised.
Deferred income tax assets and liabilities are measured at the tax rates that are expected to apply to the year when the asset is realised or the liability is settled, based on tax rates (and tax laws) that have been enacted or substantively enacted at the balance sheet date.
The income tax effects of items recorded in either other comprehensive income or equity are recognised in the Consolidated statement of comprehensive income or the Consolidated statement of changes in shareholders’ equity respectively. Otherwise, income tax is recognised in the Consolidated income statement.
Revenue, expenses and assets are recognised net of the amount of sales taxes except:
– where the sales tax incurred on a purchase of goods and services is not recoverable from the taxation authority, in which case the sales tax is recognised as part of the cost of acquisition of the asset or as part of the expense item as applicable; and
– receivables and payables are stated with the amount of sales taxes included.
The net amount of sales taxes recoverable from, or payable to, the taxation authority is included as part of receivables or payables in the Consolidated balance sheet.
Post retirement benefitsThe Group operates defined benefit pension schemes in the UK, Sweden and Germany. The Group also provides certain post employment benefits to its South Korean employees.
The UK defined benefit pension scheme, previously available to all UK employees, was closed to new applicants in 2002 and closed to future accrual from 31 March 2015. UK employees are now offered membership of a defined contribution scheme.

AVEVA GROUP PLC ANNUAL REPORT AND ACCOUNTS 2017120
STATEMENT OF GROUP ACCOUNTING POLICIESCONTINUED
The German unfunded defined benefit schemes are closed to new applicants and provide benefits to nine deferred members. These schemes were acquired as part of previous business combinations. No current employees participate in the schemes. Full provision has been made for the liability on the Consolidated balance sheet. The Group also operates a defined benefit pension scheme for one German employee.
The Group provides pension arrangements to its Swedish employees through an industry-wide defined benefit scheme. It is not possible to identify the share of the underlying assets and liabilities in the scheme which is attributable to the Group on a fair and reasonable basis. Therefore, the Group has applied the provisions in IAS 19 to account for the scheme as if it was a defined contribution scheme.
For the defined benefit schemes, the defined benefit obligation is calculated annually for each plan by qualified external actuaries using the projected unit credit method which attributes entitlement to benefits to the current period (to determine current service cost) and to the current and prior periods (to determine the present value of defined benefit obligation). The retirement benefit liability in the Consolidated balance sheet represents the present value of the defined benefit obligation (using a discount rate derived from a published index of AA rated corporate bonds) as reduced by the fair value of plan assets out of which the obligations are to be settled directly. Fair value is based on market price information and in the case of quoted securities is the published bid price. The value of a net pension benefit asset is restricted to the present value of any amount the Group expects to recover by way of refunds from the plan or reductions in the future contributions. The current service cost is recognised in the Consolidated income statement as an employee benefit expense. The net interest element of the defined benefit cost is calculated by applying the discount rate to the net defined benefit liability or asset.
Actuarial gains and losses arising from experience adjustments or changes in actuarial assumptions are credited or charged in the Consolidated statement of comprehensive income in the period in which they arise.
The Group also operates defined contribution pension schemes for a number of UK and non-UK employees. Contributions to defined contribution plans are charged to profit before tax as they become payable.
Share-based paymentsThe cost of equity-settled transactions with employees is measured by reference to the fair value at the date at which they are granted, further details of which are given in note 26.
The cost of equity-settled transactions is recognised, together with a corresponding increase in equity, over the period in which the performance conditions are fulfilled, ending on the date on which the relevant employees become fully entitled to the award (vesting date). The cumulative expense recognised for equity-settled transactions at each reporting date until the vesting date reflects the extent to which the vesting period has expired and the Group’s best estimate of the number of equity instruments that will ultimately vest.
No expense is recognised for awards that do not ultimately vest, except for awards where vesting is conditional upon a market condition, which are treated as vesting irrespective of whether or not the market condition is satisfied, provided that all other performance conditions are satisfied.
Where the terms of an equity-settled award are modified, as a minimum an expense is recognised as if the terms had not been modified. In addition, an expense is recognised for any increase in the value of the transaction as a result of the modification, as measured at the date of modification.
Where an equity-settled award is cancelled, it is treated as if it had vested on the date of cancellation and any expense not yet recognised for the award is recognised immediately. However, if a new award is substituted for the cancelled award, and designated as a replacement award on the date that it is granted, the cancelled and new awards are treated as if they were a modification of the original award, as described in the previous paragraph.
The dilutive effect of outstanding options is reflected as additional share dilution in the computation of earnings per share, subject to an estimate of whether performance conditions will be met.
Employee benefit trustThe Group has established an employee benefit trust (AVEVA Group Employee Benefit Trust 2008), which is a separately administered trust and is funded by loans from Group companies. The assets of the trust comprise shares in AVEVA Group plc and cash balances. The Group recognises assets and liabilities of the trust in the Consolidated financial statements and shares held by the trust are recorded at cost as a deduction from shareholders’ equity.
Consideration received for the sale of shares held by the trust is recognised in equity, with any difference between the proceeds from the sale and the original cost being taken to retained earnings.
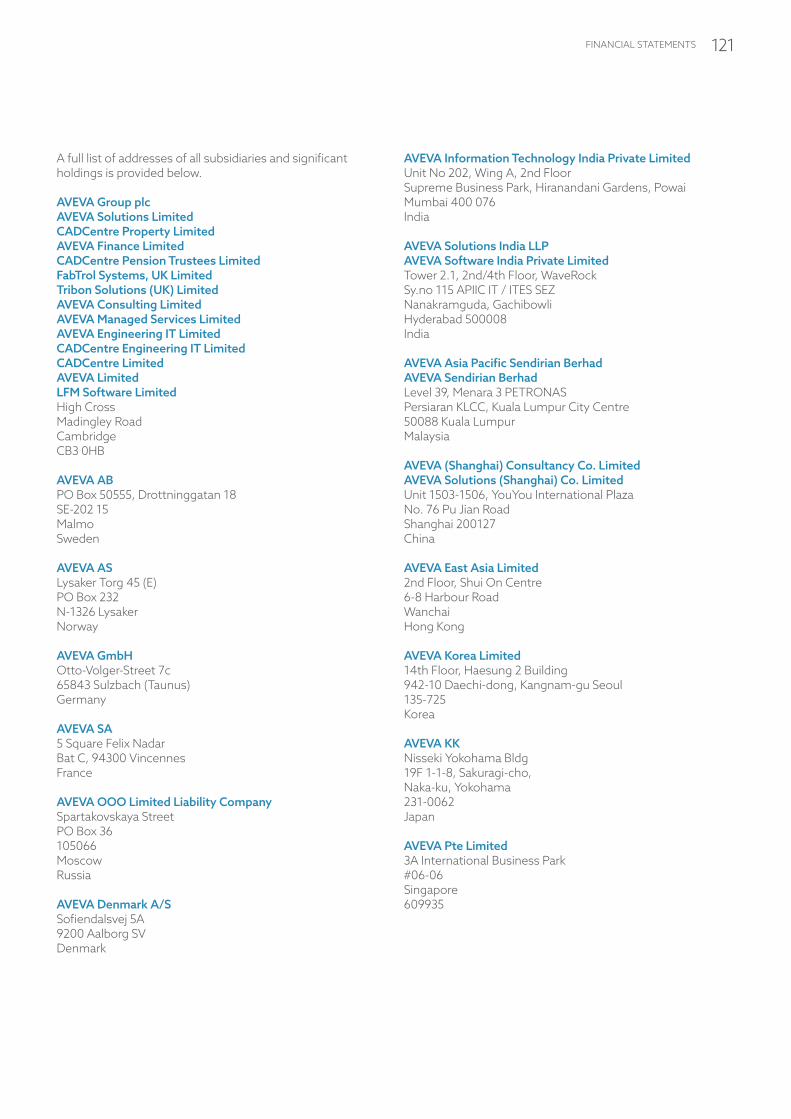
FINANCIAL STATEMENTS 121
A full list of addresses of all subsidiaries and significant holdings is provided below.
AVEVA Group plcAVEVA Solutions LimitedCADCentre Property LimitedAVEVA Finance LimitedCADCentre Pension Trustees LimitedFabTrol Systems, UK LimitedTribon Solutions (UK) LimitedAVEVA Consulting LimitedAVEVA Managed Services LimitedAVEVA Engineering IT LimitedCADCentre Engineering IT LimitedCADCentre LimitedAVEVA LimitedLFM Software LimitedHigh Cross Madingley RoadCambridgeCB3 0HB
AVEVA ABPO Box 50555, Drottninggatan 18SE-202 15MalmoSweden
AVEVA ASLysaker Torg 45 (E) PO Box 232N-1326 LysakerNorway
AVEVA GmbHOtto-Volger-Street 7c65843 Sulzbach (Taunus)Germany
AVEVA SA5 Square Felix Nadar Bat C, 94300 VincennesFrance
AVEVA OOO Limited Liability CompanySpartakovskaya StreetPO Box 36105066Moscow Russia
AVEVA Denmark A/SSofiendalsvej 5A9200 Aalborg SVDenmark
AVEVA Information Technology India Private LimitedUnit No 202, Wing A, 2nd FloorSupreme Business Park, Hiranandani Gardens, PowaiMumbai 400 076India
AVEVA Solutions India LLPAVEVA Software India Private LimitedTower 2.1, 2nd/4th Floor, WaveRockSy.no 115 APIIC IT / ITES SEZNanakramguda, Gachibowli Hyderabad 500008India
AVEVA Asia Pacific Sendirian BerhadAVEVA Sendirian BerhadLevel 39, Menara 3 PETRONASPersiaran KLCC, Kuala Lumpur City Centre50088 Kuala Lumpur Malaysia
AVEVA (Shanghai) Consultancy Co. LimitedAVEVA Solutions (Shanghai) Co. LimitedUnit 1503-1506, YouYou International PlazaNo. 76 Pu Jian RoadShanghai 200127China
AVEVA East Asia Limited2nd Floor, Shui On Centre6-8 Harbour RoadWanchaiHong Kong
AVEVA Korea Limited14th Floor, Haesung 2 Building942-10 Daechi-dong, Kangnam-gu Seoul135-725Korea
AVEVA KKNisseki Yokohama Bldg19F 1-1-8, Sakuragi-cho,Naka-ku, Yokohama231-0062Japan
AVEVA Pte Limited3A International Business Park#06-06 Singapore609935

AVEVA GROUP PLC ANNUAL REPORT AND ACCOUNTS 2017122
AVEVA Pty LimitedLevel 18333 Ann Street Brisbane, Queensland 4000Australia
AVEVA Colombia S.A.S.World Trade Center, Calle 100 No. 8ª - 49Torre B, PH, Oficina 22BogotaColombia
AVEVA Inc.10350 Richmond Avenue, Suite 400HoustonTX 77042USA
AVEVA Software and Services S.A de C.V.AVEVA de Mexico S. de R.L.AV. Insurgentes Sur No. 863, Piso 7Col. Napoles, Deleg Benito JuarezMexico CityD.F.03810Mexico
AVEVA do Brasil Informática LtdaRua Lauro Muller116 Sala 2202 Torre Rio SulBotaforgo – Rio de JaneiroCep: 22.290-160Brazil
AVEVA Chile S.p.A.Avendia Vitacura 2670Piso 15, Las CondesSantiago de Chile7550698Chile
8over8 LimitedNorthern Ireland Science Park Fort George, Bay RoadLondonderryBT48 7TG
8over8 Pty LimitedL29, 221 St Georges TerracePerth, WA 6000Australia
STATEMENT OF GROUP ACCOUNTING POLICIESCONTINUED

FINANCIAL STATEMENTS 123
COMPANY INFORMATION AND ADVISERS
DirectorsPhilip Aiken ChairmanPhilip Dayer Non-Executive Director and Senior Independent DirectorChristopher Humphrey Non-Executive DirectorJennifer Allerton Non-Executive DirectorRon Mobed Non-Executive DirectorJames Kidd Chief ExecutiveDavid Ward Chief Financial Officer
Company SecretaryClaire Denton
Registered OfficeHigh Cross Madingley RoadCambridge CB3 0HB
Registered Number2937296
AuditorErnst & Young LLPOne Cambridge Business ParkCambridge CB4 0WZ
BankersBarclays Bank plc9–11 St Andrews Street Cambridge CB2 3AA
SolicitorsAshurst LLPBroadwalk House 5 Appold Street London EC2A 2HA
Mills & Reeve LLPBotanic House 100 Hills Road Cambridge CB2 1PH
Stockbroker Numis Securities LimitedThe London Stock Exchange Building10 Paternoster Square London EC4M 7LT
RegistrarsCapita Registrars LimitedThe Registry 34 Beckenham Road Beckenham BR3 4TU
Financial PRFTI Consulting200 Aldersgate Street London EC1A 4HD

AVEVA GROUP PLC ANNUAL REPORT AND ACCOUNTS 2017124
NOTES


AN
NU
AL REPO
RT AN
D A
CC
OU
NTS 2017
Engineering and information management software for the Plant and Marine industries
WWW.AVEVA.COM
AVEVA Group plc High Cross, Madingley Road, Cambridge CB3 0HB, UK