Embed Size (px)
Citation preview
�
Fragile States
By Frances Stewart & Graham Brown
with additional case study materials by:
Graham Brown Corinne Caumartin
Alex Cobham Arnim Langer Ukoha Ukiwo
CRISE WORKING PAPER No. 51
January 2009��
Centre for Research on Inequality, Human Security and Ethnicity, CRISE Queen Elizabeth House, University of Oxford, Mansfield Rd, OX1 3TB, UK
Tel: +44 1865 281810; Fax: +44 1865 281801; http://www.crise.ox.ac.uk/
Fragile States
Abstract The aim of this paper is to help make the concept of 'fragile states' operational for development policy. Consequently, it proposes a working definition of 'fragile' states in the light of existing definitions, suggesting a way of operationalising the definition empirically. It considers how fragility, as defined, relates to other major development approaches to vulnerable societies, with particular emphasis on a human rights (HR) approach, while also discussing horizontal inequalities (HIs) and social exclusion (SE), the Millennium Development Goals (MDGs) and poverty reduction. The paper proposes a three-pronged definition of fragility – states may be fragile because they lack authority (authority failure), fail to provide services (service entitlement failure) or lack legitimacy (legitimacy failure). We argue that each captures different aspects of state vulnerability, and that they are related to each other causally. The paper points to some policy implications of the proposed approach to fragility. Throughout, it draws on six case studies – Indonesia, Nepal, Guatemala, Côte d'Ivoire, Nigeria and Sudan – which are presented at the end of the paper.
The Authors
Frances Stewart is the Director of the Centre for Research on Inequality, Human Security and Ethnicity (CRISE) and Professor of Development Economics at the Department of International Development, University of Oxford.
Graham Brown is Senior Lecturer, Economics and International Development, at the University of Bath.
Corinne Caumartin is Research Officer for Latin America at CRISE, University of Oxford.
Alex Cobham is Policy Manager at Christian Aid, but contributed this section while working as Supernumerary Fellow in Economics at St Anne's College, Oxford. (Views expressed are personal and should not be attributed to either organisation). Arnim Langer is a Research Officer for West Africa at CRISE, University of Oxford.
Ukoha Ukiwo is a Research Fellow at the Centre for Advanced Social Science (CASS), Port Harcourt, Nigeria, and a visiting scholar at the Institute of International Studies, University of California, Berkeley, USA.

Table of Contents
Fragile States.................................................................................................................. ii
Introduction .....................................................................................................................1
1 Definitional Issues: What constitutes a ‘fragile’ state? ..............................................1
2 The relationship between state fragility, human rights, HIs, Social Exclusion, poverty reduction (MDG) approaches ........................................................................................12
3 Causal links among the three dimensions of fragility and human rights failures, severe HIs, social exclusion and poverty reduction .......................................................16
4 Public policy towards fragility .................................................................................21
5 Conclusions ...........................................................................................................27
CASE STUDIES............................................................................................................29
6 Indonesia ...............................................................................................................29
7 Nepal .....................................................................................................................38
8 Guatemala .............................................................................................................49
9 Côte d’Ivoire...........................................................................................................49
10 Nigeria................................................................................................................71
11 Sudan.................................................................................................................83
Annex I: Methodology for statistical measures of progressive service failure.................92
Annex II: Social exclusion and horizontal inequalities as a cause of fragility – a preliminary statistical analysis .......................................................................................96
Annex III: Basic Data on State Fragility and Human Rights Compliance in Case Study Countries ......................................................................................................................98
References..................................................................................................................102

List of Tables
Table 1: Comparison of existing donor definitions of fragility ...........................................5 Table 2: Characteristics of 'war' and 'violence' in CSP dataset ........................................5 Table 3: State fragility in authority, 2004 .........................................................................6 Table 4: Equivalent thresholds for absolute service entitlements failure ..........................7 Table 5: State fragility in service entitlements, 2000........................................................8 Table 6: State fragility in legitimacy, 2004 .......................................................................9 Table 7: Provisional list of fragile states ..........................................................................9 Table 8: Kendall’s tau-b correlations between dimensions of fragility ............................11 Table 9: Conceptual relationship between approaches to fragility .................................16 Table 10: Literacy rates in Guatemala by indigenous status, 2000................................19 Table 11: Nepal - ethnic and caste demography ...........................................................38 Table 12: Nepal - Horizontal inequalities by major caste and ethnic group across four
dimensions (as ratio to national mean), 1996.........................................................44 Table 13: Nepal - Regional inequality index (GCov), 2001 ............................................47 Table 14: Guatemala - structure of the economy, 1994 and 2004 (% of GDP) ..............49 Table 15: Guatemala - Key social and economic indicators, 1998 – 2003.....................51 Table 16: Guatemala – selected socio-economic indicators, 1989 – 2005 ....................51 Table 17: Guatemala – selected indicators of social exclusion, 2000 ............................55 Table 18: Guatemala – Sources of aid, 2001 ................................................................57 Table 19: Côte d’Ivoire – Economic growth, 1960 – 2000..............................................63 Table 20: Côte d’Ivoire – North-South socio-economic disparities, 1995.......................67 Table 21: Côte d’Ivoire – Ethnic representation in government, 1980 – 2003................68 Table 22: Sudan – Basic development statistics with regional comparisons..................85 Table 23: Sudan – Regional representation in governments (% of ministerial positions),
1954-1999..............................................................................................................88 Table 24: Sudan – Relative per capita fiscal stance by region, 1996-2000 averages ....90 Table 25: Regression analysis: Political discrimination and service delivery, 2000........96 Table 26: Average level of political discrimination by types of state failure, with t-test
significance results.................................................................................................97 Table 27: Episodes of Armed Conflict in Case Study Countries, 1946 – 2005...............98 Table 28: Dates of Ratification of or Accession to Major Human Rights Covenants and
Conventions in Case Study Countries ..................................................................101

List of Figures
Figure 1: Schematic representation of links between dimensions of fragility and types of Human Right ..........................................................................................................17
Figure 2: Indonesia - Child mortality performance, 1965-2005 ......................................33 Figure 3: Indonesia - Landholding among agriculturalists in the outer islands by region
of birth, 1990..........................................................................................................36 Figure 4: Nepal - Conflict fatalities, 2000-2006..............................................................40 Figure 5: Nepal - Aid disbursement and debt as a proportion of GDP, 1975-2001.........41 Figure 6: Nepal - Progressive service delivery in child mortality rates, 1965-2005.........42 Figure 7: Nepal - Caste/ethnic representation in national parliament, 1959-1999..........45 Figure 8: Nepal - Representation of caste/ethnic groups in the recruitment of gazetted
third class officers, 1984/5-2001/2..........................................................................46 Figure 9: Nepal - Regional disparities in income and human development, 2001..........47 Figure 10: Nepal - Regional income inequality, 1971-2004 ...........................................48 Figure 11: Côte d’Ivoire – Progressive Realisation of Service Entitlements in Child
Mortality Reduction, 1965-2005..............................................................................64 Figure 12: Côte d’Ivoire – Primary school enrolment across regions, 1998 ...................67 Figure 13: Nigeria – Regional origins of federal cabinet members, 1960 – 2004 ...........79 Figure 14: Nigeria – household socio-economic characteristics by North-South division,
2003.......................................................................................................................80 Figure 15: Primary enrolment rate by level of GDP per capita.......................................92 Figure 16: Child Mortality Rates ....................................................................................93 Figure 17: Computation of predicted levels of service delivery across three dimensions
...............................................................................................................................94 Figure 18: Distribution of service delivery measures .....................................................95 Figure 19: Progressive Realisation of Child Mortality Service Entitlement in Case Study
Countries, 1965 – 2005..........................................................................................99 Figure 20: Democracy and Autocracy (Polity IV Indices) in Case Study Countries ......100

1
Fragile States By Frances Stewart and Graham Brown1
Introduction The aim of this paper is to help make the concept of ‘fragile states’ operational for development policy. Consequently, it proposes a working definition of ‘fragile’ states in the light of existing definitions, suggesting a way of operationalising the definition empirically. It considers how fragility, as defined, relates to other major development approaches to vulnerable societies, with particular emphasis on a human rights (HR) approach, while also discussing horizontal inequalities (HIs) and social exclusion (SE), the Millennium Development Goals (MDGs) and poverty reduction. The paper proposes a three-pronged definition of fragility, and argues that while each captures different aspects of vulnerability, they are also each related causally. The paper points to some policy implications of the proposed approach to fragility.
Section 1 of the paper is devoted to definitional issues. Section 2 reviews the relation between state fragility, human rights, social exclusion, and poverty reduction. Section 3 explores causal links between the three aspects of fragility, and HR violations, social exclusion and poverty. Section 4 considers some implications for public policy aimed at reducing fragility. Section 5 discusses both facilitating conditions and obstacles to the effective adoption of such policies. Section 6 concludes. Throughout, we draw on the six country case studies which are presented at the end of the paper.
1 Definitional issues: What constitutes a ‘fragile’ state? We should start by saying that there are generally no uniquely correct definitions of concepts drawn from common parlance and then used in a rather different context, often with an underlying political motive. This applies both to ‘state failure’ and to ‘fragile states’. We are not looking for correct definitions, but rather exploring possible definitions in order to arrive at ones which seem to make sense and be operational, and not too far removed from the way that the aid community is using them.
We should also note that countries may not like to be called ‘fragile’, especially if they feel that they are managing their development as best as they can in difficult circumstances, so while the concept points to certain vulnerabilities and consequently to the need for special treatment by the international community, it might be desirable to use a different and less provocative term, and indeed to be less categorical about situations which are uncertain and where any categorisation involves a good deal of judgement.2
1.1 Existing definitions of fragility
It is helpful to begin by looking at existing definitions within the aid community. The UK’s Department for International Development (DfID) and the Organisation for Economic
1 We are very grateful for very helpful comments on an earlier draft from DfID and from Arnim Langer; and to Emma Samman for her assistance. 2 A Jakarta Post opinion column criticised the use of ‘failed’ or ‘failing’ state to describe Timor Leste, noting that ‘Timor Leste’s political complexities cannot be reduced to simple slogans.’ It points out that ‘nation building is an ongoing complex process’. (Minh Nguyen, ‘Is Timor Lests a failed state?’, Jakarta Post, June 23rd 2006). Similarly, DAC’s exercise in ‘Piloting the Principles for Good International Engagement’ concluded that ‘The concept of a ‘fragile state’ emerged as problematic for various reasons in almost all cases. In some the rationale for classifying the country as fragile was questioned. The concept was also seen as generalising across very different situations and problems and as not providing a definition that could be accepted by both donors and government. In some cases the terminology was seen as sensitive and causing suspicion from the government side and potentially impacting negatively on the relationship with government’. (OECD 2006:6).

CRISE Working Paper No. 51
2
Cooperation and Development (OECD) have similar definitions of fragile states, which focus on service entitlements. DfID defines fragile states as occurring where ‘the government cannot or will not deliver core functions to the majority of its people, including the poor’, where core functions include service entitlements, justice and security (DFID 2005). In as much, DfID explicitly notes that it does not restrict its definition of fragility to conflict or immediate post-conflict countries. Non-conflict countries which are failing to ensure service entitlements constitute fragile states under DfID’s definition (e.g. Guyana); similarly, countries in conflict but which are nonetheless providing an acceptable level of service entitlements to the majority of the population would not constitute fragile states under DfID’s definition – this might apply to many countries with ongoing, but contained, separatist struggles such as Thailand. The OECD definition is similar, but emphasises the ‘lack of political commitment and insufficient capacity to develop and implement pro-poor policies’ (Morcos 2005, quoted in Prest et al. 2005: 5).
Canada’s Country Indicators for Foreign Policy project (CIFP) definition of fragile states extends beyond service entitlements to include those states that ‘lack the functional authority to provide basic security within their borders, the institutional capacity to provide basic social needs for their populations, and/or the political legitimacy to effectively represent their citizens at home or abroad’ (CIFP 2006). The USAID approach is similar, but differentiates between states ‘in crisis’ and those that are ‘vulnerable’. ‘USAID uses the term fragile states to refer generally to a broad range of failed, failing and recovering states…..the strategy distinguishes between fragile states that are vulnerable from those that are already in crisis’. Vulnerable states are defined as ‘unable or unwilling to adequately assure the provision of security and basic services to significant portions of their populations and where the legitimacy of the government is in question’; while states in ‘crisis’ are defined as ones where the ‘central government does not exert significant control over its own territory or is unable or unwilling to assure the provision of vital services to significant parts of its territory where legitimacy of the government is weak or non-existent, and where violent conflict is a reality or a great risk’ (USAID 2005: 1).
Finally, the World Bank identifies fragile states with ‘low-income countries under stress’ (LICUS). ‘LICUS are fragile states characterised by a debilitating combination of weak governance, policies and institutions, indicated by ranking among the lowest (<3) on the country policies and institutional performance assessment (CPIA).’ The category includes around 30 countries of which three quarters ‘are affected by on-going armed conflicts.’ (World Bank 2006). Such states ‘share a common fragility, in two particular respects: weak state policies and institutions: undermining the countries’ capacity to deliver services to their citizens, control corruption, or provide for sufficient voice and accountability’; and are at ‘risk of conflict and political instability: between 1992 and 2002, 21 out of 26 countries with intermediate or worse civil conflicts were also LICUS’. (World Bank 2005a: 1).
1.2 Proposed definition of ‘fragility’ and ‘failure’
From this brief review, we can see that there are considerable areas of overlap in the current use of the term ‘fragile states’ within the development community, but also differences of breadth and emphasis. For this paper, we propose taking a broad approach that would encompass all the definitions given thus far. Our proposed definition comes closest to the CIFP definition.3 We define fragility as applying to a
3 While the CIFP includes capacity, authority and legitimacy, we include service entitlements, authority and legitimacy. Service entitlements failures may occur because of lack of capacity or they may occur because of lack of will to deliver services.
CRISE Working Paper No. 51
3
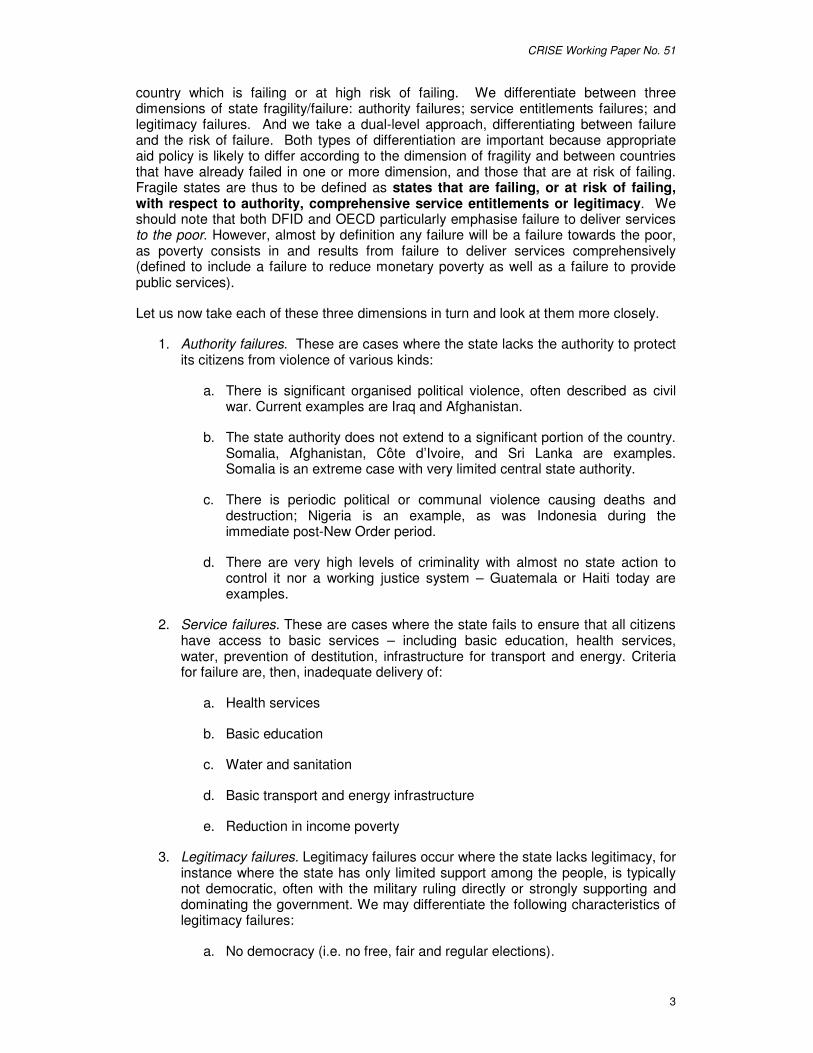
country which is failing or at high risk of failing. We differentiate between three dimensions of state fragility/failure: authority failures; service entitlements failures; and legitimacy failures. And we take a dual-level approach, differentiating between failure and the risk of failure. Both types of differentiation are important because appropriate aid policy is likely to differ according to the dimension of fragility and between countries that have already failed in one or more dimension, and those that are at risk of failing. Fragile states are thus to be defined as states that are failing, or at risk of failing, with respect to authority, comprehensive service entitlements or legitimacy. We should note that both DFID and OECD particularly emphasise failure to deliver services to the poor. However, almost by definition any failure will be a failure towards the poor, as poverty consists in and results from failure to deliver services comprehensively (defined to include a failure to reduce monetary poverty as well as a failure to provide public services).
Let us now take each of these three dimensions in turn and look at them more closely.
1. Authority failures. These are cases where the state lacks the authority to protect its citizens from violence of various kinds:
a. There is significant organised political violence, often described as civil war. Current examples are Iraq and Afghanistan.
b. The state authority does not extend to a significant portion of the country. Somalia, Afghanistan, Côte d’Ivoire, and Sri Lanka are examples. Somalia is an extreme case with very limited central state authority.
c. There is periodic political or communal violence causing deaths and destruction; Nigeria is an example, as was Indonesia during the immediate post-New Order period.
d. There are very high levels of criminality with almost no state action to control it nor a working justice system – Guatemala or Haiti today are examples.
2. Service failures. These are cases where the state fails to ensure that all citizens have access to basic services – including basic education, health services, water, prevention of destitution, infrastructure for transport and energy. Criteria for failure are, then, inadequate delivery of:
a. Health services
b. Basic education
c. Water and sanitation
d. Basic transport and energy infrastructure
e. Reduction in income poverty
3. Legitimacy failures. Legitimacy failures occur where the state lacks legitimacy, for instance where the state has only limited support among the people, is typically not democratic, often with the military ruling directly or strongly supporting and dominating the government. We may differentiate the following characteristics of legitimacy failures:
a. No democracy (i.e. no free, fair and regular elections).
CRISE Working Paper No. 51
4
b. A strong governmental role for the military
c. Acquisition of power by force
d. Suppression of opposition
e. Control of media
f. Exclusion of significant groups of the population from power.
g. Absence of civil and political liberties, with arbitrary arrest, absence of free speech etc
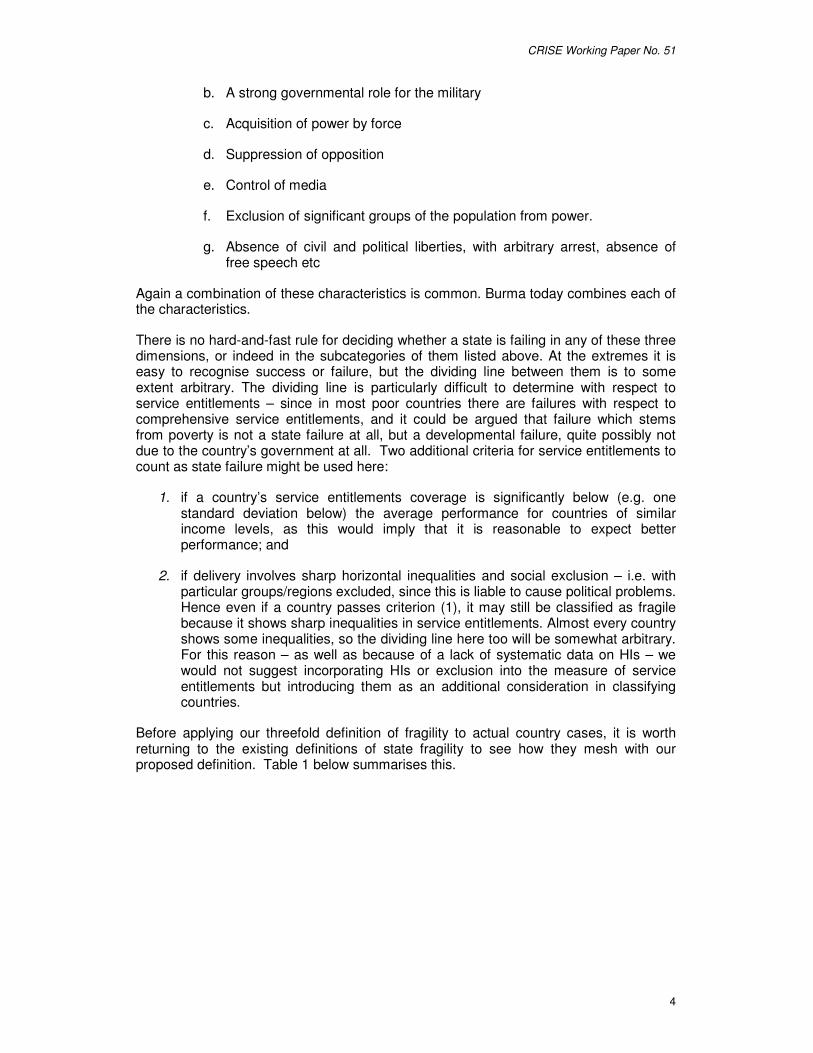
Again a combination of these characteristics is common. Burma today combines each of the characteristics.
There is no hard-and-fast rule for deciding whether a state is failing in any of these three dimensions, or indeed in the subcategories of them listed above. At the extremes it is easy to recognise success or failure, but the dividing line between them is to some extent arbitrary. The dividing line is particularly difficult to determine with respect to service entitlements – since in most poor countries there are failures with respect to comprehensive service entitlements, and it could be argued that failure which stems from poverty is not a state failure at all, but a developmental failure, quite possibly not due to the country’s government at all. Two additional criteria for service entitlements to count as state failure might be used here:
1. if a country’s service entitlements coverage is significantly below (e.g. one standard deviation below) the average performance for countries of similar income levels, as this would imply that it is reasonable to expect better performance; and
2. if delivery involves sharp horizontal inequalities and social exclusion – i.e. with particular groups/regions excluded, since this is liable to cause political problems. Hence even if a country passes criterion (1), it may still be classified as fragile because it shows sharp inequalities in service entitlements. Almost every country shows some inequalities, so the dividing line here too will be somewhat arbitrary. For this reason – as well as because of a lack of systematic data on HIs – we would not suggest incorporating HIs or exclusion into the measure of service entitlements but introducing them as an additional consideration in classifying countries.
Before applying our threefold definition of fragility to actual country cases, it is worth returning to the existing definitions of state fragility to see how they mesh with our proposed definition. Table 1 below summarises this.

CRISE Working Paper No. 51
5
Table 1: Comparison of existing donor definitions of fragility A state of actual failure or high risk of failure with respect to:
Proposed definition Authority Service entitlements Legitimacy
DFID Instrumental for service entitlements
Prime emphasis Related to emphasis on ‘justice’
OECD Instrumental for service entitlements
Prime emphasis Not mentioned
USAID Intrinsic aspect Intrinsic aspect Intrinsic aspect
CIDA Intrinsic aspect Emphasises institutional capacity
Intrinsic aspect
World Bank Emphasis on high conflict risk
Emphasis on institutional capacity
Includes voice and accountability
1.3 Countries defined as fragile using the three-fold criteria
Inevitably, determining the precise nature and extent of state fragility requires in-depth country knowledge and analysis. For tracking global developments and flagging countries at risk of fragility, however, it is useful to have broad indices of state failure across the three dimensions. In this section, we present some preliminary analysis on how such indices might apply using readily available data. On each dimension we identify indicators of countries that have ‘Failed’ and countries ‘At Risk of Failure’. Furthermore, across two of the dimensions – service entitlements failure and legitimacy failure – we suggest two alternative means of determining failure: absolute failure and progressive failure. As discussed below, this relates directly to a human rights perspective on state fragility. Absolute failure refers to absolute thresholds which determine whether a country is failing or at risk of failing; progressive failure refers to thresholds determined relative to a country’s level of income. It is important to note here that we do not intend the analysis to be in any way a definitive categorisation of existing states, but rather as an example of how such an analysis might be employed.
1.3.1 Authority failures
We take a good indicator of authority failure to be the extent of physical conflict in the country. A number of detailed global datasets are available from which to derive such an index. We use here the Major Episodes of Political Violence dataset from the Centre for Systemic Peace (Marshall 2006). This dataset distinguishes between three types of conflict – ethnic, civil, and international – and two levels of conflict – violence and war. Violence is here defined as ‘the use of instrumental violence without necessarily exclusive goals’; war is defined as ‘violence between distinct, exclusive groups with the intent to impose a unilateral result to the contention’. Although this definition of types of violence does not include casualty rates or duration, episodes of violence are typically shorter and with lower annual casualty rates than wars, as Table 2 demonstrates.
Table 2: Characteristics of 'war' and 'violence' in CSP dataset
Average duration (years)
Average annual casualty rate (thousands)
Violence 3.38 12.5 War 8.53 47.4
For our purposes, the level of violence is more important than the type of conflict, with

CRISE Working Paper No. 51
6
the CSP definition of ‘war’ associated with state failure, and their definition of ‘violence’ with risk of failure. I.e., we suggest the following criteria:
• Failure: Ethnic or civil war in the current period;
• Risk of failure: Ethnic or civil violence in the current or previous two years; or, ethnic or civil war in the previous four years (but not the current year)
Table 3 shows the states classified as fragile under this definition using data from 2005 (our case study countries are marked in bold, see Appendix). It is worth noting that in some of the states classified here as failed, the area of the country in which state authority is weak or lacking is geographically restricted, and the state may have strong authority in the rest of the country. Russia is an example here, where lack of state authority is only really an issue in Chechnya; elsewhere the state is largely unchallenged for territorial control. Similarly, poor state authority in the Philippines and India is mostly restricted to Mindanao and Kashmir, respectively. In operationalising state authority failures further it may be desirable to distinguish the geographical extent of state authority failure in individual countries, but, as will be seen below, we contend that even where state authority failure is geographically restricted it can have implications for other dimensions of state fragility.
Table 3: State fragility in authority, 2004 FAILED AT RISK
Afghanistan Angola Algeria Central African Republic Burundi Colombia Congo, Dem. Rep. Congo, Rep. Cote d'Ivoire Ethiopia India Indonesia Iraq Liberia Israel Nigeria Myanmar Rwanda Nepal Sierra Leone Philippines Solomon Islands Russian Federation Sri Lanka Somalia Sudan Thailand Uganda
Source: calculated from Marshall (2006)
1.3.2 Service entitlements failure
The distinction between absolute and progressive thresholds is important in service entitlements, because following the principle of progressive realisation, the level of services which would count as causing failure could be argued to be lower in a poor than a rich state. The problem with using a progressive measure of service entitlements, however, is that states can in effect move out of failure simply by reducing their GDP, and there are minimum levels of service that can be expected even in poor states. Hence, it is worth also taking into account an absolute threshold. Annex I describes the derivation of the absolute and progressive thresholds of service entitlements failure in detail. The progressive measure of service entitlements uses an adjusted average error term from separate regressions of GDP on selected indicators of service entitlements, specifically provision of improved water source, child mortality rates, and primary enrolment rates. Countries falling one standard deviation below the overall average are deemed ‘at risk’ of service entitlements failure; countries falling two standard deviations
CRISE Working Paper No. 51
7
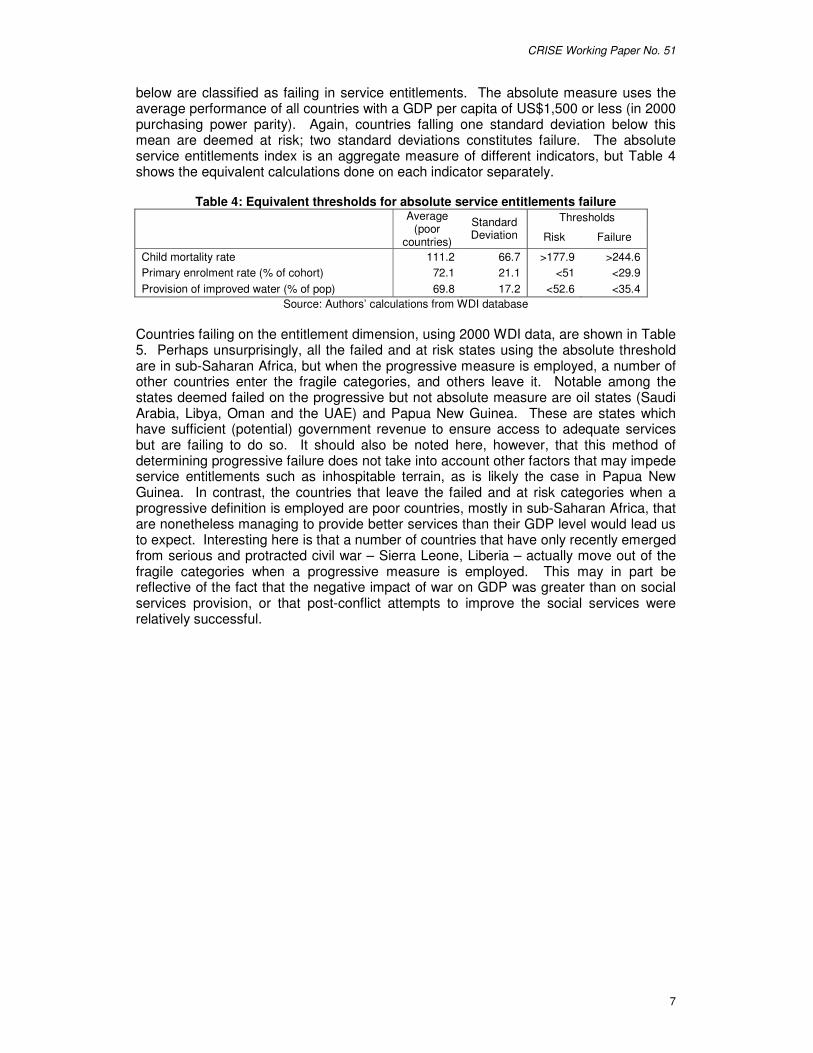
below are classified as failing in service entitlements. The absolute measure uses the average performance of all countries with a GDP per capita of US$1,500 or less (in 2000 purchasing power parity). Again, countries falling one standard deviation below this mean are deemed at risk; two standard deviations constitutes failure. The absolute service entitlements index is an aggregate measure of different indicators, but Table 4 shows the equivalent calculations done on each indicator separately.
Table 4: Equivalent thresholds for absolute service entitlements failure Thresholds
Average (poor
countries)
Standard Deviation Risk Failure
Child mortality rate 111.2 66.7 >177.9 >244.6 Primary enrolment rate (% of cohort) 72.1 21.1 <51 <29.9 Provision of improved water (% of pop) 69.8 17.2 <52.6 <35.4
Source: Authors’ calculations from WDI database Countries failing on the entitlement dimension, using 2000 WDI data, are shown in Table 5. Perhaps unsurprisingly, all the failed and at risk states using the absolute threshold are in sub-Saharan Africa, but when the progressive measure is employed, a number of other countries enter the fragile categories, and others leave it. Notable among the states deemed failed on the progressive but not absolute measure are oil states (Saudi Arabia, Libya, Oman and the UAE) and Papua New Guinea. These are states which have sufficient (potential) government revenue to ensure access to adequate services but are failing to do so. It should also be noted here, however, that this method of determining progressive failure does not take into account other factors that may impede service entitlements such as inhospitable terrain, as is likely the case in Papua New Guinea. In contrast, the countries that leave the failed and at risk categories when a progressive definition is employed are poor countries, mostly in sub-Saharan Africa, that are nonetheless managing to provide better services than their GDP level would lead us to expect. Interesting here is that a number of countries that have only recently emerged from serious and protracted civil war – Sierra Leone, Liberia – actually move out of the fragile categories when a progressive measure is employed. This may in part be reflective of the fact that the negative impact of war on GDP was greater than on social services provision, or that post-conflict attempts to improve the social services were relatively successful.

CRISE Working Paper No. 51
8
Table 5: State fragility in service entitlements, 2000 ABSOLUTE PROGRESSIVE
FAILED AT RISK FAILED AT RISK Angola Benin Saudi Arabia Oman Burkina Faso Cambodia Burkina Faso Congo, Dem. Rep. Burundi Cameroon Mali Libya Central African Rep. Cote d'Ivoire Ethiopia United Arab Emirates Chad Djibouti Sierra Leone Zambia Congo, Dem. Rep. Ethiopia Niger Cote d'Ivoire Equatorial Guinea Gambia, The Equatorial Guinea Cameroon Guinea-Bissau Guinea Angola Guinea-Bissau Liberia Madagascar Mozambique Mali Malawi Papua New Guinea Niger Mozambique Swaziland Nigeria Senegal Nigeria Rwanda Swaziland Djibouti Sierra Leone Tanzania Chad Togo Congo, Rep. Uganda Guinea Zambia
Source: Authors’ calculations from World Development Indicators
1.3.3 Legitimate governance failures
To provide a broad index of legitimate governance failures, we use the Polity IV dataset of democratic governance. As the discussion above and the case studies show (see, e.g. Indonesia), the level of democracy is not necessarily the sole determinant of regime legitimacy. But in this exercise, we take this to be a reasonable proxy of overall legitimacy. The Polity IV dataset scores each country (each year) on two indices from 1 to 10: level of democracy and level of autocracy. The overall polity score is determined by subtracting autocracy from democracy, providing a range of minus 10 (least democratic) to plus 10 (most democratic). Annex II describes how the respective thresholds are determined in more detail. Table 6 shows the countries that fail and are at risk of failing on the legitimacy dimension. We also estimate an absolute and relative standard on the grounds that more democratic regimes are generally associated with rising incomes. Legitimacy failures using the absolute measure are broadly spread geographically, with only the Americas unrepresented. In contrast, with the exception of Swaziland, the progressive failures are all oil-rich Middle Eastern states. This is because while democratisation generally tends to be associated with higher levels of GDP per capita, many Middle Eastern countries buck this trend and thus stand out as those with a level of democratisation furthest removed from their income level.
CRISE Working Paper No. 51
9
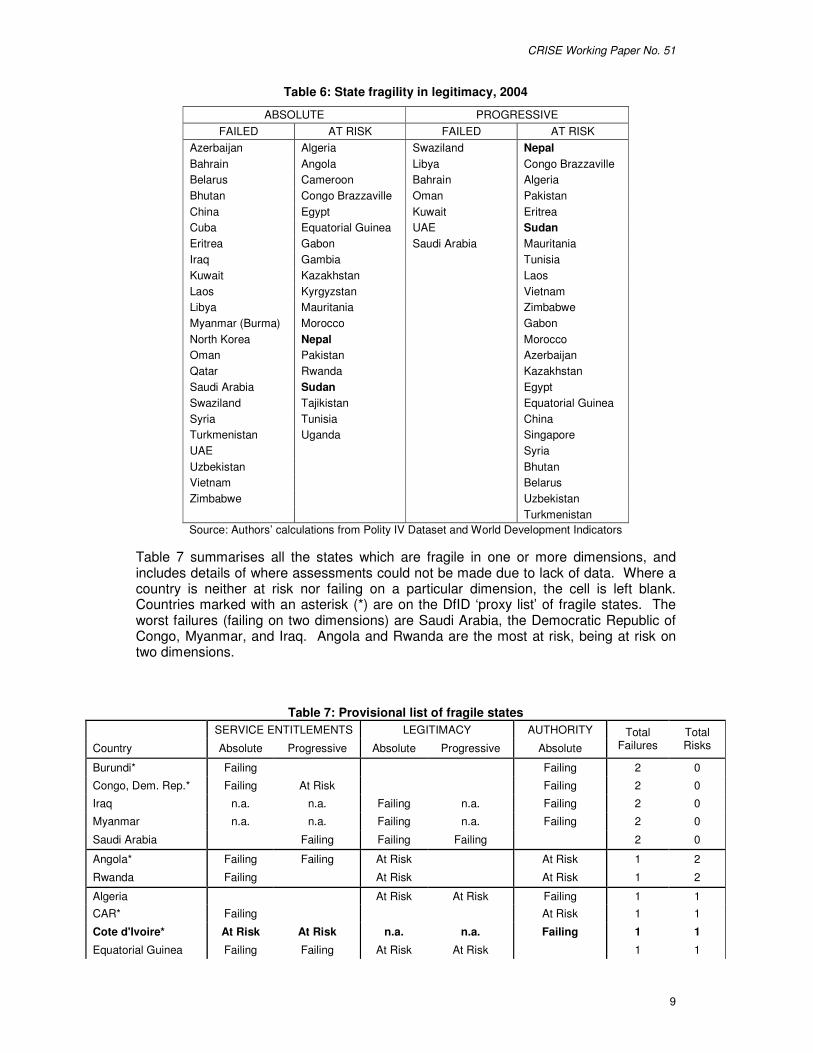
Table 6: State fragility in legitimacy, 2004
ABSOLUTE PROGRESSIVE FAILED AT RISK FAILED AT RISK
Azerbaijan Algeria Swaziland Nepal Bahrain Angola Libya Congo Brazzaville Belarus Cameroon Bahrain Algeria Bhutan Congo Brazzaville Oman Pakistan China Egypt Kuwait Eritrea Cuba Equatorial Guinea UAE Sudan Eritrea Gabon Saudi Arabia Mauritania Iraq Gambia Tunisia Kuwait Kazakhstan Laos Laos Kyrgyzstan Vietnam Libya Mauritania Zimbabwe Myanmar (Burma) Morocco Gabon North Korea Nepal Morocco Oman Pakistan Azerbaijan Qatar Rwanda Kazakhstan Saudi Arabia Sudan Egypt Swaziland Tajikistan Equatorial Guinea Syria Tunisia China Turkmenistan Uganda Singapore UAE Syria Uzbekistan Bhutan Vietnam Belarus Zimbabwe Uzbekistan Turkmenistan Source: Authors’ calculations from Polity IV Dataset and World Development Indicators
Table 7 summarises all the states which are fragile in one or more dimensions, and includes details of where assessments could not be made due to lack of data. Where a country is neither at risk nor failing on a particular dimension, the cell is left blank. Countries marked with an asterisk (*) are on the DfID ‘proxy list’ of fragile states. The worst failures (failing on two dimensions) are Saudi Arabia, the Democratic Republic of Congo, Myanmar, and Iraq. Angola and Rwanda are the most at risk, being at risk on two dimensions.
Table 7: Provisional list of fragile states SERVICE ENTITLEMENTS LEGITIMACY AUTHORITY
Country Absolute Progressive Absolute Progressive Absolute Total
Failures Total Risks
Burundi* Failing Failing 2 0
Congo, Dem. Rep.* Failing At Risk Failing 2 0
Iraq n.a. n.a. Failing n.a. Failing 2 0
Myanmar n.a. n.a. Failing n.a. Failing 2 0
Saudi Arabia Failing Failing Failing 2 0
Angola* Failing Failing At Risk At Risk 1 2
Rwanda Failing At Risk At Risk 1 2
Algeria At Risk At Risk Failing 1 1 CAR* Failing At Risk 1 1
Cote d'Ivoire* At Risk At Risk n.a. n.a. Failing 1 1
Equatorial Guinea Failing Failing At Risk At Risk 1 1

CRISE Working Paper No. 51
10
SERVICE ENTITLEMENTS LEGITIMACY AUTHORITY
Country Absolute Progressive Absolute Progressive Absolute Total
Failures Total Risks
Ethiopia* At Risk Failing At Risk 1 1
Liberia* Failing At Risk 1 1
Libya At Risk Failing Failing 1 1
Nepal* At Risk At Risk Failing 1 1
Nigeria* Failing At Risk At Risk 1 1
Oman At Risk Failing Failing 1 1
Sierra Leone* Failing Failing At Risk 1 1
Swaziland At Risk At Risk Failing Failing 1 1
UAE At Risk Failing Failing 1 1
Afghanistan* n.a. n.a. n.a. n.a. Failing 1 0 Azerbaijan* Failing At Risk 1 0
Bahrain Failing Failing 1 0
Belarus Failing At Risk 1 0
Bhutan Failing At Risk 1 0
Burkina Faso Failing Failing 1 0
Chad* Failing At Risk 1 0
China Failing At Risk 1 0
Cuba n.a. n.a. Failing n.a. 1 0
Eritrea* Failing At Risk 1 0
Guinea-Bissau* Failing At Risk 1 0
India Failing 1 0
Israel Failing 1 0
Korea, North n.a. n.a. Failing n.a. 1 0
Kuwait Failing Failing 1 0
Laos* Failing At Risk 1 0
Mali* Failing Failing 1 0
Niger* Failing Failing 1 0
Philippines Failing 1 0
Qatar Failing 1 0
Russia Failing 1 0
Somalia* n.a. n.a. n.a. Failing 1 0
Syria Failing At Risk 1 0
Turkmenistan Failing At Risk 1 0
Uzbekistan* Failing At Risk 1 0
Vietnam Failing At Risk 1 0
Zimbabwe* Failing At Risk 1 0
Congo, Rep.* At Risk At Risk At Risk At Risk 0 3
Uganda At Risk At Risk At Risk 0 3
Cameroon* At Risk At Risk At Risk 0 2 Gambia* At Risk At Risk 0 2
Sudan* At Risk At Risk At Risk 0 2
Benin At Risk 0 1
Cambodia* At Risk 0 1
Colombia At Risk 0 1
Djibouti* At Risk At Risk 0 1
Egypt At Risk At Risk 0 1

CRISE Working Paper No. 51
11
SERVICE ENTITLEMENTS LEGITIMACY AUTHORITY
Country Absolute Progressive Absolute Progressive Absolute Total
Failures Total Risks
Gabon At Risk At Risk 0 1 Guinea* At Risk At Risk 0 1
Indonesia* At Risk 0 1
Kazakhstan At Risk At Risk 0 1
Kyrgyzstan At Risk 0 1
Madagascar At Risk 0 1
Malawi At Risk 0 1
Mauritania At Risk At Risk 0 1
Morocco At Risk At Risk 0 1
Mozambique At Risk At Risk 0 1
Pakistan At Risk At Risk 0 1
Papua NG* At Risk 0 1
Senegal At Risk 0 1
Singapore At Risk 0 1
Solomon Is.* n.a. n.a. At Risk 0 1
Sri Lanka At Risk 0 1
Tajikistan* At Risk 0 1
Tanzania At Risk 0 1
Thailand At Risk 0 1
Togo* At Risk 0 1
Tunisia At Risk At Risk 0 1
Zambia At Risk At Risk 0 1
Correlation of the three dimensions across countries (Table 8) shows that though significantly related the correlation is quite low, indicating that each dimension captures a different aspect of performance and consequently it is important to analyse each of the three. Service entitlements failures, both in the absolute and progressive measure, are positively correlated with authority failures, suggesting that the relationship here is indeed strong, although it is again worth pointing out that the direction of causality needs to be explored. Interesting is the significant negative correlation between legitimacy failure, both absolute and progressive, with both authority failures and absolute service entitlements failure. The negative link with authority failure may be symptomatic of the well-known ‘inverted-U’ relationship between democracy and conflict, which suggests conflict is less likely in authoritarian states and consolidated democracies, with transition democracies the most vulnerable (e.g. Hegre et al. 2001).
Table 8: Kendall’s tau-b correlations between dimensions of fragility
Authority Service entitlements (abs.)
Service entitlements (prog.)
Legitimacy (abs.) Legitimacy
(prog.)
Authority -
Service (absolute) tau-b significance
0.266 0.089
* -
Service (progressive) tau-b significance
0.146 0.086
* 0.616 0.079
* -
Legitimacy (absolute) tau-b significance
-0.011 0.078
* -0.145 0.066
* 0.057 0.084
* -
Legitimacy (progressive) tau-b significance
-0.109 0.069
* -0.199 0.058
* 0.088 0.090
* 0.767 0.051
* -

CRISE Working Paper No. 51
12
2 The relationship between state fragility, human rights, HIs, Social Exclusion, poverty reduction (MDG) approaches
This and the following section consider the relationship between the ‘fragile states’ approach and human rights (HR), HI and social exclusion approaches to development, as well as poverty reduction and the MDG goals. In this section, we consider the relationships from a definitional perspective, adopting the definition of fragile states put forward in Section 1, while Section 3 considers the relationships from a causal perspective. For clarity, we separate the discussion of each approach.
2.1 Human rights and fragility
An HR approach to development has been widely advocated, and is increasingly accepted as the explicit basis for development policies by a number of agencies, including SIDA, UNICEF, DFID and the EU, in some cases as the basis for all development activities (notably SIDA) and in others, for part of their programmes, e.g. DFID and the EU (see e.g. Stewart 1989; Frankovits and Earle 2001; Piron and O’Neil 2005; Uvin 2004; OECD 2006).
Unique elements [of the HR approach to development] include using recommendations of international human rights bodies and mechanisms, assessing the capacity of rights-holders to claim their rights and of duty-bearers to fulfil their obligations, and developing strategies to build these capacities. Essential elements include, for example, recognising people as key actors in their own development (rather than as passive recipients of commodities and services), and valuing participation, empowerment and bottom-up practices’ (OECD 2006: 61).
An HR approach to development has two important facets: on the one hand, a supply effort, persuading government to realise their obligations with respect to both economic, social and cultural rights (ESC) and civil and political rights (CP), and using aid to help fill major gaps with respect to ESC; and, on the other, a demand effort, helping people realise their rights, by providing assistance of various kinds for citizen empowerment (including assistance in becoming a recognised citizen, for example in a DFID project in Bolivia (OECD 2006: 61)).
One important implication of a rights approach is that national and international law should be used as effective instruments or levers, with people encouraged and supported to use the law to enforce their rights. In practice, however, this is difficult to do unless the rights are incorporated in national legislation. Where they (or some) are embodied in the Constitution (as, for example, in India, South Africa, and EU countries with respect to rights incorporated in the European Convention on Human Rights), the legal approach to enforcement has proved helpful (UNDP 2000). Many rights-based aid projects assist people in exercising their legal rights.
Internationally recognised human rights are those included in the 1948 Universal Declaration of Human Rights, developed in 1966 by two covenants which came into force in 1976, the International Covenant of Civil and Political Rights and the International Covenant of Economic, Social and Cultural Rights. The first of the covenants covers civil and political rights (CP), including the right to life, liberty and security of the person, to freedom from torture, from arbitrary arrest and detention, freedom of thought, of religion, of opinion and expression, of assembly and association, and the right to participate in the government where the person is a citizen. The second covers economic, social and cultural rights (ESC) and includes among others, the right to an adequate standard of living for health and well-being, including food, shelter and medical care; and the right to education. Other human rights instruments include the 1965 International Convention on the Elimination of All Forms of Racial Discrimination,

CRISE Working Paper No. 51
13
the 1979 Convention on The Elimination of All Forms of Discrimination Against Women, the 1984 Convention against Torture and Other Cruel, Inhuman or Degrading Treatment or Punishment and the 1989 Convention on the Rights of the Child. The Human Rights Covenants and Conventions have been officially endorsed by the vast majority of countries (UNDP 2000). States who have agreed to particular HR instruments are under an obligation to fulfil them.
Important basic features of such HRs are (a) that they are universal and pertain to every person in virtue of being human; (b) there is an explicit rejection of discrimination of any type4; and (c) they are often argued to be indivisible – each person has a right to every right in the Covenants and Conventions, and there is no trade-off among rights. Rights imply duties. One of the aims of an HR approach is to identify and help enforce such duties. An HR approach has also been associated with a ‘do no harm’ principle in relation to external interventions (OECD 2006), though this could also extend to other approaches.
It is recognised, however, that realisation of the ESC (sometimes described as positive freedoms) takes time and resources, and, therefore, they cannot be realised immediately in poor countries, unlike the CP (sometimes called negative freedoms). Moreover, the Covenants do not define precisely what is meant by many of the ESC (i.e. how generous the rights are). Consequently, there is some ambiguity about interpretation, and also about the timing of the obligation to realise the positive rights. Hence the principle of ‘progressive realisation’ was introduced, meaning that for low-income countries immediate realisation of all positive rights would not be realistic or expected, but a steady move towards realisation in a way that was commensurate with the resources available, would be.
How does the HR approach fit with the approach to fragile states being adopted here? It is clear that substantial failures to meet HRs will qualify a country as a fragile state according to our definition. However, there is a difference between the two approaches: a relatively small failure on HRs (e.g. with respect to one element only, or in a minor way only) would not be sufficient to classify a country as fragile – if it were, then almost every country in the world would qualify as fragile. This is important. We would not wish to describe most countries in the world as ‘fragile’; yet most countries in the world do fail on HRs in some respect. For example, the US and the UK both currently are failing on some aspects of the civil liberties set of HRs. Among developing countries, Vietnam and India each fail with respect to some HRs. Yet none of these countries can realistically or usefully be defined as fragile. It is important to be able to show that a country is failing with respect to some aspects of HR, and argue that corrective action is needed, without making a wholesale (and sometimes clearly unjustified) claim of fragility. Put in another way, the HR approach to development has useful applications almost universally, while the fragile states approach points (also usefully) to the problems of a particularly vulnerable subset of states. A further difference is that a variety of policy approaches might be adopted to reduce fragility effectively without necessarily explicitly using an HR framework.
The progressive realisation of rights is clearly very similar to the progressive definitions of service and legitimacy failures suggested above. In operationalising the human rights perspective for development agenda, OHCHR notes the important distinction between ‘respecting’, ‘protecting’ and ‘fulfilling’ human rights. Particularly with respect to ESC rights, progressive realisation may entail state policies that respect and protect certain rights without fulfilling them, at least in the short to medium term. Treatment of the basic CP rights is more mandatory, i.e. even with a pragmatic approach, states are obliged
4 ‘All are equal before the law and are entitled without any discrimination to equal protection of the law. All are entitled to equal protection against any discrimination’ (Article 7 of the Universal Declaration of Human Rights).

CRISE Working Paper No. 51
14
fully to respect and fulfil the right to life, liberty, the security of the person, and freedom from torture, irrespective of their level of socio-economic development.
Thus, our distinction between absolute and progressive thresholds for (the risk of) state failure across the service and legitimate governance dimensions correspond to the distinction between those human rights which the state can be expected to fulfil whatever its level of socio-economic development (absolute measures) and those which are pragmatically to be obtained progressively (progressive measures). Authority failures are clearly related to some core CP human rights, including the right to life and security of the person. All CP rights are clearly embodied in the governance legitimacy dimension since critical and defining aspects of legitimacy include realisation of CP rights.
A state that is the (complicit) aggressor in internal repression is clearly culpable of governance legitimacy failure by failing to respect the basic Civil and Political Human Rights of its citizens; similarly, states responding to an insurgency may also override CP and lose legitimacy through excessive use of force, arbitrary detention of suspected rebels or the use of torture. High levels of crime raise similar issues. In the first place, very high levels of criminality which significantly endanger citizens’ personal security constitute an authority failure and a failure to respect citizens’ right to security of their persons; on the other hand, the reactions of authorities to this situation – including sometimes police ‘death squads’ – constitute a clear infraction of human rights and thus, again, implicate the state itself in legitimacy failures. As Cavallaro and Ould Mouhamedou (2005: 127) note, such problems are particularly liable to occur in states that have undergone recent democratic transition, where state policymakers ‘are charged with the difficult task of assuring citizen safety while not allowing police and other security forces to revert to abusive practices characteristic of the pre-transitional society’.
2.2 HIs and fragility
Horizontal inequalities are inequalities between culturally defined groups. They are multidimensional, including socio-economic, political and cultural status dimensions. They may be due to long-run historic disadvantage, often with a colonial basis, as well as contemporary political and economic discrimination (Stewart 2008). HIs are often associated with social exclusion. While the precise definition of SE varies, there is broad agreement that it consists of ‘Exclusion from social, political and economic institutions resulting from a complex and dynamic set of processes and relationships that prevent individuals or groups from accessing resources, participating in society and asserting their rights’ (Beall & Piron 2004). HIs, in contrast, describe a situation of group inequality, without reference to how this came about, and may occur without complete exclusion.5
How does this relate to our definition of fragile states? A state can clearly be fragile without HIs being present since failure on any of the three criteria does not require HIs. For example, one can imagine a fragile state which fails to ensure comprehensive service entitlements, but not in any particularly exclusionary way; similarly with regard to authority. Somalia is a case, where government functions have become minimal in terms of service entitlements and authority, yet one where the effects are general and not particularly exclusionary in terms of one group or another. Similarly, states can lack legitimacy as defined (e.g. be non-democratic and with no free media and poor performance on human rights) without there being pronounced exclusion – Cuba is an
5 Stewart (2004) discusses the relationship between HIs and SE.

CRISE Working Paper No. 51
15
example and Pinochet’s Chile was another. Therefore, neither HIs nor SE necessarily follow from fragility.
More complex is the relationship the other way round. A state with a significant degree of HIs would be counted as fragile with respect to both service entitlements and legitimacy according to our definition; on service entitlements because it fails in comprehensive delivery and does so in an exclusionary way,6 and on legitimacy, because exclusion of a major group is a cause of lack of legitimacy. One difficult issue is how big the deprived group needs to be, as well as how sharp the inequality needs to be, to make a state fragile. A state which discriminates against a small fraction of its population (say less than 1 per cent) would not generally be described as fragile; but one that excludes 30 per cent or more would be. But the exact dividing line is a matter of judgement. Moreover, as noted in the definitional discussion, the extent and nature of inequalities (or exclusion) which leads one to classify a state as fragile is also a matter of judgement. HIs may also be associated with conflict and loss of authority, but this is due to a causal relationship between HIs and conflict not part of the definition of fragility.
Côte d’Ivoire between 2003 and 2007 was an example of systematic HIs not only in social and economic terms (a case of the North being relatively deprived), but also in political dimensions; moreover, it lacked authority (with a large portion of the country not under government control); it also lacked legitimacy because of its political exclusion, use of the military and postponement of elections. Hence it definitely fell into the fragile classification on all three dimensions. Ghana, in contrast, has not been failing, or in danger of failing, on most criteria. It has experienced legitimate governance, being a reasonably inclusive democracy with free media, etc. The govenrment also has had authority. And its service entitlements coverage has been relatively good, given its low income. Although service entitlements, including poverty reduction outcomes, have been extremely poor in Northern Ghana relative to the South, this does not seem to have been intentional and consequently, although a cause of concern, this is not sufficient to classify Ghana as fragile; while Ghana shows serious socio-economic HIs, it has been inclusive politically and culturally (Langer 2007).
Moreover, HIs do not necessarily lead to failures in the authority dimension. A strong state may sustain its authority in the face of social, economic and political inequalities, so long as the deprived groups are not too large. For example, severe and multidimensional inequalities suffered by the Roma people in Central Europe have not led to failures with respect to authority. Of course, HIs can lead to loss of authority – and indeed to civil war – there is a causal connection which we shall explore in Section 3 of this paper.
2.3 Poverty reduction, the MDGs and state fragility
Poverty reduction and the MDGs are, of course, the most universally accepted development strategy at present (for shorthand, termed the MDGs approach). Although, this approach has much in common with the other approaches discussed, there’s more blue water conceptually between it and the definition of fragile states than in the other cases. Clearly, the MDGs have little to say about either authority or legitimacy in a conceptual way (though there may be causal connections to be discussed in the next section). There is direct relevance to the service dimension; success on the MDGs would generally be expected to be associated with success in service access and conversely, failure on the MDGs would imply failure on service access. Nonetheless, it should be noted that success on the MDGs can be achieved while still leaving many in poverty, and where the distribution of poverty remains significantly unequal across groups or regions, it may be associated with failure and fragility on the service dimension
6 Here we depart from the DFID definition of fragility which refers to service entitlements failure to ‘the majority of the people’; majority delivery is possible with social exclusion.
CRISE Working Paper No. 51
16
as well. The cases of Sudan and Nepal are examples. Both made significant progress on the MDGs. Yet in both cases, such progress was skewed – in favour of the North in Sudan and the hill regions in Nepal – and this failure was a source of fragility in both countries. By the same token, MDG success can be associated with HR failure in the presence of severe discrimination.
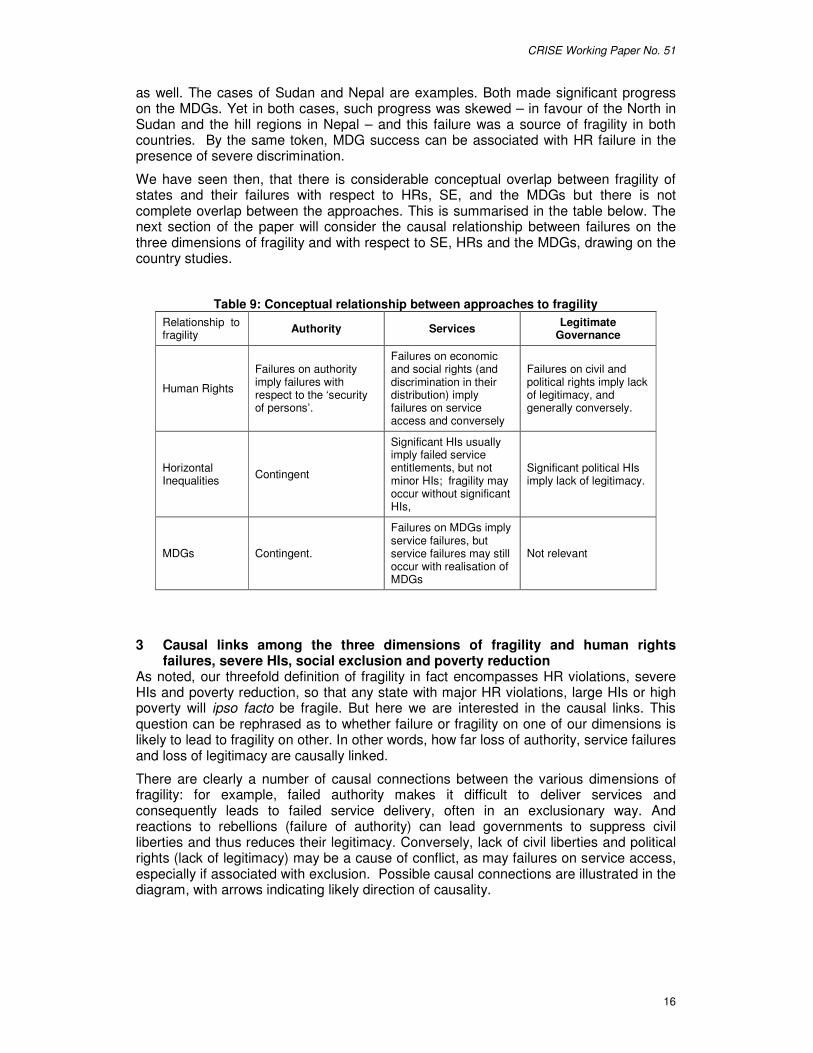
We have seen then, that there is considerable conceptual overlap between fragility of states and their failures with respect to HRs, SE, and the MDGs but there is not complete overlap between the approaches. This is summarised in the table below. The next section of the paper will consider the causal relationship between failures on the three dimensions of fragility and with respect to SE, HRs and the MDGs, drawing on the country studies.
Table 9: Conceptual relationship between approaches to fragility Relationship to fragility Authority Services Legitimate
Governance
Human Rights
Failures on authority imply failures with respect to the ‘security of persons’.
Failures on economic and social rights (and discrimination in their distribution) imply failures on service access and conversely
Failures on civil and political rights imply lack of legitimacy, and generally conversely.
Horizontal Inequalities Contingent
Significant HIs usually imply failed service entitlements, but not minor HIs; fragility may occur without significant HIs,
Significant political HIs imply lack of legitimacy.
MDGs Contingent.
Failures on MDGs imply service failures, but service failures may still occur with realisation of MDGs
Not relevant
3 Causal links among the three dimensions of fragility and human rights failures, severe HIs, social exclusion and poverty reduction
As noted, our threefold definition of fragility in fact encompasses HR violations, severe HIs and poverty reduction, so that any state with major HR violations, large HIs or high poverty will ipso facto be fragile. But here we are interested in the causal links. This question can be rephrased as to whether failure or fragility on one of our dimensions is likely to lead to fragility on other. In other words, how far loss of authority, service failures and loss of legitimacy are causally linked.
There are clearly a number of causal connections between the various dimensions of fragility: for example, failed authority makes it difficult to deliver services and consequently leads to failed service delivery, often in an exclusionary way. And reactions to rebellions (failure of authority) can lead governments to suppress civil liberties and thus reduces their legitimacy. Conversely, lack of civil liberties and political rights (lack of legitimacy) may be a cause of conflict, as may failures on service access, especially if associated with exclusion. Possible causal connections are illustrated in the diagram, with arrows indicating likely direction of causality.

CRISE Working Paper No. 51
17
Figure 1: Schematic representation of links between dimensions of fragility and types of
Human Right
The correlations in country fragility on the three dimensions (Table 5 above) provides supporting evidence that the three dimensions are connected, though these correlations do not indicate the direction of causality, which indeed may go both ways, as illustrated below. More general evidence drawn from the literature and our own case studies provides further evidence on the nature and direction of causality
The literature on the causes of conflict does not show any watertight causality; but it does show associations which indicate that the chances of conflict are higher in some situations than others. Our limited number of case studies, of course, cannot prove causality, but do illustrate connections in helpful ways.
Conflict leads to underdevelopment: i.e. conflict (authority failure) is associated with failures on Economic and Social Rights [A1]. A conclusive research finding is that conflict is associated with worse development – i.e. lower or negative growth, more poverty, generally worse social services and worse human indicators (Stewart and Fitzgerald 2001; Stewart 2003; Collier et al. 2003; Collier and Chauvet 2006). There are countries which managed to grow during conflict, however: e.g. Guatemala in its long war and Sudan, Uganda over the past twenty years, despite continued conflict in the North, and Sri Lanka. But these situations are uncommon, and econometric evidence suggests an annual loss of per capita income of over 2 per cent p.a. from the ‘average’ conflict.7 Conflict also leads to lower expenditure on the social sectors as incomes and tax revenue fall and expenditure on the military rises. On average, it is estimated that military expenditure rises from 2.8 per cent of GDP (average for developing countries in peace time, 1995) to 5.0 per cent of GDP (Collier et al. 2003). Moreover the conflict causes trained manpower to flee, undermines transport links and is often associated with direct destruction of facilities.
The process of war is also likely to enhance HIs, as the government discriminates against opposition groups. Though no general evidence has been collected on this for data reasons, there is plentiful case study evidence. For example, while Sudan managed to improve its human and economic indicators in the North during the conflict, those in
7 E.g. Hoeffler & Reynal-Querol, 2003; precise estimates of costs are not reliable – estimates of the costs of the Nicaraguan war have varied from 77 per cent of 1980 GDP (Fitzgerald, 1987) to between 17 and 26 per cent of GDP (di Addario, 1997).
AUTHORITY – SECURITY OF
PERSONS
SERVICE ENTITLEMENTS – ECONOMIC AND SOCIAL RIGHTS
B2 A1
A2
LEGITIMACY – CIVIL AND
POLITICAL (AND CULTURAL)
RIGHTS
B1
C2
C1

CRISE Working Paper No. 51
18
the South worsened. We find a similar process of growing exclusion in Côte d’Ivoire, Guatemala, Indonesia and Sri Lanka. However, in some cases deliberate action is taken to correct aspects of exclusion, recognising the role it plays in provoking conflict. This occurred in Nepal after 2003; and the history of the peace process in Northern Ireland cannot be understood without appreciating the major and effective measures to reduce socio-economic HIs that occurred there from the late 1970s.
Conflict is associated with a loss of civil and political rights (authority failures are associated with legitimacy failures) [B1]. Conflict is also associated with loss of civil and political rights – indeed, sometimes with massive human rights violations by the state, as in the case of Guatemala, Indonesia and Sudan. At a general level, Thoms and Ron show an association between conflict and a measure of the average repression of personal integrity rights on the basis of 159 countries’ experience from 1990 to 2003 (Thoms and Ron 2006).
In general, then, loss of authority weakens both the other two dimensions of fragility – service entitlements and legitimacy.
The relationships on the reverse causality are more complex.
Suppression of civil and political rights (loss of legitimacy) can cause authority loss and conflict, but not invariably [B2]. As far as civil and political rights are concerned, suppression of such rights is a common reaction to rebellion which is sometimes exercised pre-emptively. This pre-emption – if conducted harshly – can itself provoke counter-violence and thus lead to escalation. This seems to be the story in Guatemala and East Timor where what started as a relatively peaceful protest turned into violent opposition in reaction to the violence of the state.
Suppression of freedom for peaceful opposition to the government is also an element accounting for the violent opposition to the state among some ethnic groups in Burma. Conversely, it is plausible to argue that the reason Bolivia has escaped the violence of neighbouring states is that protests have been permitted, and concessions made. Yet there are many examples in history of strong states which have suppressed political rights over a long period and not experienced major violent opposition, perhaps because of their military strength. Haiti under the Duvalier regime is an example. This was associated with ‘indiscriminate repression, martial law, curfews, censorship and autocratic rule’ (Thoms and Ron,2006: 51). Yet there was no sustained rebellion.
The complex relationship between democracy and authority. It is tempting to conclude from this that promotion of democracy will reduce conflict. Yet this is not in accordance with the evidence. It is true that the states least prone to conflict are established democracies. But the most conflict-prone are recent democracies or countries in transition to democracy (Reynal-Querol, 2002; Stewart and O‘Sullivan 1999; Snyder 2000; Thoms and Ron 2006). This is partly because in such countries there is no tradition of peaceful transfer of power via the ballot box, nor of the military being neutral towards political outcomes. Consequently, governments may pervert the electoral process and losing groups sometimes then take to violence. An example is presented by Haiti: Aristide’s re-election in November 2000 was widely considered to be fraudulent, leading to demands for its annulment. Eventually in 2004, this led to violent insurgency which was only prevented from escalating by international forces. The story of Uganda under Obote followed this pattern, as have recent events in Côte d’Ivoire and Kenya. Another reason is that majoritarian democracy can be associated with permanent political exclusion of minorities who then see no possibility of political participation without violence. This danger can, however, be overcome by inclusive political processes – yet these are by no means an automatic consequence of democracy but need to be added as an explicit requirement, which is at odds with the way Western countries interpret democracy. In contrast, some very authoritarian regimes have

CRISE Working Paper No. 51
19
sustained peace and development – as shown by China, South Korea and Taiwan’s earlier history, and Chile under Pinochet.
Failures on ESC (service entitlements failures, including poverty and horizontal inequalities), as a cause of conflict [A2].
Low incomes: There is a clear empirical association between low average income per capita in a country and the probability of conflict – this partly reflects the ways in which conflict reduces income. But econometric evidence suggests that low-income countries have a higher propensity to fall into conflict, even allowing for this (Auvinen and Nafziger 1999; Elbadawi and Sambanis 2002). This could be due to several factors: one is that people with low incomes (and also poor services) have less reason to support the state and less to lose from fighting; another is that the state in poor countries has fewer resources to suppress conflict. The established connection here is between the country’s per capita income and conflict, not the rate of poverty within it. In general, no systematic econometric connection has been found between the vertical income distribution (i.e. among households) and conflict, suggesting that the rate of poverty is not an additional factor over and above the general level of development.8 However, a negative association has been found between a country’s educational level and conflict, indicating that improved service entitlements (at least as far as education is concerned) reduce the risk of conflict (Collier and Hoeffler 2004). Yet where there is high unemployment among educated youth, cases study evidence seems to indicate a rise in the propensity to take violent action: Sri Lanka’s Tamils were led by a group of well-educated unemployed; and many of the Palestinian militants are of this type.
Horizontal inequalities and fragility: HIs, often due to discrimination, can contribute to fragility in three ways: through causing failures in services; through provoking conflict and thereby causing loss in authority; and by government repression provoked by protest against the HIs, leading to loss of legitimacy, and sometimes itself provoking further conflict.
First, HIs leads directly to fragility in service access as groups suffering severe social HIs, by definition, receive lower levels of service entitlements than the remainder of the population. As the proportion of the population suffering discrimination increases the likelihood that this will result in an overall failure of service access likewise increases. There is evidence that in many Latin American countries, including Guatemala (see case study), exclusion of indigenous groups has kept overall literacy rates low.
Table 10: Literacy rates in Guatemala by indigenous status, 2000 Age Cohort Indigenous
Non-Indigenous Ratio
10-19 74% 90% 1.216
20-29 63% 88% 1.397
30-39 49% 82% 1.673
40-49 40% 78% 1.950
50-59 26% 63% 2.423
60-69 20% 58% 2.900
15-64 53% 82% 1.547 Source: Shapiro (2006: 131)
8 The evidence is conflicting on the relationship between (vertical) income distribution and conflict, with Collier and Hoeffler (2004) stating that there is no relationship and Auvinen and Nafziger (1999) finding a weak relationship between greater inequality and higher conflict.

CRISE Working Paper No. 51
20
Secondly, HIs can lead to state fragility in the authority dimension if the deprived groups resort to violence in protest, whether in the form of an attempt to take over the existing state or to create a new state in the territories in which they are concentrated (i.e. secessionism). There is considerable evidence, both econometric and from case studies, supporting the view that greater horizontal inequalities between culturally defined groups raise the probability of conflict (Østby 2004; Barrows 1976; Mancini 2005; Stewart 2008; Cobham 2005a). However, like the other causes of conflict, high HIs predispose to conflict, but do not always cause it.
Among our case studies, HIs and discrimination has been at the heart of regional and ethnic rebellions in Côte d’Ivoire, Nepal, Indonesia, Guatemala and Sudan. In Côte d’Ivoire the North suffered multiple HIs; in Nepal, there was exclusion on geographic, caste and class lines; in Guatemala, exclusion on the basis of class and race was intertwined; in Indonesia, the secessionist groups in Aceh and East Timor had lower incomes and social services than the rest of the country; and in Sudan exclusion was practised on regional, religious and ethnic lines. And political exclusion occurred in every case. The case study of Côte d’Ivoire illustrates the importance of political HIs. While economic HIs were present for decades in that country, there was no conflict during the relatively politically inclusive regime of Houphouët-Boigny, but his successors introduced sharp political exclusion, and it was then that conflict broke out. Where there is political inclusion it seems that this can overcome socio-economic HIs, in terms of being a cause of national conflict, as in the case of Ghana. In some countries, however, groups suffering in multiple dimensions are too weak to mount an effective protest, as in the case of the Roma of Eastern Europe.
Thirdly, severe HIs can lead to state fragility in the legitimacy dimension, since states that discriminate against significant proportions of their population economically and politically are likely to be perceived as illegitimate by affected groups and by others sympathetic to their plight. Moreover, repression of political rights and military coups in many countries have, in part at least, been driven by, and justified in terms of, the regime’s inability to deal with ethnic and regional rebellion. In Indonesia, the draconian practices of Suharto’s New Order regime were mainly justified in such terms; similarly, in Nepal, the King’s dismissal of the prime minister in 2002 and his subsequent abrogation of parliament in 2005 were justified in terms of the democratic system’s inability to deal with the Maoist insurgency (see case studies) Beyond our case studies here, the 1962 military takeover in Burma and Marcos’ declaration of Martial Law in the Philippines were also directly linked to the failure of existing democratic regimes to deal with ethnic and regional insurgency.
Poor performance on civil and political HRs (weak legitimacy) as a cause of poor ESC (service entitlements). [C1]
While it is uncertain as to whether there is a relationship between democracy and economic growth (Przeworski and Limongi, 1993; Przeworski 2000) the evidence is much stronger that there is a positive relationship between democratic institutions and human development indicators, indicating a positive relationship between the Civil and Political Rights (legitimacy) and ESC (service dimensions) (Ahmed 2004 ; Frey and al-Roumi 1999). Moreover, we found that political discrimination (using data from MAR) – a type of legitimacy failure – was related to service entitlements, after allowing for the effect of per capita income with significant worsening in aggregate achievements on infant mortality, child mortality and life expectancy as political discrimination increases. However, interestingly while the outcome variables showed such a relationship no relationship was found with the more direct service entitlements variables of water provision, primary enrolment and secondary enrolment.

CRISE Working Paper No. 51
21
The converse relationship, from poor service access, especially if exclusionary, to lack of legitimacy is also likely. This is the case where the social contract has broken down, leading to lack of legitimacy and sometimes to a challenge to authority [C2]
To summarise, we find strong causal connections among the different dimensions of fragility, or different types of HR.
• Conflict weakens service access and undermines legitimacy: consequently, it causes failures in both ESC and CP rights; it weakens the realisation of MDGs and often enhances HI. This is why reducing the incidence of a conflict is an imperative for any effective development policy. There are also connections going in the opposite direction – from failures in legitimacy, including HR violations, to conflict; and from failures in service access, especially if exclusionary, to conflict. While HR violations, such as killing people, detaining them or suppressing peaceful opposition can provoke violence, pushing countries into democratic transition can do so also.
• Improvements in development generally are likely to reduce the propensity to conflict; improving education may do so too. But it is important to accompany development and education with job creation as high unemployment predisposes to conflict.
• Discrimination and social exclusion provoke conflict, particularly if there is political as well as economic exclusion.
We thus find broad causal connections among our three dimensions of fragility, but these connections are not invariable. Consequently countries can be fragile on one or two dimensions without being fragile on all three, as the evidence shows. The fact that the connections are not invariable offers hope for policy to prevent fragility becoming a trap that makes failure on all fronts inevitable. Policy can then aim to strengthen the dimension(s) causing fragility and to prevent fragility in one dimension leading to fragility in others.
4 Public policy towards fragility The objective is to help states move away from fragility. But what this means for public action in practice will vary hugely according to the source of fragility and the nature of the state.
The non-fragile state is easy to describe: it is one in which government authority obtains throughout the state’s jurisdiction, the government respects human rights and has political legitimacy, and is willing and able to ensure that basic human needs are met in an inclusive way, including making progress towards the MDGs and poverty reduction more generally. But as we’ve noted departure from these conditions can occur in a variety of ways and for a variety of reasons.
One general problem is that a fragile state, by definition, is not in a position to correct its own weaknesses fully – either because it lacks the authority to do so, or because the government does not want to correct particular weaknesses, such as social and political exclusion, or because the government has very limited human and financial resources, and cannot – however willing – correct all deficiencies on its own. Clearly, then the international community has an important role to play, but a difficult one. Thus if the local government is determinedly exclusionary – as for example, in Côte d’Ivoire, Guatemala and Sudan historically and to a certain extent today – the international community is limited in what it can do: it can try persuasion, but this was unsuccessful over decades in Sudan; or it can use its own funds to make limited progress on some fronts, again not very successful in the Sudan. There is more potential for the international community where the government is weak but not unfavourable to inclusive policies. Then donors

CRISE Working Paper No. 51
22
can support governments in raising revenue, supplementing local resources with their own resources, and provide technical assistance. In the case of Nepal, for example, prior to the political agreement, the international community was already distributing resources towards the neglected hill areas, and is now able to support the government to this end. Prior to the peace agreement in the Sudan, donors were able to distribute some funds to the South, but the South remained much less developed than the North and the bulk of aid funds went straight to the North where they supported the exclusionary practices being followed. Even resources apparently intended for the South were often diverted.
There is a general issue about which type of fragility to prioritise where a state is failing on two or three dimensions. Of course, many countries are failing on only one dimension so the issue of priorities need not arise. In the short term, it is essential to restore authority because when a war is raging, service entitlements are difficult if not impossible. But it is necessary to tackle some of the root causes of conflict if authority is to be sustained in the medium term, so service entitlements must soon also be prioritised – indeed, it is important to reach people with food and some health services even during conflict (Stewart and Fitzgerald 2001). Promoting legitimacy does not typically cost economic resources, so policies to restore it need not be at the expense of achieving the other objectives. But it requires authority so is likely to be achievable only gradually both contributing to and facilitated by the restoration of authority.
The precise policies to be followed need to be differentiated according to the source of fragility in the particular state:
1. Weaknesses in authority. A lack of authority represents a very basic state failure and one that makes it difficult – indeed often impossible – to overcome other types of fragility. While it is easy to state that authority needs to be restored, it is not possible to generalise about how, since situations vary so much. There are occasions when the international community itself (whether under the auspices of the UN, regional organisations, coalitions of countries or unilaterally) can use force to impose authority. But this is often unsuccessful as it can further provoke local opposition and may leave the state dependent on continued international intervention for its authority – as appears to have occurred in the Somali case, and those of Iraq, Afghanistan and Kosovo, while repeated international interventions in Haiti have done little to restore authority or HRs. In Côte d’Ivoire French intervention helped bring outright conflict to a halt, but left an uneasy peace with a major loss of authority in the North.
A generally more desirable alternative is to encourage and facilitate local peace processes and then provide support (including military if needed) for any agreed and legitimate government. In our case studies, this is what happened (broadly speaking) in Guatemala, Sudan, East Timor and Nepal.
We should note that supporting authority can sometimes be at the expense of legitimacy. In cases, where the various parties have inconsistent demands, authority might be re-established only by suppressing human rights and democracy. In some cases, authority and legitimacy may only be achievable through secession – as in East Timor, and Eritrea. In others, political settlements can be designed to reconcile authority and legitimacy if all parties are willing, as in Nigeria following the Biafran war. Similarly, peace was secured with Southern Sudan by offering considerable autonomy and the promise of a referendum on independence. However, we have yet to see whether this will be honoured and the peace sustained.

CRISE Working Paper No. 51
23
2. Service entitlements failures, including high HIs. Aid and policy dialogue can contribute to reducing such failures (Brown and Stewart 2006). The potential for aid to do so is high in countries where aid accounts for a substantial proportion of GDP (e.g. in Ghana).
While the nature of assistance varies with the situation, there is a general requirement that service access be inclusive and that social exclusion be explicitly considered, measured and addressed. Aid cannot achieve comprehensive social and economic rights nor social inclusion in countries with strong exclusionary tendencies, unless these are specifically addressed. This does not follow automatically from a focus on the MDGs – which can often be achieved most cheaply by reducing poverty and extending services to the already relatively privileged groups and regions. For example, aid to Guatemala since the peace accords has not achieved much in the way of reducing social exclusion, while aid to Ghana has reduced poverty significantly in the South but rather little in the North.
To be effective, then, policy needs to be directed at the main source(s) of the problem. In the Guatemalan case this appears to be a matter of raising government revenue, of redirecting expenditure towards indigenous people and areas, and of introducing land reform. For the most part, generous aid to Guatemala has done little on these fronts, despite a strong focus on the MDGs. Moreover, Guatemalan policy illustrates the point that it is difficult for outside agencies to achieve much in the face of governments that want to do little. Outside donors can put these issues on the agenda as forcefully as possible and local agents may then take them up. In the meantime, aid can contribute towards tackling the particularly weak areas (e.g. deficient revenue generation in the case of Guatemala; excessive military expenditure in the case of Nigeria and Indonesia); aid can also support the relatively weak sectors (e.g. water networks and health services in Sudan and Guatemala); and the regions that are falling behind – for example in the cases of Ghana, Sudan and Nepal.
3. Legitimacy. This requires policies to move countries away from authoritarianism and failures in HRs towards inclusive democratic systems where political and civil and cultural HRs are broadly respected. As noted earlier, it is important to do so not only as an objective in itself but also for the contribution this will make, especially in the longer term, to reducing other dimensions of fragility. Yet, as also noted, there can be trade-offs in this area. The attempted transition to democracy in Côte d’Ivoire itself provoked the exclusionary policies and suppression of HRs that followed. Equally, the same transition in Indonesia was soon followed by a series of lethal communal conflicts. In peace-making contexts, insistence on HRs, including criminal investigations of major violators, can make it more difficult to reach a peace accord (an example is Northern Uganda where the International Criminal Court’s determination to issue indictments against the leaders of the Lord’s Resistance Army, threatened to make it more difficult to reach a peace agreement (Parrott 2006)).
A major issue with respect to policies towards all three types of failure is that frequently it is the government itself that is responsible for these failures, and this is the intended, not the unintended, consequence of government policy. In this context, an HR approach is especially helpful. Where a government has agreed to HRs, both the international community and local communities (or individuals) can argue that the government is violating its own agreements. In some contexts, legal means (international or domestic) can be used to try and enforce these rights. In others, such agreement can be a useful advocacy tool. The international community may use government agreement to the HR

CRISE Working Paper No. 51
24
conventions as a reason for using their own aid and other sources of leverage to promote fulfilment of the HRs. In cases where the failures are due to unintended consequence of government policies, appeal to the HR agreements may be effective in securing policy change. Where the failures are deliberate, naming and shaming may sometimes be effective. But if not, aid agencies may need to adopt a more roundabout approach, using project aid to try and support HRs. In extreme cases of HR failure, aid has been cut off – for example by Finland in both Kenya and Nepal. However, caution is needed here as this may not be helpful in changing policy, and it may harm the population, accentuating fragility.
An HR approach also encourages interventions which help empower people/communities so that they can themselves exert pressure to secure their rights. How far this is possible, however, depends in part on the source of fragility. In a situation where there is near-universal loss of authority (e.g. Somalia or the Congo) this would be difficult to organise and not necessarily effective since the government lacks any capacity to respond to pressure. Equally, where CP are severely restricted (e.g. Burma) there may be little scope for such outside interventions. An empowerment approach is likely to be most effective in poor countries suffering from service failure rather than severe authority or legitimacy ones.
4.1 Enabling conditions for corrective policies
Inclusive democratic governance. Establishing a legitimate government is arguably the most important priority in corrective policies for fragile states, as groups which have experienced historical inequalities and discrimination, or violation of human rights, are unlikely to respond favourably to corrective policies if they continue to regard the state as illegitimate. The suspicion of state motives has bedevilled peace negotiations in many conflicts, such as Aceh. As already noted, democratic systems tend to have a higher degree of legitimacy than authoritarian regimes and the existence of democratic structures is thus an important enabling condition for corrective policies. But, particularly in ethnically or religiously polarised countries, simple majoritarian democracy may not be sufficient to establish broad legitimacy for the government if smaller groups are still at risk of exclusion. Inclusive political structures may be formal or informal. Formal measures may include
• Reserved seats in parliament for specific groups. Indian policy towards scheduled castes and tribes is an example;
• Constitutional bodies charged with ensuring the representativity of government, as with the Federal Character Commission in Nigeria (see case study);
• the banning of ethnically or regionally based political parties, as in the Indonesian and Nigerian case studies, as well as many other countries such as Ghana; and
• the granting of special powers and privileges to areas of particular fragility, as in Aceh, or marginalised groups, as with the Malay ‘special rights’ in Malaysia.
Informal measures include:
• the formation of ‘grand coalition’ (cf. Lijphart 1977) governments that include all major groups, as in Malaysia; and,

CRISE Working Paper No. 51
25
• informal power-sharing precedents, such as ensuring that the president and the vice-president represent different groups or regions (or, as in the Indonesian case study, the bupati and sekwilda at the local level).
There are advantages and disadvantages to both formal and informal strategies. Formalised constitutional measures make it more difficult for governments to renege on the demands of inclusion but also, arguably, reify ethnic difference and make it difficult to transcend ethnicised politics in the long term – an argument that has been made of special rights in Malaysia (Jomo 2004; Means 1972). Informal measures are arguably more responsive and flexible, but are also easily abandoned when political elites feel it is in their interest. The appointment of regional bupati in the Indonesian case study is an example here, where the abandonment of such informal precedents was itself a major source of legitimacy failure and fragility.
Long-Term Economic Planning. Policies to correct embedded socio-economic social exclusion are likely to take a long time to bring to fruition. Bringing groups that have suffered educational exclusion up to parity, for instance, may take at least a generation. For political reasons, rectification of economic inequalities may require a gradual and long-term strategy, in order to ensure that positive action in favour of excluded group(s) does not lead to excessive resentment among the privileged groups that will lose by the policies. An example where a state has initiated such a long-term strategy with broad success is Malaysia, where the New Economic Policy, implemented in 1970, set 20-year targets for improvements in bumiputera socio-economic conditions. Even with such a moderated approach, however, Chinese resentment at the policies emerged into sustained protest when an economic downturn in the mid-1980s brought home their comparative losses (Brown 2005). The Sri Lankan policies towards reducing Tamil privileges – which were introduced abruptly – in contrast, helped provoke the Tamil rebellion.
Truth and Reconciliation Commissions. A number of countries emerging from extended conflicts, such as Peru, Guatemala and East Timor, have followed the South African example in initiating some form of Truth and Reconciliation Commission. Such commissions, where properly executed, potentially have a major stabilising influence on fragile states. They can also provide an important mapping function by identifying the dynamics of social exclusion that drove the conflict in the first place. This was the case in the Guatemalan case study, where the Truth and Reconciliation Commission provided categorical evidence of the ‘racism’ of the state and its role in fomenting the conflict (see also Caumartin 2005). They can improve the legitimacy of the state by, in effect, drawing a line under the human rights abuses and social exclusion of the past. For this latter function to succeed, however, the state must possess the political will to implement measures to correct the social exclusions and human rights abuses identified by the process; but if such will is lacking, as appears to be the case in Guatemala, this may serve to undermine further the legitimacy of the regime and lead to further fragility.
4.2 Conditions hindering corrective policies
Entrenched political interests. In both the Guatemalan and Indonesian case studies, it is clear that commitments to pursue corrective policies were not followed through because of entrenched political interests at the elite level. In Guatemala, the explicit guarantees of the 1995 peace accords that indigenous welfare would by prioritised by the government have not been realised; in Indonesia, the top-down imposition of, from the Acehnese perspective, inadequate special autonomy arrangements for Aceh led to the collapse of the peace process, although it was subsequently resuscitated following the 2004 tsunami. It seems evident that the failure to implement corrective policies is linked in part to failures to reach an inclusive political settlement. Where post-conflict

CRISE Working Paper No. 51
26
settlements leave the power of existing elites untouched, there is often little incentive for them to deliver fully on corrective policies. In as much, it is worth noting that the key sticking point in the post-tsunami peace process in Aceh, ultimately resolved in the rebels’ favour, was their demand to be able to contest local elections – Indonesia’s constitution had prohibited regionally based parties. In contrast, the comprehensive steps to address regional economic inequalities undertaken by the Nepalese government may not be sufficient to prevent a resurgence of the insurgency if the state continues to be dominated by the Parbatiya Brahmin elite. The restoration of parliament in spring 2006 is a positive step here, but given that every democratic election the country has held produced a Brahmin-dominated government, more concrete steps may be necessary to ensure the participation of excluded castes and ethnic groups in government.
Military and police autonomy. A major focus of post-conflict aid is often the demobilisation, disarmament and rehabilitation (DDR) of rebel combatants. In fragile states, however, particularly those which have recently experienced or are experiencing violent conflict, the state military and police forces themselves are often major perpetrators of human rights violations. This extends also to state-backed militia organisations, such as the Janjawid in Sudan and the anti-independence militias in East Timor at the time of the referendum. The existence of a strong and relatively autonomous (i.e. beyond civilian control) military is likely to hinder the implementation of corrective policies because its agenda often differs from that of the civilian administration. This is all the more likely in contexts where the military personnel can profit individually from the war economy. Military and police reform has been the major uncompleted project of the reformasi era in Indonesia. Designated seats for the military in parliament have been abolished and the police removed from military control, but other major reforms such as the de-territorialisation of its structure remain unfulfilled. Moreover, state funding of the military remains woefully short, such that an estimated 80 per cent of its operating budget is raised by the military itself, some of it through legal businesses, but also through illegal operations including, reportedly, marijuana growing in Aceh. In such circumstances, the military remains an important potential source of state fragility.
Corruption. The term corruption is used to cover a wide range of practices at different levels of the state, from the skimming of aid funds by national leaders to petty extortion by police personnel. High-level corruption is clearly a hindering condition for corrective policies as it can prevent policies being implemented fully or properly. This is of particular concern in ethnically divided countries, as case study evidence shows how ethnically neutral aid programmes are easily skewed through corrupt implementation to favour one or other group (Cohen 1995), thus undermining the stabilising potential of aid. More generally, prevalent corruption is likely to continue to undermine the legitimacy of the state; this applies both at the high level and at the lower level – arguably more so the latter, given the fact that petty corruption and bribery at the low level is likely to be something that affects the lives of normal individuals more directly.
Low capacity to fulfil agreed solutions. This may occur as a result of lack of authority (as in Afghanistan, for example) and/or weak infrastructure and technical personnel. Many fragile states suffer from both (e.g. Somalia). Lack of budgetary control seems to be one reason why many of the PRSPs are only partially translated into policy (McKay and Aryeetey 2004). Even where there is political will, there are some very difficult challenges involved in designing effective policies to reverse fragility. For example, balanced regional development is a requirement for inclusionary policies. Yet while it is relatively easy to ensure that public service entitlement is balanced, it is much more difficult to generate sustained economic growth in historically deprived regions like Northern Nigeria. Another example is employment creation. Sustained expansion of

CRISE Working Paper No. 51
27
employment opportunities for youth would be likely greatly to reduce political fragility. Yet what has been described as ‘jobless growth’ is a frequent characteristic of recent economic development in those regions that do enjoy sustained growth. In many others, even attaining growth is extremely difficult. There may be trade-offs here too. The Washington-consensus type stabilisation policies are often associated with little or no growth, and with even lower employment growth. Specific government interventions – including employment creation schemes and import substitution – may be needed. But adopting such policies puts countries into direct conflict with the International Financial Institutions. In general, it is easier to reverse social discrimination and inadequacy of social services than to reverse economic inequalities in the current policy environment.
Broadly, all these hindering and enabling conditions imply the need for a long-term strategy but there are clearly some tensions between some of these conditions. For instance, democracy is likely to improve political inclusion, but also tends to lead to economic short-termism as governments submit themselves for regular re-election (cf. Brittan 1975). Conversely, long-term economic planning is likely to be more prevalent in countries with entrenched political elites. Corrective policies may therefore involve some trade-offs. In Malaysia, for instance, long-term planning and inclusive government have been bought at the expense of some civil freedoms and the entrenchment of a political elite. Democratic practices, although somewhat curtailed, ensure at least that the government is ‘responsive’ if not ‘representative’ (Crouch 1996).
For donors seeking to help states to move out of fragility, this raises a number of important conclusions. Careful diagnosis is the first prerequisite for designing appropriate responses in each case; a ‘one size fits all’ approach to fragility would not be effective and may be damaging. Secondly, donors and the international community should pursue a long-term commitment to fragile states, both to reduce the fungibility of their aid (Gaspard & Platteau 2006) and to support the long-term strategy and vision necessary to move countries permanently out of fragility. Where donor organisations are involved in post-conflict countries (i.e. those that have experienced authority failures), they need to follow up any peace agreements with monitoring and incentives for enforcement.
5 Conclusions It is clear that there are considerable overlaps among the various objectives that form part of the current development agenda, all of which form essential aspects of developing non-fragile states. A non-fragile state would meet the MDGs and poverty reduction targets; it would respect human rights – economic and social, civil and political; and it would be non-exclusionary. But pursuing part of this agenda exclusively does not guarantee that the other parts will be met. In particular, poverty reduction and the MDGs can be achieved in an exclusionary way and in a way in which many human rights are not respected.
Although we have differentiated between different aspects or sources of fragility, in some sense they are indivisible because failure on one of the three dimensions (authority, service entitlements and legitimacy) generally predisposes to failure on other(s). Consequently, it is important that the full set of requirements for achieving non-fragility is aimed for. This means that securing inclusive government, comprehensive service entitlements and economic opportunities, and avoiding social exclusion must be added to the poverty reduction, MDG and market liberalisation agenda – it will not happen automatically. The same is true of fulfilling HRs: on the social and economic front, meeting the poverty reduction and MDG objectives in a non-exclusionary way should be sufficient to ensure that social and economic rights are met; but they will not be sufficient to ensure that political and civil rights are met. Such rights have to be pursued
CRISE Working Paper No. 51
28
separately. While promoting freedom and democracy should involve respect for political and civil HRs – this will not be sufficient to ensure an inclusive political system.
Thus reversing fragility goes beyond many of the current objectives taken individually, and requires a comprehensive approach and set of objectives.

CRISE Working Paper No. 51
29
ANNEX 1. CASE STUDIES9
6 Indonesia 6.1 Introduction
In the early 1990s, commentators on Indonesia often expressed a grudging admiration for the New Order regime of President Suharto, in power since 1965, which had kept tight political control over the country, while simultaneously delivering significant economic growth. Within less than a year, however, the economic crisis sparked by the regional currency crisis of July 1997 had led to Suharto’s ouster and the creation of a new democratic era. This was no orderly transition, however, with the transition accompanied by a surge in intercommunal violence across the archipelagic nation, which claimed more than 10,000 lives between 1998 and 2003 (Varshney et al. 2004). This paper explores a specific question pertinent to our overall objective in this context: how, and how far, can the New Order regime be said to have been ‘fragile’.
Indonesia, formerly the Netherlands East Indies, gained independence from the Dutch in 1950 after a five-year war of independence launched after the surrender of the Japanese, who had occupied the country during the Second World War. Originally constituted as a secular democracy with a national ideology of Pancasila (elaborated below), the new nation was quickly beset by regional and religious tensions, ushering a transformation to ‘Guided Democracy’, with a strong role for the military. Ideological differences also played a part; in the 1955 elections, the PKI (Communist Party of Indonesia) had become the largest communist party outside of the Soviet Union and China and the country’s left-leaning president, Sukarno, had included them in government. In 1965, after a purported coup attempt by alleged Communist sympathisers and a successful counter-coup led by the previously little noticed Lieutenant General Suharto, Sukarno was gradually removed from power and Suharto took over the reigns of government, creating the highly centralised ‘New Order’ regime, which dispensed with all but the slightest formalities of democracy and institutionalised a political role for the military under the dwi fungsi (dual function) concept. This transformation was accompanied by the bloodiest period in Indonesia’s history, when an anti-Communist purge, tacitly endorsed by the American administration enamoured of Suharto’s staunch anti-Communism, claimed around half a million lives, principally in Java and Bali, but also in other areas, notably Kalimantan.
For the most part, the New Order was able to suppress the regional discontents of the Sukarno era, with the notable exception of serious separatist rebellions that broke out in Aceh in 1976, in East Timor following its annexation by Indonesia in 1975, and a less severe rebellion in West Papua, which had been annexed in the final years of Sukarno’s presidency. Suharto and his New Order remained in power until his ouster in 1998, after massive protests originally against fuel price hikes forced on the regime by the Asian Financial Crisis of the previous year intensified following the murder of university student protesters by the military. Suharto’s hand-picked successor and protégé of previous years, B.J. Habibie, instituted a dual reform package of democratisation and decentralisation. This period was also accompanied by a resurgence of ethnic and regional discontent, with serious interethnic and inter-religious violence breaking out in parts of Kalimantan, Sulawesi, and Maluku. Anti-Chinese riots, primarily in Java, were also sparked by the chaos at the end of the New Order, although these proved short-lived.
9 Annex III contains available time-series summary data on the human rights performance and dimensions of authority in the case study countries.
CRISE Working Paper No. 51
30
In the first democratic election in four decades in 1999, the Democratic Struggle Party of Indonesia (PDI-P), led by Sukarno’s daughter Megawati Sukarnoputri, emerged as the largest party in parliament, but the strong Islamic bloc in parliament vetoed her selection as president, with the moderate Muslim cleric Abdurrahman Wahid emerging as a compromise choice, with Megawati as his deputy. After Wahid’s administration became increasingly erratic and displayed somewhat authoritarian tendencies, however, he was impeached by parliament after a last-ditch attempt to declare Martial Law was over-ruled by the supreme court, and Megawati took over. At the same time, parliament reformed the constitution to allow for the direct election of the president, rather than his/her selection by parliament. Parliamentary and presidential elections held in 2004 saw PDI-P punished for Megawati’s poor performance, with Golkar – the erstwhile party of Suharto and the New Order elite – winning the largest share of the seats, although still far short of a majority. The presidential elections were won by Susilo Bambang Yudhoyono, a retired general seen as a reformer, and his running mate, Jusuf Kalla, the chairman of Golkar, both of whom were widely credited with an instrumental role in ending the ethnic and religious conflicts of the previous years.
6.2 Dimensions of Fragility
6.2.1 State Authority
State authority and, particularly, the quest for territorial control have arguably been the decisive and defining features of Indonesia’s successive political transformations. Lacking any historical experience as a unified country, beyond the shared experience of Dutch colonialism, the Indonesia project was contested from the outset, particularly in the areas of the outer islands where Christianity had taken a stronger hold and the local population feared domination by the mostly Muslim Javanese. In the Minahasa region of northern Sulawesi, for instance, the conceived country of Indonesia was a ‘problematic option’ and many Minahasan nationalists were all too willing to envisage independence ‘with or without Indonesia’ (Henley 1993: 109-112). The war of independence itself was not just a struggle against the Dutch but also a struggle to unify the outer islands and bring them under central control in Jakarta. In southern Maluku, many Christian groups fought with the Dutch against the incipient Indonesian state, subsequently declaring an independent Republic of South Maluku (RMS) when the war was lost in 1950 (Chauvel 1985). While the RMS was quickly crushed, its legacy remains important in the region and was reawoken during the inter-communal conflict at the end of the New Order. In other areas, notably East Java and Aceh, a lose alignment of groups under the banner of Darul Islam fought not for secession but to transform Indonesia into an Islamic state (van Dijk 1981). By the late 1950s, it appeared that the new nation was firmly on top of these insurgencies, but regional and political discontent emerged again in the mid-1960s, prompting Sukarno’s move to Guided Democracy and subsequent declaration of Martial Law, reportedly at the behest of the military which threatened a coup otherwise.
Despite internal problems, Sukarno’s vision of an ‘Indonesia Raya’ (Greater Indonesia) that would encompass all that he perceived to be the ‘Malay’ lands in island Southeast Asia led him to military and political adventurism beyond the country’s current borders. A concerted political campaign with the threat of military intervention saw the separate Dutch colony of West Papua incorporated into Indonesia in 1965 after the UN administration of the province kowtowed to a ‘referendum’ of 1,000 Papuans hand-picked by Jakarta, who voted unanimously for inclusion. Sukarno’s policy of konfrontasi and low-level military engagement against the formation of Malaysia in 1963 was less successful.
The transition to the New Order regime saw state authority become arguably the over-riding concern of the regime. Suharto’s pragmatic and broadly pro-Western international

CRISE Working Paper No. 51
31
outlook saw him drop Indonesia’s objections to the formation of Malaysia, but within the country’s current borders – including West Papua, now renamed Irian Jaya – state territorial control became paramount. As already mentioned, the military was given an explicit political role and ABRI, the armed forces, was reorganised along territorial lines so that it had administrative presence down to the kecamatan (sub-district) or even village level; the police force was also subordinated to military control. After the Portuguese territory of East Timor, bordering Indonesian-controlled West Timor, descended into civil war following independence in 1974, Indonesia invaded and annexed the territory, allegedly fearing a communist victory would result in the emergence of an ‘Asian Cuba’. Having found in Suharto a staunch ally against the dreaded communist contagion in Southeast Asia, America turned a blind eye to the invasion, which resulted in the death of some 100,000 Timorese, or at least a fifth of the population. Suharto’s New Order regime was not immune from the regional discontents of the Sukarno period, however. In East Timor, a resistance movement emerged immediately after the occupation, which fought the Indonesian army with waxing and waning strength until independence was gained in 1999 (see below). An independence movement for West Papua also emerged, although it has never become a significant military force. Finally, regional discontent in Aceh emerged after the discovery of substantial oil and natural gas reserves in the province, this time expressing the desire for outright secession. The New Order response to all these rebellions was military, and brutal – a response that was in many ways counterproductive; in Aceh at least, the brutality of the military response to the relatively small secessionist movement in the late 1970s is largely credited with ensuring the movement’s much greater support when it re-emerged in the early 1990s.
While the New Order regime was unable to establish absolute state authority at the extremities of the archipelago, the period did manage to suppress many of the challenges of the Sukarno period. But in doing so, it also sowed the seeds for future troubles. The highly centralised nature of the regime saw important local position such as provincial governors and district bupati appointed directly by Jakarta. These appointees, particularly in trouble spots, were often military personnel not from the region, usually Javanese. In doing this, the New Order thus created what Liddle (1970: 222) termed a ‘participation gap’, whereby local ethnic elites were excluded from national and local decision-making. At the same time, the massive transmigrasi programme, the largest state-run migration programme in the world, saw many hundreds of thousands of Javanese families relocated to the outer islands, ostensibly to rectify the undoubted over-population of the island, but also with the intention of providing a bedrock of support for the territorial divisions of the military (Tirtosudarmo 1995). These transmigrant families were often given prime agricultural lands and indigenous groups were sometimes displaced by the creation of infrastructure to service the transmigrant communities (Leith 1998). Similarly, in 1979, the New Order passed legislation requiring the re-organisation of all village administrations along the lines of the Javanese desa system, undercutting traditional administrations in many parts of the country. While the New Order regime was thus broadly able to maintain state authority in much of the country, it did so in ways which only reinforced non-Javanese fears of domination and exacerbated problems of horizontal inequality and social exclusion.
As already noted, the collapse of the New Order was accompanied by a surge in inter-communal conflicts throughout the archipelago, notably in Ambon, North Maluku, Central Sulawesi, and West and Central Kalimantan – usually termed ‘horizontal conflicts’ in Indonesian parlance, as opposed to the separatist, anti-state ‘vertical conflicts’. The proximate causes of these horizontal conflicts are of course immensely complex and vary from case to case, but broadly common themes that emerge link it to the political machinations of local ethnic elites presented with a new opportunity for political power, through the democratisation process, and increased gains from this through the

CRISE Working Paper No. 51
32
decentralisation process. Whatever their causes, these conflicts presented a renewed challenge to state authority. At the same time, however, some promise of resolution for the decades-old vertical conflict appeared in the offing. In 1998, Habibie decided to allow East Timor a referendum on whether to accept special autonomy status within Indonesia, or full independence. Despite considerable violence and intimidation by military-linked militia groups, the province voted overwhelming for independence and was placed under UN administration until gaining full independence in 2002. Elsewhere, parliament passed special autonomy laws for Papua and Aceh, although these were largely criticised for their top-down un-negotiated measures. In Aceh, however, a ‘Humanitarian Pause’ and subsequent ceasefire broke down in 2002, prompting the declaration of Martial Law and an intensification of military activities in May 2003. Martial Law was lifted in 2004, but later that year natural forces intervened through the Boxing Day tsunami which decimated the province, paving the way for renewed negotiations and the signing of a ceasefire agreement in August 2005. While problems remain in its implementation, there is currently promise of an enduring settlement in Aceh.
Broadly speaking, then, the trauma of democratisation in Indonesia appears to have subsided with some degree of territorial authority restored across most of the country. State authority problems persist – notably in the weak justice system – but a slow process of (re)integration and recovery appears fully underway.
6.2.2 Service Entitlements
Under the New Order regime, Indonesia performed remarkably well in service delivery in aggregate terms, at least until the financial crisis of 1997, although, as will be seen later, aggregate figures mask severe sub-national variations. Using the techniques described in Annex II, Figure 2 shows the country’s performance in reducing child mortality against what would be expected for a country of its level of GDP. Since 1965, when the first data is available, Indonesia has performed well, even holding for its generally high growth rates before 1997, reducing from a CMR of 204 in 1965 to 38 in 2005, against an expected reduction from 211 to 98. Poverty rates declined significantly across the period, from an estimated 53.6 per cent in urban areas and 38.7 per cent in rural areas in 1970 to 9.7 per cent and 12.3 per cent respectively in 1996 (figures from Booth 2000: 76). Moreover, this was achieved with minimal effects on inequality; the consumption Gini coefficient increased only marginally between 1964 and 1996, from 0.35 to 0.36; in rural areas it declined significantly from 0.35 to 0.27.
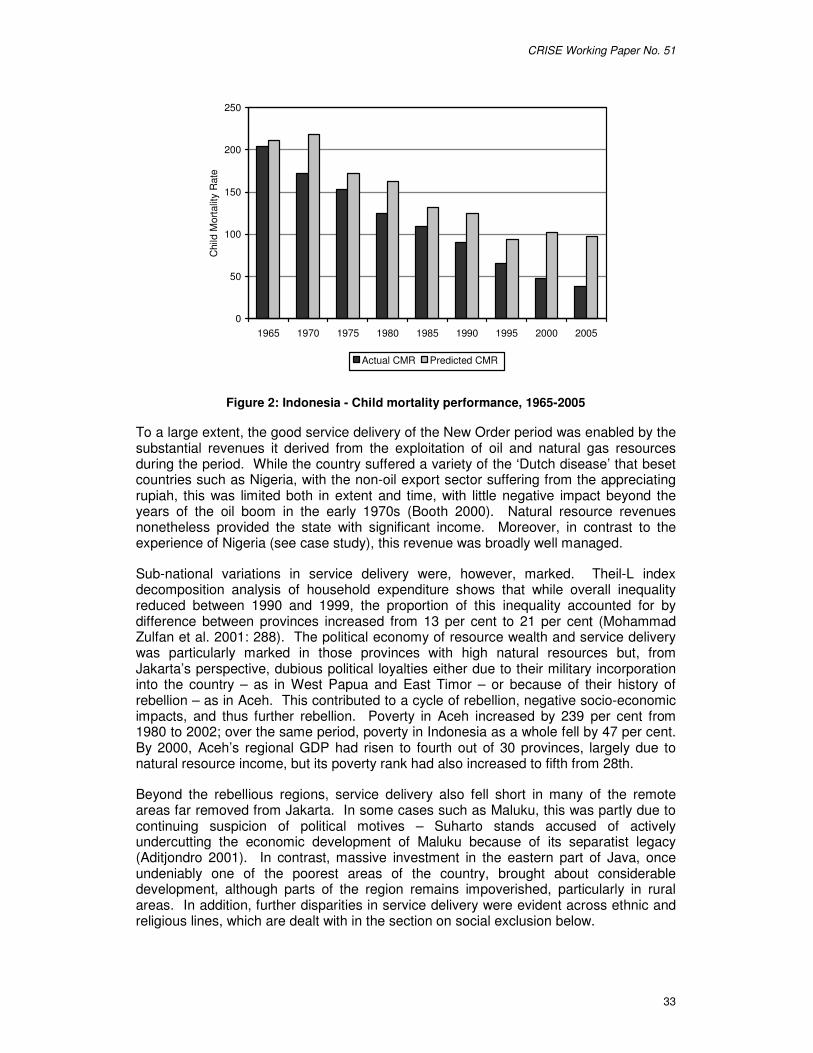
CRISE Working Paper No. 51
33
0
50
100
150
200
250
1965 1970 1975 1980 1985 1990 1995 2000 2005
Chi
ld M
orta
lity
Rat
e
Actual CMR Predicted CMR
Figure 2: Indonesia - Child mortality performance, 1965-2005
To a large extent, the good service delivery of the New Order period was enabled by the substantial revenues it derived from the exploitation of oil and natural gas resources during the period. While the country suffered a variety of the ‘Dutch disease’ that beset countries such as Nigeria, with the non-oil export sector suffering from the appreciating rupiah, this was limited both in extent and time, with little negative impact beyond the years of the oil boom in the early 1970s (Booth 2000). Natural resource revenues nonetheless provided the state with significant income. Moreover, in contrast to the experience of Nigeria (see case study), this revenue was broadly well managed.
Sub-national variations in service delivery were, however, marked. Theil-L index decomposition analysis of household expenditure shows that while overall inequality reduced between 1990 and 1999, the proportion of this inequality accounted for by difference between provinces increased from 13 per cent to 21 per cent (Mohammad Zulfan et al. 2001: 288). The political economy of resource wealth and service delivery was particularly marked in those provinces with high natural resources but, from Jakarta’s perspective, dubious political loyalties either due to their military incorporation into the country – as in West Papua and East Timor – or because of their history of rebellion – as in Aceh. This contributed to a cycle of rebellion, negative socio-economic impacts, and thus further rebellion. Poverty in Aceh increased by 239 per cent from 1980 to 2002; over the same period, poverty in Indonesia as a whole fell by 47 per cent. By 2000, Aceh’s regional GDP had risen to fourth out of 30 provinces, largely due to natural resource income, but its poverty rank had also increased to fifth from 28th.
Beyond the rebellious regions, service delivery also fell short in many of the remote areas far removed from Jakarta. In some cases such as Maluku, this was partly due to continuing suspicion of political motives – Suharto stands accused of actively undercutting the economic development of Maluku because of its separatist legacy (Aditjondro 2001). In contrast, massive investment in the eastern part of Java, once undeniably one of the poorest areas of the country, brought about considerable development, although parts of the region remains impoverished, particularly in rural areas. In addition, further disparities in service delivery were evident across ethnic and religious lines, which are dealt with in the section on social exclusion below.
CRISE Working Paper No. 51
34
6.2.3 Legitimate Governance
In Indonesia, the state has varied in its broad degree of democratic legitimacy, from relatively free and fair elections in 1955, which however produced a parliamentary stalemate between broadly Islamic parties and secular and communist parties, through three decades of military-backed authoritarianism to the democratisation of 1998. In the post-war era, few authoritarian regimes have lasted as long as the New Order.
While level of democratisation may provide a good general indicator of state legitimacy, however, it is important to nuance this in individual cases. In Indonesia, the New Order regime was in its early years actively supported by large portions of the population, including many students, not least for its virulent anti-communist stance. As the regime became further entrenched, ‘it was the economic achievements that above all others conferred legitimacy on his regime’ (Booth 2000: 73). The New Order regime and Suharto in particular propounded a concept of political legitimacy in which social order and development were prioritised above the niceties of democratic practice, a concept akin to, although distinct from, the ‘Asian Values’ ideas proposed by Suharto’s equably durable regional counterparts, Prime Ministers Mahathir Mohamad in Malaysia and Lee Kuan Yew in Singapore (Vickers and Fisher 1999). How far this notion was accepted or internalised by the domestic population is, of course, a moot point, but some support can be found by the continuing popular support for the New Order Golkar party in the post-New Order period, and the success of ex-military personnel in electoral politics; the current president, Susilo Bambang Yudhoyono, is a former general, as was one of the other candidates in the 2005 presidential election, General Wiranto.
6.3 Human Rights
During the New Order period, Indonesia ranked as one of the worst performers on human rights in the region. As already noted, the rise of the New Order in 1965-6 was marked by a massive transgression of the most fundamental right to life, orchestrated if not led by the military, in which up to half a million communists and suspected sympathisers lost their lives. Following the establishment of the new regime, human rights abuses continued on a large scale. Generally speaking, it is possible to connect these large-scale transgressions of human rights to the state’s quest for stability in the authority dimension. Systematic abuses of fundamental human rights were concentrated in regions where state authority was being challenged, such as East Timor (after annexation), Aceh, and Papua. At least 100,000 people lost their lives in East Timor, mostly after annexation.
The imprisonment and execution of political dissidents or regime opponents was commonplace throughout the New Order regime. Indonesia’s Nobel literature laureate, Pramoedya Ananda Toer, spent much of his life incarcerated in the Boven Digul camp for political prisoners. Neither were such violations restricted to political opponents: in the mid-1980s a serious of ‘mysterious shootings’, as they were ubiquitously termed, resulted in the assassination of many suspected criminal organisers, a purge that Suharto later tacitly admitted he had instructed the military to undertake. Although the post-New Order period has largely seen such violations disappear, they have by no means been eradicated, as the murder of the human rights activist Murni on a plane to Holland bears witness. The post-democratisation military is still accused of gross violations of human rights, particularly in Aceh, at least until the ceasefire, and in West Papua.
Freedom of the press was also severely curtailed during the New Order, both through explicit legislation such as the so-called SARA law, from the Indonesian acronym for ethnicity, religion, race and inter-group relations, which prohibited public discussion of
CRISE Working Paper No. 51
35
such issues, and through intimidation resulting in significant self-censorship. Freedom of association was likewise minimal. Under the democratic fig-leaf of the ‘floating mass’ concept, the multitude of political parties existent prior to the New Order were forcibly merged into three groups – the broadly Islamic United Development Party (PPP), the secular National Democratic Party (PDI) and the New Order vehicle Golkar. These parties were tightly controlled and – with the exception of Golkar, which, technically, was not a political party – were forbidden from organising at local levels. NGOs were also subject to strict controls and, in 1985, were required to adopt the national ideology of Pancasila as their sole guiding philosophy. Nonetheless, some NGOs – particularly the mass-based Islamic groups Nadhlatul Ulama and Muhammadiyah, which claimed tens of millions of members each – remained important political actors.
In terms of international human rights instruments, the four core conventions on genocide (CPPGC), racial discrimination (ICERD), civil and political rights (ICCPR) and economic, social and cultural rights (ICESCR) remained un-ratified throughout the New Order period. In the 1980s during the New Order, Indonesia signed the convention against torture (CAT), but did not ratify it. The New Order regime did ratify the conventions against discrimination against women (CEDAW) and on the rights of the child (CRC), but with reservations against referral to the ICJ without Indonesia’s own consent. Since the end of the New Order, Indonesia has ratified or acceded to CAT, ICERD, ICCPR and ICESCR, although the state has yet to act upon the additional optional protocols. In each case, however, Indonesia has passed a reservation relating to the provisions on ‘self-determination’, stating that these articles ‘do not apply to a section of people within a sovereign and independent state’. The convention on genocide remains unsigned, although Indonesia did incorporate an article on genocide into its 2000 Human Rights Law.
6.4 Social Exclusion
As already noted, since the prospect of an independent Indonesia was first mooted, fears of Javanese domination by those who lived in the outer islands were already being expressed. Contemporary scholars also noted this ‘basic Indonesian problem’, inherited from the colonial period, of a ‘top-heavy bureaucracy, originating and centered in Java’ with economic resources distributed richly across the outer islands (van der Kroef 1958: 80). Ironically, Javanese domination of the central state and, in particular, the military, was increased by the regional rebellions of the early decades as the Javanese officers and troops that suppressed such insurgencies became the ‘de facto occupiers and controllers’ of the rebel regions (Anderson 1983: 483).
Under Suharto, the appointment of positions of local power by the central state in Jakarta resulted throughout the archipelago in an increasing political dominance of Javanese, particularly retired military officers who were often appointed as provincial governors or district bupati. In addition, at the socio-economic level, the transmigration programme and the associated informal migration was an important source of social exclusion and horizontal inequalities in the outer islands. The programme impacted on local ethnic groups and horizontal inequalities in two ways. Firstly, the deforestation that accompanied the programme’s settlement practices displaced smaller, migratory local communities and deprived them of their livelihoods. The World Bank’s assessment of the Transmigration II settlement, which it had partly funded, noted that it had ‘a major and probably irreversible negative impact’ on the Kubu ethnic groups (World Bank 1994: 22). Secondly, the transmigration programme exacerbated rural ethnic inequalities and tension by assigning to the mostly Javanese transmigrants prime land, often in substantially larger family plots than those owned by local residents (e.g. Leith 1998). Figure 3 shows the distribution of landholdings among agriculturalists in the outer islands (i.e. all of Indonesia except Java and Bali), according to broad region of birth – i.e.
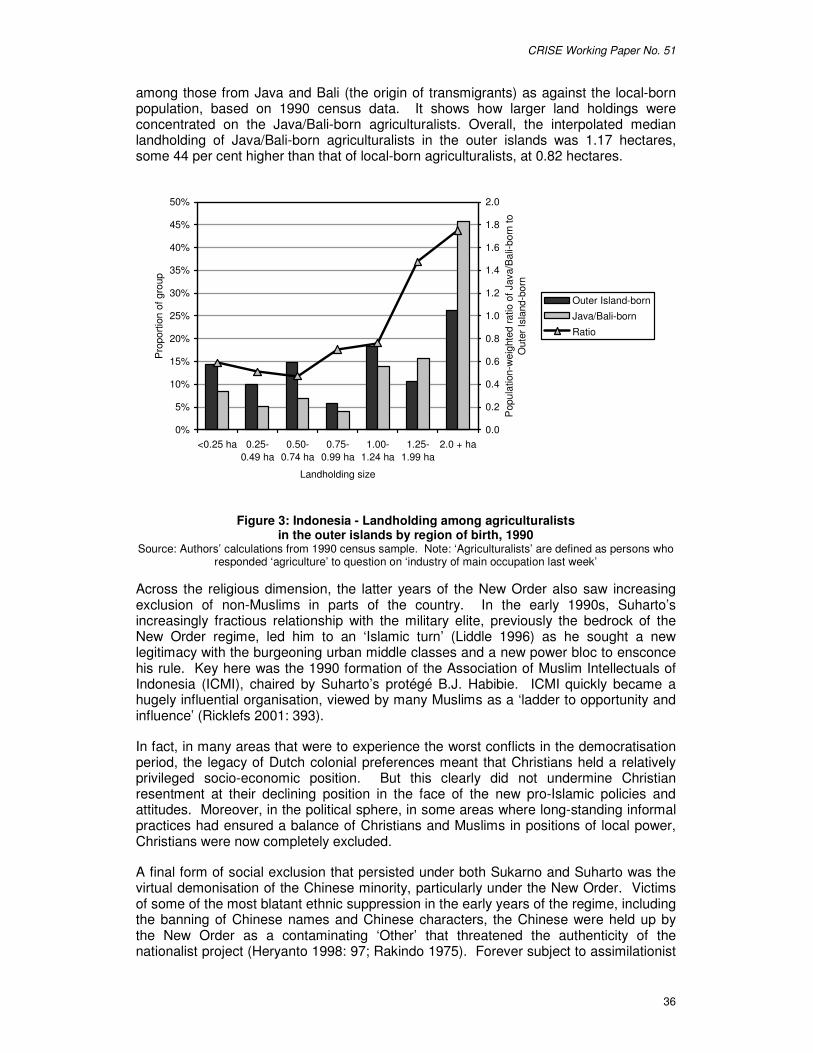
CRISE Working Paper No. 51
36
among those from Java and Bali (the origin of transmigrants) as against the local-born population, based on 1990 census data. It shows how larger land holdings were concentrated on the Java/Bali-born agriculturalists. Overall, the interpolated median landholding of Java/Bali-born agriculturalists in the outer islands was 1.17 hectares, some 44 per cent higher than that of local-born agriculturalists, at 0.82 hectares.
0%
5%
10%
15%
20%
25%
30%
35%
40%
45%
50%
<0.25 ha 0.25-0.49 ha
0.50-0.74 ha
0.75-0.99 ha
1.00-1.24 ha
1.25-1.99 ha
2.0 + ha
Landholding size
Pro
porti
on o
f gro
up
0.0
0.2
0.4
0.6
0.8
1.0
1.2
1.4
1.6
1.8
2.0
Pop
ulat
ion-
wei
ghte
d ra
tio o
f Jav
a/B
ali-b
orn
to
Out
er Is
land
-bor
n
Outer Island-born
Java/Bali-born
Ratio
Figure 3: Indonesia - Landholding among agriculturalists in the outer islands by region of birth, 1990
Source: Authors’ calculations from 1990 census sample. Note: ‘Agriculturalists’ are defined as persons who responded ‘agriculture’ to question on ‘industry of main occupation last week’
Across the religious dimension, the latter years of the New Order also saw increasing exclusion of non-Muslims in parts of the country. In the early 1990s, Suharto’s increasingly fractious relationship with the military elite, previously the bedrock of the New Order regime, led him to an ‘Islamic turn’ (Liddle 1996) as he sought a new legitimacy with the burgeoning urban middle classes and a new power bloc to ensconce his rule. Key here was the 1990 formation of the Association of Muslim Intellectuals of Indonesia (ICMI), chaired by Suharto’s protégé B.J. Habibie. ICMI quickly became a hugely influential organisation, viewed by many Muslims as a ‘ladder to opportunity and influence’ (Ricklefs 2001: 393).
In fact, in many areas that were to experience the worst conflicts in the democratisation period, the legacy of Dutch colonial preferences meant that Christians held a relatively privileged socio-economic position. But this clearly did not undermine Christian resentment at their declining position in the face of the new pro-Islamic policies and attitudes. Moreover, in the political sphere, in some areas where long-standing informal practices had ensured a balance of Christians and Muslims in positions of local power, Christians were now completely excluded.
A final form of social exclusion that persisted under both Sukarno and Suharto was the virtual demonisation of the Chinese minority, particularly under the New Order. Victims of some of the most blatant ethnic suppression in the early years of the regime, including the banning of Chinese names and Chinese characters, the Chinese were held up by the New Order as a contaminating ‘Other’ that threatened the authenticity of the nationalist project (Heryanto 1998: 97; Rakindo 1975). Forever subject to assimilationist

CRISE Working Paper No. 51
37
policies, they were thus denied the ability to assimilate fully – for instance, alone amongst Indonesian citizens, they were obliged to have their ethnicity marked on their identity cards – and thus remained the perennial political outsiders. Once again, these processes of exclusion provided the spark – or outlet – for much of the violence of the democratisation periods, with anti-Chinese riots in Jakarta and Solo on the island of Java claiming some 2,000 lives.
6.5 Conclusions: Strong but fragile
The Indonesian experience provides important insights for the application of a concept of state fragility. In common parlance, as well as in the restricted definition of state fragility used by actors such as DfID, there was little ‘fragile’ about the New Order regime – an entrenched, highly durable regime that was able to deliver significant improvements in service delivery, at least in aggregate terms. Yet when the regime collapsed, the country was engulfed by all forms of fragility: service delivery contracted; state authority was challenged across the country; and state legitimacy also suffered. The argument made in this paper is that all these developments can be traced to particular practices and policies pursued by the New Order regime. In many ways, the experience of Indonesia under the New Order echoes de Tocqueville’s reflections on the ‘strong’ state in ancien régime France, which was able to withstand social pressures for an extended period, but when it finally gave way, the built-up tensions resulted in revolution. In a similar way, the New Order regime was, primarily through its military strength, able to suppress the social and communal discontents, exclusion and inequalities that accompanied, and were largely attributable to, its rule, but when it finally collapsed, it unleashed all the destructive social forces pent up during this period. In this sense, the New Order was a fragile state.
From a human rights perspective, the New Order regime exhibited a kind of vicious cycle of state fragility and human rights abuses. In regions such as Aceh and East Timor, a vicious cycle ensued between declining or absent state legitimacy, poor service delivery and challenges to state authority, prompting military responses and severe human rights abuses, which only exacerbated further (local perceptions of) the illegitimacy of the regime and undercut service delivery. Elsewhere, the exclusionary practices of the regime created communal tensions which fed into the collapse of state authority at the end of the period. Related to this is a final conclusion from the Indonesian case that emphasises the importance of social exclusion as a driver of state fragility. Even when progressive realisation of service entitlements is good at the aggregate national level, sub-national horizontal inequalities, human rights abuses, and exclusionary practices across communal or regional groups can undermine the legitimacy and, ultimately, authority of the state.

CRISE Working Paper No. 51
38
7 Nepal 7.1 Introduction
The Nepalese case explored in this paper is an exemplary case of state fragility, whereby enduring state failure in service delivery, with particularly high levels of social exclusion, led to a Maoist rebellion and a significant loss of state authority as large parts of the country fell under rebel control. In response, the King abrogated parliament and declared a State of Emergency, stating that the democratic system was unable to cope with the insurgency, taking executive power into his own hands. In doing so, however, he merely undermined state legitimacy and gave extra ammunition to the Maoists. In spring 2006, he was forced to restore parliament and prospects are high that a permanent settlement to the conflict can be reached. Nonetheless, Nepal remains fragile in service delivery, and is burdened with very high international debt.
One of the poorest and least developed countries outside of Africa, Nepal has a complex demographic make-up, combining elements of ethnicity and of caste. The largest two ethnic groups are the Parbatiyas (around 40 per cent of the population) and the Newar (5.6 per cent). The world’s only officially Hindu country, caste has long played a very important role alongside ethnicity, with most of the major ethnic groups divided into castes – including some Buddhist castes.
Table 11: Nepal - ethnic and caste demography
Per cent of total population
Per cent of subgroup
Parbatiyas (Nepali-speaking) 40.3 Brahmins 12.9 32.0 Thakuris 1.6 4.0 Chetris 16.1 40.0 Renouncer castes 1.0 2.5 Untouchable castes 8.7 21.6 Newars 5.6 Pure caste groups 2.2 39.3 Other pure castes 3.0 53.6 Impure castes 0.4 7.1 Other hill or mountain ethnic groups 20.9 Magars 7.2 34.4 Tamangs 5.5 26.3 Rais 2.8 13.4 Gurungs 2.4 11.5 Others 3.0 14.4 Madeshis (North Indian dialect speaking) 32.0 Pure caste groups 10.0 31.3 Impure castes 1.7 5.3 Untouchable castes 2.8 8.8 Non-caste ethnic groups 9.0 28.1 Muslims 3.3 10.3
Source: Adapted from Whelpton (2005: pp.9-10)
7.2 Dimensions of Fragility
7.2.1 State Authority
Until the 1990s, the greatest challenge to Nepal’s state authority was maintaining its integrity against its two giant neighbours, China and India; in the 18th century, the Nepalese king Prithvi Narayan Shah described his country as ‘a yam between two

CRISE Working Paper No. 51
39
boulders’. Politically squashed, Nepal has also been economically dependent upon the two countries, particularly India; the agitation that led to the democratic transition of 1990 was largely a response to a blockade imposed by India. Tensions continue with India over the status and future of the Indian population in Nepal and the Nepalese-speaking population in India, particularly around Darjeeling – a product of the amorphous borders during the pre-modern period and the signing of an agreement between India and Nepal in 1950 allowing free movement of labour between the two countries (Parmanand 1986).
While Nepal remained broadly territorially intact until the emergence of the Maoist insurgency in the mid-1990s, a number of smaller challenges did emerge. Domestically, although a number of smaller ethnic groups occasionally revolted, as the Limbu did around the end of the Rana regime in 1950/51, these were very limited and posed no substantial threat to the state authority. A more serious insurgency followed the King’s takeover of power in 1961, when an India-backed guerrilla force of some 3,000 soldiers launched raids across the border. The insurgency failed to gain any territorial control, however, and was called off after the outbreak of the India-China war in 1962 led India to take a more sympathetic stance to the Nepalese regime (Whelpton 2005: 99).
An incipient threat to the state’s internal authority, based on perceptions of its illegitimacy, did however arise in the communist movement. Nominally banned along with other political parties through the panchayat period, although still very active, the communist movement was bedevilled by doctrinal and practical disputes that saw it schism into a multitude of smaller parties, including the Communist Party of Nepal (Maoist) – CPN(M) – that was later to launch an insurrection against the government. Among other factors dividing the parties – such as their stance towards China – was a dispute about whether the victory of Communism in Nepal could be achieved through democratic means or only through a revolutionary war. A hard-line of smaller parties advocated the latter, although mobilisation for violence did not emerge until the mid 1990s (Khadka 1995). Communist groups were, however, instrumental in the street protests at the end of the 1980s that forced democratic change upon the regime.
The eventual declaration of the ‘People’s War’ and the emergence of a significant threat to the state’s authority in 1996 can be traced to a number of factors. Within our framework here, however, two important factors stand out. Firstly, the insurgency derived considerable mobilising strength from the severe socio-economic inequalities in Nepal between caste and ethnic groups, and between regions (Gates and Murshed 2005; Macours 2006). These inequalities will be dealt with further below, but the important point here is that state fragility in the authority dimension in Nepal emerged as a direct consequence of a combination of social exclusion manifest as prior fragility in both the service delivery dimension – services were inadequately and inconsistently provided across the country – and the legitimacy dimension – the state’s legitimacy suffered as a result of this social exclusion and horizontal inequality. The second important factor contributing to the emergence of the Maoist rebellion was the failure of the post-1990 democratic system to generate a strong and coherent government, and the subsequent rapid disillusionment of many Nepalese with democratic forms of government. Again, this relates the emergence of state fragility in the authority dimension to a prior fragility in the legitimacy dimension.
The insurgency emerged first in one of the poorest regions of Nepal, and gained particular support from the Magar tribal group in the area (Center for Human Rights and Global Justice 2005: 17). The insurrection began with a series of guerrilla-style attacks on unprepared police posts, allowing the Maoists to quickly develop an arsenal of weaponry. By 2001, the Maoists had taken control of much of the western area of the country: up to 22 of the 75 districts in Nepal (HRW 2004). Nonetheless, casualties remained relatively low – the Maoists claimed an estimated 500 victims in the first five
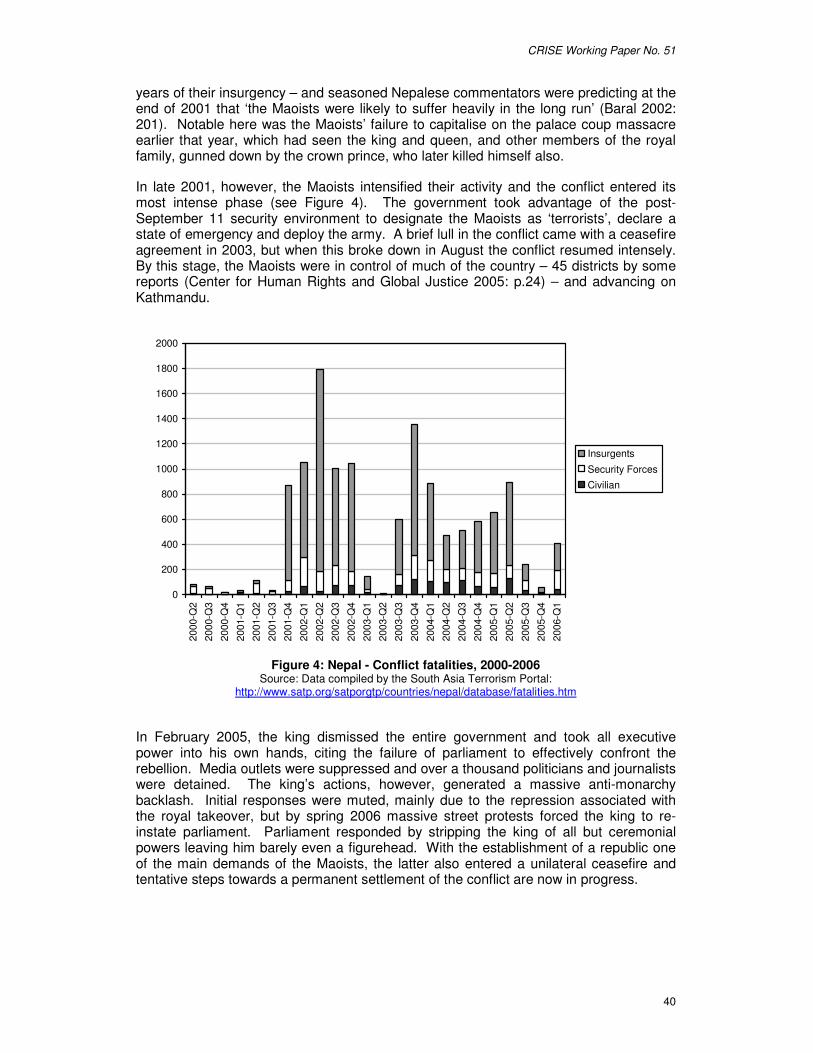
CRISE Working Paper No. 51
40
years of their insurgency – and seasoned Nepalese commentators were predicting at the end of 2001 that ‘the Maoists were likely to suffer heavily in the long run’ (Baral 2002: 201). Notable here was the Maoists’ failure to capitalise on the palace coup massacre earlier that year, which had seen the king and queen, and other members of the royal family, gunned down by the crown prince, who later killed himself also.
In late 2001, however, the Maoists intensified their activity and the conflict entered its most intense phase (see Figure 4). The government took advantage of the post-September 11 security environment to designate the Maoists as ‘terrorists’, declare a state of emergency and deploy the army. A brief lull in the conflict came with a ceasefire agreement in 2003, but when this broke down in August the conflict resumed intensely. By this stage, the Maoists were in control of much of the country – 45 districts by some reports (Center for Human Rights and Global Justice 2005: p.24) – and advancing on Kathmandu.
0
200
400
600
800
1000
1200
1400
1600
1800
2000
2000
-Q2
2000
-Q3
2000
-Q4
2001
-Q1
2001
-Q2
2001
-Q3
2001
-Q4
2002
-Q1
2002
-Q2
2002
-Q3
2002
-Q4
2003
-Q1
2003
-Q2
2003
-Q3
2003
-Q4
2004
-Q1
2004
-Q2
2004
-Q3
2004
-Q4
2005
-Q1
2005
-Q2
2005
-Q3
2005
-Q4
2006
-Q1
Insurgents
Security Forces
Civilian
Figure 4: Nepal - Conflict fatalities, 2000-2006
Source: Data compiled by the South Asia Terrorism Portal: http://www.satp.org/satporgtp/countries/nepal/database/fatalities.htm
In February 2005, the king dismissed the entire government and took all executive power into his own hands, citing the failure of parliament to effectively confront the rebellion. Media outlets were suppressed and over a thousand politicians and journalists were detained. The king’s actions, however, generated a massive anti-monarchy backlash. Initial responses were muted, mainly due to the repression associated with the royal takeover, but by spring 2006 massive street protests forced the king to re-instate parliament. Parliament responded by stripping the king of all but ceremonial powers leaving him barely even a figurehead. With the establishment of a republic one of the main demands of the Maoists, the latter also entered a unilateral ceasefire and tentative steps towards a permanent settlement of the conflict are now in progress.
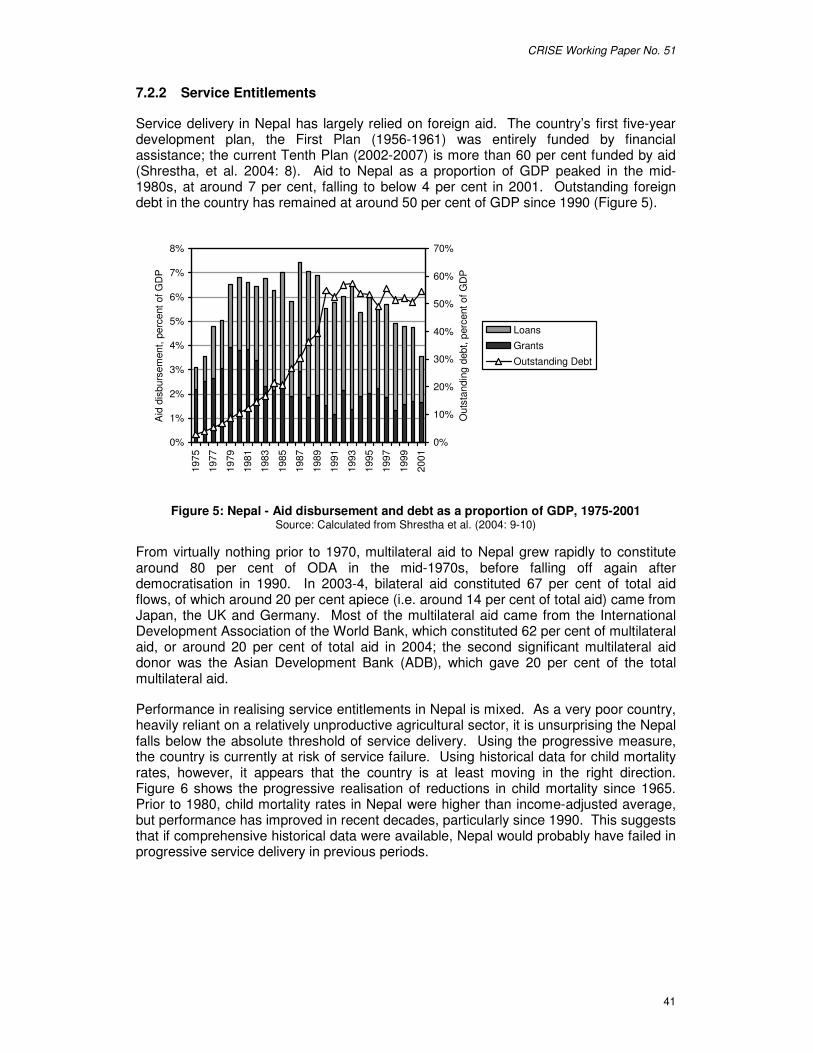
CRISE Working Paper No. 51
41
7.2.2 Service Entitlements
Service delivery in Nepal has largely relied on foreign aid. The country’s first five-year development plan, the First Plan (1956-1961) was entirely funded by financial assistance; the current Tenth Plan (2002-2007) is more than 60 per cent funded by aid (Shrestha, et al. 2004: 8). Aid to Nepal as a proportion of GDP peaked in the mid-1980s, at around 7 per cent, falling to below 4 per cent in 2001. Outstanding foreign debt in the country has remained at around 50 per cent of GDP since 1990 (Figure 5).
0%
1%
2%
3%
4%
5%
6%
7%
8%
1975
1977
1979
1981
1983
1985
1987
1989
1991
1993
1995
1997
1999
2001
Aid
dis
burs
emen
t, pe
rcen
t of G
DP
0%
10%
20%
30%
40%
50%
60%
70%
Out
stan
ding
deb
t, pe
rcen
t of G
DP
Loans
Grants
Outstanding Debt
Figure 5: Nepal - Aid disbursement and debt as a proportion of GDP, 1975-2001 Source: Calculated from Shrestha et al. (2004: 9-10)
From virtually nothing prior to 1970, multilateral aid to Nepal grew rapidly to constitute around 80 per cent of ODA in the mid-1970s, before falling off again after democratisation in 1990. In 2003-4, bilateral aid constituted 67 per cent of total aid flows, of which around 20 per cent apiece (i.e. around 14 per cent of total aid) came from Japan, the UK and Germany. Most of the multilateral aid came from the International Development Association of the World Bank, which constituted 62 per cent of multilateral aid, or around 20 per cent of total aid in 2004; the second significant multilateral aid donor was the Asian Development Bank (ADB), which gave 20 per cent of the total multilateral aid.
Performance in realising service entitlements in Nepal is mixed. As a very poor country, heavily reliant on a relatively unproductive agricultural sector, it is unsurprising the Nepal falls below the absolute threshold of service delivery. Using the progressive measure, the country is currently at risk of service failure. Using historical data for child mortality rates, however, it appears that the country is at least moving in the right direction. Figure 6 shows the progressive realisation of reductions in child mortality since 1965. Prior to 1980, child mortality rates in Nepal were higher than income-adjusted average, but performance has improved in recent decades, particularly since 1990. This suggests that if comprehensive historical data were available, Nepal would probably have failed in progressive service delivery in previous periods.
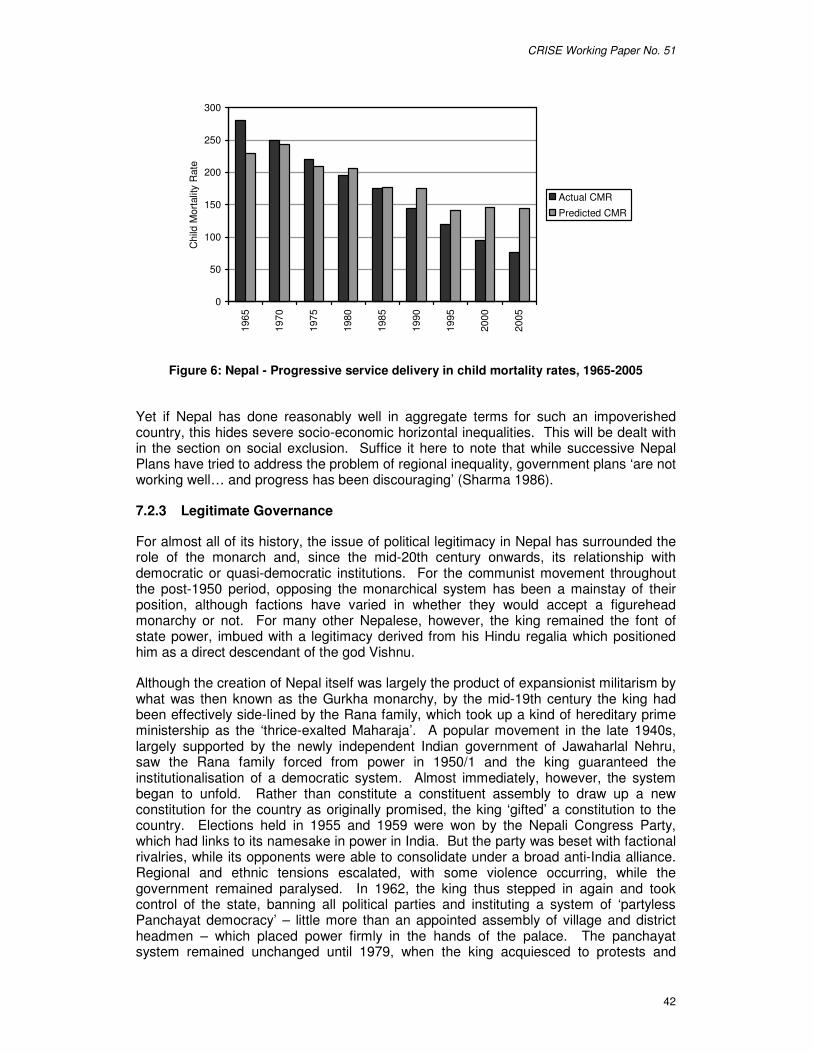
CRISE Working Paper No. 51
42
0
50
100
150
200
250
300
1965
1970
1975
1980
1985
1990
1995
2000
2005
Chi
ld M
orta
lity
Rat
eActual CMR
Predicted CMR
Figure 6: Nepal - Progressive service delivery in child mortality rates, 1965-2005
Yet if Nepal has done reasonably well in aggregate terms for such an impoverished country, this hides severe socio-economic horizontal inequalities. This will be dealt with in the section on social exclusion. Suffice it here to note that while successive Nepal Plans have tried to address the problem of regional inequality, government plans ‘are not working well… and progress has been discouraging’ (Sharma 1986).
7.2.3 Legitimate Governance
For almost all of its history, the issue of political legitimacy in Nepal has surrounded the role of the monarch and, since the mid-20th century onwards, its relationship with democratic or quasi-democratic institutions. For the communist movement throughout the post-1950 period, opposing the monarchical system has been a mainstay of their position, although factions have varied in whether they would accept a figurehead monarchy or not. For many other Nepalese, however, the king remained the font of state power, imbued with a legitimacy derived from his Hindu regalia which positioned him as a direct descendant of the god Vishnu.
Although the creation of Nepal itself was largely the product of expansionist militarism by what was then known as the Gurkha monarchy, by the mid-19th century the king had been effectively side-lined by the Rana family, which took up a kind of hereditary prime ministership as the ‘thrice-exalted Maharaja’. A popular movement in the late 1940s, largely supported by the newly independent Indian government of Jawaharlal Nehru, saw the Rana family forced from power in 1950/1 and the king guaranteed the institutionalisation of a democratic system. Almost immediately, however, the system began to unfold. Rather than constitute a constituent assembly to draw up a new constitution for the country as originally promised, the king ‘gifted’ a constitution to the country. Elections held in 1955 and 1959 were won by the Nepali Congress Party, which had links to its namesake in power in India. But the party was beset with factional rivalries, while its opponents were able to consolidate under a broad anti-India alliance. Regional and ethnic tensions escalated, with some violence occurring, while the government remained paralysed. In 1962, the king thus stepped in again and took control of the state, banning all political parties and instituting a system of ‘partyless Panchayat democracy’ – little more than an appointed assembly of village and district headmen – which placed power firmly in the hands of the palace. The panchayat system remained unchanged until 1979, when the king acquiesced to protests and

CRISE Working Paper No. 51
43
allowed direct elections to the national panchayat – although political parties were still banned and additional royal nominees ensured the palace retained control over the assembly. Resurgent protests in the late 1980s forced the king to introduce full multi-party democracy in 1991, with the first full elections held in 1994. Unfortunately, the second democratic period did not differ significantly from the prior period, with inter- and intra-party rivalries all but paralysing the government and making aid delivery all the more problematic.
As already mentioned, another perennial problem for state legitimacy has been Nepal’s problematic relationship with its neighbours, particularly India. Virtually dependent upon India for trade, there has been considerable popular resentment against governments seen as kowtowing to New Delhi. Both democratic transitions in the country, in 1950 and 1990, grew out of protest movements which had their origins in Indian boycotts of trade with Nepal. After the collapse of the Rana regime, Nepal moved to improve its relations with China in an attempt to lessen its dependence upon India (Garver 1991). But India has remained a major influence on Nepal both domestically and in its international relations.
7.3 Human Rights Realisation
Human rights realisation in Nepal has been a long and problematic struggle. As already noted, the basic conception of citizenship and governance in Nepal through most of its history has been one in which the monarchy was paramount and citizenship roles thus ‘emphasised obligations rather than rights or privileges… Each person has a recognised function which is inherited as a member of a group rather than as a personal choice’ (Deosa Rai 1981: 41). This was codified in the 1854 Muluki Ain civil code (see below). Such a concept of inherited duties and roles clearly runs directly contrary to the concepts of individual freedoms at the heart of modern human rights. In recent years, however, unswerving respect for the monarchy has declined, particularly following the palace massacre and the king’s unilateral abrogation of parliament. In a national survey conducted in 2004, a majority of respondents (63 per cent) favoured a constitutional monarchy, although more than one in five (22 per cent) still favoured an ‘active’ monarchy (Hachhethu 2004).
The post-1960 panchayat regime ratified the first two major conventions on human rights – CPPCG and CERD – in 1969 and 1971 respectively, but ratification of all the conventions had to wait until democratisation in 1990, after which they were ratified in quick succession. Certainly in the case of CERD, however, ratification of the treaty was not accompanied by any serious efforts in this regard. Issues of caste and ethnic discrimination are dealt with in the section on social exclusion below.
In a country where more than 80 per cent of employment is agricultural (WDI data), realisation of economic rights has largely been a matter of land reform. The country’s first Five Year Plan (1956-61) noted that the democratic system had ‘inherited an agrarian system which fails, in important respects, to protect the rights and interests of those who work on the land’ (quoted in Regmi 1961: 32). Concentration of landholding in the hands of feudal lords had resulted in extremely weak tenancy rights and very small landholdings for those among the population who had their own land. A series of land reform acts passed between 1956 and 1964 have improved tenancy rights, but landholdings remain small. As is illustrated below, this became a major issue in the outbreak of the Maoist insurgency.

CRISE Working Paper No. 51
44
7.4 Social Exclusion
Nepal is a highly diverse country, with many interlocking identity groups – caste, ethnic, religious, regional and linguistic (Whelpton 2005). In 1854, an official Civil Code (Muluki Ain) formalised the Hindu caste hierarchy and, in a marked difference from the Indian experience, attributed each non-caste group – indigenous Janajati ethnic groups and others, such as Muslims – an explicit place within this hierarchy (Höfer 1979). Although the democratic constitution of 1990 expressly forbade discrimination on caste grounds, caste remains a significant barrier to social mobility, particularly for the ‘untouchable’ Dalit castes; a recent survey of caste discrimination found that almost half (46.4 per cent) of Dalit respondents encountered difficulty selling milk from their cattle due to their untouchable status (Johnsen 2002; quoted in Prandan and Shrestha 2005: 8). The UN Committee on the Elimination of Racial Discrimination has noted that while ‘the caste system in Nepal has been abolished by law… this system still functions and appears embedded in parts of the Nepalese culture’ (CERD 1998: para.10). In addition to caste differentials, ethno-linguistic minorities also suffer severe exclusion. Between 1996 and 2004, poverty dropped by 26 per cent across Nepal, but the non-caste hill janajati groups and Muslims recorded, respectively, drops of only 10 per cent and 6 per cent. In contrast, poverty among the untouchable Dalit caste fell by 20 per cent, although they remain slightly poorer than the janajati and Muslims in absolute terms (Bennett 2005).10
Table 12 reports horizontal inequalities by caste and ethnic group across four dimensions of socio-economic performance in 1996, the earliest available data, collected shortly before the outbreak of the insurgency. Across all four dimensions, the Newar and Brahmin come out clearly and consistently as the top two groups, with the Chhetri third in three dimensions, although they have a poverty rate well above the national average, suggesting that within-group inequality among the Chhetri may be particularly marked. The position of Newar requires some qualification, as more than half the Newar live in the Kathmandu valley, which is their place of origin.
Table 12: Nepal - Horizontal inequalities by major caste and ethnic group across four dimensions (as ratio to national mean), 1996
Per capita
income Poverty rate
(inverted) Adult literacy Mean years of schooling
Caste/Ethnic Group Value Rank Value Rank Value Rank Value Rank Newar 1.558 1 1.818 1 1.492 2 1.939 2 Brahmin 1.293 2 1.311 2 1.580 1 2.062 1 Chhetri 1.009 3 0.909 6 1.144 3 1.236 3 Rajbansi, Yadav, Tharu, Ahir 0.901 4 0.998 4 0.749 5 0.754 5 Gurung, Magar, Sherpa, Rai, Limbu 0.861 5 0.790 7 0.959 4 0.897 4 Muslim 0.826 6 1.185 3 0.602 7 0.602 6 Occupational Castes (Dalit) (a) 0.644 7 0.957 5 0.648 6 0.545 7
Source: Authors’ calculations, based on NESAC (1998); Note: (a) figure for poverty rate among occupational castes includes other non-listed groups.
Using data from the two Nepal Living Standards Survey in 1996 and 2004, Salvi del Pero (2005) examines income inequality between what she terms the ‘majority groups’ – the Brahmin, Chhetri, and Newar – and the rest of the population. Using a Theil decomposition, she find that the between-group component of overall income inequality has trebled over this period. Moreover, even holding for education, landownership and other socio-economic variables, her regression analysis shows that 70 per cent of the gap between the ‘majority groups’ – the Brahmin, Chhetri, and Newar – and the rest of
10 Gender exclusion is also severe; women occupy a very low status in most Nepalese societies, irrespective of ethnicity or caste.
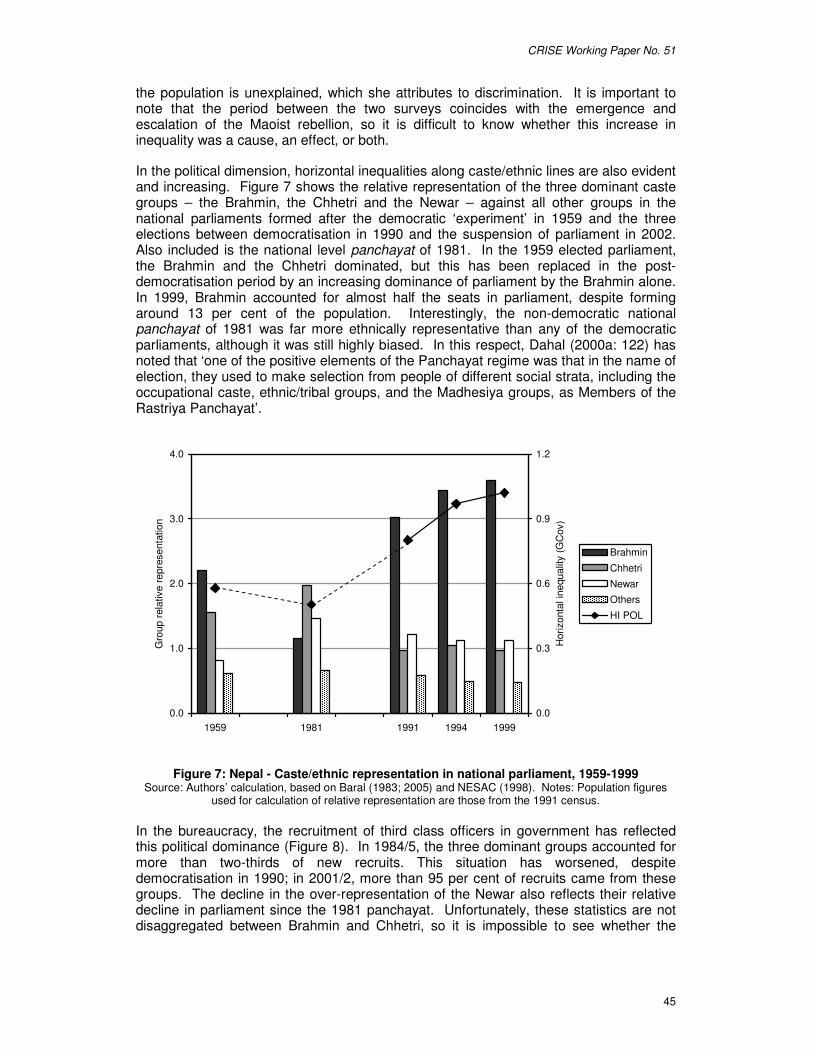
CRISE Working Paper No. 51
45
the population is unexplained, which she attributes to discrimination. It is important to note that the period between the two surveys coincides with the emergence and escalation of the Maoist rebellion, so it is difficult to know whether this increase in inequality was a cause, an effect, or both.
In the political dimension, horizontal inequalities along caste/ethnic lines are also evident and increasing. Figure 7 shows the relative representation of the three dominant caste groups – the Brahmin, the Chhetri and the Newar – against all other groups in the national parliaments formed after the democratic ‘experiment’ in 1959 and the three elections between democratisation in 1990 and the suspension of parliament in 2002. Also included is the national level panchayat of 1981. In the 1959 elected parliament, the Brahmin and the Chhetri dominated, but this has been replaced in the post-democratisation period by an increasing dominance of parliament by the Brahmin alone. In 1999, Brahmin accounted for almost half the seats in parliament, despite forming around 13 per cent of the population. Interestingly, the non-democratic national panchayat of 1981 was far more ethnically representative than any of the democratic parliaments, although it was still highly biased. In this respect, Dahal (2000a: 122) has noted that ‘one of the positive elements of the Panchayat regime was that in the name of election, they used to make selection from people of different social strata, including the occupational caste, ethnic/tribal groups, and the Madhesiya groups, as Members of the Rastriya Panchayat’.
0.0
1.0
2.0
3.0
4.0
1959 1981 1991 1994 1999
Gro
up r
elat
ive
repr
esen
tatio
n
0.0
0.3
0.6
0.9
1.2
Hor
izon
tal i
nequ
ality
(GC
ov)
Brahmin
Chhetri
Newar
Others
HI POL
Figure 7: Nepal - Caste/ethnic representation in national parliament, 1959-1999 Source: Authors’ calculation, based on Baral (1983; 2005) and NESAC (1998). Notes: Population figures
used for calculation of relative representation are those from the 1991 census. In the bureaucracy, the recruitment of third class officers in government has reflected this political dominance (Figure 8). In 1984/5, the three dominant groups accounted for more than two-thirds of new recruits. This situation has worsened, despite democratisation in 1990; in 2001/2, more than 95 per cent of recruits came from these groups. The decline in the over-representation of the Newar also reflects their relative decline in parliament since the 1981 panchayat. Unfortunately, these statistics are not disaggregated between Brahmin and Chhetri, so it is impossible to see whether the

CRISE Working Paper No. 51
46
increased dominance of this group has been particularly in the hands of the Brahmin, as it has been in parliament.
0.00
0.50
1.00
1.50
2.00
2.50
3.00
3.50
4.00
4.50
1985
1987
1989
1991
1993
1995
1997
1999
2001
Rel
ativ
e re
pres
enta
tion
of g
roup
Brahmin and Chhetri
Newar
Tarai castes
Muslims
Janajati and Dalit
Figure 8: Nepal - Representation of caste/ethnic groups in the recruitment of gazetted third class officers, 1984/5-2001/2
Source: Authors’ calculations, based on UNDP (2004a: 178).
In part, this bias is evidence of the problem of the persistence of horizontal inequalities – lower caste and disadvantaged ethnic groups have poorer access to education and thus are less likely to possess the human capital necessary to fill high-ranking positions. Not least here is the requirement to speak Nepali, which is the national language, although it is the mother tongue of only around half the population. The post-democratisation period has seen language and linguistic identity become increasingly politicised, largely for this reason. Thus far, however, a number of legal challenges to the official dominance of Nepali have come to naught (Dahal 2000b).
Whelpton (1997: 50) notes the ‘overwhelming predominance of a Partabiya-Newar elite in Nepalese society’, and the data presented here confirm this analysis. It is clear that across the socio-economic and political dimensions, the Brahmin, Chhetri and Newar enjoy considerable dominance, with the Newar particularly well-off in the economic dimension and the Brahmin increasingly dominant in the political dimension.
Regional inequalities have also attracted considerable attention in Nepal, particularly in the light of the Maoist insurgency. Separate statistical investigations have found that variations in the intensity of the insurgency at the district level are highly correlated with ‘spatial horizontal inequalities’ in level of human development (Gates and Murshed 2005) and with increasing inequalities in land ownership in particular (Macours 2006).
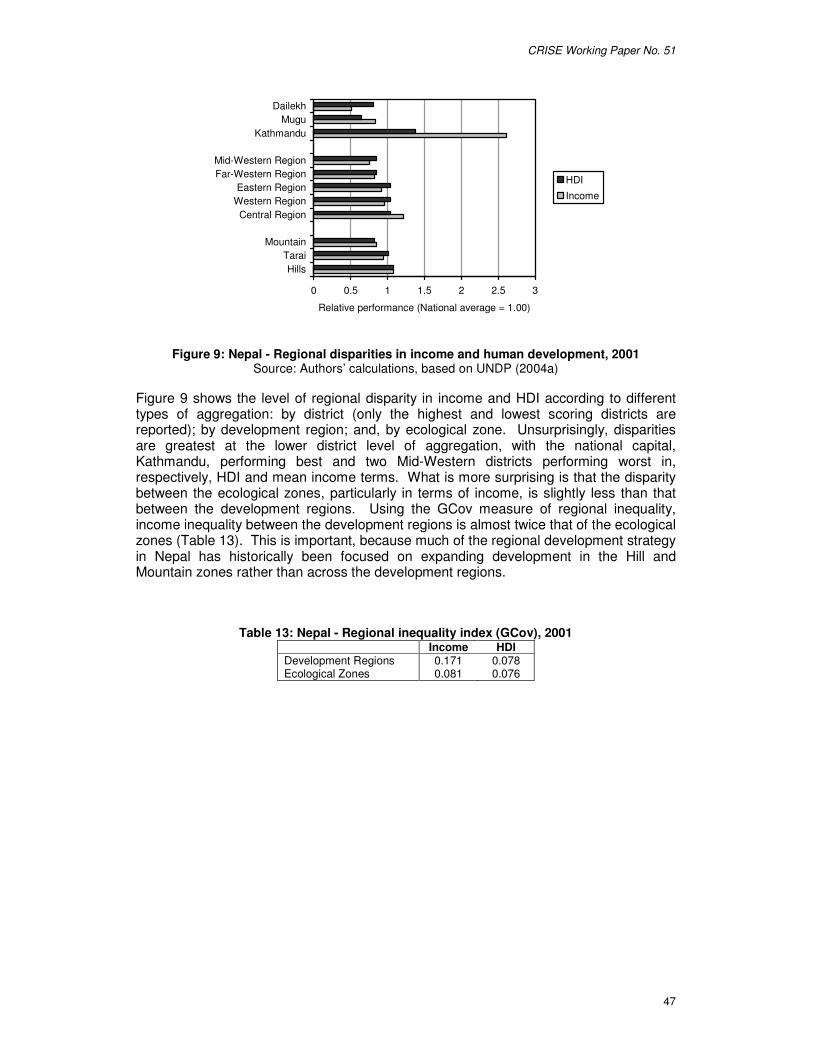
CRISE Working Paper No. 51
47
0 0.5 1 1.5 2 2.5 3
HillsTarai
Mountain
Central RegionWestern RegionEastern Region
Far-Western RegionMid-Western Region
KathmanduMugu
Dailekh
Relative performance (National average = 1.00)
HDI
Income
Figure 9: Nepal - Regional disparities in income and human development, 2001 Source: Authors’ calculations, based on UNDP (2004a)
Figure 9 shows the level of regional disparity in income and HDI according to different types of aggregation: by district (only the highest and lowest scoring districts are reported); by development region; and, by ecological zone. Unsurprisingly, disparities are greatest at the lower district level of aggregation, with the national capital, Kathmandu, performing best and two Mid-Western districts performing worst in, respectively, HDI and mean income terms. What is more surprising is that the disparity between the ecological zones, particularly in terms of income, is slightly less than that between the development regions. Using the GCov measure of regional inequality, income inequality between the development regions is almost twice that of the ecological zones (Table 13). This is important, because much of the regional development strategy in Nepal has historically been focused on expanding development in the Hill and Mountain zones rather than across the development regions.
Table 13: Nepal - Regional inequality index (GCov), 2001 Income HDI Development Regions 0.171 0.078 Ecological Zones 0.081 0.076
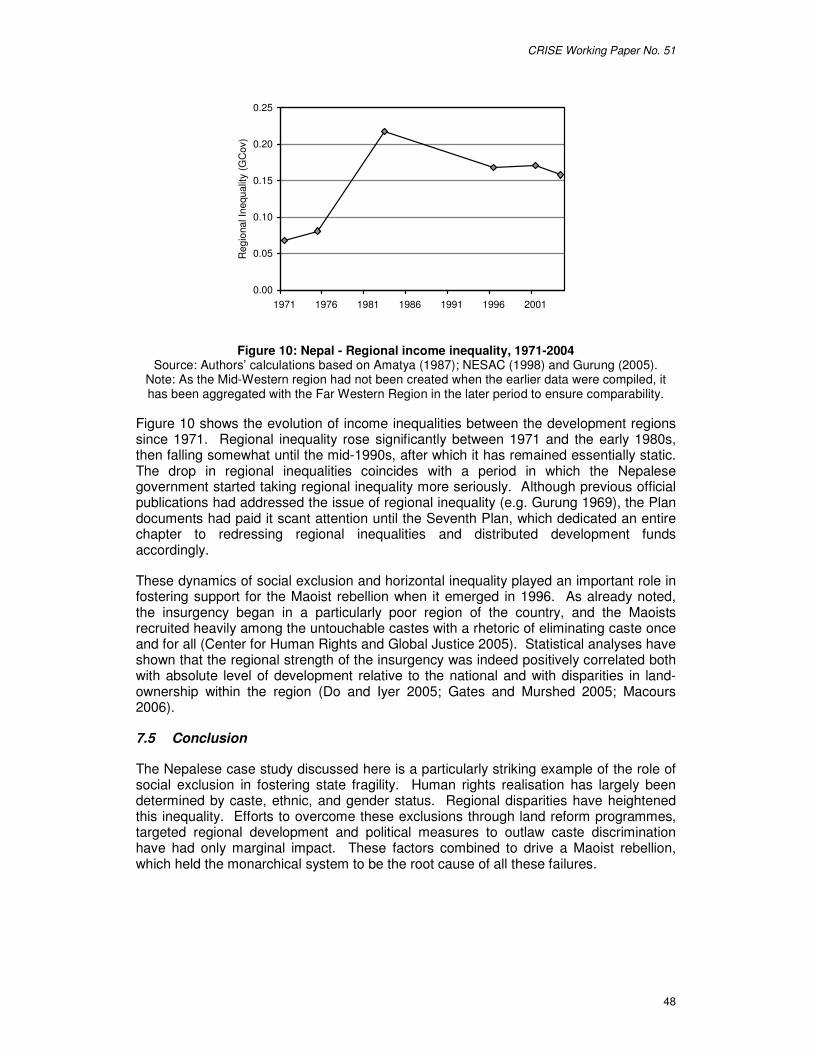
CRISE Working Paper No. 51
48
0.00
0.05
0.10
0.15
0.20
0.25
1971 1976 1981 1986 1991 1996 2001
Reg
iona
l Ine
qual
ity (G
Cov
)
Figure 10: Nepal - Regional income inequality, 1971-2004 Source: Authors’ calculations based on Amatya (1987); NESAC (1998) and Gurung (2005).
Note: As the Mid-Western region had not been created when the earlier data were compiled, it has been aggregated with the Far Western Region in the later period to ensure comparability.
Figure 10 shows the evolution of income inequalities between the development regions since 1971. Regional inequality rose significantly between 1971 and the early 1980s, then falling somewhat until the mid-1990s, after which it has remained essentially static. The drop in regional inequalities coincides with a period in which the Nepalese government started taking regional inequality more seriously. Although previous official publications had addressed the issue of regional inequality (e.g. Gurung 1969), the Plan documents had paid it scant attention until the Seventh Plan, which dedicated an entire chapter to redressing regional inequalities and distributed development funds accordingly.
These dynamics of social exclusion and horizontal inequality played an important role in fostering support for the Maoist rebellion when it emerged in 1996. As already noted, the insurgency began in a particularly poor region of the country, and the Maoists recruited heavily among the untouchable castes with a rhetoric of eliminating caste once and for all (Center for Human Rights and Global Justice 2005). Statistical analyses have shown that the regional strength of the insurgency was indeed positively correlated both with absolute level of development relative to the national and with disparities in land-ownership within the region (Do and Iyer 2005; Gates and Murshed 2005; Macours 2006).
7.5 Conclusion
The Nepalese case study discussed here is a particularly striking example of the role of social exclusion in fostering state fragility. Human rights realisation has largely been determined by caste, ethnic, and gender status. Regional disparities have heightened this inequality. Efforts to overcome these exclusions through land reform programmes, targeted regional development and political measures to outlaw caste discrimination have had only marginal impact. These factors combined to drive a Maoist rebellion, which held the monarchical system to be the root cause of all these failures.
CRISE Working Paper No. 51
49
8 Guatemala 8.1 Introduction
Guatemala is a small Central American country (108.889 million km2) sharing borders with Mexico, Belize, Honduras and El Salvador. Guatemala has a population of 12.6 million (2004) that comprise over 25 distinct ethno-linguistic groups, including indigenous or Mayan groups and ladinos. While the number of people who are monolingual in Mayan languages is diminishing fast (11 per cent of the total population and 30 per cent of the total indigenous population), the differences across Mayan languages are notable and the different languages are not understood easily across the various groups. Depending on estimates, indigenous people account for 40 to 60 per cent of the population (Yashar 2005). Guatemala is the least urbanised country of the Americas with 60 per cent of the total population living in rural areas (2002 population census). Historically, agriculture dominated the activities of the country including subsistence, domestic and agro export sectors. Agriculture still accounts for a quarter of GDP and employs over 36 per cent of all workers. The economy is still heavily dependent on exports of coffee and sugar, notwithstanding some success in promoting non-traditional exports (World Bank/GUAPA 2003). In spite of the current crises and a sharp fall in international prices, coffee still accounts for over 25 per cent of export earnings. Sugar, bananas and cardamom follow as the principal cash crops and all of the main export crops. The Guatemalan economy however is slowly changing and diversifying. Over the past decade the maquila sector (free-trade assembly and re-export zones), mining, energy, commerce, and services have all grown fairly rapidly (Sieder 2002: 42-48). Tourism strengthened in the 1990s and now exceeds coffee or sugar as the main source of foreign exchange. Table 14 illustrates how the overall structure of the economy is changing.11
Table 14: Guatemala - structure of the economy, 1994 and 2004 (% of GDP) 1994 2004 Agriculture 24.5 22.3 Industry Manufacturing
19.7 14.3
19.3 12.8
Services 55.8 58.5 Source: World Bank (2005b)
Another trend to emerge over the past 10 years has been a steady increase in the number of Guatemalans who migrate to the US. Reliable figures for illegal international migration are notoriously hard to find but a recent survey undertaken by CRISE on a limited sample of 600 individuals in four distinct rural and urban locations revealed that 18 per cent or our respondents had relatives living in the US. Further evidence of the growing importance of international migration is that remittances have displaced agriculture and tourism as the largest source of foreign exchange in the country.12
11 In 2000, Agriculture employed 36 per cent of workers aged 15 and above, followed by commerce (22 per cent), public and community administration work (16 per cent) and manufacturing (14 per cent). All other sectors employed less than 10 per cent of the working population (Vakis 2003). 12 Suspiciously, the dramatic increase in the volume and value of remittances in Guatemala occurred precisely at a time of tightening controls over money laundering activities (e.g. post 9/11). Annual figures on workers remittances increased from $592.3 million in 2001 to $1,579.4 million in 2002 (figures from the IMF, compiled in the World Development Indicators, 2004).
CRISE Working Paper No. 51
50
8.2 Dimensions of fragility
8.2.1 State authority
The political history of Guatemala is dominated by authoritarianism and political exclusions. First, Guatemala experienced three centuries of Spanish colonial rule (1524-1821) that segregated the Spaniards and their Criollo descendents from the indigenous and mestizo population. Independence brought some gains for the Criollo elites and later for the ladino/mestizo population, but the promises of equal citizenship did not materialise for the majority of the indigenous population. In addition, between Independence (1821) and 1985 (transition to democracy) political power was concentrated in the hands of a few individuals or groups. A notable exception was a short-lived democratic opening between 1944 and 1954, which came to an abrupt end when oligarchic and US private interests were threatened by agrarian reforms and nationalisations. The US-assisted coup returned the country into the hands of the far right parties of the Guatemalan oligarchy. The latter, however, proved unable to govern effectively and political control passed into the hands of the Guatemalan armed forces. By the 1960s, Guatemala had descended into an armed conflict that pitted leftist guerrillas against a ferociously exclusionary state. The Guatemalan conflict lasted 36 years in total, reaching a peak of intensity between the mid 1970s and mid 1980s. With few legal avenues of participation, the 1970s saw a dramatic increase in political polarisation with mass mobilisation of students, workers and peasants. Increased state repression further reduced political space, contributing to a swelling of the ranks of the insurgent guerrillas.13 By the early 1980s, the armed forces abandoned all pretence of restraint and undertook a campaign of mass militarisation and repression, especially in the indigenous highlands of Guatemala. Targeting a civilian population it suspected of sympathising with the insurgents, the armed forces carried out over 600 separate massacres in the rural areas of Guatemala, in cases killing entire communities. Guatemala gained an international pariah status during this period with countries such as Spain cutting off all diplomatic ties and the US Congress voting to suspend all military aid to Guatemala.
Nonetheless, the military campaign was largely successful in as far as by 1983, the guerrillas no longer had the capacity to overthrow the state. However, the military were also unable to eradicate the insurgents completely and a ‘low intensity’ conflict endured until 1996. Between 1985 and the signing of the peace accords, Guatemala officially returned to democratic rule (fair elections took place in 1985), but parties of the left were still unable to participate and the country remained largely under de facto military control.
During much of its recent history, then, state authority in Guatemala has been failing in the authority dimension of state fragility. While state authority was broadly restored by 1983 – albeit through the use of brutal force and massive violations of human rights – this was at the expense of much state legitimacy. Moreover, nothing was done to address the service delivery failures that resulted from centuries of exclusionary practices until the signing of the peace accord in 1996.
8.2.2 Service Entitlements
Table 15 and Table 16 (below) summarise some key socio-economic indicators for Guatemala. Guatemala is a mid income earning country that currently enjoys a degree of economic and financial stability (growth is steady and inflation is under control). The tables highlight some recent improvements in the social performance of Guatemala,
13 The appeal and profile of revolutionary struggle also increased dramatically following the overthrow of the dictatorship of Somoza in nearby Nicaragua.

CRISE Working Paper No. 51
51
including in reducing and infant mortality and in the steady growth of social expenditure as a percentage of GDP (from 3.6 to 5.6 per cent of GDP in 2005 according to CEPAL). In spite of these however, the high Gini index, low HDI ranking and a series of social indicators that are at odds with the relatively strong economy all point to the fact that the fruits of this strength remain in a few hands. For instance, despite steady improvements, the level of adult illiteracy remains one of the highest in the Americas (only Haiti is a worst performer in the region) and social spending as a percentage of GDP remains one of the lowest, well below the regional average of 13.1 per cent (CEPAL 2005: 119).14 While the percentage of the population living on less than $1 and $2 a day (16 per cent and 35 per cent respectively) is noticeably lower than in the other countries examined here, Guatemala shows the highest rate of poverty in terms of the national poverty line (at 55 per cent). Finally, the agrarian crisis resulting from the collapse of coffee prices at the turn of the century has taken a heavy toll on the country, with poverty rates increasing again after 1998. The recent damage occasioned by tropical storm ‘Stan’ in October 2005 (which badly damaged the road networks and existing crops) compounded by heavy rainfall in May and June 2006 and the ongoing political paralysis do not bode well for the immediate future of poverty or inequality reduction in Guatemala.
Table 15: Guatemala - Key social and economic indicators, 1998 – 2003 1998 2000 2003 GDP/ capita (PP$) 3505 3821 4148 HDI Ranking 120 117 Gini Index* 48-59.9 Life expectancy at birth 64 64.8 67.3 Adult Literacy rate 67.3 68.6 69.1 Infant Mortality at birth ** 39 35 Population with daily income below US$1 (1993 PPP) (%)*** 10 16 Population with daily income below US$2 (1993 PPP) (%)*** 37.4 Population Below the National Poverty Line 56.2 Freedom House Political Rights Index 4 4
All indicators are for years 1998, 2000 and 2003, except infant mortality rate; Source: UNDP global Indicators (http://hdr.undp.org, 2000, 2002 and 2005), CEPAL, Social Panorama of Latin America 2005. Notes: *The UNDP, CEPAL and the World Bank all have different estimates for the Gini index of Guatemala, despite all using the same base year and dataset (the 2000 household survey ENCOVI). The World Bank figure is 48, the UNDP 59.9 and CEPAl 52.9. The IADB also uses the UNDP figure. Elsewhere in our sample of countries, the WB and UNDP are either the same or very similar; ** infant deaths per 1,000 live birth, World Health organisation (www.prb.org); ***1983-2000 and 1990-2003 respectively.
Table 16: Guatemala – selected socio-economic indicators, 1989 – 2005
Annual growth in GDP (%)
Social spending (% GDP)
Fiscal revenue (% GDP)
1989-94 4.11 3.8 8.63 1998 4.99 5.75 9.8 2002 3.86 6.27 11.87 2005 3.26 6.53 11.22
Source CEPALSTATS, online database.
Politically, economically and financially the past 10 years have been deceptively stable in Guatemala (helping to produce some improvements in some of the indicators highlighted in Table 15). However, the foundations of the current stability of the country are not so solid. There are new and historical sources of fragility that need to be
14 The unweighted regional average is of 13.1 per cent of GDP, the weighted regional average is 15.1 per cent of GDP, CEPAL, Panorama Social de las Americas, 2005:119.

CRISE Working Paper No. 51
52
addressed in order to transform today’s relative stability into solid bases for the future. One long-standing issue in Guatemala is that the commitment of the Guatemalan state to the socio-economic well-being of the population has been minimal. The influential Guatemalan ‘private sector’ or economic elite has tended to oppose or resist state socio-economic reform, chiefly on the grounds that the financial burden of such spending would fall most heavily on the wealthier sectors of Guatemalan society. This has been evident in two key areas: in the elite opposition to land reform (a taboo in Guatemala since the counterrevolution of 1954) and in tax evasion. However, although agrarian issues remain important in Guatemala (poverty and extreme poverty are predominantly a rural phenomenon), land reform is no longer the central issue in the analysis of rural development and the issue is not discussed further here. As far as social reform is concerned, opposition has been particularly strong among the landed elite that relied on maintaining a vast pool of impoverished temporary workers in order to compete successfully on the international coffee and sugar markets. Anti-communism and the cold war provided a degree of ideological underpinning as well as important US support for the position of the elite.15 The changing Guatemalan economy and the emergence of a ‘modernising’ sector in the Guatemalan elite has led to a relaxation in these postures and at present most members of the elite privately endorse improved access to education. Yet, if attitudes amongst the Guatemalan elite are changing the refusal to accept a minimal tax burden remains as ferocious as ever (see Table 16). Indeed, constraints on fiscal revenue have become one of the chief issues in contemporary Guatemala. On the one hand, a key agreement in the peace accords, between the guerrillas and the state, concerned the need to address the socio-economic gaps in Guatemalan society. A second agreement was reached on how to finance increased social spending. Whilst the international community (notably the EU) contributed handsomely to post-conflict reconstruction packages, the Guatemalan state agreed that social spending needed to be funded and sustained domestically. A series of social targets was established (i.e. for improved literacy, and access to electricity and water networks), to be attained with a combination of high rates of growth (estimated at around 6 per cent per annum, allowing for rapid population increase) and on a fiscal revenue of no less than 12 per cent of GDP. Ten years after the peace accords, the Guatemalan economy has failed to grow as rapidly as earlier envisaged and the fiscal revenue target of 12% of GDP was only achieved in 2007, in the last year of the Berger administration. The Guatemalan private sector organised around a powerful system of chambers of finance and industry has used all its influence and lobbying skills to ensure that the tax burden remains minimal and, as Table 16 illustrates, has encountered remarkable success in the process. Whilst the impact of these poor results was somewhat cushioned by generous post-conflict packages, such sources of revenues are now rapidly diminishing. A clear source of fragility identified here is that the Guatemalan state has failed to establish sustainable sources for financing social spending.
8.2.3 Legitimate Governance
The Guatemalan dual transition – from dictatorship to democracy and, from war to peace – is still very recent. On the one hand, there is no credible threat of political violence flaring up again in the near future in Guatemala (the guerrillas are largely a spent force). In addition, it is essential to note that political repression and politically motivated human right abuses have greatly abated since the early 1990s. But at the same time the political party system that has emerged since 1985 is still fluid, with many parties disappearing between electoral processes (no party has won successive elections since
15 The anti-reformist posture of the Guatemalan elite has long been noted by the development community and even ran contrary to the precept of the US sponsored ‘alliance for progress’, but the cold war logic of maintaining alliances with key domestic actors in Central America (i.e. elites and armed forces as a line of defence against ‘communist threats’) superseded all other concerns.
CRISE Working Paper No. 51
53
1985) and there are few ideological differences between the main electoral contenders.16 The post-war political environment is characterised by divisions and lack of unity among all the main political actors (Sieder et al.. 2002). This is the case for the former parties of the right (the parties with ties to the influential private sector have subdivided into at least three distinct factions, whilst former military personnel run two important parties).17 The left and former guerrillas have encountered even less success, fracturing bitterly with each electoral process and now verging on electoral insignificance.18 Patronage and clientelism still dominate political proceedings, favouring candidates or parties that have access to large electoral funds that deliver instant gratification at election time (from roofing material to T-shirts and baseball caps) but not much more. Wealthy candidates to congress tend to ‘invest’ important sums in party coffers around election time that are later recuperated through bribes or contracts for their own enterprises. Politicians have few ties or loyalties to their parties, frequently changing political affiliation between and during electoral terms (43 per cent of the deputies changed their party affiliation during the Berger presidency, 2004-2008).19
Thus, on the surface, the trappings of a democratic order are present in Guatemala (free and fair elections do take place) but few Guatemalans have faith in the current political system and even less in their politicians. In the 2004 Latinobarometro survey, Guatemala scored the lowest level of support for democracy of the whole of Latin America (35 per cent compared to a regional average of 53 per cent; Latinobarometro 2004: 7). The main expression of discontent of Guatemalans in their political system is found in extremely high rates of primary and secondary abstentions in general elections (primary abstention oscillates between 40-60 per cent of the electorates since 1985, Caumartin, forthcoming). This is, of course, a far cry from and an improvement on the polarisation and mass violence of the 1970s and 1980s. The lack of obvious challenges to the current political order lends an air of stability to Guatemalan politics, but stability is clearly not enough. It is important to recall the long authoritarian tradition of Guatemala that has consistently suppressed or weakened democratic institutions, including the political parties. In addition the recent armed conflict demonised and discouraged political participation and organisation (literally under the penalty of death). These dual legacies of war and authoritarianism contribute to paralysing the current political system at a number of levels. First, the Guatemalan population at large lacks the knowledge and practice of how to articulate demands or exert pressure on political representatives and at times is still hesitant to do so (ie there is a legacy of fear). Second, belated and in cases lukewarm commitment to democracy by political actors (both on the left and right); the lack of a political party tradition; the post-war dispersal of political forces and ongoing personalism and clientelism all contribute to a weak and unresponsive party system. There are no actors with clear and coherent political projects, let alone political vehicles currently and none are on the horizon. As things stand, politicians are oblivious of and unresponsive to the needs of their constituents and can continue to be so without impunity, so have little incentive to change. It is important to distinguish between depoliticisation, inertia and paralysis which all contribute to state fragility by weakening and de-legitimising political institutions and the much more benign forms of political ‘stability ‘ that contribute positively to state ‘solidity’.
16 In a recent interview, a high-ranking members of one of the main parties revealed that they had just organised a congress seeking to establish the doctrine of the party, 16 years after it had been funded (Interview with Executive Secretary of the PAN, Guatemala City, Monday 19th June 2006). 17 The party most strongly associated with the Oligarchy are the PAN, UNE and the party of the current administration GANA (UNE and GANA split from the PAN). Former dictator Rios Mont controls the FRG and General Otto Perez Molina controls the increasingly powerful Partido Patriota. 18 The key parties of the left are the Alianza Nueva Nacion ANN and the former guerrilla URNG. The ANN has recently splintered into another party that is still seeking official registration (Encuentro para Guatemala). The URNG returned only one deputy to congress in the 2007 elections. . 19 ASIES (2007:7-8).

CRISE Working Paper No. 51
54
8.3 Human Rights violations/non-realisation
The roots of the Guatemalan conflict lie in a complex inter-meshing of human rights violations and non-realisations. The Guatemalan Truth Commission (CEH), set up as part of the peace process, found three broad historical causes of the conflict:
• Racism, exclusion and subordination of indigenous peoples; • Economic exclusions and agrarian structures; and, • Authoritarianism and dictatorship.
The first of these causes relates more directly to processes of social exclusion than human rights, and will be dealt with in the next section. In this section, we consider the second two causes of conflict from a human rights perspective.
The economic exclusions and agrarian structures that drove the conflict were largely linked to the Guatemalan state’s failure to act as an intermediary between business interests and the realisation of the socio-economics rights of the population, producing ‘a vacuum that led to a direct confrontation between the beneficiaries of this socio-economic order (the elite), those that defended it (the security forces), and those that aspired to increase their share and participation’ (Caumartin 2005: 20). Particularly in respect of indigenous peoples, the state was indeed complicit in contraventions of rights, including harsh vagrancy laws and debt peonage which amounted to little more than forced labour. In a predominantly agrarian society, access to land was also extremely difficult for the vast majority of the population, and the issue of agrarian reform was both a major cause of the conflict and a major issue in the peace negotiations. These non-realisations of social and economic rights were compounded by an authoritarian regime that denied citizens meaningful participation in the processes and structures of governance. The Guatemalan state at this time was characterised by ‘the unchecked exercise of power as a personal or small group attribute, the rejection of criticism, and of the notion of opposition’ (ibid.: 22). Put simply, the pre-war Guatemalan state paid scant attention either to the fundamental political rights of its citizens, or to moves to realise socio-economic rights.
The war in Guatemala involved massive abuses of civil and political human rights, particularly in the early 1980s, affecting primarily civilian populations rather than combatants, and mostly perpetrated by the state military. Indeed, these transgressions extended beyond the civil and political rights into economic, social and cultural rights. The movements of persons and goods was tightly monitored, dispersed rural populations were forcibly concentrated and relocated in ‘model villages’, and (mostly) young indigenous men were kidnapped to serve in the armed forces.
In terms of compliance with international instruments of human rights, Guatemala ratified the convention of genocide (CPPCG) in 1950, during the short period of democracy. CERD was signed by the military regime 1967, although not ratified until 1983 – at the height of the abuses against indigenous peoples. CEDAW was ratified in 1982, with the other major conventions being ratified after the transition to civilian rule in 1986.
Human rights were an important consideration in the peace process and, indeed, the first of the series of separate but inter-related agreements between the Guatemalan state and the rebels signed in 1994 was the Comprehensive Agreement on Human Rights; the process also involved the creation of the Guatemalan Truth Commission, specifically tasked with documenting and bringing to light the rights transgressions of the past. The UN general assembly established the United Nations Mission for the Verification of Human Rights and of Compliance with the Commitments of the Comprehensive Peace Agreement on Human Rights in Guatemala (MINUGUA) to

CRISE Working Paper No. 51
55
oversee implementation of these measures, which was phased out in 2004. A UNDP evaluation of its post-conflict activities in Guatemala has broadly found that these institutions were successful in reducing contraventions of fundamental political rights, but less successful in promoting the kind of agrarian and economic reforms required to realise the socio-economic rights of the population.
8.4 Social exclusion
The social, economic and political exclusions of indigenous people in Latin America have long been noted, but it is only in the last decade of the 20th century that the dimension of these exclusions are starting to be systematically recorded, measured and analysed (Sieder 2002, Taracena 2002, Barrón 2008, UNDP 2005b). Table 17, based largely on CRISE research, summarises some critical indicators of inequalities between indigenous and non-indigenous groups.
Table 17: Guatemala – selected indicators of social exclusion, 2000 NON INDIGENOUS INDIGENOUS Literacy rate literacy rate, 15+ 83.9 59.3 Level of education, 25+ No formal schooling 15.8 28.9 Primary School 48.6 43.8 Secondary School 19.7 18.4 Higher Education School 15.9 9.0 Services Running water 75.3 63.5 Sewer 47.8 22.8 Electricity 81.3 60.1 Telephone 25.1 4.5 Characteristics of Housing No dirt floor 71.7 39.7 Rooms per head 0.62 0.39 House ownership 63.3 49.3 Poverty Extreme 4.9 20.1 Non extreme 27.2 47.3 Non poor 67.9 32.6 Labour market** Employment in Agriculture 29 50 No employment contracts 84 95 Employees receiving less than the minimum wage
32 61
Source: Barrón 2008 and ** Vakis 2003 pp 50-53. * Ethnicity was established on the basis of self-identification in the ENCOVI survey. Barrón’s findings which are presented here confirm our expectations of substantial inequalities between non-indigenous and indigenous groups. Indigenous people have less access to services; they are less educated and, for Barrón, the most compelling indicator of horizontal inequality is the percentage of the indigenous population living in poverty/extreme poverty (Barrón 2008). Latin America has long been infamous for its severe vertical inequalities but research undertaken by the CRISE team indicate Latin America deserves the same degree of infamy for inequalities between indigenous and non-indigenous groups (Barrón 2008,. In addition, addressing the subordinate and unequal position of indigenous people whilst respecting their right to cultural difference
CRISE Working Paper No. 51
56
became a topic of national concern only very late in the 20th century, chiefly through the peace dialogues. Although the Guatemalan armed conflict cannot be categorised as a prototypical ‘ethnic conflict’ (i.e. it was not a conflict pitting indigenous against non-indigenous) there is little doubt that ethnicity and the exclusionary nature of Guatemalan society did play an important role. The Guatemalan armed conflict started in the non-indigenous Eastern regions of the country in the 1960s, but by the mid 1970s, the surviving guerrilla factions moved into the western highlands of Guatemala where they gained an important base of support amongst some of the indigenous population. By the 1980s, some indigenous communities supported the guerrillas; others (frequently coerced to do so) sided with the state and the armed forces. In both cases, the leadership tended to be ladino and the troops indigenous. State repression was savagely brutal, especially in the north of the departments of Huehuetenango and el Quiche, ‘red areas’ where the armed forces carried out scorched earth campaigns aiming to root out the guerrillas. The UN-sponsored truth commission set up as part of the peace process established that over 83 per cent of the 200,000 victims of the armed conflict were indigenous, mostly non-combatant civilians suspected by the state of sympathising with the guerrillas.20 The truth commission also attributed over 93 per cent of the killings and human rights abuse to the state and their allies.
The Guatemalan peace settlement comprising a series of accords ratified in 1996 consists of a wide-ranging series of commitments, including a process of demilitarisation as well as a series of specific measures that recognise the presence of some rights of indigenous people. Some important steps were taken towards the implementation of the accords, notably by the administration of President Arzu who had overseen their ratification, but the two following administrations that came to power in 1999 and 2003 have failed to continue the implementation efforts. If the overall implementation of the accords has been poor and disappointing, it is also clear that the agreement on indigenous peoples’ rights and identity has been the least implemented of all the accords.21 The peace process sought to start addressing a series of long-standing systemic issues in Guatemala, such as the weakness of social investment and the subordinate and excluded position of indigenous people in society. Ten years on, the peace accords no longer seem to be on the main agenda of the main political actors, ensuring that instead of delivering a firm foundation for the future, the inherent fragility of the Guatemalan state is being consolidated.
8.5 Proposed solutions to fragility: The Peace process, PRSP and Millennium Development Goals
The main national, international and multilateral development actors in Guatemala – the Guatemalan state agency SEGEPLAN, USAID, the IADB and the UNDP, as well as the World Bank – have tended to articulate similar analyses. Indeed, there has been a virtually seamless transfer of strategies and objectives first emerging around the peace accords (1994-1999), then briefly articulated in terms of poverty reduction strategy (IDB 2001, World Bank/GUAPA 2003) and currently organised around reaching the Millennium Development Goals. The essential component of the dominant development strategy for Guatemala consists of combining macroeconomic considerations (rooted in sustained growth and financial and monetary stability) with socio-economic investments
20 Comission para el Esclarecimiento Historico (CEH), 1999. 21 Interview with Dr Victor Montejo, Deputy and President of Indigenous Communities Commission, Congress of the Republic of Guatemala, 29th June 2006, Guatemala City.
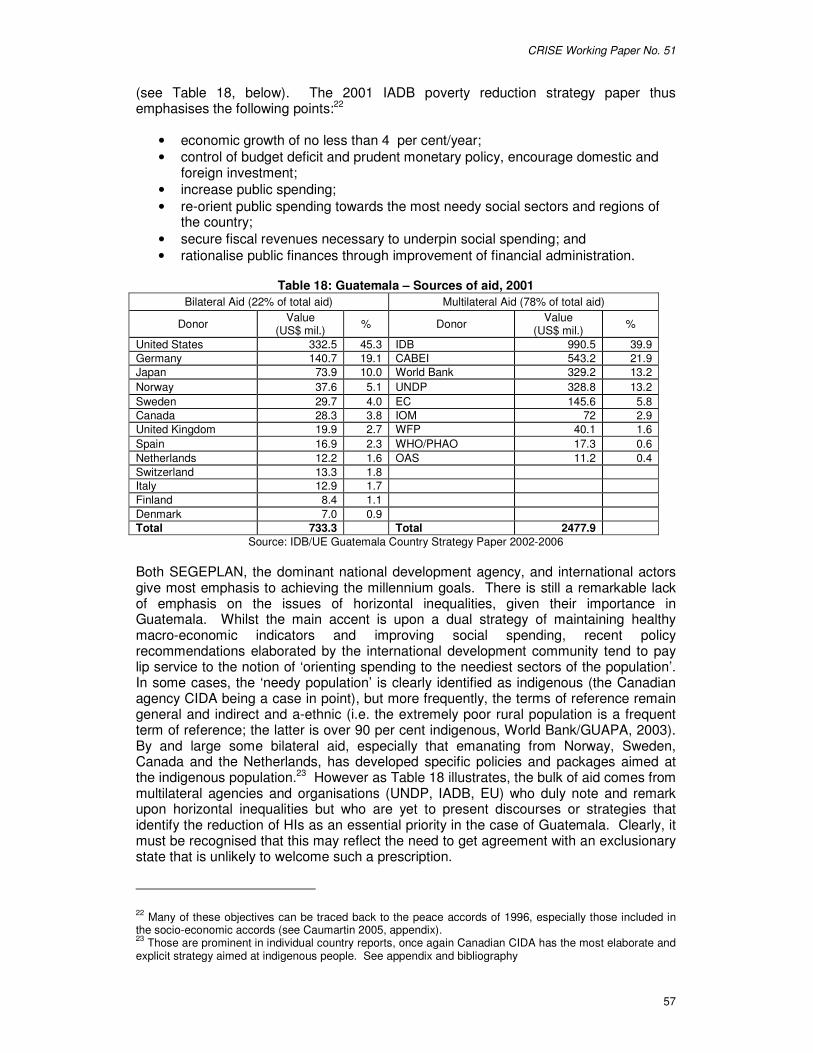
CRISE Working Paper No. 51
57
(see Table 18, below). The 2001 IADB poverty reduction strategy paper thus emphasises the following points:22
• economic growth of no less than 4 per cent/year; • control of budget deficit and prudent monetary policy, encourage domestic and
foreign investment; • increase public spending; • re-orient public spending towards the most needy social sectors and regions of
the country; • secure fiscal revenues necessary to underpin social spending; and • rationalise public finances through improvement of financial administration.
Table 18: Guatemala – Sources of aid, 2001 Bilateral Aid (22% of total aid) Multilateral Aid (78% of total aid)
Donor Value (US$ mil.) % Donor Value
(US$ mil.) %
United States 332.5 45.3 IDB 990.5 39.9 Germany 140.7 19.1 CABEI 543.2 21.9 Japan 73.9 10.0 World Bank 329.2 13.2 Norway 37.6 5.1 UNDP 328.8 13.2 Sweden 29.7 4.0 EC 145.6 5.8 Canada 28.3 3.8 IOM 72 2.9 United Kingdom 19.9 2.7 WFP 40.1 1.6 Spain 16.9 2.3 WHO/PHAO 17.3 0.6 Netherlands 12.2 1.6 OAS 11.2 0.4 Switzerland 13.3 1.8 Italy 12.9 1.7 Finland 8.4 1.1 Denmark 7.0 0.9 Total 733.3 Total 2477.9
Source: IDB/UE Guatemala Country Strategy Paper 2002-2006 Both SEGEPLAN, the dominant national development agency, and international actors give most emphasis to achieving the millennium goals. There is still a remarkable lack of emphasis on the issues of horizontal inequalities, given their importance in Guatemala. Whilst the main accent is upon a dual strategy of maintaining healthy macro-economic indicators and improving social spending, recent policy recommendations elaborated by the international development community tend to pay lip service to the notion of ‘orienting spending to the neediest sectors of the population’. In some cases, the ‘needy population’ is clearly identified as indigenous (the Canadian agency CIDA being a case in point), but more frequently, the terms of reference remain general and indirect and a-ethnic (i.e. the extremely poor rural population is a frequent term of reference; the latter is over 90 per cent indigenous, World Bank/GUAPA, 2003). By and large some bilateral aid, especially that emanating from Norway, Sweden, Canada and the Netherlands, has developed specific policies and packages aimed at the indigenous population.23 However as Table 18 illustrates, the bulk of aid comes from multilateral agencies and organisations (UNDP, IADB, EU) who duly note and remark upon horizontal inequalities but who are yet to present discourses or strategies that identify the reduction of HIs as an essential priority in the case of Guatemala. Clearly, it must be recognised that this may reflect the need to get agreement with an exclusionary state that is unlikely to welcome such a prescription.
22 Many of these objectives can be traced back to the peace accords of 1996, especially those included in the socio-economic accords (see Caumartin 2005, appendix). 23 Those are prominent in individual country reports, once again Canadian CIDA has the most elaborate and explicit strategy aimed at indigenous people. See appendix and bibliography

CRISE Working Paper No. 51
58
8.6 Conclusions
This Guatemalan case study has shown how processes of human rights violations and social exclusions across the service entitlement and legitimate governance dimensions of state fragility drove the country into three decades of conflict, which resulted in further human rights transgressions and failure on the authority dimension. Failure on the behalf of the Guatemalan state to realise the socio-economic rights of the indigenous population in particular, and the political suppression of those who sought to realise these rights themselves, combined to drive an armed rebellion against the regime. This conclusion is supported by the analysis of Guatemala’s own Presidential Commission on Discrimination and Racism against Indigenous Peoples (CODISRA), set up as part of the peace accords, which has found that ‘the crisis of discrimination against the indigenous people of Guatemala involved not only a failure to observe civil and political rights, but also the continued violation of social, economic and cultural rights’ (CERD/C/SR.1739, para.4). The processes and conclusions elucidated here are remarkably similar to the Indonesian case, except that whereas in Indonesia the exclusions and non-realisations of rights that drove conflict were concentrated in peripheral regions, giving rise to separatist struggles, the Guatemalan experience was much more countrywide, giving rise to a civil war that contested the central state itself.

CRISE Working Paper No. 51
59
9 Côte d’Ivoire 9.1 Introduction
In the light of its economic and political achievements, international observers often referred to Côte d’Ivoire in the 1970s as an ‘oasis of peace’ and an ‘African Miracle’. The current situation could hardly be more different. Since September 2002, Côte d’Ivoire has been embroiled in a civil war with clear ethno-regional undercurrents which has not only resulted in a severe economic decline and more than 750,000 internally displaced persons, but has also led to the destruction of the social fabric of its society. While the conflict does not have a secessionist character, it has de facto split the country in two: a government-controlled southern part and a rebel-controlled northern part. The current paper aims to explain not only the extent to which Côte d’Ivoire is failing as a state with regard to the three dimensions of fragility identified above, but also aims to identify the underlying causes for this state failure.
Côte d’Ivoire is a multiethnic country with approximately 60 different ethnic groups which can be grouped into five larger socio-cultural or ethno-linguistic groups: Akan (42.1 per cent), Voltaic or Gur (17.6 per cent), Krou (11 per cent), Northern Mandé (16.5 per cent) and Southern Mandé (10 per cent). Although the northern ethnic groups, Northern Mandé and Voltaic, originate from Côte d’Ivoire’s northern regions, many people belonging to these ethnic groups now live in the southern parts of Côte d’Ivoire. Another important dividing line, partly reinforcing the ethno-regional differences, is religion. The largest religious group are the Muslims with approximately 38 per cent of the population. The Muslims are predominantly found among the northern ethnic group, Northern Mandé and Voltaic, while the majority of the ethnic groups that originate from the southern and western regions, the Akan and Krou, are Christian (RGPH-1998 2001).
As a result of extensive international migration flows, a large proportion of the people in Côte d’Ivoire is of foreign origin. From the early 1940s, the French colonial administration organised the transfer of forced labour from the Upper Volta, today’s Burkina Faso, to the cocoa and coffee plantations in the southern parts of Côte d’Ivoire. Although forced labour was abolished by the French Assembly in 1946, Côte d’Ivoire continued to attract large numbers of migrants from neighbouring countries. Côte d’Ivoire’s first president, Felix Houphouët-Boigny, promoted the influx of foreign workers by introducing liberal landownership laws, under the slogan ‘the land belongs to those that develop it’ (Gonin 1998: 174). With the right to vote in national elections, foreign migrants became an important political asset, in addition to being a productive economic workforce. In 1998, foreigners accounted for roughly 25 per cent of the population; although about 50 per cent of these ‘foreigners’ were born in Côte d’Ivoire (ibid.). Most of these foreigners have ethno-religious backgrounds that are similar to the people from Côte d’Ivoire’s northern regions.
From an economic point of view, Côte d’Ivoire is an important country in West Africa. Not only does the Ivorian economy constitute around 40 per cent of the GDP of the West African Economic and Monetary Union24, but neighbouring countries also ‘depend heavily on its transport facilities for imports and exports and the remittances of migrant nationals’ (World Bank 2006). Côte d’Ivoire has a market-based economy, which is heavily dependent on the agricultural sector. The agricultural sector accounts for around 30 per cent of GDP and produces over 60 per cent of export revenues. Further, between 60 and 70 per cent of the Ivorian people are linked to some sort of agricultural activity. The main export products are cocoa, coffee, bananas, cotton, pineapples, rubber, tropical wood and tuna. Côte d’Ivoire is the world’s largest cocoa exporter and produces
24 The West African Economic and Monetary Union is constituted of the following eight countries: Benin, Burkina Faso, Côte d’Ivoire, Guinea, Mali, Niger, Senegal and Togo.

CRISE Working Paper No. 51
60
about 40 per cent of the world’s cocoa crop. The cocoa and coffee plantations are mainly located in the southern parts of Côte d’Ivoire.25
9.2 Dimensions of Fragility
9.2.1 Authority Dimension
As noted above, Côte d’Ivoire’s long period of economic growth and social stability was abruptly broken by a coup d’état in December 1999. The causes of the coup and the discontents that lay behind it are discussed below; this section focuses on the repercussions of the coup on state authority within the country. The coup was initiated by a group of young officers who claimed they were owed financial compensation for their participation in an international peace keeping mission in Central Africa (Kieffer 2000). However, the protest movement quickly developed into a large-scale mutiny, at which stage more senior officers became involved. Ultimately Bédié was removed from power and General Robert Gueï was asked by coup leaders to become the interim head of state. Although the coup d’état initially appears to have originated in individual grievances, these grievances and fears of exclusion cannot be separated from what went on in the rest of the society. As Kieffer (2000) argues, the opposition parties’ discourse of exclusion and Baoulé domination of the Ivorian state is likely to have had an important impact on the views and attitudes of the young officers involved in the coup d’état.
Following Bédié’s removal from power, the military forces established the ‘Comité national de salut public’ (CNSP-National Commission of Public Safety). The CNSP was headed by General Gueï who was a Yacouba, one of the ethnic groups belonging to the Southern Mandé ethnic group. After negotiations between the various political parties and the military junta, a transitional government was installed on January 4, 2000. Initially, Gueï strongly rejected the ideology of Ivoirité (“Ivorian-ness”) and also proclaimed that he would not participate in the following presidential elections in order to guarantee free and fair elections. However, after several months in office, Gueï changed his mind and decided to participate in the next presidential elections after all. Further, although without explicitly using the term, he also started to use the ideology of Ivoirité in order to gain political support and exclude political opponents, in particular Alassanne Ouattara and his RDR party (Akindes 2003).
The presidential elections of October 2000 were marked by chaos and violence. When minister of interior Mouassi proclaimed that Gueï had won the elections with 51.35 per cent of the vote, this sparked off massive street demonstrations by Gbabo’s FPI supporters as well as members of the military and security forces (Le Pape 2002). The military forces supporting these demonstrations, who eventually forced Gueï to leave the country, were mainly of northern origin (Banegas and Losch 2002). Following the exclusion of their presidential candidate, Alassane Ouattara, for ‘nationalité douteuse’ (nationality in doubt), the RDR refused to recognise the legality of the election results and demanded new elections. To support their demands, RDR supporters started to organise large-scale street protests in Abidjan, Bouaké and Korhogo which led to violent confrontations with both the FPI supporters and security forces (ibid: 49). On October 29 the ‘massacre of Yopougon’ was uncovered. In this neighbourhood of Abidjan, around 60 RDR supporters with northern backgrounds had been slaughtered by the security forces (Leymarie 2001).
25 Paragraph based on Worldinformation.com, Côte d’Ivoire, Country Profile, March 2003 (available at: http://worldinformation.com).

CRISE Working Paper No. 51
61
On October 26, the Supreme Court formally declared Laurent Gbagbo the winner of the presidential elections. Gbagbo originates from the western town of Gagnoa and is a Bété, one of the ethnic groups belonging to the Krou family. Gbagbo allocated most government positions in the January 2001 government to his own party, the FPI. This obviously aggravated the already existing feelings of political exclusion and inequality among RDR supporters. As with his two predecessors, Bédié and Gueï, he also wanted to establish a more favourable ethnic composition among the military forces. In order to achieve this, Gbagbo planned to demobilise two contingents – called ‘zinzins’ and ‘bahéfouê’ – that predominantly consisted of soldiers who had been recruited during the brief reign of general Gueï (Banegas and Losch 2002). In response to their planned demobilisation, however, these soldiers started a mutiny which quickly turned into a more organised rebellion. It seems, therefore, most likely that the military mutiny of September 19 was part of a larger plan to overthrow Gbagbo’s regime.
By the end of September 2003, the rebels had secured control over the northern part of the country and were referring to themselves as the Mouvement Patriotique pour la Côte d’Ivoire (MPCI-Patriotic Movement of Côte d’Ivoire). The MPCI had the following key demands: ‘the resignation of President Gbagbo, the holding of inclusive national elections, a review of the Constitution and an end to the domination by the Southerners’ (MINUCI 2004). Although the majority of its forces have a northern/Muslim background, the MPCI claims to have no specific regional or ethnic affiliation. The two most prominent figures of the political wing are, respectively, Secretary-General Guillaume Soro Kigbafori and the head of foreign relations, Louis Dacoury-Tabley. The conflict was further complicated by the emergence of two additional rebel movements in the western region of Côte d’Ivoire: Mouvement pour la Justice et la Paix (MJP) and Mouvement Populaire Ivoirien du Grand Ouest (MPIGO). These two other rebel groups are however much smaller. After the rebel movements joined forces, they are collectively referred to as the New Forces (‘Forces nouvelles’).
In order to stop the violence and protect the large contingent of French nationals in Côte d’Ivoire, France decided to intervene and blocked the MPCI’s military advance towards Abidjan in late-September 2002.26 Under pressure from France and the Economic Community of West African States (ECOWAS), the conflicting parties subsequently agreed to a ceasefire. The ceasefire agreement of October 17, 2002, was an important precondition for the organisation of more substantial peace negotiations in January 2003 in Linas-Marcoussis. These negotiations resulted in the signing of the Marcoussis Agreement on January 23, 2003, in Paris. The principal provisions of the Linas-Marcoussis Agreement were the creation of a government of national unity, the request for an international peacekeeping force with a robust UN Security Council mandate and the establishment of an international follow-up commission. It was further agreed that the President had to delegate significant executive powers to the transitional government, which would be headed by a powerful prime minister, appointed by consensus. The transition government would be comprised of ministers designated by all parties that attended the conference.
Furthermore, the Linas-Marcoussis Agreement tasked the new government of national unity with legislative reform of the laws on nationality, electoral procedure and land inheritance, the immediate creation of a national human rights commission, the establishment of an international inquiry into serious violations of human rights and international humanitarian law, and demanded an end to the impunity of those
26 France was able to intervene so quickly because of its military presence in Côte d’Ivoire. In particular, France and Côte d’Ivoire signed a mutual defence agreement in 1961. This agreement provides for the stationing of French forces in Côte d’Ivoire. More specifically, the 43rd Marine Infantry Battalion, an estimated 500 soldiers, has been based in Port Bouët adjacent to the Abidjan Airport since 1961.

CRISE Working Paper No. 51
62
responsible for summary executions, in particular the death squads (HRW 2003). In response to the request by the signatories of the Marcoussis Agreement, a French-led United Nations peacekeeping mission (the UN Mission in Côte d’Ivoire – MINUCI) was interposed between the south and north in order to improve the security situation and guarantee the ceasefire.
While the Marcoussis Agreement forms the blueprint for the return to peace, stability and democracy, neither side has adhered to the terms of the agreement and the ceasefire has been regularly broken by both parties. While a crucial provision of the agreement was the creation of a government of national unity, this transitional government has been unable to implement the most important aspects of the Marcoussis Agreement. While large-scale fighting between the rebel and government forces has not resumed since September 2002, ‘peace has proven elusive, and a succession of political agreements have failed to move beyond a “no peace no war” stalemate’ (HRW 2006: 1). The two most important issues over which the government, the New Forces and other political parties and stakeholders remain deadlocked are the disarmament of the rebel forces and voter identification.
The latter issue is particularly important for the New Forces rebels because they claim that people from the northern regions in Côte d’Ivoire are discriminated against and have been prevented from holding national identity papers, work permits and voter cards by successive Southern-dominated governments. In March 2007, as part of the latest formal peace agreement (i.e. the Ouagadougou Peace Agreement of 4 March 2007), President Laurent Gbagbo and Guillaume Soro, the leader of the New Forces, reached a compromise on the key issues of disarmament and identification. However, since then, very little progress has been made towards the disarming and dismantling of the urban militia and rebel forces, and the process of identification and voter registration also encountered serious problems and delays. As a result of this, on 11 November 2008, President Gbagbo announced that the elections (which were scheduled to take place on 30 November) had to be postponed until the beginning of 2009. However, the longer the current regime stays in power without being re-elected in free and fair elections, the less legitimate it becomes. The risk of coup d’états and the return of hostilities concurrently increases.
9.2.2 Service Entitlements
Côte d’Ivoire had an impressive economic record in the period 1960-1980; an average GDP growth rate of almost 9 per cent and an average GDP per capita growth rate of almost 5 per cent (see Table 19). However, from the early 1980s, it became clear that Côte d’Ivoire’s economic reputation was ill-founded because it disregarded fundamental flaws in its development model. First, Côte d’Ivoire’s heavy reliance on export revenues of coffee and cocoa exposed the Ivorian economy to price variability in international commodity markets. When the prices of these commodities declined sharply at the end of the 1970s, Côte d’Ivoire’s vulnerability to price changes in international commodity markets was clearly exposed and led to serious economic problems (Berg et al. 2001).27 Second, the impressive economic growth record did not result in an equally impressive improvement of the socio-economic indicators. For instance, in the period 1970-1980, primary and secondary school enrolment increased only moderately from 58 per cent to 74 per cent and from 9 per cent to 18 per cent respectively.
27 The international coffee (All coffee New York) and cocoa (Ghana - London) prices declined, respectively, 35 per cent and 40 per cent between 1977 and 1980 (International Monetary Fund (IMF), International Financial Statistics).

CRISE Working Paper No. 51
63
Table 19: Côte d’Ivoire – Economic growth, 1960 – 2000 GDP growth
(Average annual %) GDP / capita
(Average annual %) 1961-1970 8.9 4.8
1971-1980 5.5 1.4
1981-1990 0.8 -2.9
1991-2000 2.5 -0.5
Source: Author’s calculations on the basis of World Development Indicators (WDI).
Table 19 also shows that Côte d’Ivoire’s economic performance remained weak throughout the 1980s. Most people therefore experienced a serious decline in their standard of living; GDP per capita declined from $1,162 in 1980 to $867 in 1990 (World Development Indicators, Constant 1995 US$). Although Côte d’Ivoire’s economy improved briefly in the mid-1980s, from 1987, the economy slowly started to slip back into recession due to a serious deterioration of its terms of trade (Berg et al.. 2001). At the end of the 1980s, the Ivorian government decided to start implementing a new round of Structural Adjustment Programs (SAPs). After almost a decade of bad economic performance, the period 1994-1998 was characterised by renewed economic progress. Although the standard of living improved in the period 1995-1998, most people were still worse off compared to the beginning of the 1990s; GDP per capita declined from $867 in 1990 to $862 in 1999 (World Development Indicators, Constant 1995 US$). As a consequence of the coup d’état in December 1999 and civil war in September 2002, Côte d’Ivoire’s economic and financial situation has further worsened since then.
Côte d’Ivoire’s strong economic performance until the early 1980s was reflected in an improvement in fulfilment of service entitlements. At independence, the country was burdened with an exceptionally high child mortality rate, almost double what would be expected given its level of socio-economic development. This reduced significantly throughout the first two decades of independence until the economic slow-down of the 1980s, when the reduction flattened out. Since the early 1990s, child mortality rates in the country have in fact been increasing (see Figure 11).

CRISE Working Paper No. 51
64
0
50
100
150
200
250
300
1965 1970 1975 1980 1985 1990 1995 2000 2005
Chi
ld M
orta
lity
Rat
e
Actual CMR
Predicted CMR
Figure 11: Côte d’Ivoire – Progressive Realisation of Service Entitlements in Child Mortality Reduction, 1965-2005
Source: Authors’ calculations based on WDI dataset
9.2.3 Legitimate Governance
When Côte d’Ivoire became independent in 1960, a one-party regime was installed and the Parti Démocratique de la Côte d’Ivoire (PDCI-Ivorian Democratic Party) took control of state institutions. The PDCI was founded by the Baoulé tribal chief Felix Houphouët-Boigny who would also become Côte d’Ivoire’s first president. Houphouët would be successively re-elected until his death in December 1993. During the first 20 years of his presidency, Côte d’Ivoire not only achieved a remarkable economic record, but also benefited from a relatively stable political environment. An important factor that contributed to maintaining stability in Côte d’Ivoire was Houphouët-Boigny’s ‘system of ethnic quotas’ which was aimed at establishing a balance between different regions and ethnic groups within the state institutions (Bakery 1984).
However, as already noted, following the sharp decline in the prices of Côte d’Ivoire’s main export commodities at the end of the 1970s, the Ivorian model slowly started to disintegrate. The negative economic environment in the 1980s exacerbated existing tensions between locals and foreign as well as internal migrants in the southern regions. These communal tensions were increasingly perceived as a conflict between north and south. As Dembele (2003: 36; my translation) argues: ‘The communal conflict between north and south was mainly related to land issues and the presence of too many migrants from the centre and north in the rural economy in the south-western regions and the urban economy in the south.’
In April 1990, the social crisis resulted in major student protests and demonstrations by the officially illegal political opposition. In an attempt to restore social and political stability by appeasing the political opposition, Houphouët-Boigny decided to abandon one-party rule and legalise opposition parties in May 1990. The first competitive presidential elections took place in October 1990. Houphouët-Boigny won the elections

CRISE Working Paper No. 51
65
with a considerable margin against the main opposition party candidate, Laurent Gbagbo. The most significant aspect of these elections, however, was the introduction of ethno-nationalism and xenophobia into the political arena. During the 1990 elections, Côte d’Ivoire’s main opposition party, Front Populaire Ivoirien (FPI-Ivorian Popular Front), initiated a political campaign around the message that ‘the PDCI was a partial regime which had systematically favoured the interests of particular Ivorian ethnic groups – Baoulé and groups from the north – and of foreigners’ (Crook 1997: 222).
An important change in the November 1990 government was the appointment of Alassane Ouattara – a Malinké belonging to the Northern Mandé ethnic group – to the newly created position of prime minister. As a former director at the International Monetary Fund (IMF), Ouattara was mainly chosen for his economic management skills and international reputation. However, as a result of the appointment of Ouattara as prime minister, ‘the conflicts between the forest people from the south and the northerners in the land and economic sphere shifted to the political sphere’ (Dembele, 2003: 36; my translation). A growing northern consciousness was another important change that contributed to the escalation of ethnic tensions at the beginning of the 1990s. The distribution of an anonymous document called ‘le Charte du Grand Nord’ (Charter of the North) in 1992 illustrated the changed attitudes of the northerners regarding the socio-political system in general and the Baoulé group in particular. The Charter ‘called for fuller recognition of the Muslim religion…, more efforts to reduce regional inequalities, greater political recognition of the north’s political loyalty during the upheavals of the 1980s and … an end to Baoulé nepotism in recruitment to public jobs’ (Crook 1997: 226). Following the emergence of a new opposition party, Rassemblement des républicains (RDR – Republican Rally), in 1994, the heightened northern consciousness led to a split among Côte d’Ivoire’s political elite. The party aimed to draw support among the northern ethnic groups, Voltaic and Northern Mandé. Alassane Ouattara would soon become their political leader.
When Houphouët-Boigny died on December 7, 1993, Henri Konan Bédié succeeded him. The emergence of the RDR confronted Bédié with a serious challenge because this new political party was likely to reduce PDCI’s electoral support in the northern regions (ibid: 227). As Crook states in this respect: ‘Bédié’s initial strategy was familiar to any student of electoral politics: he stole the opposition’s clothes, and adopted a policy of Ivorian nationalism, under the slogan of the promotion of Ivoirité (Ivorian-ness)’ (ibid). Although he claimed that the concept was solely aimed at creating a sense of cultural unity among all the people living in the territory of the Côte d’Ivoire, it is widely recognised that it was introduced for specific political reasons: preventing Ouattara from participating in the presidential elections in 1995. Ivoirité changed the electoral code, requiring both parents of a presidential candidate to be Ivorian. Another important change was the fact that foreigners were no longer allowed to vote in Ivorian elections. Due to this new electoral code, Ouattara and many ‘foreign’ migrants as well as ‘northerners’ lacking the appropriate documents were excluded from participating in the 1995 elections.
Due to the exclusion and boycott of his main rivals, the RDR leader Alassane Ouattara and the FPI leader Laurent Gbagbo, respectively, Bédié won the October 1995 elections with a landslide, receiving 96.5 per cent of the votes. Until the coup d’état in December 1999, these two opposition parties would together form the ‘Front républicain’ (Republican Front). The Republican Front attacked Bédié for giving too much political influence and economic privileges to his own ethnic group, the Baoulé. In sharp contrast to Houphouët-Boigny, Bédié almost completely stopped the balancing process among the different ethno-regional interests and parties, and started a process of ‘baoulisation’ of state institutions (Dozon 2000). In addition to the baoulisation of the political-administrative sector, Bédié also aimed to establish a more favourable ethnic

CRISE Working Paper No. 51
66
composition among the military forces. Contamin and Losch (2000) argue that Bédié progressively destroyed the internal balances in the military by predominantly appointing Baoulé people to the higher command positions.
9.3 Human Rights
Since the flawed elections of October 2000, Côte d’Ivoire’s human rights situation has been dreadful. As Human Rights Watch has recently pointed out: ‘Impunity has taken firm root on Ivorian soil. Neither the government, the leadership of the rebel New Forces, nor the international community has taken meaningful steps to bring to justice those responsible for serious violations of international human rights and humanitarian law in Côte d’Ivoire. This failure has provided a favorable environment for increasingly entrenched lawlessness in which impunity prevails’ (HRW 2006: 1). The pattern of abuses in the last couple of years has remained the same in both the south and north. In the government-controlled southern part, the state security forces and pro-government militias regularly harass and intimidate nationals of neighbouring states and Ivorians from the north of the country on the basis of suspicions that they are sympathetic to the northern rebels or the political opposition (HRW 2006). Human Rights Watch further reported in May 2006 that ‘members of the security forces prey on individuals by extorting, robbing, and at times, beating civilians they are entrusted to protect’ (HRW 2006: 2). In the northern part of Côte d’Ivoire, the New Forces rebels also continue to extort money from civilians by threat, intimidation, or outright use of force. Further, with no functioning judicial system, arbitrary arrests and ‘the imposition of custodial “sentences” on questionable legal authority continue to occur in the north with no independent judicial or executive checks’ (ibid). Following from the above, it should come as no surprise that Côte d’Ivoire falls within the group of countries with the worst Freedom House ratings (in 2005: Political Rights 6 and Civil Liberties 6).
9.4 Social Exclusion
This section provides some data on the prevailing socio-economic north-south inequalities as well as the evolution of political inequalities and exclusion in Côte d’Ivoire. In order to illustrate the socio-economic north/south divide, Figure 12 below shows the regional disparities regarding primary school enrolment based on Côte d’Ivoire’s 1998 census data. Figure 12 clearly demonstrates that the northern regions perform significantly worse on this important socio-economic indicator. More particularly, five of the six regions that score lowest on this socio-economic indicator are located in the northern part of Côte d’Ivoire. With regard to other socio-economic indicators a similar picture emerges, as illustrated by Table 20.

CRISE Working Paper No. 51
67
Figure 12: Côte d’Ivoire – Primary school enrolment across regions, 1998
Source: RGPH-98 (2001)
Table 20: Côte d’Ivoire – North-South socio-economic disparities, 1995
Regions No. of people per doctor
No. of people per midwife
Incidence of child malnutrition (%)
South 6,483 1,309 12.5
North-East 31,458 2,678 11.3
Centre-North 21,588 2,142 13.1
North 28,613 2,568 13.3
Côte d’Ivoire (ave.) 12,846 2,013 13.0
Source: UNDP (1999) With regard to the evolution of political inequalities and exclusion, Table 21 below gives an overview of the ethnic representation of government for the period 1980-2003. To compile this table, the ethnic background of government ministers was inferred on the basis of name recognition. Each ethnic group’s relative representation (Rel. Rep.) is calculated by dividing the group’s relative proportion in government by its relative size in the entire population. Consequently, unity means proportional representation; figures higher than one point to over-representation and less than one to under-representation.
Table 21 shows the continued existence of Houphouët-Boigny’s system of ethnic quotas during the 1980s. Although the Akan remained the dominant ethnic force in government, other ethnic groups were not excluded. However, in contrast to the 1980s, the November 1991 government shows a much more significant over-representation of the Akan: the Akan over-representation increased from 1.12 to 1.46 times its relative demographic size. When further taking into account that the Akan are by far the largest ethnic group

CRISE Working Paper No. 51
68
with approximately 42 per cent of the population, it is clear that Ivorian politics remained the ‘Akan’s business’ (Bakery 1984: 35). Moreover, it appears that Houphouët-Boigny counter-balanced the appointment of a non-Akan, Alassane Ouattara, to the newly created and influential position of prime minister by increasing the overall representation of the Akan in the November-1991 government significantly.
Table 21: Côte d’Ivoire – Ethnic representation in government, 1980 – 2003 Ethnic Groups
Nov. 1980
Jul. 1986
Oct. 1989
Nov. 1991
Dec. 1993
Jan. 1996
Aug. 1998
Jan. 2000
May 2000
Jan. 2001
Aug. 2002
Sep. 2003
GOVERNMENT* Akan 0.49 0.41 0.47 0.61 0.52 0.52 0.59 0.50 0.30 0.46 0.52 0.40
Baoulé 0.22 0.24 0.20 0.17 0.24 0.28 0.31 0.13 0.04 0.11 0.13 0.09
Krou 0.19 0.20 0.20 0.17 0.24 0.21 0.16 0.13 0.22 0.29 0.19 0.23
S. Mandé 0.05 0.10 0.13 0.04 0.04 0.10 0.06 0.08 0.17 0.18 0.16 0.07 N. Mandé 0.08 0.17 0.13 0.09 0.08 0.07 0.03 0.17 0.17 0.07 0.13 0.19
Voltaic
% o
f pos
ition
s
0.14 0.10 0.03 0.09 0.12 0.10 0.13 0.13 0.08 0.00 0.00 0.12
Akan 1.16 0.99 1.12 1.46 1.24 1.23 1.41 1.19 0.72 1.10 1.23 0.94
Baoulé 1.29 1.46 1.20 1.04 1.43 1.64 1.86 0.74 0.26 0.64 0.77 0.55
Krou 1.30 1.34 1.37 1.19 1.89 1.63 1.23 0.98 1.71 2.25 1.52 1.83
S. Mandé 0.51 0.91 1.25 0.41 0.40 1.03 0.63 0.83 1.73 1.79 1.61 0.70
N. Mandé 0.51 1.07 0.84 0.55 0.48 0.42 0.19 1.01 1.05 0.43 0.78 1.13
Voltaic
Rel
. Rep
.
0.83 0.60 0.20 0.53 0.68 0.59 0.71 0.71 0.47 0.00 0.00 0.66
No. N=37 N=41 N=30 N=23 N=25 N=29 N=32 N=24 N=23 N=28 N=31 N=43
INNER CIRCLE OF POLITICAL POWER** Akan 0.67 0.70 0.80 0.73 0.67 0.67 0.75 0.38 0.11 0.18 0.18 0.33
Baoulé 0.56 0.40 0.50 0.36 0.42 0.42 0.42 0.13 0.00 0.00 0.00 0.08
Krou 0.11 0.10 0.10 0.09 0.17 0.17 0.08 0.00 0.00 0.45 0.55 0.17
S. Mandé 0.11 0.00 0.00 0.00 0.00 0.00 0.00 0.13 0.22 0.09 0.00 0.00
N. Mandé 0.11 0.10 0.00 0.09 0.08 0.08 0.08 0.13 0.44 0.18 0.18 0.33
Voltaic
% o
f pos
ition
s
0.00 0.10 0.10 0.09 0.08 0.08 0.08 0.25 0.11 0.09 0.09 0.17
Akan 1.59 1.67 1.91 1.74 1.58 1.58 1.78 0.89 0.26 0.43 0.43 0.79
Baoulé 3.33 2.40 2.99 2.18 2.48 2.48 2.48 0.74 0.00 0.00 0.00 0.50
Krou 0.76 0.68 0.68 0.62 1.31 1.31 0.66 0.00 0.00 3.58 4.29 1.31
S. Mandé 1.04 0.00 0.00 0.00 0.00 0.00 0.00 1.25 2.22 0.91 0.00 0.00
N. Mandé 0.70 0.63 0.00 0.57 0.51 0.51 0.51 0.76 2.69 1.10 1.10 2.02
Voltaic
Rel
. Rep
.
0.00 0.61 0.61 0.56 0.47 0.47 0.47 1.42 0.63 0.52 0.52 0.95
No. N=9 N=10 N=10 N=11 N=12 N=12 N=12 N=8 N=9 N=11 N=11 N=12 Source: Langer (2005a). Notes: * Government: president of the republic, ministers of state and regular
ministers; deputy-ministers were not included in the calculations. **Inner circle of political power: president of the republic, prime minister, president of national assembly, president of economic and social council, minister of security, minister of economy and finance, minister of defence, minister of mines and energy,
minister of agriculture, minister of interior, minister of justice and minister of foreign affairs.
A more ethnically equal distribution of government positions is likely to improve ethnic groups’ perceptions and attitudes towards a political regime. However, whether the inclusion of different ethnic groups in government actually results in a more equal and participatory decision-making process is not always certain. It could be argued that even if the overall picture points towards ethnic balancing, the most important political positions and, therefore, the real decision-making power, might still be monopolised by one particular ethnic group. In order to assess this, Table 21 also provides data on the ethnic distribution of a set of key political positions in Côte d’Ivoire, which I call here the inner circle of political power. The political positions included are: president of the republic, prime minister, president of national assembly, president of economic and social council, minister of security, minister of economy and finance, minister of defence, minister of mines and energy, minister of agriculture, minister of interior, minister of justice and minister of foreign affairs.

CRISE Working Paper No. 51
69
The figures demonstrate that the over-representation of the Akan and Baoulé, in particular, regarding the key political positions was more pronounced than in the case of the government as a whole. This suggests that Houphouët-Boigny assigned the government positions of lesser importance to other ethnic groups. The figures further show that the Akan over-representation regarding the key political positions slightly increased to around 1.70 in November 1991. The Baoulé over-representation, on the other hand, was significantly reduced from 3.33 in November 1980 to 2.18 in November 1991.
In December 1993, Bédié succeeded Houphouët-Boigny as president of Côte d’Ivoire. The figures in Table 21 on the ethnic composition of Bédié’s governments (1993-1999), largely corroborate the claims that he started a process of baoulisation. More particularly, under Bédié, the Baoulé over-representation in the government as a whole increased from 1.43 in the December 1993 government to 1.86 times its relative demographic size in the August 1998 government. Bédié initiated a similar process of baoulisation in the key positions of political power. Throughout his presidency, Bédié allocated more than 40 per cent of the key political positions to the Baoulé. From a violent group mobilisation point of view, it is interesting to note that Alassane Ouattara’s ethnic group, the Northern Mandé, was the main victim of Bédié’s political exclusion. In the August 1998 government only 3 per cent of the government ministers had a Northern Mandé background.
When Gueï replaced Bédié as president, he made sure that the ethnic distribution of the January 2000 government was relatively equal. However, the figures in Table 21 also confirm the important shift in Gueï’s political behaviour between the first and second transitional government of January and May 2000. First, Gueï more than doubled the relative representation of his own ethnic family, the Southern Mandé, in the second transitional government of May 2000. A similar evolution is observable regarding the inner circle of political power. Second, the relative representation of the Krou in the May 2000 government also sharply increased. The reason Gueï allowed this sharp increase in the representation of the Krou has to do with the de facto coalition between Gbagbo, the leader of the FPI, and Gueï against their mutual ‘enemy,’ the RDR leader Alassane Ouattara. Third, by excluding the RDR from the second transitional government, he effectively reduced the relative representation of the largest northern ethnic family, the Voltaic. The relative representation of the Voltaic in the May 2000 government and inner circle of political power decreased sharply to 0.47 and 0.63 respectively.
After the violent presidential elections of October 2000, the FPI presidential candidate Laurent Gbagbo became president. As mentioned previously, Gbagbo is a Bété, one of the ethnic groups of the Krou family. An important observation, therefore, deals with the increased political power in the hands of the Krou. By allocating 20 of the 28 ministers in the January 2001 government to his own party, the FPI, Gbagbo was able to increase the relative representation of the Krou significantly. By excluding the RDR from the January 2001 government, Gbagbo effectively guaranteed that the northern ethnic elites were deprived of any executive political power. This obviously aggravated the already existing feelings of political exclusion and inequality among the northern elites. Although the Krou were a relatively small ethnic group – only 13 per cent of the population in 1998 – under president Gbagbo they became the most important political force in Côte d’Ivoire, controlling more than 55 per cent of the key political positions.
9.5 Conclusions
It is clear that Côte d’Ivoire is a fragile state with regard to all three dimensions of fragility identified in the conceptual sections above. In particular:

CRISE Working Paper No. 51
70
Authority dimension: Since the violent conflict emerged in September 2002, Côte d’Ivoire has been split in two. In the rebel-controlled northern part, a kind of shadow state has been established. The reintegration of these two territories is at the heart of the peace process. Further, particularly in the south, there is significant political violence against opposition parties and people suspected of being sympathetic to the opposition parties and/or the rebel forces. Harassment of and violence against civilians with particular ethnic and religious backgrounds is also widespread.
Service entitlement dimension: Due to the economic decline as a result of violent conflict, government expenditure on social and health projects and programmes has decreased. The diversion of government funds by corrupt officials further aggravates this situation. In 2005, Transparency International (IT) ranked Côte d’Ivoire as number 133 out of 144 countries with regard to the prevailing corruption. Humanitarian aid is crucial for the survival of a large part of the population. Currently, 3 million people rely on humanitarian assistance by the international community. Furthermore, 750,000 people are internally displaced. In addition, since the late 1990s, there has been a sharp increase in the prevalence of HIV/AIDS.
Legitimacy dimension: Due to the flawed elections of October 2000, the Gbagbo regime is perceived by a substantial part of the population as illegitimate. Moreover, the exclusion of the most important northern candidate in these elections, Alasane Ouattara, disenfranchised a large proportion of the northern population. The exclusion of the northern political elites from Gbagbo’s governments further aggravated the situation. Under Gbagbo, the opposition media (like for example the newspapers ‘le Patriote’ and ‘24 Heures’) has also been constantly obstructed and journalists are regularly harassed or even arrested without reason. The human rights abuses by government security forces and pro-Gbagbo youth groups such as the Young Patriots means the Gbago regime has lost any residual legitimacy.
It is important to note that the three dimensions of fragility are mutually inter-dependent and to some extent reinforce each other in the Ivorian case (e.g. weak service delivery contributed to authority failure which in turn resulted in a situation in which the state became even less legitimate). Côte d’Ivoire’s violent disintegration at the end of the 1990s demonstrates that the simultaneous presence of socio-economic inequalities and political exclusion forms an extremely explosive socio-political situation because in such circumstances the excluded political elites not only have strong incentives to mobilise their supporters for violent conflict along ethnic lines, but are also likely to gain support among their ethnic constituencies quite easily. The military insurgency that started in September 2002 is in many ways the result of the failure of the country’s political elites to agree on a new set of formal and informal procedural and distributional rules aimed at containing elite competition for political power. In such a political environment, socio-economic grievances provide a fertile context for violent group mobilisation (see Langer 2005a).

CRISE Working Paper No. 51
71
10 Nigeria 10.1 Introduction
With a population of about 140 million, Nigeria is Africa’s most populous nation. It is the fourth largest country in sub-Saharan Africa covering a total area of 923,768 sq km with land constituting 910,768 sq km and water 13,000 sq km. The territory is divided into 36 states and federal capital territory as well as 774 local government areas (LGAs) for administrative purposes. The main religions are Islam, Christianity and traditional religion. There are about 374 ethnic groups in Nigeria. The most populous ethnic groups are Hausa/Fulani, Yoruba, Igbo, Ibibio, Ijaw, Kanuri, and Tiv. Ethnicity generally tends to coincide with religious identity except among the Yoruba. Apart from ethnic and religious cleavages, regional and state identities have become the basis of group mobilisation as evidenced by the dichotomies between the North versus the South and indigenes versus non-indigenes.
Nigeria gained independence in 1960 after about 70 years of British colonial rule. In 1963, it became a Federal Republic. In the First Republic (1960-66), the country operated a parliamentary system of government. This government was toppled in 1966 ushering in three different military regimes that ruled the country till 1979. The presidential system of government was introduced in the Second Republic in 1979. The military took over power again in 1983 and ruled until 1999 when a civilian government was inaugurated, marking the beginning of the Fourth Republic. The country seems set on the path of democratic consolidation as it achieved a political feat that had eluded it since independence in May 2007 when a civilian administration was succeeded by another civilian administration.
Nigeria has historically led initiatives to maintain peace and security in Africa, especially the West African sub-region. Nigeria was a influential frontline state that contributed to the anti-Apartheid movement. It played a crucial role in the ECOWAS Monitoring Group that helped to broker peace in Sierra Leone and Liberia. In many respects, it is considered a regional power that could help in the maintenance of peace and security in the African region. However, intermittent outbreaks of ethnic, religious, communal and regional conflicts in the country indicate that Nigeria is still confronted by the unfinished business of maintaining social cohesion. It is the paradoxical weakness of Africa’s behemoth state that prompted the United States National Defence Committee’s2005 warning that the country might disintegrate in 15 years if steps were not taken to address certain fundamental threats to its corporate existence. In 2003, the United Nations Human Development Report (2002) classified Nigeria as one of the most fragmented countries in the world. Nigeria also meets most of the criteria for fragility-stagnant economies from 1990 to 2004, World Bank’s LICUS and DFID’s fragile states (Francois and Sud 2006:160).
10.2 Dimensions of Fragility
10.2.1 Authority Dimension
Unlike the other case studies considered so far, Nigeria has not experienced any serious territorial threat in the past three decades, although it has witnessed some major ethno-religious and communal clashes. The most significant threat to Nigeria’s corporate existence occurred between 1967 and 1970, when the country , experienced a civil war following the decision of the government of Eastern Region to secede as and assume nation-state status as Republic of Biarfra. The Biafran war resulted in around 75,000 military casualties on both sides, but the civilian effects were massive, with reportedly over 2 million deaths due to disease and starvation linked to the conflict.

CRISE Working Paper No. 51
72
The civil war was a culmination of a political crisis that was brewing even before the country attained independence in 1960 often resulting in civil revolts and deployments of the military to restore order. For instance, during the First Republic the military was deployed to quell the revolt of the Tiv in the Middle Belt region and the political crises in the Western Region. Controversies over population census during this period also brought the country close to the brink of collapse. In February 1966, shortly after the collapse of the First Republic, Isaac Adaka Boro an undergraduate at the University of Nigeria in Nsukka declared the formation of the Niger Delta Republic to liberate the Ijaw minorities from perceived Igbo domination in the Eastern Region. The revolution was quelled after 12 days by a joint police-military force. In May 1966, there was a second military coup which was considered a counter-coup to terminate the short-lived military junta headed by Gen. Thomas Aguiyi Ironsi. Many southerners fled to the South following the massacres of southerners, mostly Igbo residing in northern cities. A reverse pattern took place with northerners leaving southern cities in droves as a result of fears of reprisal attacks. The military, bureaucratic and political elites could not resolve the crisis and on May 30, 1967, the Governor of Eastern Region, where the Igbo were concentrated, declared the secession of the region from the Federal Republic of Nigeria. The region was proclaimed the Republic of Biafra. The decision of the federal military government under General Yakubu Gowon to protect the territorial integrity of Nigeria resulted in a civil war that lasted till January 12, 1970.
Following the military defeat of the Biafran secessionists, the military regime adopted a ‘no victor no vanquished’ policy aimed at reintegrating and rehabilitating the Igbo in . However, 30 years after the end of the civil war, a new generation of Igbo have formed a movement aimed at restoring the Biafran State. The Movement for the Actualisation of the Sovereign State of Biafra (MASSOB) is currently the only organisation in the country that has openly announced a secessionist mission. The group has justified its campaigns on the grounds that the Igbo people have been marginalised since the end of the civil war despite assurances of full integration. Although there is no clear evidence of support for the group’s secessionist goal among the Igbo people, it seems there is some sympathy for the group among some Igbo youths. This is evidenced by the appearance of Biafran flags in many Igbo communities. In the past five years, Igbo traders in major Nigerian cities have closed their shops to mark ‘Igbo Day’. It is not clear whether the closure was based on support for or fear of MASSOB, which had declared May 27 of every year as ‘Igbo Day’ and often deployed armed youths to enforce closure of stores in some Igbo towns. There have been violent clashes between security agencies and MASSOB activists. Ralph Uwazurike, the MASSOB leader, is still standing trial for treason. There are no strong indications that MASSOB’s mobilisation would pose serious threats to Nigeria’s territorial integrity. This is partly because mainstream Igbo political leadership and the Igbo masses do not support secession. Nevertheless, perceptions of marginalisation and exclusion of the Igbo evidenced by ongoing mobilisation of Oha-Na-Eze Ndigbo, the umbrella body of Igbo elites and Governors of the South East states for an Igbo presidency is likely to indirectly mobilise support for MASSOB among the Igbo. In 2007, Oha Na Eze accused the Federal Government of double-standards when the courts refused to grant bail to the MASSOB leader who was bereaved of his mother after the government granted amnesty to other activists charged for treason.
While Nigeria has not seen a return to territorial threats to state authority, violent mobilisation surrounding the rich resources of the Niger Delta has emerged as an important new threat to state authority. In the early 1990s, the Niger Delta, which supplies the oil and gas that sustains the Nigerian state, witnessed the emergence of social movements demanding resource control. Consequently, the federal military government increased the proportion of revenue that is distributed on the basis of derivation from 1.5 per cent to 3 per cent and announced the establishment of an Oil

CRISE Working Paper No. 51
73
Minerals Producing Areas Development Commission (NDDC). Ethno-political organisations in the region regarded the concession as paltry. They reckoned that the percentage of revenue allocated on the basis of derivation was 50 per cent when cash crop was the major source of government revenue. They argued that the derivation component was reduced because oil was exploited from a region peopled by minority ethnic groups. One of the pioneer champions for resource control is the Movement for the Survival of Ogoni People (MOSOP). MOSOP mobilised the Ogoni people in Rivers State to boycott the 1993 presidential elections. The hanging of Ken Saro-Wiwa leader of MOSOP and eight other activists in November 1995 on charges of murder and military invasion of Ogoni communities only provoked the proliferation of other groups across the region.
In 1998, the Ijaw Youth Council (IYC) issued an ultimatum to oil companies to quit the region or face unpleasant consequences. Subsequently youth groups in the region have occupied oil facilities and stopped oil production. Although the derivation revenue was increased to a minimum of 13 per cent in the 1999 Constitution and the federal government established the Niger Delta Development Commission, there is still turmoil in the region. In 2005, Niger Delta delegates walked out of the National Political Reform Conference (NPRC) because their demand for the graduated increase of derivation revenue to 50 per cent was not approved. Some militant groups such as the Niger Delta Volunteer Force (NDVF), Movement for the Emancipation of the Niger Delta (MEND) and Committee for Militant Action (COMA) have claimed responsibility for several attacks on oil installations, kidnapping of foreign oil workers, bomb explosions on military installations and killings of police and soldiers. The militant actions have increased since September 2005 when the federal government orchestrated the impeachment and subsequent detention of Governor D.S.P. Alamieyeseigha of Bayelsa State on money laundering charges. Some of the groups also asked for the release of Asari Dokubo, leader of the NDVF who was being tried for treason. The militant attacks have taken a toll on Nigeria’s oil production, leading to an increase in world oil prices. The government admitted in June 2006 that oil production had fallen by 25 per cent since the militant groups stepped up their attacks on the oil industry and the Nigerian military.
The quest for resource control has also intensified agitations for the election of a president from the South South. Although the politicians in the region are divided on who should be the president, they are resolute in the demand for a South-South president. Groups such as the South-South Peoples Assembly (SSPA) that champion the calls for a South-South president have hinged their campaign on the fact that the region which sustains the Nigerian state has never produced its top citizen. This campaign only succeeded in influencing the election of a Vice President from the Niger Delta in 2007 with the North producing the president after 8 years of the Obasanjo presidency.
10.2.2 Service Entitlements
Nigeria is a resource-rich country with a dual economy dominated by primary commodities. It is the world’s 12th largest oil producer and sixth largest exporter from the Organisation of Petroleum Exporting Countries (OPEC). Nigeria also has the world’s fifth largest gas reserve estimated at 177 trillion cubic feet. Oil and gas respectively accounted for 89.5 per cent and 8.1 per cent of the country’s export in 2004. Since the 1970s, petroleum has accounted for between 70 and 80 per cent of total government revenues. A comparison of the contribution of oil to government revenue over a 30 year period reveals increasing oil dependency. For whereas oil accounted for 26.7 per cent of federal government revenue in 1970, its contribution in 2000 was 83.5 per cent. Other sources of revenue to government are company taxes, import and export duties and licences fees from telecommunications. Direct taxation such as personal income tax and property taxes is not a significant source of revenue. Since 1970, there has been
CRISE Working Paper No. 51
74
declining investment in agriculture, which was previously the mainstay of the economy. Agriculture remains important because it employs about 70 per cent of the country’s population and accounts for 40 per cent of GDP. However, the sector is limited by labour-intensive farming techniques. The country is still a net importer of food, especially rice and wheat. The manufacturing sector accounted for 4.75 per cent of GDP in 2002 and industrial capacity utilisation was below 35 per cent between 1995 and 2005. Although the country remains a net importer of essential goods, liberalisation of the telecommunications, oil and gas, and financial sectors has attracted substantial foreign investment in the last six years. Government dependence on oil is threatened by simmering violent conflicts in the oil-producing Niger Delta region.
Despite its rich resource profile, the human development index (HDI) of Nigeria is very poor and is worsening. The country ranked 151 in the UNDP HDI in 2002 but dropped to 158 a year later. A total of 183 out of 1000 live births died before the age of five in 2002. In 2003, the figure was 198. The infant mortality rates for both years were high at 110 and 98 respectively for 2002 and 2003. Between 1990 and 2003, 90 per cent of Nigerians lived on under US$2 per day and 34 per cent of the population lived under the national poverty line for the same period. In 2006, 34 per cent of Nigerians lived in extreme poverty. In 2004, the literacy rate was 67 per cent. Life expectancy in Nigeria in 2004 was 43.7 years. This was the result of the rising number of people living with HIV, which is estimated at 5 per cent of the population. The official rate of unemployment in 2002 was 10.8 per cent. This high rate of unemployment has resulted in a high index of economic dependency of 259 dependents per 100 workers. There are high levels of income inequality. The 2004 Gini coefficient for the country was among the highest in the world at 50.6 per cent. Income inequality is exacerbated by ethno-regional inequalities.
With the restoration of civil rule in 1999, the Olusegun Obasanjo administrationtried to address some of these structural problems with a view to enhancing human development. The administration introduced a National Economic Empowerment and Development Strategy (NEEDS) and established two institutions to combat corruption and financial crimes. Nigeria has also signed the United Nations Millennium Development Goals (MDGs) thus demonstrating commitment to eradicate poverty, promote universal primary education, reduce child and maternal mortality, promote gender equality and combat HIV/AIDS, malaria and other diseases by 2015. The progress report on the MDGs indicates that the country might meet targets for universal primary education, environmental sustainability and developing global partnerships. It is however ‘unlikely that the country will be able to meet most of the goals by 2015, especially the goals related to eradicating extreme poverty and hunger, reducing child and maternal mortality and combating HIV/AIDS, malaria and other diseases’ (FRN 2004: iv). In April 2006, Nigeria paid off $12.4 billion to the Paris Club in exchange for the cancellation of the remaining $30 billion of its official debts. The country has also recorded some successes in recovery of some monies deposited in foreign banks by former military head of state General Sani Abacha. Nontheless, power politics and corruption posed major threats to the reform programme. In May 2006, the National Assembly discontinued debates on a controversial constitutional amendment bill aimed at allowing the president and incumbent governors to contest a third term amidst allegations of bribery and blackmail.
The country has also laboured under a high debt burden. In 2000, for instance, the debt service obligation was 5 per cent of GDP. The money earmarked for debt servicing represented three times the national education budget and nine times the public health budget. Institutionalised corruption in the 1990s meant that moneys meant for social services were stashed away in foreign banks. In 1998, an estimated 70 per cent of private wealth was taken out of Nigeria. The result was deterioration in service

CRISE Working Paper No. 51
75
provisioning. For instance, a World Health Organisation (WHO) report on Nigeria indicated that:
The overall availability, accessibility, quality and utilisation of health services decreased significantly or stagnated in the past decade…The fact that health facilities physically exist does not mean that they function. Most of them are poorly equipped and lack essential supplies and qualified staff. In particular, the coverage of critical PHC interventions such as immunisations and access to safe water and sanitation has declined. (WHO n.d.:5)
Other sectors worst hit are education, power and road infrastructure. Teachers have had to strike over non-payment of salaries and poor working conditions with negative consequences for pupils and students. Many schools especially in the rural areas lack basic facilities and instruction is sometimes conducted under trees and or with pupils sitting on the bare floor. Epileptic power supply has created a seemingly endless boom for importers of generators which, coupled with periodic scarcity of fuel, have led to the ruination of small and medium scale enterprises and worsened living standards among the general populace. Motor accidents remain a major cause of death in Nigeria because of the poor and deadly conditions of roads. A rising crime wave has aggravated the decline in living standard. Armed robbers and criminal gangs have stretched state capacity to its limits. As the poorly equipped and poorly motivated police could no longer guarantee public security, private security companies and vigilante groups have proliferated across the country because ordinary citizens have sought alternatives to the failure of state security. Without proper control and coordination with the public security sector, vigilantes have often become involved in gross human rights violations.
10.2.3 Legitimate Governance
Establishing enduring and legitimate governance in Nigeria has been a major challenge throughout the independence period. The First Republic was bedevilled by intra and inter-party political conflicts prosecuted along ethno-regional lines. Issues that threatened stability were the allocation of federal projects, federal and regional appointments, ethnic discrimination, population censuses and elections. In 1962, there were riots in Northern Nigeria because the Tiv revolted against perceived Hausa/Fulani hegemony. There was a repeat census in 1963 because of disputes over the results of the 1962 census. In the same year, the Federal Government declared a state of emergency in the Western Region. Hundreds of lives were lost in the Tiv riots and the Western region political crisis. More lives were lost and properties destroyed in 1964 as a result of political violence that followed the elections in the Western Region.
The cumulative outcome of these outbreaks of violence and political debacles was the military coup of January 15, 1966. Although the coup was intended to address the political crisis, the manner of its prosecution aggravated the crisis leading to another military coup in July 1966. The second coup was originally aimed at the secession of the North. It was preceded by the massacre of thousands of south-easterners, mainly the Igbo in the North. The massacres were caused by the perception that the Igbo officers who carried out the first coup selectively killed prominent northern politicians. The subsequent promulgation of the unification decree was perceived as a ploy to consolidate Igbo domination.
The failure of Biafra and the division of the three powerful regions into 12 states prevented the rise of separatist agitation in the 1970s. However, the creation of the states encouraged ethnic and communal mobilisation. General Gowon was toppled in a palace coup in July 1975 for reneging on a promise to restore civil rule in October 1974.
CRISE Working Paper No. 51
76
The new military leader, General Murtala Mohammed, was assassinated barely six months after taking over on February 13, 1976, in a failed coup plot. The coup plot was linked to an alleged attempt to restore Gowon. Significantly, most of the coup plotters were from the Middle Belt and the ringleader was closely related to the former head of state. Thus, this was the third coup plot in the country that seemed to have ethno-regional underpinnings.
Although the military regimes succeeded to a large extent in their self-assigned task of ‘keeping the country together’, some of the evolving integrative policies had the unintended consequences of exacerbating ethnic and regional inequalities, suspicions and rivalries. The adoption of quotas in admissions to secondary and post-secondary schools, the location of educational institutions and federal projects and political appointments provided fertile ground for ethno-regional mobilisation even though the military regimes had banned ethnic associations. Evidence that a decade of military diktats and centralisation of power and resources did not significantly transform the ethno-regional basis of political mobilisation emerged in the Constituent Assembly, in which representatives of Nigerian peoples gathered in 1978 to debate the proposed 1979 Constitution. The deliberations of the Assembly were grounded on several occasions amid different controversies, notably over revenue allocation, a rotational presidency, presidential powers and the establishment of a federal sharia court. The divisions over these thorny issues were along ethno-regional and religious lines.
On October 1, 1979, the military handed over to a democratically elected government. The legitimacy of the Second Republic was put to the test from the outset as the second runner-up in the elections refused to concede defeat because of disagreements over the legal interpretation of the electoral laws. Abuse of power, tensions in inter-governmental relations and controversies over state and local government creation, the revenue allocation formula and elections threatened political stability. Hundreds of lives were lost in political violence in the aftermath of the 1983 elections. Corruption and economic recession led to falling living standards. This became the pretext for another military coup on December 31, 1983.
There were suspicions that the bloodless coup had ethnic underpinnings. It was allegedly aimed at pre-empting a coup by more radical sections of the military from the South. This suspicion was bolstered by the ethnic and religious composition of the General Muhamadu Buhari regime. The regime was sacked in a palace coup on August 27, 1985. Less than four months after it took power the regime of General Ibrahim Babangida claimed it had uncovered a coup plot. General Mamman Vatsa and eight other officers were convicted and subsequently executed for their roles in the alleged coup plot. In April 22, 1990, there was another failed bloody coup attempt.The failed coup was unique in the country’s political history because the coup plotters, led by Major Gideon Orkar did not pretend to harbour any nationalist agenda as they announced the excision the core northern states from the federation. The coup plotters were from the Middle Belt and Niger Delta regions of the country and were apparently opposed to Hausa-Fulani domination. In 1997, General Oladipo Diya, the Chief of General Staff, was convicted alongside several other Yoruba military officers for attempting to overthrow the Abacha regime. The coup was purportedly organised to serve the interests of the Yoruba people who believed they had been unjustly denied an opportunity to produce the president of the country when the results of the June 12, 1993, presidential elections were annulled. Instability manifested itself in frequent policy and personnel changes as successive military regimes sought to appease contending social forces.
Another threat to state legitimacy and, to an extent, authority, comes from the sporadic but regular outbursts of ethnic, religious and communal violence. Since the mid 1980s

CRISE Working Paper No. 51
77
when Christians alleged Moslem domination of the Buhari and Babangida military regimes and the enlistment of the country into the Organisation of Islamic Countries (OIC), there have been tensions in Muslim-Christian relations. Misunderstandings between Muslim and Christian students spread to major Northern cities. These riots became more frequent after the return of civil rule in 1999. The decision of 12 northern states to extend the application of sharia laws from civil to criminal cases resulted in riots in several northern cities between 2000 and 2003. The destruction of lives and property during such conflicts has led to massive population displacement. Although Nigeria has survived many religious riots in the North, two new dimensions of religious conflict pose great threats to the stability of the country. The first dimension is the tendency for Nigerian Muslims to launch attacks on Christians in response to global events. Religious conflicts were previously triggered by internal issues. In September 2001, Muslims attacked Christians in the northern city of Jos because President Obasanjo had condemned the 9/11 attacks on the United States. In 2006, Muslims attacked and killed Christians in some Northern cities over the controversial cartoons of the Prophet Mohammed by two Danish journalists. The second dimension is reprisal killings of northerners in southern states after the killing of southerners in conflicts in the North. For instance in 2006, irate Igbo mobs lynched northerners believed to be Muslims in the southern city of Onitsha following the killings of Igbo in the North over the Danish cartoons. These ethno-religious riots continue to threaten national cohesion and unity. They constrain the unfettered movement of persons across ethno-religious boundaries.
Interethnic and religious riots, which have triggered population displacement, are not the only constraint to free movement and national integration. There is also the fundamental problem of the discrimination against Nigerians ordinarily resident in towns outside their state and local government of origin. Nigerians who are considered non-indigenes face discrimination in employment, admission into schools, payment of higher fees and denial of rights to contest elections in the places of their abode. Violent conflicts that have been caused by the controversial indigene status include the perennial conflicts in Jos and Southern Plateau, Zango-Kataf and southern Kaduna, Jukun-Tiv Conflicts, Ijaw-Itsekiri and Itsekiri-Urhobo conflicts in Warri, and the Ife-Modakeke conflicts.28 Some of these violent conflicts have been triggered by the creation of local governments and competition for elective and appointed positions. Even where indigene status has not resulted in violent conflicts, the issue has contributed to the erosion of national unity.
In addition to military intervention in politics and inability of the Nigerian state to tackle perennial conflicts, the legitimacy of successive Nigerian governments has also been compromised by fraudulent elections. Over the years, the electoral process has been abused to such an extent that elections have been ritualised and popular votes no longer matter. The result of this is declining accountability of politicians and political parties to the general public. The situation became worse since the inauguration of the Fourth Republic with the emergence of political Godfathers that have replaced the electorates as electors. The political system has been overheated by conflicts between Godfathers and their protégés. Nearly 19 months after the elections were conducted, the legitimacy of federal and state governments inaugurated in May 2007 has been resolved.
10.3 Human Rights
Nigeria ranks high (4) on the Freedom House index on civil and political rights. The long years of military rule were also marked by severe violations of human rights. As the military regimes conspired to remain in power and implement unpopular policies, the media and civil society became targets of state violence. Newspapers, students unions
28 For a good summary of the discrimination against non-indigenes, see Human Rights Watch 2006.

CRISE Working Paper No. 51
78
and labour unions were proscribed and soldiers and police were routinely deployed to disperse protestors. University campuses were closed indefinitely to deter student’s agitations for provision of basic facilities. In 1987, a prominent journalist died after he opened a letter bomb allegedly dispatched by state security agencies. Human rights activists and journalists were detained and tortured. Prominent politicians and publishers of newspapers were either assassinated or threatened with assassination for opposing military rule.
Violation of human rights has persisted despite the return of civilian rule. There have been several politically motivated assassinations involving prominent politicians since 1999. Prominent victims include Chief Bola Ige, the attorney general and minister of justice; Chief Marshall Harry, leader of the opposition All Nigerian Peoples Party (ANPP); Chief A. K. Dikibo national vice chairman of the ruling Peoples Democratic Party (PDP) and the wife of Alhaji Abubakar Rimi, a presidential aspirant. Political opposition remains a high-risk activity in Nigeria. In 2003, Dr. Chuba Okadigbo a former Senate President died as result of complications from tear gas that the police used to disperse a political gathering he attended. In 2006, the police disrupted meetings of political and civil society organisations opposed to the plan to amend the constitution to allow the president and serving state governors to contest elections for a third term. The police have also committed some extrajudicial killings: the police confirmed that they had shot several thousand people suspected of being armed robbers. Some of the victims of police violence have been innocent citizens who refused to offer bribes to policemen at checkpoints. In June 2005, six people were killed at a police checkpoint in Abuja. There were also deaths at checkpoints in Benue State. Some of these deaths were linked to criminal activity on the par tof some members of the police force. For instance, in 2003 some policemen were convicted of robbing and killing a group of travellers on the Okene-Abuja Highway in the central region of the country.
Excesses, corruption and brutality of the security forces have alienated members of the public. This has led to public hostility towards the security agencies, occasionally resulting in the premeditated killing of soldiers and policemen. Such killings have attracted reprisal attacks by the security forces leading to gross violations of human rights. The most extreme reprisals occurred in Odi, Bayelsa State in 1999 and Zaki-Ibiam, Benue State in 2002 when soldiers invaded and burnt down villages in retaliation for the killing of soldiers by suspected vigilantes and ethnic militias. Human Rights Watch and Amnesty International annual reports confirm that torture of suspects is still endemic in Nigeria. Many suspects are routinely forced to admit to crimes they did not commit. Although there were improvements in freedom of expression and of the press, the state security services have continued to harass and detain journalist for performing their duties. In 2005, the security agencies raided media houses for publishing information deemed inimical to the interest of top members of government. In 2006, the security services threatened to close down the African Independent Television (AIT) for transmitting live coverage of the legislative debates on the contentious third term bill.
10.4 Social Exclusion: The North-South Polarisation
Although the North, the South-West and the South-South collaborated to quell the secession of the South-East during the civil war, the north-south cleavage is the most enduring fault-line for political competition and conflict in Nigeria. This cleavage can be traced to the decision of the British colonial administration to administer the South and North as different entities. In 1939, the British divided the South into the Eastern and Western Provinces but left the North intact despite the fact that its size was more than the combined size of the Eastern and Western Provinces. The lopsided federation became the source of subsequent northern domination of the federal legislature and executive. Successive division of the country into states has consolidated northern

CRISE Working Paper No. 51
79
advantages. While the South has 17 states and 357 LGAs, the North has 19 states and the federal capital territory as well as 417 LGAs. Since revenues are allocated to states and LGAs, the North has taken more of the revenues allocated on the basis of equality of states. This also means that the North has more legislators at the National Assembly and more ministers in the federal executive council. As Figure 12 shows since independence, the North has produced more federal ministers than the South. Allegations of northern domination are rife in the South because the North has produced eight heads of government who have ruled the country for 34 out of 46 years of independence. Between 1984 and 1998 the North also produced 63 per cent of members of the ruling military councils.
Figure 13: Nigeria – Regional origins of federal cabinet members, 1960 – 2004 Source: compiled from Mustapha 2004.
However, while the North seems to have dominated politically, the South has fared better in terms of socio-economic developments. This is due to the early access of the south to western education and the development of trade and industry in southern cities. British colonial policies discouraged missionary activities in the northern region. The gap in education has persisted at all levels of education. While the net attendance ratio (NAR)29 for primary school in 2003 was 51.2 per cent in the North, it was 81.73 in the South. Similarly, the North had 28.83 NAR for secondary school while the South recorded 53.66 per cent. The gap is wider at the tertiary level of education. For instance, 80 per cent of candidates admitted into Nigerian universities in 2000/01 were southerners. The result of this educational gap is that the South has historically provided more manpower for the civil service, the professions and the organised private sector. This disparity in education and the concentration of secondary economic activity in the South has also meant that levels of poverty are higher in the north than in the south. As is evident in Figure 14, southern households had more access to electricity, television, flush toilet and phone than northern households in 2003. A regional poverty headcount
29 The NAR is the percentage of the primary-school-age (6-11 years) and secondary-school-age (12-17 years) population that is attending schools. (NPC and ORC Macro 2004: 17)

CRISE Working Paper No. 51
80
conducted in 1996 also revealed a higher concentration of the poor in the North (70.6 per cent) than in the South (57.36 per cent).
Figure 14: Nigeria – household socio-economic characteristics by North-South division, 2003 Source: Compiled from NPC and ORC Macro 2004
The situation whereby the South enjoys relatively higher living standards and supplies more technocrats and bureaucrats but the North produces more public office holders has been a major source of instability in the country. There was a marked increase in violent conflicts involving northern and southern communities after the election of a southern president in 1999. Northern politicians accused the new president of marginalising the North in political appointments. The northerners began agitating for the return of the presidency to the North in 2007. It is not surprising therefore that the North used its majority in the National Assembly to kill the third term bill. However, while the North insisted on having the presidency back, politicians from the South especially the South-South and the South-East are claiming it is the turn of the South-South and South-East to produce the presidency. The controversy over which region should produce the next president raised tensions across the country as the 2007 elections approached. It was alleged that President Obasanjo wanted a southern successor in violation of a pact which produced a southern president in 1999. The matter was resolved with the decision of the ruling Peoples Democratic Party (PDP) to nominate Alhaji Umaru Musa Yar’Adua, a Hausa/Fulani and northerner as its presidential candidate in December 2006.
The struggle for the presidency derives from the centralisation of power and concentration of resources in the federal government during the years of military rule. These powers were retained in the 1999 Constitution which vests major appointments such as the electoral commission, the population commission, the anti-corruption commissions, the judicial and police services commission, and heads of the Police, Army, Navy and Air Force in the president. These powers conferred on the president are deemed to grant the president overbearing influence over the federal legislature and state governments. Unfortunately, the constitutional reform initiatives aimed at reducing the powers of the presidency and the federal government failed after they were hijacked to serve the opposite objective.

CRISE Working Paper No. 51
81
10.5 Conclusion
An opinion survey conducted in 2001 indicated that most Nigerians (74 per cent) wanted Nigeria to remain intact despite the persistence of ethno-regional and religious conflicts (AROBAROMETER 2002). This would suggest that the country is not about to fall part. Such a perception is bolstered by the fact that conflicts in the country have been confined to particular regions and consequently some analysts have argued that they are not sufficient to threaten the integrity of the Nigerian state (Mustapha 2006, Suberu 2006). However, although the country has managed to survive the challenges that it has encountered on its journey to nationhood this discussion has shown that its future as a single political entity cannot be taken for granted. Regional inequalities, ethno-regional political struggles, incessant violent ethnic and religious conflicts and discrimination against non-indigenes pose grave threats to national unity.
It is instructive that the AFROBAROMETER survey revealed regional disparities in support for national unity. While support for national unity was highest in the North, it was lowest in the South-East and the South-South. Incidentally, as this discussion has shown, there has been a resurgence of separatist agitation in the two regions. The Nigerian state seems to have lost control of some sections of the oil-producing region, which is currently controlled by ethnic militias. The proliferation of small arms and light weapons in the country in the midst of perennial ethno-regional conflicts and the rise of militant organisations remains a major cause for concern. Significantly, some of the militant groups in the Niger Delta are believed to have used funds derived from oil theft to procure weapons. Mass alienation and chronic youth unemployment in the region have popularised the militant groups.
Moreover, although the practice of Nigerian federalism has helped to defuse tension that arose from the adoption of sharia by 12 northern states, religious conflicts remain endemic. There seems to be a conscious effort to draw Nigeria into globalised religious conflicts. In 2004, a sectarian group known as the Taliban took control of some villages in North-eastern Nigeria. In 2005, Nigerian security sources alleged that Al Quaida had sent fighters to Nigeria. Some of the Niger Delta militants were reported to have received training in North Africa. The leader of the NDVF has curiously also converted to Islam. The intervention of international factors is also evidenced by the rising importance of Nigerian oil following the Iraq war and tensions in US-Iran relations over Tehran’s nuclear programmes. The US Navy has reportedly embarked on patrols in the Gulf of Guinea.
The combination of national and international factors poses dangers to Nigeria’s corporate existence in the long term. As both the North and South insisted on producing the next president, there were fears that the 2007 elections may been used to destabilize the country. Another source of tension as the elections approached was the disqualification of some candidates by the electoral commission. It was widely believed that the disqualifications were politically motivated and targeted at opponents of the president, especially Vice President Abubakar Atiku Abubakar and his supporters. The prompt intervention of the judiciary, which quashed the controversial disqualifications, and the decision of the political class to abide by zoning arrangements helped to diffuse tensions. However, as earlier stated the large-scale fraud in the elections have raised questions about the legitimacy of the government.
This discussion has shown that poverty, corruption and lack of good governance are sources of state fragility in Nigeria. The international community has already taken commendable steps to combat corruption in Nigeria and grant the country some debt relief. More needs to be done in the area of investment especially outside the oil and gas sector. Concentration on the oil and gas sector is likely to reinforce regional inequalities.

CRISE Working Paper No. 51
82
Ultimately, whether Nigeria will remain or disintegrate will depend on the resolution of the national question. There is no doubt that only Nigerian political leadership will resolve the issue. Still, the international community, especially influential governments, the International Financial Institutions (IFIs) and multinational oil companies can help. They can do so by supporting the adoption of more equitable revenue derivation and allocation formulas, monitoring of arms flow to the country and provision of capacity-building assistance targeted at vulnerable social groups. Support aimed at strengthening the electoral institutions and processes to guarantee free and fair elections would also be useful in the addressing the legitimacy deficits of Nigerian governments.

CRISE Working Paper No. 51
83
11 Sudan 11.1 Background
The Republic of Sudan is characterised by state fragility, human poverty, inequality and conflict. The country has been in a state of civil war for a majority of its half-century of independence, and its neighbours include many similarly poor and conflict-racked states. This background study details the nature of economic, social and political exclusion in Sudan, with particular attention to human rights aspects and the direct effects of state fragility.
Sudan is geographically the largest country in Africa, comprising a little more than 10 times the land mass of the UK, but its population of only 35 million (UNDP 2005a – data for 2003) is less than half that of neighbours Egypt (71 million) and Ethiopia (73 million). The population is, according to the CIA World Factbook, ‘black 52 per cent, Arab 39 per cent, Beja 6 per cent, foreigners 2 per cent, other 1 per cent’ and ‘Sunni Muslim 70 per cent (in north), indigenous beliefs 25 per cent, Christian 5 per cent (mostly in south and Khartoum)’.
‘Black’ groups include the Dinka, the largest ethnic grouping in Sudan with a population of perhaps 2 million, the Fur who live principally in Darfur (literally: land of the Fur), the Nuer (second-largest group, primarily in the south and in Ethiopia), the Zaghawa (less important in Sudan but the dominant group in neighbouring Chad and including a number of leaders of Darfur rebel groups) and the Beja (more important in the east of Sudan and in neighbouring Ethiopia and Eritrea). ‘Arab’ groups include the Danagla, Gaalien and Shaigia (the dominant groups from the northern states) and the Baggara (a Bedouin group that exists primarily in Darfur and Kordofan). The distinction between ‘Arab’ and ‘Black’ is of course misleading, given that many of the ‘Black African’ groups claim, or did claim until recently, Arab ancestry (El-Tom 2004 includes the Zaghawa, Fur, Berti, Slamat and Meidobe here).
The existence of Sudan as a country can be traced to the 19th century unification of previously separate states by Egypt, through the latter’s attempts to control first, much of the current north, then to add the south. The Mahdi-inspired rebellion that took Khartoum in 1885 was able to establish an effectively nationalist state, and was only removed in 1898 by the British-Egyptian force that would hold power until the granting of formal independence in 1956.
A parliament had been established two years previously in 1954 as part of moves to self-determination, but only lasted until the military coup of 1958 – a pattern that was repeated over the next 50 years. Popular demand led to the reintroduction of democratic elections in 1965, but parliament’s perceived ineffectiveness gave support to a further coup in 1969 that brought the regime of Gafar Muhammad Nimeiri to power.
Nimeiri ruled for 16 years, including in 1972 the deal which ended the first civil war. This had run from 1955, triggered by southern concern over possible post-independence northern dominance. The separation had been entrenched under British administration, with distinct political structures and education systems, and English rather than Arabic as the official language in the south. When British policy shifted to favour a combined state after independence, the southern fear (ultimately confirmed) was that power would be concentrated in the hands of a northern, Arabic-speaking elite which had enjoyed greater autonomy previously.

CRISE Working Paper No. 51
84
In the Addis Ababa Agreement of 1972, Nimeiri achieved possibly his greatest success (recognised domestically and internationally) in obtaining peace in exchange for limited autonomy for a single southern entity (rather than three separate provinces). Over time, Nimeiri moved away from pan-Arabist socialism and towards a more market-led and Islamist stance. After allying with the Muslim Brotherhood in 1981, Nimeiri imposed sharia law in 1983. This caused widespread unrest and in the south, whose autonomy it violated, the resumption of civil war. In 1985 Nimeiri was deposed.
The second democracy that followed was again short-lived. A succession of coalitions took varying positions on matters including sharia law, economic policy and negotiations with the SPLA, and little progress was made. Sadiq al-Mahdi of the Umma Party (the largest in parliament, representing the Islamic Ansar movement) was president throughout. The Ansar movement’s relative strength in Darfur and Kordofan, and the fact that the initial coalition included three northern and four southern parties, reflecting the breadth of the discontent with Nimeiri and the importance for the whole country of ending the civil war, produced a broadly representative government.
Al-Mahdi has been blamed for attempting to maintain a version of sharia law, despite its unpopularity, and resolve the civil war simultaneously. These failures were compounded by failure to produce economic benefits in the north. This followed partly from the others, but was also due to a less supportive US – significant aid flows to the Nimeiri dictatorship became, for the severely fiscally constrained democracy a net outflow (Anderson, 1999). Ultimately, these failings undermined support for the government and a further coup in 1989 was led by then Col. al-Bashir, who established the Revolutionary Command Council that governs Sudan today.
The resumed civil war is estimated to have cost 2 million lives and made a further 4 million people homeless. It was brought to a resolution, albeit an unstable one, with the signing in January 2005 of the Naivasha agreement between the government and the Sudan People’s Liberation Movement (SPLM). The terms of the deal allow for a power-sharing government, including a first vice-president from the SPLM, the sharing of oil revenues and a referendum on southern secession to be held six years later.
The west of the country, notably in Darfur but also Kordofan, has been in open conflict since February 2003, with two main rebel factions confronting government military forces and their proxies, the Janjawid. The most comprehensive mortality estimate stood at end-April 2006 at 450,000 additional deaths from violence, malnutrition and disease caused by the conflict (Reeves 2006). More than 2 million people have been displaced. The World Food Programme (2006) estimated there to be 6.71 million programme beneficiaries in Sudan for the year 2006, of which 32 per cent (though only 18 per cent of the food requirement) are in the south compared to 44 per cent (and 67 per cent of the food requirement) in the west.
The economy of Sudan combines historic reliance on agriculture with growing oil exports. Through the late 1990s, agriculture was responsible for around 40 per cent-45 per cent of GDP, roughly equally divided between crops and livestock. Services accounted for around 45 per cent, mainly made up of retail and catering (18 per cent), transport and communications (11 per cent) and finance, insurance and real estate (FIRE, 8 per cent). Finally, industry accounted for up to 15 per cent of GDP – split mainly between manufacturing and construction.

CRISE Working Paper No. 51
85
Table 22: Sudan – Basic development statistics with regional comparisons
Human development index (value) Life expectancy at birth
(years) GDP
(US$bn)
GDP per capita (US$)
1975 1985 1995 2003 1970-1975 2000-2005 2003 2003
C.A.R. 0.343 0.386 0.367 0.355 43.5 39.4 1.2 309 Chad 0.269 0.311 0.344 0.341 40.6 43.6 2.6 304 Congo, DR 0.414 0.431 0.393 0.385 46.0 43.1 5.7 107
Egypt 0.439 0.540 0.611 0.659 52.1 69.6 82.4 1220 Eritrea .. .. 0.409 0.444 44.3 53.5 0.8 171
Ethiopia .. 0.291 0.323 0.367 43.5 47.6 6.7 97 Kenya 0.461 0.530 0.524 0.474 53.6 47.0 14.4 450 Libya .. .. .. 0.799 52.8 73.4 .. .. Sudan 0.349 0.396 0.465 0.512 45.1 56.3 17.8 530 Uganda .. 0.412 0.412 0.508 51.1 46.8 6.3 249
Source: UNDP (2005a).
The important change of the last 10 years has been the growth in exploitation of natural resources – specifically oil (with natural gas expected to follow). By 2002 (the last year for which full data are available), petroleum was responsible for 8.4 per cent of GDP – from zero (officially) in 1998. This resulted in the relative contribution of other sectors falling – to 35.8 per cent of GDP accounted for by agriculture in 2002, and 40.7 per cent by services. The oil sector’s growth since has outstripped that of GDP (see e.g. ADB, 2004, though data availability is limited), furthering this rebalancing of output.
As a result, per capita income compares well with neighbouring countries to the south (see Table 22) – to the north, Libya and Egypt are significantly better off. GDP per capita in 2004 was also $530, well below the cut-off for low-income countries of $825. In broader terms, Sudan ranked 141 in the 2005 Human Development Index, just above the cut-off point (those countries ranked 146 or below) for the classification of ‘Low’ human development. Table 22 also shows how Sudan’s human development score has improved steadily since 1975, despite ongoing conflict; a pattern that is less convincing or even reversed among southern neighbours.
11.2 Human rights performance
Sudan scores consistently at the bottom on respected internationally comparable indicators of political and civil rights. On the Freedom House measures of political and civil rights, scored from one to seven where seven indicates ‘least free’, Sudan scores seven for each. For Amnesty International’s political terror index, scored from one to five with the higher number indicating most terror, Sudan scores 4.75. The anonymous publication of the Black Book (see Section 11.3 below) is an indicator of the difficulties faced by those wishing to highlight shortcomings of the regime, but basic political and rights to expression are also routinely violated.
Newspapers are regularly shut down or disciplined over their coverage, and NGOs such as Amnesty have frequently documented beatings, imprisonment and seizure of output. In awarding Majoub Mohamed Salah with the 2005 Golden Pen of Freedom for more than 50 years of journalism in Sudan, the World Association of Newspapers described

CRISE Working Paper No. 51
86
him as a pioneer and a hero in ‘one of the most restrictive media environments in Africa’. Censorship was officially lifted in 2005, however, and Reporters without Borders (2006) state that since August 2005, ‘what was previously routine for Sudanese journalists, has become an exception.’
The state has failed much of the population in terms of the provision or guarantee of economic and social rights also. The following data from the 2005 Human Development Report (UNDP, data for 2003 unless stated) summarises the extent. Life expectancy (Table 1) stands at 56.3 years, while infant mortality is 63 per 1000 live births, child (under-5) mortality at 93. Primary school enrolment is 46 per cent (2002/3) and adult literacy 41 per cent.
Cobham (2005a) shows that the patterns of distorted regional expenditures are mirrored in basic health and education outcomes. Looking first at healthcare provision for births, regional differences are sharp. On data for 1999/2000, while doctors attended half of births in the North, and more than 40 per cent in Khartoum, the corresponding figure for the West (Darfur and Kordofan) is just 10 per cent. A doctor or health visitor attended more than 70 per cent of births in the North, but only a third of this number in the West. Almost 45 per cent of births in the West are completely unattended, but only 15 per cent of those in the North.
Female life expectancy and infant mortality show patterns consistent with these levels of care. Life expectancy for women varied from 49.2 years in the South, 53.6 in the East and 56.4 in the West, up to 58.8 in the North and 59.8 in Khartoum – women from ‘marginal’ regions outside the civil war in the south lived on average between two-and-a-half and five years fewer than those from the North. Male infant mortality is more than 20 per cent higher in the West and East regions, and almost 50 per cent higher in the South, than in the North. Only Khartoum fares better, and then only marginally. A similar pattern holds for female infant mortality. Where changes from 1993-2000 can be tracked, the overall picture is one of continuing disparity – with the East seeing greatest improvement and the West remaining furthest behind.
Literacy and school enrolment show a failure of provision across the whole country, but one that is of a different magnitude in the marginalised regions. For total literacy rates from 1993-2002, the only region to see an improvement was the North (10.6 per cent). The Central region fell least (2.6 per cent) thanks to a rise in the capital state Khartoum, followed by larger falls in the West (10.2 per cent) and then the East (13.8 per cent).
Underlying this is a more complex pattern of gender differences. Encouragingly, every region saw substantial (double-digit) increases in female literacy.30 The West’s overall fall is lower because it achieved the greatest relative increase (from the lowest base) in female literacy rates. But the male literacy rate fell by more than a third, compared to a drop of just 2.9 per cent in the North. While the general fall in male literacy may be seen as reflecting conflict with the south and difficulties related to donor withdrawal during the period, the regional pattern follows closely the observed allocation of government expenditures.
Data on basic incomes are scarce. There are no statistics for those living on less than $1 a day or other poverty lines. The World Food Programme (2006: 12-13) does, however, provide the following damning assessment:
30 By 2002/3, UNDP reports a gender ratio (girls/boys) in primary school enrolment of 0.83.

CRISE Working Paper No. 51
87
Information on income distribution in Sudan is very thin, and related measures for Sudan are not reported in the standard references. The most recent study available calculated poverty rates, Gini coefficients (a commonly used measure of income inequality) and average income levels for a number of localities in northern Sudan, using data from 1996. In this study, the mean and median values for the Gini coefficients were 61.13 and 60.5, respectively. This would have placed Sudan among the top 5 per cent of countries for which Gini coefficients were reported in the most recent Human Development Report, supporting the impression that the income distribution in Sudan is highly skewed. The average income in the wealthiest locality was more than ten times the average value and more than 100 times that of the poorest locality.
The report estimates that more than half the population would have been living below the $1 a day level in 2001. Significant growth since then in average per capita incomes, with the exploitation of oil, is likely to have had a beneficial impact – but just how much is unclear, and data are not available.
Finally, food insecurity is pervasive. The WFP (2006) presents data showing average meals per day around 2.5 across non-southern Sudan, and nearer 2 per day in the latter. The displaced of Darfur dominate in the calculation of external food needs, requiring approximately half a million of the 800 000 MT of food assistance. Other areas continue to face shortages however, albeit at less dramatic levels.
11.3 Social exclusion: economic, political and social
The primary narrative of political exclusion in Sudan is that proposed in ‘The Black Book of Sudan: Imbalance of wealth and power’, an originally anonymous analysis that was published in the capital Khartoum in 2000 and then widely circulated through photocopying. The authors were later revealed to be for the most part Muslim intellectuals, now associated with the Justice and Equality Movement (JEM) in Darfur. The book’s first part (in English translation: Anonymous, 2004a), which had a major impact on political discussion, sets out the extent to which governments of different persuasions have disproportionately appointed citizens from the northern regions in all areas of government, at the expense of all others.31 (Evidently the authors are far from ‘neutral’, and hence the claims should be treated with caution. Given the book’s rapid circulation and immediate impact, the government was forced to respond and deny its veracity; a second part rebutted this by listing every individual in each government by name, along with their regional origins.)
The authors of the Black Book sought to show the effect of this discourse on access to power in the Sudan. To do this, they determined the regional origins of each minister appointed in each government from independence in 1956 until 2000, and compared it with the underlying population distribution. Table 23 shows the pattern of regional representation in terms of the proportion of ministerial appointments under successive governments. As noted above, these swing between military dictatorship and elected parliament; but the over-representation of the northern states is a consistent feature of each. The ministerial share of the northern region varied between 60 per cent and 80 per cent, with the sole exception of the second democratic period (1986-89) when the share fell to 47 per cent. The northern regions’ population makes up less than 5 per cent of the total.
31 Note that this is not ‘the north’ as casually used to indicate all regions of Sudan bar the southern states; but specifically the northernmost areas (‘Northern’ and ‘River Nile’) – see table 22.
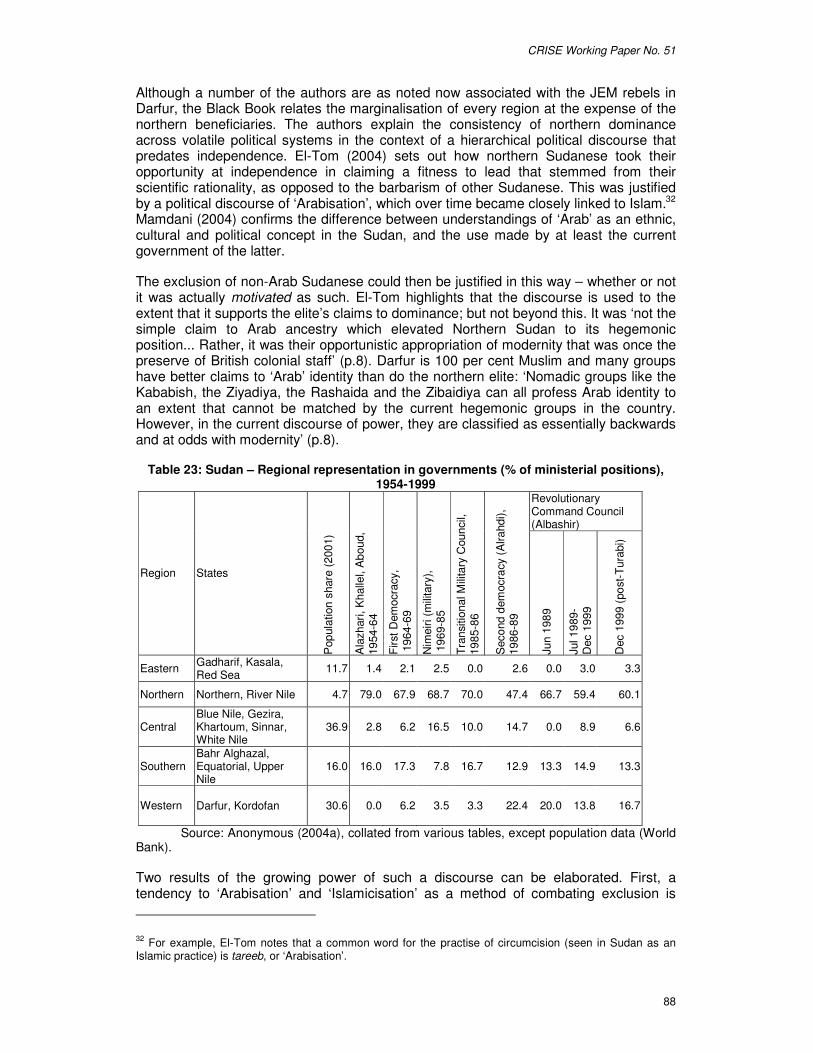
CRISE Working Paper No. 51
88
Although a number of the authors are as noted now associated with the JEM rebels in Darfur, the Black Book relates the marginalisation of every region at the expense of the northern beneficiaries. The authors explain the consistency of northern dominance across volatile political systems in the context of a hierarchical political discourse that predates independence. El-Tom (2004) sets out how northern Sudanese took their opportunity at independence in claiming a fitness to lead that stemmed from their scientific rationality, as opposed to the barbarism of other Sudanese. This was justified by a political discourse of ‘Arabisation’, which over time became closely linked to Islam.32 Mamdani (2004) confirms the difference between understandings of ‘Arab’ as an ethnic, cultural and political concept in the Sudan, and the use made by at least the current government of the latter.
The exclusion of non-Arab Sudanese could then be justified in this way – whether or not it was actually motivated as such. El-Tom highlights that the discourse is used to the extent that it supports the elite’s claims to dominance; but not beyond this. It was ‘not the simple claim to Arab ancestry which elevated Northern Sudan to its hegemonic position... Rather, it was their opportunistic appropriation of modernity that was once the preserve of British colonial staff’ (p.8). Darfur is 100 per cent Muslim and many groups have better claims to ‘Arab’ identity than do the northern elite: ‘Nomadic groups like the Kababish, the Ziyadiya, the Rashaida and the Zibaidiya can all profess Arab identity to an extent that cannot be matched by the current hegemonic groups in the country. However, in the current discourse of power, they are classified as essentially backwards and at odds with modernity’ (p.8).
Table 23: Sudan – Regional representation in governments (% of ministerial positions), 1954-1999
Revolutionary Command Council (Albashir)
Region States
Pop
ulat
ion
shar
e (2
001)
Ala
zhar
i, K
halle
l, A
boud
, 19
54-6
4
Firs
t Dem
ocra
cy,
196
4-69
Nim
eiri
(mili
tary
), 1
969-
85
Tran
sitio
nal M
ilita
ry C
ounc
il,
1985
-86
Sec
ond
dem
ocra
cy (
Alra
hdi),
19
86-8
9
Jun
1989
Jul 1
989-
D
ec 1
999
Dec
199
9 (p
ost-
Tura
bi)
Eastern Gadharif, Kasala, Red Sea 11.7 1.4 2.1 2.5 0.0 2.6 0.0 3.0 3.3
Northern Northern, River Nile 4.7 79.0 67.9 68.7 70.0 47.4 66.7 59.4 60.1
Central Blue Nile, Gezira, Khartoum, Sinnar, White Nile
36.9
2.8 6.2 16.5 10.0 14.7 0.0 8.9 6.6
Southern Bahr Alghazal, Equatorial, Upper Nile
16.0
16.0 17.3 7.8 16.7 12.9 13.3 14.9 13.3
Western Darfur, Kordofan
30.6 0.0 6.2 3.5 3.3 22.4 20.0 13.8 16.7
Source: Anonymous (2004a), collated from various tables, except population data (World Bank).
Two results of the growing power of such a discourse can be elaborated. First, a tendency to ‘Arabisation’ and ‘Islamicisation’ as a method of combating exclusion is
32 For example, El-Tom notes that a common word for the practise of circumcision (seen in Sudan as an Islamic practice) is tareeb, or ‘Arabisation’.
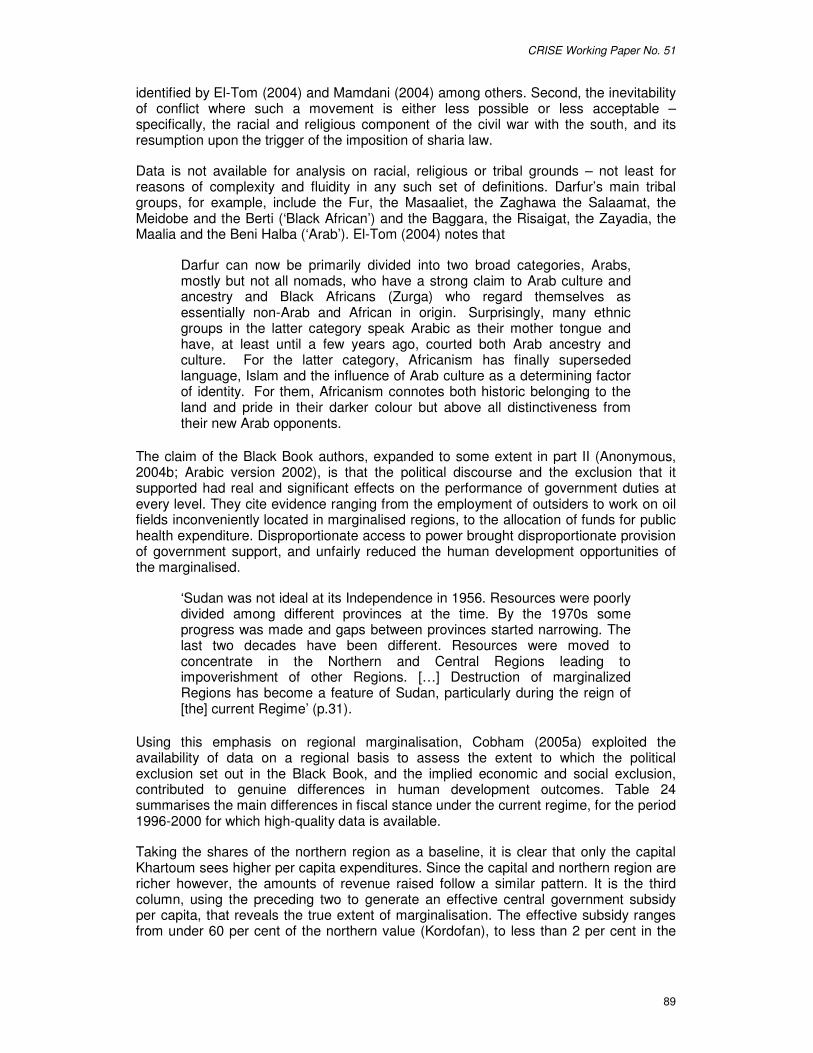
CRISE Working Paper No. 51
89
identified by El-Tom (2004) and Mamdani (2004) among others. Second, the inevitability of conflict where such a movement is either less possible or less acceptable – specifically, the racial and religious component of the civil war with the south, and its resumption upon the trigger of the imposition of sharia law.
Data is not available for analysis on racial, religious or tribal grounds – not least for reasons of complexity and fluidity in any such set of definitions. Darfur’s main tribal groups, for example, include the Fur, the Masaaliet, the Zaghawa the Salaamat, the Meidobe and the Berti (‘Black African’) and the Baggara, the Risaigat, the Zayadia, the Maalia and the Beni Halba (‘Arab’). El-Tom (2004) notes that
Darfur can now be primarily divided into two broad categories, Arabs, mostly but not all nomads, who have a strong claim to Arab culture and ancestry and Black Africans (Zurga) who regard themselves as essentially non-Arab and African in origin. Surprisingly, many ethnic groups in the latter category speak Arabic as their mother tongue and have, at least until a few years ago, courted both Arab ancestry and culture. For the latter category, Africanism has finally superseded language, Islam and the influence of Arab culture as a determining factor of identity. For them, Africanism connotes both historic belonging to the land and pride in their darker colour but above all distinctiveness from their new Arab opponents.
The claim of the Black Book authors, expanded to some extent in part II (Anonymous, 2004b; Arabic version 2002), is that the political discourse and the exclusion that it supported had real and significant effects on the performance of government duties at every level. They cite evidence ranging from the employment of outsiders to work on oil fields inconveniently located in marginalised regions, to the allocation of funds for public health expenditure. Disproportionate access to power brought disproportionate provision of government support, and unfairly reduced the human development opportunities of the marginalised.
‘Sudan was not ideal at its Independence in 1956. Resources were poorly divided among different provinces at the time. By the 1970s some progress was made and gaps between provinces started narrowing. The last two decades have been different. Resources were moved to concentrate in the Northern and Central Regions leading to impoverishment of other Regions. […] Destruction of marginalized Regions has become a feature of Sudan, particularly during the reign of [the] current Regime’ (p.31).
Using this emphasis on regional marginalisation, Cobham (2005a) exploited the availability of data on a regional basis to assess the extent to which the political exclusion set out in the Black Book, and the implied economic and social exclusion, contributed to genuine differences in human development outcomes. Table 24 summarises the main differences in fiscal stance under the current regime, for the period 1996-2000 for which high-quality data is available.
Taking the shares of the northern region as a baseline, it is clear that only the capital Khartoum sees higher per capita expenditures. Since the capital and northern region are richer however, the amounts of revenue raised follow a similar pattern. It is the third column, using the preceding two to generate an effective central government subsidy per capita, that reveals the true extent of marginalisation. The effective subsidy ranges from under 60 per cent of the northern value (Kordofan), to less than 2 per cent in the
CRISE Working Paper No. 51
90
east of Sudan. That low-level conflict is growing in the latter is perhaps not then surprising.
Table 24: Sudan – Relative per capita fiscal stance by region, 1996-2000 averages
Region Total expenditure per capita
Total revenue per capita
Effective subsidy per capita
Development expenditure per capita
North 100.0 100.0 100.0 100.0 Central 104.0 134.1 16.8 245.5
Khartoum 161.5 213.7 13.3 532.9 Central ex. Khartoum 60.6 70.9 23.8 35.5
East 73.7 98.4 1.6 79.5 West 44.1 43.9 43.3 17.0
Darfur 40.6 41.5 35.1 17.2 Kordofan 49.9 47.6 57.5 15.5
Source: Cobham (2005a).
The extent to which this pattern of fiscal bias contributed to worsening horizontal inequalities between regions is the next consideration. These wider elements of the pattern of regional marginalisation are explored below.
11.4 Fragility
The fragility of the state in Sudan can be seen in the failure to provide for the human rights of citizens, as set out above, and in the evidence of an apparently systematic undercutting of the human development opportunities of the majority of citizens in marginalised regions. The political power of the Black Book, highlighting just some of this pattern, provides a clear example of the role of that aspect of the state’s failings feeding back into the political instability as groups in different marginalised regions find common cause against the regime.
Apart from the tolerated and exacerbated regional inequalities, questions remain over the causes of the failures to ensure an adequate baseline level of provision in most of the country. The role of revenue generation requires attention – the question of whether the state is acting towards its limit, given restrictions on the ability to raise tax revenue, natural resource royalties and aid, or whether the failure to deliver services is at least partly due to irresponsible government.
Tax revenue as a share of GDP typically exceeds 30 per cent in the EU-15. In middle-income countries, 15-18 per cent is more typical. The average for sub-Saharan Africa during the 1990s was just over 16 per cent. In Sudan, by contrast, tax revenues as a share of GDP never exceeded 7 per cent. Averaging 6.2 per cent in 1991-93, they rose to 6.5 per cent in 1994-96 before falling off to 6.1 per cent in 1997-99 and 5.4 per cent in 2000. By the latter year, non-tax revenues had risen from less than 2 per cent to exceed tax revenues at 5.7 per cent.33
New IMF data show a more encouraging trend. From tax revenues of 5.4 per cent of GDP in 2002, measures to reform the system led to a figure of 7.5 per cent in 2004 but a predicted 7 per cent in 2006. Of these, direct taxes are least important (1.3 per cent of GDP compared to 5.7 per cent in indirect taxes) while non-tax revenues are forecast to soar to 16 per cent of GDP. (The latter is more than 90 per cent oil revenues.)
33 The data in this paragraph are drawn from Cobham (2005c) for country averages and Cobham (2005a) for Sudanese data.

CRISE Working Paper No. 51
91
The impression from the data is that the current regime in Sudan has not been willing to seek the levels of taxation that would have allowed improvements in provision of (minimally) health and education. The low value of taxes compared to those of roughly equivalent neighbouring countries suggests that it is indeed willingness (rather than ability) that has been lacking. The IMF is now focusing strongly on this, with the 2006 Article IV consultation paper stressing the need to ‘reinvigorate the reform momentum’ (p.12). Reforms have already introduced a VAT and removed income tax exemptions. The IMF recommends exemptions now be removed from the corporate tax system and the VAT, and a range of administrative efforts. With the exploitation of oil resources, and some improvements in tax collection stemming from IMF pressure, the revenues to increase expenditure are however now available. Questions remain over the willingness to use them. The revenue-sharing element of the Naivasha agreement, and the limited aspect of the Abuja agreement signed with one section of one of the two Darfur rebel groups, will force some regional distribution.
In terms of the longer-term impact for state fragility, the work of Ross (2004) is suggestive. He shows using cross-country data that the importance of taxation in strengthening channels of political representation (and hence bolstering fragile states) does not emerge from the ratio of tax to GDP, but rather ‘the price of government (i.e., the ratio of taxes to government spending) is associated with a subsequent rise in the level of democracy’ (p.24). The implication for Sudan’s fragility of increasing expenditure through dependence on oil revenues, while tax revenues continue to be well below the level of equivalent countries, is therefore not encouraging. The better-known resource curse arguments offer support for this view – Robinson, Torvik & Verdier (2006), for example, emphasise the centrality of institutions in allowing countries to avoid the costs of the curse.
Given that the pattern of regional exclusion appears to stem in significant part from deliberate government policy and a charged political discourse, and that this itself had led to wide inequalities and ongoing conflict and fragility even before the advent of oil, the failure of the state now to respond in a constructive manner will exacerbate the circular problems facing Sudan. A failed state that continues to pursue a policy of regional marginalisation and insufficient revenue mobilisation is likely to see greater conflict and further fragility, undermining the ability to raise revenues and address human rights failures stemming from sharp under-provision.
International actors pursuing access to natural resources, or other geopolitical aims, will not assist the longer-term development of a stable state. The harshest variant of this argument holds that both the Naivasha and Abuja agreements have been forced by external actors onto rebel movements but may not ultimately satisfy the civilian populations whose grievances are one main aspect of the state’s fragility. Failure to address this, or to put sufficient pressure on the other main aspect (the state’s policies of marginalisation), suggest a long-term solution has not been found.
The role for donors, given the existing situation, should be to ensure as far as possible a reversal of marginalisation while encouraging the construction of a stable system of (non-oil) revenue mobilisation that can eventually provide the baseline provision necessary.

CRISE Working Paper No. 51
92
ANNEX I: Methodology for statistical measures of progressive service failure We have argued for a progressive and absolute measure of service delivery. This annex explores how these measures might be developed and employed. We begin with the measure of progressive service delivery. One possible way of measuring state fragility in this dimension, then, would be simply to regress indicators of service delivery against GDP per capita and take the error term for each country as a measure of its progressive service delivery, as depicted in Figure 15 (see OECD for a similar approach). Countries falling below the line of best fit are failing to provide the level of service delivery one might expect of countries with similar level of GDP per capita.
0
20
40
60
80
100
120
4 5 6 7 8 9 10 11
GDP per capita (log)
Prim
ary
enro
lmen
t rat
e
Figure 15: Primary enrolment rate by level of GDP per capita
A clear problem with this, however, is the extension of the line of best fit beyond the maximum possible point (e.g. 100 per cent primary enrolment). This results in better-off countries emerging as fragile because, for instance, the regression predicts their enrolment rate should be 120 per cent, which is impossible. One possible way of obverting this problem is only to look at developing countries, but this is a somewhat arbitrary solution. We propose the following process.
1. GDP per capita is transformed into a shortfall index, as used in the computation of the Human Development Index. Arithmetically, this is given by the equation: GDP(i)=(actual value-minimum value)/(maximum value-minimum value). This index is used as the independent variable in the subsequent regressions.
2. The desired measures of service delivery are similarly converted into a shortfall index; where increases in the variable are associated with a worsening situation, the index is reversed, e.g. for child mortality, CMR(i)=1-(actual value-minimum value)/(maximum value-minimum value).
3. Each new measure of service delivery – e.g. CMR(i) – is regressed against the GDP measure, GDP(i) and an estimated variable stored – e.g. CMR(e). Where this predicted variable exceeds 1, it is re-set to 1. Figure 16 shows this in action.
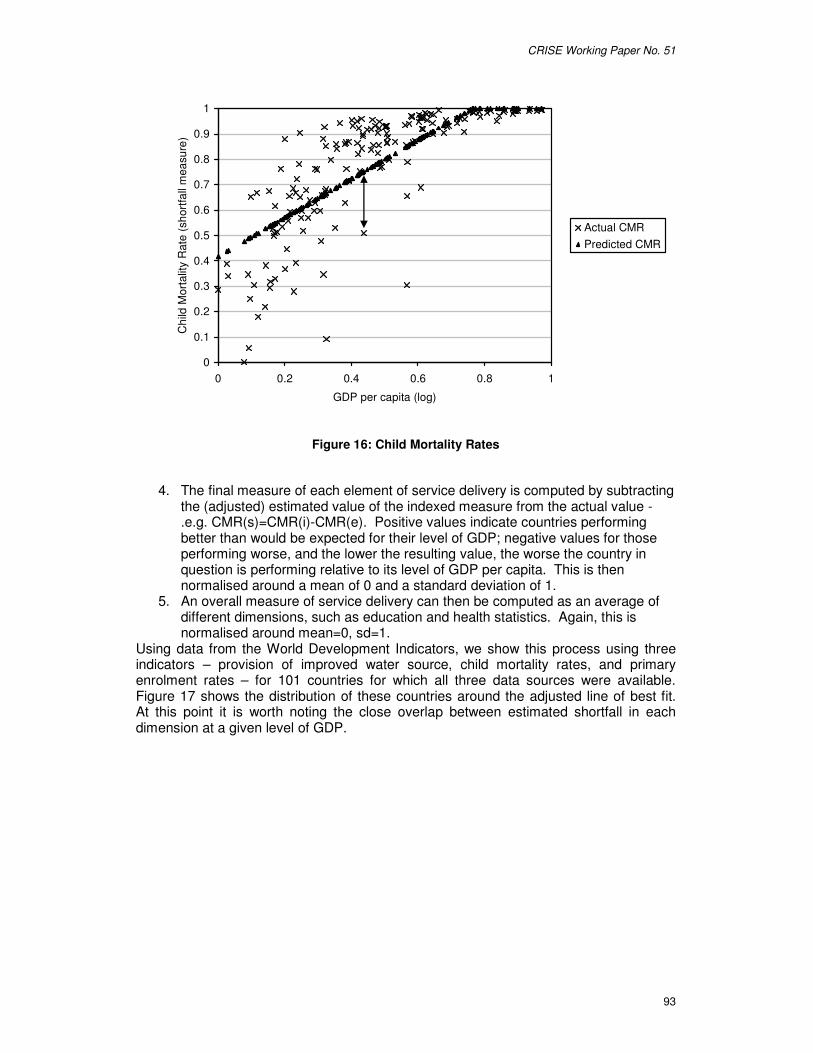
CRISE Working Paper No. 51
93
0
0.1
0.2
0.3
0.4
0.5
0.6
0.7
0.8
0.9
1
0 0.2 0.4 0.6 0.8 1
GDP per capita (log)
Chi
ld M
orta
lity
Rat
e (s
hort
fall
mea
sure
)
Actual CMRPredicted CMR
Figure 16: Child Mortality Rates
4. The final measure of each element of service delivery is computed by subtracting the (adjusted) estimated value of the indexed measure from the actual value - .e.g. CMR(s)=CMR(i)-CMR(e). Positive values indicate countries performing better than would be expected for their level of GDP; negative values for those performing worse, and the lower the resulting value, the worse the country in question is performing relative to its level of GDP per capita. This is then normalised around a mean of 0 and a standard deviation of 1.
5. An overall measure of service delivery can then be computed as an average of different dimensions, such as education and health statistics. Again, this is normalised around mean=0, sd=1.
Using data from the World Development Indicators, we show this process using three indicators – provision of improved water source, child mortality rates, and primary enrolment rates – for 101 countries for which all three data sources were available. Figure 17 shows the distribution of these countries around the adjusted line of best fit. At this point it is worth noting the close overlap between estimated shortfall in each dimension at a given level of GDP.
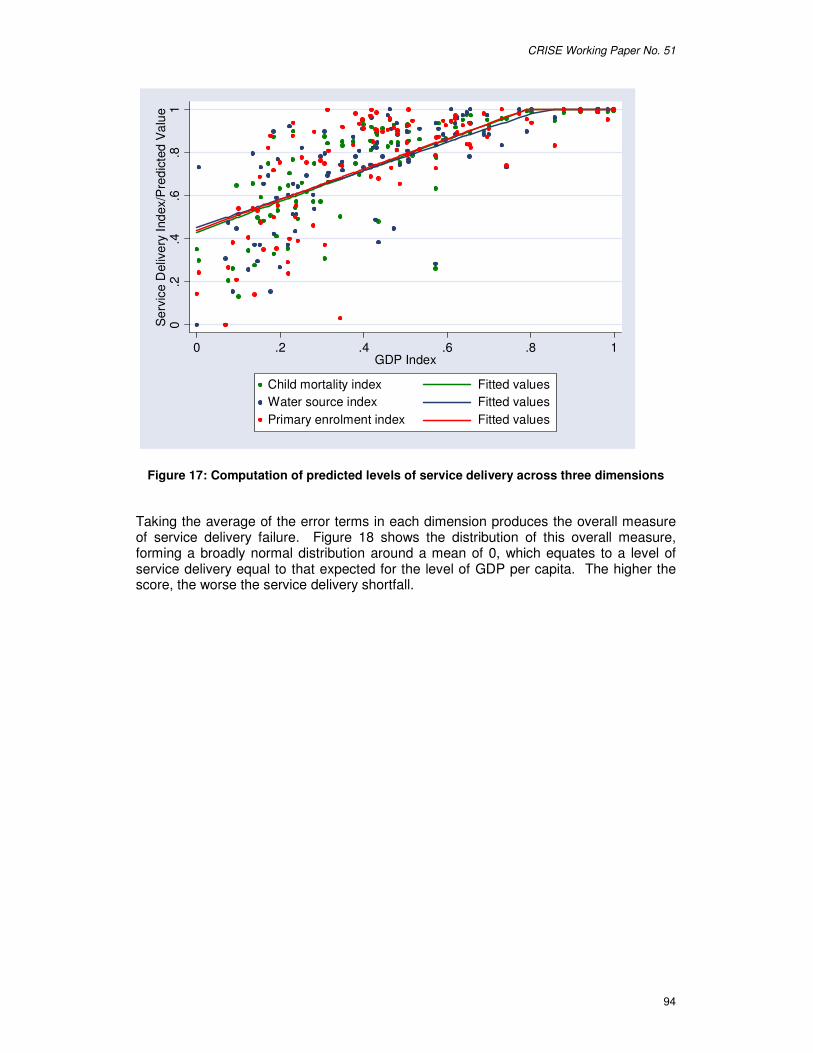
CRISE Working Paper No. 51
94
0.2
.4.6
.81
Ser
vice
Del
iver
y In
dex/
Pre
dict
ed V
alue
0 .2 .4 .6 .8 1GDP Index
Child mortality index Fitted valuesWater source index Fitted valuesPrimary enrolment index Fitted values
Figure 17: Computation of predicted levels of service delivery across three dimensions
Taking the average of the error terms in each dimension produces the overall measure of service delivery failure. Figure 18 shows the distribution of this overall measure, forming a broadly normal distribution around a mean of 0, which equates to a level of service delivery equal to that expected for the level of GDP per capita. The higher the score, the worse the service delivery shortfall.
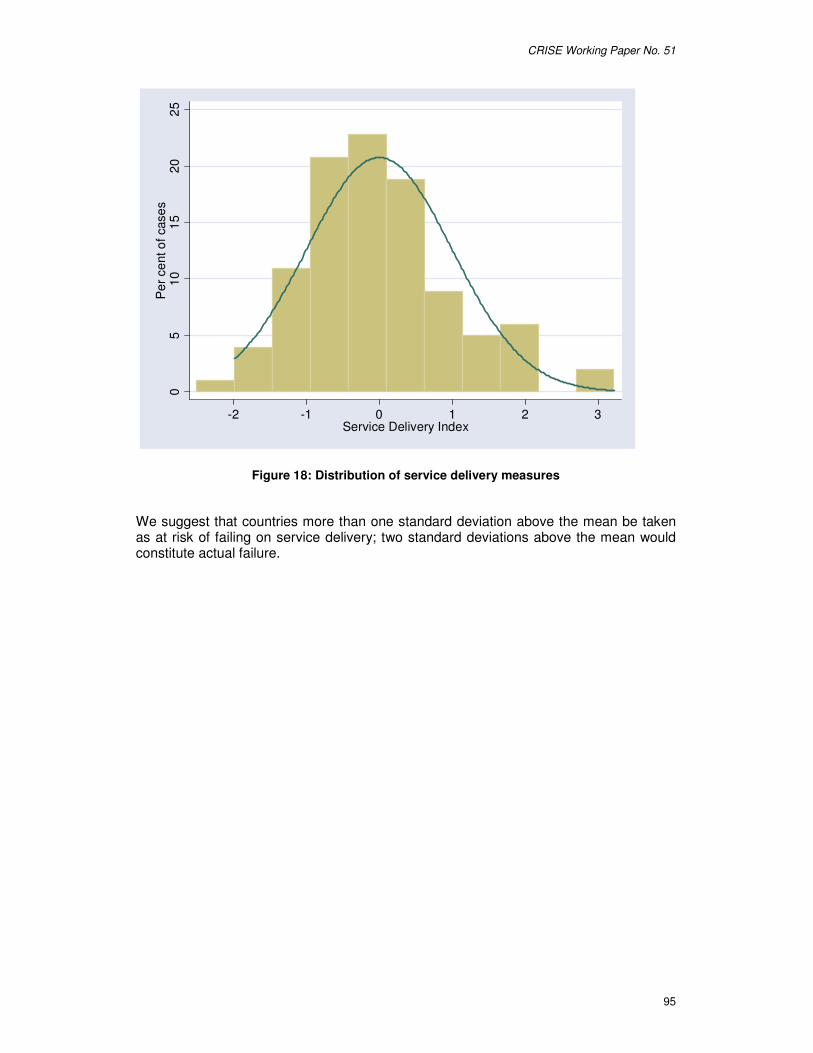
CRISE Working Paper No. 51
95
05
1015
2025
Per
cen
t of c
ases
-2 -1 0 1 2 3Service Delivery Index
Figure 18: Distribution of service delivery measures
We suggest that countries more than one standard deviation above the mean be taken as at risk of failing on service delivery; two standard deviations above the mean would constitute actual failure.

CRISE Working Paper No. 51
96
Annex II: Social exclusion and horizontal inequalities as a cause of fragility – a preliminary statistical analysis Table 25 shows the results of a simple regression analysis of the relationship between political discrimination and service delivery across six indicators and 111 countries, holding for the overall level of GDP per capita. Of the six variables, three – infant and child mortality and overall life expectancy – show a significant worsening relationship with increases in levels of political discrimination. It is interesting to note that the three variables in which political discrimination is not significant relate directly to services provided (or not) by the state – health and education; whereas the significant variables are those related to the impact (or ‘outcomes’) of service delivery on levels of basic welfare. This indeed has an intuitive logic to it – given that in most developing countries health and education delivery is well below universal, discrimination may not necessarily entail reducing the level of overall delivery, but simply discriminating in who get services or not. From this simple analysis the mechanism through which political discrimination affects the other three indicators is not clear and further investigation of this may be worthwhile. Intuitively, we might suggest two possible mechanisms. Firstly, it may be that the effect of the lack of service delivery to excluded groups on welfare outcomes is multiplicative so that where the lack of service delivery on different variables overlaps (i.e. the excluded group) the overall impact on welfare is greater. This would suggest that social exclusion does indeed impact directly on overall fragility in service delivery. Secondly, the causality may be indirect. Given that countries with high levels of social exclusion are more likely to experience conflict, the reduction in welfare standards associated with political discrimination may be the results of welfare losses from exclusion-induced conflict. This would confirm that political discrimination and social exclusion affect fragility both in the authority dimension – through its relationship with conflict – and, indirectly, in service delivery.
Table 25: Regression analysis: Political discrimination and service delivery, 2000
Dependent variable:
Infant Mortality Child
Mortality Life
Expect-ancy
Improved
Water Provision
Primary Enrol-ment
Secondary Enrolment
-21.46*** -37.78*** 6.03*** 10.16*** 7.96*** 12.53*** GDP per capita (log) (-12.84) (-10.68) (15.09) (9.76) (7.39) (9.71)
10.74** 18.70** -3.03*** 0.30 -1.44 -2.17 Discrimination Index (2.54) (2.43) (-2.85) (0.12) (-0.61) (-0.57)
197.98*** 332.26*** 22.08*** 7.32 24.57*** -33.81*** Constant (14.41) (11.95) (6.42) (0.91) (2.69) (-3.04)
N 110 105 111 93 84 67 R2
0.646 0.610 0.616 0.519 0.425 0.545 Sources: GDP and service delivery variables from World Development Indicators; Regression
with robust standard errors; Discrimination index calculated as a population-weighted average of the group-based political discrimination index in the Minorities At Risk dataset.
Using the measure of political discrimination described in Annex I, Table 26 reports the average level of discrimination across the countries analysed in Section 2, and reports the significance of the difference. Across all dimensions of fragility, the average level of discrimination is higher in the failing states than in the non-failing states, except for the absolute legitimacy measure, where the average is lower but the difference is statistically insignificant. Interestingly, the average level of discrimination in failing states is significantly higher across the service and legitimacy dimensions when the progressive measures of failure are employed, but not when the absolute measures are employed. Although these finding cannot help understand the causal direction of this relationship – whether social exclusion tends to lead to state fragility; whether fragile states tend to discriminate more; or a combination of the both – they do indicate that

CRISE Working Paper No. 51
97
there is clearly some significant relationship between social exclusion and state fragility across all dimensions worth further empirical investigation.
Table 26: Average level of political discrimination by types of state failure, with t-test significance results
Authority Failure
Absolute Service Failure
Progressive
Service Failure
Absolute
Legitimacy Failure
Progressive Legitimacy
Failure
Failure in at least 1 dimension
Failure in at least 2
dimensions
Not Failing 0.482 0.487 0.454 0.515 0.496 0.452 0.487
Failing 0.865 0.773 0.983 0.493 1.090 0.679 1.137 Stand. Err. of difference 0.204 0.258 0.199 0.170 0.365 0.129 0.280
Sig. of difference 0.032 ** 0.135 0.004 *** 0.551 0.053 * 0.040 ** 0.011 **

CRISE Working Paper No. 51
98
Annex III: Basic Data on State Fragility and Human Rights Compliance in Case Study Countries Authority Dimension
Table 27: Episodes of Armed Conflict in Case Study Countries, 1946 – 2005 Indonesia
Darul Islam 1953 War Regional Rebellions: Darul Islam, PRRI, Permesta 1958–61 Minor Republic of South Moluccas 1950 War
1965 Minor 1967–69 Minor OPM (Organisation for a Free Papua) 1976–78 War 1975–78 War 1979–89 Minor Fretilin, East Timor 1992 Minor 1990-91 Minor
Free Aceh Movement 1999-2005 Minor
Nepal Nepali Congress 1960–62 Minor
1996–2001 Minor CPN-M (Communist Party of Nepal-Maoist)/UPF (United People’s Front)
2002-06 War Guatemala
Military faction 1949 Minor Forces of Carlos Castillo Armas 1954 Minor
1965–67 Minor 1968 Minor 1969–87 War
Civil War: MR-13 (13 November Revolutionary Movement), FAR (Rebel Armed Forces), EGP (Guerilla Army of the Poor), PGT (Guatemalan Worker’s Party), ORPA (Organisation of Armed People), URNG (Guatemalan National Revolutionary Unity) 1988–95 Minor
Côte d'Ivoire MPCI (Patriotic Movement of Ivory Coast), MJP (Movement for Justice and Peace), MPIGO (Ivorian Movement for the Greater West) 2002-03 Minor
Forces Nouvelles 2004 Minor Nigeria
Military faction 1966 Minor Republic of Biafra 1967–70 War Ahlul Sunna Jamaa (Followers of the Prophet) 2004 Minor NDPVF (Niger Delta People’s Volunteer Force) 2004 Minor
Sudan Sudanese Communist Party 1971 Minor Islamic Charter Front 1976 Minor
2003-04 War SLA (Sudan Liberation Movement/Army), JEM (Justice and Equality Movement) 2005 Minor Anya Nya129 1963–72 War
1983–92 War 1993–94 Minor 1995–2002 War
SPLM (Sudanese People’s Liberation Movement), SPLM faction, NDA (National Democratic Alliance)130, SAF (Sudan Alliance Forces)
2003-04 Minor Source: PRIO/Uppsala Armed Conflict Dataset

CRISE Working Paper No. 51
99
Service Entitlements
0.0
0.2
0.4
0.6
0.8
1.0
1.2
1.4
1.6
1.8
2.0
1965 1970 1975 1980 1985 1990 1995 2000 2005
Rat
io o
f A
ctua
l CM
R to
Pre
dict
ed C
MR
IndonesiaNepalGuatemalaCote d'IvoireNigeriaSudan
Figure 19: Progressive Realisation of Child Mortality Service Entitlement in Case Study Countries, 1965 – 2005
Source: Calculated from WDI Dataset
Note: The chart shows the ratio between the actual child mortality rate (CMR) in each country against the country’s ‘predicted’ performance using the technique described in Annex I, repeated at 5 year intervals since 1965. Figures above 1 represent performance worse than expected; figures below 1 represent performance better than expected.
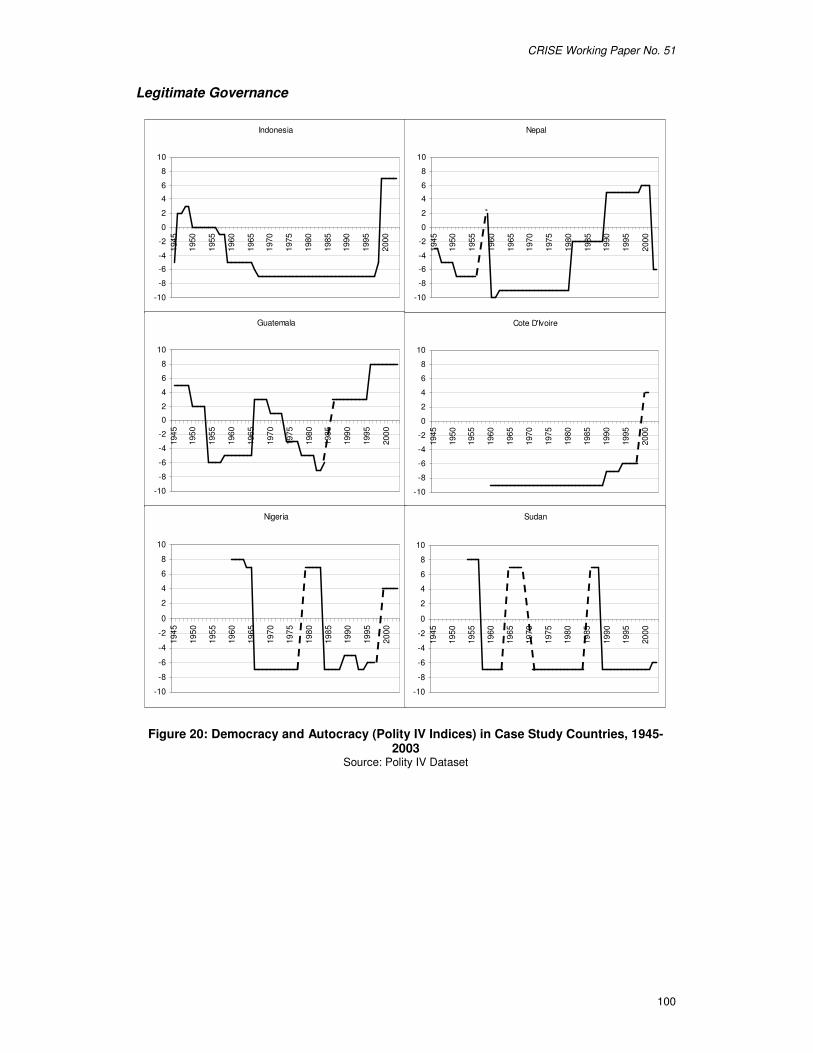
CRISE Working Paper No. 51
100
Legitimate Governance
Figure 20: Democracy and Autocracy (Polity IV Indices) in Case Study Countries, 1945-2003
Source: Polity IV Dataset
Indonesia
-10
-8
-6
-4
-2
0
2
4
6
8
10
1945
1950
1955
1960
1965
1970
1975
1980
1985
1990
1995
2000
Guatemala
-10
-8
-6
-4
-2
0
2
4
6
8
10
1945
1950
1955
1960
1965
1970
1975
1980
1985
1990
1995
2000
Nepal
-10
-8
-6
-4
-2
0
2
4
6
8
10
1945
1950
1955
1960
1965
1970
1975
1980
1985
1990
1995
2000
Cote D'Ivoire
-10
-8
-6
-4
-2
0
2
4
6
8
10
1945
1950
1955
1960
1965
1970
1975
1980
1985
1990
1995
2000
Nigeria
-10
-8
-6
-4
-2
0
2
4
6
8
10
1945
1950
1955
1960
1965
1970
1975
1980
1985
1990
1995
2000
Sudan
-10
-8
-6
-4
-2
0
2
4
6
8
10
1945
1950
1955
1960
1965
1970
1975
1980
1985
1990
1995
2000

CRISE Working Paper No. 51
101
Human Rights Compliance
Table 28: Dates of Ratification of or Accession to Major Human Rights Covenants and Conventions in Case Study Countries
CPPCG CERD ICCPR ICESCR CEDAW CAT CRC UN General Assembly 1948 1966 1966 1966 1979 1984 1989 Entry in to Force 1951 1969 1976 1976 1981 1987 1990 Indonesia - 1999 2006 2006 1984 1998 1992 Nepal 1969 1971 1991 1991 1991 1991 1990 Guatemala 1950 1983 1992 1988 1982 1990 1990 Cote d'Ivoire 1995 1973 1992 1992 1995 1995 1991 Nigeria - 1967 1993 1993 1985 2001 1991 Sudan 2003 1977 1986 1986 - - 1990
Source: OHCHR Website (www.ohchr.org)
Note: Dates correspond to ratification or accession, not signing
Key: CPPCG = Convention on the Prevention and Punishment of the Crime of Genocide; CERD = Convention on the Elimination of All Forms of Racial Discrimination; ICCPR = International Covenant on Civil and Political Rights; ICESCR = International Covenant on Economic, Social and Cultural Rights; CEDAW = Convention on the Elimination of All Forms of Discrimination Against Women; CAT = Convention Against Torture and Other Cruel, Inhuman or Degrading Treatment or Punishment; CRC = Convention on the Rights of the Child
CRISE Working Paper No. 51
102
References
ADB 2004 Sudan: Country dialogue paper 2003-2004, Tunis: African Development Bank. (Update of 2003 original)
Aditjondro, G. J. 2001 'Guns, pamphlets and handie-talkies: How the military exploited local ethno-religious tensions in Maluku to preserve their political and economic privileges', in I. Wessel and G. Wimhöfer (eds) Violence in Indonesia, Hamburg: Abera.
Afrobarometer 2002 ‘Violent Social Conflict and Conflict Resolution in Nigeria’, Briefing Paper, No. 2, August.
Ahmed , F. 2004. Democracy and human development. University of Oxford MPhil Thesis.
Akindes, F. 2003 ‘Racines des crises socio-politiques en Côte d’Ivoire et sens de l’histoire’, paper presented at the CODESRIA and Nordiska Afrika Institut conference, Identity, security and the negotiation of national belonging in West Africa. Reflections on the crisis in Côte d’Ivoire, Dakar, 15-16 May.
Amatya, D. B. 1987 Perspectives in Regional Problems and Regional Development in Nepal, New Delhi: Sterling Publishers.
Anderson, B. R. O’G. 1983 'Old state, new society: Indonesia's New Order in comparative historical perspective', Journal of Asian Studies 42(3): 477-496.
Anderson, N. 1999 Sudan in Crisis: The Failure of Democracy, Gainsville, FL: University of Florida Press.
Anonymous 2004a [original Arabic version 2000] The Black Book: Imbalance of power and wealth in Sudan, Translator: Anonymous, Khartoum: Justice and Equality Movement.
Anonymous 2004b [original Arabic version 2002] The Black Book part 2, Translator: Anonymous, Khartoum: Justice and Equality Movement.
Asociación de Investigación y Estudios Sociales, ASIES 2007 Monografia de los Partidos Politicos 2004-2007, ASIES, Guatemala.
Auvinen, J. and E.W. Nafziger 1999 'The sources of humanitarian emergencies', Journal of Conflict Resolution 43(3): 267-290.
Bakery, T. 1984 ‘Elite transformation and political succession,’ in W.I. Zartman and C. Delgado (eds) The Political Economy of Ivory Coast, New York: Praeger Publishers.
Banegas, R. and B. Losch 2002 ‘La Côte d’Ivoire au bord de l’implosion,’ Politique Africaine, 87, pp. 139-161.
Baral, L. R. 1983 Nepal's Politics of Referendum: A study of groups, personalities, and trends, New Delhi: Vikas Publishing House.
Baral, L. R. 2002 'Nepal in 2001: The strained monarchy', Asian Survey 42(1): 198-203.
CRISE Working Paper No. 51
103
Baral, L. R. 2005 'Democracy and elections: Trajectories of political development', in L. R. Baral (ed) Election and Governance in Nepal, New Delhi: Manohar.
Barrón, M. 2008 Gender and Ethnic Inequalities in Latin America: A Multidimensional Comparison of Bolivia, Guatemala and Peru, CRISE Working Papers no. 32, Oxford: Centre for Research on Inequality, Human Security and Ethnicity, University of Oxford.
Barrows, W. L. 1976 'Ethnic diversity and political instability in Black Africa', Comparative Political Studies 9(2): 139-170.
Beall, J. and L. H Piron 2004 'DFID Social Exclusion Review', London: London School of Economics/Overseas Development Institute.
Bhardan, P. 'Democracy and Development: a Complex Relationship.' Downloaded from http://globetrotter.berkeley.edu/macarthur/inequality/papers/BardhanDemoc.pdf (last accessed 25 July 2006).
Bennett, L. 2005 'Gender, caste, and ethnic exclusion in Nepal: Following the policy process from analysis to action' Paper presented at the World Bank conference on New Frontiers of Social Policy: Development in a Globalizing World, Arusha: 12-15 December.
Berg, E., P. Guillaumont, J. Auprou, & J. Pegatienan 2001 ‘Côte d’Ivoire,’ in S. Devarayan, D.R. Dollar, & T. Holmgren (eds), Aid and Reform in Africa: Lessons from ten case studies, Washington D.C.: World Bank.
Booth, A. 2000 'Poverty and inequality in the Soeharto era: An assessment', Bulletin of Indonesian Economic Studies 36(1): 73-104.
Brittan, S. 1975 'The economic contradictions of democracy', British Journal of Political Science 5(2): 129-159.
Brown, G. 2005 'Balancing the risks of corrective surgery: The political economy of horizontal inequalities and the end of the New Economic Policy in Malaysia' CRISE Working Papers no.20, Oxford: Centre for Research on Inequality, Human Security and Ethnicity (CRISE), University of Oxford.
Brown, G. and F. Stewart 2006 ‘The implications of horizontal inequality for aid’ Paper presented at the WIDER Conference on Aid, Helsinki: World Institute of Development Economics Research, United Nations University (UNU-WIDER), 16-17 June.
Caumartin, C. 2005 'Racism, violence and inequality: An overview of the Guatemalan case' CRISE Working Papers no.11, Oxford: Centre for Research on Inequality, Human Security and Ethnicity (CRISE), University of Oxford.
Cavallaro, James & Mohammad-Mahmoud Ould Mohamedou. 2005. ‘Public Enemy Number Two: Rising Criminality and Challenges to Human Rights Defense in Transitional Societies’, Harvard Human Rights Journal 18: 139-168.
CBN (Central Bank of Nigeria) 2006 CBN Monthly Report: February 2006, Abuja: CBN.
CEH (Comisión de Esclarecimiento Histórico) 2004 Guatemala: Memoria del Silencio. Tomo I: Mandato y Procedimiento de trabajo; Causas y Origineses del enfrentamiento armado Interno. Oficina de Servicios para Proyectosde las

CRISE Working Paper No. 51
104
Naciones Unidas (UNOPS). Available online at: http://shr.aaas.org/guatemala/ceh/ (Last accessed 29 March 2004).
Center for Human Rights and Global Justice 2005 'The Missing Piece of the Puzzle: Caste discrimination and the conflict in Nepal', New York: New York University, Center for Human Rights and Global Justice.
CEPALSTATS http://www.eclac.org/estadisticas/default.asp?idioma=IN, Last accessed 16 November 2008.
CEPAL/ECCLAC 2005 Panorama Social de las Americas, Santiago: United Nations and CEPAL/ECCLAC.
CERD 1998 'Concluding observations: Nepal' Committee on the Elimination of Racial Discrimination Fifty-Third Session, Geneva.
Chauvel, R. 1985 'Ambon: Not a revolution but a counterrevolution', in A. R. Kahin (ed) Regional Dynamics of the Indonesian Revolution, Honolulu: University of Hawaii Press.
Chauvet, L. and P. Collier. 2006. ‘Helping hand? Aid to failing states’, IRD, DIAL, Paris and CSAE, Oxford.
CIFP 2006 'Fragile states: Monitoring and assessmnet; the way forward'. Carleton,
Ottawa. CIFP.
Cobham, A. 2005a ‘Causes of conflict in Sudan: Testing the Black Book’, European Journal of Development Research 17:3: 462-480.
Cobham, A. 2005b ‘Tax evasion, tax avoidance and development finance’, Queen Elisabeth House Working Paper 129.
Cohen, J. M. 1995 'Ethnicity, foreign aid and economic growth in sub-Saharan Africa: The case of Kenya' Development Discussion Papers no. 520, Cambridge, MA: Harvard Institute for International Development.
Collier, P., V.L. Elliott, H. Hegre, A. Hoeffler, M. Reynal-Querol, and N. Sambanis 2003 Breaking the Conflict Trap: Civil war and development policy, Washington DC: World Bank.
Collier, P. and A. Hoeffler 2004 'Greed and grievance in civil war', Oxford Economic Papers 56: 563-595.
Contamin, B. and B. Losch 2000 ‘Côte d’Ivoire: la voi étroite,’ Politique Africaine, 77 : 117-128.
Crook, R. 1997 ‘Winning coalitions and ethno-regional politics: the failure of the opposition in the 1990 and 1995 elections in Côte d’Ivoire,’ African Affairs, 96: 215-242.
Crouch, H. 1996 'Malaysia: Do elections make a difference?' in R. H. Taylor (ed) The Politics of Elections in South East Asia, Cambridge: Cambridge University Press.
Dahal, D. R. 2000a 'Nepal's governing elite: Their composition and role in constituting the state', in D. Kumar (ed) Domestic Conflict and Crisis of Governability in Nepal, Kathmandu: Centre for Nepal and Asian Studies, Tribhuvan University.

CRISE Working Paper No. 51
105
Dahal, R. K. 2000b 'Language politics in Nepal', Contributions to Nepalese Studies 27(2): 155-190.
Dembele, O. 2003 ‘Côte d’Ivoire: la fracture communautaire,’ Politique Africaine, 89: 34-48.
Deosa Rai, Lal-dhoj 1981 ‘Human rights development in ancient Nepal,’ Human Rights Quarterly, 3(3): 37-46.
DFID (Department for International Development) 2004 Country Assistance Plan for Nigeria, London: DFID
DFID (Department for International Development) 2005 ‘Reducing poverty by tackling social exclusion. A DFID Policy Paper’ London. DFID.
Do, Q.-T. and Iyer, L. 2005 'An empirical analysis of civil conflict in Nepal' Unpublished manuscript, Boston, MA: Harvard Business School.
Dozon, J.-P. 2000 ‘La Côte d’Ivoire entre démocratie, nationalisme et ethno-nationalisme,’ Politique Africaine, 78: 45-62.
Elbadawi, I. and N. Sambanis 2002 'How much war will we see? Estimating the incidence of civil war in 161 countries', Journal of Conflict Resolution 46(3): 307-334.
El-Tom, A. 2004 ‘Darfur people: Too black for the Arab-Islamic project of Sudan’, mimeo., National University of Ireland in Maynooth.
FRN (Federal Republic of Nigeria) 2004, Millennium Development Goals Report 2004: Nigeria
Francois, M. and I. Sud 2006 ‘Promoting Stability and Development in Fragile and Failed States’, Development Policy Review, 24(2): 141-160.
Frankovits, A. and P. Earle 2001 Working Together: Report of the Workshop "Promotion of the human rights based approach to development cooperation", Stockholm: Swedish International Development Agency (SIDA).
Frey, B.S. and A. Al-Roumi, 1999 ‘Political democracy and the physical quality of life: the cross-national evidence.’ Social Indicators Research 47(1): 73–97.
Garver, J. W. 1991 'China-India rivalry in Nepal: The clash over Chinese arms sales', Asian Survey 31(10): 956-975.
Gaspard, F. and J.-P. Platteau 2006 ‘The perverse effect of cheap aid money’. Paper presented at the WIDER Conference on Aid, Helsinki: World Institute of Development Economics Research, United Nations University (UNU-WIDER), 16-17 June.
Gates, S. and M.S. Murshed 2005 'Spatial-horizontal inequality and the Maoist insurgency in Nepal', Review of Development Economics 9(1).
Gboyega, A., O. Albert and A.G. Garba 2004 ‘Nature of Horizontal Inequality in Nigeria’, Paper Presented at CRISE Regional Workshop on West Africa, April 22-24, Ibadan: University of Ibadan.

CRISE Working Paper No. 51
106
Gonin, G. 1998, ‘Ethnicity, politics and national awareness in Côte d’Ivoire’, in O. Nnoli (ed), Ethnic Conflict in Africa, Dakar: CODESRIA.
Gurung, H. 1969 Regional Development Planning for Nepal, Kathmandu: National Planning Commission.
Gurung, H. 2005 'Nepal Regional Strategy for Development' ADB Nepal Resident Mission Working Paper no. 3, Kathmandu: Asian Development Bank.
Hachhethu, K. 2004 State of Democracy in Nepal Survey Report, Kathmandu: State of Democracy in South Asia – Nepal Chapter and International Institute for Democracy and Electoral Assistance.
Hegre, H, T. Ellingsen, S. Gates and N.P. Gleditsch 2001 ‘Towards a democratic civil peace? Democracy, political change, and civil war, 1816-1992’, American Review of Political Science 95(1): 33-48.
Henley, D. 1993 'Nationalism and regionalism in colonial Indonesia: The case of Minahasa', Indonesia, 55: 91-112.
Heryanto, A. 1998 'Ethnic identities and erasure: Chinese Indonesians in public culture', in J. S. Kahn (ed) Southeast Asian Identities: Culture and the politics of representation in Indonesia, Malaysia, Singapore and Thailand, Singapore: Institute of Southeast Asian Studies.
Höfer, A. 1979 The Caste Hierarchy and the State in Nepal: A study of the Muluki Ain of 1854, Innsbruck: Universitätsverlag Wagner.
HRW (Human Rights Watch) 2003 Trapped between Two Wars: Violence against Civilians in Western Côte d’Ivoire, New York, Human Rights Watch.
HRW (Human Rights Watch) 2004 'Between a Rock and a Hard Place: Civilians struggle to survive in Nepal's civil war', New York: Human Rights Watch.
HRW (Human Rights Watch) 2006 The Price of Continuing Impunity in Côte d’Ivoire, New York: Human Rights Watch.
IMF (International Monetary Fund) 2006 IMF Country Report 06/182, Washington, DC: International Monetary Fund.
ICG (International Crisis Group) 2005 Côte d’Ivoire: The worst may be yet to come, Brussels: International Crisis Group, 24 March.
ICG (International Crisis Group) 2004 Côte d’Ivoire: No peace in sight, Brussels: International Crisis Group, 12 July.
Inter-American Development Bank 2001, Country Strategy with Guatemala, January 2001http://www.idb.int/publications/search.cfm?query=&context=&lang=en&docType=INSTITUTIONAL%20DOCUMENTS&topic=&country=GU&searchLang=, last accessed 16 November 2008.
Johnsen, U.H. 2002 'Caste-based prejudices and discrimination in Nepal: A survey report' Report submitted to DANIDA/HUGO.
CRISE Working Paper No. 51
107
Jomo, K.S. 2004 'The New Economic Policy and interethnic relations in Malaysia', United Nations Research Institute for Social Development; Identities, Conflict and Cohesion Programme Paper 7.
Khadka, N. 1995 'Factionalism in the Communist movement in Nepal', Pacific Affairs 68(1): 55-76.
Khemani, S. 2006 ‘Local Government Accountability for Health Service Delivery in Nigeria’, Journal of African Economies, 15(2): 285-312.
Kieffer, G.-A. 2000 ‘Armée ivoirienne: le refus du déclassement,’ Politique Africaine, 78: 26-44.
Langer, A. 2003 ‘Policy Levers in Côte d’Ivoire’, CRISE Policy Paper No. 3, Oxford: Centre for Research on Inequality, Human Security and Ethnicity, University of Oxford.
Langer, A. 2007 ‘The peaceful management of Horizontal Inequalities in Ghana’, CRISE Working Papers no. 25, Oxford: CRISE. www.crise.ox.ac.uk
Langer, A. 2005a ‘Horizontal Inequalities and Violent Group Mobilisation in Côte d’Ivoire’, Oxford Development Studies, 33(1): 25-45.
Langer, A. 2005b Horizontal inequalities and violent conflict: Côte d’Ivoire Country Paper, UNDP background paper for the 2005 Human Development Report.
Le Pape, M. 2002. ‘Chronologie politique de la Côte d’Ivoire, du coup d’état aux élections’, in M. Le Pape and C. Vidal, Côte d’Ivoire: l’année terrible, 1999-2000, Paris: Karthala.
Leith, J. 1998 'Resettlement history, resources and resistance in North Halmahera', in S. Pannell and F. von Benda-Beckmann (eds) Old World Places, New World Problems: Exploring issues of resource management in Eastern Indonesia, Canberra: Australian National University, Centre for Resource and Environmental Studies.
Leymarie, P. 2001 ‘L’Afrique de l’ouest dans la zone des tempêtes,’ Le Monde Diplomatique. Available at: http://www.monde-diplomatique.fr/ dossiers/afrique/, last accessed 24 July 2006.
Liddle, R.W. 1970 Ethnicity, Party and National Integration: An Indonesian case study, New Haven: Yale University Press.
Liddle, R.W. 1996 'The Islamic turn in Indonesia: A political explanation', Journal of Asian Studies 55(3): 613-634.
Lijphart, A. 1977 Democracy in Plural Societies: A comparative exploration, New Haven: Yale University Press.
Macours, K. 2006 'Relative deprivation and civil conflict in Nepal' Unpublished manuscript, Washington D.C.: Johns Hopkins University, School of Advanced International Studies.
Mamdani, M. 2004, ‘Naming the Darfur crisis’, Pambazuka News, 7 October.

CRISE Working Paper No. 51
108
Mancini, L. 2005 'Horizontal inequality and communal violence: Evidence from Indonesian districts' CRISE Working Paper No. 22, Oxford: Centre for Research on Inequality, Human Security and Ethnicity, University of Oxford.
Marshall, M.G. 2006 'Major Episodes of Political Violence, 1946-2005' Centre for Systemic Peace, http://members.aol.com/cspmgm/warlist/htm: Accessed 15 July 2006.
Means, G. P. 1972 '"Special rights" as a strategy for development', Comparative Politics 5(1): 29-61.
McKay, A and E. Aryeetey 2004. ‘Operationalising Pro-Poor Growth” A Country Case Study on Ghana’, A joint initiative of AFD, BMZ (GTZ, KfW Development Bank), DFID, and the WorldBank
Minorities at Risk (MAR) data set. http://www.cidcm.umd.edu/mar/data.asp
MINUCI (United Nations Mission in Côte d’Ivoire) 2004. Côte d’Ivoire – MINUCI – Background. http://www.un.org/Depts/dpko/missions/minuci/background.html
Mohammad Zulfan, T., I.S. Widjajanti and S. Mishra 2001 'Regional disparity and vertical conflict in Indonesia', Journal of the Asia Pacific Economy 6(3): 283-304.
Morcos, K. 2005. 'Chair's summary', Senior Level Forum on Development Eeffectiveness in Fragile States. London. www.oecd.org/dataoecd/60/37/34401185 last accessed 24 July 2006.
Mustapha, A.R. 2004 ‘Ethnic Structure, Inequality and Governance of the Public Sector in Nigeria’, Paper Presented at CRISE Regional Workshop on West Africa, April 22-24, 2004, Ibadan: University of Ibadan, Nigeria.
Mustapha, A.R. 2006 ‘Institutionalizing Ethnic Representation: how effective is the Federal Character Commission in Nigeria’, Paper Presented at CRISE Regional Workshop on West Africa, March 23-25, 2006, Legon: University of Legon, Ghana.
National Population Commission (NPC) and ORC Macro (2004) Nigeria Demographic and Health Survey 2003, Calverton, Maryland: National Population Commission and ORC Macro.
NESAC 1998 Nepal Human Development Report 1998, Kathmandu: Nepal South Asia Centre.
OECD 2006 Integrating Human Rights into Development, Donor Approaches, Experiences and Challenges Paris: OECD.
Østby, G. 2004 'Do Horizontal Inequalities Matter for Civil Conflict?' Oslo: Centre for Study of Civil War (CSCW), International Peace Research Institute (PRIO).
Parmanand 1986 ‘The Indian community in Nepal and the Nepalese community in India: The problem of national integration’ Asian Survey 26(9): 1005-1019.
Parrott. Louise 2006 ‘The Role of the International Criminal Court in Uganda: Ensuring that the Pursuit of Justice Does Not Come at the Price of Peace’, Australian Journal of Peace Studies 1(1): 8-29

CRISE Working Paper No. 51
109
Piron, L. and T. O'Neil 2005. 'Integrating rights into development: a synthesis of donor approaches and experiences'. London. Overseas Development Institute.
Prandan, R. and A. Shrestha 2005 'Ethnic and Caste Diversity: Implications for development' Asian Development Bank, Nepal Resident Mission Working Paper no. 4.
Prest, S., J. Gazo, and D. Carment 2005. 'Working out strategies for strengthening fragile states - the British, American and German experience', paper prepared for Conference on Canada's Policy Towards Fragile, Failed and Dangerous States.
Przeworski, A. and F. Limongi 1993. 'Political regimes and economic growth', Journal of Economic Perspectives.
Przeworski, A. 2000. Democracy and Development; Political Institutions and Well-Being in the World, 1950-1990. New York: Cambridge University Press
.Rakindo, A. 1975 'Indonesia: Chinese scapegoat politics in Suharto's "New Order"', Journal of Contemporary Asia 5(3): 345-352.
Reeves, E. 2006 ‘Quantifying genocide in Darfur: April 28, 2006 (Part 1)’, via http://www.sudanreeves.org.
Regmi, M. C. 1961 ‘Recent land reform programs in Nepal,’ Asian Survey, 1(7): 32-37.
Reporters without Borders 2006, Sudan Annual Report 2006, at http://www.rsf.org.
Reynal-Querol, M. 2002 'Political systems, stability and civil wars', Defence and Peace Economics 13(6): 465-483.
RGPH-1998 ‘Recensement Général de la Population et de l’Habitation de 1998,’ (2001), Volume IV: Tome 1, ‘Etat et structures de la population’, Institut National de la Statistique (INS), Abidjan.
Ricklefs, M. C. 2001 A History of Modern Indonesia since c. 1200, Third Edition, London: Palgrave.
Robinson, J., R. Torvik & T. Verdier 2006 ‘Political foundations of the resource curse’, Journal of Development Economics 79: 447-468.
Ross, M. 2004, ‘Does taxation lead to representation?’, mimeo., Dept of Political Science, University of California (also published in British Journal of Political Science).
Salvi Del Pero, A. 2005 'Ethnic inequality in Nepal: A regression-based analysis' Unpublished manuscript, Milan: Dipartimento di Economia Politica e Aziendale.
Shapiro, J. 2006 ‘Guatemala’ in G. Hall and H.A. Patrinos (eds) Indigenous Peoples, Poverty, and Human Development in Latin America, London: Palgrave MacMillan.
Sharma, S. 1986 'Nepal's economy: Growth and development', Asian Survey 26(8): 897-908.
Shrestha, B., H.S. Shrestha, and S. Bhatt 2004 'Foreign aid utilisation at the grassroots level: A case study of Local Development Fund' Report submitted to the

CRISE Working Paper No. 51
110
South Asia Network of Economic Research Institute, Kathmandu: Institute for Integrated Development Studies.
Sieder, Rachel 2002 Multiculturalism in Latin America: Indigenous rights, diversity and democracy. Institute of Latin American Studies series. Basingstoke: Palgrave Macmillan.
Sieder Rachel, Megan Thomas, George Vickers and Jack Spence 2002 Who Governs? Guatemala Five Years After the Peace Accords. Cambridge (Massachusets): Hemisphere Initiatives.
Snyder, J. 2000 From Voting to Violence, New York: W.W. Norton.
Stewart, F. (ed) 2008 Horizontal Inequalities and Conflict: Explaining Group Violence in Multiethnic Societies. Basingstoke: Palgrave Macmillan.
Stewart, F. 2004 ‘The relationship between Horizontal Inequalities, Vertical Inequality and Social Exclusion’. CRISE Newsletter, Winter.
Stewart, F. 2003. ‘Conflict and the millennium development goals’, Journal of Human Development, 4, 3, 325-352.
Stewart, F. 1989 'Basic Needs Strategies, Human Rights and the Right to Development' Human Rights Quarterly 11(3): 347-375.
Stewart, F. and V. FitzGerald (eds) 2001 War and Underdevelopment: The economic and social consequences of conflict, Oxford: Oxford University Press.
Stewart, F. and M. O'Sullivan 1999 'Democracy, conflict and development: Three cases', in G. Ranis, S.-C. Hu and Y.-P. Chu (eds) The Political Economy of Comparative Development into the 21st Century: Essays in memory of John C.H. Fei, Vol. 1, Cheltenham: Edward Elgar.
Taracena, A. A., et al. (eds) 2002 Etnicidad, estado y nación en Guatemala, 1808-1944, Volumen I. Antigua Guatemala: CIRMA (Centro de investigaciones regionales de mesoamerica).
Tirtosudarmo, R. 1995 'The political demography of national integration and its policy implications for a sustainable development in Indonesia', The Indonesian Quarterly 23: 369-383.
Thoms, O. and J. Ron 2006 'Do human rights violations cause internal conflict?' Paper Prepared for the Human Rights and Participation Division, CIDA, Ottawa: Norman Patterson School of International Affairs, Carleton University.
UNDP (United Nations Development Programme) 1999 Rapport sur le développement humain 1997 Côte d’Ivoire, Abidjan: United Nations Development Programme.
UNDP (United Nations Development Programme) 2000 Human Development Report 2000, New York: United Nations Development Programme.
UNDP (United Nations Development Programme) 2004a Nepal Human Development Report 2004: Empowerment and Poverty Reduction, Kathmandu: United Nations Development Programme (Nepal).
CRISE Working Paper No. 51
111
UNDP (United Nations Development Programme) 2004b Nigeria Human Development Report 2004, Lagos: UNDP
UNDP (United Nations Development Programme) 2005a Human Development Report 2005: International Coooperation at a Crossroads: Aid, trade and security in an unequal world. New York: United Nations Development Programme.
UNDP (United Nations Development Programme) 2005b Informe Nacional De Desarollo Humano: Diversidad Etnico-Cultural: La Ciudadania En Un Estado Plural. Guatemala: PNUD.
USAID (United States Agency for International Development) 2005 'Fragile states
strategy'. http://www.usaid.gov/policy,2005_fragile_states_strategy, last accessed 25 July 2006.
Uvin. P.2004. Human Rights and Development. Bloomfield, CT., Kumarian Press.
Vakis, R., Guatemala, Livelihoods, Labour Markets, and Rural Poverty in World Bank, Guatemala Poverty Assesment Program, Technical paper N 1, December 2003.
van der Kroef, J. M. 1958 'Disunited Indonesia', Far Eastern Survey 27(4 & 5): 49-63 & 73-80.
van Dijk, C. 1981 Rebellion under the Banner of Islam: The Darul Islam in Indonesia, 's Gravenhage: Martinus Nijhoff.
Varshney, A., R. Panggabean and M.Z. Tadjoeddin 2004 'Patterns of collective violence in Indonesia (1990-2003)', Jakarta: UNSFIR Working Paper 04/03.
Vickers, A. and L. Fisher 1999 'Asian Values in Indonesia? National and regional identities', Sojourn 14(2): 382-401.
WFP (World Food Programme) 2006, Sudan Annual Needs Assessment 2006, Khartoum: World Food Programme.
Whelpton, J. 1997 'Political identity in Nepal: State, nation, and community', in D. N. Gellner, J. Pfaff-Czarnecka and J. Whelpton (eds) Nationalism and Ethnicity in a Hindu Kingdom: The politics of culture in contemporary Nepal, Amsterdam: Harwood Academic Publishers.
Whelpton, J. 2005 A History of Nepal, Cambridge: Cambridge University Press.
World Bank 1994 'Indonesia Transmigration Program: A review of five bank-supported projects' Operations Evaluation Study no. 12988, Washington D.C.: World Bank.
World Bank 2005a. 'Fragile states - good practice in country assistance strategies'. Board Report 34790, 19 December.
World Bank 2005b Guatemala at a Glance http://web.worldbank.org/WBSITE/EXTERNAL/COUNTRIES/LACEXT/GUATEMALAEXTN/0,,menuPK:328143~pagePK:141132~piPK:141109~theSitePK:328117,00.html, Last accessed June 2006.
World Bank 2006. 'Fragile States: The Low Income Countries Under Stress (LICUS) Initiative.http://web.worldbank.org/WBSITE/EXTERNAL/NEWS/0,,contentMDK:20127382~menuPK:34480~pagePK:34370~theSitePK:4607,00.html

CRISE Working Paper No. 51
112
World Bank/GUAPA 2003 Guatemala Poverty Assessment Program: Poverty in Guatemala, Report No. 24221-GU. World Bank. Available: http://lnweb18.worldbank.org/external/lac/lac.nsf/Countries/Guatemala. 3 Dec.
World Health Organisation [n.d.] WHO Country Cooperation Strategy: Federal Republic of Nigeria 2002-2007, Brazzaville: WHO Regional Office for Africa
Yashar, D. 2005. Contesting Citizenship in Latin America: The Rise of Indigenous Movements and the Postliberal Challenge. Cambridge: Cambridge University Press.
Zeitlyn, S. 2004 Social Exclusion in Asia: Some initial ideas, London: Department for International Development, UK Government.