Embed Size (px)
Citation preview
PG&E Windsor Substation Project INITIAL STUDY
July 2013 5-17 Draft MND/Initial Study
5.3 Air Quality
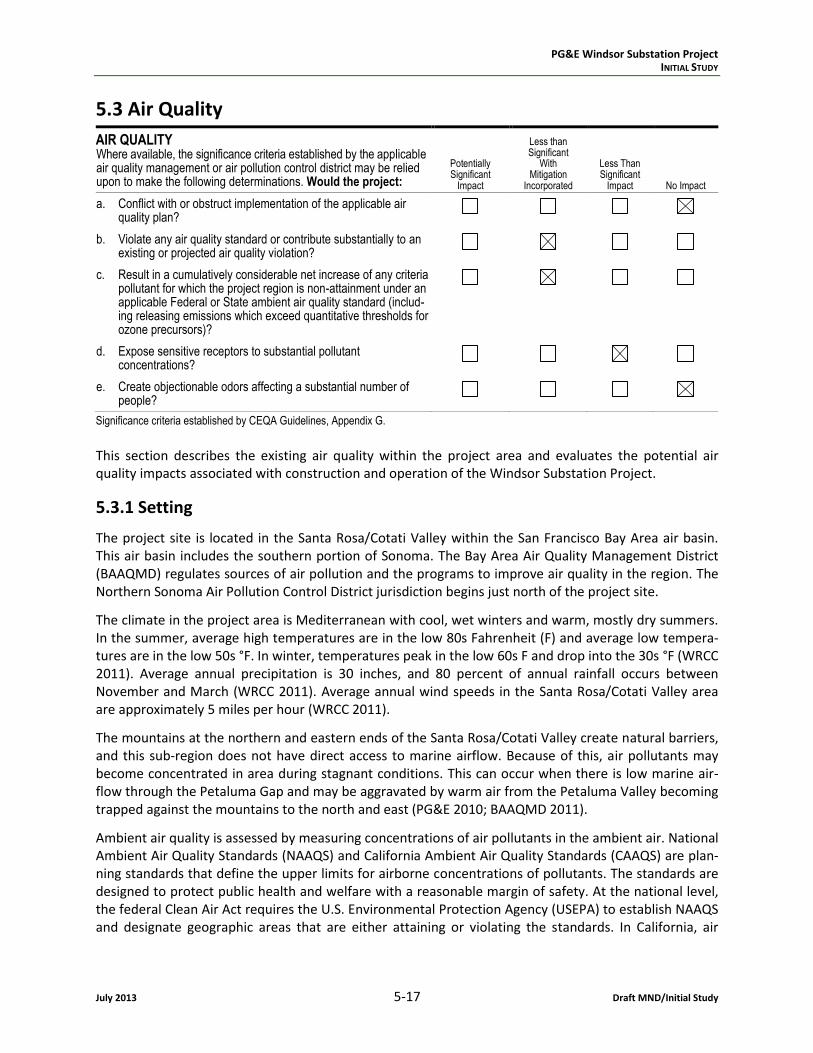
AIR QUALITY Where available, the significance criteria established by the applicable air quality management or air pollution control district may be relied upon to make the following determinations. Would the project:
Potentially Significant
Impact
Less than Significant
With Mitigation
Incorporated
Less Than Significant
Impact No Impact
a. Conflict with or obstruct implementation of the applicable air quality plan?
b. Violate any air quality standard or contribute substantially to an existing or projected air quality violation?
c. Result in a cumulatively considerable net increase of any criteria pollutant for which the project region is non-attainment under an applicable Federal or State ambient air quality standard (includ-ing releasing emissions which exceed quantitative thresholds for ozone precursors)?
d. Expose sensitive receptors to substantial pollutant concentrations?
e. Create objectionable odors affecting a substantial number of people?
Significance criteria established by CEQA Guidelines, Appendix G.
This section describes the existing air quality within the project area and evaluates the potential air quality impacts associated with construction and operation of the Windsor Substation Project.
5.3.1 Setting
The project site is located in the Santa Rosa/Cotati Valley within the San Francisco Bay Area air basin. This air basin includes the southern portion of Sonoma. The Bay Area Air Quality Management District (BAAQMD) regulates sources of air pollution and the programs to improve air quality in the region. The Northern Sonoma Air Pollution Control District jurisdiction begins just north of the project site.
The climate in the project area is Mediterranean with cool, wet winters and warm, mostly dry summers. In the summer, average high temperatures are in the low 80s Fahrenheit (F) and average low tempera-tures are in the low 50s °F. In winter, temperatures peak in the low 60s F and drop into the 30s °F (WRCC 2011). Average annual precipitation is 30 inches, and 80 percent of annual rainfall occurs between November and March (WRCC 2011). Average annual wind speeds in the Santa Rosa/Cotati Valley area are approximately 5 miles per hour (WRCC 2011).
The mountains at the northern and eastern ends of the Santa Rosa/Cotati Valley create natural barriers, and this sub-region does not have direct access to marine airflow. Because of this, air pollutants may become concentrated in area during stagnant conditions. This can occur when there is low marine air-flow through the Petaluma Gap and may be aggravated by warm air from the Petaluma Valley becoming trapped against the mountains to the north and east (PG&E 2010; BAAQMD 2011).
Ambient air quality is assessed by measuring concentrations of air pollutants in the ambient air. National Ambient Air Quality Standards (NAAQS) and California Ambient Air Quality Standards (CAAQS) are plan-ning standards that define the upper limits for airborne concentrations of pollutants. The standards are designed to protect public health and welfare with a reasonable margin of safety. At the national level, the federal Clean Air Act requires the U.S. Environmental Protection Agency (USEPA) to establish NAAQS and designate geographic areas that are either attaining or violating the standards. In California, air

PG&E Windsor Substation Project INITIAL STUDY
Draft MND/Initial Study 5-18 July 2013
quality management and regulation is the responsibility of the California Air Resources Board (CARB) and local air quality management districts (such as BAAQMD).
The NAAQS and CAAQS are established for “criteria pollutants.” These are ozone, respirable particulate matter (PM10), fine particulate matter (PM2.5), carbon monoxide (CO), nitrogen dioxide (NO2), sulfur dioxide (SO2), and lead. Ozone is an example of a secondary pollutant that is not emitted directly from a source (e.g., an automobile tailpipe), but it is formed in the atmosphere by chemical and photochemical reactions. Reactive organic gases (ROG), including volatile organic compounds (VOC), are regulated as precursors to ozone formation. The USEPA and CARB both have independent authority to develop and establish ambient air quality standards, and in general, the CAAQS are more stringent than the corre-sponding NAAQS. The national and California standards are shown in Table 5.3-1.
Table 5.3-1. National and California Ambient Air Quality Standards
Pollutant Averaging Time California Standards National Standards
Ozone 1-hour 8-hour
0.09 ppm 0.070 ppm
— 0.075 ppm
Respirable Particulate Matter (PM10) 24-hour Annual Mean
50 µg/m3 20 µg/m3
150 µg/m3 —
Fine Particulate Matter (PM2.5) 24-hour Annual Mean
— 12 µg/m3
35 µg/m3 15 µg/m3
Carbon Monoxide (CO) 1-hour 8-hour
20 ppm 9.0 ppm
35 ppm 9.0 ppm
Nitrogen Dioxide (NO2) 1-hour Annual Mean
0.18 ppm 0.030 ppm
0.100 ppm 0.053 ppm
Sulfur Dioxide (SO2) 1-hour 24-hour
Annual Mean
0.25 ppm 0.04 ppm
—
0.075 ppm 0.14 ppm 0.03 ppm
Lead 30-day Average Calendar Quarter
1.5 µg/m3 —
— 1.5 µg/m3
Notes: ppm=parts per million; µg/m3= micrograms per cubic meter; “—“ =no standard Source: CARB 2011a
The USEPA and local air districts work together to classify areas of the nation as attainment, unclassified, or nonattainment. The classification depends on whether the monitored ambient air quality data show compliance (attainment), insufficient data available (unclassified), or non-compliance (nonattainment) with the ambient air quality standards. Table 5.3-2 provides the attainment status for the national and California ambient air quality standards in the BAAQMD.
Table 5.3-2. Attainment Status for Bay Area Air Quality Management District
Pollutant Federal Designation State Designation
Ozone (1-hour) No Federal Standard Nonattainment
Ozone (8-hour) Nonattainment Nonattainment
PM10 Unclassified Nonattainment
PM2.5 Attainment/Nonattainment Nonattainment
CO Attainment Attainment
NO2 Attainment Unclassified/Attainment
SO2 Attainment Attainment
Lead Attainment Attainment
Source: BAAQMD 2011

PG&E Windsor Substation Project INITIAL STUDY
July 2013 5-19 Draft MND/Initial Study
Existing Local Air Quality Conditions
The CARB and BAAQMD monitor ambient concentrations of criteria pollutants in the project area. Table 5.3-3 shows exceedances of CAAQS in Sonoma County between 1998 and 2008. Table 5.3-4 shows air quality measurements at the nearest air quality monitoring site to the proposed project (located on 5th Street in Santa Rosa). This station, the only monitoring station within BAAQMD jurisdiction in Sonoma County, provides data that are most representative of the project area. The Santa Rosa station is located just south of Windsor in the Cotati Valley, and experiences similar conditions to those found in Windsor.
Sensitive Receptors. Residential areas, schools, day care centers, hospitals, and convalescent homes are examples of land uses that include members of the population that are particularly sensitive to the effects of air pollutants, such as children, the elderly, and people with illnesses (BAAQMD 2011). Figure 5.12-1 shows residences in the proposed project area.
Ozone. Ambient levels of ozone in the BAAQMD have improved since 1998 (CARB 2011b). The number of exceedances of the state and federal standards has generally declined. These exceedances are gene-rally attributed to unique meteorological patterns, combined with increases in ozone precursor emis-sions during the summer months. Motor vehicle emissions, industrial emissions, and high ambient tem-peratures that occur in the inland portions of the BAAQMD contribute to summertime ozone formation and subsequent air standard violations. In Sonoma County the state-level one-hour standard for ozone has been exceeded twice since 1998, as shown in Table 5.3-3. Peak hourly average ozone concentrations ranged from 0.070 to 0.100 parts per million (ppm) during this time.
Particulate Matter. Concentrations of inhalable PM10 and PM2.5 have remained relatively constant in the BAAQMD since 1998 (CARB 2011b). The maximum 24-hour concentrations of PM10 and the number of exceedances of the state 24-hour standard have remained relatively stable. PM10 is generated within the project area largely as a result of wind during dry conditions (resulting in fugitive dust) and combus-tion sources. Between 1998 and 2008, the maximum 24-hour PM10 concentration within Sonoma County was 90 micrograms per cubic meter of air (µg/m3), which was reached in 2006. The total number of viola-tions of the PM10 state air quality standards (over 50 µg/m3) in Sonoma County between 1998 and 2008 was 54. Air quality in Santa Rosa with respect to PM2.5 has remained relatively constant since 2000. The maximum 24-hour concentration of PM2.5 has remained within a range from 75.9 to 26.6 ppm. The annual arithmetic mean has ranged from 10.8 to 7.6 ppm. Combustion of fossil fuels is the primary source of directly emitted PM2.5, and combustion exhaust contains nitrogen and sulfur compounds that react to form PM2.5 in the atmosphere.
Toxic Air Contaminants. Toxic air contaminants (TACs) are air pollutants that may lead to serious illness or increased mortality, even when present in relatively low concentrations. Potential human health effects of TACs include birth defects, neurological damage, cancer, and death. There are hundreds of dif-ferent types of TACs with varying degrees of toxicity. Individual TACs vary greatly in the health risk they present; at a given level of exposure, one TAC may pose a hazard that is many times greater than another’s. TACs do not have ambient air quality standards, but are regulated by the BAAQMD using a risk-based approach. The BAAQMD uses a health risk assessment to determine what stationary sources to control as well as the degree of control. If the BAAQMD concludes that projected emissions of a spe-cific air toxic compound from a proposed new or stationary modified source would pose a potential pub-lic health risk, then the applicant is subject to a health risk assessment for the source in question. Such an assessment also evaluates the chronic and acute hazards and the potential increased cancer risk stem-ming from exposure to a change in airborne TACs. The BAAQMD has found as part of its 2010 Clean Air Plan that the estimated lifetime cancer risk (70‐year lifespan) from regional exposure to all air toxics com-bined declined from 1,330 cases per million in 1990 to 405 cases per million people in 2008 (BAAQMD 2010a). Diesel particulate matter (DPM) is classified as a TAC, and statewide and local programs focus on managing this pollutant because many toxic compounds adhere to diesel exhaust particles.

PG&E Windsor Substation Project INITIAL STUDY
Draft MND/Initial Study 5-20 July 2013
Table 5.3-3. Sonoma County Exceedances of California Ambient Air Quality Standards Between 1998 and 2010
Ozone (1-hr) Note: 1 Ozone (8-hr) Note: 2 PM10 Note: 3
Year
Number of Exceedance
Days
Maximum 1-hr Concentration
(ppm)
Number of Exceedance
Days
Maximum 8-hr Concentration
(ppm)
Number of Exceedance
Days
Maximum 24-Hour Concentration
(g/m3)
1998 — 0.068 — — 6 —
1999 1 0.095 — — 6 54
2000 — 0.078 — — — 46
2001 — 0.086 — — 18 78
2002 — 0.077 — — 12 64
2003 1 0.096 — — — 36
2004 — 0.076 — — — 48
2005 — 0.072 — 0.051 — 39
2006 — 0.077 — 0.058 12 90
2007 — 0.071 — 0.059 — 37
2008 — 0.076 — 0.065 * 50
2009 — 0.086 — 0.065 * *
2010 — 0.084 — 0.068 * *
Source: BAAQMD 2013 - Bay Area Air Pollution Summary 1998-2009; CARB 2011b - ADAM Air Quality Data Statistics. 1 - The sampling frequency of ozone is continuous (hourly). The CAAQS for ozone is 0.09 ppm. 2 - The eight-hour CAAQS for ozone is 0.070 ppm. 3 - Sampling of particulate matter (PM10) is scheduled throughout California once every sixth day (a 24-hour sample). Therefore, each station
has a nominal 60 to 61 sampling days per year. All stations have the same schedule; that is, they all attempt to sample for PM10 on the same days. The number of station-sampling days per county is dependent the number of PM10 stations in the county. The state AAQS for PM10 is 50 micrograms per meter of air (g/m).
* PM10 discontinued in 2008.
Table 5.3-4. Santa Rosa 5th Street Air-Monitoring Station Annual Air Quality Measurements Between 1998 and 2010
Ozone PM2.5 PM10
Year
Maximum 8-hr
(ppm)
Maximum 1-hr
(ppm)
Annual Arithmetic
Mean (g/m3)
Maximum 24-hr
(g/m3)
Annual Arithmetic
Mean (g/m3)
Maximum 24-hr
(g/m3)
1998 0.055 0.068 — — — 56.1
1999 0.077 0.095 — 54.9 — 57.1
2000 0.057 0.078 10.5 40.1 18.2 48.4
2001 0.063 0.086 10.8 75.9 21.9 78.1
2002 0.061 0.077 — 50.7 20.4 63.6
2003 0.080 0.096 8.7 38.8 16.9 36.3
2004 0.061 0.076 8.3 26.6 18.0 48.1
2005 0.051 0.072 7.6 33.6 15.9 38.9
2006 0.058 0.077 9.2 59.0 18.8 89.5
2007 0.060 0.071 7.6 32.0 17.1 37.2
2008 0.065 0.076 8.6 30.8 * 49.9
2009 0.66 0.86 8.4 29.0 * *
2010 0.68 0.84 7.3 26.6 * *
Source: CARB 2011b - ADAM Air Quality Data Statistics. * PM10 discontinued in 2008.

PG&E Windsor Substation Project INITIAL STUDY
July 2013 5-21 Draft MND/Initial Study
Regulatory Setting
Federal Clean Air Act (CAA). NAAQS were established in 1970 for six criteria air pollutants: carbon monoxide (CO), ozone (O3), particulate matter (PM10 and PM2.5), nitrogen dioxide (NO2), sulfur dioxide (SO2), and lead (Pb). These pollutants are commonly referred to as criteria pollutants, because they are considered the most prevalent air pollutants known to be hazardous to human health. The Federal CAA required states exceeding the standards to prepare air quality plans showing how the standards were to be met by December 1987. The Federal CAA Amendments of 1990 directed the USEPA to set emissions performance standards for toxic air contaminants and required facilities to sharply reduce emissions.
California Clean Air Act. The California CAA requires regions to develop and implement strategies to attain California’s Ambient Air Quality Standards (CAAQS). For some pollutants, the California standards are more stringent than the national standards. California also has standards for visibility reducing particles, sulfates, hydrogen sulfide (H2S), and vinyl chloride. Local air districts, including the BAAQMD, must periodically prepare air quality management plans showing how the standards will be met.
California Air Toxics “Hot Spots” Information and Assessment Act. The Air Toxic “Hot Spots” Informa-tion and Assessment Act identifies toxic air contaminant hot spots where emissions from specific sta-tionary source facilities may expose individuals to an elevated risk of adverse health effects. It requires that a business or other establishment identified as a significant source of toxic emissions provide the affected population with information about health risks posed by the emissions.
Bay Area Air Quality Management District and Regional Air Quality Management Plans. Responsibility for developing regional air quality management plans lies with the BAAQMD. The local air district also has the authority to issue permits through its rules and regulations by requiring that new stationary sources be subject to New Source Review (NSR) under BAAQMD Regulation II (Permits). The NSR program ensures that the new stationary sources would not interfere with progress to attain the ambient air quality standards. No stationary sources would be associated with the proposed project or subject to permitting. Emissions from mobile and portable sources and temporary activities (such as construction) are managed through a range of state and federal programs that control motor vehicle emissions and emissions from equipment powered by diesel engines.
The BAAQMD periodically prepares and updates the regional air quality management plans to show how the district intends to achieve ambient air quality goals. These plans usually include measures to reduce air pollution emissions from industrial, area, mobile and other sources. In 2001, the Ozone Attainment Plan was prepared for the Bay Area as part of the State Implementation Plan to achieve the ozone standards. Later in 2005, the Bay Area Ozone Strategy was prepared to detail how the BAAQMD will achieve the State 1-hour ozone standard. In addition, the BAAQMD adopted in 2005 an implementation schedule for state-proposed measures for reducing airborne particulate matter.
In 2010, the BAAQMD’s Board of Directors adopted the CEQA Air Quality Guidelines (BAAQMD 2012) in an effort to assist lead agencies in evaluating air quality impacts of projects and plans proposed in the San Francisco Bay Area Air Basin. As a result of a March 2012 judicial action, the BAAQMD no longer rec-ommends that thresholds in the 2010 guidelines be used as a generally applicable measure of significant impacts.6 However, the BAAQMD CEQA Air Quality Guidelines include recommendations for analysis procedures, and threshold of significance justifications; the BAAQMD also prepared detailed documen-tation for CEQA thresholds prior to its 2010 adoption of the guidelines (BAAQMD 2012).
6 The BAAQMD describes the status of its CEQA Guidelines at: http://www.baaqmd.gov/Divisions/Planning-and-
Research/CEQA-GUIDELINES/Updated-CEQA-Guidelines.aspx.
PG&E Windsor Substation Project INITIAL STUDY
Draft MND/Initial Study 5-22 July 2013
California Air Resources Board (CARB) Off-Road Mobile Sources Emission Reduction Program. The Cali-fornia CAA mandates CARB to achieve the maximum degree of emission reductions from all off-road mobile sources in order to attain the State ambient air quality standards. Off-road mobile sources include construction and farming equipment. Tier 1, Tier 2, and Tier 3 standards for large compression-ignition engines used in off-road mobile sources went into effect in California in 1996, 2001, and 2006 respec-tively. In addition, equipment can be retrofitted to achieve lower emissions using the CARB-verified retrofit technologies. The engine standards and ongoing rulemaking jointly address NOx emissions and toxic particulate matter from diesel combustion (DPM).
CARB Portable Equipment Registration Program. This program allows owners or operators of portable engines and associated equipment commonly used for construction or farming to register their units under a statewide portable program that allows them to operate their equipment throughout California without having to obtain individual permits from local air districts.
Town of Windsor General Plan. Windsor’s General Plan includes the following Air Quality Policies:
The Town requires that development proposals comply with federal and state air quality standards, but has discretionary review authority to make findings that a project has overriding benefits to the commu-nity that outweigh nonattainment of the standards.
To conserve air and energy resources, the Town encourages land use patterns and management practices such as higher residential densities and business development intensities at existing and future transit stops.
5.3.2 Environmental Impacts and Mitigation Measures
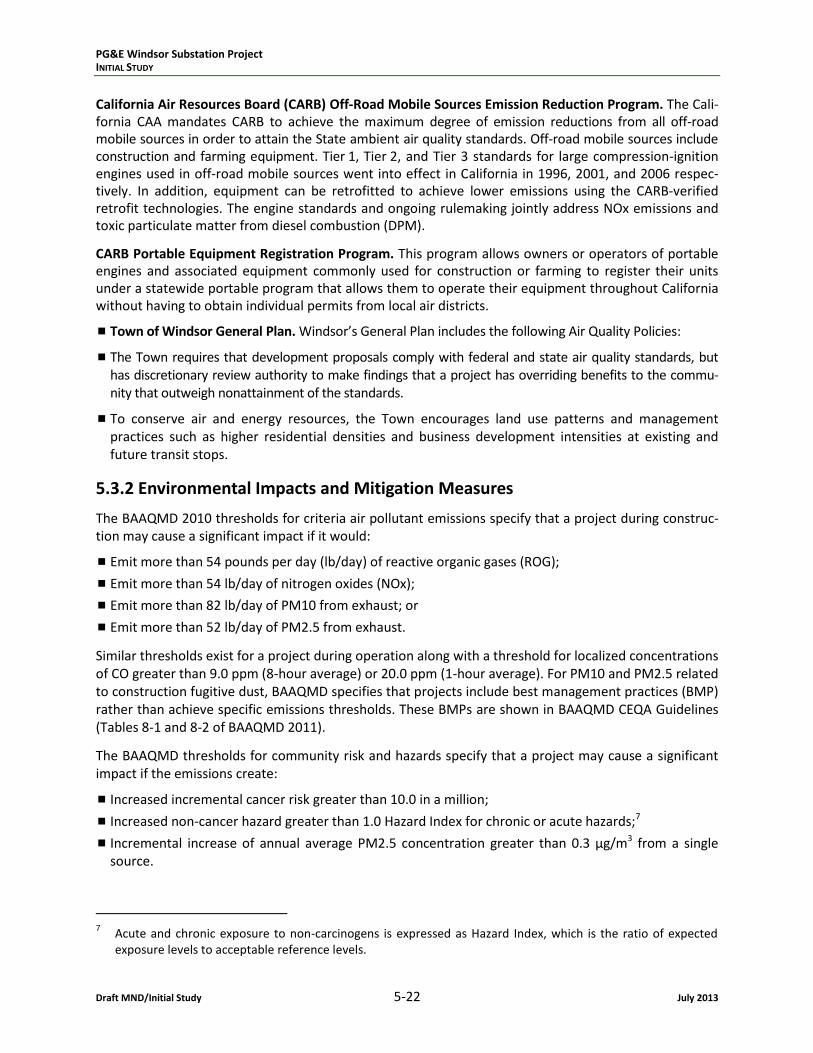
The BAAQMD 2010 thresholds for criteria air pollutant emissions specify that a project during construc-tion may cause a significant impact if it would:
Emit more than 54 pounds per day (lb/day) of reactive organic gases (ROG);
Emit more than 54 lb/day of nitrogen oxides (NOx);
Emit more than 82 lb/day of PM10 from exhaust; or
Emit more than 52 lb/day of PM2.5 from exhaust.
Similar thresholds exist for a project during operation along with a threshold for localized concentrations of CO greater than 9.0 ppm (8-hour average) or 20.0 ppm (1-hour average). For PM10 and PM2.5 related to construction fugitive dust, BAAQMD specifies that projects include best management practices (BMP) rather than achieve specific emissions thresholds. These BMPs are shown in BAAQMD CEQA Guidelines (Tables 8-1 and 8-2 of BAAQMD 2011).
The BAAQMD thresholds for community risk and hazards specify that a project may cause a significant impact if the emissions create:
Increased incremental cancer risk greater than 10.0 in a million;
Increased non-cancer hazard greater than 1.0 Hazard Index for chronic or acute hazards;7
Incremental increase of annual average PM2.5 concentration greater than 0.3 µg/m3 from a single source.
7 Acute and chronic exposure to non-carcinogens is expressed as Hazard Index, which is the ratio of expected
exposure levels to acceptable reference levels.
PG&E Windsor Substation Project INITIAL STUDY
July 2013 5-23 Draft MND/Initial Study
Applicant Proposed Measures
PG&E has committed to the Applicant Proposed Measures (APMs) in Table 4-5 of the Project Descrip-tion. APMs AQ-1 through AQ-14 relate to air quality impacts. PG&E proposes to implement measures during the design, construction, and operation of the proposed project to ensure it would occur with minimal environmental impacts in a manner consistent with applicable rules and regulations. APMs are considered part of the proposed project in the evaluation of environmental impacts. CPUC approval would be based upon PG&E adhering to the proposed project as described in this document, including this project description and the APMs as well as any adopted mitigation measures identified by this Initial Study.
a. Would the project conflict with or obstruct implementation of the applicable air quality plan?
NO IMPACT. The BAAQMD is the primary agency responsible for managing local air quality and administering other California and federal programs ensuring implementation of the air quality management plan. A project could be inconsistent with the applicable air quality management plan or attainment plan if it could cause population and/or employment growth or growth in vehicle-miles traveled in excess of the growth forecasts included in the attainment plan. The proposed project would not create any new per-manent full-time or part-time jobs. The proposed substation would not be staffed. Local PG&E crew members would commute to the project site from the general vicinity. Substation construction would require up to 15 workers over the course of eight months, and distribution line work would require up to 16 workers over six to seven months.
PG&E estimates that each worker would make two trips per day to and from the site. During operations, PG&E maintenance personnel would visit the site once a month (PG&E 2010). Regional air quality plans anticipate some growth, and this anticipated growth includes the construction of some new infrastruc-ture, such as the proposed project. Therefore, the project would not conflict with or obstruct implementa-tion of the applicable air quality plan. No impacts would occur, and no mitigation is required.
b. Would the project violate any air quality standard or contribute substantially to an existing or projected air quality violation?
Construction Impacts
DURING CONSTRUCTION, LESS THAN SIGNIFICANT WITH MITIGATION INCORPORATED. Emissions during the construc-tion phase would include criteria air pollutants that could contribute to existing or projected violations of the ambient air quality standards. The proposed project involves construction of a substation with a footprint of 2.6 acres. The project would also require rebuilding 1.5 miles of power lines and reconduc-toring of 1.8 miles of overhead and underground distribution lines. Construction equipment that would be used for the proposed project is shown in Table 4-3 (Substation Construction – Typical Equipment Use) in Section 4 (Project Description). The construction workforce is described in detail Section 4.10.3 (Construction Workforce and Schedule). Substation construction would require up to 15 workers over the course of eight months, and distribution line work would require up to 16 workers over six to seven months.
During construction, emissions would be generated at the proposed substation site, at distribution line work areas, and along the roadways used to access these locations. Construction emissions would be caused by exhaust from vehicles and equipment (e.g., ozone precursors [volatile organic compounds and NOx], CO, and particulate matter [PM10 and PM2.5]) and fugitive dust/particulate matter from ground-disturbing activities and travel on unpaved roads. Diesel and gasoline-powered construction equipment at work sites would include loaders, graders, backhoes, cranes, demolition equipment, and

PG&E Windsor Substation Project INITIAL STUDY
Draft MND/Initial Study 5-24 July 2013
trucks for lifts, delivery, concrete, water, and work crews. Outside of work sites, exhaust emissions would be caused by vehicles transporting equipment and supplies to the sites, trucks removing debris, and workers commuting to and from work sites. Table 5.3-5 summarizes the estimated average daily construction emissions.
Table 5.3-5. Windsor Substation Project – Estimated Construction Emissions (lb/day)
NOx ROG PM10
[exhaust] PM10 [dust] PM2.5 CO SO2
Average Daily Emissions 2012 38.5 5.5 2.4 26.1 2.2 23.2 0.1
Average Daily Emissions 2013 43.2 4.4 2.0 64.0 1.8 24.3 0.1
BAAQMD Significance Threshold 54 54 82 Implement BMPs
54 None None
Source: PG&E 2011-2013, Data Request Responses; estimated using URBEMIS 2007, Ver 9.2.4. Note that implementation of APMs was assumed to reduce construction equipment, construction vehicle, and worker commute emissions by 15 percent.
Instead of specific significance thresholds for fugitive dust, the BAAQMD recommends BMPs for dust control. The BMPs in the BAAQMD CEQA Guidelines are incorporated into APM AQ-1 (water active con-struction areas twice daily during dry conditions), APM AQ-2 (cover trucks hauling dirt), APM AQ-3 (pave, apply water or soil stabilizers), APM AQ-4 (sweep access roads, staging areas, and parking areas), and APM AQ-5 (sweep streets with water sweepers). Mitigation Measure AQ-1 supplements these APMs by: limiting vehicle speeds to 15 mph on unpaved roads; requiring paving or covering of work areas; and requiring posting of information for a lead agency contact responsible for dust complaints. With the implementation of these APMs and Mitigation Measure AQ-1, the project would comply with all of the BAAQMD’s recommended BMPs for fugitive dust.
Reducing equipment exhaust emissions would occur through the APMs as follows: APM AQ-6 (encour-age worker carpooling), APM AQ-7 (use low emission equipment), APM AQ-8 (minimize idling time), APM AQ-9 (encourage use of natural gas vehicles), and APM AQ-10 (minimize welding and cutting). Mitigation Measure AQ-1 supplements these APMs by requiring proper maintenance and tuning of construction equipment.
With the implementation of the APMs for air quality and Mitigation Measure AQ-1, emissions from the proposed project would not exceed the BAAQMD’s significance thresholds, and the project would com-ply with the dust control measures required by BAAQMD. Therefore, construction-related emissions would not substantially contribute to any air quality violations, and this impact would be less than signif-icant.
Mitigation Measures for Construction-Phase Air Quality
In addition to APM AQ-1 through APM AQ-14:
AQ-1 Implement measures to control dust and equipment exhaust during construction. PG&E shall implement measures to control dust and vehicle exhaust during construction of the proposed substation. These measures shall incorporate Applicant Proposed Mea-sures AQ-1 through AQ-12 and additionally shall include the following:
Limit the speeds of construction vehicles on unpaved surfaces to 15 miles per hour.
Limit size of area subject to excavation, grading, or other construction disturbance at any one time to avoid excessive dust; paving shall occur as soon as possible after grading.
PG&E Windsor Substation Project INITIAL STUDY
July 2013 5-25 Draft MND/Initial Study
Provide BAAQMD phone number in a visible location. Post a publicly visible sign with the telephone number and person to contact at PG&E regarding dust complaints. This person shall respond and take corrective action within 48 hours. PG&E shall report to the CPUC within 1 week regarding complaints and corrective action taken.
Construction equipment will be properly maintained. All offroad construction diesel engines not registered under the CARB Statewide Portable Equipment Registration Program will meet at a minimum the Tier 1 California Emission Standards for Off-Road Compression-Ignition Engines as specified in California Code of Regulations (CCR) Title 13, Chapter 9, Sec. 2423(b)(1).
Operations and Maintenance Impacts
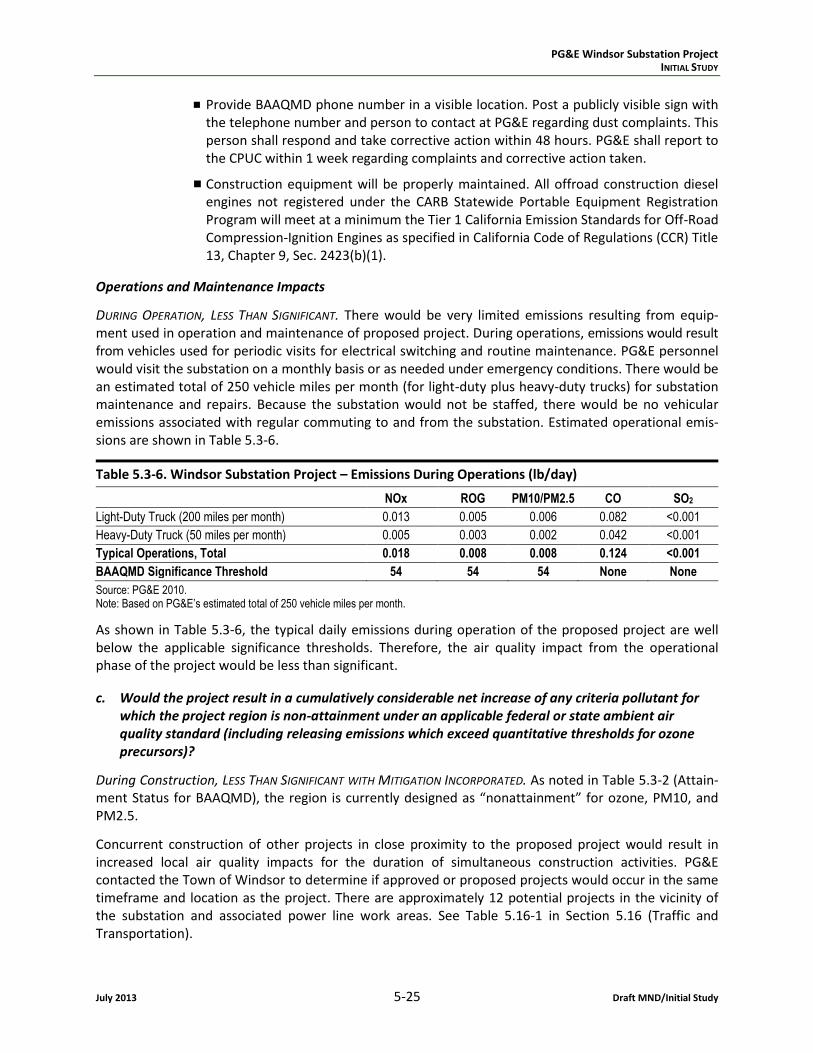
DURING OPERATION, LESS THAN SIGNIFICANT. There would be very limited emissions resulting from equip-ment used in operation and maintenance of proposed project. During operations, emissions would result from vehicles used for periodic visits for electrical switching and routine maintenance. PG&E personnel would visit the substation on a monthly basis or as needed under emergency conditions. There would be an estimated total of 250 vehicle miles per month (for light-duty plus heavy-duty trucks) for substation maintenance and repairs. Because the substation would not be staffed, there would be no vehicular emissions associated with regular commuting to and from the substation. Estimated operational emis-sions are shown in Table 5.3-6.
Table 5.3-6. Windsor Substation Project – Emissions During Operations (lb/day)
NOx ROG PM10/PM2.5 CO SO2
Light-Duty Truck (200 miles per month) 0.013 0.005 0.006 0.082 <0.001
Heavy-Duty Truck (50 miles per month) 0.005 0.003 0.002 0.042 <0.001
Typical Operations, Total 0.018 0.008 0.008 0.124 <0.001
BAAQMD Significance Threshold 54 54 54 None None
Source: PG&E 2010. Note: Based on PG&E’s estimated total of 250 vehicle miles per month.
As shown in Table 5.3-6, the typical daily emissions during operation of the proposed project are well below the applicable significance thresholds. Therefore, the air quality impact from the operational phase of the project would be less than significant.
c. Would the project result in a cumulatively considerable net increase of any criteria pollutant for which the project region is non-attainment under an applicable federal or state ambient air quality standard (including releasing emissions which exceed quantitative thresholds for ozone precursors)?
During Construction, LESS THAN SIGNIFICANT WITH MITIGATION INCORPORATED. As noted in Table 5.3-2 (Attain-ment Status for BAAQMD), the region is currently designed as “nonattainment” for ozone, PM10, and PM2.5.
Concurrent construction of other projects in close proximity to the proposed project would result in increased local air quality impacts for the duration of simultaneous construction activities. PG&E contacted the Town of Windsor to determine if approved or proposed projects would occur in the same timeframe and location as the project. There are approximately 12 potential projects in the vicinity of the substation and associated power line work areas. See Table 5.16-1 in Section 5.16 (Traffic and Transportation).
PG&E Windsor Substation Project INITIAL STUDY
Draft MND/Initial Study 5-26 July 2013
Simultaneous construction in close proximity to the proposed project work sites would also likely incor-porate the BAAQMD recommendations for minimizing air quality impacts and would need to comply with BAAQMD rules regarding dust control. Table 5.3-5 shows that construction-related criteria air pollutants would not exceed the project-level thresholds, and according to BAAQMD guidelines, these emissions would not be at a cumulatively considerable level. Therefore, with the implementation of APMs AQ-1 through AQ-12 and Mitigation Measure AQ-1 (Implement measures to control dust and vehicle/equip-ment exhaust), the proposed project would not result in a cumulatively considerable net increase of any criteria pollutants for which the project region in is nonattainment.
DURING OPERATION, LESS THAN SIGNIFICANT. Table 5.3-6 shows that operational emissions would result from limited vehicle use related to periodic maintenance, repair, and inspection of the project components, and that the emission levels would be below the BAAQMD thresholds. This would not result in a cumula-tively considerable net increase of any criteria pollutant.
d. Would the project expose sensitive receptors to substantial pollutant concentrations?
LESS THAN SIGNIFICANT. Sensitive receptors include residential areas, schools, day care centers, hospitals, and convalescent homes. The proposed substation parcel boundary is approximately 60 feet south of the nearest residence; the substation fenceline would be 125 feet from this home. Distribution line work sites would also be located near sensitive receptors. Excavation, grading, and construction activities could potentially expose sensitive receptors to construction-related emissions, including emissions of DPM and other toxic air contaminants, which would expose the receptors to increased health risk and hazards. The construction-related emissions would be short-term, ensuring that no single location would be exposed to increased pollutant concentrations for more than one year. Construction of the substa-tion would last approximately eight months. Distribution line work would occur over six to seven months, but construction at any one work site would last a much shorter time.
Construction-phase emission rates in Table 5.3-5 include diesel particulate matter (DPM), shown as PM10 exhaust, PM2.5, and ROG, which includes other air toxics common to equipment exhaust. The quantified emissions from substation site construction were used in a screening air dispersion model to determine whether nearby sensitive receptors would experience substantial concentrations.
Toxic air contaminant (TAC) risk and hazards were assessed by PG&E using a dispersion model (SCREEN3) with the construction emissions configured as an area source (PG&E 2011-2013).8 From that analysis, which provided hazard index calculations for one TAC, formaldehyde (PG&E 2011-2013), the maximum offsite ground level concentrations of the other TACs in the construction exhaust were derived. The results were reviewed and expanded upon to determine the risk and hazards associated with all TACs likely to occur with construction. For determining acute hazard, the peak daily construction reactive organic gas (ROG) emissions were separated into individual TAC emission rates using speciation factors for diesel exhaust provided by the BAAQMD with the PG&E assessment (PG&E 2011-2013). Determining the chronic hazard involved a similar analysis for annual average emissions. The assessment found that no significant cancer risk would be caused by DPM, and no significant acute or chronic hazard would be posed by formaldehyde or the combined effects of all TACs. The maximum annual average incremental
8 SCREEN3 is a single source Gaussian plume model which provides maximum ground-level concentrations for
point, area, flare, and volume sources, as well as concentrations in the cavity zone, and concentrations due to inversion break-up and shoreline fumigation. It is a conservative screening model that is usually applied before the refined air quality model to determine if refined modeling is needed. (http://www.epa.gov/scram001/dispersion_screening.htm).
PG&E Windsor Substation Project INITIAL STUDY
July 2013 5-27 Draft MND/Initial Study
PM2.5 concentration would be approximately 0.2 µg/m3 during the year of substation construction. This level would not exceed the applicable BAAQMD threshold of 0.3 µg/m3; therefore, impacts would be less than significant.
Implementation of APMs AQ-1 through AQ-12 and Mitigation Measure AQ-1 would further reduce the impact related to exposing sensitive receptors to toxic air contaminant pollutant concentrations during project construction. During project operations, emissions would result from limited use of vehicles for routine maintenance, repair, and inspection (see Table 5.3-6) that would not expose sensitive receptors to substantial concentrations of air pollutants.
e. Would the project create objectionable odors affecting a substantial number of people?
NO IMPACT. The proposed project includes short-term construction activity that would involve com-bustion of diesel fuel and emissions of dust. Odors of construction equipment diesel exhaust would be reduced by the use of either low-sulfur or ultra-low-sulfur fuel as required by law. No substances used or activities involved with the project would have the capability to produce offensive odors.
PG&E Windsor Substation Project INITIAL STUDY
Draft MND/Initial Study 5-28 July 2013
This page intentionally blank.