Embed Size (px)
Citation preview
BEML
GENERAL INTRODUCTION
INDUSTRIAL BACKGROUND
Industries are the pointing lights to the growth of an economy and are
the backbone of the country. The development and growth of a country
largely depends on industrialization of its economy.
India is basically an agriculture-based country. It is after the
independence, India has given importance to the growth of Industries
through 5year planning programmes. Government has taken a leading
march to up heave the movement of Industrialization.
For any country, small or big, developed or developing, need good
infraustructural facilities, such as roads, dams, tunnels etc. The
infraustructural facilities are the primary need for the transportation or
movement of goods. Roads play an important role in this aspect.
Tremendous development has taken place in science and technology,
which has mechanized every work in every field. Manually carried out work
is less productive and time consuming. Thus, to increase efficiency and
productivity, mechanical equipments came into existence and almost every
field is mechanized. As such, the demand for such mechanical equipments
has increased tremendously.
Foreigners have ruled India for several years. And as such, after
Independence, India has given priority to strengthen the country’s defence
force. Several Industries producing defence equipments have been started by
the Indian Government there after. India felt the need of having strong
defence, which is capable of defending its borders from neighbours. In this
view, BEML has been established by the Ministry of Defence.
Adarsha College of Maanagement & Science
1
BEML
BEML was mainly established to produce defence equipments and
heavy capital equipments like, Railway coaches, Earthmovers, Machineries
etc.
Two aggressive wars with Pakistan and China have made Defence Ministry
to start one more unit of BEML. It was started in Kolar Gold Fields in the
year 1964. It is one of the biggest units in Asia.
BEML has number of branches all over India. Its various units in
different parts of the country have immensely contributed to the growth of
the economy. It is not only has provided employment, but also has
successfully achieved the advantages of economies of scale. Ancillary and
small scale Industries has been started around its vicinity. It is also earning
foreign exchange to the country. It is contributing to the economy’s growth
both directly and indirectly. It has emerged as a powerful Industrial unit of
Indian economy.
India’s heavy Earth Moving equipment and spare parts manufacturers
manufacture various capacities ranging from mini version to giants.
Overseas manufacturers also manufacture the equipment and spares and
export to our country, hence, providing a stiff competition.
There are four major OEM and around 500 spare parts manufactures in
the country. The four major manufacturers are:
BEML
L&T
TATA-HITACHI
ESCORTS
Among them BEML is dominating.
Adarsha College of Maanagement & Science
2
BEML
MARKET STRUCTURE
The major customers for the above products are the coal mines
ministry, defence ministry, fleet owners in the construction industry, state
government civil engineering and irrigation department and some small
individual operators.
Adarsha College of Maanagement & Science
3
BEML
SUBJECT BACKGROUND
INTRODUCTION TO FINANCE
Finance is lifeblood of the economy. It is one of the major
components, which activates and stimulates the overall growth of the
economy.
Finance is a body of principles and theories, which deals with rising, and
acquiring of funds on reasonable terms, and use of money by the acquirer.
In the modern money oriented economy, finance is one of the basic
foundations of all kinds of economic activities. It is a master key, which
provides access to all the sources for being employed in manufacturing and
merchandising activities. It is rightly said that, “Business needs money to
make more money”. Efficient management of every business enterprise is
closely linked with efficient management of finance. Hence, a well-knit
financial system directly contributes to the growth of the economy.
BUSINESS FINANCE
Business finance is that business activity, which is concerned with the
acquisition and conservation of capital funds to meet financial needs and
overall objectives of a business enterprise.
Financial functions of a business may be stated as the procurement of funds
and their effective utilization.
Adarsha College of Maanagement & Science
4
BEML
FINANCIAL MANAGEMENT
Sound financial management is necessary in every organization.
Collins Brooks has remarked that, “Bad production management and sales
management have stain in hundreds, but, a faulty financial management
have stain in thousands”.
Financial management is a managerial activity, which is concerned
with the anticipation of financial needs, acquiring financial resources,
allocating funds in business, administrating the allocation of funds and
accounting and reporting to the management over the financial matters.
OBJECTIVES
The firm’s investment and financing decisions are unavoidable and
continuous. In order to make them rational, the firm must have certain
goals.
The main objectives of financial management are:
1. Profit maximization as a social obligation.
2. To ensure wealth maximization.
3. To have a balanced asset structure, that is, proper balance between
fixed assets and current assets.
4. To maintain liquidity to meet the upcoming obligations.
5. To ensure fair returns to share holders.
6. To have an efficient and disciplined financial structure.
7. To avail the creation of resources needed by the firm.
Adarsha College of Maanagement & Science
5
BEML
FUNCTIONS OF BUSINESS FINANCE
The functions of a financial manager are to plan cautiously, control
and execute the financial objectives with great care. He should review and
control the financial decisions to commit or recommit the funds to new or
outgoing uses. Thus, in addition to raising funds, financial management is
directly concerned with production, marketing and other functions of an
enterprise.
The main functions of business finance are:
1. Funds requirement decisions
2. Financing or capital-mix decision
3. Investment or long-term asset-mix decision
4. Liquidity or short-term asset-mix decision
5. Dividend or profit allocation decision
FINANCIAL STATEMENTS
A firm communicates financial information to the users through
financial statements and reports. Financial statements are the organized
collection of financial data, undertaken according to logical and consistent
accounting procedures for the purpose of presenting a periodical review or
report on the financial aspects o f a business firm, such as operating results
and financial position of the firm at a particular period of time.
Adarsha College of Maanagement & Science
6
BEML
OBJECTIVES
I. Basic objective is to assist in decision-making.
II. To provide reliable information about economic resources and
obligations of a firm.
III. To provide financial information that assist in estimating the earning
potential of the enterprise
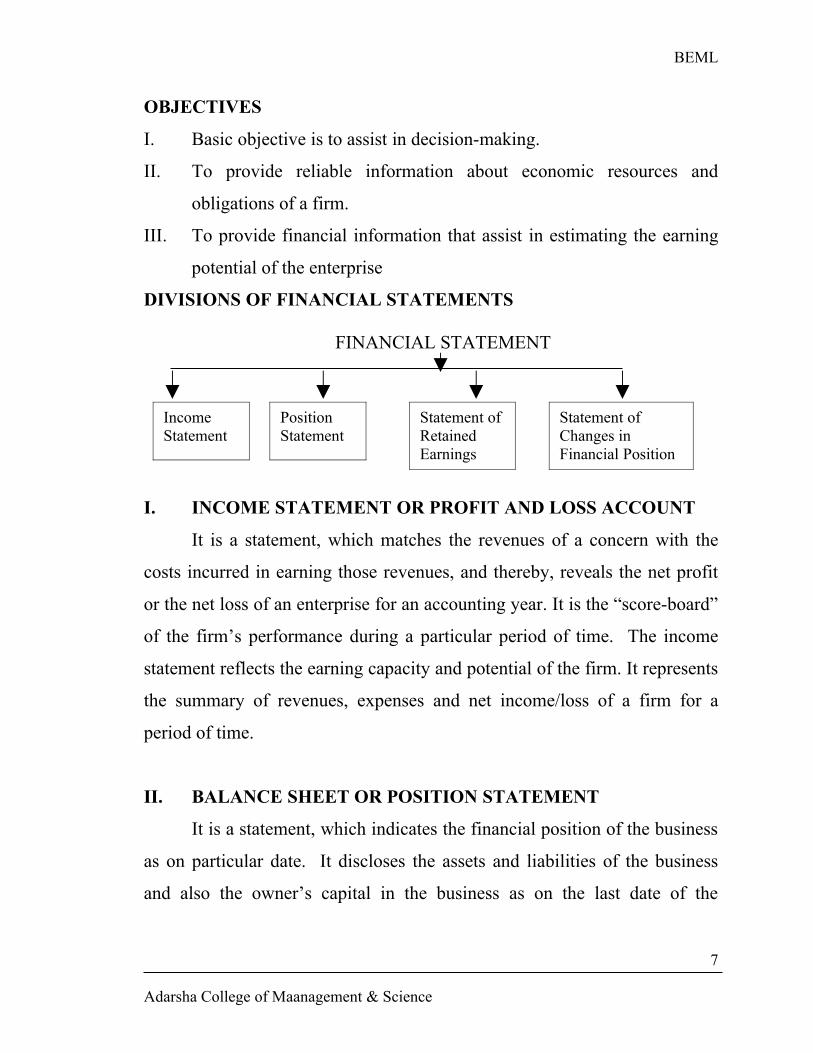
DIVISIONS OF FINANCIAL STATEMENTS
FINANCIAL STATEMENT
I. INCOME STATEMENT OR PROFIT AND LOSS ACCOUNT
It is a statement, which matches the revenues of a concern with the
costs incurred in earning those revenues, and thereby, reveals the net profit
or the net loss of an enterprise for an accounting year. It is the “score-board”
of the firm’s performance during a particular period of time. The income
statement reflects the earning capacity and potential of the firm. It represents
the summary of revenues, expenses and net income/loss of a firm for a
period of time.
II. BALANCE SHEET OR POSITION STATEMENT
It is a statement, which indicates the financial position of the business
as on particular date. It discloses the assets and liabilities of the business
and also the owner’s capital in the business as on the last date of the
Adarsha College of Maanagement & Science
7
Income Statement
Position Statement
Statement of Retained Earnings
Statement of Changes in Financial Position
BEML
accounting year. It contains information about the resources and obligations
of a business entity and about the owner’s interest in the business.
III. STATEMENT OF RETAINED EARNINGS OR CHANGES IN
OWNER’S EQUITY OR PROFIT & LOSS APPROPRIATION
ACCOUNT
It is a connecting link between Profit and loss account and Balance
sheet. Only Joint Stock companies prepare it.
It is a statement, which is prepared to show the distribution of the earnings
or profits of a company during a particular accounting period as retained
earnings and dividends and reserves. The balance shown by the income
statement is transferred to the balance sheet through this statement after
making necessary appropriations.
I. STATEMENT OF CHANGES IN FINANCIAL POSITION
It is a statement, which discloses the changes in assets, liabilities and
owner’s equity between dates of two balance sheets. It also discloses the
way in which the firm used its financial resources during the period.
The most commonly used forms of the statement of changes in financial
position are:
(a) Statement of sources and uses of funds or Fund flow statement
(b)Cash flow statement
(a)STATEMENT OF SOURCES AND USES OF FUNDS OR
WORKING CAPITAL
It is a statement prepared to determine the changes in the sources and
uses of working capital between dates of two balance sheets.
It helps management in planning and proper utilization of funds.
Adarsha College of Maanagement & Science
8
BEML
(b)CASH FLOW STATEMENT
It is a statement, which summarizes the causes for the changes in cash
position of a business between dates of two balance sheets. It indicates
sources and uses of cash. It helps the management in making projections of
cash inflows and outflows for the near future to determine the availability of
cash.
ANALYSIS AND INTERPRETATION OF FINANCIAL
STATEMENTS
Analysis and interpretation of the financial statements is the
methodical classification of the data given in the financial statements into
simple component parts or elements, establishment and study of the
relationship between the classified component parts with a view to provide a
full diagnosis of the profitability and financial strength of an enterprise.
STEPS INVOLVED IN ANALYSIS OF FINANCIAL STATEMENTS
It involves three steps or processes:
1.ANALYSIS
Analysis of financial statements refers to the splitting up or
regrouping of the figures found in the financial statements into the desired
homogenous and comparable component parts.
Eg: The amount of current assets in the balance sheet may be regrouped as
Debtors, Cash, Inventories etc.
Adarsha College of Maanagement & Science
9
BEML
2. COMPARISON
Comparison is the process of ascertainment of the relative magnitudes
of the component parts or the study of the extent of relationship of the
component parts.
3. INTERPRETATION
Interpretation refers to the formation of rational judgment and the
drawing of proper conclusions of the business through careful study of the
relationship of component parts obtained through analysis and interpretation.
Analysis and interpretation go in hand-in-hand. Interpretation cannot
be done without analysis and comparison, and mere analysis without
interpretation is of no value.
OBJECTIVES
The objectives of the analysis and interpretation of financial statements are;
1. To determine the progress of the concern
2. To measure the operational efficiency of the company
3. To judge the financial position, i.e., short-term liquidity and long-term
solvency of the concern.
4. To ascertain the future prospects of the company.
TYPES OF FINANCIAL ANALYSIS
Financial analysis may be classified into different types:
1. On the basis of materials used for the analysis or the persons interested in
the analysis
2. On the basis of the modus operandi or method of operation followed in
the analysis
Adarsha College of Maanagement & Science
10
BEML
1. ON THE BASIS OF PERSONS INTERESTED IN THE ANALYSIS
• EXTERNAL ANALYSIS: is the analysis done by external parties, i.e.,
the parties, who are outsiders to the business. The external parties are
shareholders, investors, lenders, creditors etc. who have no access to the
books of account and the internal records of the concern. The analysis
mainly depends upon the published financial statements.
• INTERNAL ANALYSIS: is the analysis done by the internal parties of
the concern. They include persons who have access to the books of
accounts and the internal records of the concern. They are personnel of
finance and accounting departments of the concern and the executives for
management purpose.
2. ON THE BASIS OF THE METHOD OF OPERATION
FOLLOWED IN THE ANALYSIS
• VERTICAL OR STRUCTURAL ANALYSIS: when a single set of
financial statements relating to just one accounting year is analyzed, it is
said to be vertical analysis.
It is an analysis used to study the quantitative relationship of items in the
financial statements as on a particular date or for one accounting year,
through ratios. The figure from a year’s financial statement is compared
with a base figure selected from the same financial statement.
• HORIZONTAL ANALYSIS OR TREND ANALYSIS: When the
financial statements of a number of years are analyzed, it is said to be
Adarsha College of Maanagement & Science
11
BEML
horizontal analysis. In this, a comparison of the trend of each item in the
financial statements over a number of years is made.
The current year’s figures are compared with the figures of the standard
or base year, and changes in each of the elements from the base year are
shown, usually, in the form of percentages.
TOOLS AND TECHNIQUES OF FINANCIAL ANALYSIS
A number of tools and techniques are available for financial analysis. The
important tools are as follows:
i. Comparative financial statement analysis
ii. Common-size statement analysis
iii. Trend analysis or trend percentages
iv. Ratio analysis
v. Fund flow analysis
vi. Cash flow analysis
i. COMPERATIVE FINANCIAL STATEMENTS
These are the financial statements, which summarizes and present
relative accounting data for a number of years, incorporating therein changes
in individual items.
The current year financial happenings are compared with the previous year’s
events and the direction of growth of the enterprise is found out.
There are two important comparative financial statements:
COMPARATIVE BALACE SHEET: is a balance sheet which is
prepared to facilitate the comparison of assets, liabilities and proprietor’s
Adarsha College of Maanagement & Science
12
BEML
capital of a business as on two different dates and to find out the changes
in the elements.
COMPARITIVE INCOME STATEMENT: is a statement prepared to
compare the various items of income statements of the different periods
and to ascertain the changes in the items of income statements from one
period to another.
ii. COMMON-SIZE STATEMENT
These are the statements in which the data or figures reported in the
financial statements are converted into percentages, taking some common
base. These statements are also known as component percentage
statements or 100 percent statements, because each statement is reduced
to the total of 100% and each individual item is expressed as percentage
of the total of 100.
iii. TREND ANALYSIS
Trend analysis is a horizontal analysis of financial statements, as the
financial statements of more than one year is analyzed. Comparison of past
data over a period of time with a base year is known as trend analysis.
It is possible to identify the areas in which the concern has improved over
the years and the areas in which it has not succeeded. It is possible to know
the present position and the trend or direction in which the enterprise is
moving, through trend analysis.
Adarsha College of Maanagement & Science
13
BEML
iv. RATIO ANALYSIS
Financial statements, no doubt, contain the items related to profit and loss
and financial position of a concern, but the items found in financial
statements will not be of much use, if they are considered independently.
They will be very useful only when one item is considered in the light of
another, i.e., compared.
In this regard, ratio analysis is a powerful tool. A ratio is defined as “The
indicated quotient of two mathematical expressions” and “as the relationship
between two or more items”.
It is used as an index or yardstick for evaluating the financial position
and performance of a firm. Ratio analysis is the technique of the calculation
of number of accounting ratios from the data found in the financial
statements, the comparison of the accounting ratios with those of the
previous years or with those of the concerns engaged in similar line of
activities or with those of standard or ideal ratios and interpretation of the
comparison there after.
Ratios can be expressed in two ways:
In the terms of time. Eg.: current assets to current liabilities = 1.36 times
In terms of percentage. Eg.: net profit to net sales = 50%
CLASSIFICATION OF ACCOUNTING RATIOS
Accounting ratios can be classified mainly on 2 bases:
I. On the basis of origin or source of figures placed in relation with
each other:
(a) Balance sheet ratios or financial ratios
(b)Profit and loss account ratios or operating ratios
(c) Mixed or combined or inter-statement ratios
Adarsha College of Maanagement & Science
14
BEML
II. On the basis of nature and functions of the accounting ratios:
(a) Liquidity ratios
(b)Leverage ratios
(c) Turnover ratios
(d)Profitability ratios
LIQUIDITY RATIOS OR SHORT-TERM SOLVENCY
RATIOS
The importance of liquidity in the sense of the ability of a firm to meet
current or short-term obligations when they become due for payment can
hardly be over-stressed. This liquidity ratio measures the ability of a firm to
meet its short-term obligations and reflect short-term financial strength or
solvency of a firm.
The most common ratios which measures the liquidity of a firm are:
1. Current ratio or working capital ratio
2. Quick ratio or Acid test ratio or Liquid ratio or Liquidity ratio
3. Absolute liquid ratio or Cash position ratio or Cash ratio
4. Inventory to Working capital ratio
5. Net working capital ratio
1. Current ratio
It is the ratio, which expresses the relationship between current assets &
current liabilities.
Current Assets: Includes cash & other assets which can be converted into
cash with in an year, such as marketable securities, debtors, inventories,
prepaid expences, o/s or accured incomes, advances to staff & others,
provisions for bad & doubtful debts.
Adarsha College of Maanagement & Science
15
BEML
Current Liabilities: All obligations maturing within a year are included in
current liabilities. They include bills payable, creditors, bank overdrafts,
accrued expenses, short term bank loans, provision for income tax, dividend
payable, incomes received in advance and long term debt maturing in the
current year.
Expression of Current Ratio:
C.R. = Current assetsCurrent liabilities
Interpretation
As a conventional rule, a current ratio of 2:1 or more is considered
satisfactory. If the actual current ratio is less than 2:1, the logical conclusion
is that the concern doesn’t enjoy sufficient liquidity & there is shortage of
working capital.
2. Quick/ Acid Test Ratio
Quick ratio is the ratio, which express the relationship between quick or
liquid assets & quick or liquid liabilities.
Quick assets include all the current assets excluding stock or inventory &
prepaid expenses.
Quick liabilities include all the current liabilities excluding bank o/d &
cash credit.
Expression of Quick Ratio: Quick Ratio Quick Liabilities
Interpretation
The ideal quick ratio is 1:1. If the quick ratio is equal or more than the
standard ratio, it is satisfactory.
Adarsha College of Maanagement & Science
16
BEML
3. Cash Ratio/ Absolute Liquid Ratio
Cash Ratio is the ratio, which expresses the relationship between absolute
liquid assets & quick liabilities. Absolute Quick Assets refer to cash & near
cash assets include cash in hand, cash at bank & readily marketable
securities.
Expression: Absolute Liquid Assets Liabilities Current
Interpretation
The ideal Absolute Liquid Ratio is 1:2. If the actual absolute Liquid
Ratio is equal or more than the standard ratio the concern is liquid.
4. Inventory to Working Capital Ratio
It is the ratio of Inventory to Working Capital. Inventory refers to closing
stocks of raw materials, work in progress (semi finished goods) & finished
goods. Working capital is the excess of current assets over current liabilities
Expression: Inventory * 100 Working Capital
Interpretation
As per standard ratio, the inventories should not absorb more than
75% of working capital. A low inventory to working capital ratio indicates
under stocking & company, high liquid position & high ratio indicates over
stocking & company, a low liquid position.
5. Net Working Capital Ratio
It is the relationship between net working capital & net assets or capital
employed. Net Working Capital is the difference between current assets &
current liabilities
Expression: Net Working Capital Net Assets
Adarsha College of Maanagement & Science
17
BEML
Interpretation
The Net Working Capital should be more than the net assets to meet
the short-term obligations of the company easily.
LEVERAGE/ CAPITAL STRUCTURE/ LONG TERM SOLVENCY
RATIO
Leverage Ratios are the financial ratios, which throw light on long-
term solvency of a firm as reflected in its ability to assure the long-term
creditors with, regarded to
i. Periodic payment of interest during the period of loan
ii. Repayment of principal on maturity or in pre determined installments at
due dates
There are thus, two aspects of the long-term solvency of a firm
Ability to repay the principal when due &
Regular payment of interest
Accordingly, there are two different, but, mutually dependant & inter
related, types of leverage ratios
(a) First, ratios are based on the relationship between borrowed funds &
owners capital. Their ratios are computed from the balance sheet & have
many variations, such as
Debt Equity Ratio/ External- Internal Ratio
Property/ Equity/ Net worth Ratio
Solvency Ratio
Fixed Asset to Net worth Ratio
Current Asset to Net worth Ratio
Current Liabilities to Net worth Ratio
Adarsha College of Maanagement & Science
18
BEML
Capital Gearing Ratio
Fixed Assets Ratio
(b) The second type of capital structure ratios, popularly called as Coverage
Ratios are calculated from profit & loss account included in this category
Interest Coverage Ratio
Dividend Coverage Ratio
Total Fixed Charges Ratio
1. Debt Equity Ratio
This is the Ratio of total outside liabilities to total owner’s funds. The
ratio reflects the relative claims of creditors & shareholders against the
assets of the firm.
Equity/Owners fund = capital+ all accumulated results + profits.
Expression: Total Long term Debt Total Long-term funds
Interpretation
The ideal Debt Equity Ratio is 2:1. As such, if the debt is less than two
times of equity, the logical conclusion is that the financial structure of the
firm is sound & the stake of long term creditors is relatively less.
2. Proprietary Ratio
This is the Ratio, which express the relationship between net worth and
equity & total assets. Net worth/ Equity means the excess of total assets over
total liabilities. It means proprietor’s funds. Total Assets refers to all
realizable assets, both tangible & intangible except goodwill.
Expression: Net worth/ Shareholders Fund
Adarsha College of Maanagement & Science
19
BEML
Total AssetsInterpretation
Ideal ratio is 0.50:1. Higher the Proprietary Ratio, the stronger is the
financial position of the concern & vice versa.
3. Solvency Ratio
This is the ratio between total assets & total liabilities
Expression: Total Assets Total Liabilities
Interpretation
Higher the Solvency Ratio of a concern the stronger is the financial
position.
4. Fixed Assets to Net worth Ratio
It is the Ratio between the fixed assets & net worth
Fixed Assets: (machinery, building, furniture etc) – depreciation
Net worth: owner’s fund
Expression: Net Fixed Assets * 100 Net worth
Interpretation
Ideal ratio is 2/3 or 67% if the fixed assets constitute more than 67%
of the proprietor’s fund, the indication is that the concern is financially weak
& greater risk for creditors & vice versa.
5. Current Assets to Net worth
This is the Ratio between current assets & net worth
Expression: Current Assets Net worth
Interpretation
If the ratio is high, the financial strength of the concern is good.
Adarsha College of Maanagement & Science
20
BEML
6. Current Liabilities to Net worth
It is the ratio between current liabilities & net worth of a concern.
Expression: Current Liabilities Net worth
Interpretation
The desire level set is 1/3 or 33 1/3. If the Actual Ratio is very high, the
liability base of the concern will not provide an adequate cover for long-term
creditors. That means, it would be difficult for the concern to obtain long-
term funds.
7. Capital Gearing Ratio
This is the Ratio, which expresses the relationship between equity capital
& fixed interest bearing securities & fixed dividend bearing shares.
Equity Capital: Equity Share Capital + Accumulated Reserves & profits
Fixed Interest Bearing Securities: Long-term loans carrying fixed rate of
interest. They comprise debentures, long-term loans & long-term fixed
deposits.
Fixed Dividend Bearing Shares: Preference Share Capital, which is entitled
to, fixed rate of interest every year.
Expression:
Fixed Interest Bearing Securities + Fixed Dividend Bearing Securities
Equity Share holders Fund
Interpretation
If the fixed interest bearing securities & fixed dividend bearing securities
are more than equity share holder’s fund, the company is said to be highly
geared & vice versa.
Adarsha College of Maanagement & Science
21
BEML
8. Fixed Assets Ratio
This is the ratio between fixed assets & capital employed.
Capital Employed = owner’s fund + long term loans, deposits & debentures
(or) = Fixed Assets + Trade Investments+ Net Working Capital.
Expression: Fixed Assets Capital Employed
Interpretation
The Ratio should not be more than 1. The ideal ratio is 0.67, this
would means that not only all the fixed assets but also a part of working
capital are financed by long term funds, because part of working capital
known as “ CORE WORKING CAPITAL”, should met out of long term
funds.
Coverage Ratios
It measures the relationship what is normally available from operations of
the firms & claims of the outsiders.
1. Interest Charged Ratio
This measures the debt servicing capacity of a firm in so far as fixed
interest & long term loans is concerned. This shows how many times the
interest charges are covered by the EBIT out of which they will be paid.
Expression: EBIT Fixed Charges
Interpretation
Ideal fixed charges cover 6 to 7 times, as such, higher fixed charges
cover indicates that there is greater margin of safety for the long term
Adarsha College of Maanagement & Science
22
BEML
lenders & it is easy to obtain long term loans & vice versa in low fixed
charges.
2. Dividend Coverage Ratio
This measures the ability of the firm to pay dividend on the preference
shares, which carry a fixed rate of return.
Expression: EAT Preference Dividend
3. Total Coverage Ratio
The over all ability of a firm to service outside liability is truly reflected
in total Coverage Ratio. It takes into account fixed charges like interest on
loan, preference dividend, repayment of principal etc.
Expression: EBIT Fixed Charges
Activity/ Performance/ Turnover Ratios
Activity Ratios refers to Ratios, which measures the level of activities,
the performance or the operating efficiency of an enterprise. They may be
defined as the test of relationship between sales & various assets of the firm.
Several Activity Ratios are calculated to judge the effectiveness of asset
utilization.
The important Activity Ratios are
1. Inventory/ Stock Turnover Ratio
2. Receivable/ debtors Turnover Ratio/ debtors Velocity
3. Creditors Turnover Ratio/ creditors Velocity
4. Cash Turnover Ratio/ Cash Velocity
5. Assets Turnover Ratio/ Investment Turnover Ratio
Adarsha College of Maanagement & Science
23
BEML
6. Sales to net worth Ratio
7. Working Capital Turnover Ratio
1. Inventory Turnover Ratio
This is the ratio, which indicates the number of times the stock is turned
over during the year. This ratio indicates the efficiency of the firm in selling
its products. It is the ratio between stock & cost of goods sold.
Expression Cost of Goods Sold Average Stock/ Inventory
Average Stock = Opening Stock of Closing Stock of finished goods + finished goods 2
Cost of Goods Sold = Opening stock of goods+ manufacturing cost
(including purchases) - closing stock.
Interpretation
A stock turn over Ratio of 8 times a year is considered ideal. The ratio
higher than the ideal rate indicates the efficient sales of the concern i.e., the
business is expanding & lower ratio indicates the inefficient in sales of the
products i.e., business is not prosperous.
The manufacturing firms inventory consists two more components
viz.
(a) Raw Materials
(b) Work-in-progress
Adarsha College of Maanagement & Science
24
BEML
To know the levels of raw materials involved in inventory & work-in-
progress inventory held by the firm on coverage, the following two ratios are
helpful.
(a) Raw Materials Inventory TOR = Cost of raw materials used Average Raw Material Inventory
(b) Work-in-progress TOR Ratio = Cost of Goods manufactured Average work-in-progress Inventory
2. Debtors Turnover Ratio
It is the ratio, which indicates the relationship between debtors & sales. It
is the ratio, which indicates the number of times the debts collected in a
year.
Expression: Net Credit Sales Average Debtors
Debtors = Sundry debtors + Bills Receivable
Average Debtors = Opening Debtors + Closing Debtors 2
Debt Collection Period
This indicates the average time taken by the firm to collect debts.
Expression: Months/ Days in a year Debtors TOR Ratio
Interpretation
If the actual period of credit allowed is more than the normal period of
credit or ideal period of credit (30 days) the indication is that credit
collection is not efficient. In the adverse case, it is the indication of efficient
credit collection.
Adarsha College of Maanagement & Science
25

BEML
3. Creditors Turnover Ratio
This is the Ratio between creditors & purchasers. It is the Ratio, which
indicates the number of times the creditors are paid in a year.
Expression: Net Credit Purchases Average creditors
Creditors = sundry creditors + bills payable.
Average creditors = Opening creditors + Closing crs 2
Debt Payment Period
This indicates the time with in which the payments are made to
creditors.
Expression: Days/ Months in a Year Creditors TOR Ratio
Interpretation
If the actual period of credit received from creditors is less than 30 days
(ideal time), it indicates that sufficient period of credit has not been received
from creditors. In the adverse case, it indicates that the concern has received
sufficient period of credit from the creditors.
4. Cash TOR Ratio
This is the ratio between cash & turnover or sales
Expression: Net Annual Sales Cash
Cash = cash in hand + cash at bank & readily realizable investments
Or securities
Net Sales = Sales – Sales Returns.
Interpretation
Adarsha College of Maanagement & Science
26
BEML
Ideal Cash TOR Ratio is 10:1. The Actual Ratio equal or more than the
ideal ratio indicates the effective utilization of the cash resources, & vice
versa in adverse case.
5. Assets Turnover Ratio
This represents the relationship between sales & assets. Several assets
TOR Ratio can be calculated as follows
Total Asset TOR Ratio
Fixed Asset TOR Ratio
Current Asset TOR Ratio
Asset TOR Ratio
This is the ratio between total assets or turn over or sales
Expression: Net Sales Total Assets
Interpretation
The ideal Total Asset TOR Ratio is that the sales should be at least two
times the value of the assets (2:1). The actual Ratio more than the ideal
Ratio indicates that the assets of the concern are utilized effectively & vice
versa in adverse case.
Fixed Asset Turnover Ratio
This is ratio between fixed asset & turnover
Expression: Net Sales Fixed Assets (net)
Net Sale = Sales – Returns
Adarsha College of Maanagement & Science
27
BEML
Fixed Assets = Fixed Assets – Depreciation
Interpretation
Ideal ratio is 5:1 the actual ratio equal or more than the ideal ratio
indicates the better utilization of fixed assets & vice versa in adverse case.
Current Assets TOR Ratio
This is the between current assets & turn over
Expression: Net Sales Current Assets
Interpretation
There is no ideal ratio. Yet the interference is that a high Current TOR
Ratio is an indication of better utilization of current assets & vice versa in
adverse cases.
6. Sales Net worth Ratio
This is the ratio between sales & net worth (owner’s fund)
Expression: Net Sales Current Assets
Interpretation
If the volume of sales in relation to net worth is reasonable, it indicates
that the owner’s funds have been effectively utilized.
7. Working Capital Turnover Ratio
This is the ratio between working capital & turnover
Expression: Net Sales Working Capital
Interpretation
Adarsha College of Maanagement & Science
28
BEML
Higher Working Capital TOR Ratio indicates the efficiency & low
ratio indicates the inefficiency of the management in the utilization of
working capital.
Profitability Ratios
Profit is the difference between revenues & expenses over a period of
time. Profit is the ultimate output of the company & it will have no future if
it fails to make sufficient profits.
Profitability Ratios reveal the total effect of the business transactions
on the profit position of the enterprise & indicate how far the enterprise has
been successful in its aim.
1) Profit Ratios Related to Sales
2) Profitability in Relation to Investment
1. Profit Ratios Related to Sales
These are the ratios, which are based on the premise that a firm should
earn sufficient profit on each rupee of sales, the difference ratios under this
head are:
i. Profit Margin Ratio
Measures the relationship between profit & sales. The ratios under this
category are:
o Gross Profit Ratio
o Net Profit Ratio
ii. Expenses Ratio
Adarsha College of Maanagement & Science
29
BEML
Expenses refer to operating expenses of a firm exclusive of financial
expenses like interest, taxes & dividends & extra ordinary losses due to theft
of goods, goods loosed by fire etc. Different expense ratios are
o Operating Expenses Ratio
o Cost of Goods Sold Ratio
o Specific Expenses Ratio
2. Profitability Ratios Related to Investments
This is based on the exim that a firm should earn reasonable profits on
the capital invested. The different ratios under this category are
o Return on Assets
o Return on Capital Employed
o Return on Share holder’s Equity Funds
o Return on Equity Capital Ratio
o Earning Per Share
o Dividend Per Share
o Dividend Payout Ratio
o Earnings & Dividend Yield
o Price-Earning Ratio
1. Gross Profit Ratio
This is the relationship between gross profit & sales
Expression: Gross Profit * 100 Sales
Interpretation
A high Ratio of G/P to sales is a sign of good management, as it
implies that the cost of production of the firm is relatively low. It may also
Adarsha College of Maanagement & Science
30
BEML
be indicative of higher sales price without a corresponding increase in the
CGS.
2. Net Profit Ratio
This is the ratio between net profit & sales.
Expression: Net Profit * 100 Sales
Interpretation
A high Ratio indicates that profitability of the concern is good & vice
versa in adverse cases.
3. Operating Expenses Ratio
This is the ratio of operating expenses to sales.
Expression: Operating Expenses * 100 Sales
Operating Expenses = CGS + other operating expenses
Interpretation
A low Ratio is an indication of operating efficiency of the business.
4. Cost of Goods Sold Ratio
This is the ratio of CGS to sales
Expression: Cost of Gods Sold Sales
Cost of Goods Sold =Operating Stock+ Purchase – Closing Stock.
5. Specified Expenses Ratio
This is the ratio of specified expenses & sales
i. Factory Expenses Ratio = Factory Expenses * 100 Net Sales
Factory Expenses = Wages, Power etc.
Adarsha College of Maanagement & Science
31
BEML
ii. Administrative Expenses Ratio = Administrative Expenses * 100 Net Sales
Administrative Expenses = Salaries, Office Rent, Printing, Stationary…
iii. Selling & Distribution Expenses Ratio
= Selling & Distribution Expenses * 100 Net Sales
Selling & Distribution Expenses = Advertisement, Cash discounts allowed,
carriage outward etc
Interpretation
A low expense ratio is an indication of the economy & efficiency of
operations. A high ratio is the indication of inefficiency.
6. Return on Assets
This is the ratio of net profit to total assets
Expression: Net Profit after Tax * 100 Total Assets
Interpretation:
A return of 10% is considered as ideal ratio. As such, if the actual
ratio is equal or more than 10%, it indicates the higher productivity of the
total resources/ assets & vice versa in adverse cases.
7. Return on Capital Employed
This is the ratio of return on capital employed & capital employed
Return on Capital Employed = EBIT/ Net Profit after Tax
Total Capital Employed =Net Fixed Assets + Trade Investment + W.C.
Expression: Net Profit after Tax * 100 Total Capital Employed
Interpretation
Adarsha College of Maanagement & Science
32
BEML
Ideal ratio is about 15%. Actual Ratio equal or more than 15% is the
indication of higher productivity of capital employed & vice versa.
8. Return on Shareholders Equity
This is the ratio of net profit to net worth.
Expression: Net Profit after Tax (between dividend) * 100 Net worth
Net worth = share capital + share premium + reserves & surplus –
Accumulated loss.
Interpretation:
Ideal ratio is 13%. If actual ratio is equal or more than 13%, it
indicates good return on shareholders fund & vice versa.
9. Return on Equity Capital Ratio
This is the ratio of net profit to equity capital
Expression:
Net Profit available for Equity Share Holder’s * 100Equity Shareholders Fund lonely Equity Capital
Net Profit = Profit after Tax & Dividend
Equity SH Fund = Equity Share Capital + Accumulated Reserves &
Surplus – losses & Fictitious Assets
Interpretation:
There is no ideal ratio. The actual net profit to equity capital ratio is
compared with those of others similar concerns & the productivity of equity
capital is determined.
10.Interpreted Earning Per Share
Adarsha College of Maanagement & Science
33
BEML
This is the ratio of Net Profit available for Equity Shareholders i.e.,
Net Profit after tax & dividend to the no of Equity Shares or common shares
outstanding.
Expression: Profit after Tax & Dividend * 100 No of common shares outstanding
Interpretation
The more the EPS, the better is performance & future
prospectus of the company & vice versa.
11.Dividend Per Share
This is the ratio of earnings paid to share holders to number common
shares outstanding.
Expression: Earnings paid to Share Holders Number of Common Shares Outstanding
Interpretation:
A higher ratio attracts investors in shares & vice versa.
12.Dividend Payout Ratio
This is the ratio of Dividend Share to EPS.
Expression: Dividend Per Share EPS
Interpretation :
A high ratio indicates high dividends & low retained profits & vice
versa.
13.Earnings & Dividend Yield
i. Dividend Yield = Dividend Per Share * 100 Market Price of Share
Adarsha College of Maanagement & Science
34
BEML
Interpretation :
If the dividend yield of the company is more than the other company,
it is an indication to the investor that it is worth investing on shares of the
company & vice versa.
ii. Price Earning Ratio
This is the ratio of market price per share to earning per share
Expression: Market Price of Share EPS
Interpretation:
The higher the price, the better are the chances of appreciation in the
market price of shares.
V. FUND FLOW ANAYSIS
FUND
The term fund may be interpreted in various ways, namely as cash, as
total current assets & as net current assets or net w.c.
FUND FLOW
Flow of fund means changes in the amount of fund or net w.c. There
is said to be flow of fund when a business transaction results in change,
either in an increase or in a decrease in the amount of fund or net w.c. If a
transaction results in an increase in the amount of fund, it is considered as
source of fund. If a transaction results in decrease of fund, it is considered as
an application/use of fund.
FUND FLOW STATEMENT
Adarsha College of Maanagement & Science
35
BEML
A fund flow statement is a statement of sources & uses of fund or net
w.c. It is also be defined as a condensed report of how activities of a
business have been financed & how the financial resources have been used
during the period conversed by the statement.
Steps Involved in the Preparation of Fund Flow statement:
i. Preparation of schedule of change in w.c.
ii. Preparation of adjusted profit & loss account to find out funds from
operation.
iii. Preparation of fund flow statement.
Significance
A Fund Flow statement is useful in following ways:
i. It is helpful in knowing sources of fund.
ii. It suggests the way in which w.c. Position can be improved.
iii. It can be used in planning a sound dividend policy.
iv. It is helpful in planning the temporary investment of ideal fund.
v. It is useful in forecasting the fund flow & in projecting the w.c.
requirements.
vi. On a comparison of the fund flow statements of a concern for a numbers
of years, the information about the financial method used in part can be
obtained.
VI. CASH FLOW ANALYSIS
CASH FUND
It includes only cash along with bank balance.
CASH FLOW
Adarsha College of Maanagement & Science
36
BEML
It means actual flow or movement of cash in & out of an
enterprise. The increase in the cash balance implies the inflow of cash,
source of cash or positive cash flow. The decrease in the cash balance
indicates the out flow of cash, application of cash or negative cash flow.
CASH FLOW STATEMENT
It is a statement, which depicts the change in the cash position of a
concern between one balance sheet dates to another. A cash flow statement
is prepared by taking into account the opening & closing cash &bank
balances, various sources of cash & various uses of cash.
STEPS
Ascertainment of operating cash profit.
i) Ascertainment of cash flow from operations.
ii) Preparations of cash flow statement.
Significance
It gives penetration review of cash movements over an operating cycle.
i. It is helpful to a concern to evaluate its current cash position.
ii. It is helpful in determining the policies of financial management like
dividend payments, repayments of long-term loans etc…
iii. It facilitates an affective & efficient cash planning.
iv. It helps the management to analyse the past behavior of the cash cycle,
& to control the uses of cash in future.
Adarsha College of Maanagement & Science
37
BEML
Title of the Project
“A case study on Financial Performance with reference to Bharath Earth
Movers Limited”
Statement of the Problem
The statement of the problem under study is “A case study on
Financial Performance with reference to Bharath Earth Movers Limited”.
This study is made in the light of different tools of financial
management such as, comparative statements, common-size statements,
trend analysis & ratio analysis. The study broadly makes an attempt to
determine the overall financial performance of a company from last few
years. Since finance is an important parameter of every business concern to
determine the growth & profitability, the study of the topics sounds
momentous.
Adarsha College of Maanagement & Science
38
BEML
Purpose of the Study
The study was conducted in BEML for the purpose of fulfillment of
curriculum.
The main purpose is to make the thorough study on the growth &
working of the company from its inception till date.
The purpose is to assess the company’s trend specifically for last four
years with regard to operational performance.
To examine the factors affecting the financial & operational
performance of a company.
To asses the market strength & position of the company.
The main focus is to identify the loopholes of the company & give
suitable solutions to the problem based on analysis.
The study is concerned under this topic, which may help in further
academic education.
Objectives of the Study
To analyse & interpret the financial statements of BEML.
To study validity of tools of financial statements in real life situation.
To know about the soundness of the financial performance of the
company.
To know about the accounting policies & accomplishment of
accounting standards by the company.
To know the capital structure of the company.
To know about the working capital management & dividend policy of
the company.
To gain some practical experience about cash control & cash
management.
Adarsha College of Maanagement & Science
39
BEML
To study history & agenda of the company.
Significance of the Study
An analysis & interpretation of financial statements is very important
in today’s competitive business world. As the study gives a clear picture of
the growth & financial performance of the company, it helps the company to
rectify the errors & it improve in the field of weak performance. It also helps
in framing budgets & in framing dividend policies of the company.
Scope of the Study
The analysis & interpretation of financial statements is made by using
various techniques of analysis, each having their own merits & demerits.
The company to derive meaningful decisions concerning financial matters
can evidently use the report. More over, the study is confined to “Bharat
Earth Movers Limited” only.
Hypothesis
This is an organizational & financial study & hence, there are no
assumptions to be proved or disproved in this report.
Adarsha College of Maanagement & Science
40
BEML
Inception of the Industry
Bharath Earth Movers Limited an acronym for BEML, is a premier
ISO 9000 certified public sector Company, under the administrative control
of ministry defence.
BEML manufacturers the Earth Moving equipments & Defence
products, which build the Nation. It is the largest manufacturer of earth
moving equipments in India & second largest manufacturer in Asia after
Komatsu Industries in Japan.
BEML was incorporated on 11th May 1964 and is one of the few
public sectors earning profits since inception.
BEML commenced operations with the transfer of the Erst while Rail
Coach Manufacturing facilities from then Hindustan Aeronautics Limited
[HAL] at Bangalore on 1st January 1965 [Date of Registration]. Initially
BEML was entrusted with the manufacture of wheeled earth moving
equipments under the collaboration agreement with Government of India &
Westing House Air- Brake Company limited USA [Later renamed as Dress
Adarsha College of Maanagement & Science
41
BEML
Industries]. Subsequently BEML entered into collaboration agreement with
the Komatru Limited, Japan.
Under, the section 43 of the Companies Act, 1956, the provision has
made by treating the private limited company whose turnover exceeds Rs. 1
crore. It was deemed as a public company till 1989. It became a public
limited company by amendment of Articles of Association.
The company status has been changed from wholly Government
Company to partly Government Company. It was incorporated in the year
11-5-1964 with the capital investment of 3198 lakhs in the form of equity
shares capital as a private sector of Rs. 681 lakhs held by the President of
India.
BEML started a unit at KGF complex in the year 1967 for the purpose
of manufacturing Earth Moving Equipments to fulfill the requirements of the
Defence & other sectors of economy.
To maximize the indigenous technology in its products & to support
its production units, BEML has setup a multi crore R&D unit at HP division
in 1979 near KGF complex.
BEML Mysore complex was started in the year 1983 to manufacture
heavy-duty trucks, which were manufactured at KGF complex previously.
Due to lack of space facilities, it shifted its truck unit to Mysore. To develop
its own engines to its products, BEML started Engine division in 1989 at
Mysore, which was imported from M/S Komatsu, Japan.
Type of Organization
Bharat Earth Movers Limited is a public sector company under the
administrative control of Ministry of Defence. BEML is a premier ISO 9000
Adarsha College of Maanagement & Science
42
BEML
Company in India & second largest manufacturer in Asia after Komatsu
Industries in Japan. The total share capital was Rs. 36.87 crores of which
government capital was Rs. 22.50 crores, others Rs. 14.37 crores & revenues
& surplus Rs. 548.27 crores.
Nature of Business
Bart Earth Movers Limited is a multi technology company offering
high-quality products for diverse sectors of economy such as coal, mining,
steel, limestone, power, irrigation, construction, road building, defence &
railways. It has its products range to cover high equity hydraulic aggregates,
heavy-duty diesel engines, welding robots & heavy fabricated structures.
In the last four decades, it has come to the forefront of heavy
Engineering industry & established an undisputed leadership in Earth
Moving industry.
Board of Directors
The board consists of a whole time Chairman & the Managing
Director, Five functional Directors, & Four Promotive Directors holding
responsible positions with vast & varied experience. All of them are
nominated by President of India and also appointed by shareholders.
The Part-time Directors include two from Ministry of Defence, one
from the Ministry of Railways, one from Ministry of Coal & Mines and
another from the Government of Karnataka.
VRS NATARAJAN : Chairman & MD
VENKATANANTHAN : Director (R&D)
RAMESH.C.SUTHAR : Director (Production)
P. MAZUMDAR : Director (Finance)
Adarsha College of Maanagement & Science
43
BEML
K.A. NAGARAJ : Director (Marketing)
B.V. RAMANNA : Director (HRD)
A.P.V.N. SHARMA : Jt. Secretary (coal) [Ministry of Coal &
Mines]
ABHIJIT BARU : Additional Financial Advisor (B) &
Jt.Secretary, [Ministry of Defence]
TAPAN RAY : Jt. Secretary (Export) department of Defence
Production & supplies, [Ministry of Defence]
Market Share
BEML was the first company to enter the earth moving equipment
market & is the market leader holding 70% of market share. It holds 66%
market share in respect of Dozers & Dumpers & 33% in respect of
Excavators. Nearly 40% of its equity has been diverted to Financial
Institutions & public.
Competitors
After the new economic policy of 1991, the economy opened its
floodgates to foreign investment & foreign companies to start their business
in India.
As a result of this, many multi-nationals came into existence to compete
with the domestic industries in all sectors of the economy. As such, BEML
is also facing competition from many MNC’S & domestic industries.
Competitors
Larsen & Turbo -- Komatsu
Hindustan motors
Adarsha College of Maanagement & Science
44
BEML
Tata Engineering & Locomotives Co., Ltd [TELCO]
ESCORTS -- JCB
Godrej
Komatsu -- Japan
Catter Piller -- Russia
Hitachi -- Japan
BE -- USA
Fial
Liebherr Mitobhachi
Volva -- Swiss
Terex -- USA
Dresser Marian -- USA
AUSA -- Australia
O&K
P&H
Collaborations
M/S Komatsu, Industries -- Japan
O mnipol -- Burma
Voest alpine -- Germany
IGM -- Austria
Burma Labedy -- Poland
Letourneau Westing House Co., -- USA
M/S Mit Suimike -- Japan
Indersco
Adarsha College of Maanagement & Science
45
BEML
The flow of state - of the – art technology from global partners has
enabled BEML to achieve high standards in product engineering & gain
international competence.
BANKERS
BEML being a huge organization, should possess better banking
facilitates to meet the timely requirements of capital of the company & also
to fulfill the financial obligations of supplies, customers & other personnel
having relationship with the company.
The Bankers of the company are:
State Bank of India --State Bank of Mysore
Canara Bank --Punjab National Bank
State Bank of Saurarhtra --State Bank of Patiala
Bank of India -- State Bank of Bikaner & Jaipur
Central Bank of India -- Bank of Baroda
Adarsha College of Maanagement & Science
46
BEML
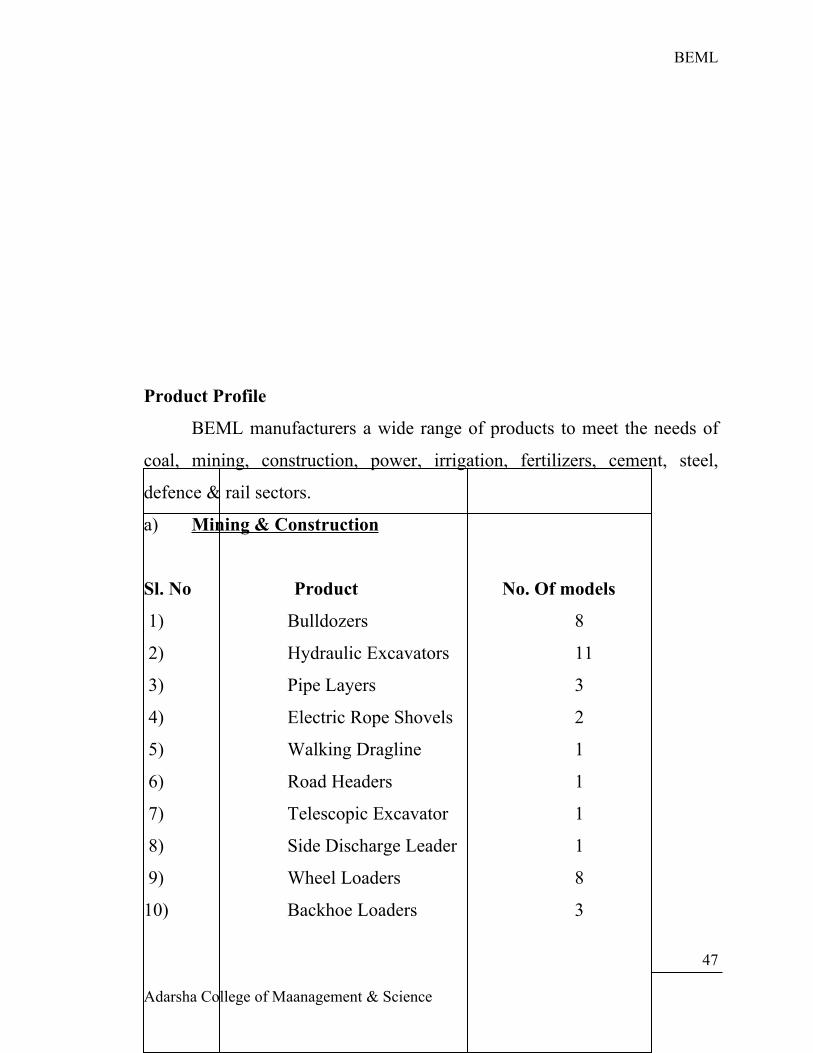
Product Profile
BEML manufacturers a wide range of products to meet the needs of
coal, mining, construction, power, irrigation, fertilizers, cement, steel,
defence & rail sectors.
a) Mining & Construction
Sl. No Product No. Of models
1) Bulldozers 8
2) Hydraulic Excavators 11
3) Pipe Layers 3
4) Electric Rope Shovels 2
5) Walking Dragline 1
6) Road Headers 1
7) Telescopic Excavator 1
8) Side Discharge Leader 1
9) Wheel Loaders 8
10) Backhoe Loaders 3
Adarsha College of Maanagement & Science
47
BEML
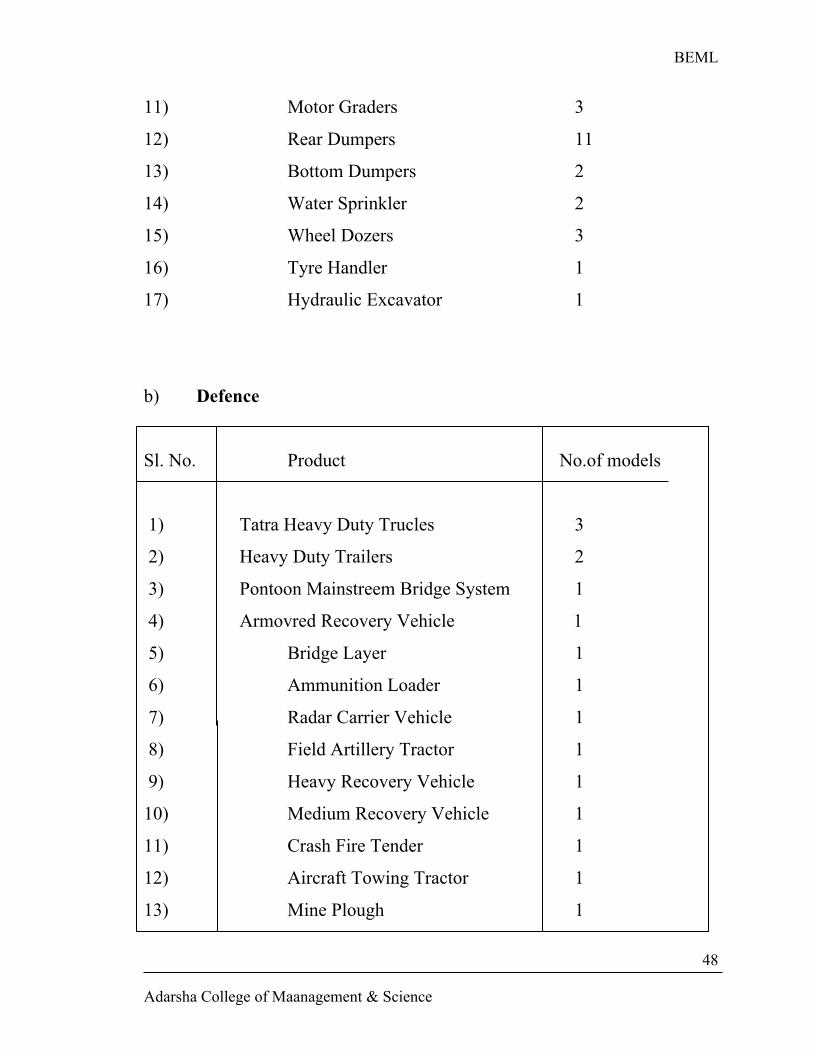
11) Motor Graders 3
12) Rear Dumpers 11
13) Bottom Dumpers 2
14) Water Sprinkler 2
15) Wheel Dozers 3
16) Tyre Handler 1
17) Hydraulic Excavator 1
b) Defence
Sl. No. Product No.of models
1) Tatra Heavy Duty Trucles 3
2) Heavy Duty Trailers 2
3) Pontoon Mainstreem Bridge System 1
4) Armovred Recovery Vehicle 1
5) Bridge Layer 1
6) Ammunition Loader 1
7) Radar Carrier Vehicle 1
8) Field Artillery Tractor 1
9) Heavy Recovery Vehicle 1
10) Medium Recovery Vehicle 1
11) Crash Fire Tender 1
12) Aircraft Towing Tractor 1
13) Mine Plough 1
Adarsha College of Maanagement & Science
48
BEML
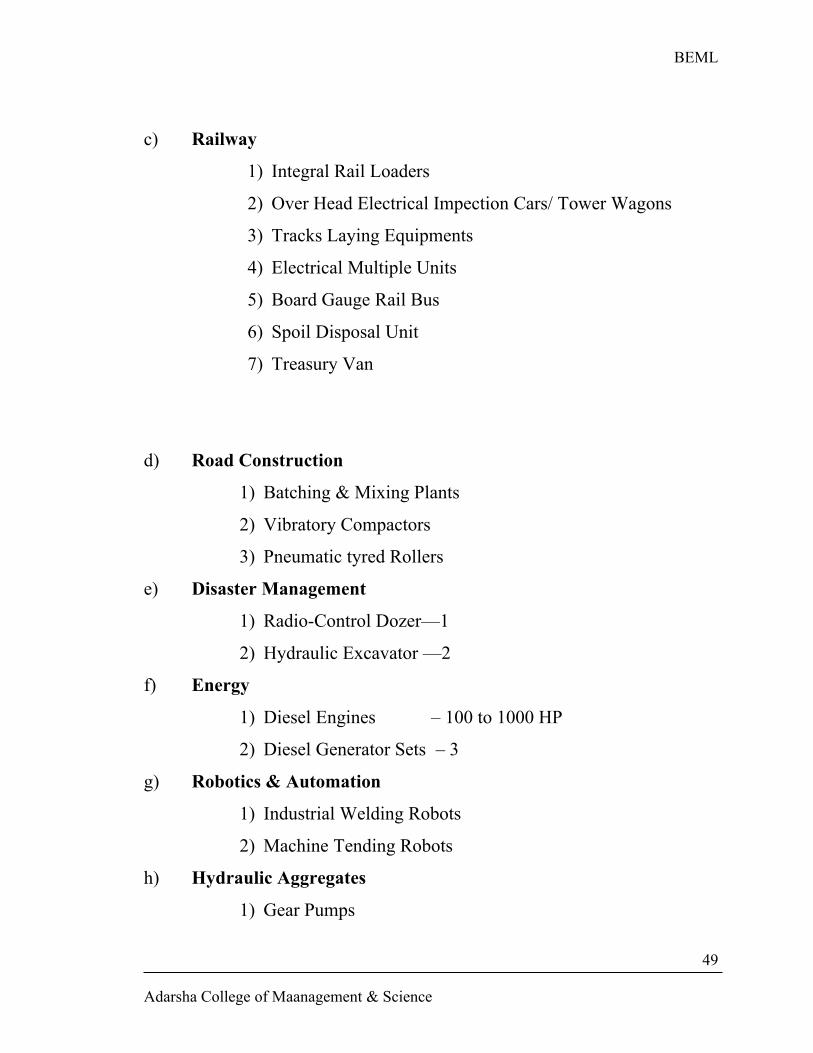
c) Railway
1) Integral Rail Loaders
2) Over Head Electrical Impection Cars/ Tower Wagons
3) Tracks Laying Equipments
4) Electrical Multiple Units
5) Board Gauge Rail Bus
6) Spoil Disposal Unit
7) Treasury Van
d) Road Construction
1) Batching & Mixing Plants
2) Vibratory Compactors
3) Pneumatic tyred Rollers
e) Disaster Management
1) Radio-Control Dozer—1
2) Hydraulic Excavator —2
f) Energy
1) Diesel Engines – 100 to 1000 HP
2) Diesel Generator Sets – 3
g) Robotics & Automation
1) Industrial Welding Robots
2) Machine Tending Robots
h) Hydraulic Aggregates
1) Gear Pumps
Adarsha College of Maanagement & Science
49
BEML
2) Cylinders/ Suspensions
3) Control Values
4) Axels
5) Power Take-offs
Exports
BEML is a recognized export house with star exporter status. Its
strengths in handling large-scale trading & counter-trade have helped it to
push exports of engineering goods & non-military equipments.
The company has established a full-fledged export division for the
purpose of globalising the market. As a top quality supplier of surface
mining equipments, BEML exports machines to over 30 countries
worldwide covering Asia, Africa, Latin America & Middle East.
Export turnover stood Rs. 21.45 crores of which Rs. 12.45 crores
related to physical exports to Abudhabi, Bhutan, South Africa, Tanzania,
Syria & Tunisia. The physical exports were affected by the Middle East
crisis.
BEML plans to further strengthen its global presence by setting up
overseas offices & joint ventures in diverse areas & by executing turnkey
projects in mining & allied fields.
Customers
BEML takes pride in serving its customers who belong to the vital
sectors of the national economy like coal, mining, irrigation, power, steel &
iron ore, defence & railways.
Adarsha College of Maanagement & Science
50
BEML
BEML’S consumers in public sector include Singareni Collieries Co.,
Neyveli Legnite Co., Hindustan Copper Ltd., Hindustan Zinc Ltd., National
Aluminium Co., Ltd., CCL Ltd., SAIL, NHPC, NTPC, etc…
Private Sector: TISCO, Gujarat Ambuja Cements, Modi Cements,
Jayaprakash Associatives etc…
Business Operations
1. Corporate office & Marketing Division
BEML is a vast organization having corporate head office & marketing
division at Bangalore with many regional offices, district offices, spare parts
depots, service centers located in difference parts of country where, BEML
equipments are functioning to ensure efficient after sales services to the
satisfaction of its customers.
The regional offices are at Bangalore, Bilaspur, Kolkota, Hyderabad,
Mumbai, Nagpur, New Delhi, Ranchi, Sambalpur & Singrauli.
The district offices at Asancol, Ahmedabad, Bhilai, Bhuwaneshwar,
Chandrapur, Chennai, Dhanbad, Ghuwahti, Jammu, Kochi/ Ernakulam,
Kothagudam, Neyveli, Panjim, Ramgundam & Udaipur.
2. Manufacturing Units
In order to meet the demands of heavy earthmoving equipments, rail
coaches & heavy-duty trailers, BEML has established units at Bangalore,
KGF, & Mysore. These units are equipped with sophisticated manufacturing
facilities.
Bangalore Complex
BEML started in 1964 with railway equipment division at Bangalore.
This unit is spread over an area of 200 acres. The first rail coach in the
Indian sub continent, this unit has consolidated its status as a major supplier
Adarsha College of Maanagement & Science
51
BEML
of integral rail coaches, meeting about 25% of the country’s demand. It has a
production capacity of over 800 coaches per annum & has work force of
4500 employees. To meet the growing requirements of rail sector, BEML
has diversified into manufacture of overhead equipment, inspection cars &
truck laying equipments. Recently this unit has taken the production of
electric multiple units & rail bus.
The Bangalore unit also manufacturers heavy-duty trucks & trailer, as
also defence aggregates, to meet the needs of the armed forces. Road
headers & side discharge loaders, for use in underground mining are also
produced here.
The factory has comprehensive manufacturing facilities, which are
constantly augmented & modernized to keep pace with the growing
demands of production.
KGF Complex
At Kolar Gold Fields, located 100 kms from Bangalore, spread over an
area of 1850 acres, BEML has established an extensive manufacturing base.
A skilled work force of over 7400 turn out state-of-the-art Bulldozers,
Hydraulic Excavators, Wheel Loaders, Rope Shovels & Walking Draglines
for mining & construction industry. Sophisticated CNC machines & latest
technology welding equipments have been installed.
A multi-million-rupee heavy equipment shop has been setup for major
fabrication work with a capacity of 5000 MT, this shop turns out heavy
structures for industry.
The exclusive Hydraulic and Power [HP] division, manufactures
precision assembles & aggregates, not only for captive consumption but also
Adarsha College of Maanagement & Science
52
BEML
for meeting customer’s requirements. State-of-the-art gear pumps, control
valves, suspensions, cylinders, heavy-duty planetary axels & automatic
transmissions are productionised here.
Mysore Complex
The biggest dumb truck factory in India is located at BEML’s Mysore
Complex. This unit is located about 180 kms from Bangalore & occupies
about 178 acres of land, having a work force of about 2500 employees.
Apart from the popular 35-ton & 50 ton rear dumpers, BEML also
manufactures 85 ton & 120 ton dumpers here. Plans are afoot to take up
manufacture giant 170-ton dumpers on the production line.
The integration of robotized manufacture on the shop floor by installation
of an arc-welding robot for fabrication of giant structures has accelerated the
pace of activity & provides a flexible & powerful facility.
Engine division has been established to manufacture diesel engines of
100-1000 HP rating at Mysore. These are used not only for captive
consumption but also for applications like diesel generators & comrerssors.
The company plans to further expand the division by installing flexible
manufacturing systems.
3. Research & Development
BEML’S growth in Earthmover industry owes a great deal to its strength
in R&D centers located at KGF. Partly founded by the United Nations
Development Programme, the center houses sophisticated laboratories,
powerful computer Aided Design (CAD) facilities, test equipments & a full-
fledged PROTOTYPE manufacturing shop.
Adarsha College of Maanagement & Science
53
BEML
Over 280 qualified Engineers work constantly to improve on product &
develop new equipments to meet market requirements. As many as 30 new
products have been developed in house &have been successfully launched.
Examples include state-of-the-art 35-ton dump truck, aircraft towing tractor,
backhoe loader etc.
Joining hands with several user organizations including defence Research
& Development Organization (DRDO), Department of Science &
Technology (DST) & the Railway Board, BEML has developed several
products successfully.
Subsidiary & Supporting Units
1. Subsidiary Company
BEML has a captive foundry M/S Vignyan Industries limited, at Tarikere
in Karnataka which manufacturers & supplies various types of cartings
required for BEML.
2. Supporting Units
Engine Division (Mysore Complex)
The engine division of BEML situated at Mysore manufactures diesel
engines of 100 to 1000 HP ratings. It also manufactures engines &
generators for their own vehicles like Dozers, Excavators etc.
Hydraulic & Power Line Division (KGF Complex)
BEML started H&P division in the year 1979, in order to meet the area of
hi-tech product range & also to double the share of supplies to vital defence
sector. H&P division manufacturers precession assembles & aggregates not
Adarsha College of Maanagement & Science
54
BEML
only for captive consumption but also for meeting customer’s requirements.
State-of-the-art gear pumps, control valves, suspensions, cylinders, heavy-
duty planetary axles & automatic transmissions are productionised here.
Customer Service
BEML field offices & spare parts depots provide total equipments care &
maintenance support. BEML NET, a dedicated setcom network aims at
streamlining supply of spares across the nation effecting inter-depot transfers
and rationalizing inventories thus, enabling faster response to customers
needs. Service centers located in strategic areas help out users in equipment
rehabilitation as well as overhaul services. In taking service to the doorsteps
of customers, site engineers ensure high availability of machines through
prompt after-sales service. BEML also undertakes to service high-cost
machines throughout their lifetime. BEML also offers credit facility to
prospective buyers of its equipments. Suitable credit packages at competitive
rates are offered duly taking into account, credit rating of customers. All this
activities are aimed at achieving total customers satisfaction.
Perusing Consistent Quality
Quality is the hallmark of excellence in BEML. All manufacturing
facilities are certified under ISO 9000 STD Field trails in actual working
conditions are conducted at BEML’s own testing grounds & tracks.
Future Prospectus and Growth
The growth of the company is directly linked with the development of
core sector and infrastructure in keeping with the importance of road
Adarsha College of Maanagement & Science
55
BEML
infrastructure, the company has planned to introduce several products such
as vibratory compactors, crushing equipments etc with an eye to get a good
share of market for their equipments.
With a view to addressing itself to national interest, BEML has tied up with
Technology Information Forecasting and Assessment Council [TIFAC] for
the manufacture of specialized equipments to be used in disaster
management and is planning to produce them for employment in hazardous
situation.
During the next five years, BEML is planning for diversification activities in
the allied and non-allied areas of business.
Awards & Achievements
♦ Sixth international award to export-Athens
♦ Seventh international award to export-Greece 1984
♦ BEML has won National award for import substitution for its R & D
developed 50 tones tank transportation trailer & crawler mounted shovel
of 2.3 cubic meter capacity.
♦ Corporate Excellence Award for outstanding performance in 1987-88
among all PSU, in the engineering sector in the country instituted by the
department of Public Enterprise, Government of India.
♦ National Safety award won by BEML in the years 1982, 1984, 1985,
1986, 1988 …1999 for longer accident free period.
♦ EEPC’s [Engineering Export Promotion Council] All India Special
Shield for special performance during 88-89, 95-96,96-97 & 1999-2000.
♦ Best productivity award for 1989-90 received from vice-president of
India.
Adarsha College of Maanagement & Science
56
BEML
♦ Special award won by BEML for displaying the most popular working
model at defence & science exhibition in New Delhi.
♦ Company was awarded a standardization commendation award in 1989-
90 & 1990-91 instituted by the Institute of Standards Engineering in
recognition of commandable work done in the field of standardization
improving quality & reducing costs.
♦ BEPC National awards for export excellence in 1995-96 amongst non-
SSI exporters.
♦ Armed forces stage award for employing number of ex-service men for
the yr 1996-97.
♦ National award for 1997 instituted by the Ministry of welfare,
Government of India, for being the outstanding employees of the
physically handicapped.
♦ During the year 2002-03, the Mysore complex equipment division won
the National Safety Award 2000 for achieving the lowest average
frequency rate of accidents. This is the 8th time that the division has
bagged this award.
Adarsha College of Maanagement & Science
57
BEML
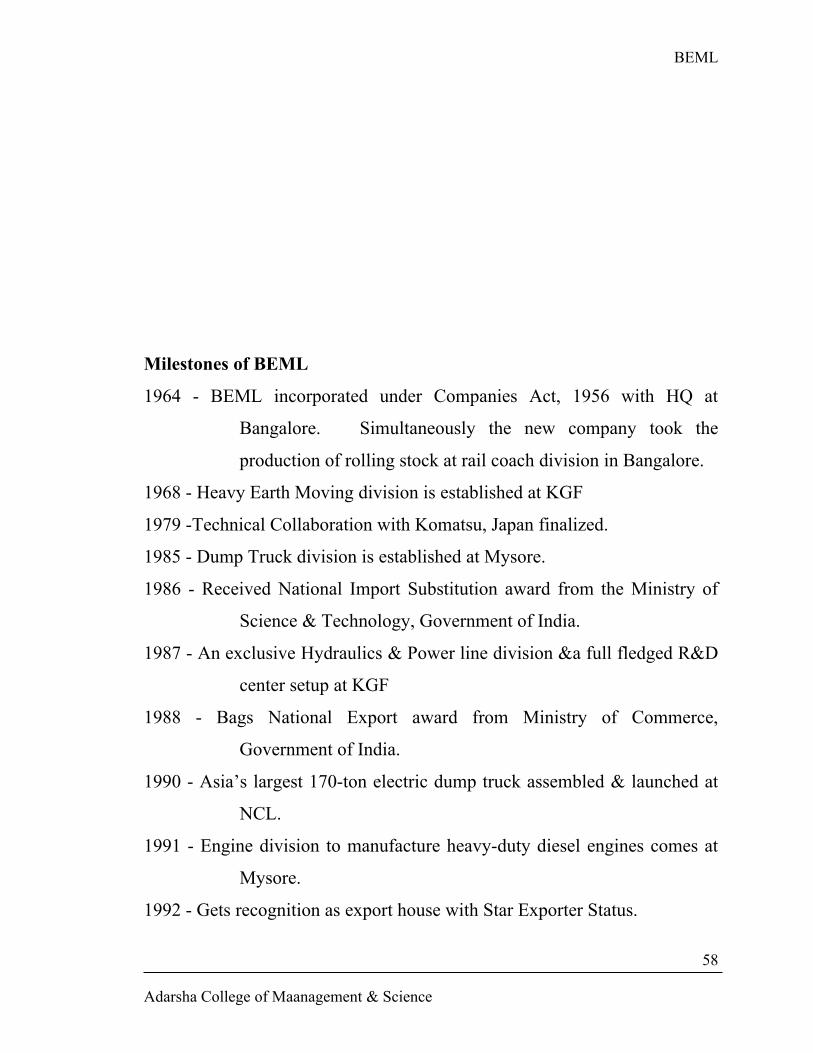
Milestones of BEML
1964 - BEML incorporated under Companies Act, 1956 with HQ at
Bangalore. Simultaneously the new company took the
production of rolling stock at rail coach division in Bangalore.
1968 - Heavy Earth Moving division is established at KGF
1979 -Technical Collaboration with Komatsu, Japan finalized.
1985 - Dump Truck division is established at Mysore.
1986 - Received National Import Substitution award from the Ministry of
Science & Technology, Government of India.
1987 - An exclusive Hydraulics & Power line division &a full fledged R&D
center setup at KGF
1988 - Bags National Export award from Ministry of Commerce,
Government of India.
1990 - Asia’s largest 170-ton electric dump truck assembled & launched at
NCL.
1991 - Engine division to manufacture heavy-duty diesel engines comes at
Mysore.
1992 - Gets recognition as export house with Star Exporter Status.
Adarsha College of Maanagement & Science
58
BEML
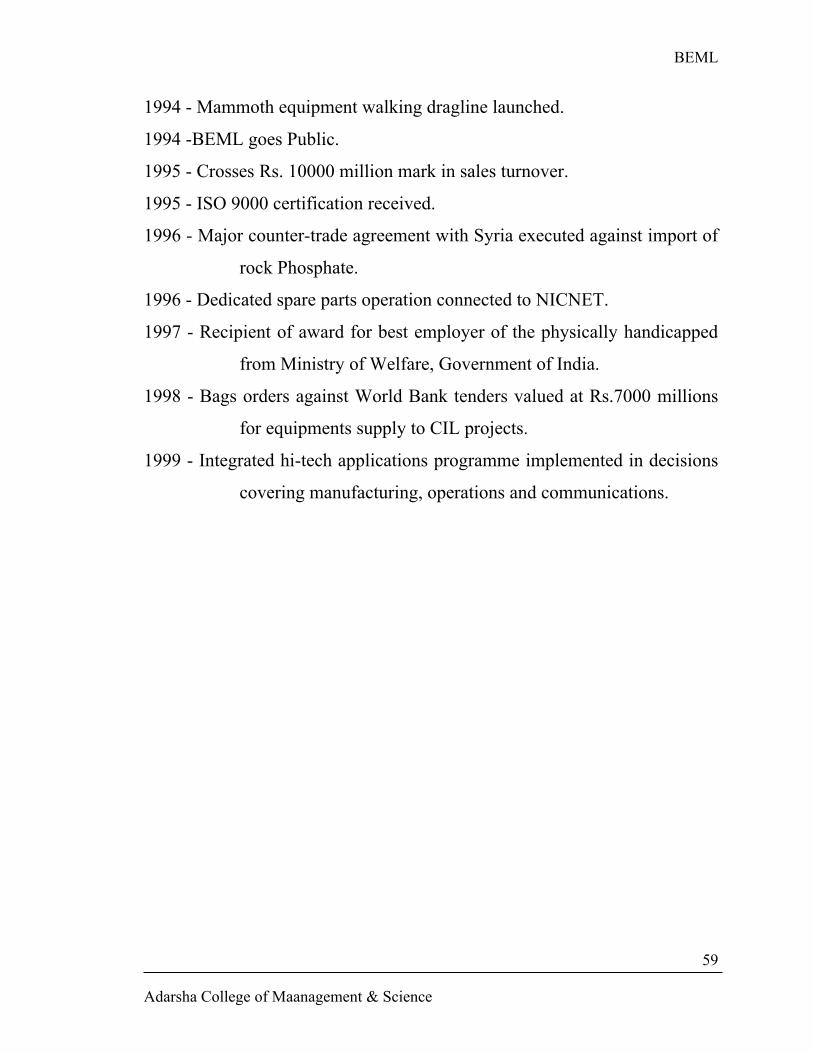
1994 - Mammoth equipment walking dragline launched.
1994 -BEML goes Public.
1995 - Crosses Rs. 10000 million mark in sales turnover.
1995 - ISO 9000 certification received.
1996 - Major counter-trade agreement with Syria executed against import of
rock Phosphate.
1996 - Dedicated spare parts operation connected to NICNET.
1997 - Recipient of award for best employer of the physically handicapped
from Ministry of Welfare, Government of India.
1998 - Bags orders against World Bank tenders valued at Rs.7000 millions
for equipments supply to CIL projects.
1999 - Integrated hi-tech applications programme implemented in decisions
covering manufacturing, operations and communications.
Adarsha College of Maanagement & Science
59
BEML
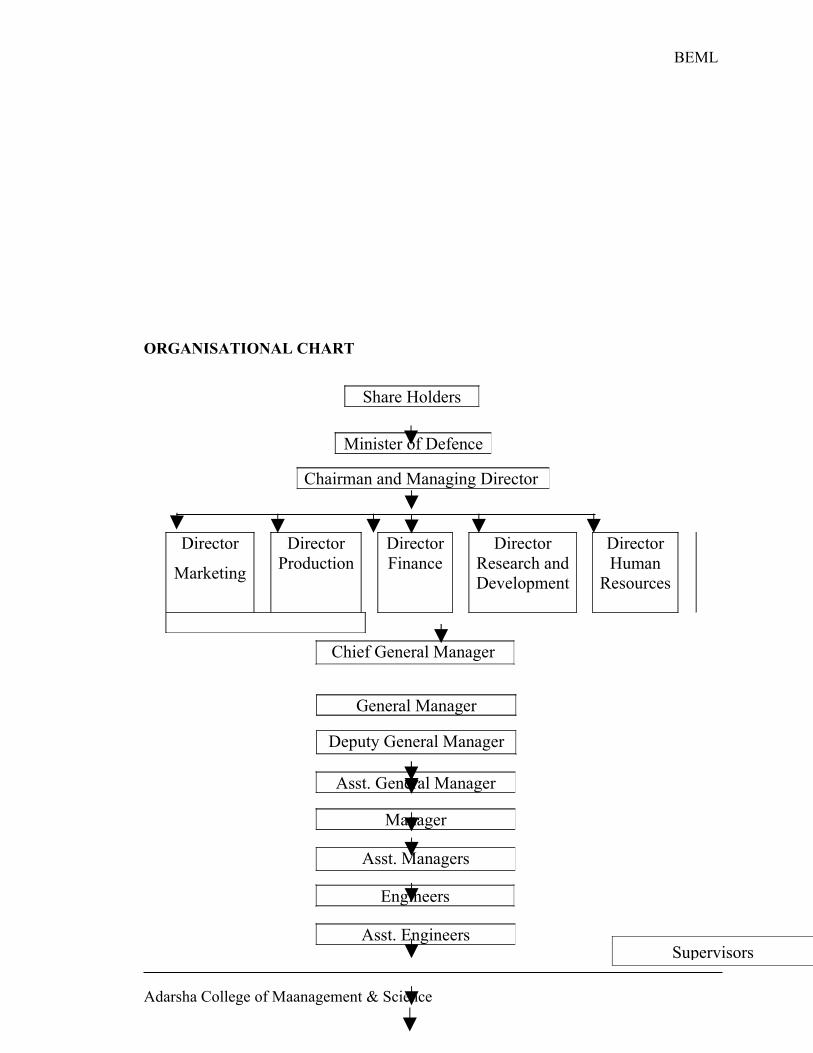
ORGANISATIONAL CHART
Director
Marketing
Director Production
Director Finance
DirectorResearch and Development
Director Human
Resources
Adarsha College of Maanagement & Science
Share Holders
Minister of Defence
Chairman and Managing Director
Chief General Manager
General Manager
Deputy General Manager
Asst. General Manager
Manager
Asst. Managers
Engineers
Asst. Engineers
60Supervisors
BEML
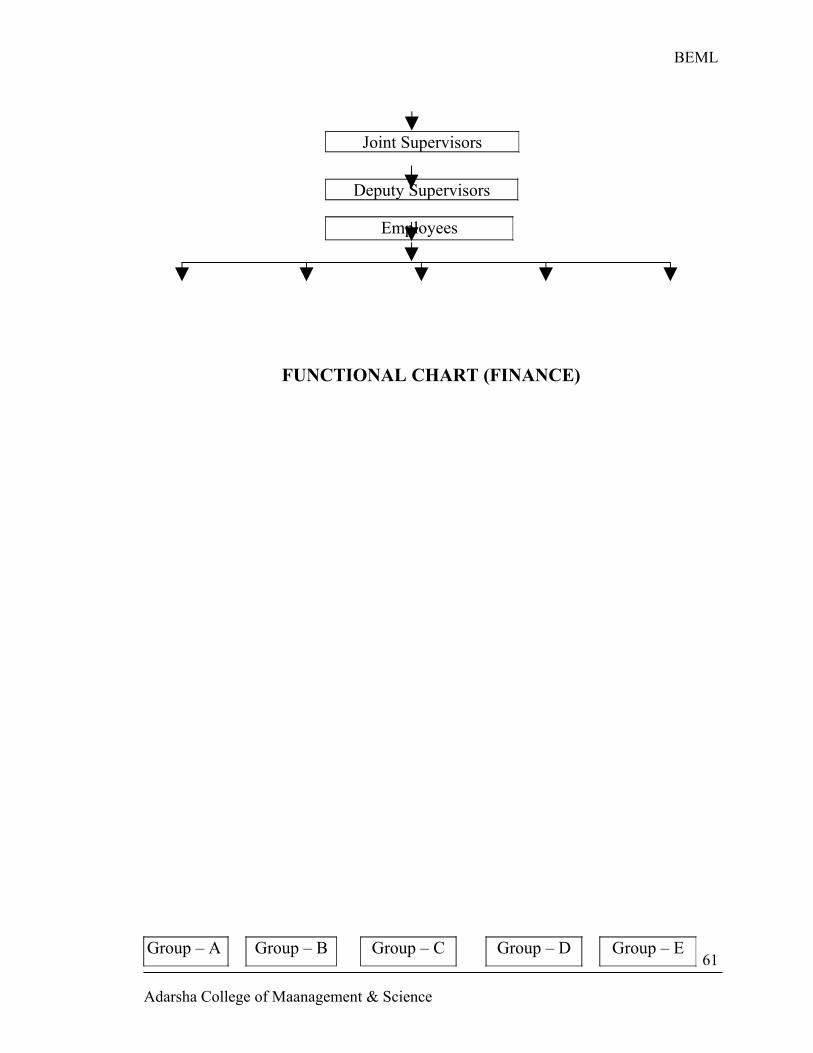
FUNCTIONAL CHART (FINANCE)
Adarsha College of Maanagement & Science
Joint Supervisors
Deputy Supervisors
Employees
Group – A Group – B Group – C Group – D Group – E61
BEML
Introduction
The quality of the project work depends on the methodology adopted
for the study. Methodology, in turn, depends on the nature of the project
work. The use of proper methodology is an essential part of any research. In
order to conduct the study scientifically, suitable methods & measures are to
be followed.
Research Design
The type of research used for the collection & analysation of the data
is “Historical Research Method”
The main source of data for this study is the past records prepared by
the company. The focus of the study is to determine the performance of the
company since its inception & to identify the ways in which the performance
especially the financial performance of BEML can be improved.
The data regarding company history & profile are collected through
“Explanatory Research Design” particularly through the study of secondary
sources and discussions with individuals.
Data Collection Method
Adarsha College of Maanagement & Science
62
BEML
Data has been collected from both primary & secondary sources.
Primary Data
Having discussions with different department managers & officers of
the company to get general information about the company & its activities.
Having face to face discussions with the company officials
By taking guidance from company guide & departmental guide.
Secondary Data
Collection of data through company annual reports, company manuals
and other relevant documents
By text books & journals
Collection of data through the literature provided by the company.
Research Measuring Tool
The tools used for data collection are:
1. Personal Interview
The authenticity of the study would be more if, the information were
collected through direct interview. In this, discussions are held directly with
the officials & section heads to get the clear-cut information about the topic.
2. Secondary Sources
Annual company reports, Balance Sheets, Profit & Loss account & other
literatures provided by the company, textbooks & journals are also used to
collect the data.
Further, data has been processed using various tools like,
• Comparative Statements
Adarsha College of Maanagement & Science
63
BEML
• Common-size Statements
• Trend Analysis
• Ratio Analysis
Some other vital research measuring tools used for the analysis are
leverages, tables and graphs, various charts etc.
Analysis
The study is concerned with the analysis of the financial statements of
BEML. Analysis of statements and data is done by using some of the
accounting techniques based on the past four-year's balance sheet and
income statements of the company.
Balance sheets, Profit & Loss account, Ratios, Financial Leverages,
Tables & graphs, Charts etc. are used as analysis module, which has made
the study truthful.
Limitations of the Study
1. The study is only on interim reports.
2. It doesn't consider the changes in price level.
3. Changes in accounting procedure by the firm may be misleading.
4. Due to time constraints, all the ratios couldn’t be calculated. Only a few
of them were taken into account.
5. Discussions about the project could be conducted only with a few
officials due to the time constraint.
Adarsha College of Maanagement & Science
64
BEML
Chapter Overview
1. The first chapter deals with industrial background and theoretical subject
background of the topic & techniques within.
2. The second chapter picturises the introduction of the problem along with
purpose, objectives, significance and scope of the study.
3. The third chapter reveals the practical working of the company along
with its history & profile.
4. The fourth chapter gives the methodology of the study and an overview
of the chapter scheme framed in the report.
5. The fifth chapter includes the analysis and interpretation of financial
statements through various accounting techniques namely comparative
statements, common size statements, trend analysis, ratios, tables &
graphs etc.
6. The sixth chapter includes the summery of findings arrived at, after
taking the project study.
7. The seventh chapter reveals the limitations of the study done.
8. The eighth chapter points out the suggestions given on overall study &
the conclusions opinioned.
9. The last chapter consists of Annexure provided by BEML and other
related literatures & bibliography.
Adarsha College of Maanagement & Science
65
BEML
Analysis & Interpretation of financial statements of BEML
The production value of the Bharat Earth Movers Limited during the
year 2002-03 has reached its Rs.168117 lakhs. A brief study of the financial
statements of the firm has revealed that the company recorded a sales
turnover of Rs.2610.06 lakhs, which has helped the company in declaring
the dividend of Rs.735 lakhs (or) 20% to its shareholders at Rs.20 per share.
This signifies that the company is in a profitable position & is also in
fair position to meet its commitment towards shareholders. But in addition to
this, financial statements are required to know the following aspects:
• Whether the company profits are adequate to meet the needs of its
investors, both owners & creditors, in the long run.
• The efficiency of management in utilization of its assets employed by
it.
• The liquidity position of the organization so as to meet the obligation
as & when it arises.
• The working capital resources available to carry on its activities
smoothly.
• Adequate funds & assets to meet the claim of shareholders & creditors
without great strain on the firm’s financial position.
Adarsha College of Maanagement & Science
66
BEML
• The credit facility available to the firm in its business & the financial
reputation that it enjoys.
• Any variation in the accounting policy & procedures of the company’s
accounts.
For the accurate analysis, there has to be consistency in the accounting
policies of a company. The significant accounting policies of the BEML are
as under:
Method of Accounting
Financial statements are prepared on accrual basis under the historical
cost convention & in accordance with the mandatory accounting standards
under section 211(3L) of the Company’s Act.
Fixed Assets (Capitalization & Depreciation)
The values of fixed assets are at cost.
Financing cost relating to borrowed funds or to deffered credits is
capitalized to the extent attributed to the period up to the completion of
construction/ acquisition of fixed assets.
Expenditure on administration & general overhead attributable to
construction or acquisition of fixed assets is not capitalized.
Depreciation is charged at straight-line method & rates are as per
schedules XIV of the Company Act, 1956.
Inventory Valuation
Raw materials are valued at weighted average cost components, stores &
spares are valued at Weighted Average Cost or estimated cost whenever
costs are not available.
Adarsha College of Maanagement & Science
67
BEML
Work-in-progress is valued at actual cost based on normal capacity or
adjusted/ estimated reasonable value which ever is lower.
Finished stock is valued at actual cost or estimated realizable value
whichever is lower.
Spares for resale are valued at Weighted Average Cost less
Obsolescence.
Scrap is valued at estimated reasonable value.
Advances from Customers
Advances from customers include advances/ progress payments
received as per letters of interest/ sale contracts & is net after adjustments for
dispatches with customers under respective contracts.
Retirements Benefits
Accruing liability towards gratuity is ascertained on actuarial valuation &
remitted to separate trust fund.
Liability towards leave salary accruals is laid-out on the basis of actuarial
valuation.
Research & Development
The development cost on R&D projects is treated as Deffered Revenue
Expenses to be allocated to future accounting periods.
Other expenses on R&D are charged to revenue in the year of
occurrence.
Expenditure on fixed assets relating to R&D is capitalized.
Accounting for Foreign Currency Transactions
Adarsha College of Maanagement & Science
68
BEML
Transactions in foreign currency are recorded in rupees by applying to
foreign currency amount, the exchange rates at the existing time of
transaction or forward contract rate wherever applicable.
The outstanding balances of current assets, current liabilities & long-term
liabilities are stated in rupees at the rate of exchange prevailing at the
date of balance sheet or forward contract rate.
The gain or loss in conversion and/or settlement of liabilities incurred for
acquisition of fixed assets is adjusted to the cost of related fixed assets.
Under/Over Absorption Cost
Adjustments for under/ over absorption of costs on jobs, is made only
if the extent of under/ over recovery exceeds one percent of turnover.
Taxes on Income
Deffered tax is recognized, subject to the consideration of prudence,
on timing differences, being the difference between taxable income &
accounting income that originate in the period &are capable of reversal in
one or more subsequent periods.
Financial Analysis
Financial analysis is the process of identifying the financial strengths
and weakness of the firm by properly establishing relationships between the
items of balance sheet and profit & loss account. The analysis can be done
using the following financial techniques.
I. Comparative Financial Statements
Adarsha College of Maanagement & Science
69
BEML
II. Common Size Statements
III. Trend Analysis
IV. Ratio Analysis
These techniques treat the information contained in the balance sheet &
profit & loss account, so as to afford the full diagnosis of the profitability &
financial soundness of the firm. They focus on key financial figures &
relationship existing between them. It is known as fact that mere financial
statements don't provide the exhaustive information. Hence, the above
techniques are used to diagonise the entire financial statements and give a
meaningful information that will be helpful to both the management &
outside parties of company such as owners, creditors, investors & others.
The nature of analysis will differ depending upon the purpose of the analyst.
I. Comparative Financial Statements
Comparative financial statements refers to those statements of the
financial affairs of a business which, are prepared in such a way as to
provide time perspective to the various elements contained in such
statements. In other words, these are statements, which, summarize &
present relative accounting data for a number of years, incorporating there in
the changes in individual items.
There are two important comparative financial statements. They are
(a) Comparative Balance Sheet
(b)Comparative Income Statement
Adarsha College of Maanagement & Science
70
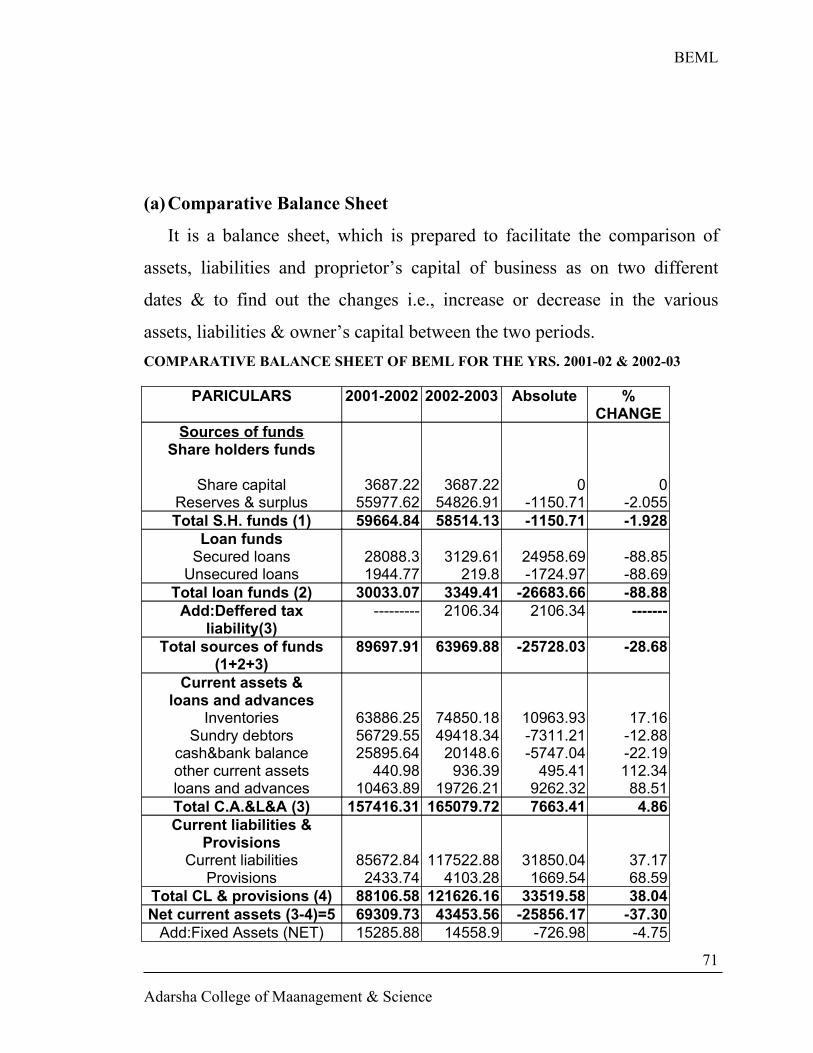
BEML
(a)Comparative Balance Sheet
It is a balance sheet, which is prepared to facilitate the comparison of
assets, liabilities and proprietor’s capital of business as on two different
dates & to find out the changes i.e., increase or decrease in the various
assets, liabilities & owner’s capital between the two periods.
COMPARATIVE BALANCE SHEET OF BEML FOR THE YRS. 2001-02 & 2002-03
PARICULARS 2001-2002 2002-2003 Absolute % CHANGE
Sources of fundsShare holders funds
Share capitalReserves & surplus
3687.2255977.62
3687.2254826.91
0-1150.71
0-2.055
Total S.H. funds (1) 59664.84 58514.13 -1150.71 -1.928Loan funds
Secured loansUnsecured loans
28088.31944.77
3129.61219.8
24958.69-1724.97
-88.85-88.69
Total loan funds (2) 30033.07 3349.41 -26683.66 -88.88Add:Deffered tax
liability(3)--------- 2106.34 2106.34 -------
Total sources of funds (1+2+3)
89697.91 63969.88 -25728.03 -28.68
Current assets &loans and advances
InventoriesSundry debtors
cash&bank balanceother current assetsloans and advances
63886.2556729.5525895.64
440.9810463.89
74850.1849418.34
20148.6936.39
19726.21
10963.93-7311.21-5747.04
495.419262.32
17.16-12.88-22.19112.34
88.51Total C.A.&L&A (3) 157416.31 165079.72 7663.41 4.86Current liabilities &
ProvisionsCurrent liabilities
Provisions85672.84
2433.74117522.88
4103.2831850.04
1669.5437.1768.59
Total CL & provisions (4) 88106.58 121626.16 33519.58 38.04Net current assets (3-4)=5 69309.73 43453.56 -25856.17 -37.30
Add:Fixed Assets (NET) 15285.88 14558.9 -726.98 -4.75
Adarsha College of Maanagement & Science
71
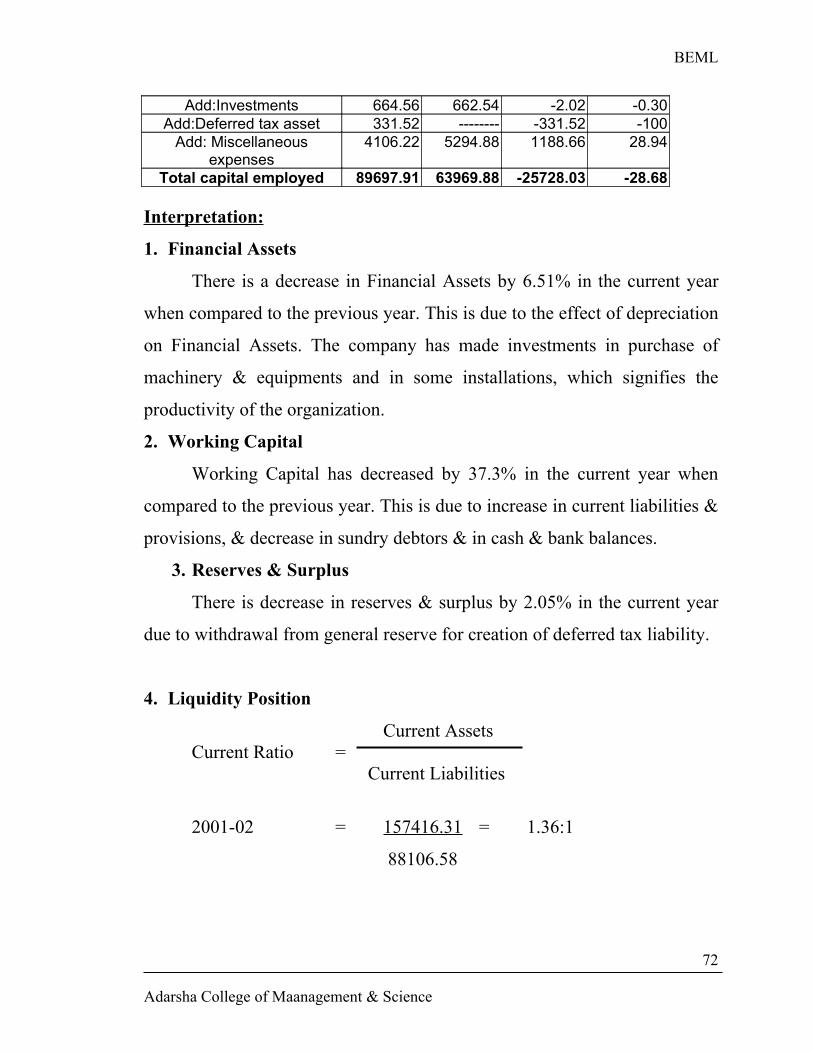
BEML
Add:Investments 664.56 662.54 -2.02 -0.30Add:Deferred tax asset 331.52 -------- -331.52 -100
Add: Miscellaneous expenses
4106.22 5294.88 1188.66 28.94
Total capital employed 89697.91 63969.88 -25728.03 -28.68
Interpretation:
1. Financial Assets
There is a decrease in Financial Assets by 6.51% in the current year
when compared to the previous year. This is due to the effect of depreciation
on Financial Assets. The company has made investments in purchase of
machinery & equipments and in some installations, which signifies the
productivity of the organization.
2. Working Capital
Working Capital has decreased by 37.3% in the current year when
compared to the previous year. This is due to increase in current liabilities &
provisions, & decrease in sundry debtors & in cash & bank balances.
3. Reserves & Surplus
There is decrease in reserves & surplus by 2.05% in the current year
due to withdrawal from general reserve for creation of deferred tax liability.
4. Liquidity Position
Current AssetsCurrent Ratio =
Current Liabilities
2001-02 = 157416.31 = 1.36:1
88106.58
Adarsha College of Maanagement & Science
72
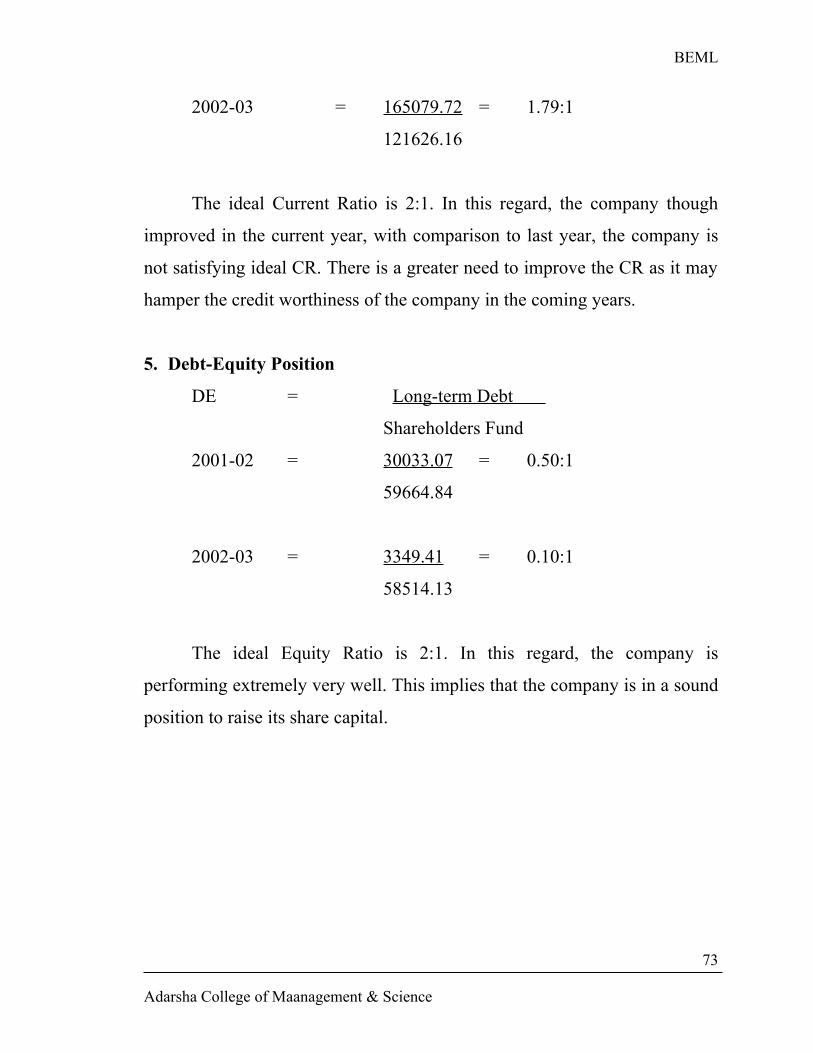
BEML
2002-03 = 165079.72 = 1.79:1
121626.16
The ideal Current Ratio is 2:1. In this regard, the company though
improved in the current year, with comparison to last year, the company is
not satisfying ideal CR. There is a greater need to improve the CR as it may
hamper the credit worthiness of the company in the coming years.
5. Debt-Equity Position
DE = Long-term Debt
Shareholders Fund
2001-02 = 30033.07 = 0.50:1
59664.84
2002-03 = 3349.41 = 0.10:1
58514.13
The ideal Equity Ratio is 2:1. In this regard, the company is
performing extremely very well. This implies that the company is in a sound
position to raise its share capital.
Adarsha College of Maanagement & Science
73
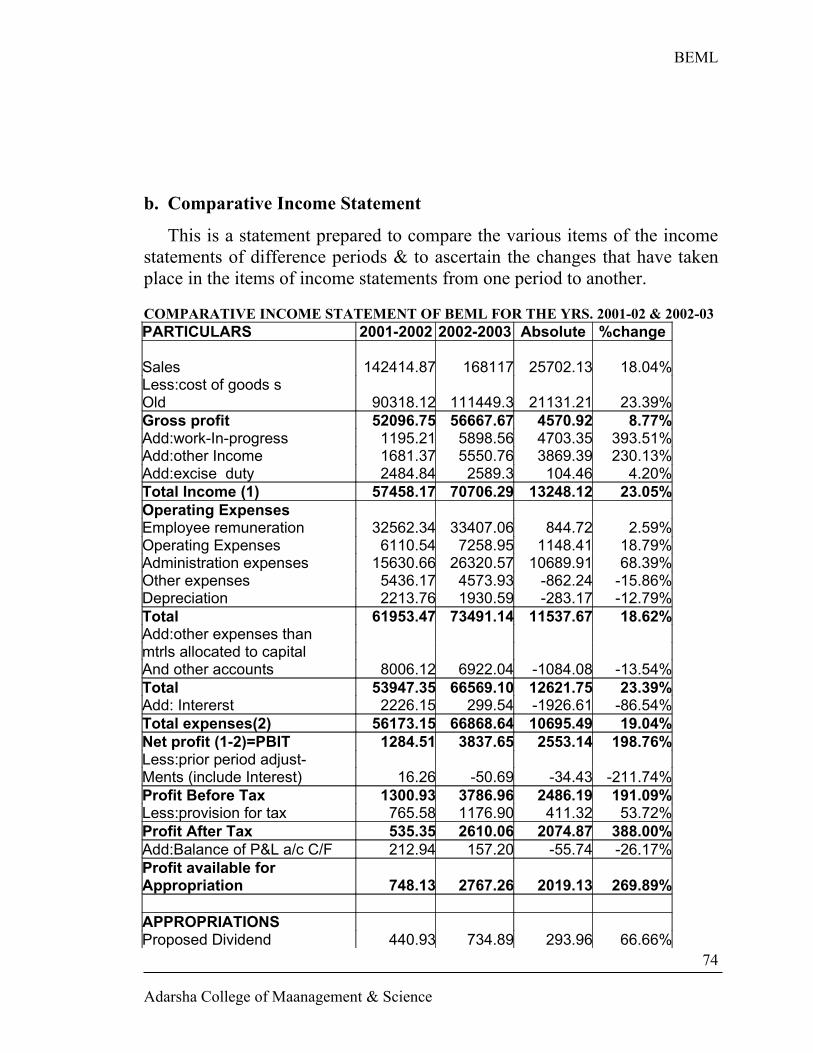
BEML
b. Comparative Income Statement
This is a statement prepared to compare the various items of the income statements of difference periods & to ascertain the changes that have taken place in the items of income statements from one period to another.
COMPARATIVE INCOME STATEMENT OF BEML FOR THE YRS. 2001-02 & 2002-03PARTICULARS 2001-2002 2002-2003 Absolute %change
Sales 142414.87 168117 25702.13 18.04%Less:cost of goods sOld 90318.12 111449.3 21131.21 23.39%Gross profit 52096.75 56667.67 4570.92 8.77%Add:work-In-progress 1195.21 5898.56 4703.35 393.51%Add:other Income 1681.37 5550.76 3869.39 230.13%Add:excise duty 2484.84 2589.3 104.46 4.20%Total Income (1) 57458.17 70706.29 13248.12 23.05%Operating ExpensesEmployee remuneration 32562.34 33407.06 844.72 2.59%Operating Expenses 6110.54 7258.95 1148.41 18.79%Administration expenses 15630.66 26320.57 10689.91 68.39%Other expenses 5436.17 4573.93 -862.24 -15.86%Depreciation 2213.76 1930.59 -283.17 -12.79%Total 61953.47 73491.14 11537.67 18.62%Add:other expenses thanmtrls allocated to capitalAnd other accounts 8006.12 6922.04 -1084.08 -13.54%Total 53947.35 66569.10 12621.75 23.39%Add: Intererst 2226.15 299.54 -1926.61 -86.54%Total expenses(2) 56173.15 66868.64 10695.49 19.04%Net profit (1-2)=PBIT 1284.51 3837.65 2553.14 198.76%Less:prior period adjust-Ments (include Interest) 16.26 -50.69 -34.43 -211.74%Profit Before Tax 1300.93 3786.96 2486.19 191.09%Less:provision for tax 765.58 1176.90 411.32 53.72%Profit After Tax 535.35 2610.06 2074.87 388.00%Add:Balance of P&L a/c C/F 212.94 157.20 -55.74 -26.17%Profit available for Appropriation 748.13 2767.26 2019.13 269.89%
APPROPRIATIONSProposed Dividend 440.93 734.89 293.96 66.66%
Adarsha College of Maanagement & Science
74
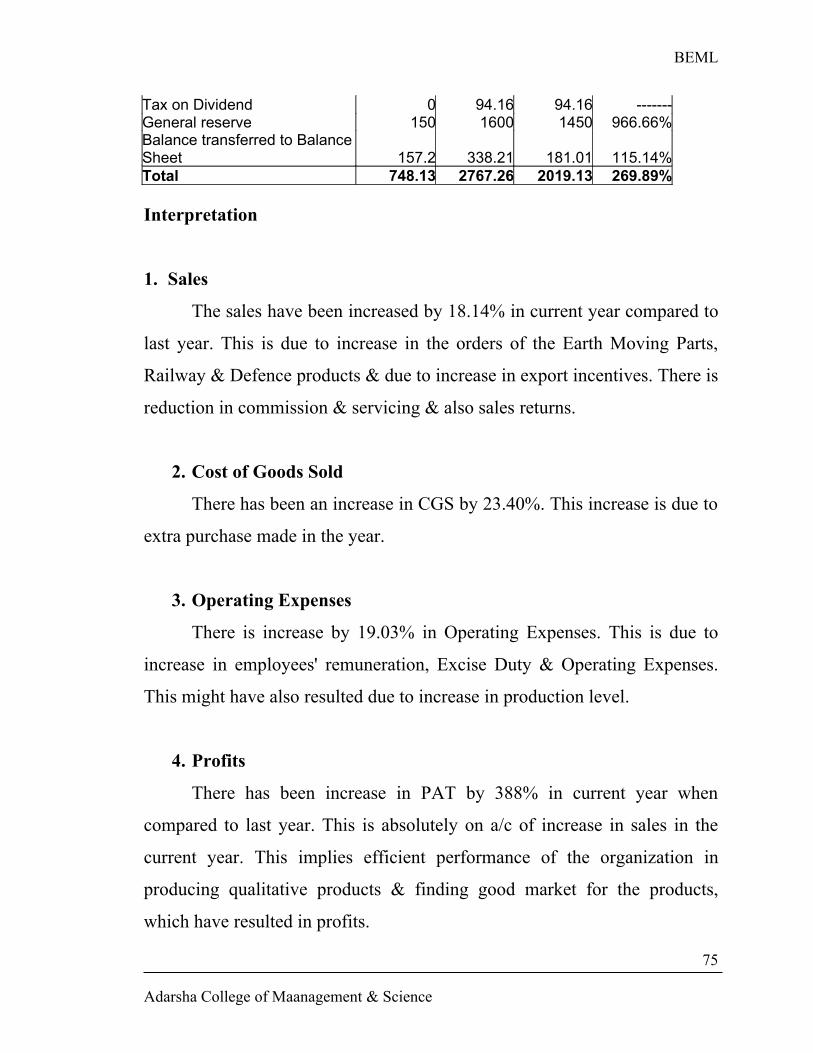
BEML
Tax on Dividend 0 94.16 94.16 -------General reserve 150 1600 1450 966.66%Balance transferred to Balance Sheet 157.2 338.21 181.01 115.14%Total 748.13 2767.26 2019.13 269.89%
Interpretation
1. Sales
The sales have been increased by 18.14% in current year compared to
last year. This is due to increase in the orders of the Earth Moving Parts,
Railway & Defence products & due to increase in export incentives. There is
reduction in commission & servicing & also sales returns.
2. Cost of Goods Sold
There has been an increase in CGS by 23.40%. This increase is due to
extra purchase made in the year.
3. Operating Expenses
There is increase by 19.03% in Operating Expenses. This is due to
increase in employees' remuneration, Excise Duty & Operating Expenses.
This might have also resulted due to increase in production level.
4. Profits
There has been increase in PAT by 388% in current year when
compared to last year. This is absolutely on a/c of increase in sales in the
current year. This implies efficient performance of the organization in
producing qualitative products & finding good market for the products,
which have resulted in profits.
Adarsha College of Maanagement & Science
75
BEML
II. Common Size Statements
The main limitation of comparative financial statements is that they
do not show the changes that takes place from year to year in relation to the
total assets & total liabilities and owner’s capital or total net sales. To
overcome this limitation, Common Size Financial Statement analysis has
been evolved.
Common Size Financial Statements are those statements in which the
data or figures reported in the financial statements are converted into
percentages, taking some base.
Common Size Financial Statements mainly include
a. Common Size Balance Sheet.
b. Common Size Income Statement.
Adarsha College of Maanagement & Science
76
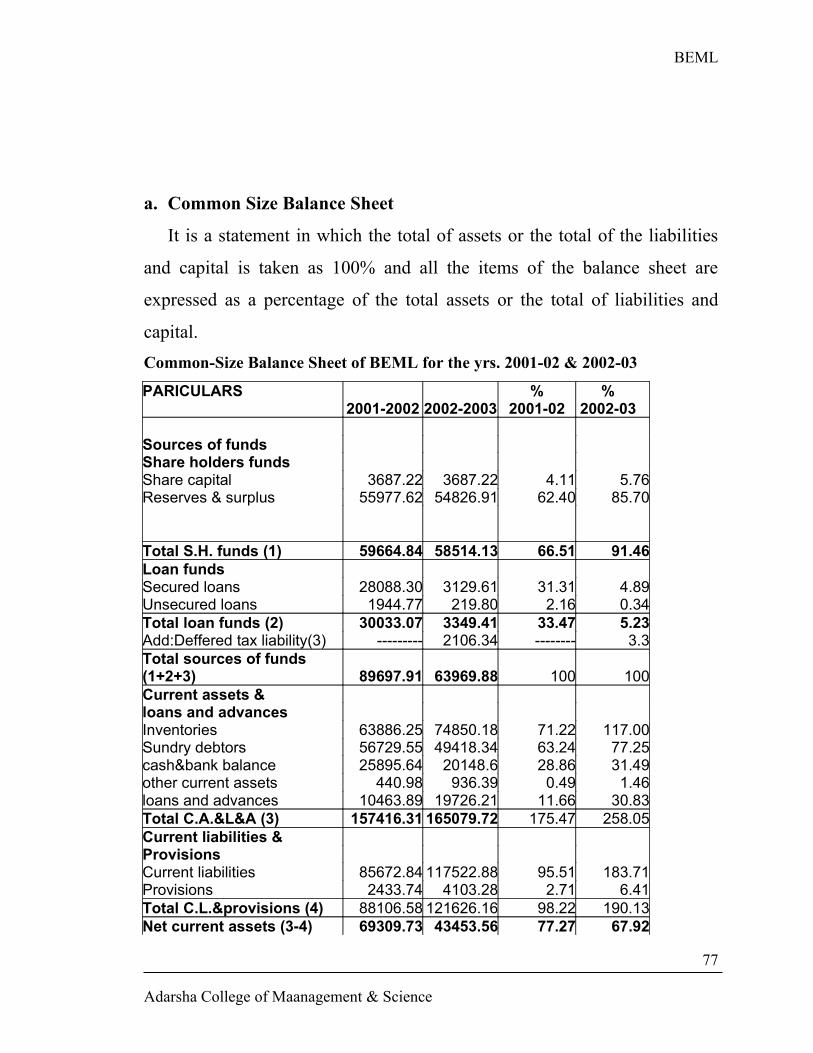
BEML
a. Common Size Balance Sheet
It is a statement in which the total of assets or the total of the liabilities
and capital is taken as 100% and all the items of the balance sheet are
expressed as a percentage of the total assets or the total of liabilities and
capital.
Common-Size Balance Sheet of BEML for the yrs. 2001-02 & 2002-03
PARICULARS2001-2002 2002-2003
%2001-02
% 2002-03
Sources of fundsShare holders fundsShare capital 3687.22 3687.22 4.11 5.76Reserves & surplus 55977.62 54826.91 62.40 85.70
Total S.H. funds (1) 59664.84 58514.13 66.51 91.46Loan fundsSecured loans 28088.30 3129.61 31.31 4.89Unsecured loans 1944.77 219.80 2.16 0.34Total loan funds (2) 30033.07 3349.41 33.47 5.23Add:Deffered tax liability(3) --------- 2106.34 -------- 3.3Total sources of funds (1+2+3) 89697.91 63969.88 100 100Current assets & loans and advancesInventories 63886.25 74850.18 71.22 117.00Sundry debtors 56729.55 49418.34 63.24 77.25cash&bank balance 25895.64 20148.6 28.86 31.49other current assets 440.98 936.39 0.49 1.46loans and advances 10463.89 19726.21 11.66 30.83Total C.A.&L&A (3) 157416.31 165079.72 175.47 258.05Current liabilities &ProvisionsCurrent liabilities 85672.84 117522.88 95.51 183.71Provisions 2433.74 4103.28 2.71 6.41Total C.L.&provisions (4) 88106.58 121626.16 98.22 190.13Net current assets (3-4) 69309.73 43453.56 77.27 67.92
Adarsha College of Maanagement & Science
77
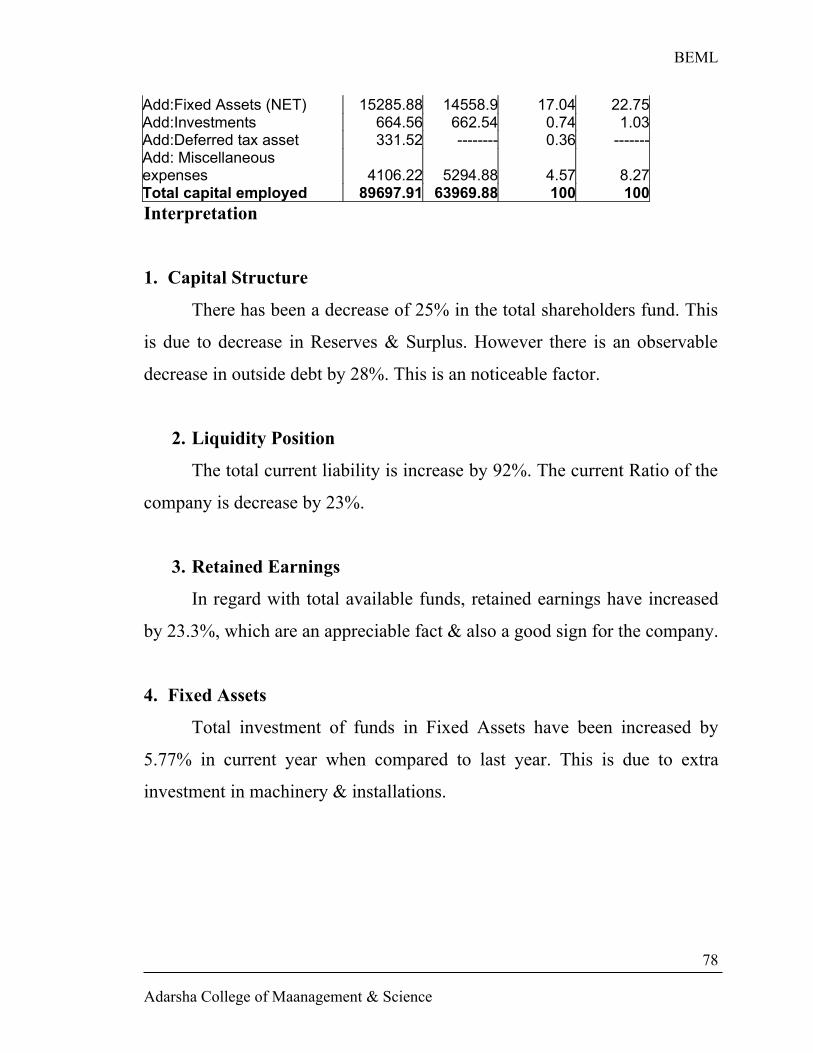
BEML
Add:Fixed Assets (NET) 15285.88 14558.9 17.04 22.75Add:Investments 664.56 662.54 0.74 1.03Add:Deferred tax asset 331.52 -------- 0.36 -------Add: Miscellaneous expenses 4106.22 5294.88 4.57 8.27Total capital employed 89697.91 63969.88 100 100Interpretation
1. Capital Structure
There has been a decrease of 25% in the total shareholders fund. This
is due to decrease in Reserves & Surplus. However there is an observable
decrease in outside debt by 28%. This is an noticeable factor.
2. Liquidity Position
The total current liability is increase by 92%. The current Ratio of the
company is decrease by 23%.
3. Retained Earnings
In regard with total available funds, retained earnings have increased
by 23.3%, which are an appreciable fact & also a good sign for the company.
4. Fixed Assets
Total investment of funds in Fixed Assets have been increased by
5.77% in current year when compared to last year. This is due to extra
investment in machinery & installations.
Adarsha College of Maanagement & Science
78
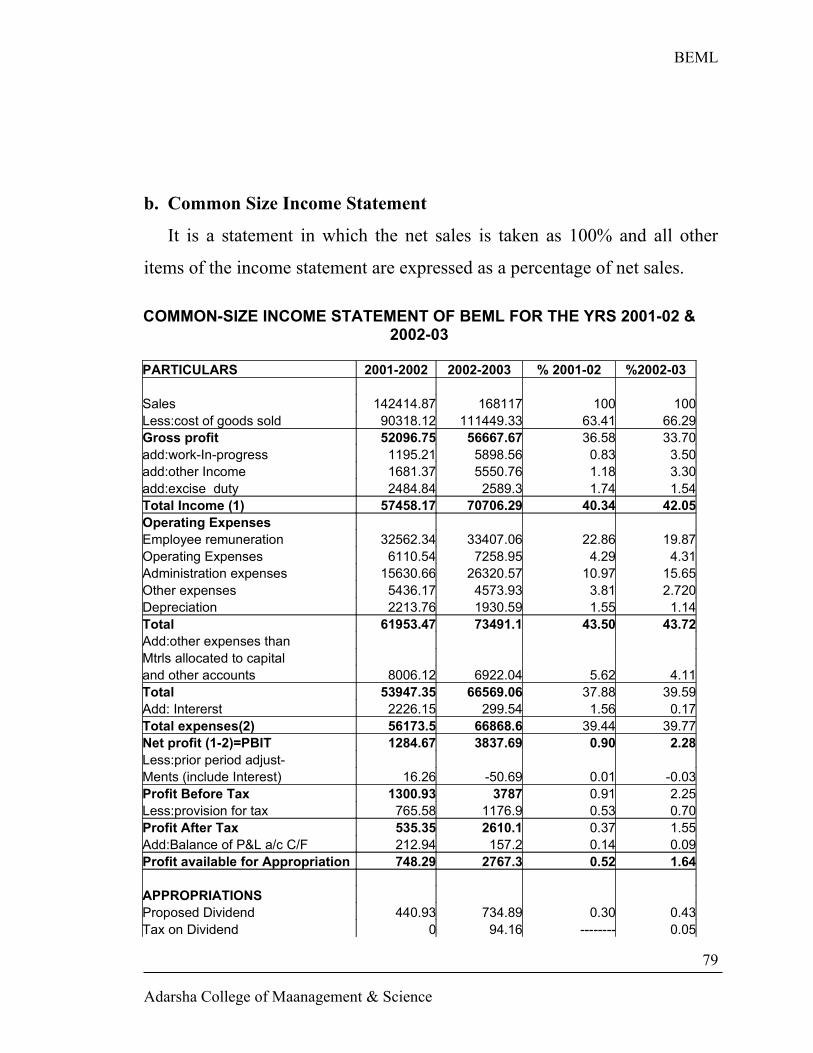
BEML
b. Common Size Income Statement
It is a statement in which the net sales is taken as 100% and all other
items of the income statement are expressed as a percentage of net sales.
COMMON-SIZE INCOME STATEMENT OF BEML FOR THE YRS 2001-02 & 2002-03
PARTICULARS 2001-2002 2002-2003 % 2001-02 %2002-03
Sales 142414.87 168117 100 100Less:cost of goods sold 90318.12 111449.33 63.41 66.29Gross profit 52096.75 56667.67 36.58 33.70add:work-In-progress 1195.21 5898.56 0.83 3.50add:other Income 1681.37 5550.76 1.18 3.30add:excise duty 2484.84 2589.3 1.74 1.54Total Income (1) 57458.17 70706.29 40.34 42.05Operating ExpensesEmployee remuneration 32562.34 33407.06 22.86 19.87Operating Expenses 6110.54 7258.95 4.29 4.31Administration expenses 15630.66 26320.57 10.97 15.65Other expenses 5436.17 4573.93 3.81 2.720Depreciation 2213.76 1930.59 1.55 1.14Total 61953.47 73491.1 43.50 43.72Add:other expenses thanMtrls allocated to capitaland other accounts 8006.12 6922.04 5.62 4.11Total 53947.35 66569.06 37.88 39.59Add: Intererst 2226.15 299.54 1.56 0.17Total expenses(2) 56173.5 66868.6 39.44 39.77Net profit (1-2)=PBIT 1284.67 3837.69 0.90 2.28Less:prior period adjust-Ments (include Interest) 16.26 -50.69 0.01 -0.03Profit Before Tax 1300.93 3787 0.91 2.25Less:provision for tax 765.58 1176.9 0.53 0.70Profit After Tax 535.35 2610.1 0.37 1.55Add:Balance of P&L a/c C/F 212.94 157.2 0.14 0.09Profit available for Appropriation 748.29 2767.3 0.52 1.64
APPROPRIATIONSProposed Dividend 440.93 734.89 0.30 0.43Tax on Dividend 0 94.16 -------- 0.05
Adarsha College of Maanagement & Science
79
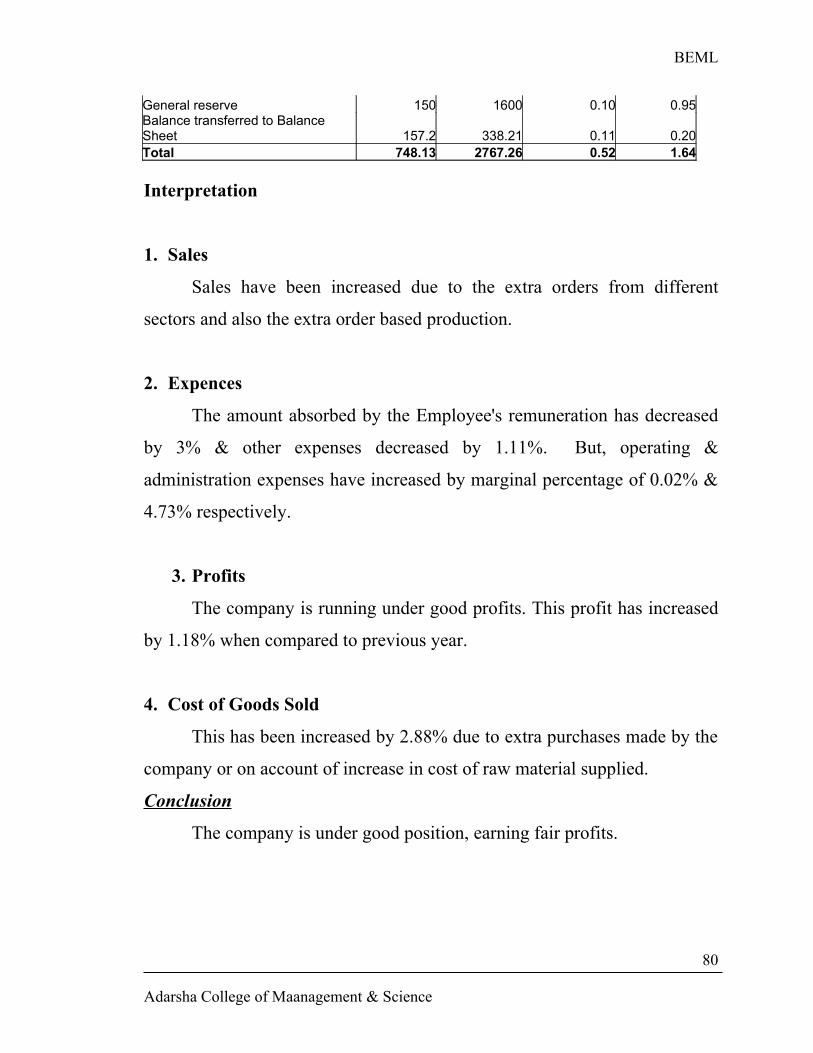
BEML
General reserve 150 1600 0.10 0.95Balance transferred to Balance Sheet 157.2 338.21 0.11 0.20Total 748.13 2767.26 0.52 1.64
Interpretation
1. Sales
Sales have been increased due to the extra orders from different
sectors and also the extra order based production.
2. Expences
The amount absorbed by the Employee's remuneration has decreased
by 3% & other expenses decreased by 1.11%. But, operating &
administration expenses have increased by marginal percentage of 0.02% &
4.73% respectively.
3. Profits
The company is running under good profits. This profit has increased
by 1.18% when compared to previous year.
4. Cost of Goods Sold
This has been increased by 2.88% due to extra purchases made by the
company or on account of increase in cost of raw material supplied.
Conclusion
The company is under good position, earning fair profits.
Adarsha College of Maanagement & Science
80
BEML
III. Trend Analysis
Comparison of past data over a period of time with a base year is
known as Trend Analysis. It is also called as Trend Percentage or Trend
Ratio Analysis. It is a method of analysis under which, the percentage
relationship that each financial statement item of each year bears to the same
item in the base year is calculated.
Each item in the base year is taken as 100, and on this basis, trend
analysis for the corresponding items in the other years are calculated. It is
possible to identify the areas in which the organization has improved over
the years, through trend analysis.
Adarsha College of Maanagement & Science
81
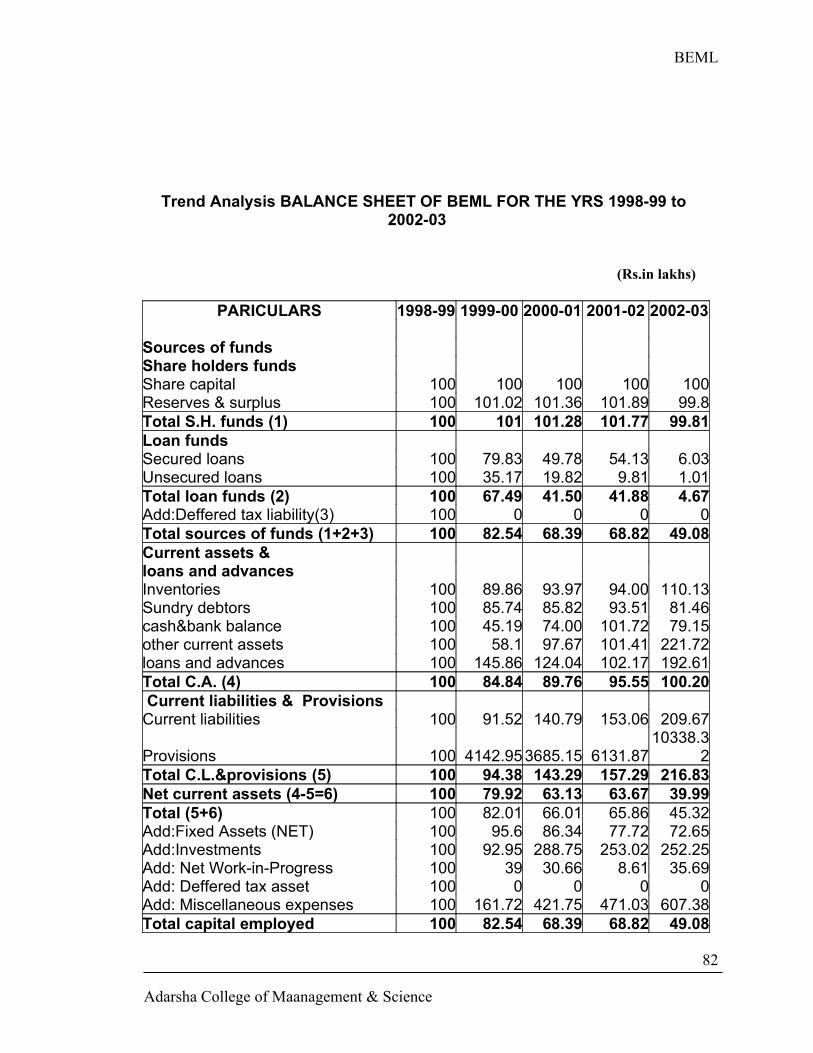
BEML
Trend Analysis BALANCE SHEET OF BEML FOR THE YRS 1998-99 to 2002-03
(Rs.in lakhs)
PARICULARS 1998-99 1999-00 2000-01 2001-02 2002-03
Sources of fundsShare holders fundsShare capital 100 100 100 100 100Reserves & surplus 100 101.02 101.36 101.89 99.8Total S.H. funds (1) 100 101 101.28 101.77 99.81Loan fundsSecured loans 100 79.83 49.78 54.13 6.03Unsecured loans 100 35.17 19.82 9.81 1.01Total loan funds (2) 100 67.49 41.50 41.88 4.67Add:Deffered tax liability(3) 100 0 0 0 0Total sources of funds (1+2+3) 100 82.54 68.39 68.82 49.08Current assets & loans and advancesInventories 100 89.86 93.97 94.00 110.13Sundry debtors 100 85.74 85.82 93.51 81.46cash&bank balance 100 45.19 74.00 101.72 79.15other current assets 100 58.1 97.67 101.41 221.72loans and advances 100 145.86 124.04 102.17 192.61Total C.A. (4) 100 84.84 89.76 95.55 100.20 Current liabilities & ProvisionsCurrent liabilities 100 91.52 140.79 153.06 209.67
Provisions 100 4142.953685.15 6131.8710338.3
2Total C.L.&provisions (5) 100 94.38 143.29 157.29 216.83Net current assets (4-5=6) 100 79.92 63.13 63.67 39.99Total (5+6) 100 82.01 66.01 65.86 45.32Add:Fixed Assets (NET) 100 95.6 86.34 77.72 72.65Add:Investments 100 92.95 288.75 253.02 252.25Add: Net Work-in-Progress 100 39 30.66 8.61 35.69Add: Deffered tax asset 100 0 0 0 0Add: Miscellaneous expenses 100 161.72 421.75 471.03 607.38Total capital employed 100 82.54 68.39 68.82 49.08
Adarsha College of Maanagement & Science
82
BEML
Interpretation
1. Shareholders Fund
The company was in almost stable condition in the previous years.
But in the current year, shareholders fund has been decreased due to
decrease in Reserves & Surplus from which the amount has been withdrawn
for creation of deferred tax liability.
2. Fixed Assets
There has been decreasing trend in the Fixed Assets, which indicates
that the company has not invested in Fixed Assets. But there is increasing
trend in investments & capital work-in-progress.
3. Current Assets
There is an increasing trend in inventories, loans & advances & other
current assets, but decreasing trend in Sundry Debtors & Cash & bank
balance. Overall CA shows increasing trend.
4. Current Liabilities
Both current liabilities & provisions are in increasing trend in last 4
years.
Adarsha College of Maanagement & Science
83
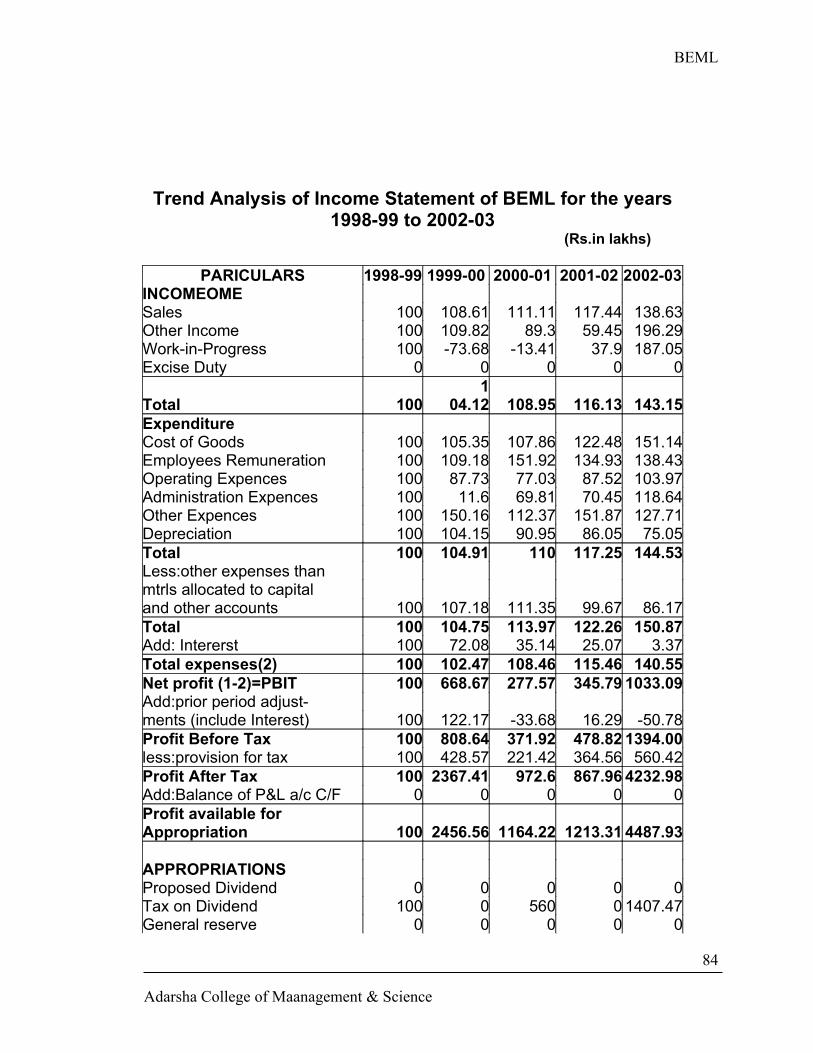
BEML
Trend Analysis of Income Statement of BEML for the years 1998-99 to 2002-03
(Rs.in lakhs)
PARICULARS 1998-99 1999-00 2000-01 2001-02 2002-03INCOMEOMESales 100 108.61 111.11 117.44 138.63Other Income 100 109.82 89.3 59.45 196.29Work-in-Progress 100 -73.68 -13.41 37.9 187.05Excise Duty 0 0 0 0 0
Total 1001
04.12 108.95 116.13 143.15ExpenditureCost of Goods 100 105.35 107.86 122.48 151.14Employees Remuneration 100 109.18 151.92 134.93 138.43Operating Expences 100 87.73 77.03 87.52 103.97Administration Expences 100 11.6 69.81 70.45 118.64Other Expences 100 150.16 112.37 151.87 127.71Depreciation 100 104.15 90.95 86.05 75.05Total 100 104.91 110 117.25 144.53Less:other expenses thanmtrls allocated to capitaland other accounts 100 107.18 111.35 99.67 86.17Total 100 104.75 113.97 122.26 150.87Add: Intererst 100 72.08 35.14 25.07 3.37Total expenses(2) 100 102.47 108.46 115.46 140.55Net profit (1-2)=PBIT 100 668.67 277.57 345.79 1033.09Add:prior period adjust-ments (include Interest) 100 122.17 -33.68 16.29 -50.78Profit Before Tax 100 808.64 371.92 478.82 1394.00less:provision for tax 100 428.57 221.42 364.56 560.42Profit After Tax 100 2367.41 972.6 867.96 4232.98Add:Balance of P&L a/c C/F 0 0 0 0 0Profit available for Appropriation 100 2456.56 1164.22 1213.31 4487.93
APPROPRIATIONSProposed Dividend 0 0 0 0 0Tax on Dividend 100 0 560 0 1407.47General reserve 0 0 0 0 0
Adarsha College of Maanagement & Science
84
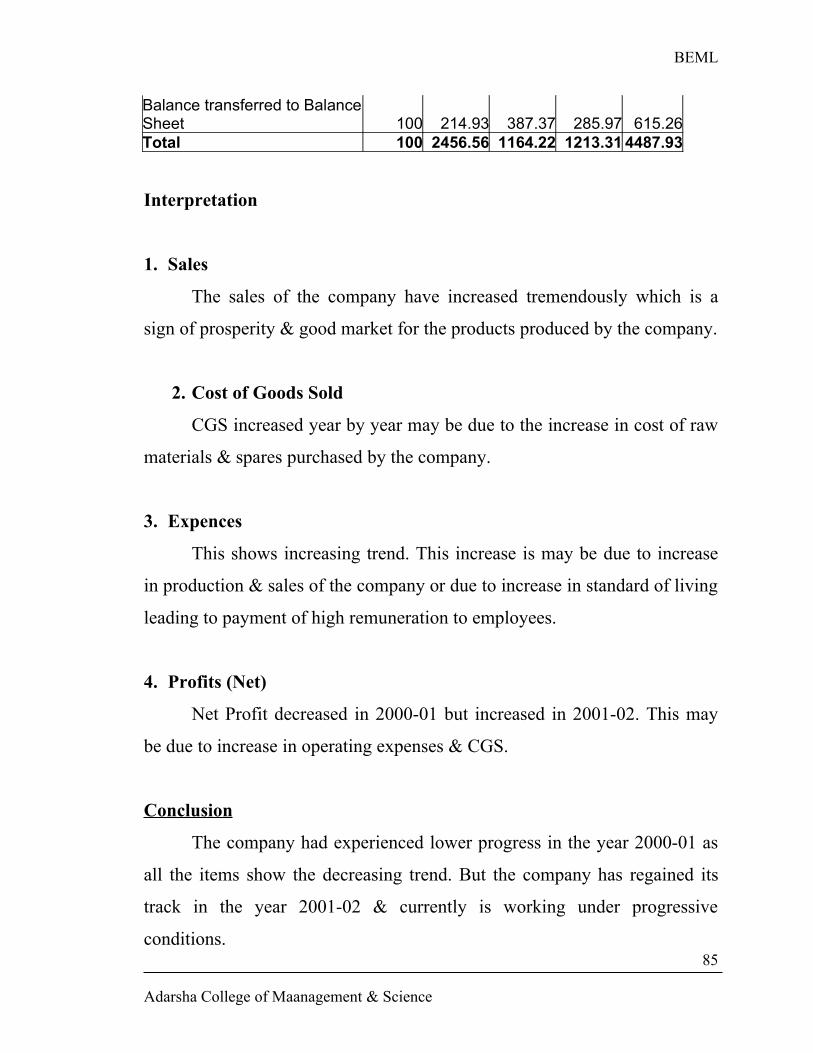
BEML
Balance transferred to Balance Sheet 100 214.93 387.37 285.97 615.26Total 100 2456.56 1164.22 1213.31 4487.93
Interpretation
1. Sales
The sales of the company have increased tremendously which is a
sign of prosperity & good market for the products produced by the company.
2. Cost of Goods Sold
CGS increased year by year may be due to the increase in cost of raw
materials & spares purchased by the company.
3. Expences
This shows increasing trend. This increase is may be due to increase
in production & sales of the company or due to increase in standard of living
leading to payment of high remuneration to employees.
4. Profits (Net)
Net Profit decreased in 2000-01 but increased in 2001-02. This may
be due to increase in operating expenses & CGS.
Conclusion
The company had experienced lower progress in the year 2000-01 as
all the items show the decreasing trend. But the company has regained its
track in the year 2001-02 & currently is working under progressive
conditions.
Adarsha College of Maanagement & Science
85
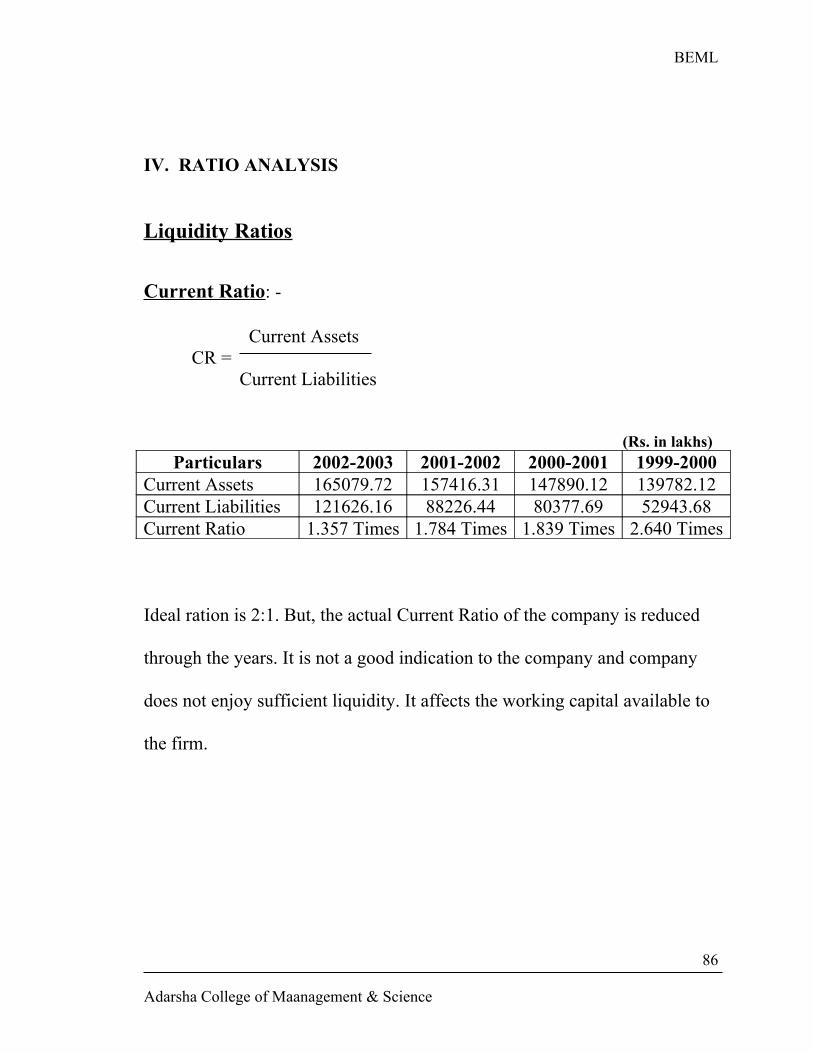
BEML
IV. RATIO ANALYSIS
Liquidity Ratios
Current Ratio: -
Current AssetsCR =
Current Liabilities
(Rs. in lakhs)Particulars 2002-2003 2001-2002 2000-2001 1999-2000
Current Assets 165079.72 157416.31 147890.12 139782.12Current Liabilities 121626.16 88226.44 80377.69 52943.68Current Ratio 1.357 Times 1.784 Times 1.839 Times 2.640 Times
Ideal ration is 2:1. But, the actual Current Ratio of the company is reduced
through the years. It is not a good indication to the company and company
does not enjoy sufficient liquidity. It affects the working capital available to
the firm.
Adarsha College of Maanagement & Science
86
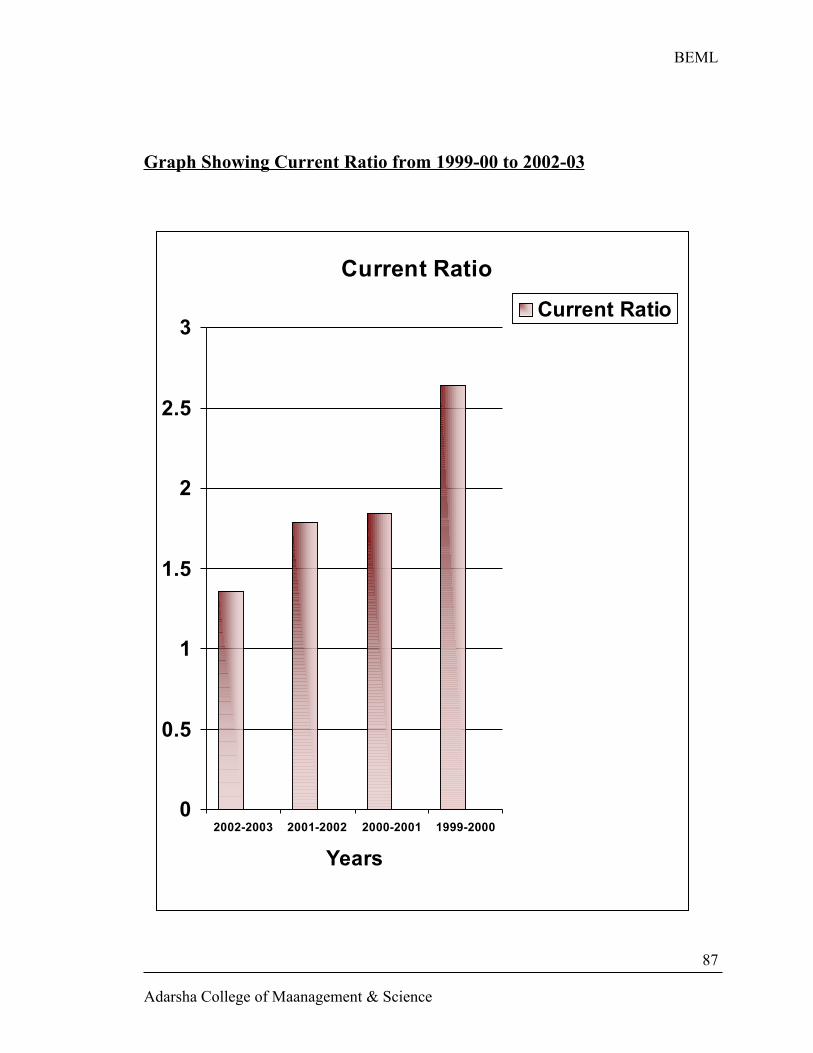
BEML
Graph Showing Current Ratio from 1999-00 to 2002-03
Current Ratio
0
0.5
1
1.5
2
2.5
3
2002-2003 2001-2002 2000-2001 1999-2000
Years
Current Ratio
Adarsha College of Maanagement & Science
87
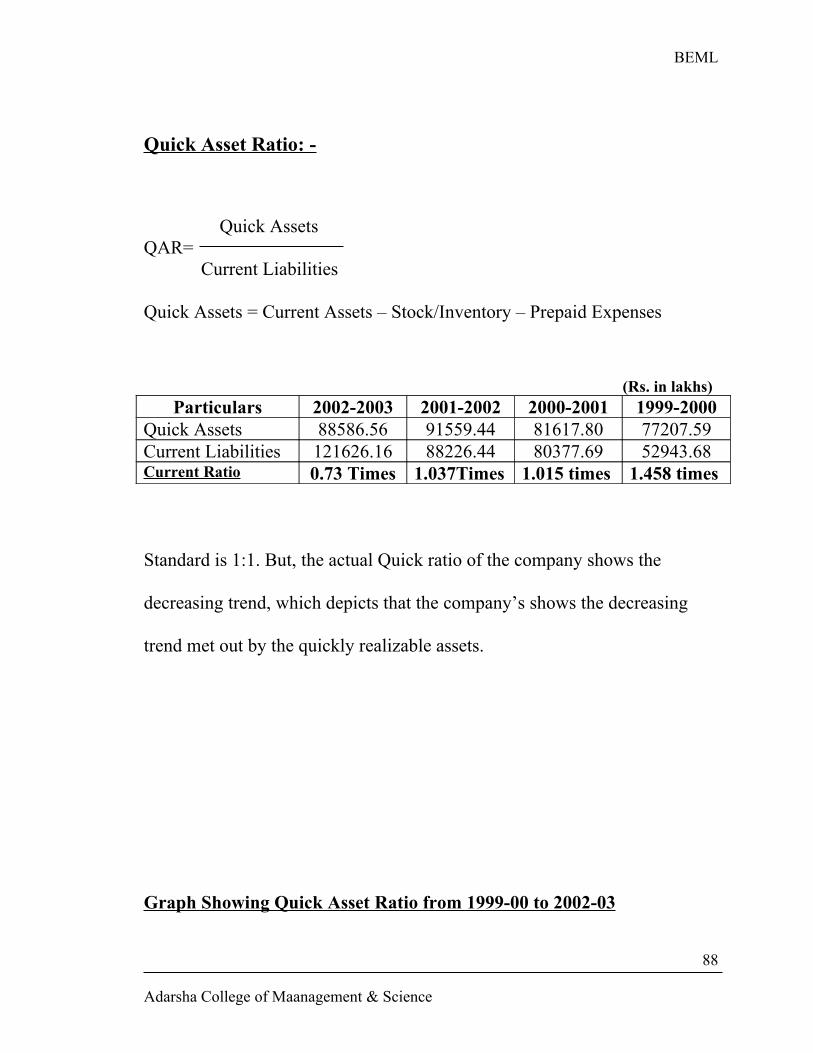
BEML
Quick Asset Ratio: -
Quick AssetsQAR=
Current Liabilities
Quick Assets = Current Assets – Stock/Inventory – Prepaid Expenses
(Rs. in lakhs)Particulars 2002-2003 2001-2002 2000-2001 1999-2000
Quick Assets 88586.56 91559.44 81617.80 77207.59Current Liabilities 121626.16 88226.44 80377.69 52943.68Current Ratio 0.73 Times 1.037Times 1.015 times 1.458 times
Standard is 1:1. But, the actual Quick ratio of the company shows the
decreasing trend, which depicts that the company’s shows the decreasing
trend met out by the quickly realizable assets.
Graph Showing Quick Asset Ratio from 1999-00 to 2002-03
Adarsha College of Maanagement & Science
88
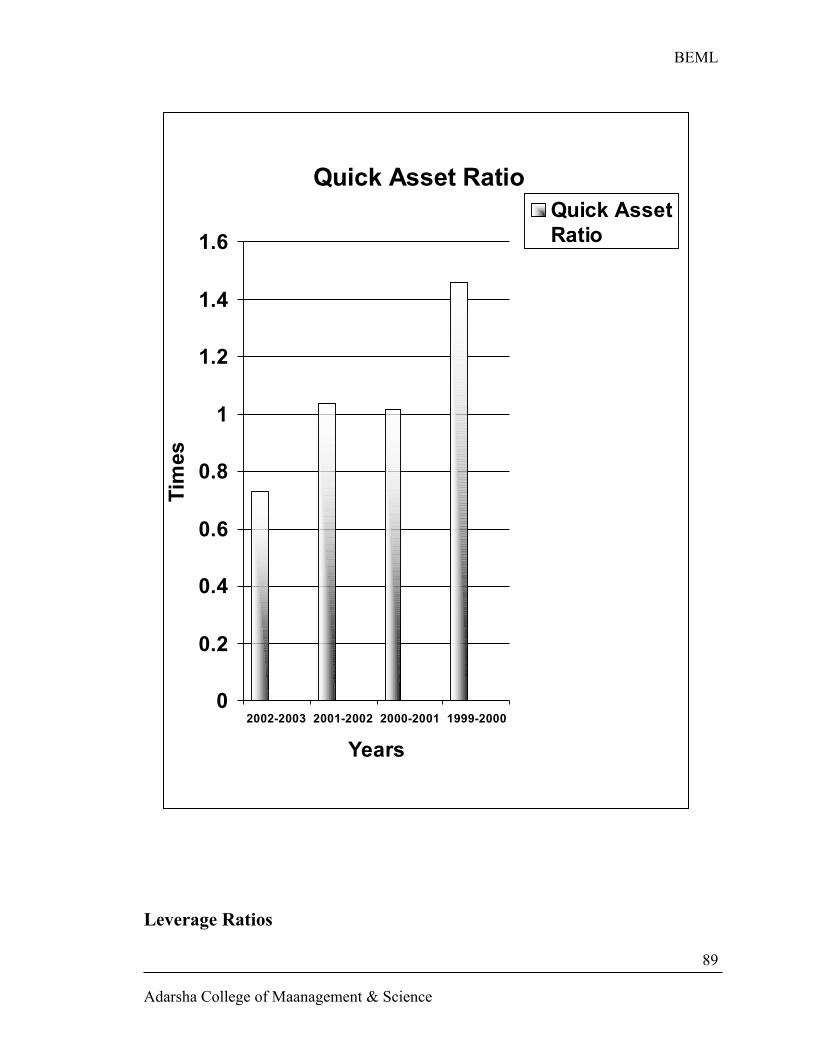
BEML
Quick Asset Ratio
0
0.2
0.4
0.6
0.8
1
1.2
1.4
1.6
2002-2003 2001-2002 2000-2001 1999-2000
Years
Tim
es
Quick AssetRatio
Leverage Ratios
Adarsha College of Maanagement & Science
89
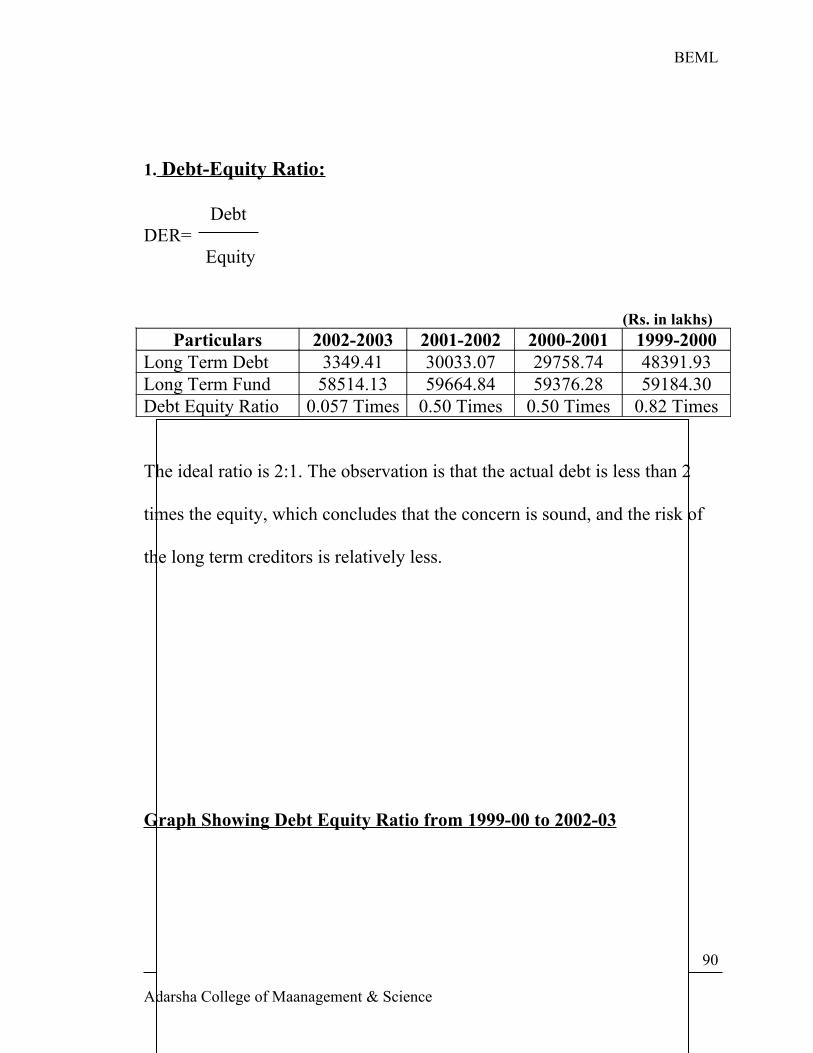
BEML
1. Debt-Equity Ratio:
DebtDER=
Equity
(Rs. in lakhs)Particulars 2002-2003 2001-2002 2000-2001 1999-2000
Long Term Debt 3349.41 30033.07 29758.74 48391.93Long Term Fund 58514.13 59664.84 59376.28 59184.30Debt Equity Ratio 0.057 Times 0.50 Times 0.50 Times 0.82 Times
The ideal ratio is 2:1. The observation is that the actual debt is less than 2
times the equity, which concludes that the concern is sound, and the risk of
the long term creditors is relatively less.
Graph Showing Debt Equity Ratio from 1999-00 to 2002-03
Adarsha College of Maanagement & Science
90
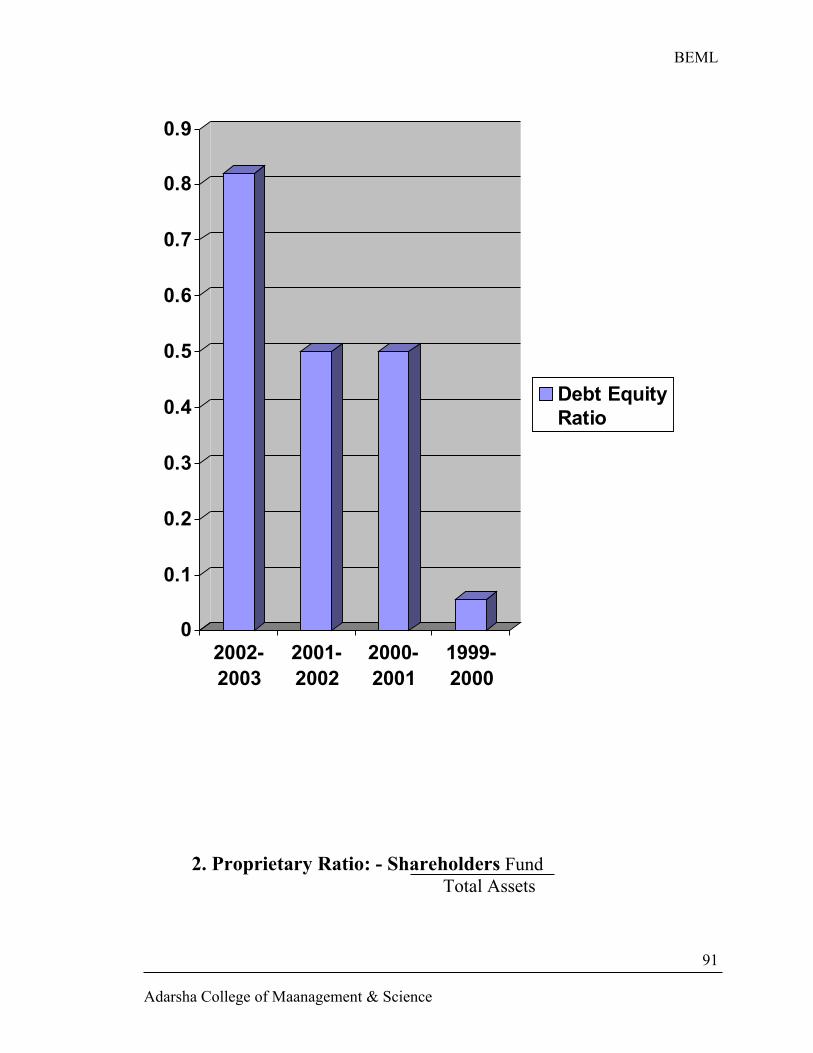
BEML
0
0.1
0.2
0.3
0.4
0.5
0.6
0.7
0.8
0.9
2002-2003
2001-2002
2000-2001
1999-2000
Debt EquityRatio
2. Proprietary Ratio: - Shareholders Fund Total Assets
Adarsha College of Maanagement & Science
91
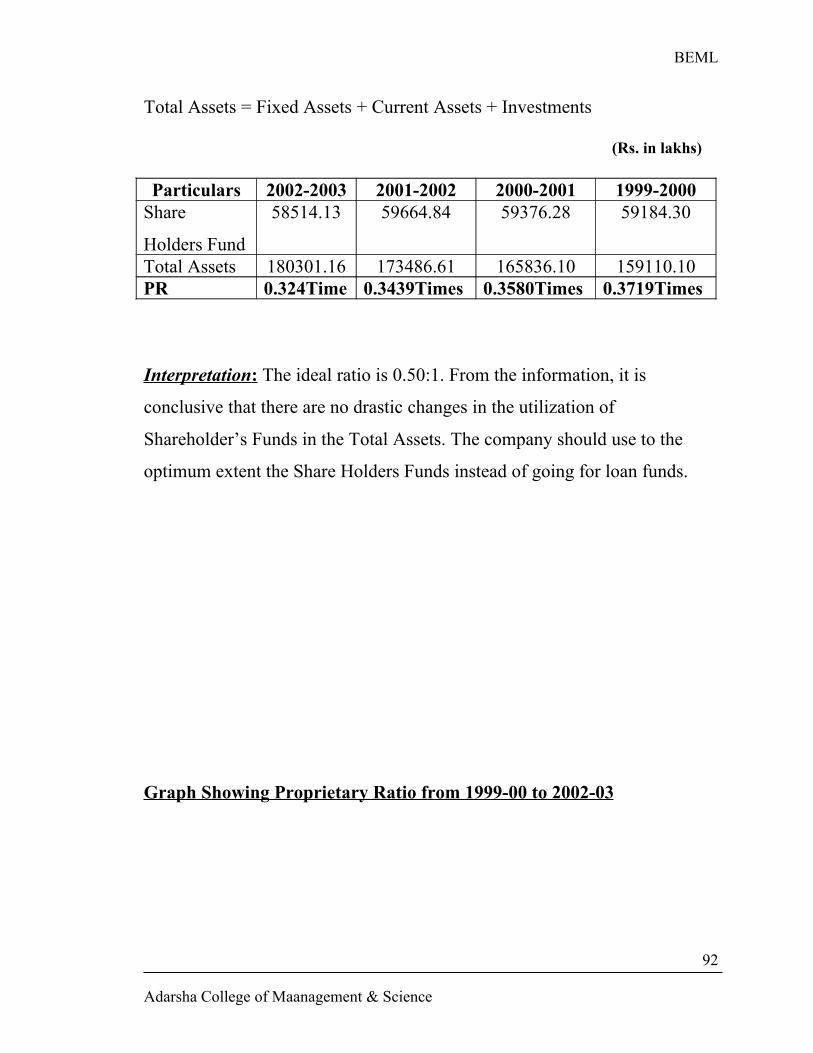
BEML
Total Assets = Fixed Assets + Current Assets + Investments
(Rs. in lakhs)
Particulars 2002-2003 2001-2002 2000-2001 1999-2000Share
Holders Fund
58514.13 59664.84 59376.28 59184.30
Total Assets 180301.16 173486.61 165836.10 159110.10PR 0.324Time 0.3439Times 0.3580Times 0.3719Times
Interpretation : The ideal ratio is 0.50:1. From the information, it is
conclusive that there are no drastic changes in the utilization of
Shareholder’s Funds in the Total Assets. The company should use to the
optimum extent the Share Holders Funds instead of going for loan funds.
Graph Showing Proprietary Ratio from 1999-00 to 2002-03
Adarsha College of Maanagement & Science
92
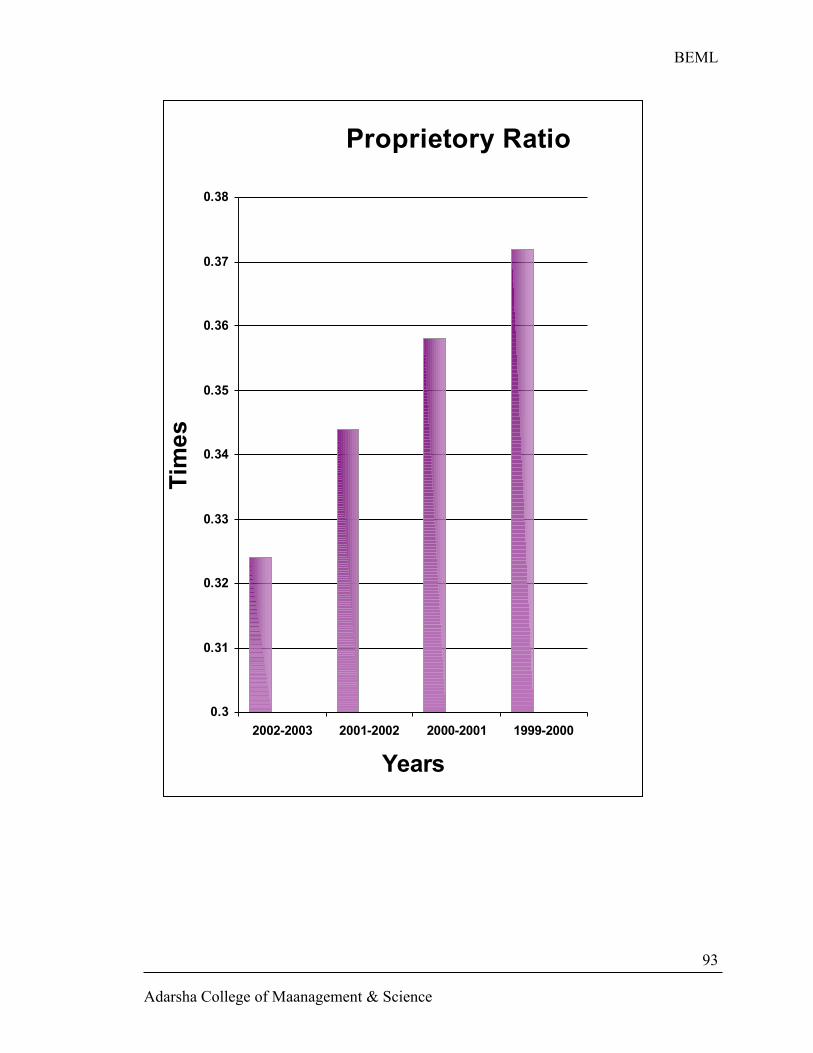
BEML
Proprietory Ratio
0.3
0.31
0.32
0.33
0.34
0.35
0.36
0.37
0.38
2002-2003 2001-2002 2000-2001 1999-2000
Years
Tim
es
Adarsha College of Maanagement & Science
93
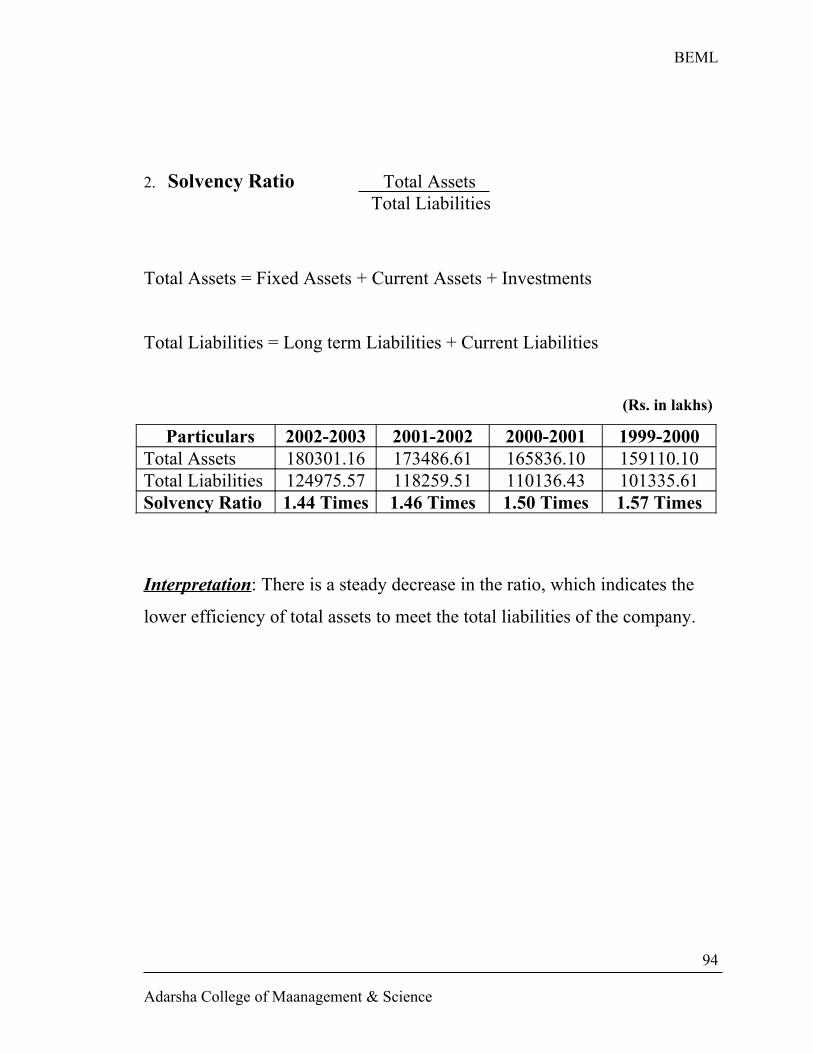
BEML
2. Solvency Ratio Total Assets Total Liabilities
Total Assets = Fixed Assets + Current Assets + Investments
Total Liabilities = Long term Liabilities + Current Liabilities
(Rs. in lakhs)
Particulars 2002-2003 2001-2002 2000-2001 1999-2000Total Assets 180301.16 173486.61 165836.10 159110.10Total Liabilities 124975.57 118259.51 110136.43 101335.61Solvency Ratio 1.44 Times 1.46 Times 1.50 Times 1.57 Times
Interpretation: There is a steady decrease in the ratio, which indicates the
lower efficiency of total assets to meet the total liabilities of the company.
Adarsha College of Maanagement & Science
94
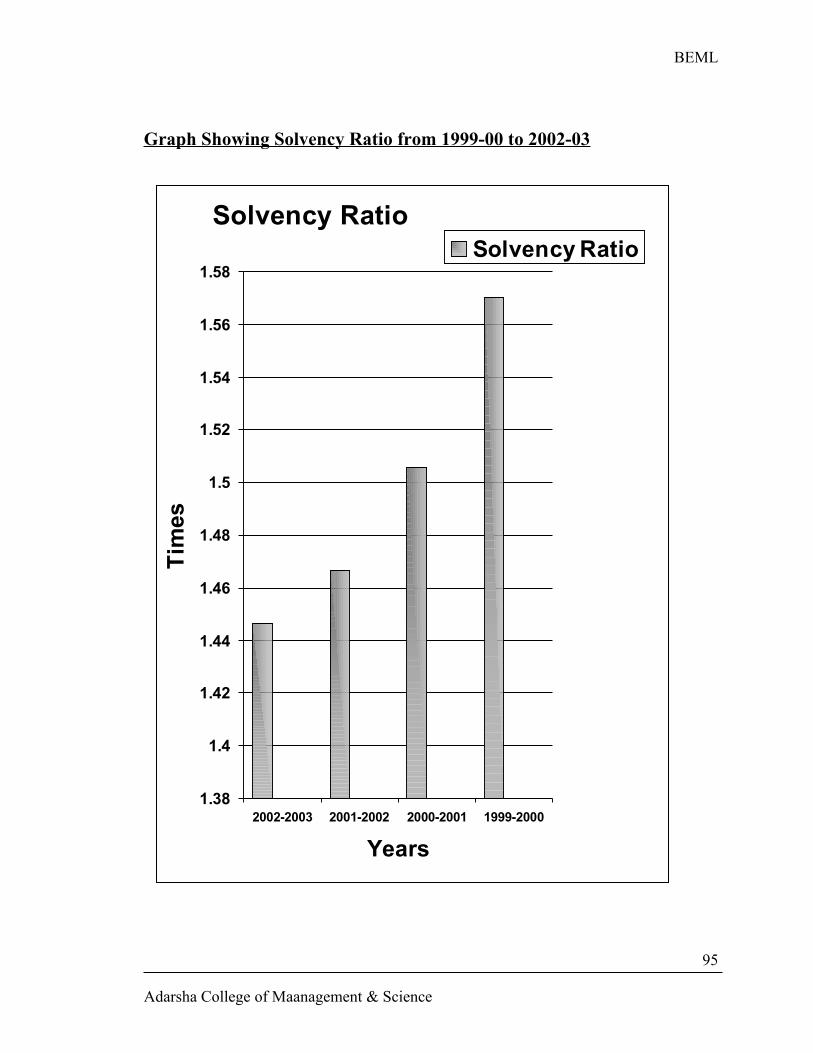
BEML
Graph Showing Solvency Ratio from 1999-00 to 2002-03
Solvency Ratio
1.38
1.4
1.42
1.44
1.46
1.48
1.5
1.52
1.54
1.56
1.58
2002-2003 2001-2002 2000-2001 1999-2000
Years
Tim
es
Solvency Ratio
Adarsha College of Maanagement & Science
95
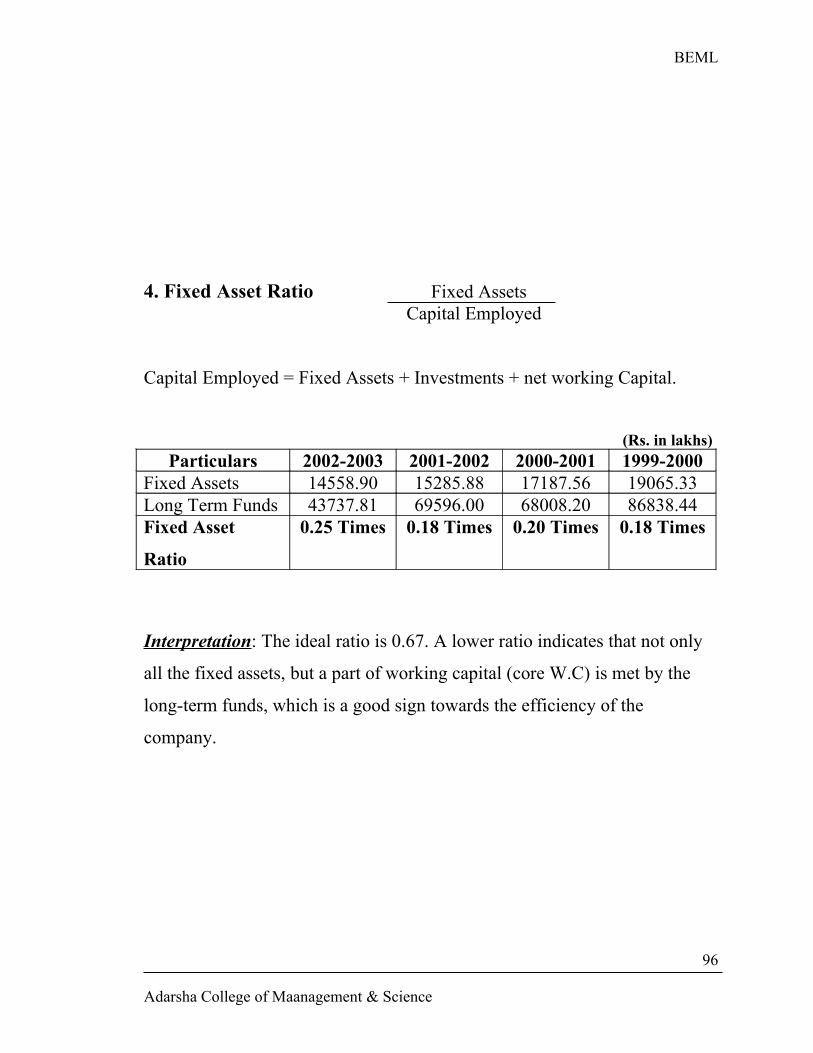
BEML
4. Fixed Asset Ratio Fixed Assets Capital Employed
Capital Employed = Fixed Assets + Investments + net working Capital.
(Rs. in lakhs)Particulars 2002-2003 2001-2002 2000-2001 1999-2000
Fixed Assets 14558.90 15285.88 17187.56 19065.33Long Term Funds 43737.81 69596.00 68008.20 86838.44Fixed Asset
Ratio
0.25 Times 0.18 Times 0.20 Times 0.18 Times
Interpretation: The ideal ratio is 0.67. A lower ratio indicates that not only
all the fixed assets, but a part of working capital (core W.C) is met by the
long-term funds, which is a good sign towards the efficiency of the
company.
Adarsha College of Maanagement & Science
96
BEML
Graph Showing Fixed Asset Ratio from 1999-00 to 2002-03
Adarsha College of Maanagement & Science
97
BEML
Fixed Asset Ratio
2002-20032001-20022000-20011999-2000
Adarsha College of Maanagement & Science
98
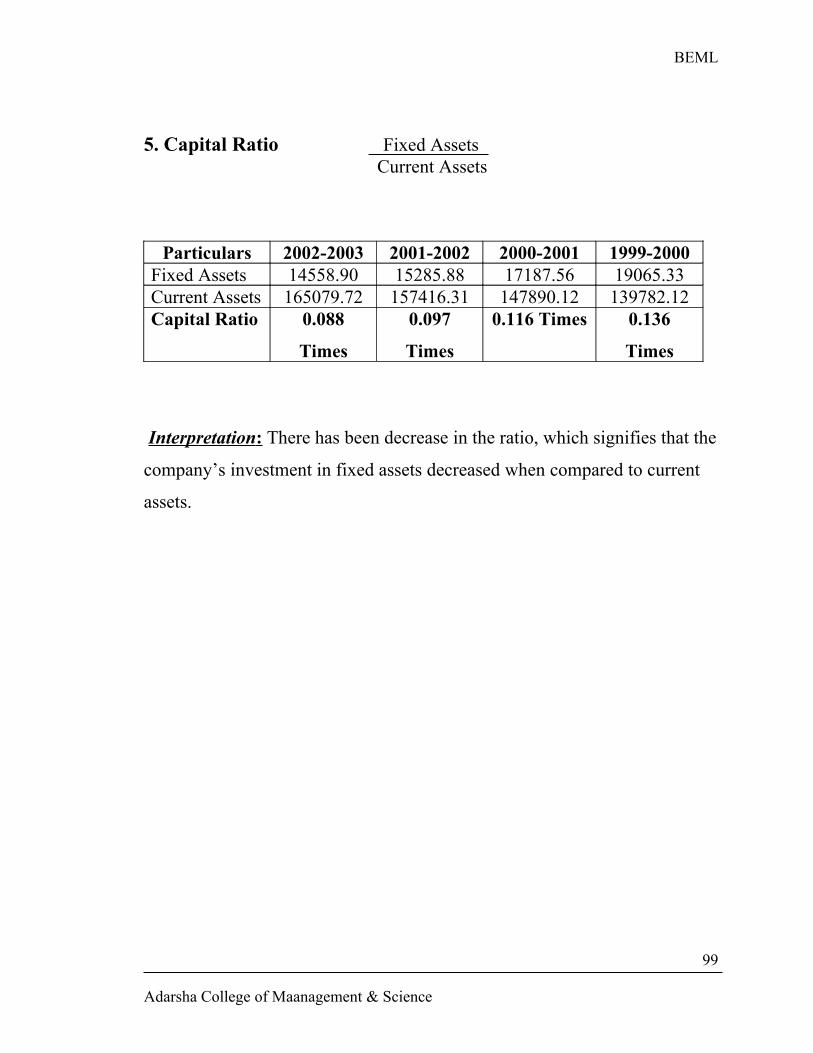
BEML
5. Capital Ratio Fixed Assets Current Assets
Particulars 2002-2003 2001-2002 2000-2001 1999-2000
Fixed Assets 14558.90 15285.88 17187.56 19065.33Current Assets 165079.72 157416.31 147890.12 139782.12Capital Ratio 0.088
Times
0.097
Times
0.116 Times 0.136
Times
Interpretation : There has been decrease in the ratio, which signifies that the
company’s investment in fixed assets decreased when compared to current
assets.
Adarsha College of Maanagement & Science
99
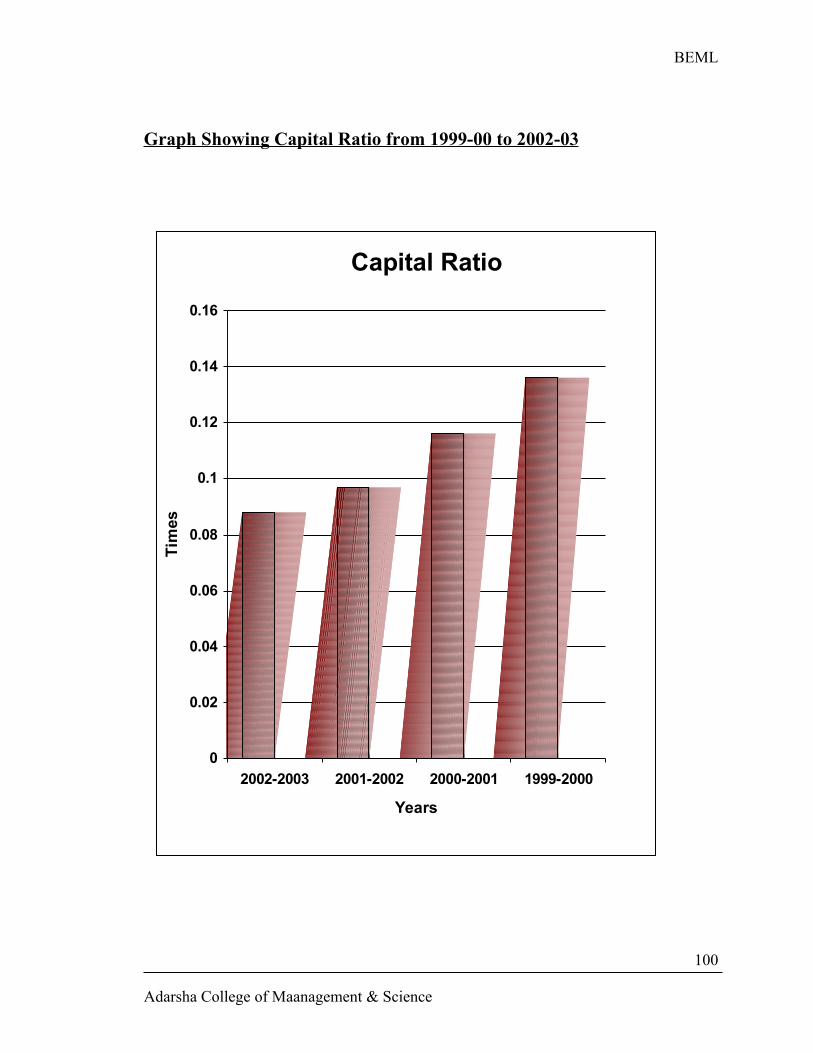
BEML
Graph Showing Capital Ratio from 1999-00 to 2002-03
Capital Ratio
0
0.02
0.04
0.06
0.08
0.1
0.12
0.14
0.16
2002-2003 2001-2002 2000-2001 1999-2000
Years
Tim
es
Adarsha College of Maanagement & Science
100
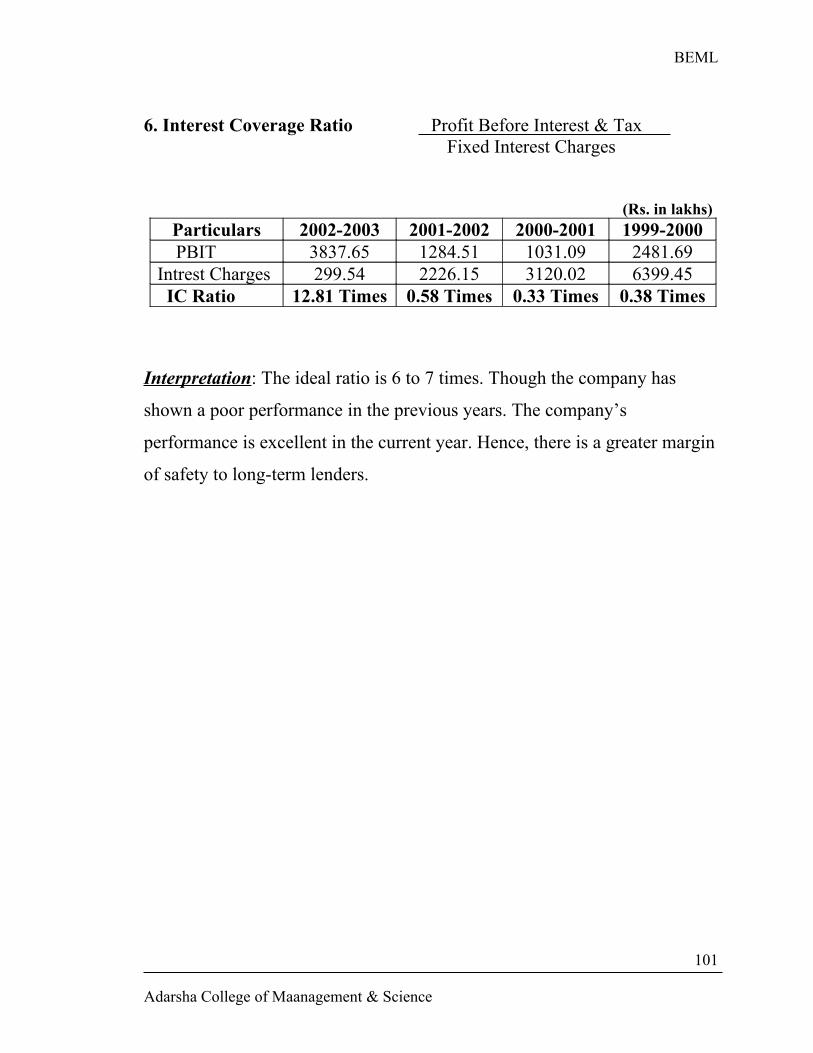
BEML
6. Interest Coverage Ratio Profit Before Interest & Tax Fixed Interest Charges
(Rs. in lakhs)Particulars 2002-2003 2001-2002 2000-2001 1999-2000
PBIT 3837.65 1284.51 1031.09 2481.69Intrest Charges 299.54 2226.15 3120.02 6399.45 IC Ratio 12.81 Times 0.58 Times 0.33 Times 0.38 Times
Interpretation: The ideal ratio is 6 to 7 times. Though the company has
shown a poor performance in the previous years. The company’s
performance is excellent in the current year. Hence, there is a greater margin
of safety to long-term lenders.
Adarsha College of Maanagement & Science
101
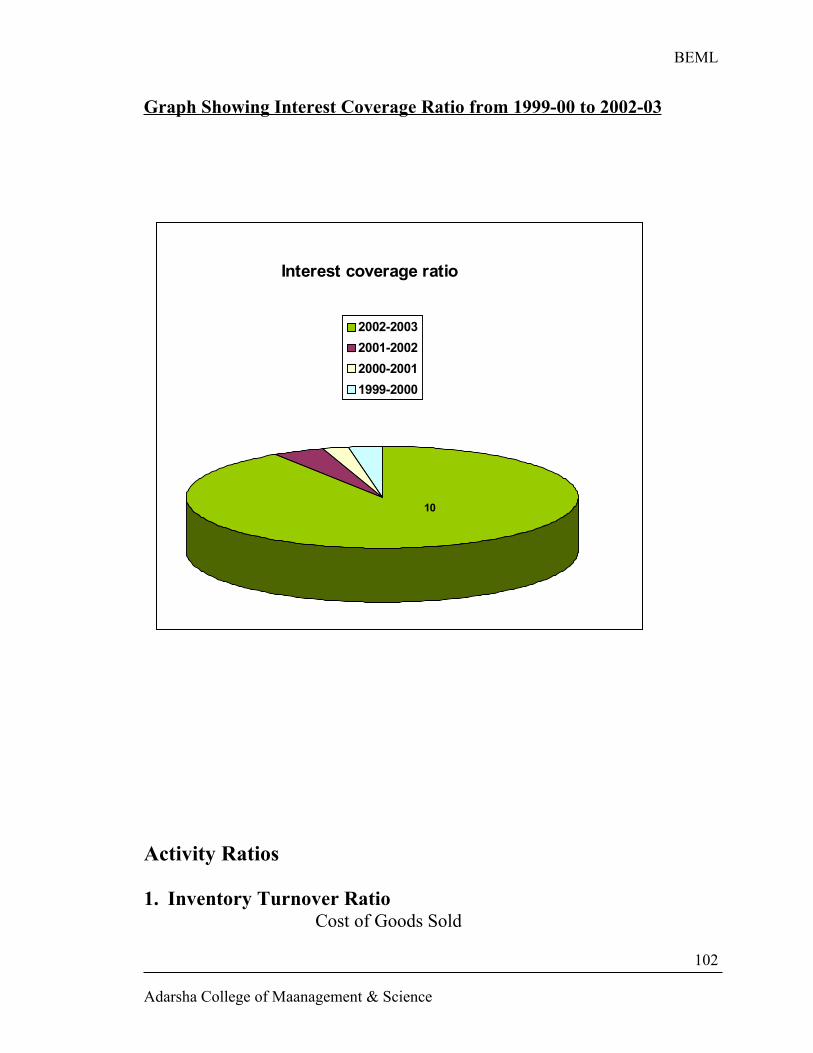
BEML
Graph Showing Interest Coverage Ratio from 1999-00 to 2002-03
Interest coverage ratio
2002-2003
2001-2002
2000-2001
1999-2000
10
Activity Ratios
1. Inventory Turnover Ratio Cost of Goods Sold
Adarsha College of Maanagement & Science
102
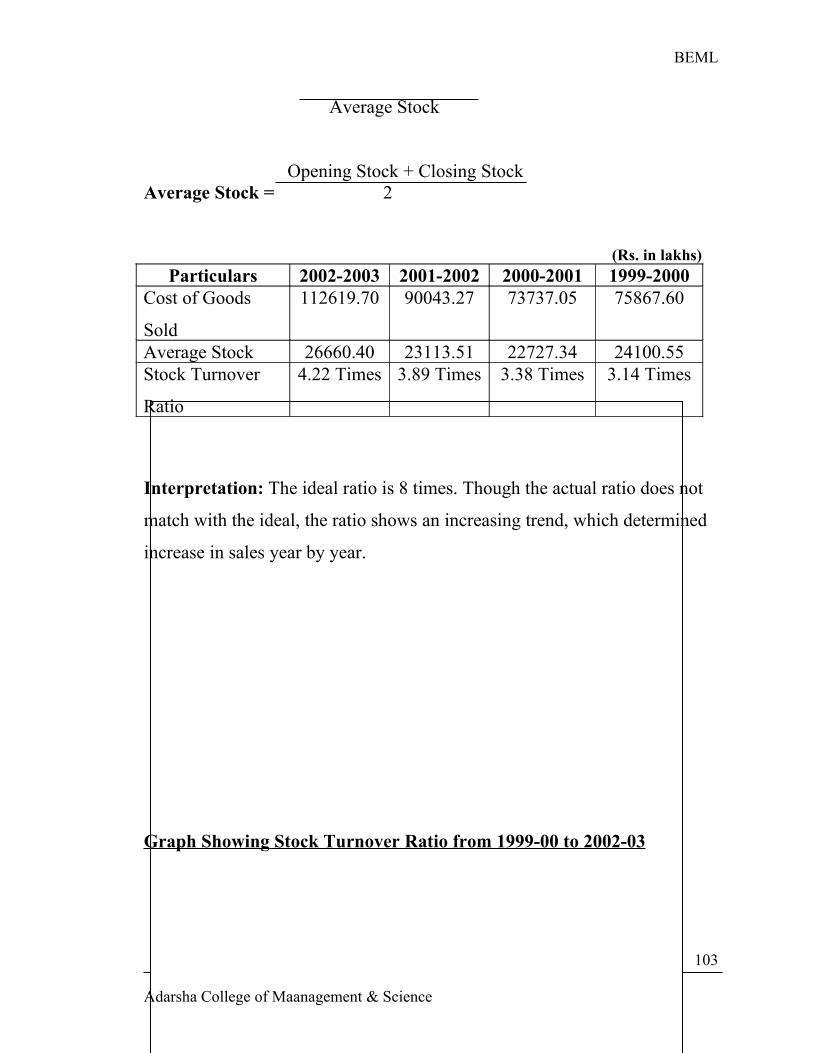
BEML
Average Stock
Opening Stock + Closing StockAverage Stock = 2
(Rs. in lakhs)Particulars 2002-2003 2001-2002 2000-2001 1999-2000
Cost of Goods
Sold
112619.70 90043.27 73737.05 75867.60
Average Stock 26660.40 23113.51 22727.34 24100.55Stock Turnover
Ratio
4.22 Times 3.89 Times 3.38 Times 3.14 Times
Interpretation: The ideal ratio is 8 times. Though the actual ratio does not
match with the ideal, the ratio shows an increasing trend, which determined
increase in sales year by year.
Graph Showing Stock Turnover Ratio from 1999-00 to 2002-03
Adarsha College of Maanagement & Science
103
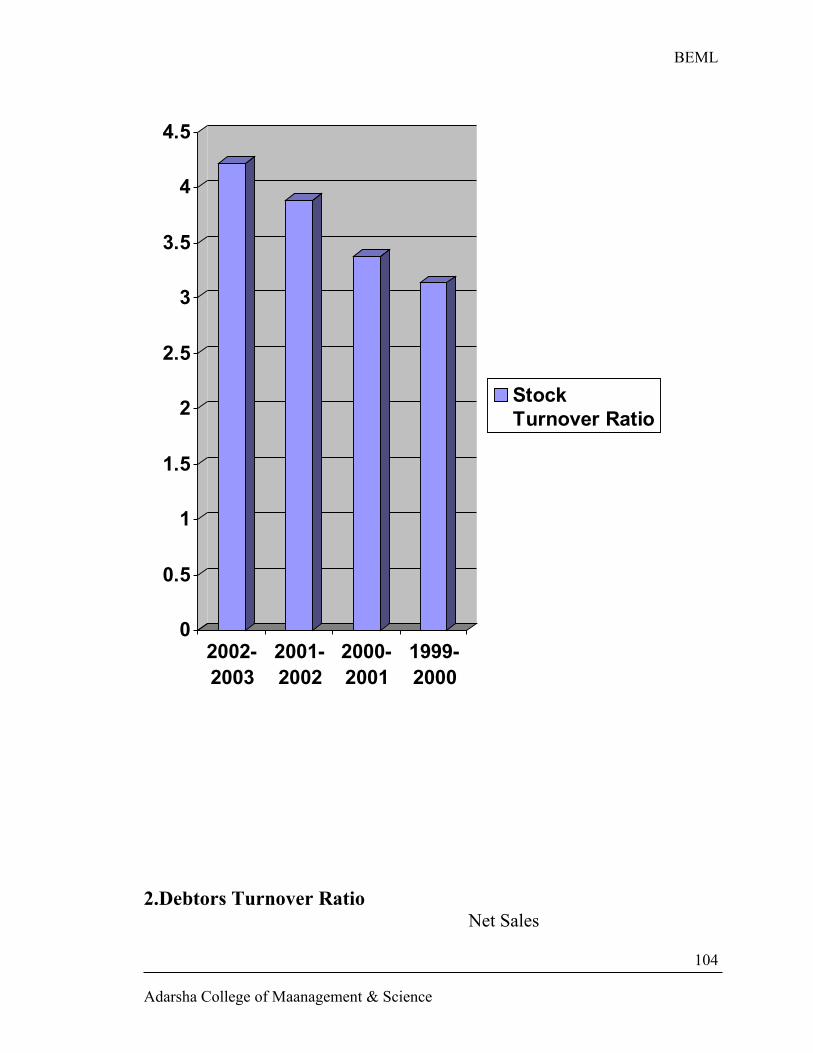
BEML
0
0.5
1
1.5
2
2.5
3
3.5
4
4.5
2002-2003
2001-2002
2000-2001
1999-2000
StockTurnover Ratio
2.Debtors Turnover Ratio Net Sales
Adarsha College of Maanagement & Science
104
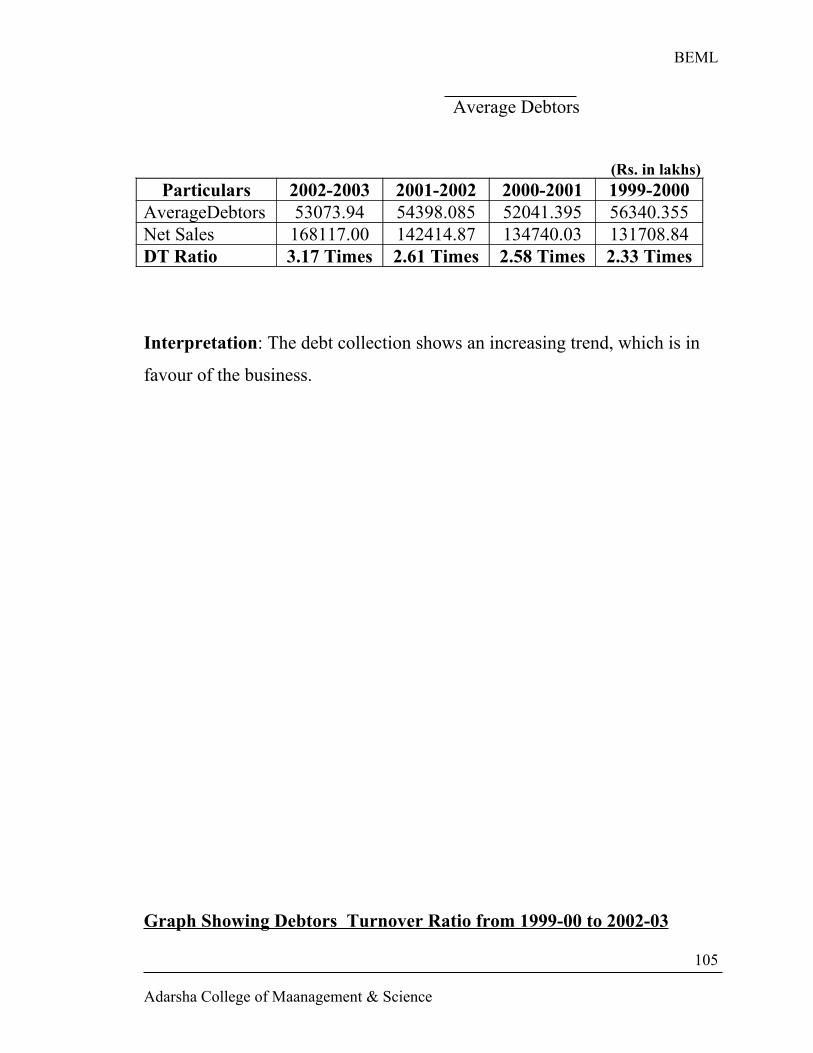
BEML
Average Debtors
(Rs. in lakhs)Particulars 2002-2003 2001-2002 2000-2001 1999-2000
AverageDebtors 53073.94 54398.085 52041.395 56340.355Net Sales 168117.00 142414.87 134740.03 131708.84DT Ratio 3.17 Times 2.61 Times 2.58 Times 2.33 Times
Interpretation: The debt collection shows an increasing trend, which is in
favour of the business.
Graph Showing Debtors Turnover Ratio from 1999-00 to 2002-03
Adarsha College of Maanagement & Science
105
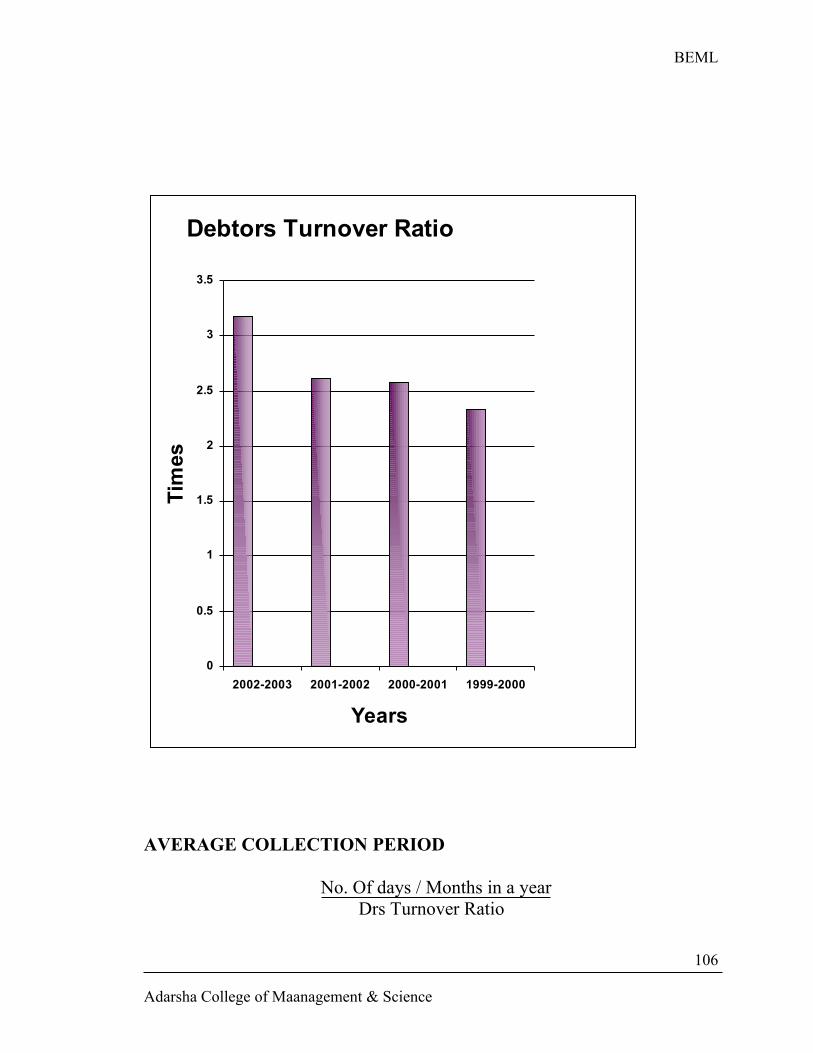
BEML
Debtors Turnover Ratio
0
0.5
1
1.5
2
2.5
3
3.5
2002-2003 2001-2002 2000-2001 1999-2000
Years
Tim
es
AVERAGE COLLECTION PERIOD
No. Of days / Months in a year Drs Turnover Ratio
Adarsha College of Maanagement & Science
106
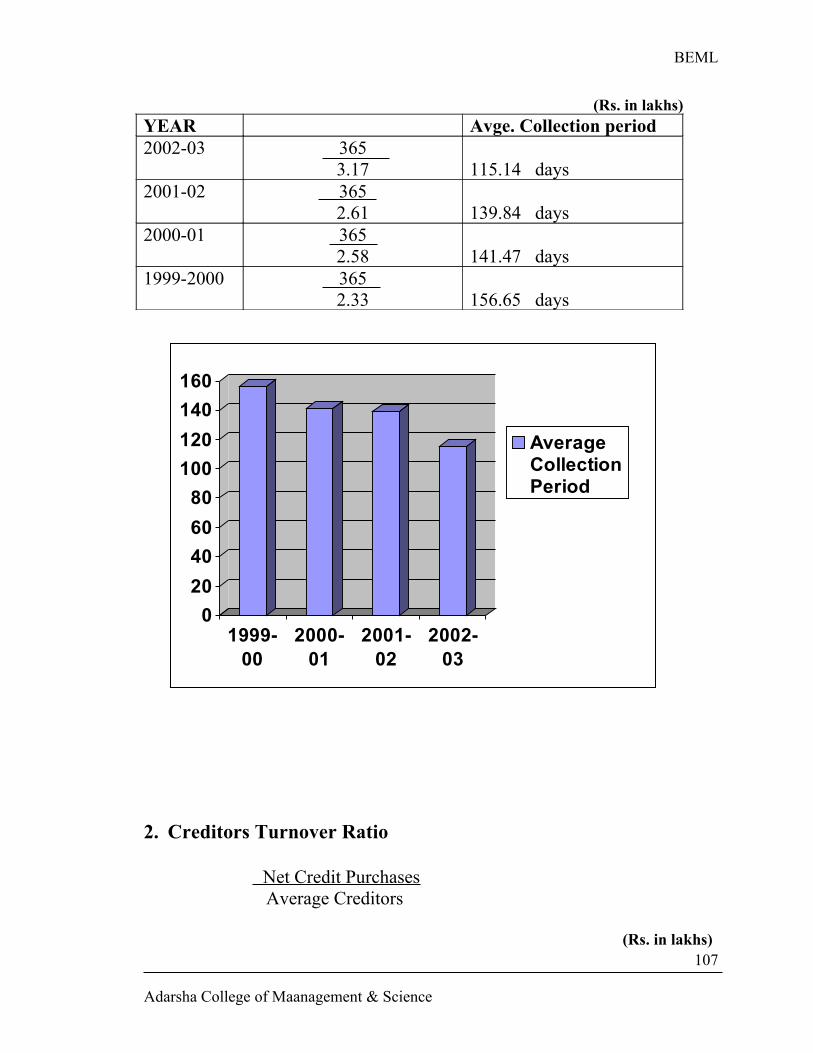
BEML
(Rs. in lakhs)YEAR Avge. Collection period2002-03 365
3.17 115.14 days2001-02 365
2.61 139.84 days2000-01 365
2.58 141.47 days1999-2000 365
2.33 156.65 days
0
20
40
60
80
100
120
140
160
1999-00
2000-01
2001-02
2002-03
AverageCollectionPeriod
2. Creditors Turnover Ratio
Net Credit Purchases Average Creditors
(Rs. in lakhs)
Adarsha College of Maanagement & Science
107
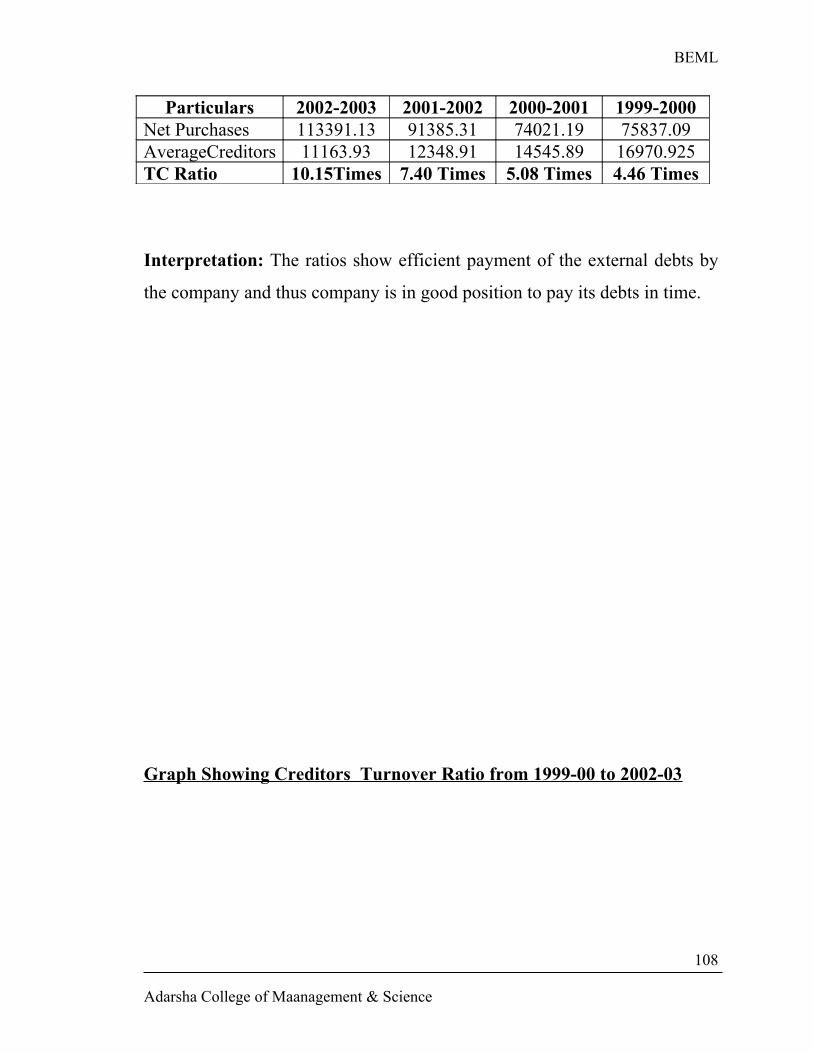
BEML
Particulars 2002-2003 2001-2002 2000-2001 1999-2000Net Purchases 113391.13 91385.31 74021.19 75837.09AverageCreditors 11163.93 12348.91 14545.89 16970.925TC Ratio 10.15Times 7.40 Times 5.08 Times 4.46 Times
Interpretation: The ratios show efficient payment of the external debts by
the company and thus company is in good position to pay its debts in time.
Graph Showing Creditors Turnover Ratio from 1999-00 to 2002-03
Adarsha College of Maanagement & Science
108
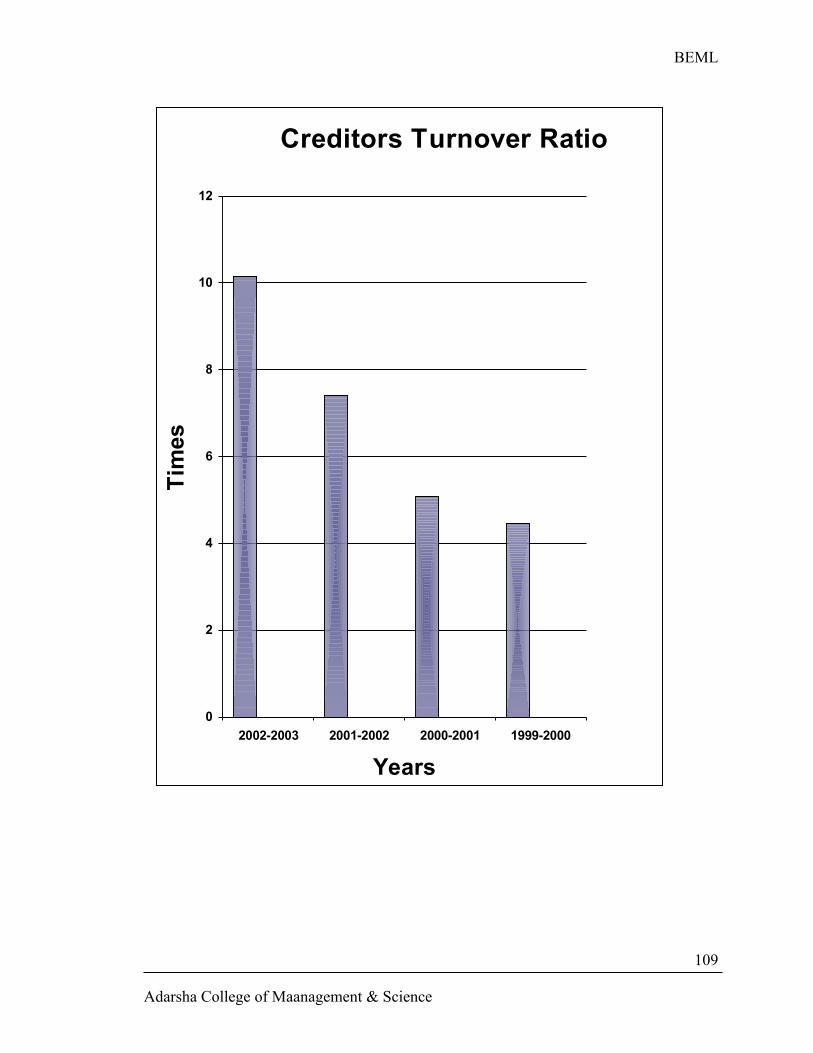
BEML
Creditors Turnover Ratio
0
2
4
6
8
10
12
2002-2003 2001-2002 2000-2001 1999-2000
Years
Tim
es
Adarsha College of Maanagement & Science
109
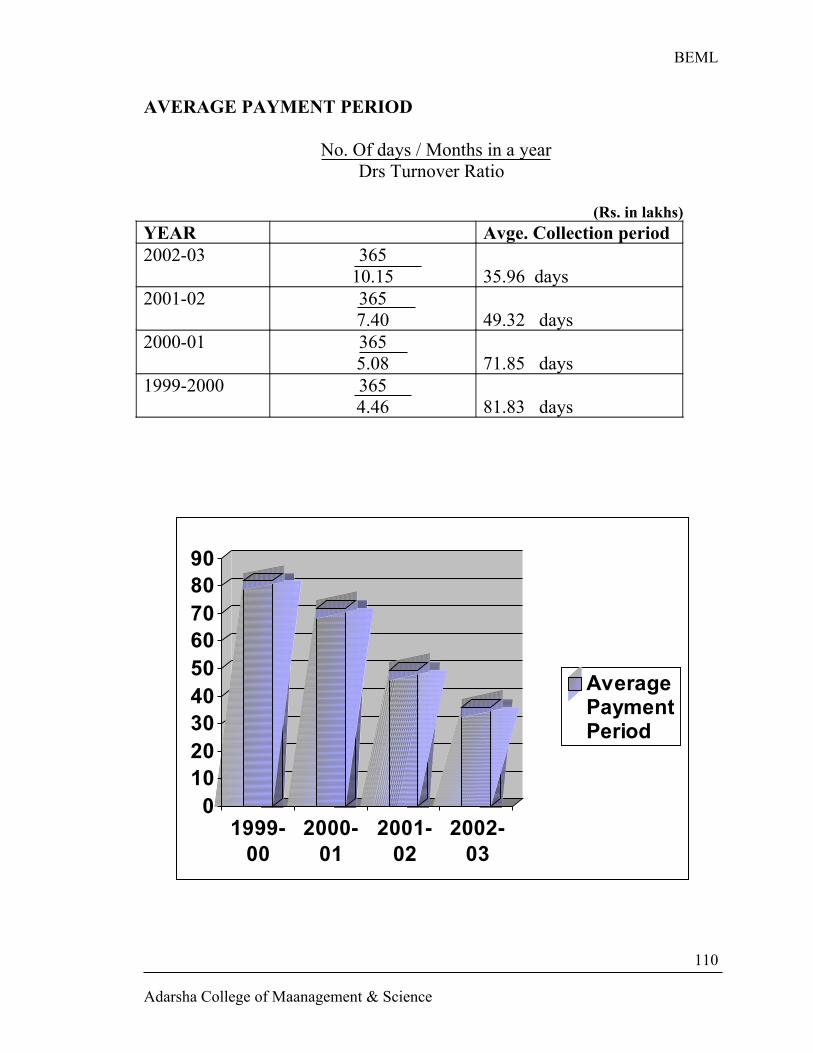
BEML
AVERAGE PAYMENT PERIOD
No. Of days / Months in a year Drs Turnover Ratio
(Rs. in lakhs)YEAR Avge. Collection period2002-03 365
10.15 35.96 days2001-02 365
7.40 49.32 days2000-01 365
5.08 71.85 days1999-2000 365
4.46 81.83 days
0102030405060708090
1999-00
2000-01
2001-02
2002-03
AveragePaymentPeriod
Adarsha College of Maanagement & Science
110
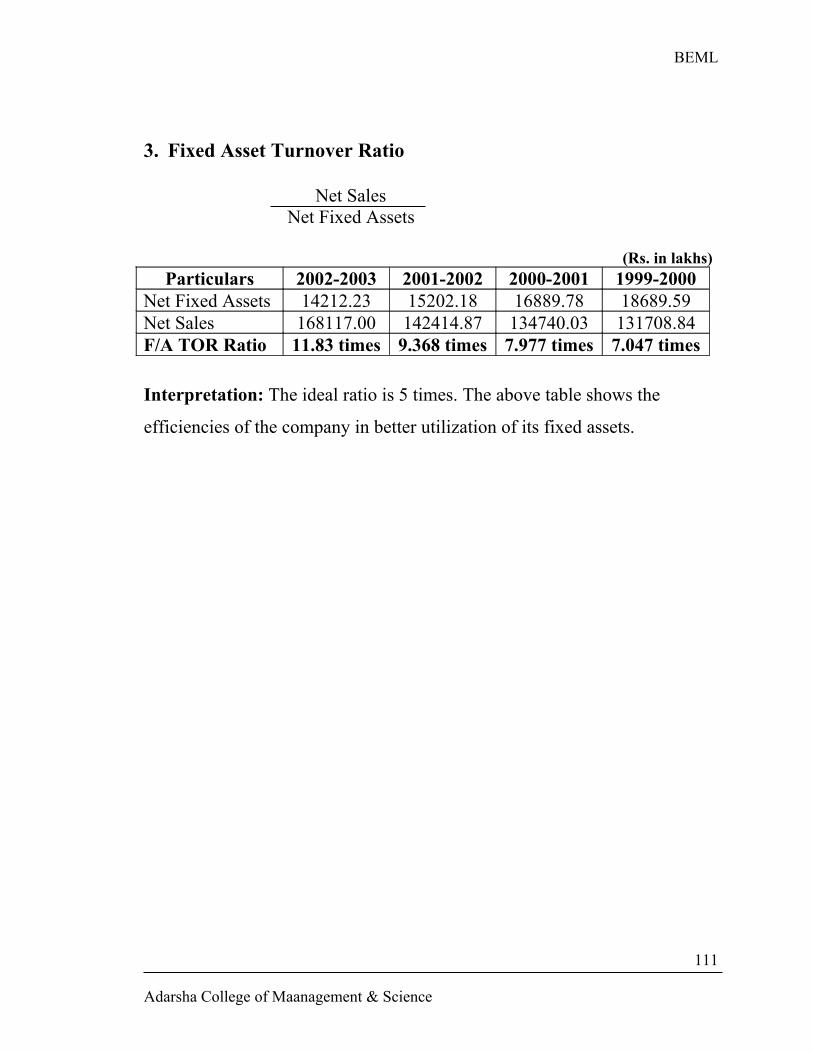
BEML
3. Fixed Asset Turnover Ratio
Net SalesNet Fixed Assets
(Rs. in lakhs)Particulars 2002-2003 2001-2002 2000-2001 1999-2000
Net Fixed Assets 14212.23 15202.18 16889.78 18689.59Net Sales 168117.00 142414.87 134740.03 131708.84F/A TOR Ratio 11.83 times 9.368 times 7.977 times 7.047 times
Interpretation: The ideal ratio is 5 times. The above table shows the
efficiencies of the company in better utilization of its fixed assets.
Adarsha College of Maanagement & Science
111
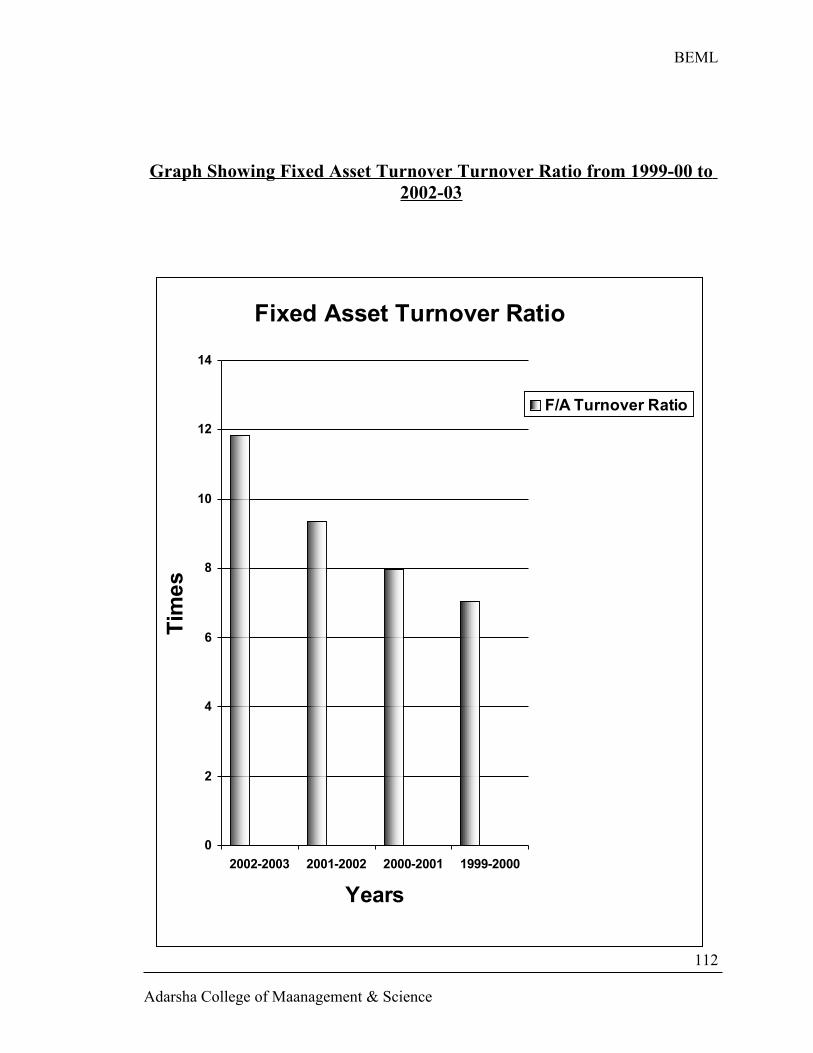
BEML
Graph Showing Fixed Asset Turnover Turnover Ratio from 1999-00 to 2002-03
Fixed Asset Turnover Ratio
0
2
4
6
8
10
12
14
2002-2003 2001-2002 2000-2001 1999-2000
Years
Tim
es
F/A Turnover Ratio
Adarsha College of Maanagement & Science
112
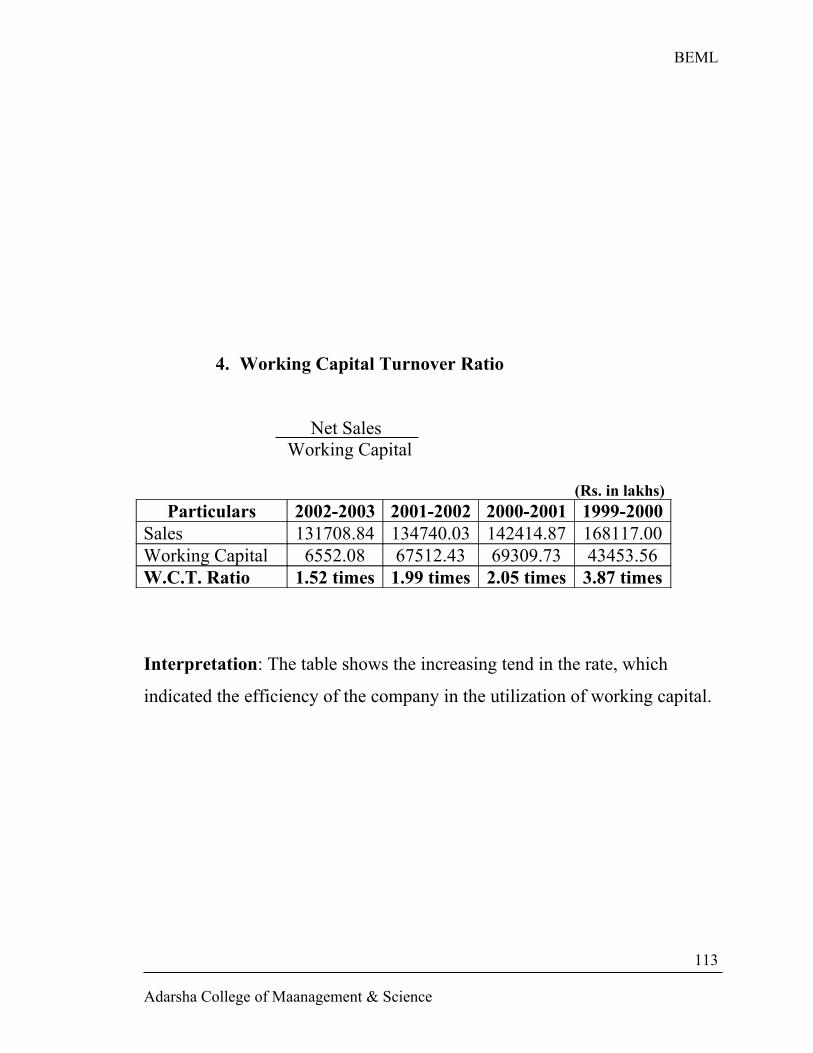
BEML
4. Working Capital Turnover Ratio
Net SalesWorking Capital
(Rs. in lakhs)Particulars 2002-2003 2001-2002 2000-2001 1999-2000
Sales 131708.84 134740.03 142414.87 168117.00Working Capital 6552.08 67512.43 69309.73 43453.56W.C.T. Ratio 1.52 times 1.99 times 2.05 times 3.87 times
Interpretation: The table shows the increasing tend in the rate, which
indicated the efficiency of the company in the utilization of working capital.
Adarsha College of Maanagement & Science
113

BEML
Graph Showing Working Capital Turnover Ratio from 1999-00 to 2002-03
Adarsha College of Maanagement & Science
114
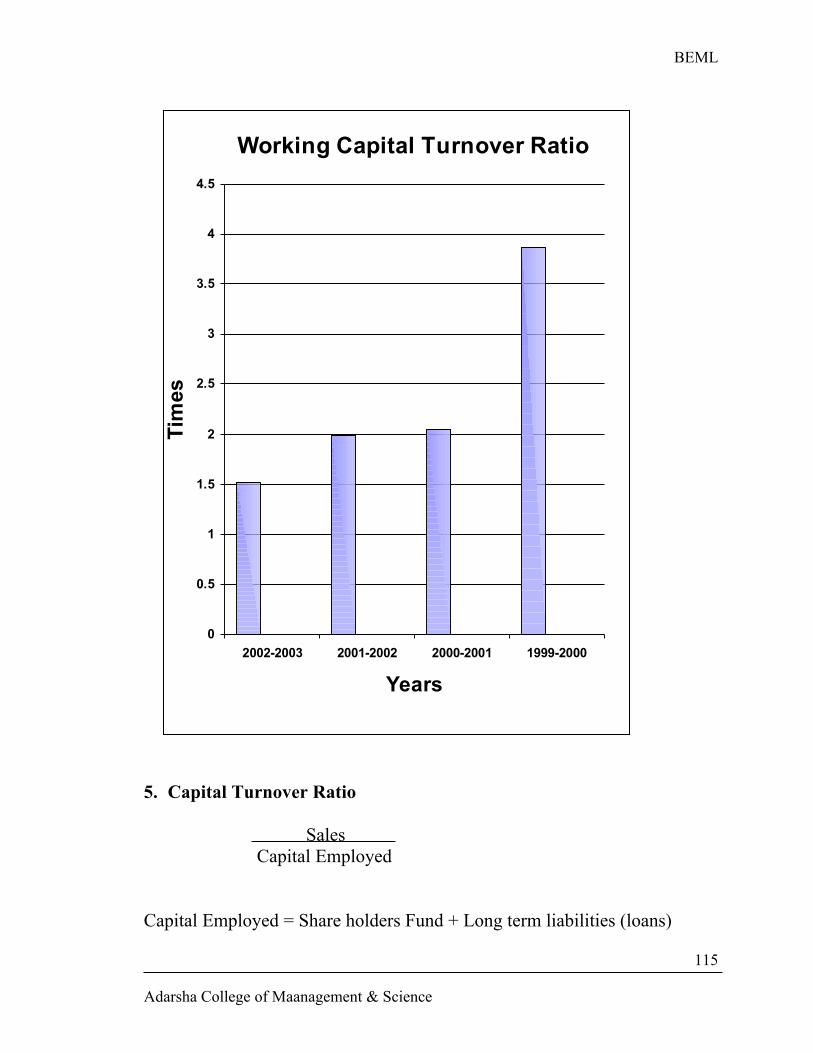
BEML
Working Capital Turnover Ratio
0
0.5
1
1.5
2
2.5
3
3.5
4
4.5
2002-2003 2001-2002 2000-2001 1999-2000
Years
Tim
es
5. Capital Turnover Ratio
Sales Capital Employed
Capital Employed = Share holders Fund + Long term liabilities (loans)
Adarsha College of Maanagement & Science
115
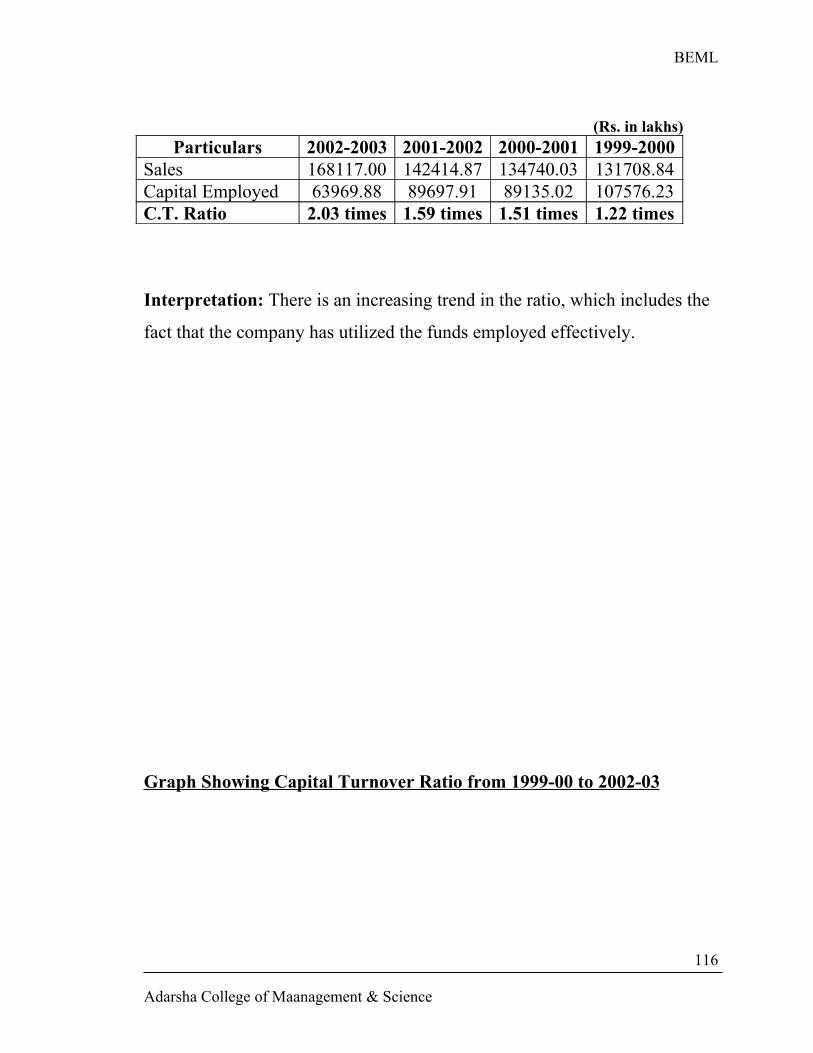
BEML
(Rs. in lakhs)Particulars 2002-2003 2001-2002 2000-2001 1999-2000
Sales 168117.00 142414.87 134740.03 131708.84Capital Employed 63969.88 89697.91 89135.02 107576.23C.T. Ratio 2.03 times 1.59 times 1.51 times 1.22 times
Interpretation: There is an increasing trend in the ratio, which includes the
fact that the company has utilized the funds employed effectively.
Graph Showing Capital Turnover Ratio from 1999-00 to 2002-03
Adarsha College of Maanagement & Science
116
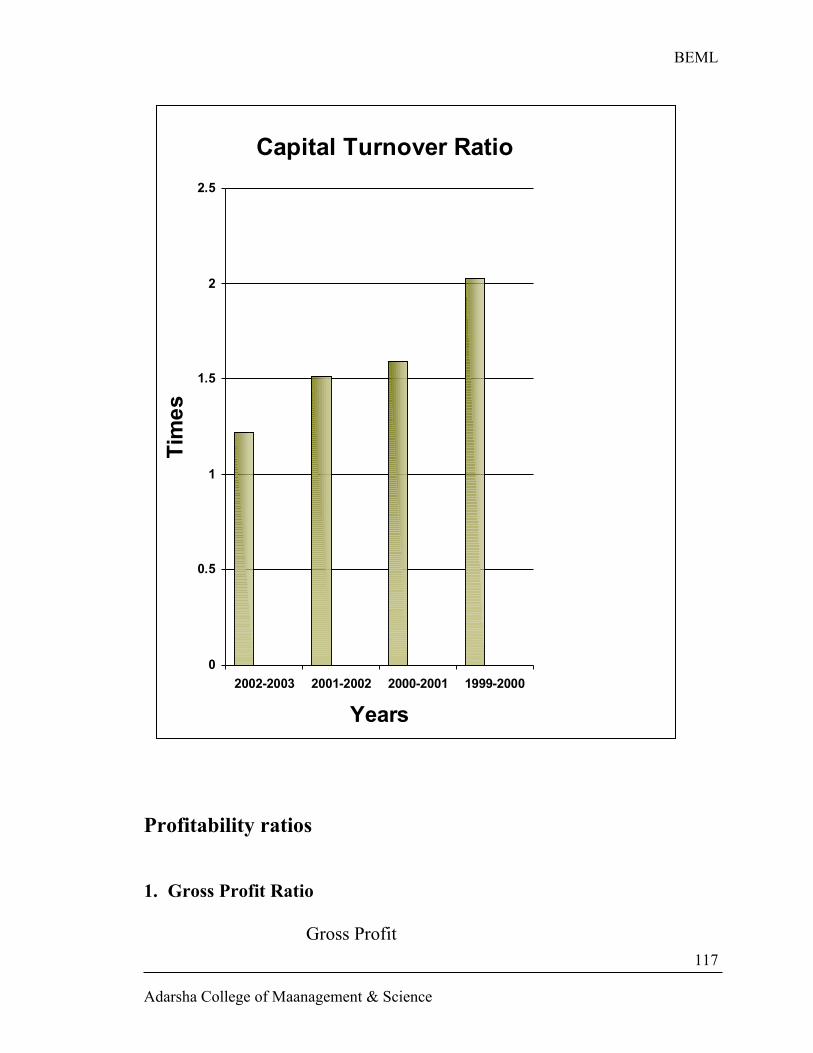
BEML
Capital Turnover Ratio
0
0.5
1
1.5
2
2.5
2002-2003 2001-2002 2000-2001 1999-2000
Years
Tim
es
Profitability ratios
1. Gross Profit Ratio
Gross Profit
Adarsha College of Maanagement & Science
117
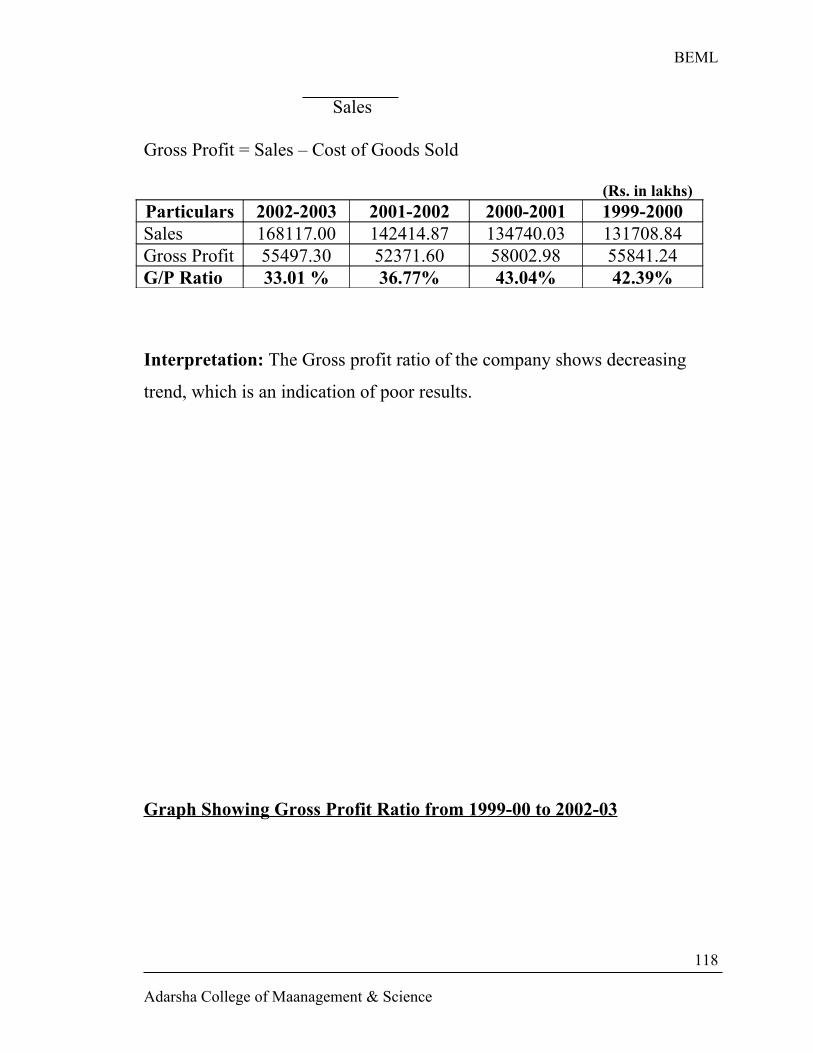
BEML
Sales
Gross Profit = Sales – Cost of Goods Sold
(Rs. in lakhs)Particulars 2002-2003 2001-2002 2000-2001 1999-2000Sales 168117.00 142414.87 134740.03 131708.84Gross Profit 55497.30 52371.60 58002.98 55841.24G/P Ratio 33.01 % 36.77% 43.04% 42.39%
Interpretation: The Gross profit ratio of the company shows decreasing
trend, which is an indication of poor results.
Graph Showing Gross Profit Ratio from 1999-00 to 2002-03
Adarsha College of Maanagement & Science
118
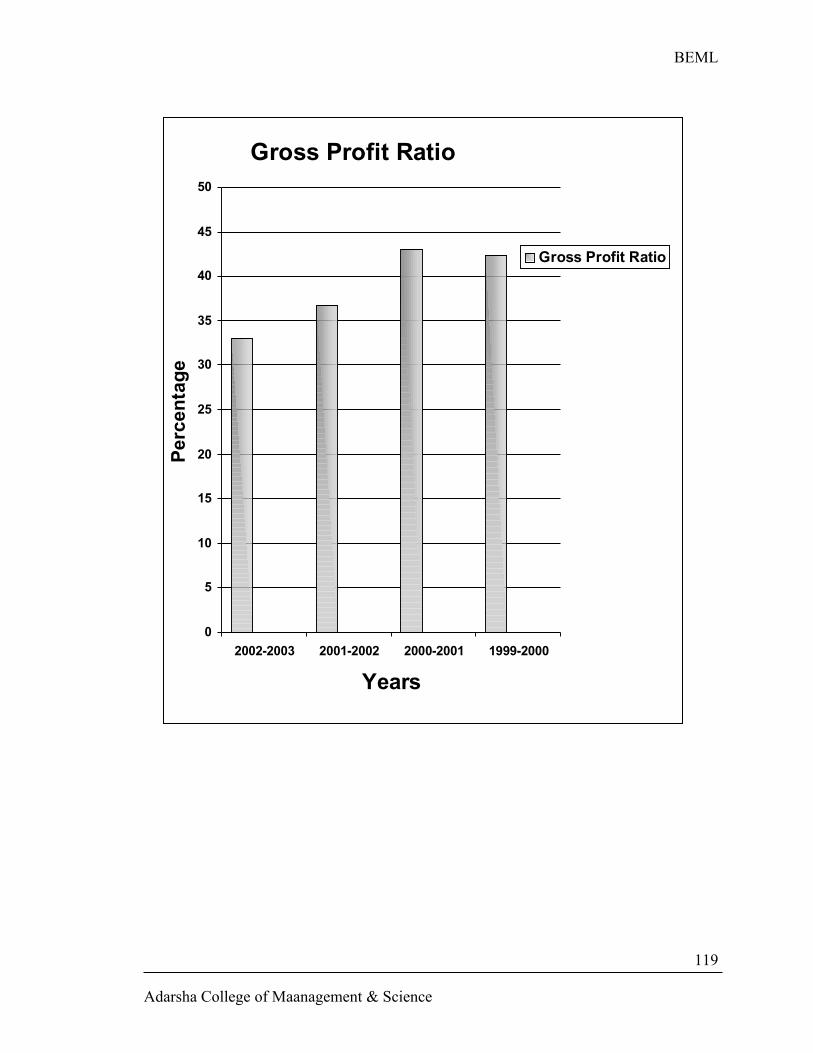
BEML
Gross Profit Ratio
0
5
10
15
20
25
30
35
40
45
50
2002-2003 2001-2002 2000-2001 1999-2000
Years
Per
cen
tag
e
Gross Profit Ratio
Adarsha College of Maanagement & Science
119
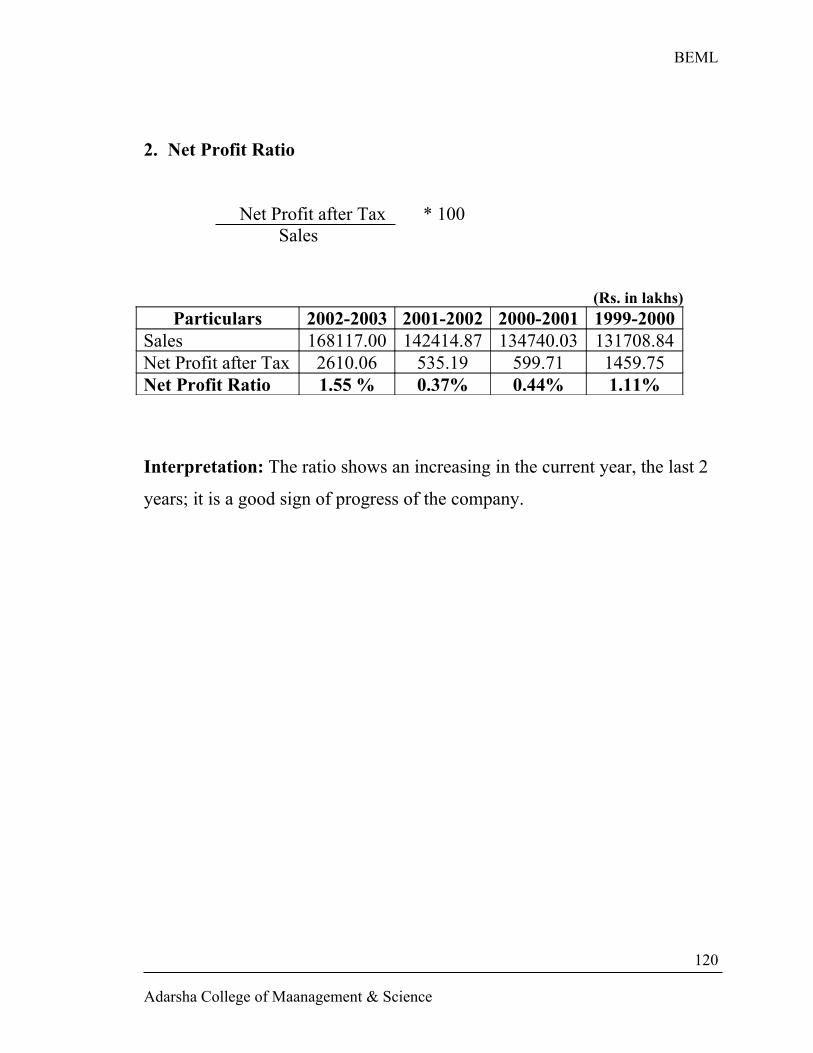
BEML
2. Net Profit Ratio
Net Profit after Tax * 100 Sales
(Rs. in lakhs)Particulars 2002-2003 2001-2002 2000-2001 1999-2000
Sales 168117.00 142414.87 134740.03 131708.84Net Profit after Tax 2610.06 535.19 599.71 1459.75Net Profit Ratio 1.55 % 0.37% 0.44% 1.11%
Interpretation: The ratio shows an increasing in the current year, the last 2
years; it is a good sign of progress of the company.
Adarsha College of Maanagement & Science
120
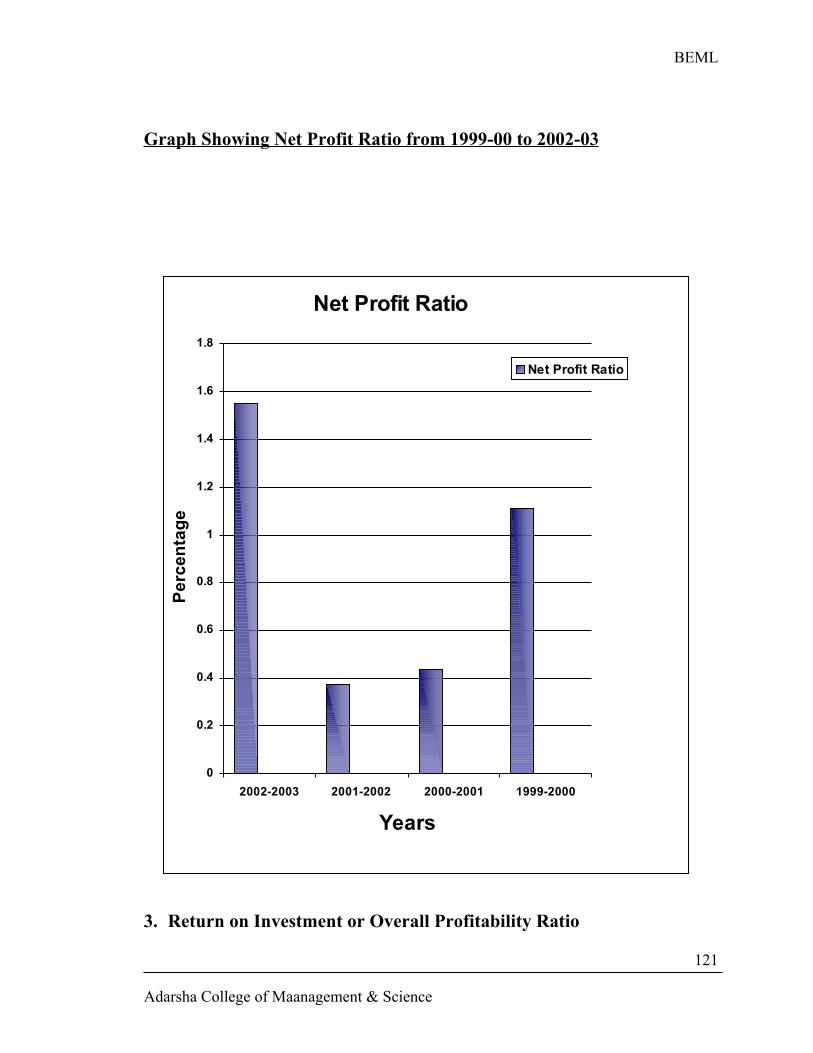
BEML
Graph Showing Net Profit Ratio from 1999-00 to 2002-03
Net Profit Ratio
0
0.2
0.4
0.6
0.8
1
1.2
1.4
1.6
1.8
2002-2003 2001-2002 2000-2001 1999-2000
Years
Pe
rce
nta
ge
Net Profit Ratio
3. Return on Investment or Overall Profitability Ratio
Adarsha College of Maanagement & Science
121
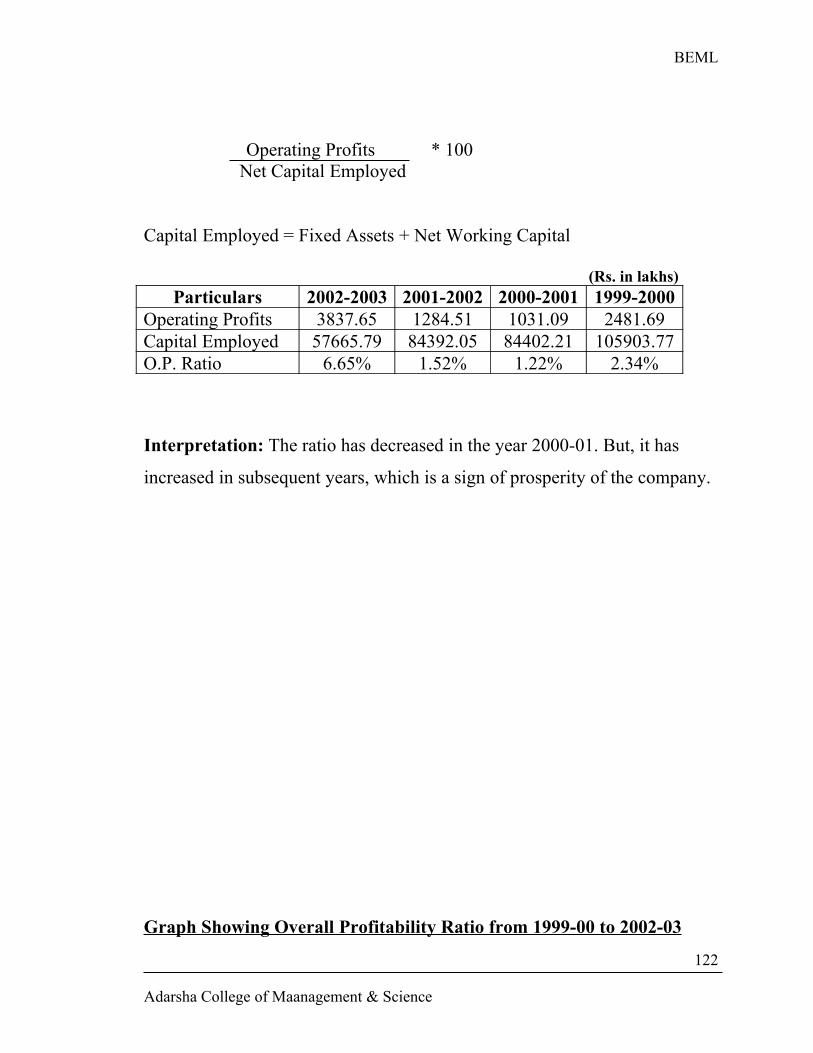
BEML
Operating Profits * 100Net Capital Employed
Capital Employed = Fixed Assets + Net Working Capital
(Rs. in lakhs)Particulars 2002-2003 2001-2002 2000-2001 1999-2000
Operating Profits 3837.65 1284.51 1031.09 2481.69Capital Employed 57665.79 84392.05 84402.21 105903.77O.P. Ratio 6.65% 1.52% 1.22% 2.34%
Interpretation: The ratio has decreased in the year 2000-01. But, it has
increased in subsequent years, which is a sign of prosperity of the company.
Graph Showing Overall Profitability Ratio from 1999-00 to 2002-03
Adarsha College of Maanagement & Science
122
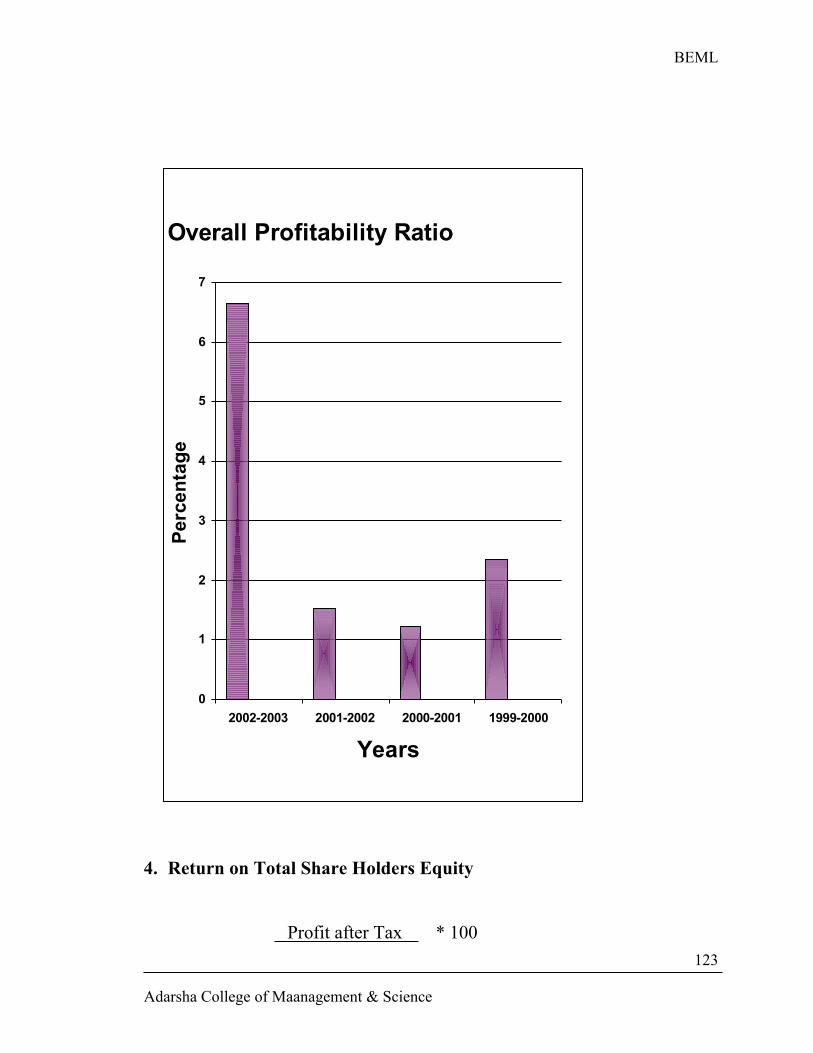
BEML
Overall Profitability Ratio
0
1
2
3
4
5
6
7
2002-2003 2001-2002 2000-2001 1999-2000
Years
Per
cen
tag
e
4. Return on Total Share Holders Equity
Profit after Tax * 100
Adarsha College of Maanagement & Science
123
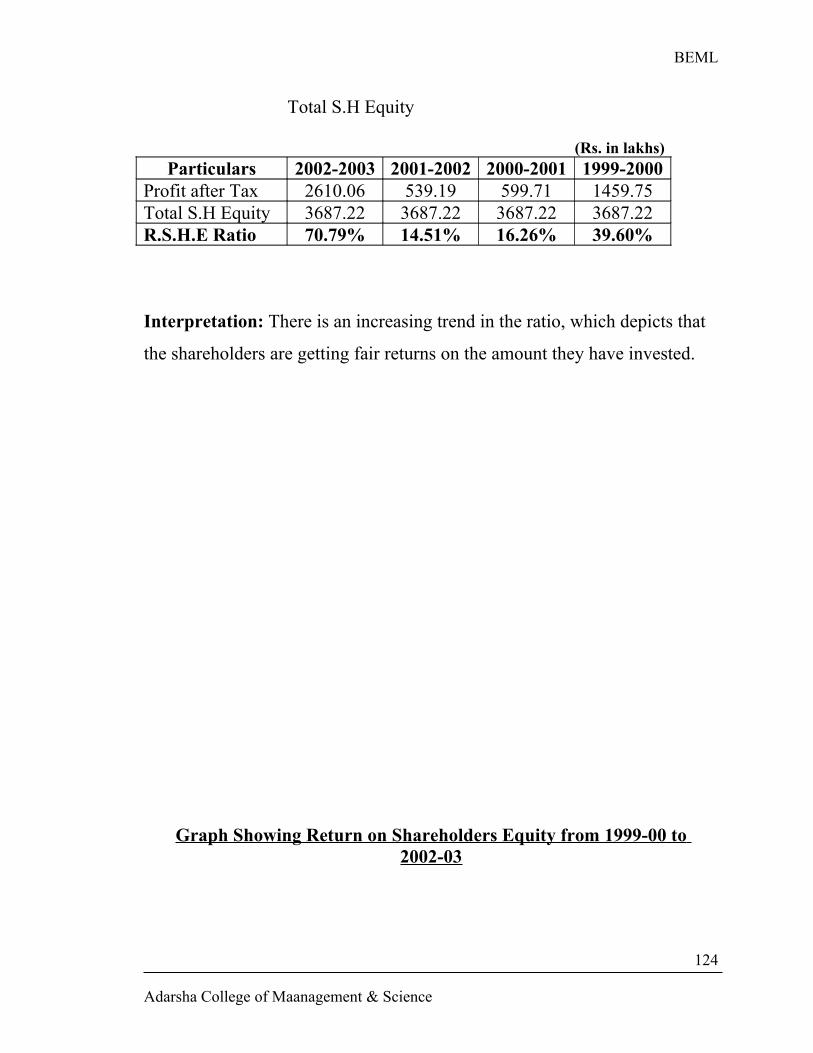
BEML
Total S.H Equity
(Rs. in lakhs) Particulars 2002-2003 2001-2002 2000-2001 1999-2000
Profit after Tax 2610.06 539.19 599.71 1459.75Total S.H Equity 3687.22 3687.22 3687.22 3687.22R.S.H.E Ratio 70.79% 14.51% 16.26% 39.60%
Interpretation: There is an increasing trend in the ratio, which depicts that
the shareholders are getting fair returns on the amount they have invested.
Graph Showing Return on Shareholders Equity from 1999-00 to 2002-03
Adarsha College of Maanagement & Science
124
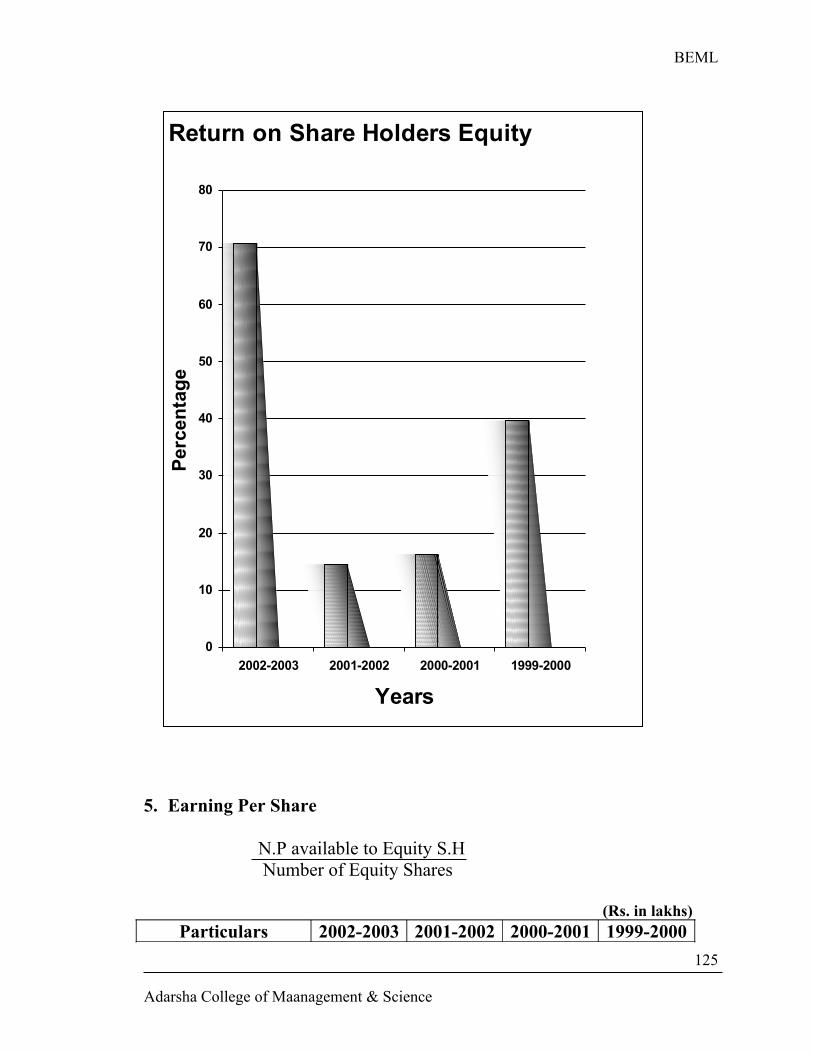
BEML
Return on Share Holders Equity
0
10
20
30
40
50
60
70
80
2002-2003 2001-2002 2000-2001 1999-2000
Years
Per
cen
tag
e
5. Earning Per Share
N.P available to Equity S.H Number of Equity Shares
(Rs. in lakhs)Particulars 2002-2003 2001-2002 2000-2001 1999-2000
Adarsha College of Maanagement & Science
125
BEML
Profit After Tax 2032.37 307.20 350.41 779.83No. of Equity Shares 367.445 367.445 367.445 367.445Earning Per Share Rs.5.53 Rs.0.836 Rs.0.953 Rs.2.12
Interpretation: The Earning per Share of the company has decreased
drastically in the years 2000-01 and 2001-02. But, it has gained its reback in
the year 2002-03, which is a good sign to the company.
Graph Showing Earning Per Share from 1999-00 to 2002-03
Adarsha College of Maanagement & Science
126
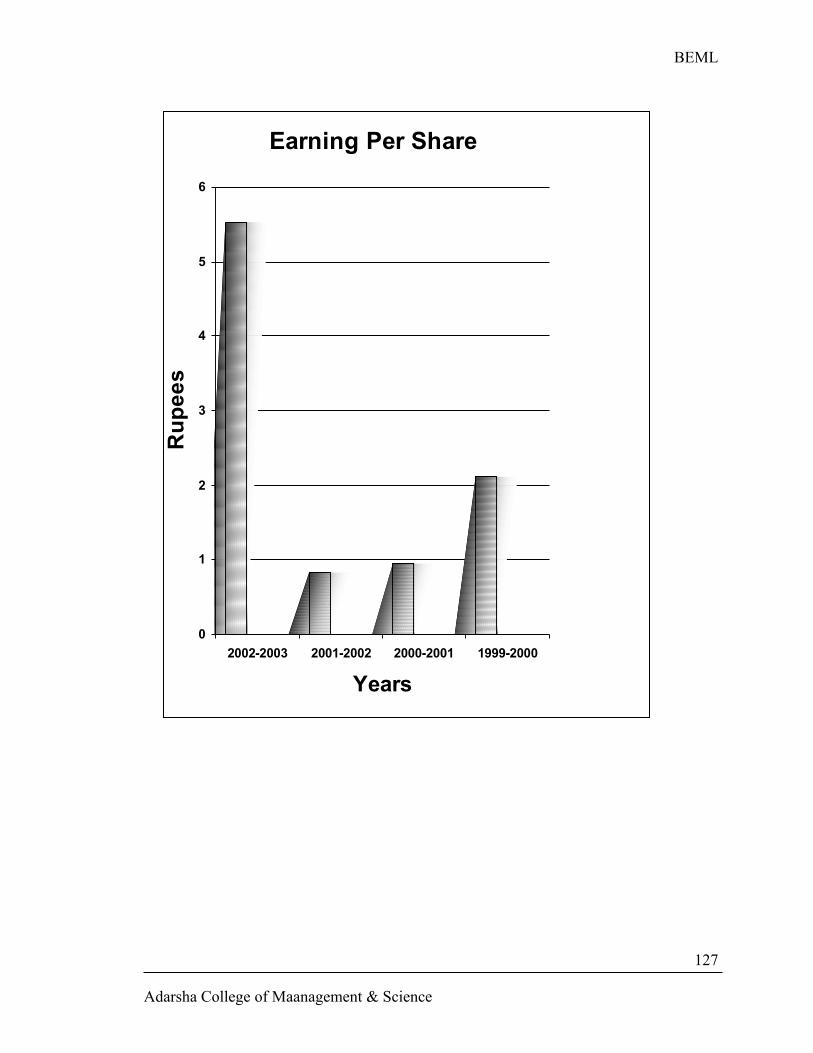
BEML
Earning Per Share
0
1
2
3
4
5
6
2002-2003 2001-2002 2000-2001 1999-2000
Years
Ru
pe
es
Adarsha College of Maanagement & Science
127
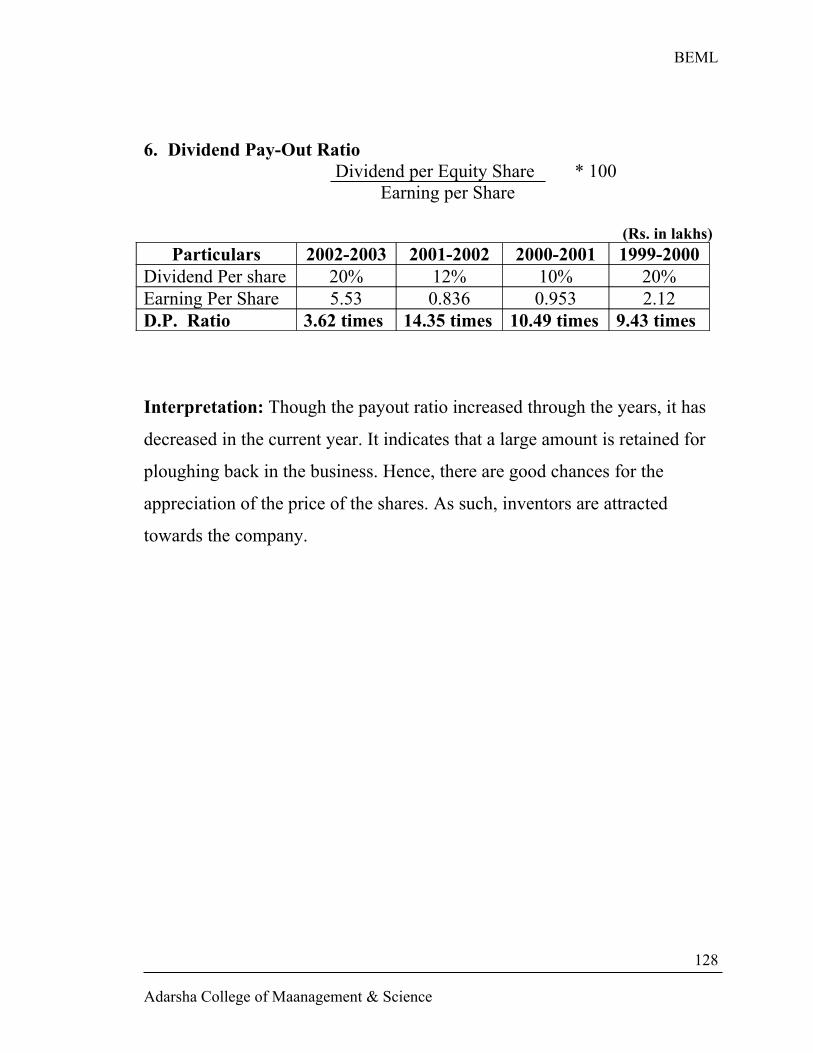
BEML
6. Dividend Pay-Out Ratio Dividend per Equity Share * 100
Earning per Share
(Rs. in lakhs)Particulars 2002-2003 2001-2002 2000-2001 1999-2000
Dividend Per share 20% 12% 10% 20%Earning Per Share 5.53 0.836 0.953 2.12D.P. Ratio 3.62 times 14.35 times 10.49 times 9.43 times
Interpretation: Though the payout ratio increased through the years, it has
decreased in the current year. It indicates that a large amount is retained for
ploughing back in the business. Hence, there are good chances for the
appreciation of the price of the shares. As such, inventors are attracted
towards the company.
Adarsha College of Maanagement & Science
128
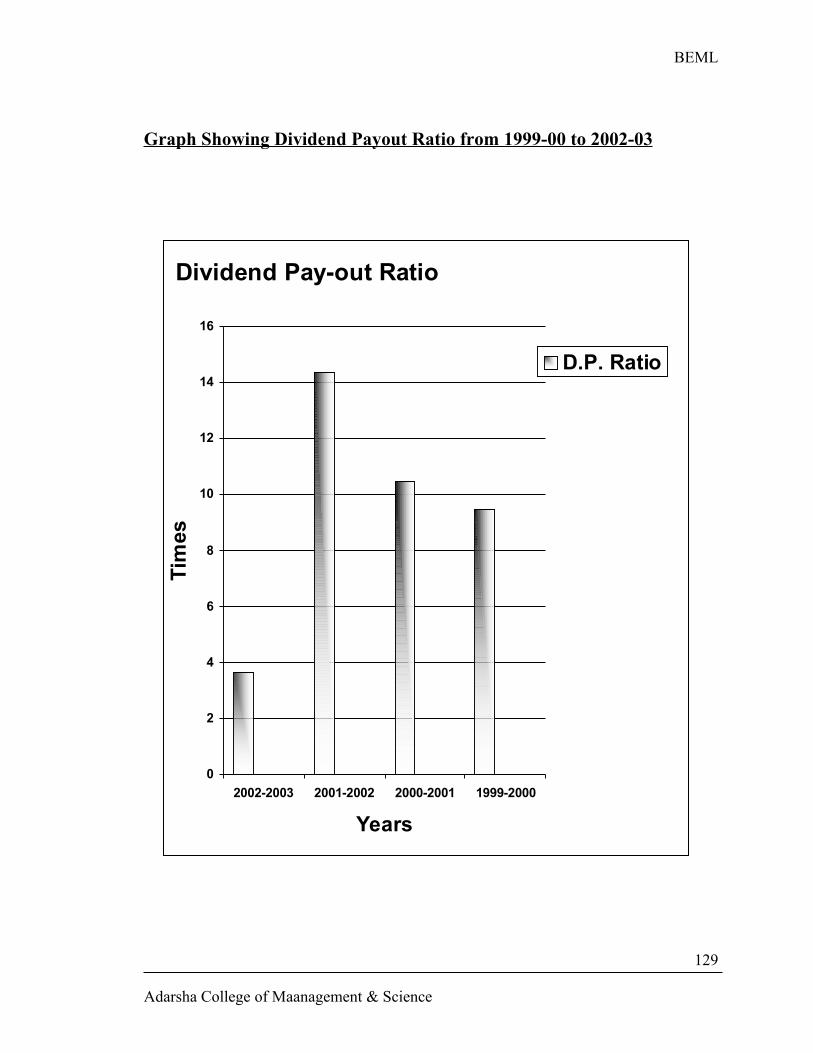
BEML
Graph Showing Dividend Payout Ratio from 1999-00 to 2002-03
Dividend Pay-out Ratio
0
2
4
6
8
10
12
14
16
2002-2003 2001-2002 2000-2001 1999-2000
Years
Tim
es
D.P. Ratio
Adarsha College of Maanagement & Science
129
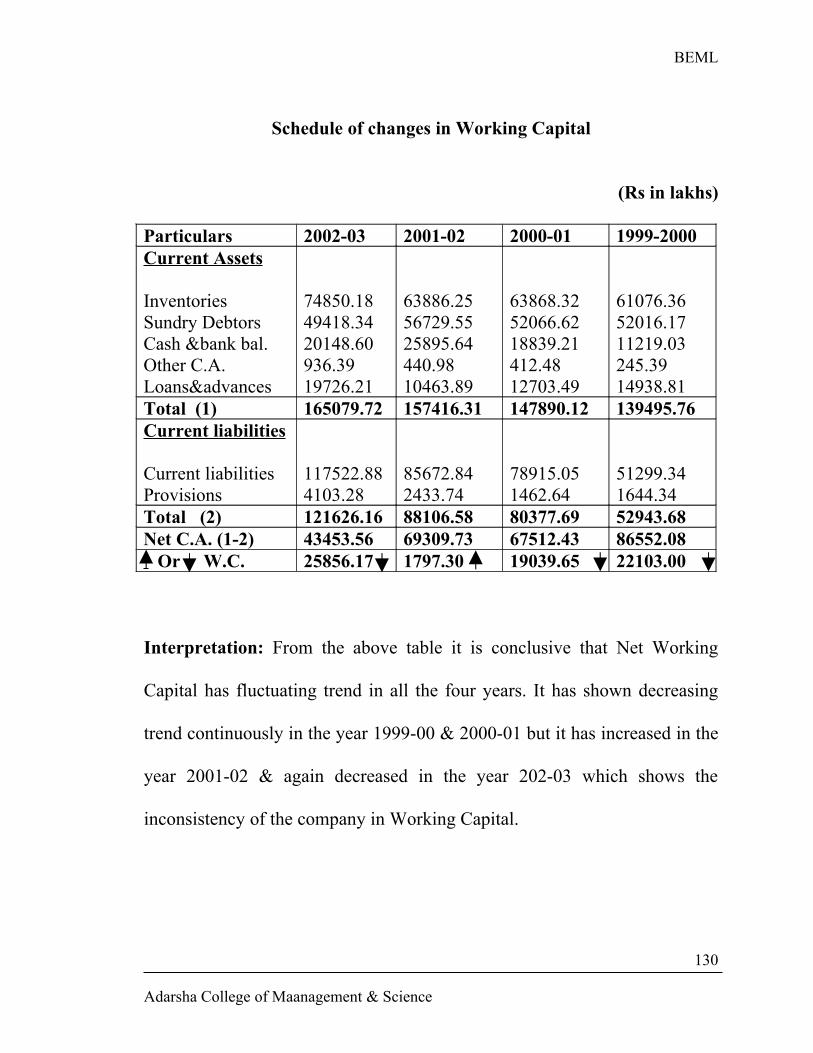
BEML
Schedule of changes in Working Capital
(Rs in lakhs)
Particulars 2002-03 2001-02 2000-01 1999-2000Current Assets
InventoriesSundry DebtorsCash &bank bal.Other C.A.Loans&advances
74850.1849418.3420148.60936.3919726.21
63886.2556729.5525895.64440.9810463.89
63868.3252066.6218839.21412.4812703.49
61076.3652016.1711219.03245.3914938.81
Total (1) 165079.72 157416.31 147890.12 139495.76Current liabilities
Current liabilitiesProvisions
117522.884103.28
85672.842433.74
78915.051462.64
51299.341644.34
Total (2) 121626.16 88106.58 80377.69 52943.68Net C.A. (1-2) 43453.56 69309.73 67512.43 86552.08 Or W.C. 25856.17 1797.30 19039.65 22103.00
Interpretation: From the above table it is conclusive that Net Working
Capital has fluctuating trend in all the four years. It has shown decreasing
trend continuously in the year 1999-00 & 2000-01 but it has increased in the
year 2001-02 & again decreased in the year 202-03 which shows the
inconsistency of the company in Working Capital.
Adarsha College of Maanagement & Science
130
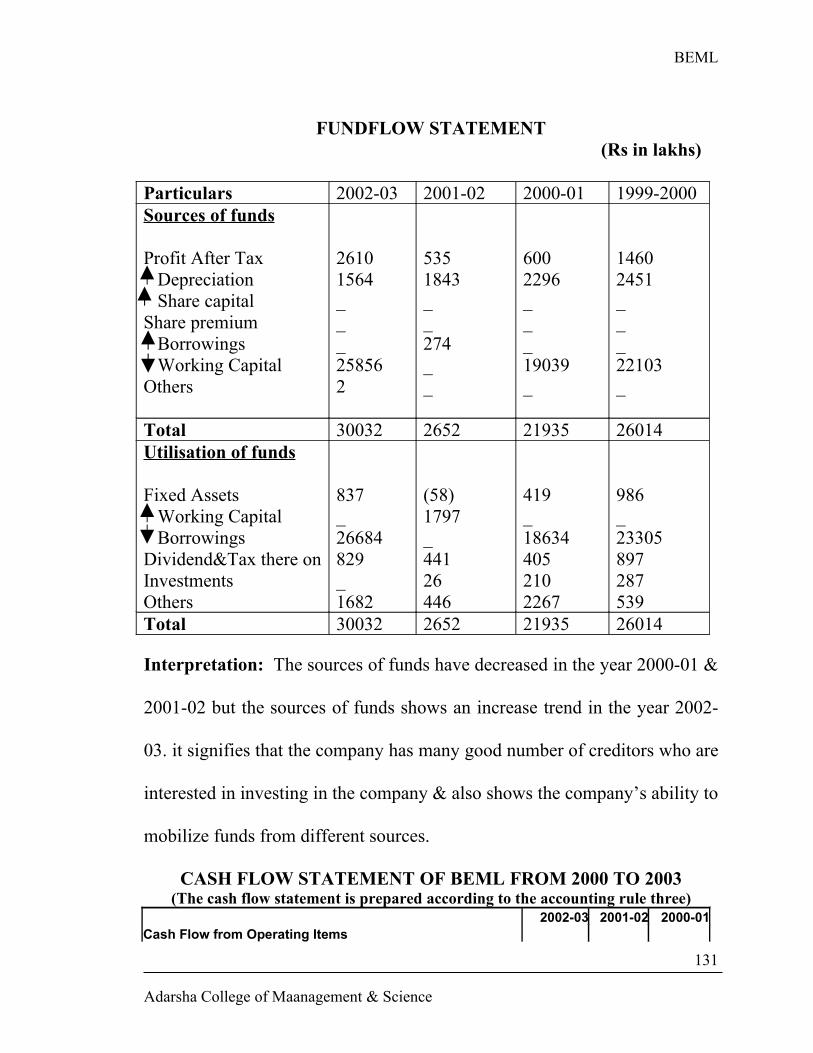
BEML
FUNDFLOW STATEMENT (Rs in lakhs)
Particulars 2002-03 2001-02 2000-01 1999-2000Sources of funds
Profit After Tax Depreciation Share capitalShare premium Borrowings Working CapitalOthers
26101564___258562
5351843__274__
6002296___19039_
14602451___22103_
Total 30032 2652 21935 26014Utilisation of funds
Fixed Assets Working Capital BorrowingsDividend&Tax there onInvestmentsOthers
837_26684829_1682
(58)1797_44126446
419_186344052102267
986_23305897287539
Total 30032 2652 21935 26014
Interpretation: The sources of funds have decreased in the year 2000-01 &
2001-02 but the sources of funds shows an increase trend in the year 2002-
03. it signifies that the company has many good number of creditors who are
interested in investing in the company & also shows the company’s ability to
mobilize funds from different sources.
CASH FLOW STATEMENT OF BEML FROM 2000 TO 2003(The cash flow statement is prepared according to the accounting rule three)
2002-03 2001-02 2000-01Cash Flow from Operating Items
Adarsha College of Maanagement & Science
131
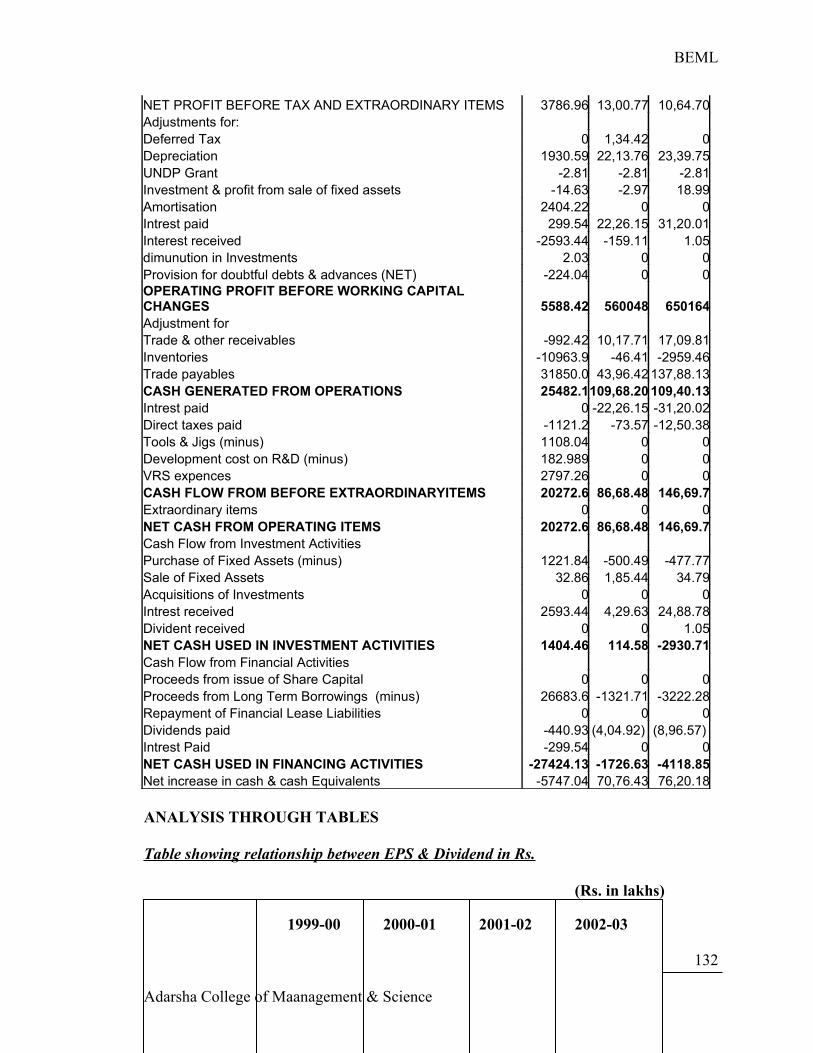
BEML
NET PROFIT BEFORE TAX AND EXTRAORDINARY ITEMS 3786.96 13,00.77 10,64.70Adjustments for: Deferred Tax 0 1,34.42 0Depreciation 1930.59 22,13.76 23,39.75UNDP Grant -2.81 -2.81 -2.81Investment & profit from sale of fixed assets -14.63 -2.97 18.99Amortisation 2404.22 0 0Intrest paid 299.54 22,26.15 31,20.01Interest received -2593.44 -159.11 1.05dimunution in Investments 2.03 0 0Provision for doubtful debts & advances (NET) -224.04 0 0OPERATING PROFIT BEFORE WORKING CAPITAL CHANGES 5588.42 560048 650164Adjustment for Trade & other receivables -992.42 10,17.71 17,09.81Inventories -10963.9 -46.41 -2959.46Trade payables 31850.0 43,96.42 137,88.13CASH GENERATED FROM OPERATIONS 25482.1109,68.20 109,40.13Intrest paid 0 -22,26.15 -31,20.02Direct taxes paid -1121.2 -73.57 -12,50.38Tools & Jigs (minus) 1108.04 0 0Development cost on R&D (minus) 182.989 0 0VRS expences 2797.26 0 0CASH FLOW FROM BEFORE EXTRAORDINARYITEMS 20272.6 86,68.48 146,69.7Extraordinary items 0 0 0NET CASH FROM OPERATING ITEMS 20272.6 86,68.48 146,69.7Cash Flow from Investment Activities Purchase of Fixed Assets (minus) 1221.84 -500.49 -477.77Sale of Fixed Assets 32.86 1,85.44 34.79Acquisitions of Investments 0 0 0Intrest received 2593.44 4,29.63 24,88.78Divident received 0 0 1.05NET CASH USED IN INVESTMENT ACTIVITIES 1404.46 114.58 -2930.71Cash Flow from Financial Activities Proceeds from issue of Share Capital 0 0 0Proceeds from Long Term Borrowings (minus) 26683.6 -1321.71 -3222.28Repayment of Financial Lease Liabilities 0 0 0Dividends paid -440.93 (4,04.92) (8,96.57) Intrest Paid -299.54 0 0NET CASH USED IN FINANCING ACTIVITIES -27424.13 -1726.63 -4118.85Net increase in cash & cash Equivalents -5747.04 70,76.43 76,20.18
ANALYSIS THROUGH TABLES
Table showing relationship between EPS & Dividend in Rs.
(Rs. in lakhs)
1999-00 2000-01 2001-02 2002-03
Adarsha College of Maanagement & Science
132
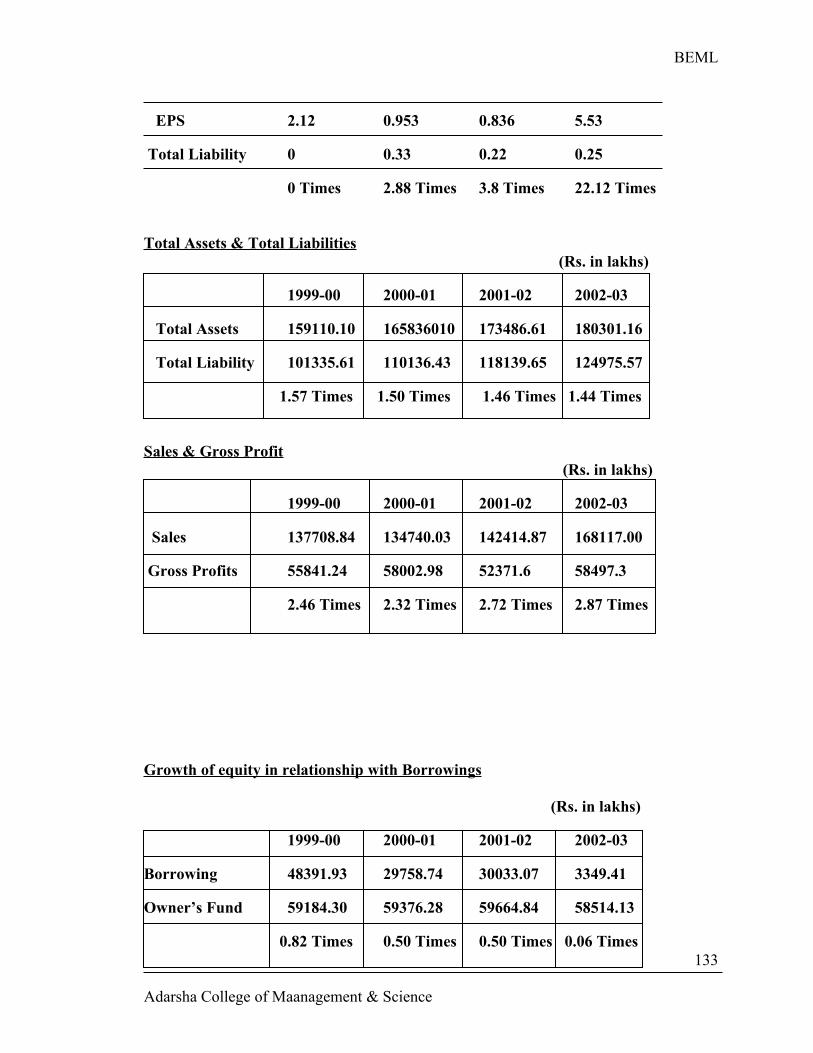
BEML
EPS 2.12 0.953 0.836 5.53
Total Liability 0 0.33 0.22 0.25
0 Times 2.88 Times 3.8 Times 22.12 Times
Total Assets & Total Liabilities (Rs. in lakhs)
1999-00 2000-01 2001-02 2002-03
Total Assets 159110.10 165836010 173486.61 180301.16
Total Liability 101335.61 110136.43 118139.65 124975.57
1.57 Times 1.50 Times 1.46 Times 1.44 Times
Sales & Gross Profit (Rs. in lakhs)
1999-00 2000-01 2001-02 2002-03
Sales 137708.84 134740.03 142414.87 168117.00
Gross Profits 55841.24 58002.98 52371.6 58497.3
2.46 Times 2.32 Times 2.72 Times 2.87 Times
Growth of equity in relationship with Borrowings
(Rs. in lakhs)
1999-00 2000-01 2001-02 2002-03
Borrowing 48391.93 29758.74 30033.07 3349.41
Owner’s Fund 59184.30 59376.28 59664.84 58514.13
0.82 Times 0.50 Times 0.50 Times 0.06 Times
Adarsha College of Maanagement & Science
133
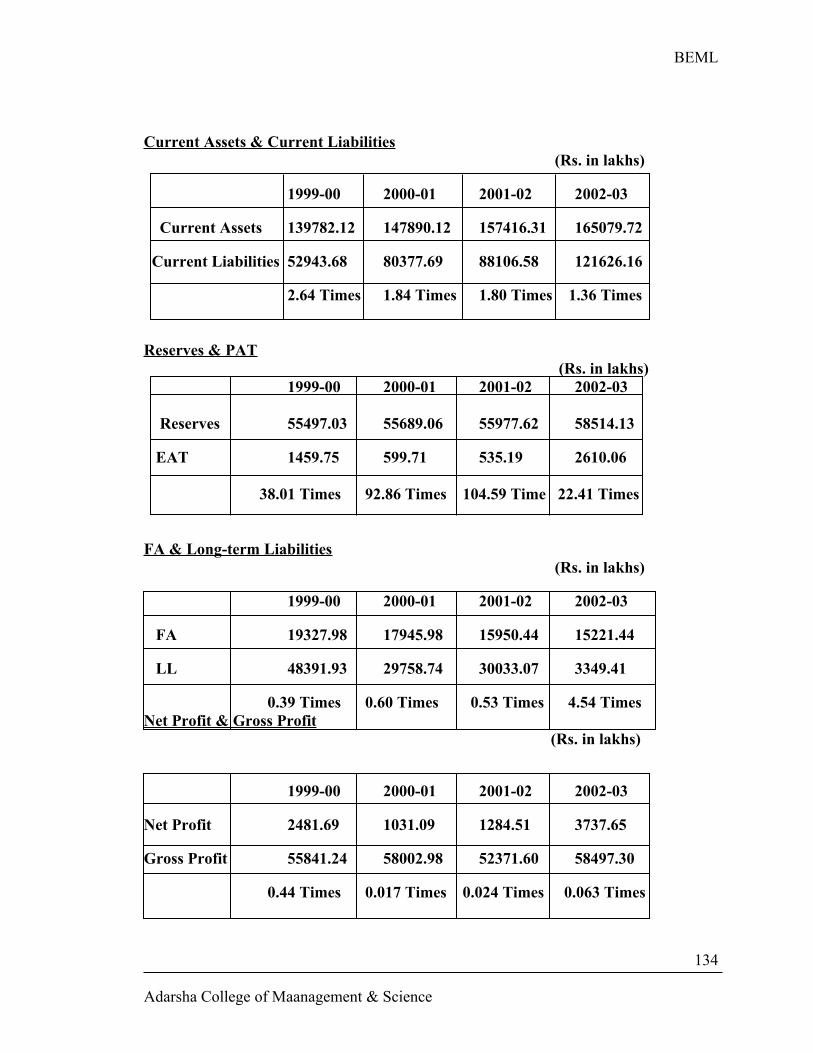
BEML
Current Assets & Current Liabilities (Rs. in lakhs)
1999-00 2000-01 2001-02 2002-03
Current Assets 139782.12 147890.12 157416.31 165079.72
Current Liabilities 52943.68 80377.69 88106.58 121626.16
2.64 Times 1.84 Times 1.80 Times 1.36 Times
Reserves & PAT (Rs. in lakhs)
1999-00 2000-01 2001-02 2002-03
Reserves 55497.03 55689.06 55977.62 58514.13
EAT 1459.75 599.71 535.19 2610.06
38.01 Times 92.86 Times 104.59 Time 22.41 Times
FA & Long-term Liabilities (Rs. in lakhs)
1999-00 2000-01 2001-02 2002-03
FA 19327.98 17945.98 15950.44 15221.44
LL 48391.93 29758.74 30033.07 3349.41
0.39 Times 0.60 Times 0.53 Times 4.54 TimesNet Profit & Gross Profit
(Rs. in lakhs)
1999-00 2000-01 2001-02 2002-03
Net Profit 2481.69 1031.09 1284.51 3737.65
Gross Profit 55841.24 58002.98 52371.60 58497.30
0.44 Times 0.017 Times 0.024 Times 0.063 Times
Adarsha College of Maanagement & Science
134
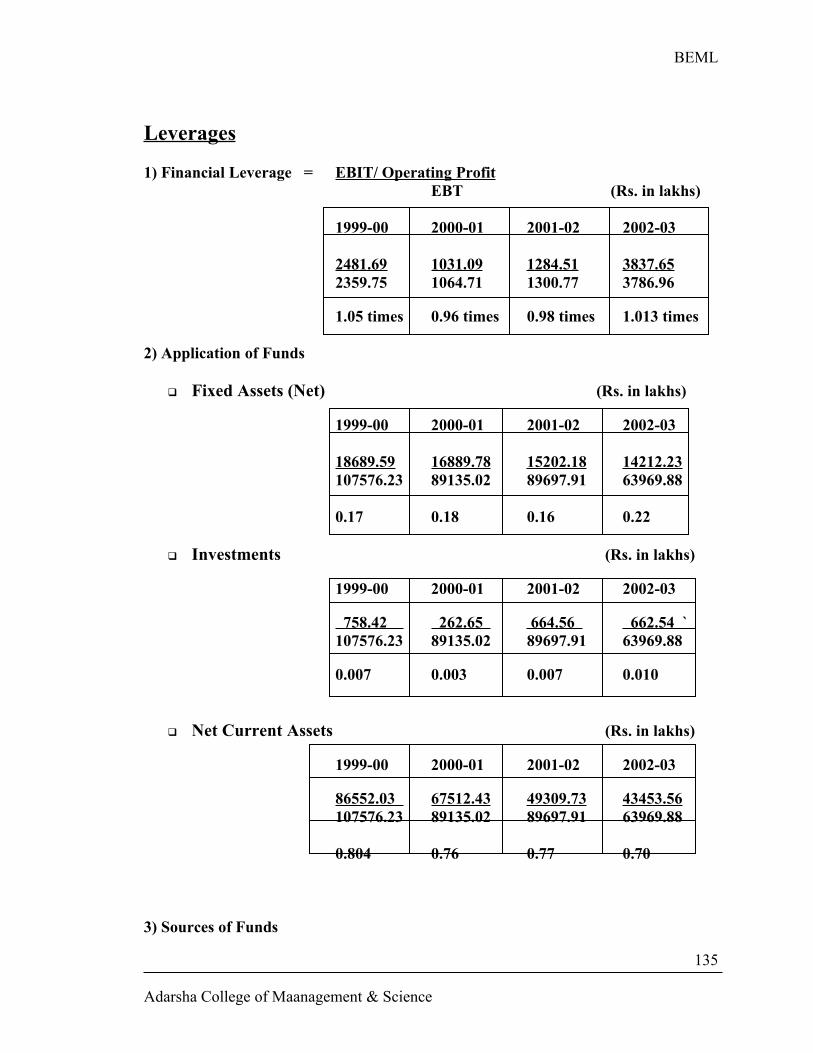
BEML
Leverages
1) Financial Leverage = EBIT/ Operating ProfitEBT (Rs. in lakhs)
1999-00 2000-01 2001-02 2002-03
2481.69 1031.09 1284.51 3837.652359.75 1064.71 1300.77 3786.96
1.05 times 0.96 times 0.98 times 1.013 times
2) Application of Funds
Fixed Assets (Net) (Rs. in lakhs)
1999-00 2000-01 2001-02 2002-03
18689.59 16889.78 15202.18 14212.23107576.23 89135.02 89697.91 63969.88
0.17 0.18 0.16 0.22
Investments (Rs. in lakhs)
1999-00 2000-01 2001-02 2002-03
758.42 262.65 664.56 662.54 ` 107576.23 89135.02 89697.91 63969.88
0.007 0.003 0.007 0.010
Net Current Assets (Rs. in lakhs)
1999-00 2000-01 2001-02 2002-03
86552.03 67512.43 49309.73 43453.56107576.23 89135.02 89697.91 63969.88
0.804 0.76 0.77 0.70
3) Sources of Funds
Adarsha College of Maanagement & Science
135
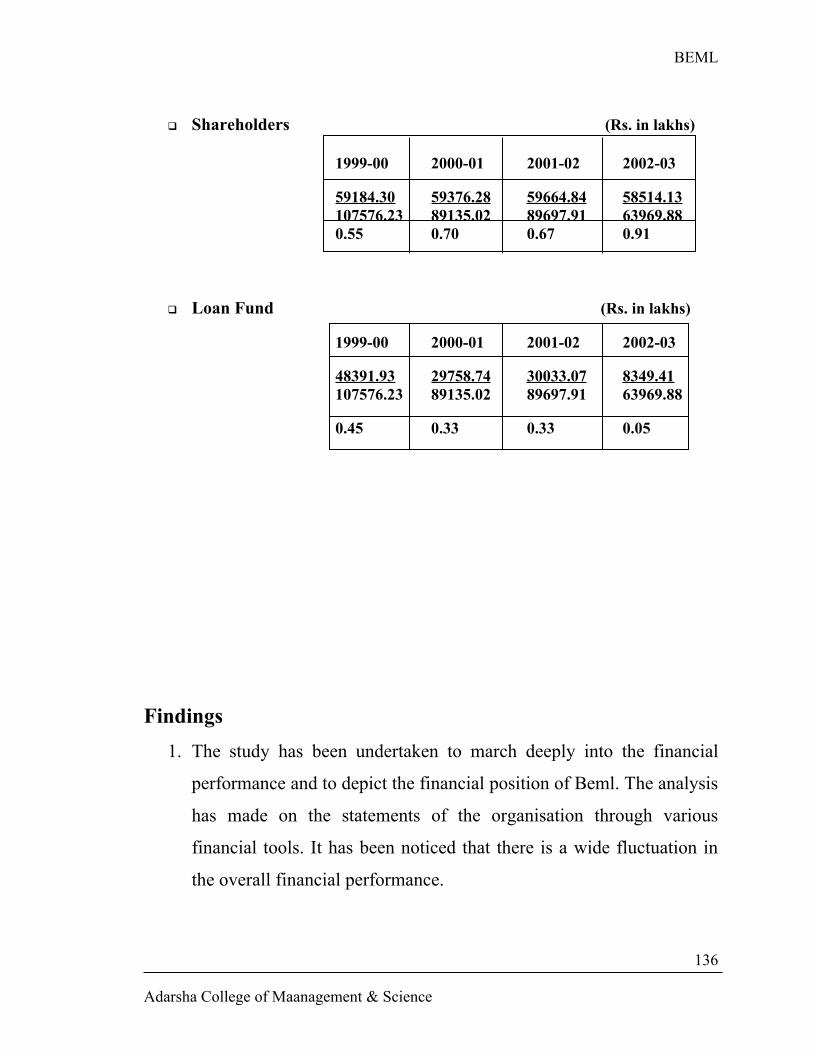
BEML
Shareholders (Rs. in lakhs)
1999-00 2000-01 2001-02 2002-03
59184.30 59376.28 59664.84 58514.13107576.23 89135.02 89697.91 63969.880.55 0.70 0.67 0.91
Loan Fund (Rs. in lakhs)
1999-00 2000-01 2001-02 2002-03
48391.93 29758.74 30033.07 8349.41107576.23 89135.02 89697.91 63969.88
0.45 0.33 0.33 0.05
Findings
1. The study has been undertaken to march deeply into the financial
performance and to depict the financial position of Beml. The analysis
has made on the statements of the organisation through various
financial tools. It has been noticed that there is a wide fluctuation in
the overall financial performance.
Adarsha College of Maanagement & Science
136
BEML
2. There is an increasing trend in Reserves and Surplus up to the year
2001-02. But, in the year 2002-03, Reserves and Surplus has been
decreased due to withdrawal from the general reserves for the creation
of deferred tax liability. Share capital remains same.
3. Long- term loan funds have decreased in the year 2002-03 and even
from last 4 years.
4. The investment in fixed assets has shown the decreasing trend from
year to year. The company has enough fixed assets and installments.
Thus the company has reduced investing in fixed assets.
5. The trend in current assets is been increasing from year to year. This
may be due to increase in production volume or due to increase in the
cost of raw materials and supplies.
6. The current liabilities has increased through the years, which is not a
good sign to the company, it has to take measures to decrease
operating costs.
7. Though the current liabilities have increased, the level of net current
assets is showing a decreasing trend, which is a noticeable factor.
8. The sales have increased tremendously through the years, which
concludes that the products produced by the company are finding a
good market in the industry. The overall income level of the company
shows an increase trend, which shows company’s progress.
9. The CGS shows an increasing trend may be balance of the extra
production activities took by the company.
10.Depreciation shows a decreasing trend, which is a good sign, which
shows the effective maintenance of assets by the company.
Adarsha College of Maanagement & Science
137
BEML
11.EPS shows a steady increase from year to year, which lied in the
favour of the company.
12.Dividend declared by the company has increased to 20% in the year
from 12% when compared to previous year.
13.The level of general reserve has decreased in the years 2000-01 and
2001-02 steadily. But, the company’s general reserve raised in the
year 2002-03, which shows the profitability of the company.
14.Though the level of general reserve has increased, even the reserve for
proposed divided also increased which shows the company’s ability to
pay fair returns to its members (shareholders).
15.It is evidentiary through ratio analysis that the current ratio of the
company is not in favour of the company. There has been a drastic
decrease in the ratio through the years.
16.The company is utilizing its fixed assets to the optimum extent, which
is evidentiary in fixed asset turnover ratio.
17.The company’s investment in fixed assets has decreased when
compared to the investment in current assets, due to increase in
production level.
18.There has been a drastic increase in the inventory coverage ratio,
which implies greater security to the debtors.
19.The inventory coverage ratio has increased tremendously in the year,
which is a good sign towards shareholders of the company.
20. There is a steady increase in the Net profit of the company, which
shows the profitability position of the company.
Adarsha College of Maanagement & Science
138
BEML
LIMITATIONS
Nothing is “Complete” in this world except the divinity. As such, though the
study provides the relevant information, still it suffers from inherent
limitations.
Adarsha College of Maanagement & Science
139
BEML
1. The study is done only for the limited past 4 years, due to the time
constraints for the job of project work.
2. The study does not reveal complete and accurate data though it
stresses on objectives of accuracy.
3. The study is fully evident and based on the monetary information
provided by the organisation.
4. The data mainly has been collected from secondary sources and less
chances to gather primary information due to time constraints.
5. Again, due to lack of time, all the ratios are not calculated for the
analysis purpose.
6. The study does not consider the changes in the price level, which
alters the analysis accuracy.
7. Some information related to the financial aspects is not revealed by
the company and is kept confidential.
8. Time allotted by the company for the study was very limited, within
which, the collection of data was not possible.
9. Accounting concepts and conventions, such as going concern concept
used as basis to prepare the financial statement themselves are
bounded by limitations.
10.The study is entirely based on the book values specified in position
and income statements. Market values are ignored.
11.Changes in accounting procedures by the firm may be misleading and
confusing.
12.Personal contact with officials was not possible due to busy schedules.
13.It is the only study of interim reports
Adarsha College of Maanagement & Science
140
BEML
14.Because of time constraints, a deep study into the financial aspects
was not possible.
SUGGESTIONS AND RECOMMENDATIONS
By the analysis and interpretation of financial statements of BEML, the
following suggestions can be put forth:
Adarsha College of Maanagement & Science
141
BEML
1. The current liability position should be maintained to cope with
efficient management of the outside liabilities.
2. It has seen that the current ratio has been decreased from year to year,
which is not in favour of the company, and it may hamper the credit
worthiness of the company.
3. The investment in current assets should be managed optimum the
level of production. Surplus current assets can be deployed in long
term investments to have profitable rebacks.
4. The loan funds can be employed wherever necessary to trade on
equity. The loans should be used carefully.
5. The company should strive to manage the cost of goods sold, though
it increases with the increase in production and due to changes in price
levels of inputs the company should try to minimize the costs to have
efficient control over costs.
6. The company should use the shareholders funds effectively, instead of
going for loans.
7. The company should try to decrease its total liabilities.
8. The operating expenses should be minimized to the possible extent
with efficient budgetary control.
9. The cost of the production should be controlled, which otherwise
decreases the gross profit level.
10.Investments should not be blocked in non-productive projects, instead
should be used efficiently.
11.Maximum funds are transferred to reserves, their amounts should be
used for the improvement of the business activities and for
diversification.
Adarsha College of Maanagement & Science
142
BEML
12.The company should strive to decrease the depreciation charges by
maintaining the assets properly.
13.The company should take better cash management techniques to
improve its liquidity position.
14.Simple techniques and procedures of accounting should be used by
the company, so that every member of the company can understand
the procedures properly.
15.Better inspection and control techniques should be adopted to
minimize the scrap in production, so that, the cost of production can
be reduced.
16.The company should go for economic purchasing to reduce costs of
production and sold goods.
17.The company should try to avoid the idle time both in administrative
and production departments.
18.The company may increase long-term borrowings from economic
sources, which can be used of productive purposes.
19.The company should strive to meet its current liabilities from current
assets only.
Conclusion
Bharat Earth Moving Limited is acting as pioneer in the market of earth
moving equipments. The company has grown progressively and shown
Adarsha College of Maanagement & Science
143
BEML
tremendous profits since from its inception regardless to the state of
economy.
The company has spread its roots and branches to all over India. It has the
capability to go for globalization, on which the company should think.
The company produces on order basis only. It should find other customers
than government sectors, as the company is having a fair market position in
the industry.
The company is maintaining only one subsidiary small company. As it has
grown into a well-rooted tree, it can give shelter to many small industries,
which hikes the growth of the company.
The company maintains well-trained, qualified employees, which is a big
asset to the company.
The company, though tails in minor factors, is really performing very well
earning good profits. The company has never incurred loss, which is a sign
of prosperous business conditions maintained by the company.
To conclude the company is the leader in the market producing highly
qualitative goods and earning very good profits and thus, attracting the
investors.
Adarsha College of Maanagement & Science
144


![[Fix] Print Out](https://img.pdfslide.net/doc/110x75/577c7f251a28abe054a36348/fix-print-out.jpg)