Embed Size (px)
Citation preview

Reinforced Concrete Design by ELPLA
-134-
Example 5: Comparison between flat and ribbed rafts
1 Description of the problem
A ribbed raft may be used where the distance between columns is so great that a flat raft requires
excessive depth, with resulting high bending moments. Consequently, the volume of concrete is
reduced. A ribbed raft consists of a stiffened slab by girders in x- and y-directions. The girders
on the raft may be either down or up the slab. Ribbed rafts can be used for many structures when
a flat level for the first floor is not required. Such structures are silos, elevated tanks and various
other possible structures. Although this type of foundation has many disadvantages if used in
normally buildings, still is used by many designers. Such disadvantages are: the raft needs deep
foundation level under the ground surface, fill material on the raft to make a flat level. In
addition, a slab on the fill material is required to be constructed for the first floor. The use of the
ribbed raft relates to its simplicity in analysis by traditional manners or hand calculations,
particularly, if the columns are arranged in lines. The ribbed raft generally leads to less concrete
quantity than the flat raft, especially if the columns have heavy loads and large spans.
In this example two types of rafts, flat and ribbed rafts, are considered as shown in Figure 49
The length of each raft is L = 14.3 [m] while the width is B = 28.3 [m]. Each raft carries 15
column loads and a brick wall load of p = 30 [kN/ m] at its edges. Width of ribs is chosen to be
bw = 0.30 [m] equal to the minimum side of columns, while the height of ribs including the slab
thickness is chosen to be hw + hf = 1.0 [m]. Column dimensions, reinforcement and loads are
shown in Table 52. A thin plain concrete of thickness 0.20 [m] is chosen under the raft and is not
considered in any calculation.
Table 52 Column models, loads, dimensions and reinforcement
Column
Load [kN] Dimensions [m × m]
Reinforcement
Model C1
781
0.30 × 0.30
6 Φ 16
Model C2
1562
0.30 × 0.70
4 Φ 16 + 4 Φ 19
Model C3
3124
0.30 × 1.40
6 Φ 22 + 6 Φ 19
Two analyses are carried out to compare between the two structural systems of rafts. In the
analyses, the Continuum model is used to represent the subsoil. The two cases of analyses are
considered as follows:
- Flat raft for optimal raft thickness
- Ribbed raft for optimal slab thickness

Reinforced Concrete Design by ELPLA
-135-
Figure 49 a) Plan of rafts and dimensions
b) Section through the rafts
Flat raft
7.0 [m] 7.0 [m]
Ribbed raft
7.0 [m] 7.0 [m]
Section x-x
0.3 [m]
x x
0.3 [m]
Girders
b)
df dr a)
C2
C3 C2
C2 C1
C3 C2
C3 C2
C2 C1
C3
14.30 [m] 14.30 [m]
7.0
[m
] 7.0
[m
] 7.0
[m
] 7.0
[m
]
28.3
0 [
m]
1.0
[m
]

Reinforced Concrete Design by ELPLA
-136-
2 Properties of the raft material
The material of rafts is reinforcement concrete that has the following parameters:
Young's modulus of concrete Eb = 3.2 × 10⁷ [kN/ m2]
Poisson's ratio of concrete νb = 0.20 [-]
Shear modulus of concrete Gb = 0.5 Eb (1 + νb) = 1.3 × 10⁷ [kN/ m2]
Unit weight of concrete γb = 25 [kN/ m3]
3 Soil properties
The rafts rest on three soil layers consisting of silty sand, silt and clay, respectively. A rigid base
of sandstone is found under the clay layer. Figure 50 shows soil layers under rafts while Table
53 shows the soil parameters. Poisson's ratio is constant for all soil layers. The effect of
reloading of the soil and limit depth of the soil layers are taken into account. The general soil
parameters are:
Poisson's ratio νs = 0.30 [-]
Level of foundation depth under the ground surface df = 2.50 [m]
Level of water table under the ground surface GW = 2.20 [m]
Table 53 Soil properties Layer
No.
I
Type of
soil
Depth of
layer under
the ground
surface
z [m]
Modulus of compressibility
of the soil for
Unit weight
above
ground water
γs [kN/ m3]
Unit weight
under
ground
water
γ's [kN/ m3]
Loading
Es [kN/ m2]
Reloading
Ws [kN/ m2]
1
Silty sand
4.00
60 000
150 000
19
11
2
Silt
6.00
10 000
20 000
-
8
3
Clay
20.0
5 000
10 000
-
9

Reinforced Concrete Design by ELPLA
-137-
Figure 50 Soil layers and soil parameters under rafts
Clay
(0.00)
GW (2.50)
(20.00)
(6.00)
(4.00)
Silt
Silt Silty sand
Silty sand
Clay
(2.20)
Poisson's ratio νs = 0.3
Sandstone
Es = 60 000 [kN/m2]
Ws = 150 000 [kN/m2]
γs = 19 [kN/m3]
γ`s = 11 [kN/m3]
Es = 10 000 [kN/m2]
Ws = 20 000 [kN/m2]
γ`s = 8 [kN/m3]
Es = 5 000 [kN/m2]
Ws = 10 000 [kN/m2]
γ`s = 9 [kN/m3]

Reinforced Concrete Design by ELPLA
-138-
4 Analysis of the raft
4.1 Modeling of ribs
For modeling of ribs, different possibilities can be applied as follows:
i) The raft is analyzed first separately by considering the ribs as non-displaceable or elastic
line supports. Then, the obtained support reactions apply to equivalent girders. This
mathematical model supposes that the rib has more significant stiffness than that of the
raft. In this case, a linear contact pressure under the raft may be assumed in the analysis
(Conventional method 1), where the interaction between the raft and the subsoil is not
taken into account
ii) Using a combination of two types of finite elements representing the system of a ribbed
raft. The raft is represented by plate bending elements according to the two-dimensional
nature of the raft. Beam elements are used to represent the rib action along the raft
iii) Using a thicker line of plate elements representing the rib action along the raft. Then, for
design of the rib, the required internal forces are determined from the plate element
results. This model is reasonable for a wide rib
iv) Using a three-dimensional shell model of block elements with six degrees of freedom at
each node to represent the rib and raft together. This model gives an exact representation
of the rib behavior but it is complicated
In this example the analysis of the ribbed raft is carried out using a combination of plate and
beam elements. Figure 51 shows FE-Nets of flat and ribbed rafts. Each raft is subdivided into
312 plate elements. For the ribbed raft, the ribs are considered through inserting additional 138
beam elements along the location of the ribs on the FE-Net.

Reinforced Concrete Design by ELPLA
-139-
b)
P1
7.0 [m] 7.0 [m]
P1 = 781P2 = 1562P3 = 3124p = 12
[kN][kN][kN][kN/m]
P3
P2
P1 P1
P1
P2
P2
P2
P2 P2
P2
P2
P3
P3
p
p
a)
2*1.05 5*1.19
Ending part of edge ribSupporting part of edge ribField part of edge ribEnding part of inner ribSupporting part of inner ribField part of inner rib
(1)(2)(3)(4)(5)(6)
(1)(2)
Beam elementsPlate elements
aa
Figure 51 a) Flat raft with loads, dimensions and FE-Net
b) Ribbed raft, arrangement of beam elements, dimensions and FE-Net

Reinforced Concrete Design by ELPLA
-140-
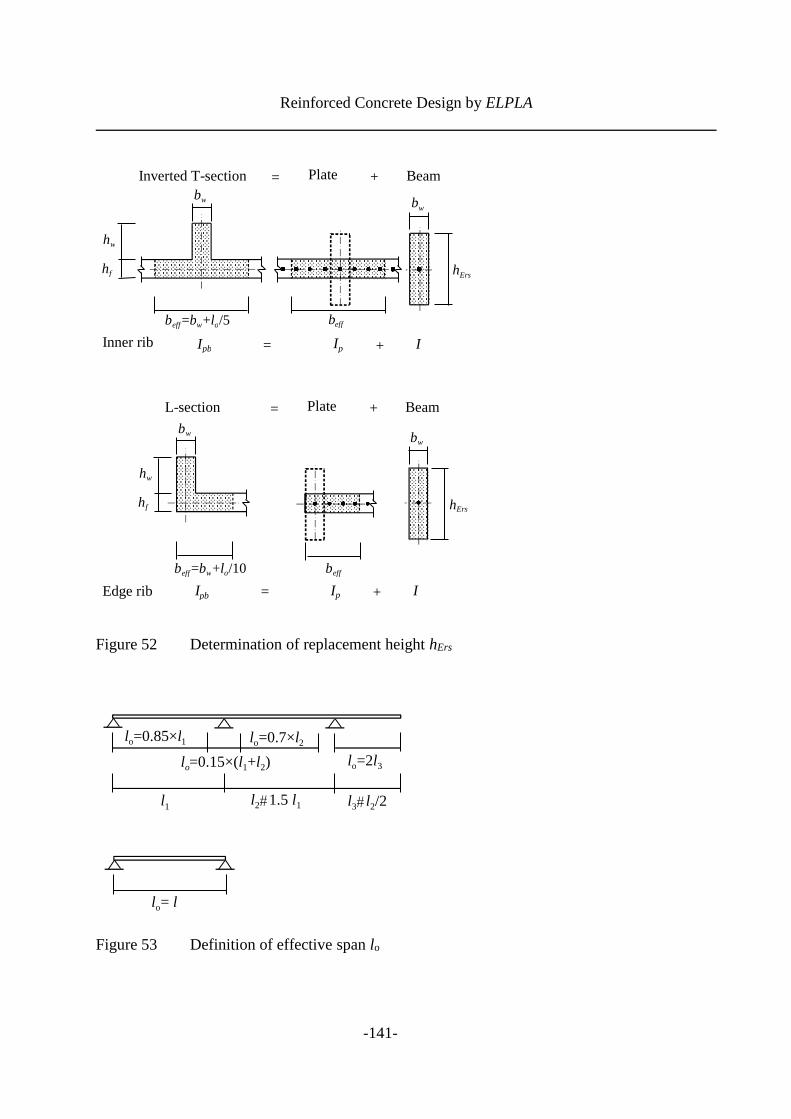
4.2 Determination of replacement rib height hErs
To simulate the rib stiffness on the FE-Net by using additional beam elements, the actual
properties of the beam elements must be determined. The stiffness of the rib can be obtained
through a replacement beam arranged in the center plane of the plate. The dimensions of the
replacement beam can be taken as in DIN 1075 or EC 2. This can be carried out by determining
firstly the moment of inertia for the effective section of the rib Ipb that contains two parts, flange
and web (Figure 52). The rib section may be L-section or inverted T-section. Then, the
replacement height of the web hErs can be determined by equating the section of inertia Ipb to two
equivalent moments of inertia. The first moment of inertia Ip corresponds a rectangular flange of
dimensions beff and hf while the second moment of inertia I corresponds a rectangular web of
dimensions bw and hErs. The replacement height of the web hErs must be higher than the sum of
slab thickness hf and clear height of the rib hw. In the finite element model of the ribbed raft, the
rib is represented by beam element that has the property of bw and hErs while the flange is already
included in the plate finite element.
According to EC 2 the rib is defined by different stiffness distribution along its length,
depending on the points of zero moment at the rib, where the effective flange width of the rib
depends on the position of this point. This stiffness can be determined approximately
independent of the load geometry at different spans. Guidelines for calculating effective spans lo
and flange widths beff are given in Figure 52 and Figure 53, while Table 54 shows effective spans
and flange widths of ribs at different rib parts for the raft.
Table 54 Effective span and flange width of the rib
Rib part
Effective rib span
lo [m]
Effective flange width
beff [m]
Edge rib
beff = bw + lo/ 10
Inner rib
beff = bw + lo/ 5
Ending part
0.85 l1 = 5.95
0.895
1.49
Supporting part
0.15 (l1 + l2) = 2.1
0.51
0.72
Field part
0.7 l2 = 4.9
0.79
1.28
where in Table 54:
l1 = l2 = 7.0 [m] Rib span
bw = 0.30 [m] Width of rib
Figure 54 and Figure 55 show the moment of inertia ratios r = Ipb/ I at different clear heights hw.
From these figures, it can be concluded that the small clear height hw has a great influence on the
ratio r. The replacement heights hErs for different clear heights hw are plotted as curves in Figure
56 and Figure 57. These curves indicate that the maximum replacement height occurs when the
clear height hw is about 0.75 − 0.80 [m]. At this clear height, the dimensions of the rib are
considered optimal.
Reinforced Concrete Design by ELPLA
-141-
Figure 52 Determination of replacement height hErs
Figure 53 Definition of effective span lo
l o =0.7×l 2 l o =0.85×l 1
l o =0.15×(l 1 +l 2 )
l 2 1.5 l 1 l 1 l 3 l 2 /2
l o =2l 3
l o = l
b eff =b w +l o /5
h Ers
b eff
h w
h f
b w
b w
b eff =b w +l o /10
h Ers
b eff
h w
h f
b w
b w
I pb I p I + = Inner rib
I pb I p I + = Edge rib
L-section Plate Beam + =
Inverted T-section Plate Beam + =

Reinforced Concrete Design by ELPLA
-142-
Figure 54 Moment of inertia ratio r = Ipb/ I for edge ribs
Figure 55 Moment of inertia ratio r = Ipb/ I for inner ribs
1.2
1.3
1.4
1.5
1.0
1.1
0.90 0.80 0.50 0.70 0.60
Clear height h w [m]
Ending part of rib
Supporting part of rib
Field part of rib
Rat
io I
pb/ I
1.2
1.3
1.4
1.5
1.0
1.1
0.90 0.80 0.50 0.70 0.60
Clear height h w [m]
Ending part of rib
Supporting part of rib
Field part of rib
Rat
io I
pb/ I

Reinforced Concrete Design by ELPLA
-143-
Figure 56 Replacement height hErs for edge ribs
Figure 57 Replacement height hErs for inner ribs
1.10
1.15
1.20
1.25
1.00
1.05
0.90 0.80 0.50 0.70 0.60
Clear height h w [m]
Ending part of rib
Supporting part of rib
Field part of rib
Rep
lace
men
t hei
ght
hE
rs
1.10
1.15
1.20
1.25
1.00
1.05
0.90 0.80 0.50 0.70 0.60
Clear height h w [m]
Ending part of rib
Supporting part of rib
Field part of rib
Rep
lace
men
t h
eig
ht
hE
rs

Reinforced Concrete Design by ELPLA
-144-
4.3 Optimal thickness
The optimal thickness is designed to be the minimum thickness of the raft for which the concrete
section and tensile reinforcement are enough to resist the flexure moments without compressive
reinforcement. The optimal thickness is designed according to EC 2 for the following
parameters:
Material
Concrete grade C 30/37
Steel grade BSt 500
Characteristic compressive cylinder strength of concrete fck = 30 [MN/ m2]
Characteristic tensile yield strength of reinforcement fyk = 500 [MN/ m2]
Partial safety factor for concrete strength γc = 1.5
Design concrete compressive strength fcd = fck/ γc = 30/ 1.5 = 20 [MN/ m2]
Partial safety factor for steel strength γs = 1.15
Design tensile yield strength of reinforcing steel fyd = fyk/ γs = 500/ 1.15 = 435 [MN/ m2]
Geometry
Width of the section to be designed b = 1.0 [m]
Concrete cover + 1/2 bar diameter c = 5.0 [cm]
Factored moment
The maximum moment mmax for the raft is obtained at different raft thicknesses t for flat raft and
slab thicknesses hf for ribbed raft. As soil layers represent the subsoil under the rafts, one of the
methods for Continuum model may be used. The considered rafts and system of loads will lead
to appearing a negative contact pressure, if method 6 or 7 is used. Therefore, the modification of
modulus of subgrade reaction by iteration (method 4) with sufficient accuracy ε = 0.002 [m] is
used in the analyses. It is found that the maximum moment mmax for the flat raft occurs always at
its center while for the ribbed raft occurs at different places depending on the slab thickness.
Total load factor for both dead and live loads γ = 1.5
Factored moment Msd = γmmax
Check for section capacity
The limiting value of the ratio x/ d is ξlim = 0.45 for fck 35 [MN/ m2]
The normalized concrete moment capacity μsd, lim as a singly reinforced section is
)ξ4.01(ξ8.0μ limlim −=limsd,
295.0)45.04.01(45.08.0μ =−=limsd,

Reinforced Concrete Design by ELPLA
-145-
The sustained moment Ma for singly reinforced section will be obtained from
Ma = μsd, lim bd2(0.85 fcd ) = 0.295×1.0× d2×0.85×20
Ma = 5.015 d2
where for flat raft:
d = t - 5 [cm] cover
t = raft thickness for flat raft
and for ribbed raft:
d = hf - 5 [cm] cover
hf = slab thickness for ribbed raft
The factored moment Msd and the sustained moment Ma for both flat and ribbed rafts are
calculated at different thicknesses and plotted in Figure 58 and Figure 59. The minimum
thickness is obtained from the condition Msd = Ma. From Figure 58 and Figure 59 the minimum
thickness for the flat raft is t = 0.58 [m] while for the ribbed raft is hf = 0.24 [m]. Therefore, the
optimal thickness for the flat raft is chosen to be t = 0.60 [m] while for the ribbed raft is chosen
to be hf = 0.25 [m]. Table 55 shows a comparison between flat and ribbed rafts, which indicates
that ribbed raft lead to less concrete volume and weight than those of flat raft by 44 [%].
Table 55 Comparison between flat and ribbed rafts
Cases
Concrete volume
[m3]
Concrete weight
[kN]
Average contact pressure
σo [kN/ m2]
Flat raft
243
6070
81
Ribbed raft
135
3384
75
Difference [%]
44
44
7
)85.0(μ
2
cd
a
limsd,fbd
M=

Reinforced Concrete Design by ELPLA
-146-
Figure 58 Determination of optimal raft thickness t for flat raft
Figure 59 Determination of optimal slab thickness hf for ribbed raft
0.4
0.6
0.8
1.0
0.0
0.2
0.50 0.45 0.35 0.25 0.40 0.10 0.30 0.20 0.15
h f = 0.24 [m]
Slab thickness h f [m]
Sustained moment M a
Factored moment M sd
Mo
men
ts [
MN
.m/
m]
Raft thickness t [m]
2.0
3.0
4.0
5.0
0.0
1.0
1.0 0.9 0.7 50 0.8 0.1 0.6 0.4 0.2 0.3
Sustained moment M a
Factored moment M sd
t = 0.58 [m]
Mo
men
ts [
MN
.m/
m]

Reinforced Concrete Design by ELPLA
-147-
Details of rib properties concerning ribbed raft are shown in Table 56.
Table 56 Properties of ribs for slab thickness hf = 0.25 [m] and
clear height hw = 0.75[m]
Rib part
Moment of
inertia for
effective
rib section
Ipb [m4]
Moment of
inertia for
rib flange
Ib [m4]
Replacement web
Replacement
height
hErs [m]
Moment of
inertia
I [m4]
Torsional
inertia
J [m4]
Edge
rib
Ending
0.0398
0.0386
1.16
0.0390
0.0087
Supporting
0.0316
0.0309
1.07
0.0306
0.0079
Field
0.0379
0.0368
1.14
0.0370
0.0086
Inner
rib
Ending
0.0476
0.0456
1.22
0.0454
0.0093
Supporting
0.0365
0.0355
1.12
0.0351
0.0084
Field
0.0452
0.0436
1.20
0.0432
0.0091
where:
Moment of Inertia for rib I = bw hErs 3/ 12
Torsional Inertia for rib
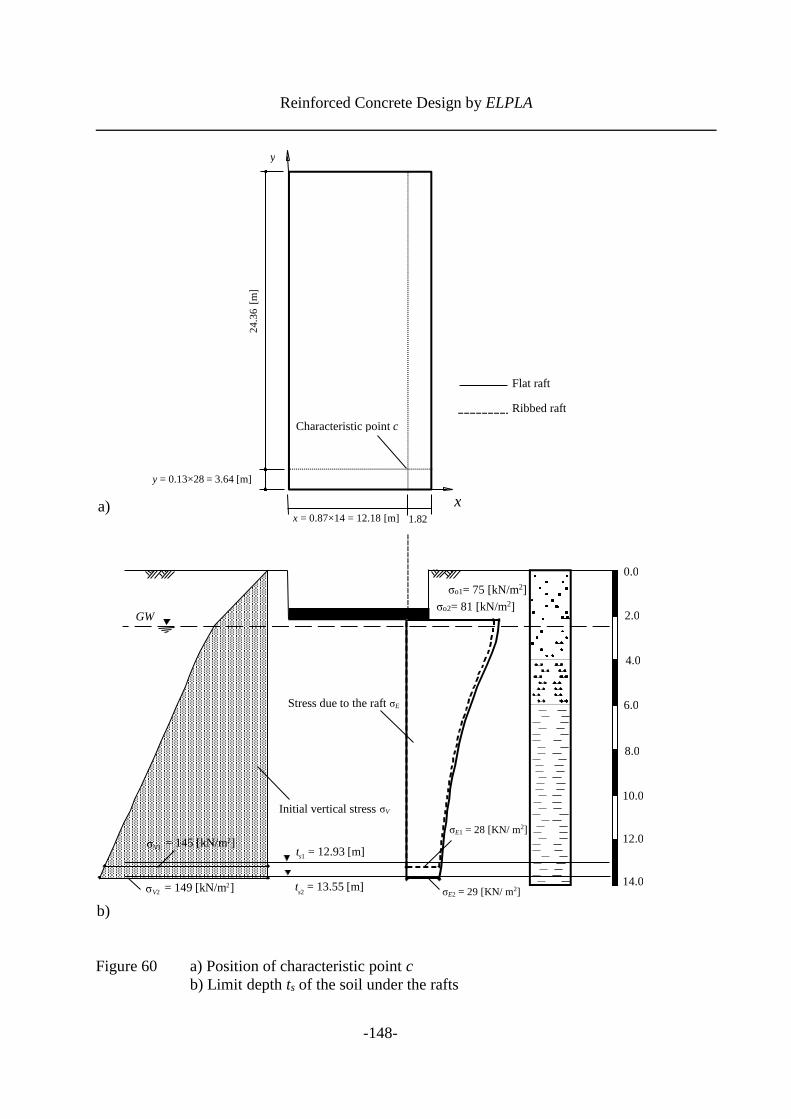
4.4 Determination of the limit depth ts
The level of the soil under the raft in which no settlement occurs or the expected settlement will
be very small, where can be ignored, is determined as a limit depth of the soil. The limit depth in
this example is chosen to be the level of which the stress due to the raft σE reaches the ratio ξ =
0.2 of the initial vertical stress σV. The stress in the soil σE is determined at the characteristic
point c of the rectangular foundation. The stress σE is due to the average stress from the raft at
the surface σO = 81 [kN/ m2] for flat raft and σO = 75 [kN/ m2] for ribbed raft. At the
characteristic point, from the definition of Graßhoff (1955), the settlement if the raft is full rigid
will be identical with that if the raft is full flexible. The characteristic point c takes coordinates x
= 0.87 × L = 12.18 [m] and y = 0.13 × B = 3.64 [m] as shown in Figure 59. The results of the
limit depth calculation are plotted in a diagram as shown in Figure 59. The limit depth is ts =
13.55 [m] for flat raft and ts = 12.93 [m] for ribbed raft under the ground surface.
12
121.03
14
4
3
−
−=
Ers
w
Ers
w
wErsh
b
h
bbhJ
Reinforced Concrete Design by ELPLA
-148-
Figure 60 a) Position of characteristic point c
b) Limit depth ts of the soil under the rafts
Characteristic point c
x = 0.87×14 = 12.18 [m] 1.82
b)
a)
y
x
t s2 = 13.55 [m]
10.0
8.0
6.0
4.0
2.0
0.0
12.0
14.0
Initial vertical stress σV
Stress due to the raft σE
σ V2 = 149 [kN/m 2 ]
σo1= 75 [kN/m2] σo2= 81 [kN/m2]
GW
t s1 = 12.93 [m] σ V1 = 145 [kN/m 2 ]
σE1 = 28 [KN/ m2]
Flat raft
Ribbed raft
y = 0.13×28 = 3.64 [m]
24
.36 [
m]
σE2 = 29 [KN/ m2]

Reinforced Concrete Design by ELPLA
-149-
5 Evaluation and conclusions
To evaluate analysis results, the results of the two cases of analyses are compared. The following
conclusions are drawn:
Settlements
Table 57 shows the extreme values of settlements for both flat and ribbed rafts. Figure 61 shows
the contour lines of settlements s while Figure 62 shows the settlements s at section a-a under
the middle of rafts. From the table and figures, it can be concluded the following:
- The ribs in the raft reduce the differential settlement by 7 [%], if a ribbed raft is used
instead of flat raft
- The settlement of the flat raft is greater than that of the ribbed raft because the flat raft
has concrete volume greater than that of the ribbed raft, which leads to an increase in the
self-weight of the foundation
Table 57 Extreme values of settlements for both flat and ribbed rafts
Cases of analysis Maximum settlement
smax [cm]
Minimum settlement
smin [cm]
Maximum differential
settlement
Δs [cm]
Flat raft
5.42
3.56
1.86
Ribbed raft
4.80
3.06
1.74
Contact pressures
Figure 63 shows the contact pressures q at section a-a for the two cases of analyses.
- The difference in contact pressure for the two cases of analyses is not great along the
rafts
Moments
Figure 64 shows the moments mx at section a-a for the two cases of analyses.
- The moment in slab of flat raft is greater than that of the ribbed raft by 93 [%]. This
means the ribs resist most of the stresses in the ribbed raft

Reinforced Concrete Design by ELPLA
-150-
Figure 61 Contour lines of settlements for flat and ribbed rafts
Ribbed raft h f = 0.25 [m]
Flat raft t = 0.60 [m]
3.80
3.60
3.40

Reinforced Concrete Design by ELPLA
-151-
Figure 62 Settlements s [cm] at middle section a-a for flat and ribbed rafts
Figure 63 Contact pressures q [kN/ m2] at middle section a-a for flat and ribbed rafts
100
0
600
500
400
300
200
14.0 12.0 10.0 8.0 6.0 4.0 2.0 0.0
x [m]
Flat raft Ribbed raft
Co
nta
ct p
ress
ure
q [
KN
/ m
2]
1.0
0.0
6.0
5.0
4.0
3.0
2.0
14.0 12.0 10.0 8.0 6.0 4.0 2.0 0.0
x [m]
Flat raft Ribbed raft
Set
tlem
ent
s [c
m]

Reinforced Concrete Design by ELPLA
-152-
Figure 64 Moments mx [kN.m/ m] at middle section a-a for flat and ribbed rafts
0
-200
1000
800
600
400
200
14.0 12.0 10.0 8.0 6.0 4.0 2.0 0.0
x [m]
Flat raft Ribbed raft
Mo
men
ts m
x [K
N.m
/ m
]

Reinforced Concrete Design by ELPLA
-153-
6 Design of the flat raft for flexure moment
6.1 Definition of critical sections
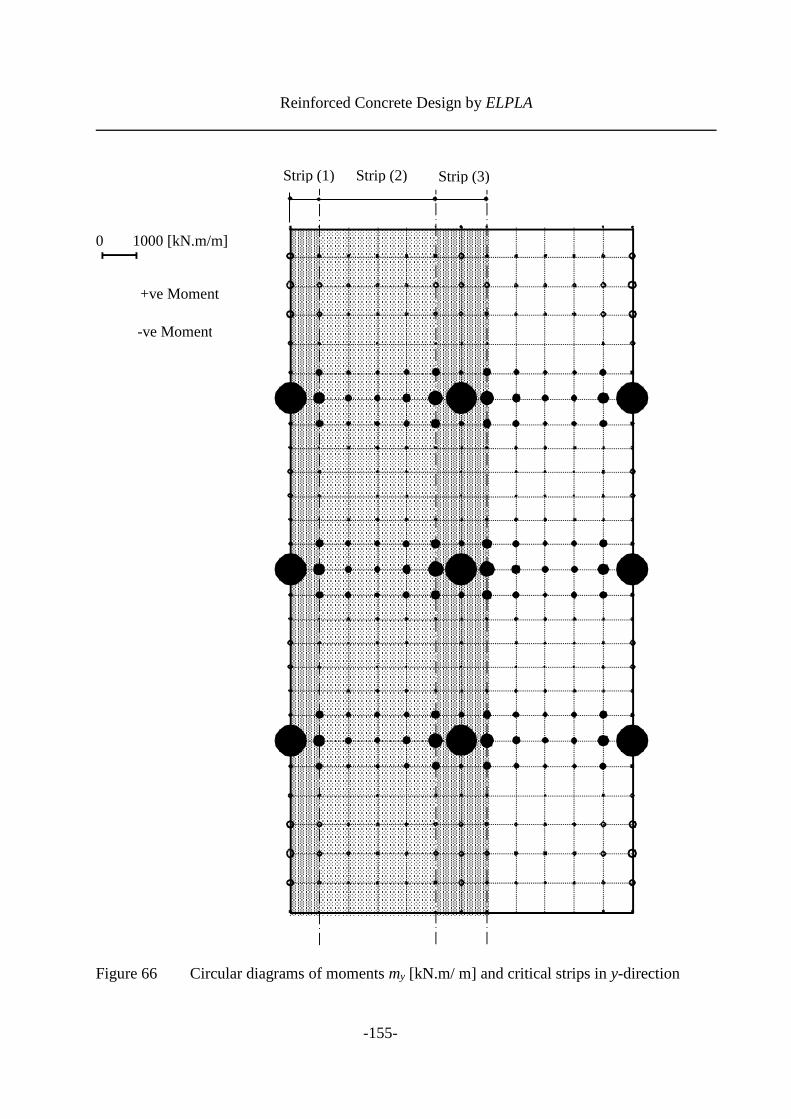
The flat raft is designed for optimal thickness t = 0.60 [m]. Figure 65 and Figure 66 show
circular diagrams of moments and critical strips in x- and y-directions. The use of circular
diagrams is an effective representation for moments where the critical zones can be quickly
identified. Two critical strips are considered for each direction, column strip and field strip. It
can be seen from circular diagrams that in each direction either column strips or field strips are
nearly the same. Critical strips in x-direction are chosen to be the column strip (III) and the field
strip (IV), while in y-direction are the column strip (3) and the field strip (2). Figure 67 to Figure
70 and Table 58 show the extreme values of moments of these strips.
Table 58 Extreme values of moments in critical strips
x-direction
y-direction
mx [kN.m/ m]
my [kN.m/ m]
Column strip
Field strip
Column strip
Field strip
Min.
Max.
Min.
Max.
Min.
Max.
Min.
Max.
-143
939
-96
454
Po1
Po2
Po3
Po4
Po5
Po6
Po7
Po8
-163
-45
897
918
-141
-45
402
424

Reinforced Concrete Design by ELPLA
-154-
Figure 65 Circular diagrams of moments mx [kN.m/ m] and critical strips in x-direction
+ve Moment
-ve Moment
0 1000 [kN.m/ m]
Strip (I)
Strip (IV)
Strip (III)
Strip (II)
Reinforced Concrete Design by ELPLA
-155-
Figure 66 Circular diagrams of moments my [kN.m/ m] and critical strips in y-direction
+ve Moment
-ve Moment
0 1000 [kN.m/m]
Strip (1) Strip (3) Strip (2)

Reinforced Concrete Design by ELPLA
-156-
Figure 67 Extreme values of moments mx [kN.m/ m] in column strip (III)
Figure 68 Extreme values of moments mx [kN.m/ m] in field strip (IV)
x [m]
14.0 10.0 4.0
0
0.0
200
400
600
800
1000
-200
Maximum moments
Minimum moments
9 22 [mm/m]
5 19 [mm/ m]
5 19 [mm/ m] 5 19 [mm/ m]
5 19 [mm/ m]
Mo
men
ts m
x [K
N.m
/ m
]
x [m]
14.0 10.0 4.0
0
0.0
200
400
600
800
1000
-200
16 22 [mm/ m]
5 19 [mm/ m] 5 19 [mm/ m]
5 19 [mm/ m] 5 19 [mm/ m]
Mo
men
ts m
x [K
N.m
/ m
]

Reinforced Concrete Design by ELPLA
-157-
Figure 69 Extreme values of moments my [kN.m/ m] in column strip (3)
Figure 70 Extreme values of moments my [kN.m/ m] in field strip (2)
y [m]
12.0 8.0 4.0 0.0
0
200
400
600
800
1000
-200 20.0 24.0 28.0 16.0
Maximum moments
Minimum moments
8 22 [mm/ m]
5 19 [mm/ m]
5 19 [mm/ m]
5 19 [mm/ m] 8 22 [mm/ m]
8 22 [mm/ m]
Po5
Po8 Po7
Po6 5 19 [mm/ m]
5 19 [mm/ m] 5 19 [mm/ m]
Mo
men
ts m
y [K
N.m
/ m
]
y [m]
12.0 8.0 4.0 0.0
0
200
400
600
800
1000
-200 20.0 24.0 28.0 16.0
7 22 [mm/ m]
5 19 [mm/ m]
5 19 [mm/ m]
5 19 [mm /m] 7 22 [mm/ m]
7 22 [mm/ m]
Po1
Po4 Po3
Po2
5 19 [mm /m] 5 19 [mm/ m] 5 19 [mm/ m]
Mo
men
ts m
y [K
N.m
/ m
]

Reinforced Concrete Design by ELPLA
-158-
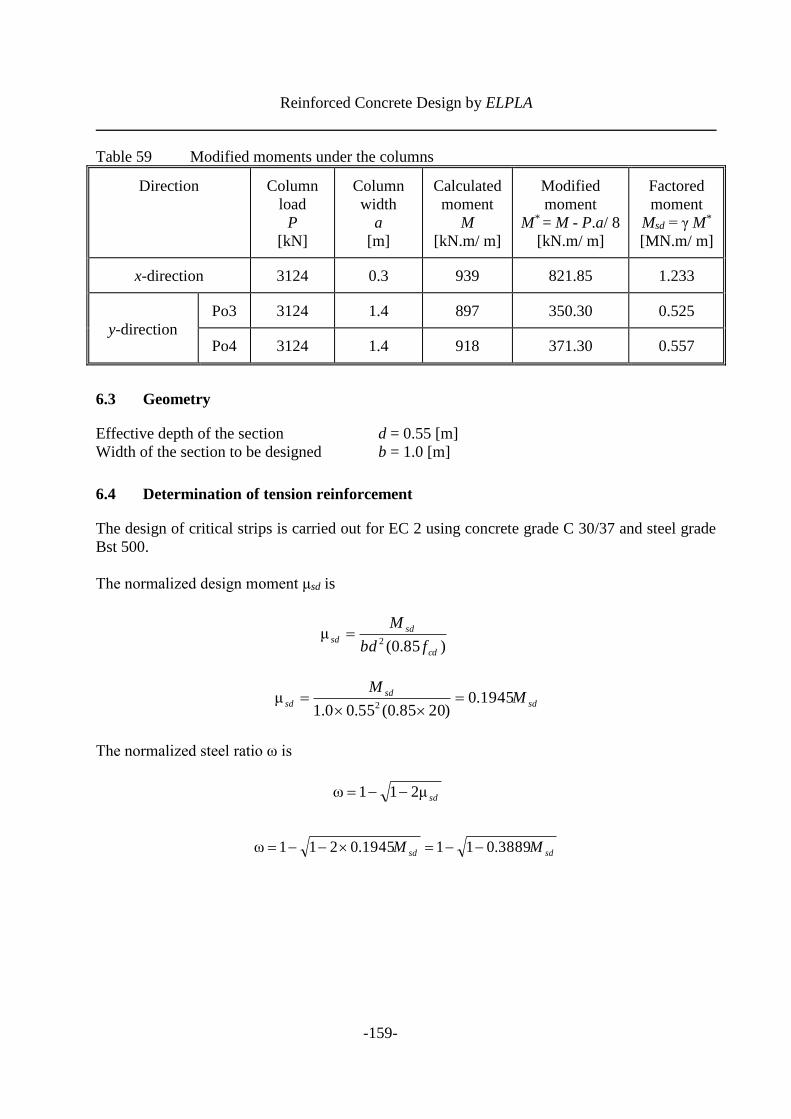
6.2 Modified moments under columns
Because the column load is represented by a point load on the FE-Net, the moment under the
column will be higher than the real moment. Therefore, to take into account the load distribution
through the raft thickness, the obtained moments under columns are modified according to
Figure 71 and the following formula (Rombach (1999)):
8
|||||*|
aPMM
−=
where:
M* = Modified moment under the column [kN.m/ m]
M = Calculated moment under the column [kN.m/ m]
P = Column load as a point load [kN]
a = Column width [m]
Figure 71 Modified moment under the column
It can be seen from Table 59 that the modified moment in y-direction is less than half the
calculated moment. This is due to the wide column side in y-direction (a = 1.4 [m]). The
difference between modified and calculated moments in x-direction is small as a result of the
short column side in this direction. However, considering the load distribution through the raft
thickness has great influence on the results particularly for wide columns, the modified moment
is neglected when determining the optimal thickness of the flat raft in this example.
Point load P
Modified moment M
* Calculated moment M
Column
width a
Reinforced Concrete Design by ELPLA
-159-
Table 59 Modified moments under the columns
Direction
Column
load
P
[kN]
Column
width
a
[m]
Calculated
moment
M
[kN.m/ m]
Modified
moment
M* = M - P.a/ 8
[kN.m/ m]
Factored
moment
Msd = γ M*
[MN.m/ m]
x-direction
3124
0.3
939
821.85
1.233
y-direction
Po3
3124
1.4
897
350.30
0.525
Po4
3124
1.4
918
371.30
0.557
6.3 Geometry
Effective depth of the section d = 0.55 [m]
Width of the section to be designed b = 1.0 [m]
6.4 Determination of tension reinforcement
The design of critical strips is carried out for EC 2 using concrete grade C 30/37 and steel grade
Bst 500.
The normalized design moment μsd is
sd
sd
sd MM
1945.0)2085.0(55.00.1
μ2
=
=
The normalized steel ratio ω is
sdsd MM 3889.0111945.0211ω −−=−−=
)85.0(μ
2
cd
sd
sdfbd
M=
sdμ211ω −−=

Reinforced Concrete Design by ELPLA
-160-
The required area of steel reinforcement per meter As is
As = 214.94ω [cm2/ m]
Minimum reinforcement per meter, min As, is assumed as
min As = 0.15 [%] × concrete section = 0.0015 × 100 × 60 = 9 [cm2/ m]
Chosen min As = 5 Φ 19 [mm/ m] = 14.2 [cm2/ m]
Minimum reinforcement, min As, can resist factored moment Msd equal to
( )m][MN.m/ 329.0
3889.0
94.214
2.1411
3889.0
ω11
2
2
=
−−
=−−
=sdM
It can be seen from Figure 67 to Figure 70 that the negative moments in x- and y-directions are
trivial. Therefore, the chosen minimum reinforcement, min As = 5 Φ 19 [mm/ m] is sufficient to
resist the negative moments in the raft at the top.
The following Table 60 to Table 61 show the required bottom reinforcement in critical strips.
Table 60 Required bottom reinforcement in x-direction Asxb Strip
Msd [MN.m/ m]
μsd
ω
Asxb [cm2/ m]
Column strip
1.233
0.2398
0.2786
59.89
Field strip
0.681
0.1325
0.1426
30.65
=
yd
cd
sf
bdfA
)85.0(ω
m]/ [m 0.02149ω435
55.00.1)2085.0(ω 2=
=sA

Reinforced Concrete Design by ELPLA
-161-
Table 61 Required bottom reinforcement in y-direction Asyb Strip
Msd [MN.m/ m]
μsd
ω
Asyb [cm2/ m]
Column
strip
Po3
0.525
0.1021
0.1079
23.20
Po4
0.557
0.1083
0.1149
24.70
Field
strip
Po7
0.603
0.1183
0.1251
26.89
Po8
0.636
0.1237
0.1325
28.48
Chosen reinforcement
Table 62 shows the number of bottom steel bars in critical strips. The chosen main diameter of
bottom steel bars is Φ = 22 [mm].
Table 62 Chosen main bottom reinforcement in critical strips
Direction
Strip
Chosen reinforcement As
x-direction
Column strip
16 Φ 22 = 60.80 [cm2/ m]
Field strip
9 Φ 22 = 34.2 [cm2/ m]
y-direction
Column strip
Po3
7 Φ 22 = 26.6 [cm2/ m]
Po4
7 Φ 22 = 26.6 [cm2/ m]
Field strip
Po7
8 Φ 22 = 30.40 [cm2/ m]
Po8
8 Φ 22 = 30.40 [cm2/ m]
Check of punching shear is to be done for corner column C1, edge column C2 and interior
column C3 according to EC 2.
The details of reinforcement in plan and cross section through the raft are shown in Figure 72.
Arrangement of reinforcement with moments is shown in details also in Figure 67 to Figure 70.

Reinforced Concrete Design by ELPLA
-162-
Figure 72 Details of reinforcement in plan and section a-a through the raft
7.0
4.8
14.70 [m]
5 19 [mm/m]
5 19 [mm/m] 5 19 [mm/m]
16 22 [mm/m] 5 19 [mm/m]
5 19 [mm/m] 5 19 [mm/m] 9 22 [mm/m]
0.15 0.2
0.15 0.2
7.0
2.1
a
a
0.1
5
0.1
5
0.2
0
7.0
7
.0
7.0
7
.0
28
.70
[m
]
5
19
[m
m/m
]
5
19
[m
m/m
]
5
19
[m
m/m
]
5
19
[m
m/m
]
7
22
[m
m/m
]
8
22
[m
m/m
]
7
22
[m
m/m
]
8
22
[m
m/m
]
5
19
[m
m/m
]
8
22
[m
m/m
]
7
22
[m
m/m
]
5
19
[m
m/m
] 5
19
[m
m/m
]
5
19
[m
m/m
]
2.1
4
.9
Sec
tio
n a
-a
5
19
[m
m/m
] 1
6
22
[mm
/m]
5
19
[m
m/m
]
9
22
[m
m/m
] 8
22
[m
m/m
] 8
22
[m
m/m
]
5
19
[m
m/m
]
5
19
[m
m/m
]
0.6
0
.2

Reinforced Concrete Design by ELPLA
-163-
Design of the ribbed raft for flexure moment
7.1 Definition of critical sections
The ribbed raft is designed for optimal slab thickness of hf = 0.25 [m], while the ribs are
designed for rib width of bw = 0.3 [m] and total height of hw + hf = 1.0 [m]. Figure 73 andFigure
74 show circular diagrams of moments for slabs in x- and y-directions. It can be seen from these
diagrams that in either x- or y-direction the moments along the slab are nearly constant.
Therefore, only one critical strip in each direction is required to design. Figure 75 to Figure 76
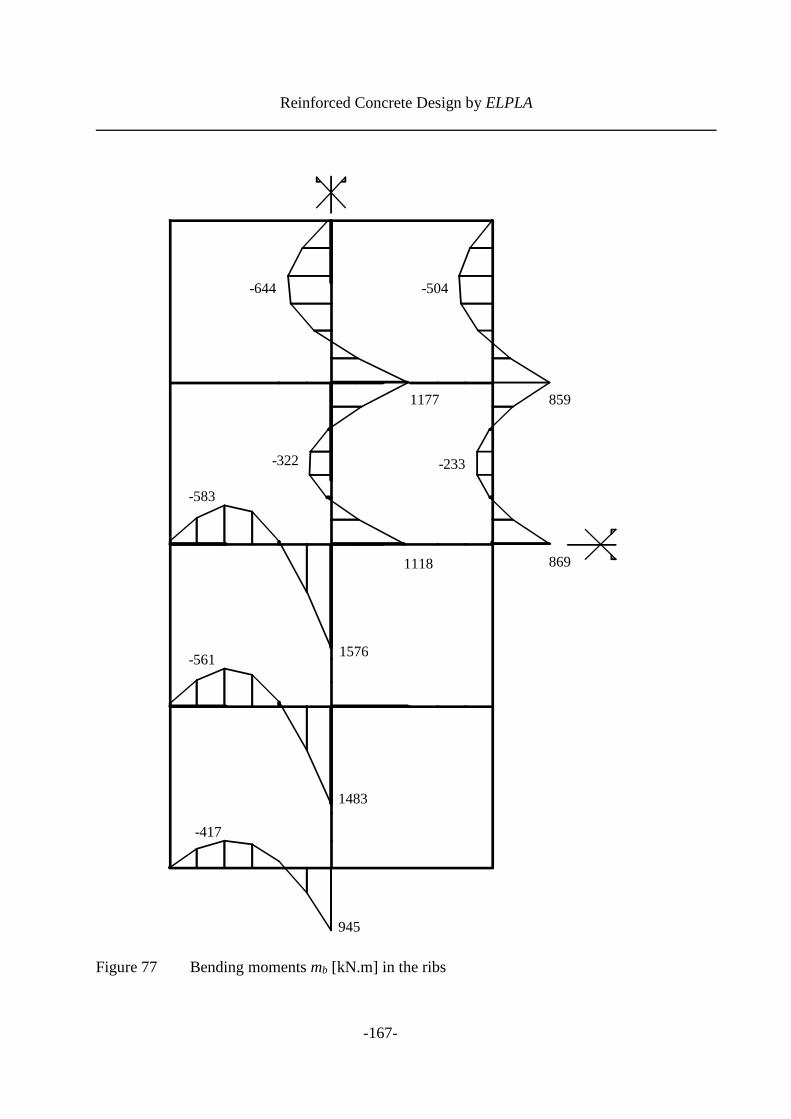
and Table 63 show the extreme values of moments of these strips. Figure 77 shows the bending
moments mb in the ribs, while Figure 78 shows the shear forces Qs in the ribs.
Table 63 Extreme values of moments in critical strips
x-direction
y-direction
mx [kN.m/ m]
my [kN.m/ m]
Min.
Max.
Min.
Max.
-39
123
Po1
Po2
Po3
Po4
-38
-36
96
101

Reinforced Concrete Design by ELPLA
-164-
Figure 73 Circular diagrams of moments mx [kN.m/ m] for the slab in x-direction
100 [kN.m/m]
+ve Moment
-ve Moment
0

Reinforced Concrete Design by ELPLA
-165-
Figure 74 Circular diagrams of moments my [kN.m/ m] for the slabs in y-direction
+ve Moment
-ve Moment
0 100 [kN.m/m]

Reinforced Concrete Design by ELPLA
-166-
Figure 75 Extreme values of moments mx [kN.m/ m] in the slab
Figure 76 Extreme values of moments my [kN.m/ m] in the slab
y [m]
12.0 8.0 4.0 0.0
-25
0
25
50
75
100
-50 20.0 24.0 28.0 16.0
7 19 [mm/ m]
5 16 [mm/ m]
5 16 [mm/ m]
5 16 [mm/ m] 8 19 [mm/ m]
7 19 [mm/ m]
Po1
Po4 Po3
Po2
5 16 [mm/ m] 5 16 [mm/ m]
5 16 [mm/ m]
150
125 Maximum moments
Minimum moments
Mom
ents
my
[KN
.m/
m]
x [m]
14.0 10.0 4.0
-25
0.0
0
25
50
75
125
-50
9 19 [mm/ m]
5 16 [mm/ m] 5 16 [mm/ m]
5 16 [mm/ m] 5 16 [mm/ m]
100
150
Maximum moments
Minimum moments
Mom
ents
mx
[KN
.m/
m]
Reinforced Concrete Design by ELPLA
-167-
Figure 77 Bending moments mb [kN.m] in the ribs
945
-417
1483
-561 1576
-583
-233
-504
869
859
1118
-322
1177
-644

Reinforced Concrete Design by ELPLA
-168-
Figure 78 Shear forces Qs [kN] in the ribs
541
-233
782
-289
819
-300
-564
523
-528
-662
679
-725
330 280

Reinforced Concrete Design by ELPLA
-169-
7.2 Factored moments in the slab
Total load factor for both dead and live loads is taken as γ = 1.5. Table 64 shows the factored
positive moments at critical sections.
Table 64 Factored positive moments at critical sections
Direction
Calculated moment
M
[kN.m/ m]
Factored moment
Msd = γ M*
[MN.m/ m]
x-direction
123
0.185
y-direction
Po3
96
0.144
Po4
101
0.152
7.3 Geometry of the slab
Effective depth of the section d = 0.20 [m]
Width of the section to be designed b = 1.0 [m]
7.4 Determination of tension reinforcement in the slab
The design of critical strips is carried out for EC 2 using concrete grade C 30/37 and steel grade
Bst 500.
The normalized design moment μsd is
sd
sd
sd MM
4706.1)2085.0(20.00.1
μ2
=
=
The normalized steel ratio ω is
sdsd MM 9412.2114706.1211ω −−=−−=
)85.0(μ
2
cd
sd
sdfbd
M=
sdμ211ω −−=

Reinforced Concrete Design by ELPLA
-170-
The required area of steel reinforcement per meter As is
As = 78.16ω [cm2/ m]
Minimum reinforcement per meter, min As, is assumed as
min As = 0.15 [%] × concrete section = 0.0015 × 100 × 25 = 3.75 [cm2/ m]
Chosen min As = 5 Φ 16 [mm/ m] = 8.04 [cm2/ m]
Minimum reinforcement, min As, can resist factored moment Msd equal to
( )m][MN.m/ 066.0
9412.2
16.78
04.811
9412.2
ω11
2
2
=
−−
=−−
=sdM
It can be seen from Figure 75 to Figure 76 that the negative moments in x- and y-directions are
trivial. Therefore, the chosen minimum reinforcement min As = 5 Φ 16 [mm/ m] is sufficient to
resist the negative moments in the slab at the top.
The following Table 65 and 66 show the required bottom reinforcement in critical strips in both
directions.
Table 65 Required bottom reinforcement in x-direction Asxb
Msd [MN.m/ m]
μsd
ω
Asxb [cm2/ m]
0.185
0.2721
0.3248
25.39
Table 66 Required bottom reinforcement in y-direction Asyb Position
Msd [MN.m/ m]
μsd
ω
Asyb [cm2/ m]
Po3
0.144
0.2118
0.2408
18.82
Po4
0.152
0.2235
0.2564
20.04
=
yd
cd
sf
bdfA
)85.0(ω
m]/ [m 0.007816ω435
20.00.1)2085.0(ω 2=
=sA

Reinforced Concrete Design by ELPLA
-171-
Chosen reinforcement
Table 67 shows the number of bottom steel bars in critical strips. The chosen main diameter of
bottom steel bars is Φ = 19 [mm].
Table 67 Chosen main bottom reinforcement in critical strips
Direction
Chosen reinforcement As
x-direction
9 Φ 19 = 25.5 [cm2/ m]
y-direction
Po3
7 Φ 19 = 19.9 [cm2/ m]
Po4
8 Φ 19 = 22.7 [cm2/ m]
Design of the rib sections are to be done according to EC 2. The design of section may be as L-
section for edge ribs or inverted T-section for inner ribs or rectangular section depending on the
compression side of the rib. The effective flange width of the ribs can be taken from Table 54.
The details of reinforcement in plan are shown in Figure 79. Arrangement of reinforcement with
moments is shown in details also in Figure 75 to Figure 76.

Reinforced Concrete Design by ELPLA
-172-
Figure 79 Details of reinforcement in plan
14.70 [m]
0.2 7.0
5 16 [mm/ m] 19 19 [mm/ m] 5 16 [mm/ m]
5 16 [mm/ m]
0.15 0.15 0.2
7.0
0.1
5
0.1
5
7.0
7
.0
7.0
7
.0
28
.70
[m
]
516 [mm/ m]
5
16
[m
m/
m]
5
16
[m
m/
m]
5
16
[m
m/
m]
5
16
[m
m/
m]
5
16
[m
m/
m]
5
16
[m
m/
m]
7
19
[m
m/
m]
8
19
[m
m/
m]
7
19
[m
m/
m]
0.2

Reinforced Concrete Design by ELPLA
-173-
8 References
[1] DIN 1075 Betonbrücken; Bemessung und Ausführung (Ausgabe 04.81)
[2] DIN 1045 (1988): Stahlbeton- und Spannbetonbau. Beton und Stahlbeton,
Bemessung und Ausführung. Ausgabe Juli 1988
[3] EUROCODE 2 (1993): Design of Concrete Structures
Deutsche Fassung: DIN V 18932 Teil 1
Beuth-Verlag GmbH, Berlin und Beton-Kalender Oktober 1991
[4] Graßhoff, H. (1955): Setzungsberechnungen starrer Fundamente mit Hilfe des
kennzeichnenden Punktes
Der Bauingenieur, S. 53-54
[5] Rombach, G. (1999): Anwendung der Finite-Elemente-Methode im Betonbau
Ernst & Sohn, Berlin