Embed Size (px)
Citation preview

Strategic Plan Goal: II. Program Quality and Accountability
d) Track current trends and research in learning theory, educator preparation, and certification and disseminate information about high quality programs, models, and outcomes.
June 2015
5A Information
Educator Preparation Committee
Report of Services Credentials Issued in California, 2009‐2010 to 2013‐2014
Executive Summary: This agenda item provides data, trends and patterns in the numbers of services credentials, permits and waivers issued in the past five years.
Policy Question: Does this report provide sufficient information and data about services credentials issued in California to inform Commission policy discussions?
Recommended Action: For information only
Presenters: Roxann Purdue and Marjorie Suckow, Consultants, Professional Services Division

EPC 5A‐1 June 2015
Report of Services Credentials Issued in California, 2009‐10 to 2013‐14
Introduction This agenda item provides a report on the number of services credentials that were issued during the previous five year period (2009‐10 to 2013‐14). Services credentials authorize prepared educators to provide non‐teaching services in the public schools that support student learning. This item also reports the number of waivers and permits issued for these service areas and identifies possible trends in the number of credentials, waivers, and permits issued. The services credentials addressed in this report are provided in the chart below along with an abbreviated description of the services each credential authorizes in California public schools. Detailed information on the authorizations and requirements for each services credential noted below may be accessed in the References section at the end of this report.
Credential Title Services Authorized in the Public Schools
Administrative Services Serve as a school site principal, assistant principal, or district/county administrator
Pupil Personnel Services (PPS)
Provide services in one or more of the following positions:
School Counselor
School Psychologist
School Social Worker
School Child Welfare and Attendance Worker
Speech‐Language Pathology (SLP) Services
Provide language, speech and hearing services
Clinical or Rehabilitative Services
Provide audiology or orientation and mobility services
Health Services: School Nurse Serve as a school nurse
Teacher Librarian Services Serve as a school librarian
This report does not include data on teaching credentials (e.g., Multiple Subject, Single Subject, Education Specialist, Career Technical Education, or Adult Education). Caveats about the Data It is important to note that the data presented in this report reflect the actual count of credential documents issued by the Commission, not the number of separate individuals who were granted these credentials. However, additional steps were taken to eliminate data duplication across credential holders in the same service area. For example, it is possible that an individual was granted a Certificate of Eligibility and a Preliminary Credential for Administrative Services in the
EPC 5A‐2 June 2015
same or following year based on when the educator secures employment in an administrative position. In these cases, the data identify only the initial document issued for that individual in the total count of new Administrative Services Credentials issued for that year as well as following years in order to avoid duplication in the number of new individuals prepared. Traditionally, for the annual reports (e.g., teacher supply), data was provided for only the Preliminary Credentials granted. In this report, for some of the services credentials, data on Clear credentials is also provided. In some cases (e.g., Pupil Personnel Services) the credential is only issued as a Clear document with no initial Preliminary Credential issued. In other cases, the Preliminary Credential is issued based on specific criteria (e.g., a School Nurse Services candidate must hold a Registered Nurse license) but the candidate completes the preparation program to earn the Clear credential. Clear credential data in these instances is provided to identify the number of individuals completing Commission‐approved preparation programs for the full credential. When available, data for currently employed service credential holders in California public schools along with staff/pupil ratios are presented to give a statewide context. Aggregate and summary data are provided within the narrative of this report; however, more detailed data tables are also available within the Appendix as follows: http://www.ctc.ca.gov/commission/agendas/2015‐06/2015‐06‐5A‐appendix.pdf.
Table 1 New Administrative Services Credentials Issued by Institution, 2013‐14
Table 2 Administrative Services Intern Credentials Issued by LEA, 2013‐14
Table 3 Administrative Services Credential Waivers Issued by LEA, 2013‐14
Table 4 New Pupil Personnel Services Credentials Issued by Institution, 2013‐14
Table 5 Pupil Personnel Services Intern Credentials Issued by LEA, 2013‐14
Table 6 Pupil Personnel Services Credential Waivers Issued by LEA, 2013‐14
Table 7 New Speech‐Language Pathology Services Credentials Issued by Institution, 2013‐14
Table 8 Speech‐Language Pathology Services Credential Waivers Issued by, LEA, 2013‐14
Table 9 New School Nurse Services Credentials Issued by Institution, 2013‐14
Table 10 Teacher Librarian Services Permits and Waivers Issued by LEA, 2013‐14
Background The Commission approves all educator preparation programs in California, including programs to prepare school administrators, school counselors, school psychologists, school social workers, school nurses, teacher librarians, rehabilitation specialists, and speech‐language pathologists to provide services in California public schools. The number of new teaching credentials issued each year is reported in April in the annual teacher supply report to the Governor and Legislature. The new teaching credentials and program completers information is reported in the annual institutional and program report card to the U.S. Department of Education every October. A report on the number of services credentials issued annually is not a state or federal government mandate but serves a similar purpose in providing the supply data necessary to inform potential policy decisions regarding the requirements and preparation for these credentials. This item presents data on the services credentials issued in the past five years to provide a statewide perspective in California.

EPC 5A‐3 June 2015
Administrative Services Credential California has a two‐tier credential structure for the Administrative Services Credential. A five‐year Preliminary credential is the first credential issued after an individual meets basic credential requirements and has secured an administrative position in California. A Clear credential is issued when a Commission‐approved program and the experience requirement for the Administrative Services Credential have been completed. In February 2014, the Commission adopted Induction program standards for the second tier preparation of school leaders and the Induction programs are completing the program approval process at this time. The Administrative Services Credential authorizes the holder to provide the following services in grades 12 and below, including preschool, and in classes organized primarily for adults:
Develop, coordinate, and assess instructional programs
Evaluate certificated and classified personnel
Provide student discipline, including but not limited to suspension and expulsion
Provide certificated and classified employee discipline, including but not limited to suspension, dismissal, and reinstatement
Supervise certificated and classified personnel
Manage school site, district, or county level fiscal services
Recruit, employ, and assign certificated and classified personnel
Develop, coordinate, and supervise student support services, including but not limited to extracurricular activities, pupil personnel services, health services, library services, and technology support services
An individual must hold an Administrative Services Credential to provide the following services in grades preschool, K‐12 and in classes organized primarily for adults:
Evaluate the quality and effectiveness of instructional services at the school site level
Evaluate certificated personnel employed at the school site level, with the exception of the site administrator
Provide student and certificated personnel employee discipline at the school site level California candidates for an initial Administrative Services Credential have three preparation pathways:
1. Commission‐approved traditional preparation program 2. Commission‐approved alternative (Intern) preparation program 3. Commission‐approved examination
For individuals completing a Commission–approved preparation program through either a traditional or an intern program, there are 61 Commission‐approved programs [51 Institution of Higher Education (IHEs) and 10 non‐IHEs]. Among the 51 IHEs, 31 IHEs offer intern programs in addition to a traditional program pathway.

EPC 5A‐4 June 2015
Terms used to refer to different types of documents for Administrative Services Credentials There are a few terms used for different documents issued for the Administrative Services Credential. The terms are defined below:
Intern Credential ‐ issued to candidates employed as administrators in California public schools. The intern holder is provided with supervised in‐service preparation that results in a formal recommendation by a Commission‐approved program sponsor for the Preliminary Administrative Services Credential if the individual has secured employment in an administrative position in California.
Certificate of Eligibility (CE) ‐ candidates who have completed all requirements for the Preliminary Administrative Services Credential, but who do not yet have an offer of employment as an administrator, are issued this certificate. The CE allows an individual to seek employment as an administrator in the public schools. The CE has no expiration date and is valid indefinitely. Once an offer of employment as an administrator is secured, the CE holder may apply directly to the Commission for the preliminary credential by submitting an application and verification of an employment offer as an administrator. The CE was developed to allow applicants time to secure an administrative position prior to issuance of the initial five‐year Preliminary Credential in order to provide the job‐embedded experience necessary for the Clear credential. In some cases individuals move very quickly (less than 30 days) from the CE to the Preliminary while others may never pursue or obtain an administrative position in California public schools. The flow chart that follows provides a graphic representation of the steps involved in these two possibilities.
Preliminary Credential – issued to candidates who have satisfied all initial requirements, including a Commission‐approved preparation program or examination, and have secured an offer of employment as an administrator in California. Once a Preliminary Administrative Services Credential is issued, the credential holder has five years to complete the additional requirements for the Clear Administrative Services Credential.
Direct Application – describes three different types of applications submitted directly to the Commission by the applicant or employing agency for Administrative Services Credentials, as follows:
─ Preliminary Administrative Services Credentials are issued based on direct application from individuals holding a Certificate of Eligibility (CE) once they secure employment in an administrative position in California. (Data presented in this report does not include duplicate data for individuals who earned their initial CE and were subsequently issued a Preliminary credential based on securing employment in an administrative position.)
─ Out of State (OOS) prepared school administrators may submit direct applications to the Commission.
─ Individuals who achieve a passing score on a Commission‐approved examination and meet all other requirements for the Preliminary Administrative Services Credential may submit direct applications to the Commission.

EPC 5A‐5 June 2015
Table 1a reports the number of Preliminary Administrative Services Credentials issued based on recommendation by a Commission‐approved preparation program. Each year, more than 1,500 CEs and about 300 to 400 Preliminary Credentials were issued. Approximately 100 individuals were issued Intern credentials each year. Between 2012‐13 and 2013‐14, the number of CEs decreased by 6.5 percent, while Intern Credentials and Preliminary Credentials increased (8.8 percent and 17.2 percent, respectively). Overall, there was a decrease of 2.7 percent for the approved program route. Table 1a. Administrative Services Credentials Issued – Program Pathway, 2009‐10 to 2013‐14
2009‐10 2010‐11 2011‐12 2012‐13 2013‐14 1‐year Change
(%) from 2012‐13 to 2013‐14
Certificate of Eligibility 1,591 1,395 1,535 2,065 1,931 ‐6.5%
Intern Credential 92 67 79 113 123 8.8%
Offer of Employment
No Offer of Employment
Preliminary Credential
Certificate of Eligibility (CE)
Offer of Employment
Preliminary Credential
Completes All Requirements of a Commission‐Approved Program or Examination for Preliminary Administrative Services Credential
Completes Commission‐Approved Program and Required Experience to Earn a Clear Administrative Services Credential

EPC 5A‐6 June 2015
2009‐10 2010‐11 2011‐12 2012‐13 2013‐14 1‐year Change
(%) from 2012‐13 to 2013‐14
Preliminary Credential 346 297 295 332 389 17.2%
Total Approved Programs Route
2,029 1,759 1,909 2,510 2,443 ‐2.7%
Note – Data include new credentials only; do not include renewals or duplicates between CE and Preliminary.
For candidates completing the examination pathway, individuals must have achieved a passing score on the previous School Leaders Licensure Assessment (SLLA) or on the current California Preliminary Administrative Credential Examination (CPACE). From 2002‐2011 the SLLA was used as the Commission‐adopted examination option for a Preliminary Administrative Services Credential. In 2008, the Commission approved the development of a California‐specific examination to replace the SLLA, and in 2011, the newly developed CPACE replaced the SLLA. The initial CPACE administration was held in June 2011. Figure 1 illustrates the distribution of new Administrative Services Credentials issued by each type of approved program. About two‐fifths (40 percent) of the new Administrative Services Credentials were issued based on completion of a Commission‐approved program completed through a California State University (CSU) and more than two‐fifths (43 percent) based on programs completed through a Private/Independent College or University. Administrative Services Credentials issued based on a Commission‐approved programs completed through Local Education Agencies (LEA) represented more than one‐tenth (13 percent) with the remaining 4 percent through University of California (UC) campuses. Figure 1. New Administrative Services Credentials Issued by Program Type, 2013‐14
Data include new (CE and Preliminary) credentials only; do not include intern, clear, or renewals.
CSU40%
UC4%
Private/Independe
nt43%
LEA13%
EPC 5A‐7 June 2015
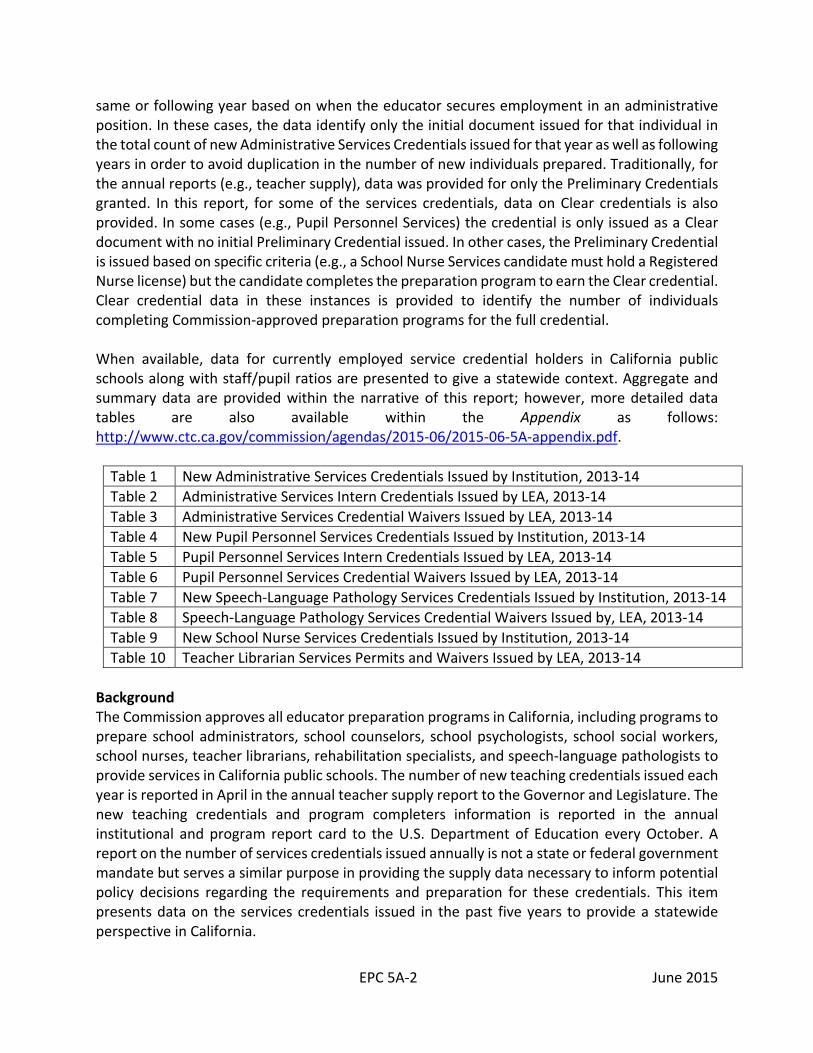
Table 1b provides data on the number of Administrative Services Credentials issued based on the examination pathway. The number of credentials earned by passing the examination increased in 2010‐11 and then declined in recent years. In 2013‐14, there was a slight increase in the number of credentials for both CE and Preliminary. Between 2012‐13 and 2013‐14, the number of individuals who were issued a CE based on the examination pathway increased by 22.8 percent. There was an increase of 19.2 percent for individuals who were issued initial Preliminary Credentials based on the examination pathway. Overall, there was an increase of 21 percent between 2012‐13 and 2013‐14 for the exam pathway. Table 1b. Administrative Services Credentials Issued ‐ Exam Pathway, 2009‐10 to 2013‐14
2009 ‐10 2010 ‐11 2011 ‐12 2012 ‐13 2013 ‐14 1‐year Change
(%) from 2012‐13 to 2013‐14
Certificate of Eligibility 279 461 184 123 151 22.8%
Preliminary Credential 201 328 191 120 143 19.2%
Total Exam Pathway 480 789 375 243 294 21.0%
Note – Data include SLLA and CPACE exams. SLLA was replaced by CPACE in 2011. Data include new credentials only; do not include renewals or duplicates between CE and Preliminary.
Table 1c provides data on the number of candidates electing to complete the examination pathway each year as well as the number and percentage of those candidates who pass these examinations. Table 1c. CPACE Annual Passing Rates, August 2013 to July 2014
CPACE Written CPACE Video
N Completed N Passed % Passed N Completed N Passed % Passed
1,890 442 23.4% 1,320 1,036 78.5%
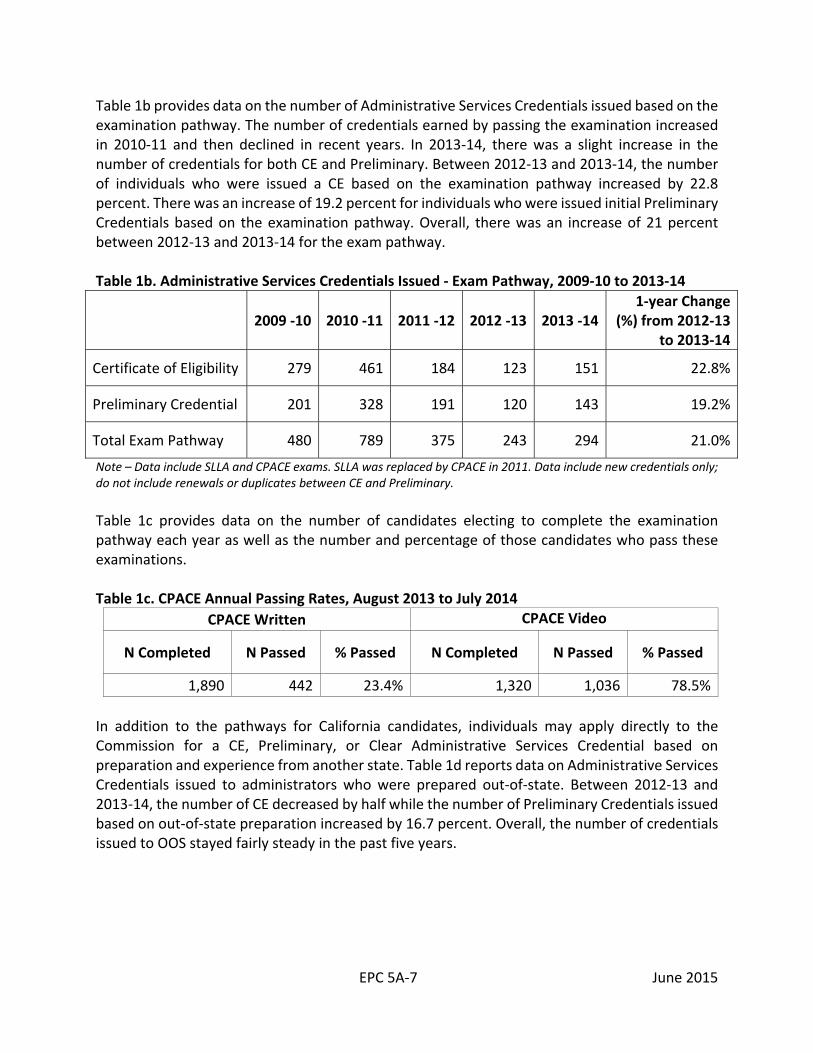
In addition to the pathways for California candidates, individuals may apply directly to the Commission for a CE, Preliminary, or Clear Administrative Services Credential based on preparation and experience from another state. Table 1d reports data on Administrative Services Credentials issued to administrators who were prepared out‐of‐state. Between 2012‐13 and 2013‐14, the number of CE decreased by half while the number of Preliminary Credentials issued based on out‐of‐state preparation increased by 16.7 percent. Overall, the number of credentials issued to OOS stayed fairly steady in the past five years.
EPC 5A‐8 June 2015
Table 1d. Administrative Services Credentials Issued – Preparation Completed Out of State (OOS), 2009‐10 to 2013‐14
2009‐10 2010‐11 2011‐12 2012‐13 2013‐14 1‐year Change (%) from
2012‐13 to 2013‐14
Certificate of Eligibility 17 24 28 22 11 ‐50.0%
Preliminary 59 54 54 66 77 16.7%
Total OOS Pathway 76 78 82 88 88 0.0%
Note – Data include new credentials only; do not include renewals or duplicates between CE and Preliminary.
Figure 2 depicts the total number of CE and Preliminary Credentials issued for the past five years. In the past five years, a total of approximately 2,000 CEs and 500 to 600 Preliminary Credentials were issued each year. With respect to the relative proportion of the CEs and Preliminary Credentials issued, in 2009‐2010 the CEs accounted for more than three‐fourths (76 percent) of the initial administrative documents issued while about one‐fourth (24 percent) were issued as Preliminary Credentials. Despite the increase in the number of CEs in the past two years, the proportion of the CEs and Preliminary Credentials remained fairly steady ‐ in 2013‐14, the proportion of CEs and Preliminary Credentials was 77 percent and 23 percent, respectively. Figure 2. Total Number of Certificates of Eligibility and Preliminary Administrative Services Credentials Issued – All Pathways, 2009‐10 to 2013‐14
Note – Data include new credentials only; do not include renewals or duplicates between CE and Preliminary Credentials. Data include new administrative credentials issued to individuals who came through the Commission‐approved program pathway, exam pathway, and out‐of‐state prepared pathway.
1,887 1,880 1,747
2,210 2,093
606 679 540
518 609
‐
500
1,000
1,500
2,000
2,500
3,000
2009‐10 2010‐11 2011‐12 2012‐13 2013‐14
Preliminary
Certificate ofEligibility
EPC 5A‐9 June 2015
CE to Preliminary Credential Conversion An analysis of the 2009‐10 data was completed to answer two primary questions:
1. How many CE holders obtained employment as an administrator in California, thus allowing them to convert their CE to a Preliminary Credential?
2. How long on average did it take for CE holders to obtain employment as an administrator in California? (Data identified by direct applications from CE holders to convert to a Preliminary Credential, which only requires verification of employment as an administrator.)
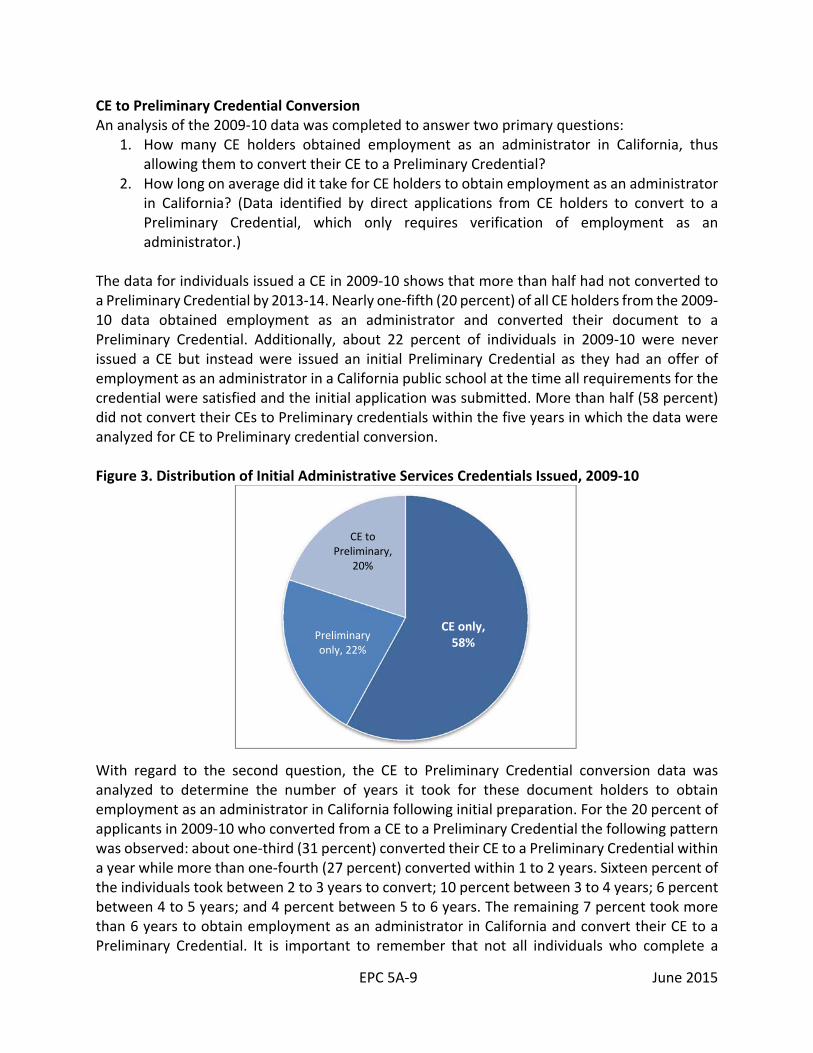
The data for individuals issued a CE in 2009‐10 shows that more than half had not converted to a Preliminary Credential by 2013‐14. Nearly one‐fifth (20 percent) of all CE holders from the 2009‐10 data obtained employment as an administrator and converted their document to a Preliminary Credential. Additionally, about 22 percent of individuals in 2009‐10 were never issued a CE but instead were issued an initial Preliminary Credential as they had an offer of employment as an administrator in a California public school at the time all requirements for the credential were satisfied and the initial application was submitted. More than half (58 percent) did not convert their CEs to Preliminary credentials within the five years in which the data were analyzed for CE to Preliminary credential conversion. Figure 3. Distribution of Initial Administrative Services Credentials Issued, 2009‐10
With regard to the second question, the CE to Preliminary Credential conversion data was analyzed to determine the number of years it took for these document holders to obtain employment as an administrator in California following initial preparation. For the 20 percent of applicants in 2009‐10 who converted from a CE to a Preliminary Credential the following pattern was observed: about one‐third (31 percent) converted their CE to a Preliminary Credential within a year while more than one‐fourth (27 percent) converted within 1 to 2 years. Sixteen percent of the individuals took between 2 to 3 years to convert; 10 percent between 3 to 4 years; 6 percent between 4 to 5 years; and 4 percent between 5 to 6 years. The remaining 7 percent took more than 6 years to obtain employment as an administrator in California and convert their CE to a Preliminary Credential. It is important to remember that not all individuals who complete a
CE only, 58%
Preliminary only, 22%
CE to Preliminary,
20%

EPC 5A‐10 June 2015
Preliminary Administrative Services program intend to serve as a school administrator and so may never convert the CE to a Preliminary Credential. Figure 4.Years Before Converting a Certificate of Eligibility to Preliminary Credential, 2009‐10
Note – Data only include the twenty percent of individuals who held a CE in 2009‐10 and then converted to a Preliminary credential. Fifty‐eight percent of CE holders issued in 2009‐10 have yet to convert to a Preliminary credential and another twenty‐two percent were issued a Preliminary credential initially without first holding a CE.
Variable‐Term Waivers The Variable‐Term Waiver is a document issued to an individual based on the request of an employer when a fully credentialed educator is not available for the assignment. Individuals must meet the waiver criteria. It allows the employer to fill the assignment while searching for a fully credentialed educator and gives the waiver holder additional time to complete requirements. Waiver Criteria are set by the Commission and include specific requirements that need to be met by the employer, including verification of recruitment efforts, evidence of qualifications for the assignment and a commitment to meet the credentialing goals. Variable‐Term Waivers are restricted to service with the local education agency that is granted the Waiver and are generally issued for one school year with specific criteria set for a subsequent Waiver. Table 1e displays the number of Variable‐Term Waivers that were issued for Preliminary Administrative Service Credentials over a five‐year span. Very few waivers for administrators were issued in the last five years. The Commission does not issue emergency permits for administrators in California. Table 1e. Waivers Issued for Administrative Services Credentials, 2009‐10 to 2013‐14
2009‐10 2010‐11 2011‐12 2012‐13 2013‐14
1‐year Change (%) from 2012‐13 to 2013‐14
Waivers 3 2 4 10 8 ‐20.0%Note – Waiver data include both initial issuance and subsequent reissuances. The number of waivers is small over time; caution should be exercised when discussing trend patterns.
31%
27%
16%
10%
6%4%
7%
0%
5%
10%
15%
20%
25%
30%
35%
less than 1 yr 1 to 2 yrs 2 to 3 yrs 3 to 4 yrs 4 to 5 yrs 5 to 6 yrs above 6 yrs

EPC 5A‐11 June 2015
Table 1f compares K‐12 student enrollment and the number of administrators in the public schools between 2009‐10 and 2013‐14, as reported by California Department of Education (CDE). The K‐12 student enrollment increased by 0.2 percent between 2012‐13 and 2013‐14 and the number of school administrators also increased by 3.3 percent. Table 1f. Number of Administrators Serving in California Public Schools, 2009‐10 to 2013‐14
2009‐10 2010‐11 2011‐12 2012‐13 2013‐14
1‐year Change (%) from
2012‐13 to 2013‐14
K‐12 Enrollment
6,190,425 6,217,002 6,220,993 6,226,989 6,236,672 0.2%
Number of Administrators
24,727 25,534 23,140 23,843 24,634 3.3%
Per Pupil Ratio 250.4 243.5 268.8 261.2 253.2 ‐3.1%
Source: CDE’s Dataquest, 2009‐10 to 2013‐14 data
Age Distribution of New Administrative Services Credential Holders Figure 5 shows the age distribution of new Preliminary and CE Administrative Services Credential holders for 2013‐14. The average age of new credential holders of administrative services credentials in 2013‐14 was 41.6 years. Figure 5. Age Distribution of New Administrative Services Credential Holders, 2013‐14
0
50
100
150
200
250
300
25 27 29 31 33 35 37 39 41 43 45 47 49 51 53 55 57 59 61 63 65 67 69
Number of Individuals
AGE

EPC 5A‐12 June 2015
School Administrators by Gender and Ethnicity Figures 6 and 7 display the gender and ethnicity of school administrators serving in California in 2013‐14. As depicted in Figure 5, nearly two‐thirds of the administrators were female (61 percent). Figure 6 indicates that 62 percent of administrators were White with 21 percent identified as Hispanic/Latino and 7 percent as African American. There was an increase in the number of school administrators who identified as Hispanic/Latino in the past five years – 18 percent in 2009‐10 and 21 percent in 2013‐14.
Figure 6. Gender Distribution of School Administrators, 2013‐2014
Figure 7. Ethnic Identification of School Administrators, 2013‐2014
Source: California Department of Education’s Data Quest; Certificated Staff by Ethnicity for 2013‐14. State Summary, Number of school administrators by Ethnicity. Asian/Pacific Islander category includes Filipino also.
Pupil Personnel Services Credential The Pupil Personnel Services (PPS) Credential authorizes four specializations: School Counseling, School Social Work, School Psychology, and Child Welfare and Attendance Services. The authorization, preparation program, and requirements for each specialization are distinct. An individual earning a PPS Credential in California must earn one of the first three specializations provided below but may also add the fourth specialization, Child Welfare and Attendance, in conjunction with any of the first three specializations.
School Counseling authorizes the holder to develop, plan, implement and evaluate a school counseling and guidance program that includes academic, career, personal and social development; advocate for the high academic achievement and social development of all students; provide school‐wide prevention and intervention strategies and counseling services; provide consultation, training and staff development to teachers and parents regarding students' needs; and supervise a district‐approved advisory program as described in EC §49600.
Male39%
Female61%
White, 62%
Hispanic, 21%
African American,
7%
Asian/ Pacific Islander,
5%
American Indian, 0.4%
Multiple race or No Response,
4%

EPC 5A‐13 June 2015
School Social Work authorizes the holder to assess home, school, personal and community factors that may affect a student's learning; identify and provide intervention strategies for children and their families, including counseling, case management, and crisis intervention; consult with teachers, administrators and other school staff regarding social and emotional needs of students; and coordinate family, school and community resources on behalf of students. School Psychology authorizes the holder to provide services that enhance academic performance; design strategies and programs to address problems of adjustment; consult with other educators and parents on issues of social development, behavioral and academic difficulties; conduct psycho‐educational assessments for purposes of identifying special needs; provide psychological counseling; and coordinate intervention strategies for management of individual and school‐wide crises. Child Welfare and Attendance authorizes the holder to access appropriate services from both public and private providers; provide staff development to school personnel regarding state and federal laws pertaining to due process and child welfare and attendance laws; address school policies and procedures that inhibit academic success; implement strategies to improve student attendance; participate in school‐wide reform efforts; and promote understanding and appreciation of those factors that affect the attendance of culturally‐diverse student populations. The Child Welfare and Attendance certificate is an additional authorization that must be added to a PPS credential in school counseling, school psychology, or school social work.
The PPS Credential is unique in that it is issued initially as a Clear Credential rather than moving through a two‐tiered structure of Preliminary to Clear, like most other credentials. There are 32 Commission‐approved program sponsors offering PPS credential preparation programs. Like the Administrative Services Credential, PPS also has an alternative preparation (Intern) pathway option. The Intern pathway for a PPS credential differs from an Intern program for teachers or school administrators. For the PPS credentials, there are a specified number of hours of clinical practice that must be completed before an individual is eligible for the Clear credential (for School Psychology 1,200 hours; for School Counseling 600 hours; and for School Social Work 1000 hours). In most cases, an individual completes all program coursework and practicum prior to serving on a PPS Intern credential for the fieldwork component. In addition, the institution and employer must certify that the interns do not displace certificated employees. This Intern credential allows the individual to be employed while completing the required hours of supervised field experience. PPS Intern credentials are only issued in the areas of School Psychology and School Counseling. In addition, individuals prepared out of state as a PPS provider may also be issued a PPS Credential in California. Table 2a provides data on PPS credentials issued by various pathways. There was an increase in the IHE traditional pathway and PPS Intern pathway (2.6 percent and 15.0 percent, respectively), while the number stayed steady for the out‐of‐state prepared. Overall, there was an increase of 7.3 percent in the new PPS credentials issued between 2012‐13 and 2013‐14.

EPC 5A‐14 June 2015
Table 2a. Pupil Personnel Services Credentials Issued by Pathway, 2009‐10 to 2013‐14
2009‐10 2010‐11 2011‐12 2012‐13 2013‐14
1‐year Change (%)
from 2012‐13 to 2013‐14
IHE Traditional Pathway 1,557 1,486 1,479 1,433 1,470 2.6%
IHE Intern Pathway 228 218 170 187 215 15.0%
Out of State Prepared 93 113 156 157 222 41.4%
Totals 1,878 1,817 1,805 1,777 1,907 7.3%Note – Data include new credentials only; do not include renewals. Figure 8 illustrates the distribution of PPS credentials issued by each type of Commission‐approved program. More than half (53 percent) of the new PPS credentials were issued based on completion of a Commission‐approved program at a Private/Independent College or University, more than two‐fifths (42 percent) were issued based on program completion at a CSU campus and the remaining 5 percent are attributed to the UC campuses.
Figure 8. New Pupil Personnel Services Credentials by Program Type, 2012‐13
Data include new credentials only; do not include intern credentials or renewals.
Table 2b shows there was an increase in the number of all new PPS Credentials: School Counseling (5.4 percent), School Psychology (0.2 percent), School Social Work (54.2 percent), and Child Welfare and Attendance (3.1 percent). Overall, the number of authorizations issued in PPS increased by 6.4 percent between 2012‐13 and 2013‐14. Table 2b. Pupil Personnel Services Credentials Issued by Type, 2009‐10 to 2013‐14
2009‐10 2010‐11 2011‐12 2012‐13 2013‐14
1‐year Change (%) from 2012‐13
to 2013‐14
School Counseling 1,184 1,166 1,085 977 1,030 5.4%
CSU42%
UC5%
Private/Independent53%

EPC 5A‐15 June 2015
2009‐10 2010‐11 2011‐12 2012‐13 2013‐14
1‐year Change (%) from 2012‐13
to 2013‐14
School Psychology 279 288 389 434 435 0.2%
School Social Work 74 77 61 83 128 54.2%
Child Welfare and Attendance*
111 68 100 96 99 3.1%
Totals 1,648 1,599 1,635 1,590 1,692 6.4%
Note – Data include new credentials only; do not include renewals. Numbers do not include Interns or Waivers. *Child Welfare and Attendance is an additional authorization that may be added to a PPS credential in school counseling, school psychology, or school social work.
Figure 9 shows the total number of PPS authorizations issued, by specialization, between 2009‐10 and 2013‐14. As shown in Figure 9, between 60 and 70 percent of the PPS authorizations issued were in School Counseling. School Psychology credentials ranged from 17 to 26 percent of the total number of PPS credentials issued. There was an increase in the proportion of School Psychology (from 17 percent in 2009‐10 to 26 percent in 2013‐14), whereas there was a decrease in the proportion of School Counseling (from 72 percent in 2009‐10 to 61 percent in 2013‐14). School Social Work and Child Welfare and Attendance credentials made up the remaining 11 to 14 percent of the total number of PPS credentials issued and remained fairly steady over the past five years. Figure 9. Distribution of Pupil Personnel Services Credentials Issued, by Specialization areas, 2009‐10 to 2013‐14
72% 73%66% 61% 61%
17% 18%24%
27% 26%
4% 5% 4% 5% 8%
7% 4% 6% 6% 6%
0%
20%
40%
60%
80%
100%
2009‐10 2010‐11 2011‐12 2012‐13 2013‐14
School ChildWelfare andAttendance
School SocialWork
SchoolPsychology
SchoolCounseling
EPC 5A‐16 June 2015
While there are no Emergency Permits available for PPS Credentials, the Commission may issue Variable‐Term Waivers for these credentials. Table 2c shows that the number of PPS Variable‐Term Waivers remained fairly small in the past five years. There was an increase of three Waivers (42.9 percent) between 2012‐13 and 2013‐14. Table 2c. Pupil Personnel Services Credential Waivers Issued, 2009‐10 to 2013‐14
2009‐10 2010‐11 2011‐12 2012‐13 2013‐14
1‐year Change (%) from 2012‐13 to 2013‐14
Waivers 10 8 10 7 10 42.9%Note – Waiver data include both initial issuance and subsequent reissuances. The number of waivers is small over time; caution should be exercised when discussing trend patterns.
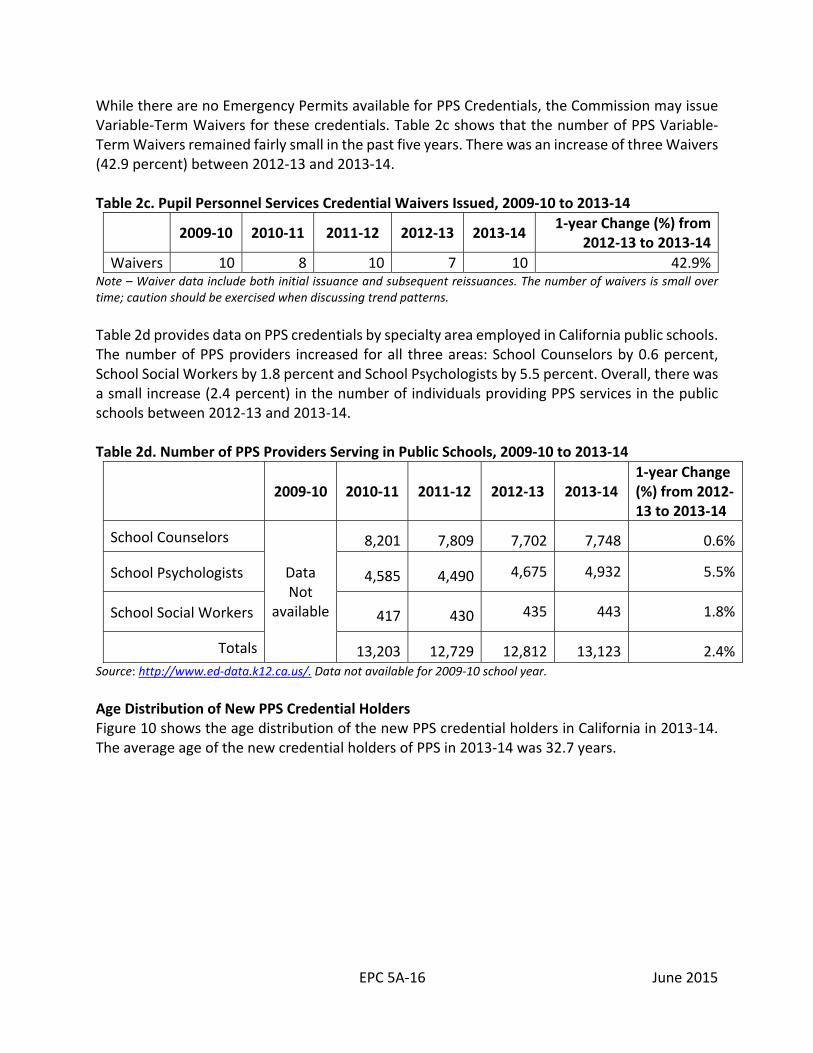
Table 2d provides data on PPS credentials by specialty area employed in California public schools. The number of PPS providers increased for all three areas: School Counselors by 0.6 percent, School Social Workers by 1.8 percent and School Psychologists by 5.5 percent. Overall, there was a small increase (2.4 percent) in the number of individuals providing PPS services in the public schools between 2012‐13 and 2013‐14. Table 2d. Number of PPS Providers Serving in Public Schools, 2009‐10 to 2013‐14
2009‐10 2010‐11 2011‐12 2012‐13 2013‐14 1‐year Change (%) from 2012‐13 to 2013‐14
School Counselors
Data Not
available
8,201 7,809 7,702 7,748 0.6%
School Psychologists 4,585 4,490 4,675 4,932 5.5%
School Social Workers 417 430 435 443 1.8%
Totals 13,203 12,729 12,812 13,123 2.4%Source: http://www.ed‐data.k12.ca.us/. Data not available for 2009‐10 school year.
Age Distribution of New PPS Credential Holders Figure 10 shows the age distribution of the new PPS credential holders in California in 2013‐14. The average age of the new credential holders of PPS in 2013‐14 was 32.7 years.

EPC 5A‐17 June 2015
Figure 10. Age Distribution of New PPS Credential Holders, 2013‐14
School Pupil Personnel Services Staff by Gender and Ethnicity More than four‐fifths (84 percent) of the PPS providers employed in California public schools in 2013‐14 were female. Nearly two‐thirds (62 percent) identified themselves as White and about one‐fourth (19 percent) as Hispanic. African American, Asian/Pacific Islander or Filipino, and American Indian together constituted another one‐sixth of all PPS staff in California public schools (5 percent, 8 percent, and less than 1 percent, respectively) during 2013‐14.
Figure 11. Gender Distribution of Pupil Personnel, 2013‐2014
Figure 12. Ethnic Identification of Pupil Personnel, 2013‐2014
Source: California Department of Education’s Data Quest; Certificated Staff by Ethnicity for 2013‐14. State Summary, Number of school administrators by ethnicity. Asian/Pacific Islander category includes Filipino also.
0
20
40
60
80
100
120
140
160
180
23 25 27 29 31 33 35 37 39 41 43 45 47 49 51 53 55 57 60 62 65 71
Number of Individuals
AGE
Male16%
Female84%
White, 62%Hispanic, 19%
African American
, 5%
Asian/ Pacific
Islander, 8%
American Indian, 0.4%
Multiple race or No
Response, 6%

EPC 5A‐18 June 2015
Speech‐Language Pathology Services and Clinical or Rehabilitative Services Credentials Speech‐Language Pathology and Clinical or Rehabilitative Services Credentials authorize the holders to perform services in one of the following designated areas: Language, Speech, and Hearing; Audiology; or Orientation and Mobility. The services may be provided to students from birth to age 22. AB 2837 (Chap. 581, Stats. 2006) established the Speech‐Language Pathology (SLP) Services Credential as a two‐tiered credential, Preliminary and Clear. The two‐year Preliminary Credential is the first document issued after an individual completes a Commission‐approved program and meets additional specific requirements. Individuals issued the Preliminary Credential are making a commitment to complete the additional requirements to earn a Clear Credential. The SLP Services Credential authorizes the holder to perform the following services: conduct language, speech, and hearing assessments including the screening, evaluation, and interpretation of test results and referrals for further evaluation for treatment and provide educational services including the development of speech and language goals and objectives and the delivery of speech and language services; provide specific learning disability area services related to speech and language; and special education services to individuals with language and speech impairments across the special education disability areas, to students from birth through age 22 in services across the continuum of program options available. Sixteen Commission‐approved program sponsors offer SLP credential programs. Table 3a shows a steady increase in the number of SLP credentials issued in the past five years for both California IHE recommendations and Direct (i.e., out of state prepared) applications. IHE recommendations showed an increase of 6.4 percent and Direct applications an increase of 23.3 percent. Overall, the number of SLP Services Credentials issued increased by 10.5 percent between 2012‐13 and 2013‐14. Table 3a. Speech‐Language Pathology Services Credentials Issued, 2009‐10 to 2013‐14
2009‐10 2010‐11 2011‐12 2012‐13 2013‐14 1‐year Change
(%) from 2012‐13 to 2013‐14
Direct Applications 114 125 130 159 196 23.3%
IHE Recommendations 395 379 428 487 518 6.4%
Totals 509 504 558 646 714 10.5%Note: Data include new credentials only; do not include renewals. SLP authorization became effective 1/1/2007.
Figure 13 illustrates the distribution of new SLP Services Credentials issued by each Commission‐approved program type. More than three‐fourths (78 percent) of the SLP Service Credentials issued are attributed to a CSU and less than one‐fourth (22 percent) to a Private/Independent College or University.

EPC 5A‐19 June 2015
Figure 13. New Speech‐Language Pathology Services Credentials by Program Type, 2013‐14
Despite the large increase in new SLP credentials, the number of Variable‐Term Waivers for positions requiring these authorizations continues to be relatively high in comparison with other Variable‐Term Waivers issued by the Commission. Table 3b reports the number of SLP waivers issued between 2009‐10 and 2013‐14. The number of waivers has declined steadily in the past five years. Between 2012‐13 and 2013‐14, there was a 5.5 percent decrease in waivers. There are no emergency permits issued for SLP. Table 3b. Speech‐Language Pathology Services Credential Waivers Issued, 2009‐10 to 2013‐14
2009‐10 2010‐11 2011‐12 2012‐13 2013‐14
1‐year Change (%) from 2012‐13
to 2013‐14
Waivers 498 436 415 399 377 ‐5.5%Note – Waiver data include both initial issuance and subsequent reissuances. Data include previously issued Clinical and Rehabilitative Services Credential Waivers in Language, Speech and Hearing.
Figure 14 shows that the total number of SLP Services Credentials issued increased steadily in the past five years while there was a downward trend in the number of SLP waivers issued.
CSU78%
Private/Independe
nt
22%

EPC 5A‐20 June 2015
Figure 14. Comparison of SLP Credentials and Waivers Issued, 2009‐10 to 2013‐14
Table 3c shows that there has been a 5 percent increase between 2012‐13 and 2013‐14 in the number of individuals providing language, speech, and hearing services in the public schools.
Table 3c. Number of SLPs Serving in Public Schools, 2009‐10 to 2013‐14
2009‐10 2010‐11 2011‐12 2012‐13 2013‐14
1‐year Change (%) from 2012‐13 to
2013‐14
Totals Not
available 4,646 4,608 4,893 5,137 5.0%
Source: California Department of Education’s Data Quest. Note: CDE data do not disaggregate information into the specializations within the SLP and Clinical or Rehabilitative Services (Audiology and Orientation and Mobility) credential areas.
Age Distribution of New SLP Services Credentials in California Figure 15 shows the age distribution of the new SLP Services Credential holders in California. The average age of the new SLP Services Credential holder in 2013‐14 was 31.9 years.
509 504 558
646 714
498 436 415 399 377
‐
200
400
600
800
2009‐10 2010‐11 2011‐12 2012‐13 2013‐14
Credentials Waivers Linear (Credentials)

EPC 5A‐21 June 2015
Figure 15. Age Distribution of New SLP Credential Holders, 2013‐14
Speech Language Pathology Services Credential Special Class Authorization The Special Class Authorization (SCA) is not a stand‐alone document but rather a teaching authorization that may be added to a credential that authorizes providing speech services. The SCA authorizes the holder to provide instructional services to special needs students in the area of autism and speech and language impairment who are identified through local level special education assessments, and to conduct educational assessments related to students’ access to the academic core curriculum and special education support, from birth through age 22 across the continuum of program options available.
Since the SCA is a teaching rather than service authorization, requirements were updated effective July 1, 2012 to include satisfying subject‐matter competence, reading, and English learner requirements to align with other special education teaching authorizations for the Education Specialist Teaching Credential as well as to ensure compliance with federal No Child Left Behind (NCLB) provisions concerning highly qualified teachers. Over the past 5 years only 13 individuals have earned the Special Class Authorization—6 in 2011‐12, 4, in 2012‐13, and 3 in 2013‐14.
Clinical or Rehabilitative Services Credentials A Clinical or Rehabilitative Services Credential in Audiology authorizes the holder to provide services to individuals with a disability of deaf or hard of hearing, deaf‐blind, and a hearing loss that manifests itself in conjunction with additional disabilities including unilateral or bilateral, whether fluctuating, conductive, sensorineural, and/or auditory neuropathy; to conduct audiologic assessments; and to provide instruction and management of individual and classroom amplification and assistive listening devices, central auditory processing testing.
0
10
20
30
40
50
60
70
80
90
23 25 27 29 31 33 35 37 39 41 43 45 47 49 51 53 55 58 60 64
Number of Individuals
AGE

EPC 5A‐22 June 2015
A Clinical or Rehabilitative Services Credential in Orientation and Mobility authorizes providing services to students who are blind, visually impaired, and deaf‐blind with age‐appropriate, hands‐on experiences; allows individuals to learn how to navigate their natural travel settings including home, school and community; and provides individuals preparation to become independent travelers and assist in the development of a conceptual understanding of the environment. As shown in Table 3d, between 20 to 40 Clinical or Rehabilitative Services Credentials were issued each year. There are two pathways to a Clinical or Rehabilitative Services Credential: direct applications to the Commission (i.e., from individuals prepared out‐of‐state), and recommendation by an IHE. The data show that the number of Orientation and Mobility credentials issued decreased by 34.4 percent in the past year. There are currently no Commission‐approved programs for the Clinical or Rehabilitative Services Credential in Audiology.
Table 3d. Clinical or Rehabilitative Services Credentials Issued by Type, 2009‐10 to 2013‐14
2009‐
102010‐
112011‐
122012‐
132013‐
141‐year Change (%) from
2012‐13 to 2013‐14
Audiology 4 4 6 7 7 0.0%
Orientation and Mobility 20 25 16 32 21 ‐34.4%
Totals 24 29 22 39 28 ‐28.2%Note: Data include new credentials only; do not include renewals. The number of credentials is small over time; caution should be exercised when discussing trend patterns.
Health Services: School Nurse Services Credential The School Nurse Services Credential authorizes the holder to perform the following services:
Conduct immunization programs pursuant to Education Code section 49403 Assess and evaluate the health and developmental status of pupils Interpret the health and developmental assessment to parents, teachers, administrators,
and other professionals directly concerned with the pupil Design and implement individual student health maintenance plans, incorporating plans
directed by a physician Refer the pupil and parent or guardian to appropriate community resources for necessary
services Maintain communication with parents and all involved community practitioners and
agencies to promote needed treatment and secure reports of findings pertinent to educational planning
Interpret medical and nursing findings appropriate to the student’s individualized education program and make recommendations to professional personnel directly involved
Consult with, conduct in‐service training for, and serve as a resource person to teachers and administrators
Develop and implement the health education curriculum Act as a participant in implementing a comprehensive health instruction curriculum for
students Counsel and assist pupils and parents in health‐related and school adjustment services

EPC 5A‐23 June 2015
Teach health‐related subjects under the supervision of a classroom teacher School Nurse Services Credentials in California are issued initially as a Preliminary Credential prior to the individual completing a Commission‐approved preparation program. The Preliminary Credential is issued based on holding a baccalaureate or higher degree from a regionally‐accredited college or university and a valid California Registered Nurse (RN) License. In order to earn the Clear Credential, individuals must complete both a Commission‐approved school nurse preparation program and two years of successful experience as a school nurse. For this reason, the data in Table 4a provides both the initially‐issued Preliminary Credential data as well as the Clear Credential data in order to provide information on the number of individuals coming into the profession as well as those who continue on to complete a Commission‐approved School Nurse Services Credential program. The Commission does not issue emergency permits or waivers for school nurses. Five Commission‐approved program sponsors offer School Nurse Services Credential programs. As seen in Table 4a, the number of preliminary credentials issued showed a steady increase in the past five years. Between 2012‐13 and 2013‐14, there was an increase of 24 percent in the Preliminary Credentials issued. The number of Clear Credentials issued is relatively low; after a significant increase in the 2012‐13 year, there was a small decrease (by 8.4 percent) in 2013‐14. Table 4a. School Nurse Services Credentials Issued, 2009‐10 to 2013‐14
2009‐10 2010‐11 2011‐12 2012‐13 2013‐14 1‐year Change (%) from
2012‐13 to 2013‐14
Preliminary 161 205 198 267 331 24.0%
Clear 7 4 14 95 87 ‐8.4%Note: Data include new credentials only; do not include renewals. The number of credentials is small over time; caution should be exercised when discussing trend patterns.
Figure 16 displays the changes over time in the number of nurses who were issued Preliminary and Clear School Nurse Services Credentials.

EPC 5A‐24 June 2015
Figure 16. Comparison of Preliminary and Clear School Nurse Services Credentials Issued, 2009‐10 to 2013‐14
Figure 17 illustrates the distribution of new School Nurse Services Credentials issued by each program type. More than four‐fifths (97 percent) of the new School Nurse Services Credentials issued were attributed to a CSU and the remaining 3 percent to a Private/Independent College or University.
Figure 17. New School Nurse Services Credentials by Program Type, 2013‐14
Data include new credentials only; do not include renewals.
Table 4b shows the total number of school nurses in the public schools. There has been a steady decrease in the past four years. In between 2012‐13 and 2013‐14, there was a small increase by 3.3 percent in the number of school nurses in California public schools.
161
205 198
267
331
7 4 14
95 87
0
50
100
150
200
250
300
350
2009‐10 2010‐11 2011‐12 2012‐13 2013‐14
Preliminary Clear
CSU97%
Private/Independ
ent3%
EPC 5A‐25 June 2015
Table 4b. Number of School Nurses Serving in California Public Schools, 2009‐10 to 2013‐14
2009‐10 2010‐11 2011‐12 2012‐13 2013‐14 1‐year Change
(%) from 2012‐13 to 2013‐14
Totals Not
available 2,474 2,361 2,287 2,362 3.3%
Source: http://www.ed‐data.k12.ca.us/
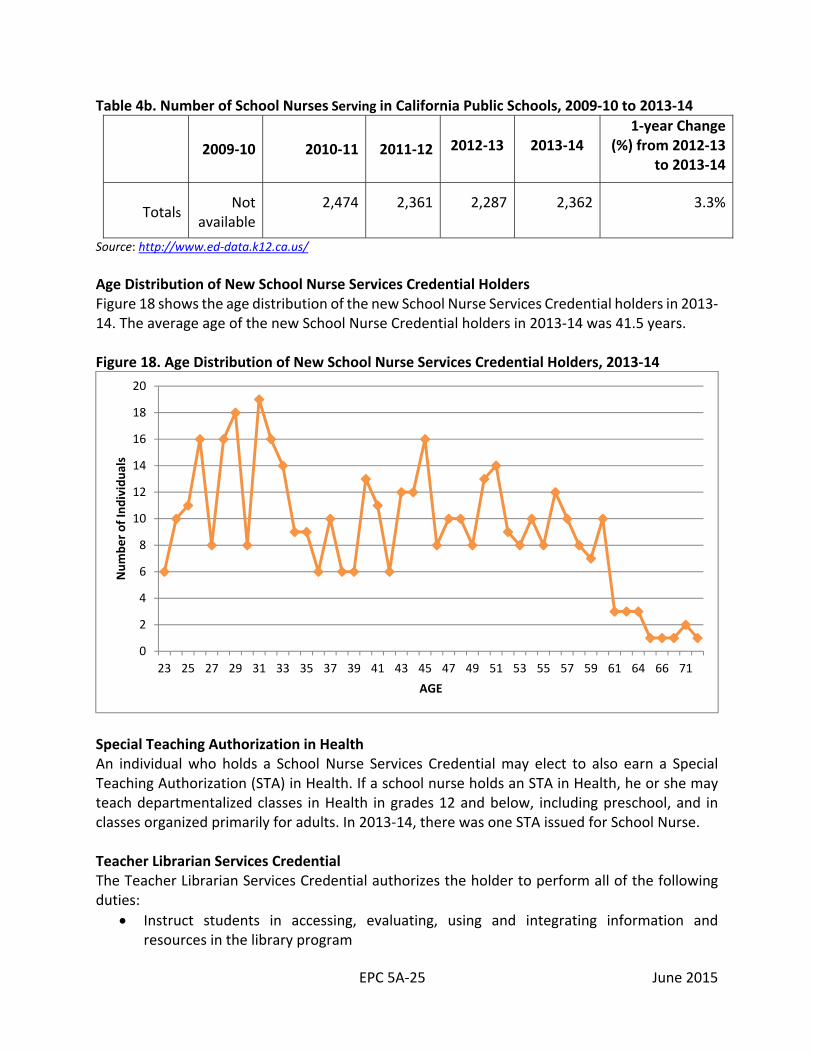
Age Distribution of New School Nurse Services Credential Holders Figure 18 shows the age distribution of the new School Nurse Services Credential holders in 2013‐14. The average age of the new School Nurse Credential holders in 2013‐14 was 41.5 years. Figure 18. Age Distribution of New School Nurse Services Credential Holders, 2013‐14
Special Teaching Authorization in Health An individual who holds a School Nurse Services Credential may elect to also earn a Special Teaching Authorization (STA) in Health. If a school nurse holds an STA in Health, he or she may teach departmentalized classes in Health in grades 12 and below, including preschool, and in classes organized primarily for adults. In 2013‐14, there was one STA issued for School Nurse. Teacher Librarian Services Credential The Teacher Librarian Services Credential authorizes the holder to perform all of the following duties:
Instruct students in accessing, evaluating, using and integrating information and resources in the library program
0
2
4
6
8
10
12
14
16
18
20
23 25 27 29 31 33 35 37 39 41 43 45 47 49 51 53 55 57 59 61 64 66 71
Number of Individuals
AGE

EPC 5A‐26 June 2015
Plan and coordinate school library programs with the instructional programs of a school district through collaboration with teachers
Select materials for school and district libraries
Develop programs for and deliver staff development for school library services
Coordinate or supervise library programs at the school, district or county level
Plan and conduct a course of instruction for those pupils who assist in the operation of school libraries
Supervise classified personnel assigned school library duties
Develop procedures for and management of the school and district libraries Four Commission‐approved program sponsors offer Teacher Librarian Services credential programs. Table 5a illustrates that there was a decrease in the number of credentials recommended by IHEs in the past five years. Overall, between 2012‐13 and 2013‐14, there was a decrease of 19.6 percent in the total number of credentials issued for school librarians. Table 5a. Teacher Librarian Service Credentials Issued, 2009‐10 to 2013‐14
2009‐10 2010‐11 2011‐12 2012‐13 2013‐14 1‐year Change (%) from 2012‐13 to
2013‐14
Direct Applications 8 7 7 8 7 ‐12.5%
IHE Recommendations 98 97 69 48 38 ‐20.8%
Totals 106 104 76 56 45 ‐19.6%Note: Data include new credentials only; do not include renewals. Data include both previously issued Library Media Teacher Services Credentials and current Teacher Librarian Services Credentials. Direct Applications represent credentials issued by the Commission directly to individuals, primarily out of state prepared individuals.
Figure 19 illustrates the distribution of new Teacher Librarian Services Credentials recommended by IHEs in 2013‐14. Nearly two‐thirds (61 percent) of the new credentials issued were attributed to a CSU and more than one‐third (39 percent) to a Private/Independent College or University.

EPC 5A‐27 June 2015
Figure 19. New Teacher Librarian Service Credentials by Program Type, 2013‐14
Teacher Librarian Service Credential Special Class Authorization This Special Class Authorization (SCA) authorizes the holder to provide departmentalized instruction in information literacy, digital literacy, and digital citizenship to students in grades 12 and below, including preschool and in classes organized primarily for adults. In 2013‐14, there were six SCAs issued for teacher librarian. Emergency Teacher Librarian Permits and Waivers As shown in Table 5b, between 100 and 200 emergency permits were issued in the past five years with a significant decline in 2012‐13. The number of waivers was small, with an increase in 2013‐14. Overall, there was an increase of 28.4 percent between 2012‐13 and 2013‐14, when data on emergency permits and waivers were combined. Table 5b. Emergency Teacher Librarian Permits and Waivers Issued, 2009‐10 to 2013‐14
2009‐10 2010‐11 2011‐12 2012‐13 2013‐14
1‐year Change (%) from 2012‐13 to
2013‐14
Emergency Permits 192 140 110 91 114 25.3%
Waivers 8 6 6 4 8 100.0%
Totals 200 146 116 95 122 28.4%Note – Waiver data include both initial issuance and subsequent reissuances. Since the number of waivers issued is small, caution must be used when discussing trend patterns.
Figure 20 illustrates the trends in the credentials, emergency permits and waivers issued. It is noteworthy that the number of emergency permits exceeded the total number of credentials granted each year, in spite of the downward trend of the emergency permits.
CSU61%
Private/Independent39%

EPC 5A‐28 June 2015
Figure 20. Comparison of Credentials, Waivers, and Emergency Permits Issued for Teacher Librarians, 2009‐10 to 2013‐14
As shown in Table 5c, there was a steady decline in the number of school librarians in California public schools in the first couple of years. However, between 2012‐13 and 2013‐14, there was a small increase of 2 percent. Table 5c. Number of Teacher Librarians Serving in Public Schools, 2009‐10 to 2013‐14
2009‐10 2010‐11 2011‐12 2012‐13 2013‐14 1‐year Change
(%) from 2012‐13 to 2013‐14
Totals Not
available 895 834 804 820 2.0%
Source: http://www.ed‐data.k12.ca.us/
Age Distribution of New Teacher Librarian Services Credential Holders Figure 21 shows the age distribution of the new Teacher Librarian Services Credential holders in 2013‐14. The average age of the new Teacher Librarian Services Credential holders in 2013‐14 was 46.1 years.
106 104
76
56 45
8 6 6 4 8
192
140
110
91
114
‐
40
80
120
160
200
240
2009‐10 2010‐11 2011‐12 2012‐13 2013‐14
Credentials Waivers Emergency Permits Linear (Emergency Permits)

EPC 5A‐29 June 2015
Figure 21. Age Distribution of New School Librarian Services Credential Holders, 2013‐14
School Administrators, Pupil Services, Teachers, All Certificated Staff and Length of Service According to the California Department of Education (CDE)’s Certificated Staff Experience Report for 2013‐14, the average number of years in educational service for school administrators was 18 years while the average years serving in the same school district was 13 years in the academic year 2013‐14. The average number of years in educational service and average number of years in the same school district for pupil services was 14 and 11 years, respectively. For comparison purposes, the average number of years of service for teachers was 14 years and the average number of years in the same district was 12 years. When all certificated staff was considered, the average number of years in educational service was 14 years and the number of years in the same district was 12 years. Data and Figure 22 indicate that educators tend to stay in the profession longer than they stay in the same school district. School administrators had the biggest difference between number of years in educational service and number of years in the same district, by 5 percentage points. The difference ranged from 2 percentage points for teachers to 3 percentage points for pupil services.
0
1
2
3
4
5
6
31 32 33 34 35 36 37 39 41 44 45 46 47 49 50 51 52 53 55 56 57 59 60 61 62 63 67
Number of Individuals
AGE

EPC 5A‐30 June 2015
Figure 22. Average Years of Educational Service and Years of Service in District for Certificated Staff Serving in Public Schools, 2013‐14
Data Source: California Department of Education, Staff Service and Experience for 2013‐14
The definition of Years in Educational Service and Years in District are described below:
Average Years of Educational Service – Total years of public and/or private educational service. Includes services in this districts, other districts, other states, and countries. Does not include substitute teaching or classified staff service. The first year of service is counted as 1 year.
Average Years in District – Total years of service in a certified position in the same district.
The first year of service is counted as 1 year.
When the average number of years of educational service was analyzed by county, the number of counties above the state average, at the state average and below the state average differed for teachers, administrators, and pupil services. It is apparent that teachers, school administrators, and pupil personnel services providers in smaller counties tend to stay in educational services longer. Table 6. Average Number of Years of Education Service by County
Teachers Administrator Pupil Personnel Services State Mean 14 Years 18 Years 14 Years
# Counties and Mean
Above 13 16 19
At 21 13 15
Below 24 29 24
14
18
14 14
1213
1112
0
4
8
12
16
20
Teachers Administrators Pupil Services All Certificated staff
Average
Years
Average Years of Educational Service Average Years in District

EPC 5A‐31 June 2015
Teachers Administrator Pupil Personnel Services
Counties that exceed state mean
Alpine, Butte, Calaveras, Del Norte, El Dorado, Los Angeles, Mariposa, Nevada, Orange, Placer, San Luis Obispo, Sierra, Tehama Range 15‐21 Years
Amador, Butte, Calaveras, Del Norte, El Dorado, Nevada, San Luis Obispo, Los Angeles, Marin, Mendocino, Placer, San Diego, Shasta, Sierra, Siskiyou, Trinity
Range 19‐25 years
Alpine, Butte, Calaveras, El Dorado, Fresno, Glenn, Lassen, Madera, Marin, Napa, Nevada, Plumas, San Benito, Santa Cruz, Siskiyou, Sonoma, San Bernardino, Shasta, Yuba
Range 15‐18 Years Data Source: California Department of Education, Staff Service and Experience for 2013‐14
Figure 23 depicts the gender distribution of teachers, school administrators, pupil personnel services providers, and all certificated staff in 2013‐14. Nearly three‐fourths (73 percent) of the teachers were female while nearly two‐thirds (61 percent) of the school administrators were female. By contrast, more than four‐fifths (84 percent) of the pupil personnel services providers were female. When the gender distribution of all certificated staff was compared with teachers, the proportion of female/male was the same as for teachers: 73 percent and 27 percent, respectively. Figure 23. Gender Distribution of Certificated Staff Serving in Public Schools, 2013‐14
Data Source: California Department of Education, Staff Service and Experience for 2013‐14
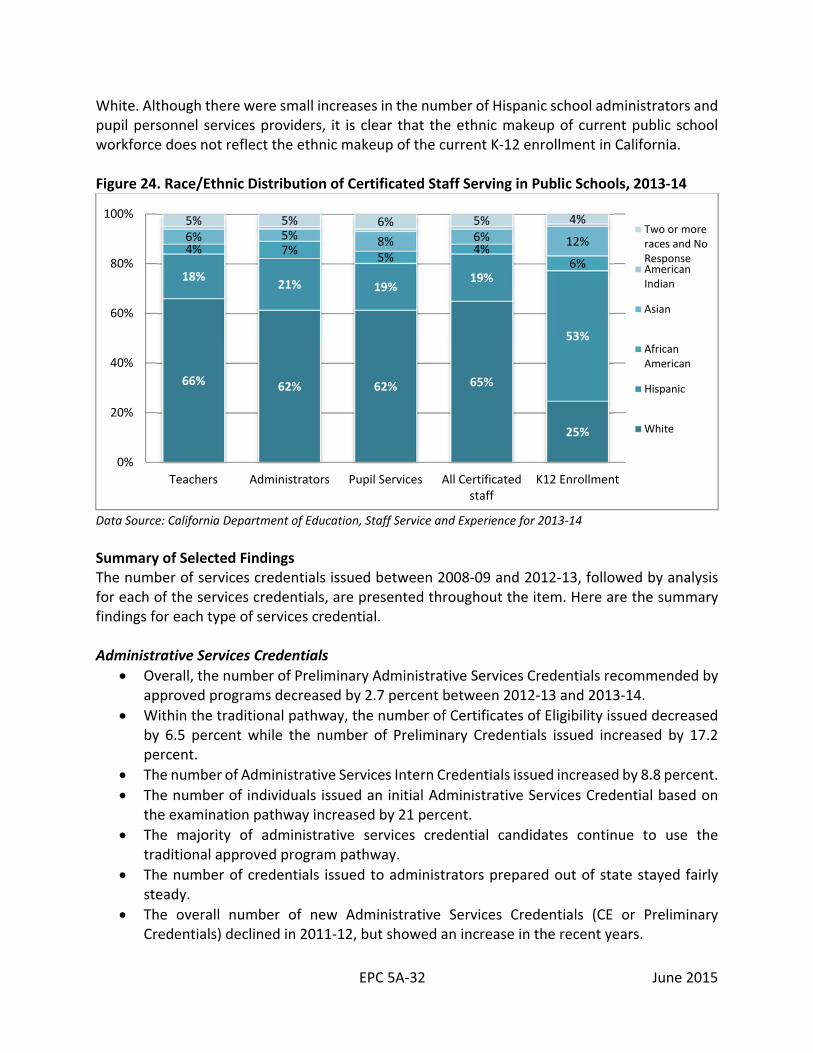
Figure 24 depicts the ethnic identification of teachers, school administrators, pupil personnel services providers, and all certificated staff in 2013‐14. It is interesting to note that for all four groups, nearly two‐thirds identified themselves as White followed by about one‐fifth identifying themselves as Hispanic. By contrast, the current K‐12 enrollment’s ethnic distribution looks very different – more than half (53 percent) of the K‐12 enrollment is Hispanic and one‐fourth is
27%39%
16%27%
73%61%
84%73%
0%
20%
40%
60%
80%
100%
Teachers Administrators Pupil Services All Certificated staff
Female
Male
EPC 5A‐32 June 2015
White. Although there were small increases in the number of Hispanic school administrators and pupil personnel services providers, it is clear that the ethnic makeup of current public school workforce does not reflect the ethnic makeup of the current K‐12 enrollment in California. Figure 24. Race/Ethnic Distribution of Certificated Staff Serving in Public Schools, 2013‐14
Data Source: California Department of Education, Staff Service and Experience for 2013‐14
Summary of Selected Findings The number of services credentials issued between 2008‐09 and 2012‐13, followed by analysis for each of the services credentials, are presented throughout the item. Here are the summary findings for each type of services credential. Administrative Services Credentials
Overall, the number of Preliminary Administrative Services Credentials recommended by approved programs decreased by 2.7 percent between 2012‐13 and 2013‐14.
Within the traditional pathway, the number of Certificates of Eligibility issued decreased by 6.5 percent while the number of Preliminary Credentials issued increased by 17.2 percent.
The number of Administrative Services Intern Credentials issued increased by 8.8 percent.
The number of individuals issued an initial Administrative Services Credential based on the examination pathway increased by 21 percent.
The majority of administrative services credential candidates continue to use the traditional approved program pathway.
The number of credentials issued to administrators prepared out of state stayed fairly steady.
The overall number of new Administrative Services Credentials (CE or Preliminary Credentials) declined in 2011‐12, but showed an increase in the recent years.
66% 62% 62% 65%
25%
18%21% 19%
19%
53%
4% 7%5%
4%6%
6% 5% 8% 6% 12%
5% 5% 6% 5% 4%
0%
20%
40%
60%
80%
100%
Teachers Administrators Pupil Services All Certificatedstaff
K12 Enrollment
Two or moreraces and NoResponseAmericanIndian
Asian
AfricanAmerican
Hispanic
White

EPC 5A‐33 June 2015
In spite of the decrease in the past four years, the proportion of individuals issued a CE without an offer of employment as an administrator in California is relatively high compared to those individuals issued a Preliminary Credential with an offer of employment in California.
The number of administrative positions in California increased in the past two years.
Pupil Personnel Services Credentials
Overall, there was an increase (by 7.3 percent) in the total number of PPS credentials issued.
There were increases for all three areas ‐ School Counseling by 5.4 percent, School Psychology by 0.2 percent, School Social Work by 54.2 percent, and Child Welfare and Attendance by 3.1 percent.
There was a significant shift in the proportion of specialty areas of PPS: School Counseling was 72 percent in 2009‐10 and dropped to 61 percent in 2013‐14. School Psychology was 17 percent in 2009‐10 and increased to 26 percent in 2013‐14.
The number of PPS Intern credentials increased by 15 percent.
There was an overall increase (2.4 percent) in the number of PPS credential holders providing services in the public schools: an increase of 5.5 percent for School Psychologists, 1.8 percent for School Social Workers and 0.6 percent for School Counselors.
Speech‐Language Pathology (SLP) Services Credentials
There was an increase (by 10.5 percent) in the number of SLP Services Credentials issued.
In turn, there was a decrease of 5.5 percent in the number of SLP Variable‐Term Waivers issued.
There was a steady upward trend in the number of SLP Services Credentials issued and a downward trend in the number of Waivers issued in the past five years. Compared to five years ago, more than 200 credentials were issued in 2013‐14, while about 120 less Waivers issued between 2009‐10 and 2013‐14.
There was a 5 percent increase in the number of individuals providing speech/hearing/language services in California public schools.
School Nurse Credentials
There was a steady upward pattern in the number of Preliminary Credentials issued ‐ increased by 24 percent between 2012‐13 and 2013‐14.
There has been a small increase (by 3.3 percent) in the number of school nurses serving in California public schools in between 2012‐13 and 2013‐14.
Teacher Librarian Services Credentials
The number of Teacher Librarian Services Credentials issued decreased by 19.6 percent.
There has been an increase in the number of Emergency Permits issued ‐ increased by 25.3 percent between 2012‐13 and 2013‐14.

EPC 5A‐34 June 2015
Though the number of waivers is relatively small, there has been a steady decline in the number of waivers issued in the past four years; however, there was an increase between 2012‐13 and 2013‐14. Overall, there was an increase of 28.4 percent when emergency permits and waivers were combined. Nevertheless, in every year studied, the number of emergency permits issued was greater than the total number of Teacher Librarian credentials issued.
The number of teacher librarians serving in California public schools showed a small increase by 2 percent between 2012‐13 and 2013‐14.
Overall, at the state level, the new Administrative Services credentials and Teacher Librarian Services credentials showed decreases while other services credentials (PPS, SLP, School Nurse) showed increases. The number of school personnel also increased for all groups – school administrators, pupil personnel, speech therapists, school nurses, and teacher librarians between 2012‐13 and 2013‐14.

EPC 5A‐35 June 2015
References Information on the authorizations and requirements for each of the Services Credentials detailed in this report may be accessed through informational leaflets published by the Commission provided in the links below.
1. Administrative Services Credential ‐ California Prepared – CL‐574C http://www.ctc.ca.gov/credentials/leaflets/cl574c.pdf
2. Administrative Services Credential ‐ Out‐of‐State Prepared – CL‐574 http://www.ctc.ca.gov/credentials/leaflets/cl574.pdf
3. Pupil Personnel Services Credential For Individuals Prepared In California – CL‐606C
http://www.ctc.ca.gov/credentials/leaflets/cl606c.pdf
4. Pupil Personnel Services Credentials – Out‐of‐State Prepared ‐ CL‐606 http://www.ctc.ca.gov/credentials/leaflets/cl606.pdf
5. Speech‐Language Pathology Services Credential –CL‐879
http://www.ctc.ca.gov/credentials/leaflets/cl879.pdf
6. Clinical or Rehabilitative Services Credentials – CL‐610 http://www.ctc.ca.gov/credentials/leaflets/cl610.pdf
7. School Nurse and Other Health Services Credentials – CL‐380
http://www.ctc.ca.gov/credentials/leaflets/cl380.pdf
8. Teacher Librarian Services Credentials – CL‐562 http://www.ctc.ca.gov/credentials/leaflets/cl562.pdf
9. Emergency Teacher Librarian Services Permits – CL‐533O‐LIB http://www.ctc.ca.gov/credentials/leaflets/cl533o‐LIB.pdf