Embed Size (px)
Citation preview
1
5G New Radio in mmWave Spectrum Bands
June 2nd , 2017
2
© Nokia 2017
Summary
• Nokia also sees value in 5G @ 70/80 GHz (part of 3GPP Phase 2)• 10 GHz of spectrum available worldwide and under study in ITU
• Use 2 GHz of BW can meet 3GPP requirements
• > 10 Gbps Peak Rate
• > 100 Mbps of cell edge rate
• Higher mmWave Spectrum is no different than lower mmWave spectrum:• Similar channel models
• Higher pathloss can be mitigated by using large number of antenna elements
• Marginal performance difference between high and low mmWave bands
• Many similarities in RFIC technology between higher and lower mmWave bands
• Feasibility:• Nokia has demonstrated 70 GHz PoC with multiple features
• Nokia has addressed co-existence issues with existing backhaul links
• Nokia is fully committed to 5G @ bands below 52.6GHz (3GPP Phase 1)
3
5G New Radio- 3GPP Timeline
4
© Nokia 2017
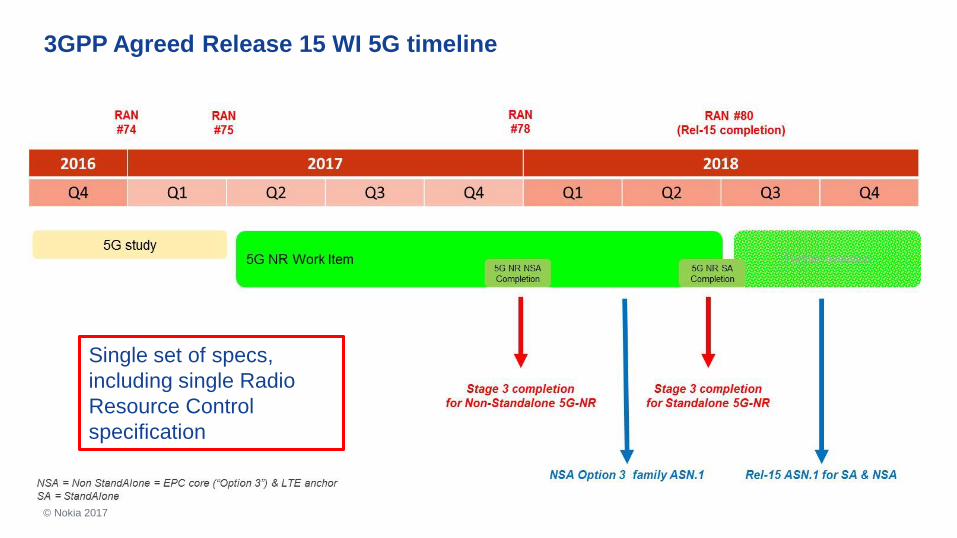
3GPP Agreed Release 15 WI 5G timeline
Single set of specs,
including single Radio
Resource Control
specification
5
© Nokia 2017
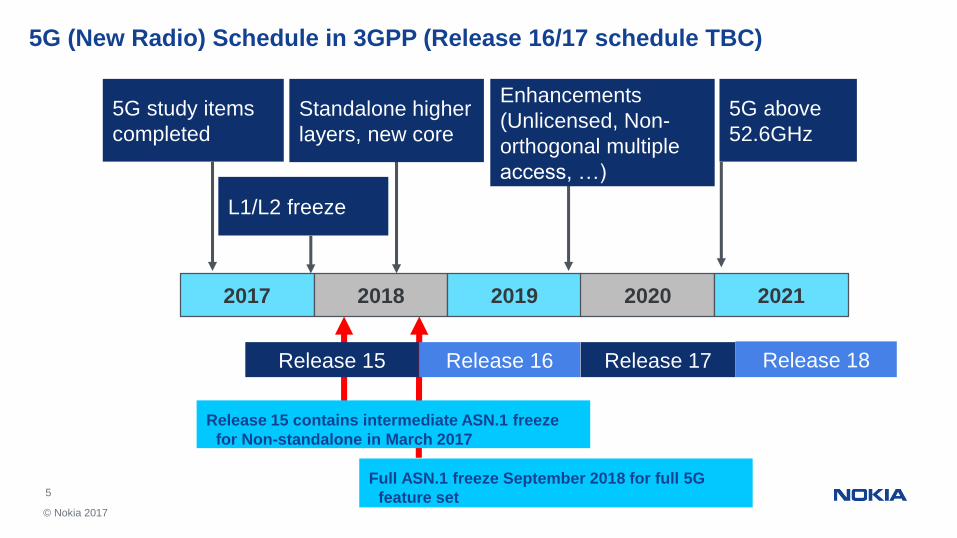
5G (New Radio) Schedule in 3GPP (Release 16/17 schedule TBC)
5G study items
completed
L1/L2 freeze
Standalone higher
layers, new core
Enhancements
(Unlicensed, Non-
orthogonal multiple
access, …)
2017 2018 2019 2020
5G above
52.6GHz
2021
Release 15 Release 16 Release 17 Release 18
Full ASN.1 freeze September 2018 for full 5G
feature set
Release 15 contains intermediate ASN.1 freeze
for Non-standalone in March 2017
6
© Nokia 2017
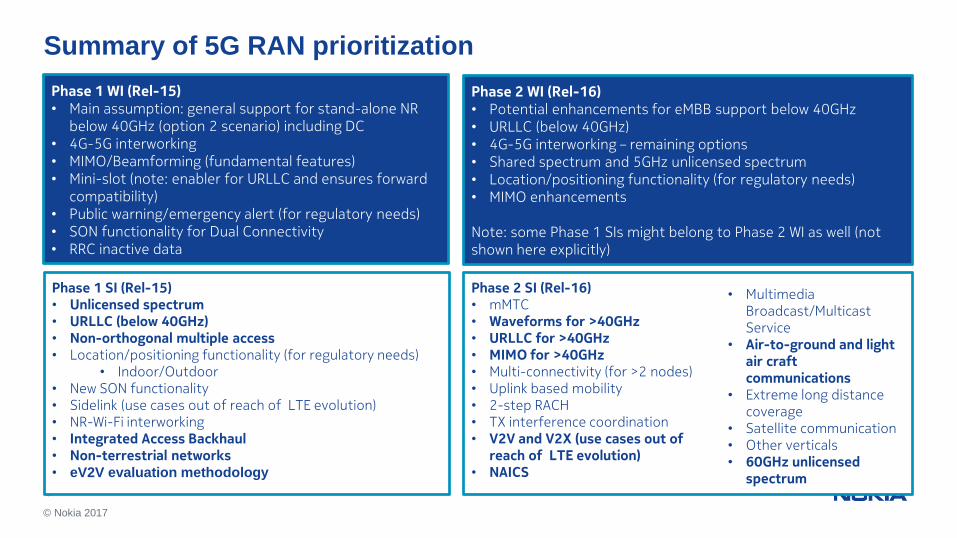
Summary of 5G RAN prioritization
Phase 1 WI (Rel-15)• Main assumption: general support for stand-alone NR
below 40GHz (option 2 scenario) including DC• 4G-5G interworking• MIMO/Beamforming (fundamental features)• Mini-slot (note: enabler for URLLC and ensures forward
compatibility)• Public warning/emergency alert (for regulatory needs)• SON functionality for Dual Connectivity • RRC inactive data
Phase 2 WI (Rel-16)• Potential enhancements for eMBB support below 40GHz• URLLC (below 40GHz)• 4G-5G interworking – remaining options• Shared spectrum and 5GHz unlicensed spectrum• Location/positioning functionality (for regulatory needs)• MIMO enhancements
Note: some Phase 1 SIs might belong to Phase 2 WI as well (not shown here explicitly)
Phase 1 SI (Rel-15)• Unlicensed spectrum• URLLC (below 40GHz) • Non-orthogonal multiple access• Location/positioning functionality (for regulatory needs)
• Indoor/Outdoor• New SON functionality• Sidelink (use cases out of reach of LTE evolution)• NR-Wi-Fi interworking• Integrated Access Backhaul• Non-terrestrial networks• eV2V evaluation methodology
Phase 2 SI (Rel-16)• mMTC• Waveforms for >40GHz• URLLC for >40GHz• MIMO for >40GHz• Multi-connectivity (for >2 nodes)• Uplink based mobility• 2-step RACH• TX interference coordination• V2V and V2X (use cases out of
reach of LTE evolution)• NAICS
• Multimedia Broadcast/Multicast Service
• Air-to-ground and light air craft communications
• Extreme long distance coverage
• Satellite communication• Other verticals• 60GHz unlicensed
spectrum
7
© Nokia 2017
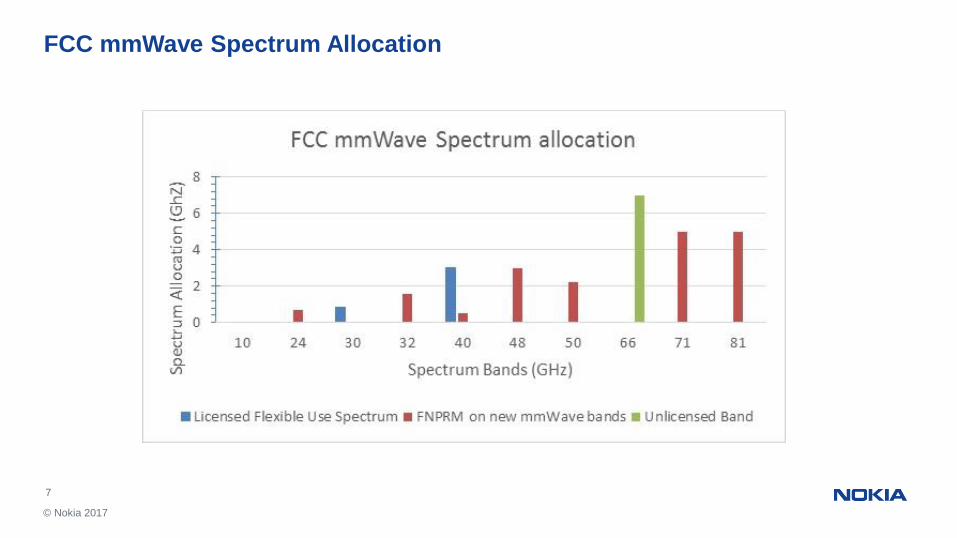
FCC mmWave Spectrum Allocation
8
5G New Radio- mmWave Challenges and Peak Rates
9
© Nokia 2017
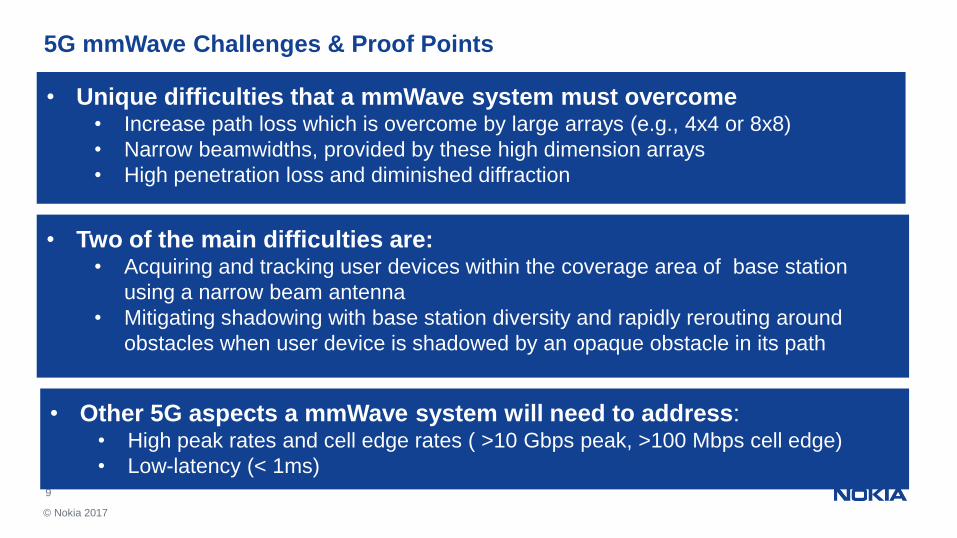
• Unique difficulties that a mmWave system must overcome • Increase path loss which is overcome by large arrays (e.g., 4x4 or 8x8)
• Narrow beamwidths, provided by these high dimension arrays
• High penetration loss and diminished diffraction
5G mmWave Challenges & Proof Points
• Two of the main difficulties are:• Acquiring and tracking user devices within the coverage area of base station
using a narrow beam antenna
• Mitigating shadowing with base station diversity and rapidly rerouting around
obstacles when user device is shadowed by an opaque obstacle in its path
• Other 5G aspects a mmWave system will need to address:• High peak rates and cell edge rates ( >10 Gbps peak, >100 Mbps cell edge)
• Low-latency (< 1ms)
10
© Nokia 2017
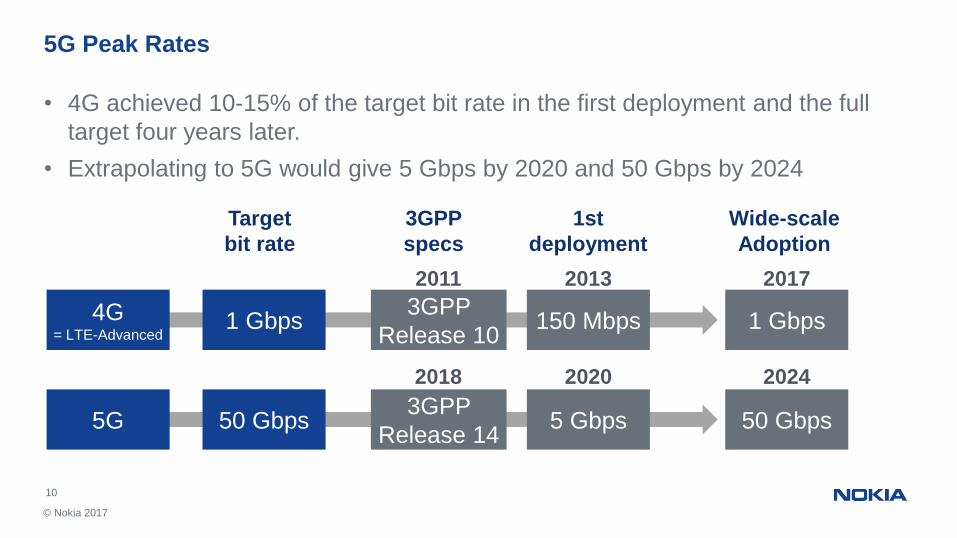
• 4G achieved 10-15% of the target bit rate in the first deployment and the full
target four years later.
• Extrapolating to 5G would give 5 Gbps by 2020 and 50 Gbps by 2024
5G Peak Rates
2013
150 Mbps
2017
1 Gbps4G = LTE-Advanced
3GPP
Release 10
2011
1 Gbps
2020
5 Gbps
2024
50 Gbps5G 3GPP
Release 14
2018
50 Gbps
Target
bit rate
3GPP
specs
1st
deployment
Wide-scale
Adoption
11
5G mmWave : Channel Models
12
© Nokia 2017
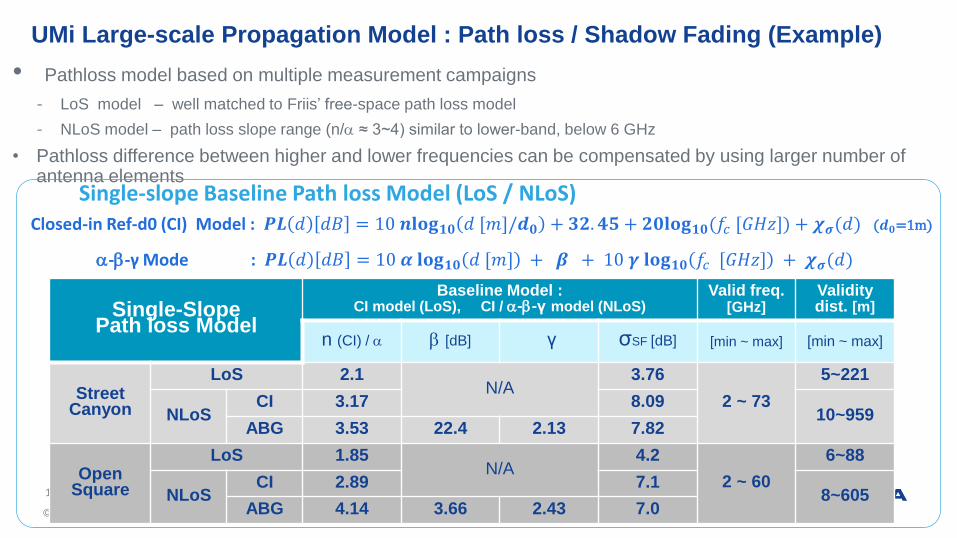
• Pathloss model based on multiple measurement campaigns
- LoS model – well matched to Friis’ free-space path loss model
- NLoS model – path loss slope range (n/ ≈ 3~4) similar to lower-band, below 6 GHz
• Pathloss difference between higher and lower frequencies can be compensated by using larger number of antenna elements
UMi Large-scale Propagation Model : Path loss / Shadow Fading (Example)
Single-Slope Path loss Model
Baseline Model : CI model (LoS), CI / --γ model (NLoS)
Valid freq.[GHz]
Validitydist. [m]
n (CI) / [dB] γ σSF [dB] [min ~ max] [min ~ max]
Street Canyon
LoS 2.1N/A
3.76
2 ~ 73
5~221
NLoSCI 3.17 8.09
10~959ABG 3.53 22.4 2.13 7.82
OpenSquare
LoS 1.85N/A
4.2
2 ~ 60
6~88
NLoSCI 2.89 7.1
8~605ABG 4.14 3.66 2.43 7.0
Closed-in Ref-d0 (CI) Model : 𝑷𝑳 𝑑 𝑑𝐵 = 10 𝒏𝐥𝐨𝐠𝟏𝟎 𝑑 [𝑚]/𝒅𝟎 + 𝟑𝟐. 𝟒𝟓 + 𝟐𝟎𝐥𝐨𝐠𝟏𝟎(𝑓𝑐 [𝐺𝐻𝑧]) + 𝝌𝝈(𝑑) (𝒅𝟎=1m)
--γ Mode : 𝑷𝑳 𝑑 𝑑𝐵 = 10 𝜶 𝐥𝐨𝐠𝟏𝟎 𝑑 [𝑚] + 𝜷 + 10 𝜸 𝐥𝐨𝐠𝟏𝟎 𝑓𝑐 [𝐺𝐻𝑧] + 𝝌𝝈(𝑑)
13
© Nokia 2017
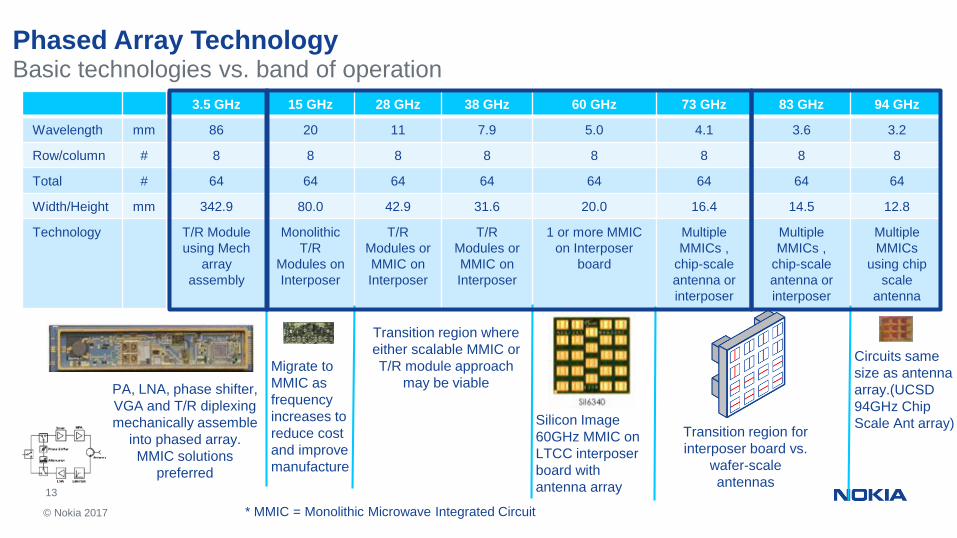
3.5 GHz 15 GHz 28 GHz 38 GHz 60 GHz 73 GHz 83 GHz 94 GHz
Wavelength mm 86 20 11 7.9 5.0 4.1 3.6 3.2
Row/column # 8 8 8 8 8 8 8 8
Total # 64 64 64 64 64 64 64 64
Width/Height mm 342.9 80.0 42.9 31.6 20.0 16.4 14.5 12.8
Technology T/R Module
using Mech
array
assembly
Monolithic
T/R
Modules on
Interposer
T/R
Modules or
MMIC on
Interposer
T/R
Modules or
MMIC on
Interposer
1 or more MMIC
on Interposer
board
Multiple
MMICs ,
chip-scale
antenna or
interposer
Multiple
MMICs ,
chip-scale
antenna or
interposer
Multiple
MMICs
using chip
scale
antenna
Phased Array Technology
Circuits same
size as antenna
array.(UCSD
94GHz Chip
Scale Ant array)Silicon Image
60GHz MMIC on
LTCC interposer
board with
antenna array
Transition region for
interposer board vs.
wafer-scale
antennas
PA, LNA, phase shifter,
VGA and T/R diplexing
mechanically assemble
into phased array.
MMIC solutions
preferred
Migrate to
MMIC as
frequency
increases to
reduce cost
and improve
manufacture
Transition region where
either scalable MMIC or
T/R module approach
may be viable
Basic technologies vs. band of operation
* MMIC = Monolithic Microwave Integrated Circuit
14
© Nokia 2017
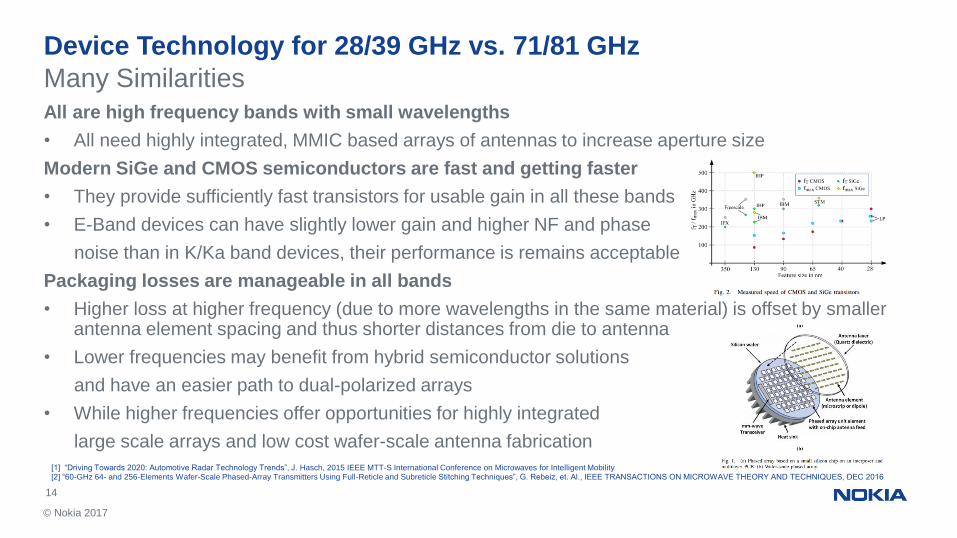
Many Similarities
Device Technology for 28/39 GHz vs. 71/81 GHz
All are high frequency bands with small wavelengths
• All need highly integrated, MMIC based arrays of antennas to increase aperture size
Modern SiGe and CMOS semiconductors are fast and getting faster
• They provide sufficiently fast transistors for usable gain in all these bands
• E-Band devices can have slightly lower gain and higher NF and phase
noise than in K/Ka band devices, their performance is remains acceptable
Packaging losses are manageable in all bands
• Higher loss at higher frequency (due to more wavelengths in the same material) is offset by smaller antenna element spacing and thus shorter distances from die to antenna
• Lower frequencies may benefit from hybrid semiconductor solutions
and have an easier path to dual-polarized arrays
• While higher frequencies offer opportunities for highly integrated
large scale arrays and low cost wafer-scale antenna fabrication
[1] “Driving Towards 2020: Automotive Radar Technology Trends”, J. Hasch, 2015 IEEE MTT-S International Conference on Microwaves for Intelligent Mobility [2] “60-GHz 64- and 256-Elements Wafer-Scale Phased-Array Transmitters Using Full-Reticle and Subreticle Stitching Techniques”, G. Rebeiz, et. Al., IEEE TRANSACTIONS ON MICROWAVE THEORY AND TECHNIQUES, DEC 2016
[1]
[2]
15
System Level Simulation Results
16
© Nokia 2017
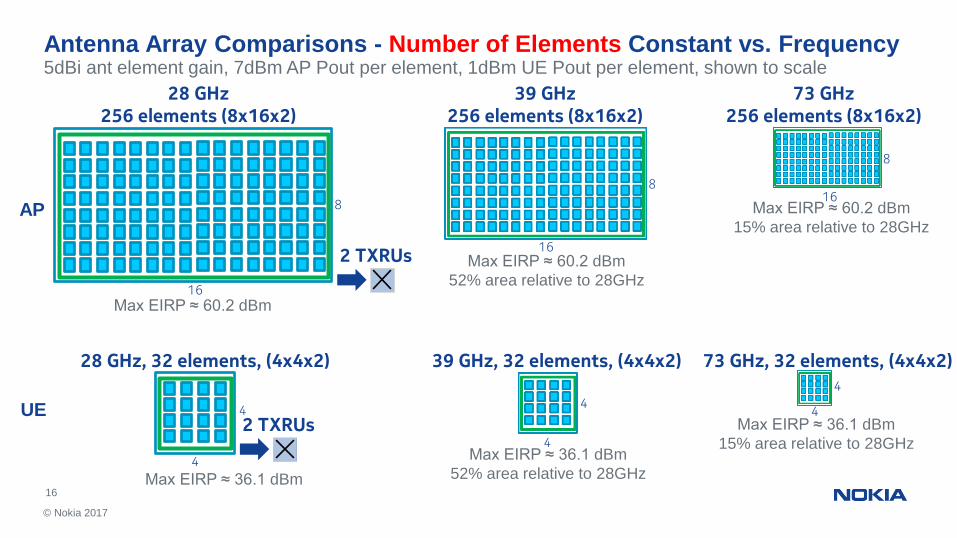
Antenna Array Comparisons - Number of Elements Constant vs. Frequency5dBi ant element gain, 7dBm AP Pout per element, 1dBm UE Pout per element, shown to scale
AP
Max EIRP ≈ 60.2 dBm
8
16
2 TXRUs Max EIRP ≈ 60.2 dBm
52% area relative to 28GHz
Max EIRP ≈ 60.2 dBm
15% area relative to 28GHz
16
8
8
16
4
4
Max EIRP ≈ 36.1 dBm
2 TXRUs
4
4
4
4
Max EIRP ≈ 36.1 dBm
52% area relative to 28GHz
Max EIRP ≈ 36.1 dBm
15% area relative to 28GHz
28 GHz256 elements (8x16x2)
39 GHz256 elements (8x16x2)
73 GHz256 elements (8x16x2)
UE
73 GHz, 32 elements, (4x4x2)39 GHz, 32 elements, (4x4x2)28 GHz, 32 elements, (4x4x2)
17
© Nokia 2017
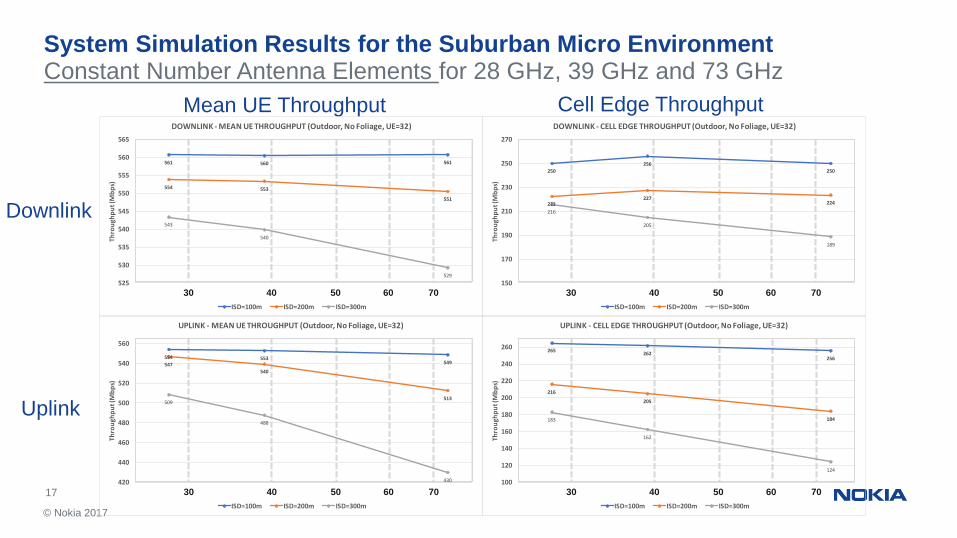
System Simulation Results for the Suburban Micro EnvironmentConstant Number Antenna Elements for 28 GHz, 39 GHz and 73 GHz
Mean UE Throughput Cell Edge Throughput
30 40 50 60 70 30 40 50 60 70
30 40 50 60 70 30 40 50 60 70
Downlink
Uplink
561 560 561
554 553
551
543
540
529
525
530
535
540
545
550
555
560
565
25
Thro
ugh
pu
t (M
bp
s)
DOWNLINK - MEAN UE THROUGHPUT (Outdoor, No Foliage, UE=32)
ISD=100m ISD=200m ISD=300m
250
256
250
222227
224
216
205
189
150
170
190
210
230
250
270
25
Thro
ugh
pu
t (M
bp
s)
DOWNLINK - CELL EDGE THROUGHPUT (Outdoor, No Foliage, UE=32)
ISD=100m ISD=200m ISD=300m
554 553549547
540
513509
488
430420
440
460
480
500
520
540
560
25
Thro
ugh
pu
t (M
bp
s)
UPLINK - MEAN UE THROUGHPUT (Outdoor, No Foliage, UE=32)
ISD=100m ISD=200m ISD=300m
265262
256
216
205
184183
162
124
100
120
140
160
180
200
220
240
260
25Th
rou
ghp
ut (
Mb
ps)
UPLINK - CELL EDGE THROUGHPUT (Outdoor, No Foliage, UE=32)
ISD=100m ISD=200m ISD=300m
18
© Nokia 2017
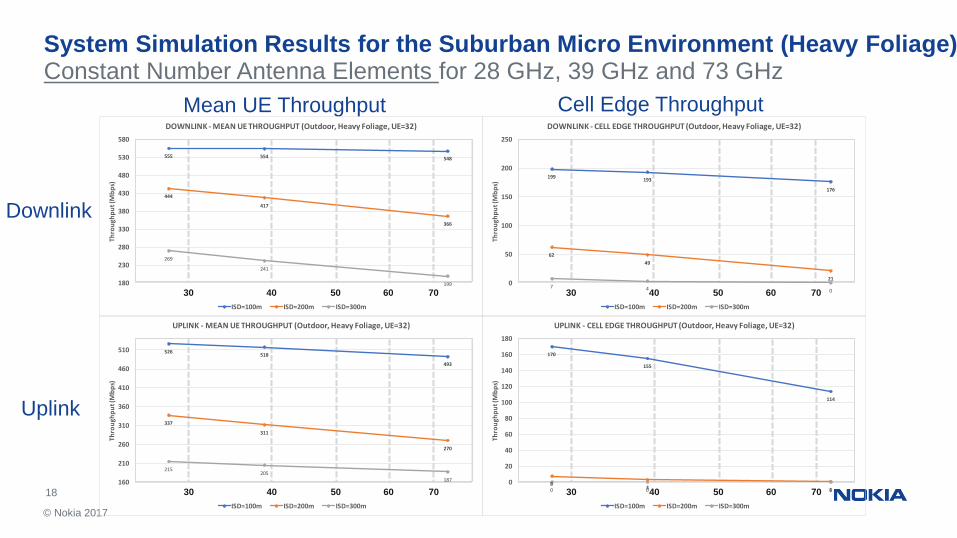
System Simulation Results for the Suburban Micro Environment (Heavy Foliage)Constant Number Antenna Elements for 28 GHz, 39 GHz and 73 GHz
Mean UE Throughput Cell Edge Throughput
30 40 50 60 70 30 40 50 60 70
30 40 50 60 70 30 40 50 60 70
Downlink
Uplink
555 554 548
444
417
366
269
241
199180
230
280
330
380
430
480
530
580
25
Thro
ugh
pu
t (M
bp
s)
DOWNLINK - MEAN UE THROUGHPUT (Outdoor, Heavy Foliage, UE=32)
ISD=100m ISD=200m ISD=300m
199193
176
62
49
21
7 4 0
0
50
100
150
200
250
25
Thro
ugh
pu
t (M
bp
s)
DOWNLINK - CELL EDGE THROUGHPUT (Outdoor, Heavy Foliage, UE=32)
ISD=100m ISD=200m ISD=300m
526518
493
337
311
270
215205
187160
210
260
310
360
410
460
510
25
Thro
ugh
pu
t (M
bp
s)
UPLINK - MEAN UE THROUGHPUT (Outdoor, Heavy Foliage, UE=32)
ISD=100m ISD=200m ISD=300m
170
155
114
83 10 0 0
0
20
40
60
80
100
120
140
160
180
25Th
rou
ghp
ut (
Mb
ps)
UPLINK - CELL EDGE THROUGHPUT (Outdoor, Heavy Foliage, UE=32)
ISD=100m ISD=200m ISD=300m
19
© Nokia 2017
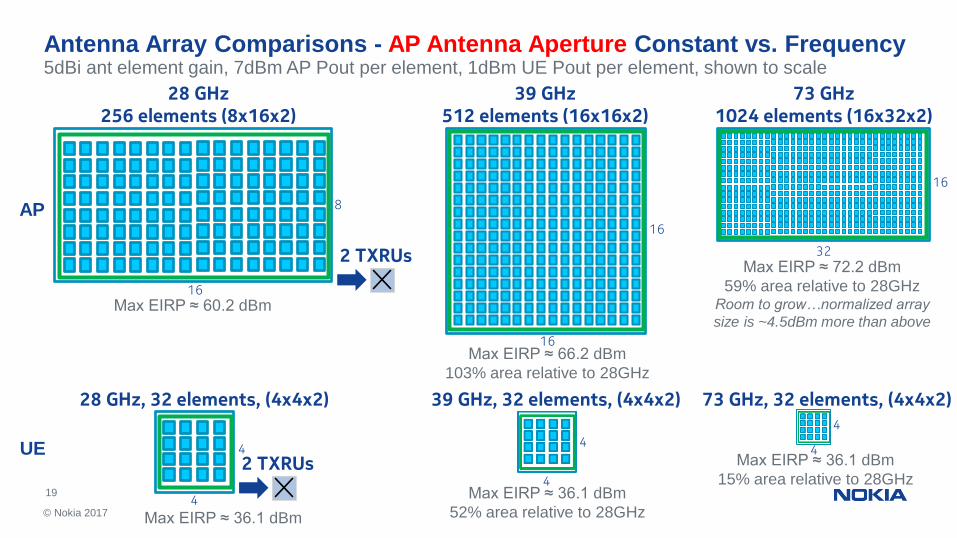
Antenna Array Comparisons - AP Antenna Aperture Constant vs. Frequency5dBi ant element gain, 7dBm AP Pout per element, 1dBm UE Pout per element, shown to scale
AP
Max EIRP ≈ 60.2 dBm
8
16
2 TXRUs
Max EIRP ≈ 66.2 dBm
103% area relative to 28GHz
Max EIRP ≈ 72.2 dBm
59% area relative to 28GHzRoom to grow…normalized array
size is ~4.5dBm more than above
16
16
16
32
4
4
Max EIRP ≈ 36.1 dBm
2 TXRUs
4
4
4
4
Max EIRP ≈ 36.1 dBm
52% area relative to 28GHz
Max EIRP ≈ 36.1 dBm
15% area relative to 28GHz
28 GHz256 elements (8x16x2)
39 GHz512 elements (16x16x2)
73 GHz1024 elements (16x32x2)
UE
73 GHz, 32 elements, (4x4x2)39 GHz, 32 elements, (4x4x2)28 GHz, 32 elements, (4x4x2)
20
© Nokia 2017
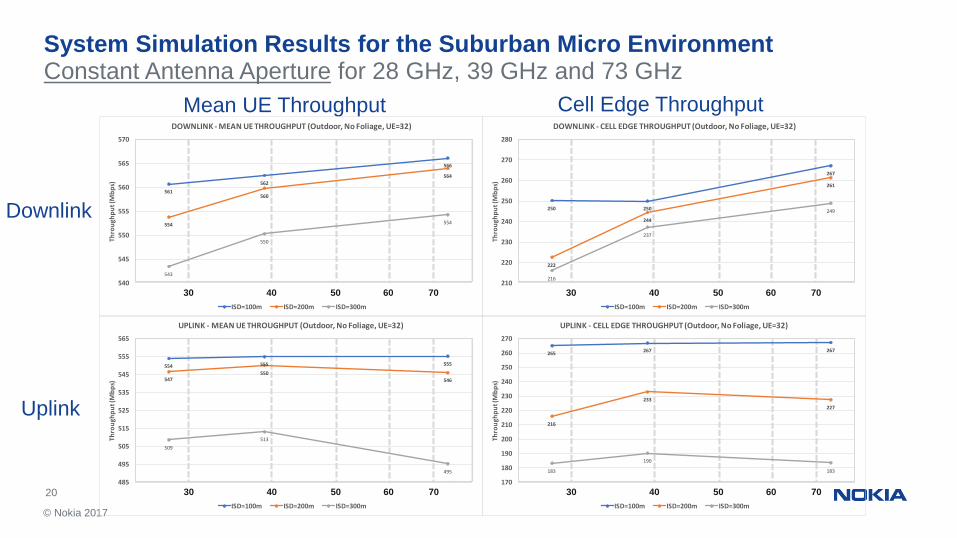
System Simulation Results for the Suburban Micro EnvironmentConstant Antenna Aperture for 28 GHz, 39 GHz and 73 GHz
Mean UE Throughput Cell Edge Throughput
30 40 50 60 70 30 40 50 60 70
30 40 50 60 70 30 40 50 60 70
Downlink
Uplink
561
562
566
554
560
564
543
550
554
540
545
550
555
560
565
570
25
Thro
ugh
pu
t (M
bp
s)
DOWNLINK - MEAN UE THROUGHPUT (Outdoor, No Foliage, UE=32)
ISD=100m ISD=200m ISD=300m
250 250
267
222
244
261
216
237
249
210
220
230
240
250
260
270
280
25
Thro
ugh
pu
t (M
bp
s)
DOWNLINK - CELL EDGE THROUGHPUT (Outdoor, No Foliage, UE=32)
ISD=100m ISD=200m ISD=300m
554 555 555
547550
546
509
513
495
485
495
505
515
525
535
545
555
565
25
Thro
ugh
pu
t (M
bp
s)
UPLINK - MEAN UE THROUGHPUT (Outdoor, No Foliage, UE=32)
ISD=100m ISD=200m ISD=300m
265267 267
216
233
227
183
190
183
170
180
190
200
210
220
230
240
250
260
270
25Th
rou
ghp
ut (
Mb
ps)
UPLINK - CELL EDGE THROUGHPUT (Outdoor, No Foliage, UE=32)
ISD=100m ISD=200m ISD=300m
21
© Nokia 2017
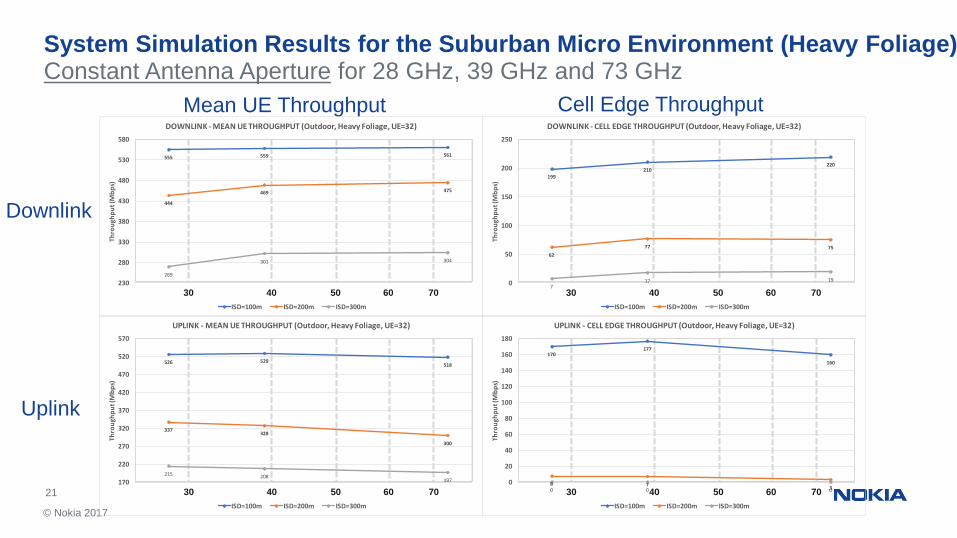
System Simulation Results for the Suburban Micro Environment (Heavy Foliage)Constant Antenna Aperture for 28 GHz, 39 GHz and 73 GHz
Mean UE Throughput Cell Edge Throughput
30 40 50 60 70 30 40 50 60 70
30 40 50 60 70 30 40 50 60 70
Downlink
Uplink
555 559 561
444
469 475
269
301 304
230
280
330
380
430
480
530
580
25
Thro
ugh
pu
t (M
bp
s)
DOWNLINK - MEAN UE THROUGHPUT (Outdoor, Heavy Foliage, UE=32)
ISD=100m ISD=200m ISD=300m
199210
220
62
77 75
717 190
50
100
150
200
250
25
Thro
ugh
pu
t (M
bp
s)
DOWNLINK - CELL EDGE THROUGHPUT (Outdoor, Heavy Foliage, UE=32)
ISD=100m ISD=200m ISD=300m
526 529518
337328
300
215 208197170
220
270
320
370
420
470
520
570
25
Thro
ugh
pu
t (M
bp
s)
UPLINK - MEAN UE THROUGHPUT (Outdoor, Heavy Foliage, UE=32)
ISD=100m ISD=200m ISD=300m
170177
160
8 730 0 0
0
20
40
60
80
100
120
140
160
180
25Th
rou
ghp
ut (
Mb
ps)
UPLINK - CELL EDGE THROUGHPUT (Outdoor, Heavy Foliage, UE=32)
ISD=100m ISD=200m ISD=300m
22
© Nokia 2017
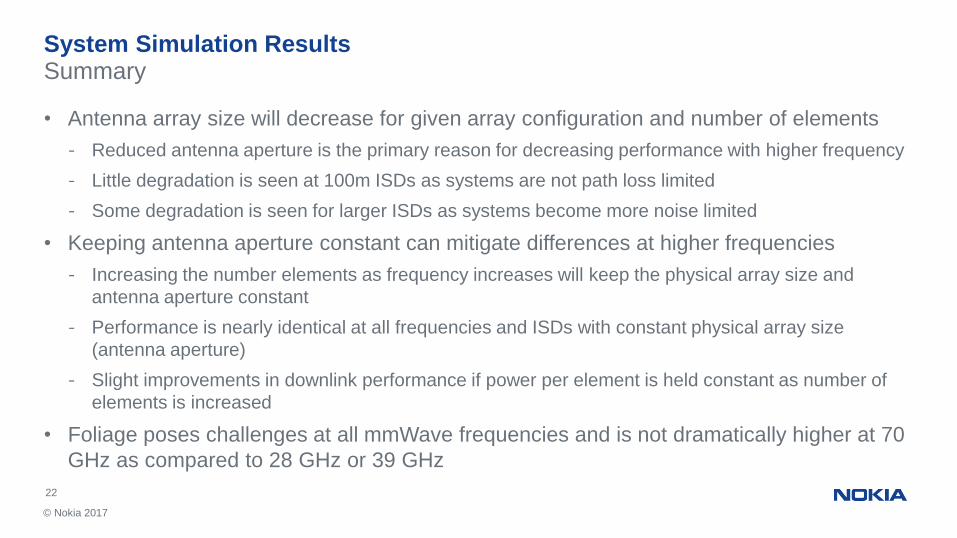
• Antenna array size will decrease for given array configuration and number of elements
- Reduced antenna aperture is the primary reason for decreasing performance with higher frequency
- Little degradation is seen at 100m ISDs as systems are not path loss limited
- Some degradation is seen for larger ISDs as systems become more noise limited
• Keeping antenna aperture constant can mitigate differences at higher frequencies
- Increasing the number elements as frequency increases will keep the physical array size and
antenna aperture constant
- Performance is nearly identical at all frequencies and ISDs with constant physical array size
(antenna aperture)
- Slight improvements in downlink performance if power per element is held constant as number of
elements is increased
• Foliage poses challenges at all mmWave frequencies and is not dramatically higher at 70
GHz as compared to 28 GHz or 39 GHz
System Simulation ResultsSummary
23
Co-existence of Access and Backhaul
24
© Nokia 2017
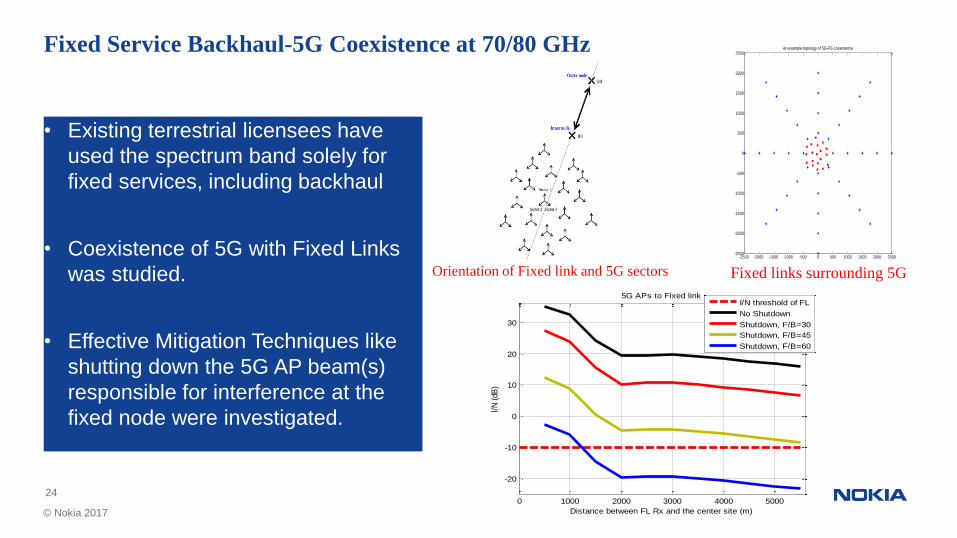
Fixed Service Backhaul-5G Coexistence at 70/80 GHz
• Existing terrestrial licensees have
used the spectrum band solely for
fixed services, including backhaul
• Coexistence of 5G with Fixed Links
was studied.
• Effective Mitigation Techniques like
shutting down the 5G AP beam(s)
responsible for interference at the
fixed node were investigated.
0 1000 2000 3000 4000 5000
-20
-10
0
10
20
30
Distance between FL Rx and the center site (m)
I/N
(dB
)
5G APs to Fixed link
I/N threshold of FL
No Shutdown
Shutdown, F/B=30
Shutdown, F/B=45
Shutdown, F/B=60
-2500 -2000 -1500 -1000 -500 0 500 1000 1500 2000 2500-2500
-2000
-1500
-1000
-500
0
500
1000
1500
2000
2500An example topology of 5G-FS coexistence
Orientation of Fixed link and 5G sectors Fixed links surrounding 5G
25
Nokia’s PoC @ 70 GHz
26
© Nokia 2017
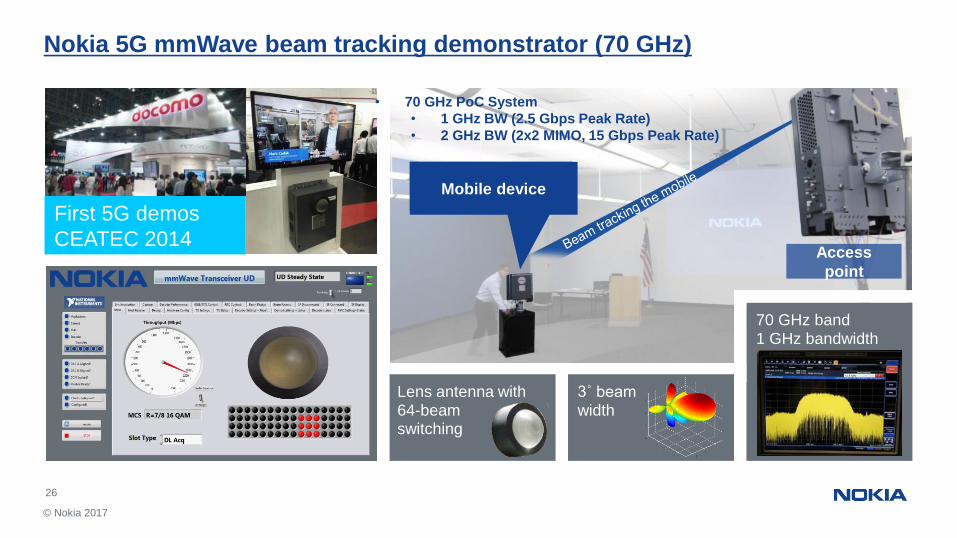
3˚ beamwidth
Lens antenna with 64-beam switching
Access
point
Mobile device
Nokia 5G mmWave beam tracking demonstrator (70 GHz)
First 5G demos
CEATEC 2014
70 GHz band1 GHz bandwidth
• 70 GHz PoC System
• 1 GHz BW (2.5 Gbps Peak Rate)
• 2 GHz BW (2x2 MIMO, 15 Gbps Peak Rate)
27
© Nokia 2017
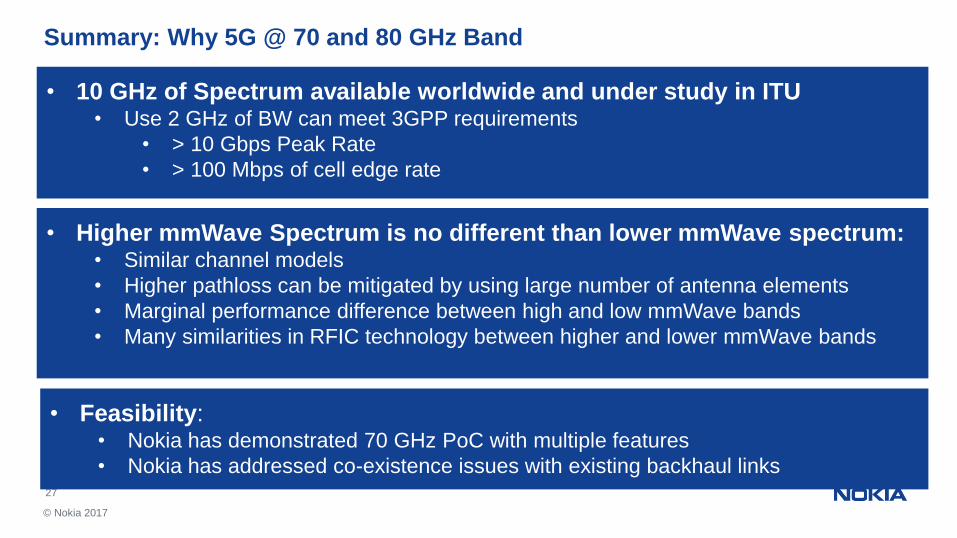
• 10 GHz of Spectrum available worldwide and under study in ITU • Use 2 GHz of BW can meet 3GPP requirements
• > 10 Gbps Peak Rate
• > 100 Mbps of cell edge rate
Summary: Why 5G @ 70 and 80 GHz Band
• Higher mmWave Spectrum is no different than lower mmWave spectrum:• Similar channel models
• Higher pathloss can be mitigated by using large number of antenna elements
• Marginal performance difference between high and low mmWave bands
• Many similarities in RFIC technology between higher and lower mmWave bands
• Feasibility:• Nokia has demonstrated 70 GHz PoC with multiple features
• Nokia has addressed co-existence issues with existing backhaul links
<Chang
e


![Analysis of Addax-Sinopec Outdoor Pathloss Behavior … · Keywords pathloss issues owing to location techniques used [5],[6]. In Wifi, WiMax, Mobility, Pathloss, QoS, Signal Degradation,](https://img.pdfslide.net/doc/110x75/5b5e63247f8b9aa3048cf02e/analysis-of-addax-sinopec-outdoor-pathloss-behavior-keywords-pathloss-issues.jpg)