Embed Size (px)
Citation preview
6-1
Operations Operations ManagementManagement
Managing QualityManaging QualityChapter 6Chapter 6
6-2
OutlineOutline Quality and Strategy.
Defining Quality.
International Quality Standards.
Total Quality Management.
Tools of TQM.
Inspection.
TQM in Services.
6-3
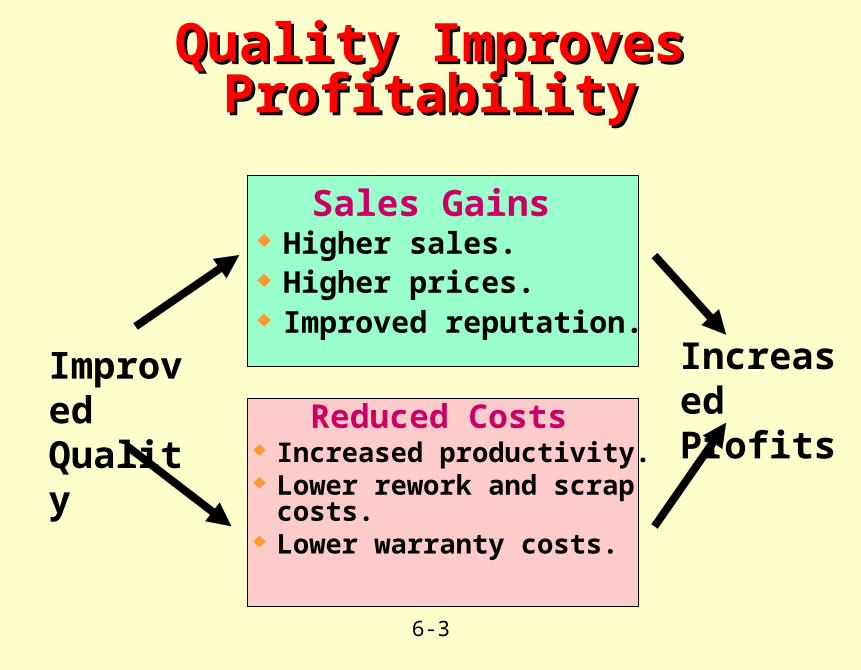
Quality Improves ProfitabilityQuality Improves Profitability
Sales Gains Higher sales. Higher prices. Improved reputation.
Reduced Costs Increased productivity. Lower rework and scrap costs. Lower warranty costs.
Increased Profits
Improved Quality
6-4
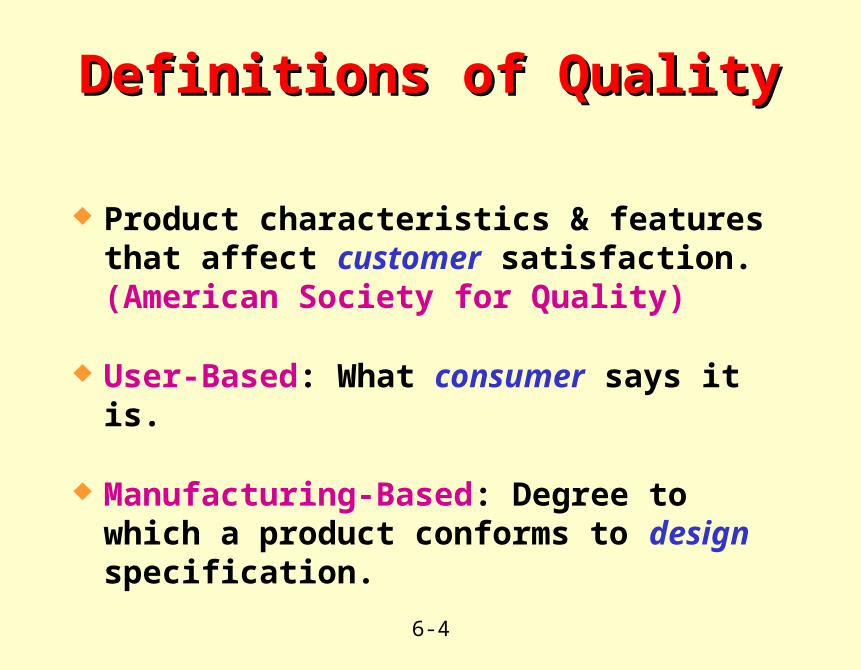
Definitions of QualityDefinitions of Quality
Product characteristics & features that affect customer satisfaction. (American Society for Quality)
User-Based: What consumer says it is.
Manufacturing-Based: Degree to which a product conforms to design specification.
6-5
Operation or Performance. Reliability. Durability. Conformance. Serviceability. Appearance to senses. Perceived quality.
Quality
Dimensions of Quality for GoodsDimensions of Quality for Goods
6-6
Company reputation. Real or perceived.
Product liability. Large $ can be awarded.
Global implications. Company quality affects national image.
Implications of QualityImplications of Quality
6-7
International Quality StandardsInternational Quality Standards
ISO 9000 series (Europe/EC) Common quality standards for products sold in
Europe (even if made in U.S.).
ISO 14000 series (Europe/EC) Standards for recycling, labeling etc.
6-8
Costs of QualityCosts of Quality Prevention costs (5-10%) - To prevent failures. Appraisal costs (15-40%) - To evaluate products. Failure costs (50-80%):
Internal failure costs - Defective parts or services discovered in-house.
External failure costs - Defective parts or services discovered by customer.
Most organizations do not know the cost of poor quality.
6-9
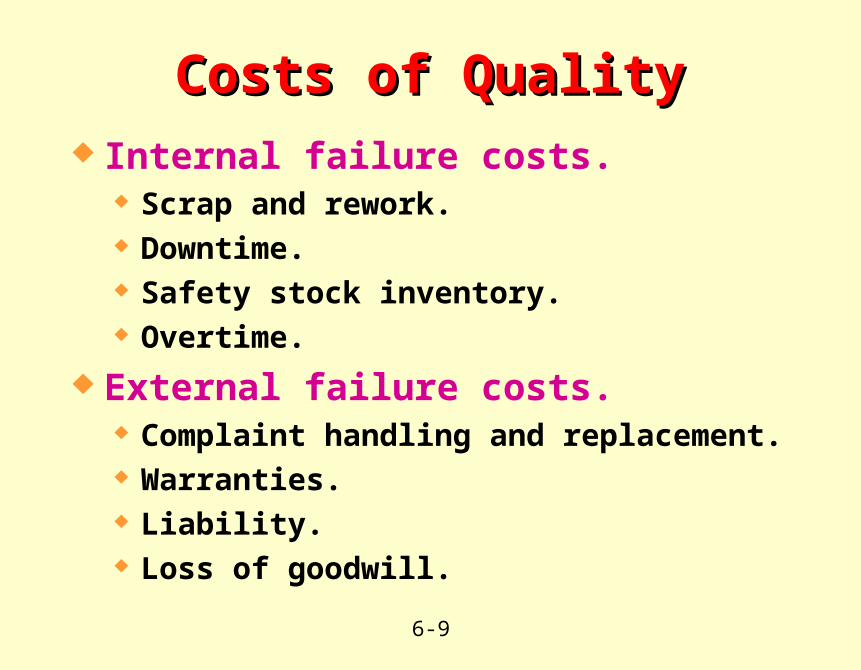
Costs of QualityCosts of Quality Internal failure costs.
Scrap and rework. Downtime. Safety stock inventory. Overtime.
External failure costs. Complaint handling and replacement. Warranties. Liability. Loss of goodwill.
6-10
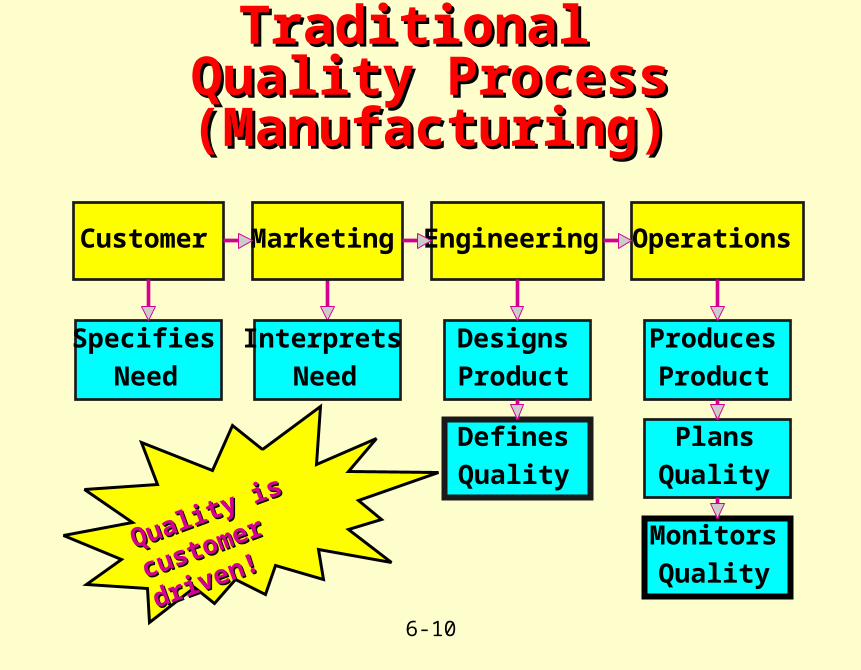
Traditional Traditional Quality Process (Manufacturing)Quality Process (Manufacturing)
Specifies
Need
Customer
Interprets
Need
Marketing
Designs
Product
Defines
Quality
Engineering
Produces
Product
Plans
Quality
Monitors
Quality
Operations
Quality is
Quality is
customer driven!
customer driven!
6-11
TQM - Total Quality ManagementTQM - Total Quality Management
Encompasses entire organization from supplier to customer.
Commitment by management to a continuing company-wide drive toward excellence in all aspects of products and services that are important to the customer.
6-12
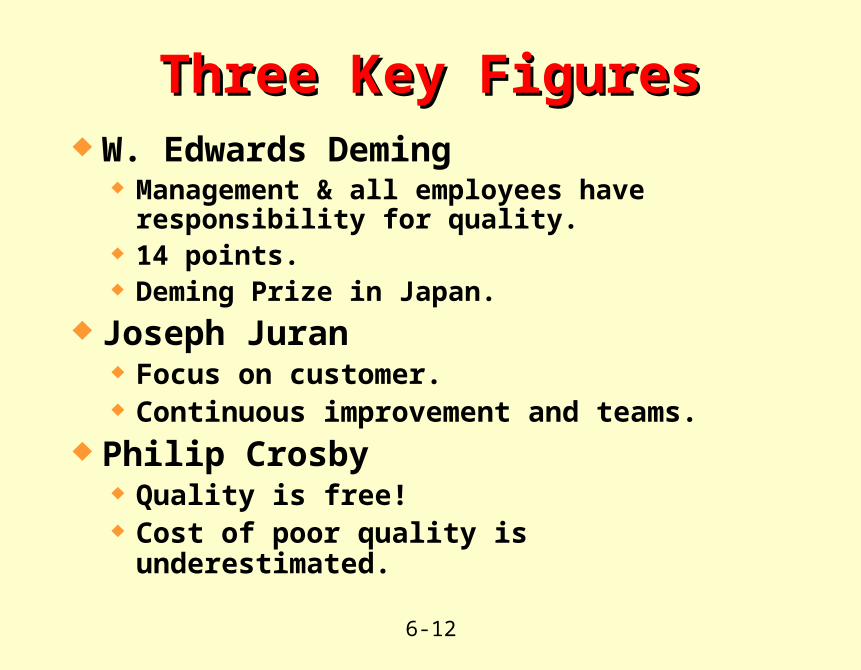
Three Key FiguresThree Key Figures W. Edwards Deming
Management & all employees have responsibility for quality.
14 points. Deming Prize in Japan.
Joseph Juran Focus on customer. Continuous improvement and teams.
Philip Crosby Quality is free! Cost of poor quality is underestimated.
6-13
Deming’s PointsDeming’s Points Create consistency of purpose across the
organization. Leadership must play a key role. Build quality into the products. Build long term relationships. Continuously improve product, quality, and service. Training & education are crucial. Empower employees.
6-14
Established in 1988 by the U.S. government.
Designed to promote TQM practices.
Criteria include: Senior executive leadership.
Strategic planning.
Management of process quality.
Quality results.
Customer satisfaction.
Malcom Baldrige National Quality Malcom Baldrige National Quality AwardAward
6-15
The leadership of the U.S. in product and process quality has been challenged strongly by foreign competition.
Quality improvement programs are essential to the well-being of our economy and our ability to compete globally.
Malcom Baldrige National Quality Malcom Baldrige National Quality Award - GuidelinesAward - Guidelines
6-16
It is crucial to have improved: management understanding of the factory floor, worker involvement in quality, and greater emphasis on statistical process control.
“Quality improvement programs must be management-led and customer-oriented, and this may require fundamental changes in the way companies and agencies do business.”
Malcom Baldrige National Quality Malcom Baldrige National Quality Award - GuidelinesAward - Guidelines
6-17
Concepts of TQMConcepts of TQM
Top management has primary responsibility.
Focus on customer.
Continuous improvement.
Employee empowerment.
Benchmarking.
Knowledge of tools for TQM.
6-18
Continuous ImprovementContinuous Improvement
Continuously improve process & customer satisfaction.
Involve all operations & work units.
Other names: Kaizen (Japanese).
Zero-defects.
Six sigma.
6-19
Involve employees in product & process improvements. 85% of quality problems are due to process & material.
Techniques: Support workers; workers solve quality problems.
Let workers make decisions.
Train workers; provide tools for improved quality.
Build teams & quality circles.
Employee EmpowermentEmployee Empowerment
6-20
BenchmarkingBenchmarking
Selecting best practices to use as a standard for performance.
Determine what to benchmark.
Form a benchmark team.
Collect and analyze benchmarking information.
Take action to match or exceed the benchmark.
6-21
Tools for TQMTools for TQM
Quality Function Deployment (QFD).
Taguchi techniques.
Cause-and-effect diagrams.
Pareto charts.
Statistical process control.
6-22
Quality Function DeploymentQuality Function Deployment(QFD)(QFD)
Determines what will satisfy the customer.
Translates customer desires into target design.
Helps determine product and process to ensure quality.
6-23
Taguchi TechniquesTaguchi Techniques
Experimental design methods to improve product & process design. Identify key component & process variables
affecting product variation.
Taguchi Concepts: Quality robustness.
Quality loss function.
6-24
Design and make products so that variations in production do not cause failure.
Identify important variations.
Eliminate the effect of variations rather than the cause. Allow variation, but limit its ability to reduce
quality.
Quality RobustnessQuality Robustness
6-25
Poor quality can be viewed as deviation from a desired level. Most quality characteristics (e.g., length, weight)
have a target value. Large deviations are much more expensive than
small deviations.
Quality loss function shows cost of deviation and is not linear. A deviation twice as large may be 10 times as
expensive.
Quality Loss FunctionQuality Loss Function
6-26
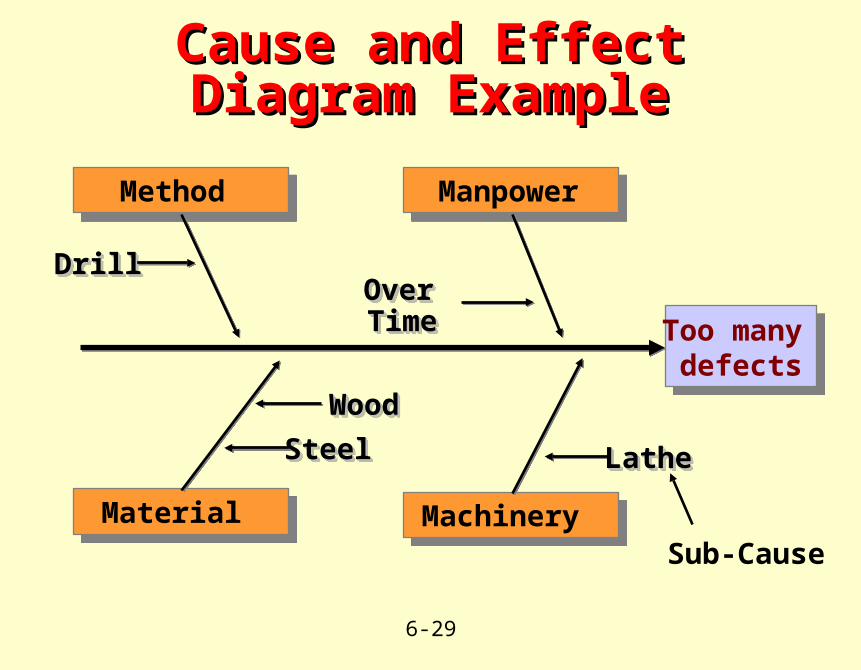
Used to find problem sources/solutions.
Other names: Fish-bone diagram, Ishikawa diagram.
Steps: Identify problem to correct.
Draw main causes for problem as ‘bones’.
Ask ‘What could have caused problems in these areas?’ Repeat for each sub-area.
Cause and Effect DiagramCause and Effect Diagram
6-27
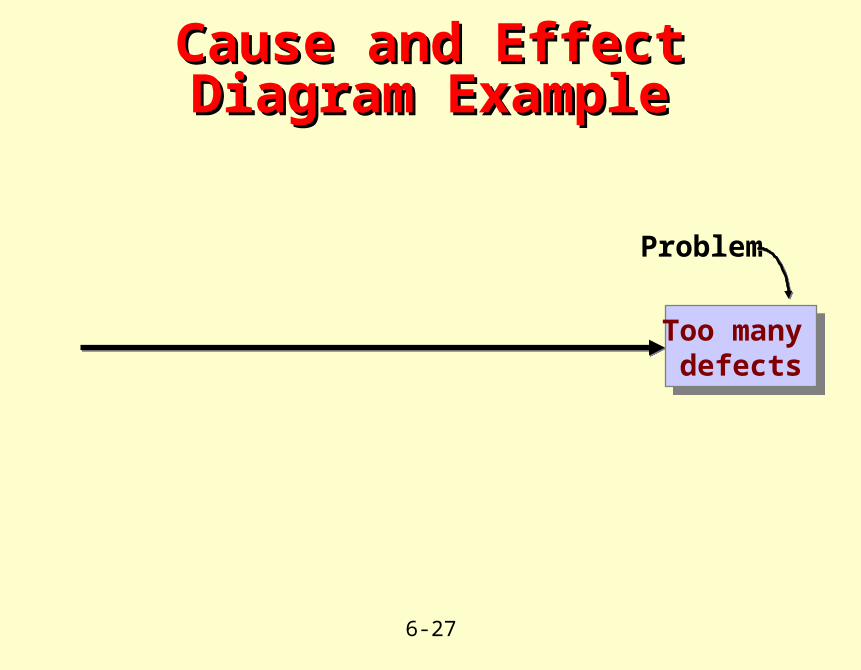
Too many defects
Too many defects
Problem
Cause and Effect Diagram Cause and Effect Diagram ExampleExample
6-28
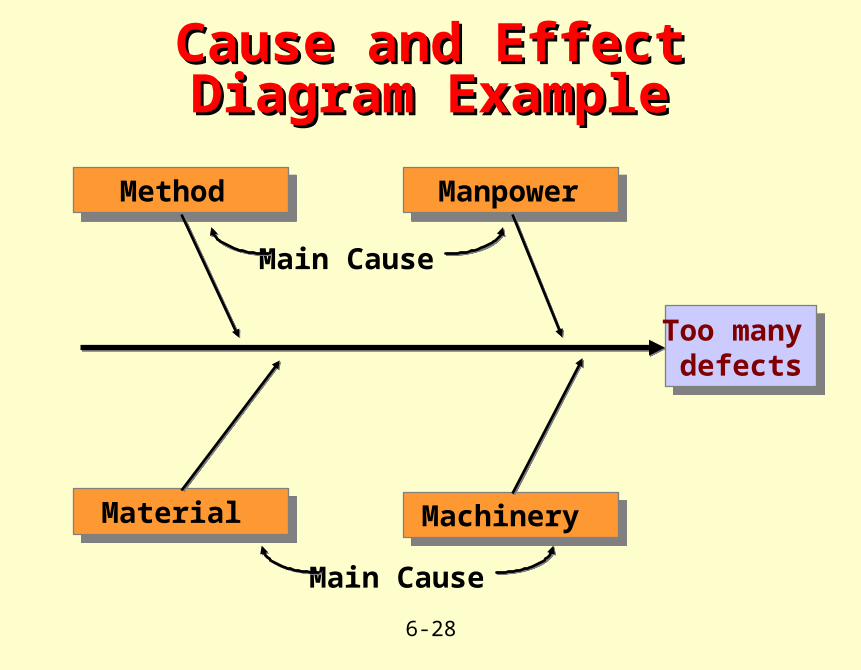
Method Manpower
Material Machinery
Too many defects
Too many defects
Main Cause
Main Cause
Cause and Effect Diagram Cause and Effect Diagram ExampleExample
6-29
Method Manpower
Material Machinery
DrillDrillDrillDrillOverOverOverOverTimeTimeTimeTime
SteelSteelSteelSteel
WoodWoodWoodWood
LatheLatheLatheLathe
Too many defects
Too many defects
Sub-Cause
Cause and Effect Diagram Cause and Effect Diagram ExampleExample
6-30
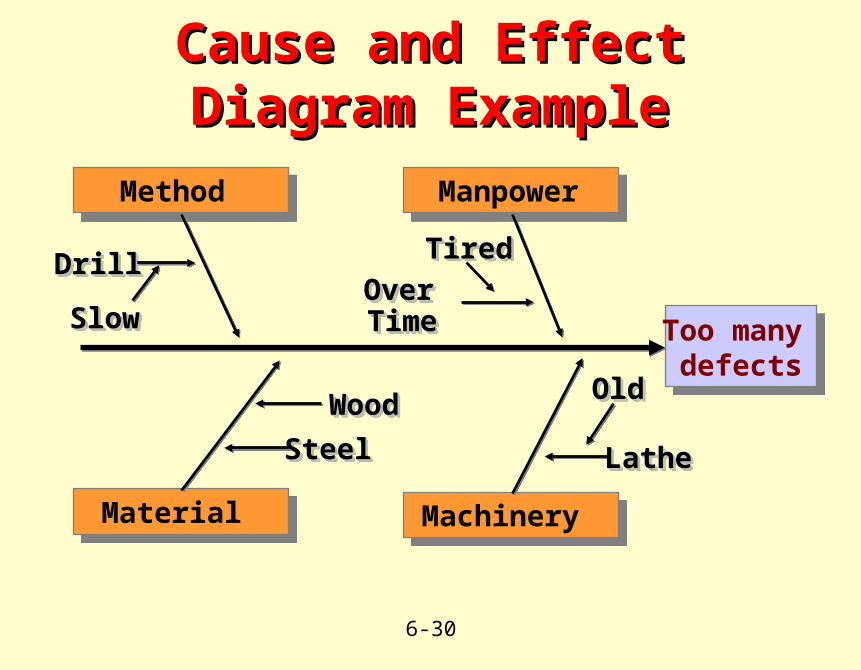
Method Manpower
Material Machinery
DrillDrillDrillDrillOverOverOverOverTimeTimeTimeTime
SteelSteelSteelSteel
WoodWoodWoodWood
LatheLatheLatheLathe
Too many defects
Too many defects
TiredTiredTiredTired
OldOldOldOld
SlowSlowSlowSlow
Cause and Effect Diagram Cause and Effect Diagram ExampleExample
6-31
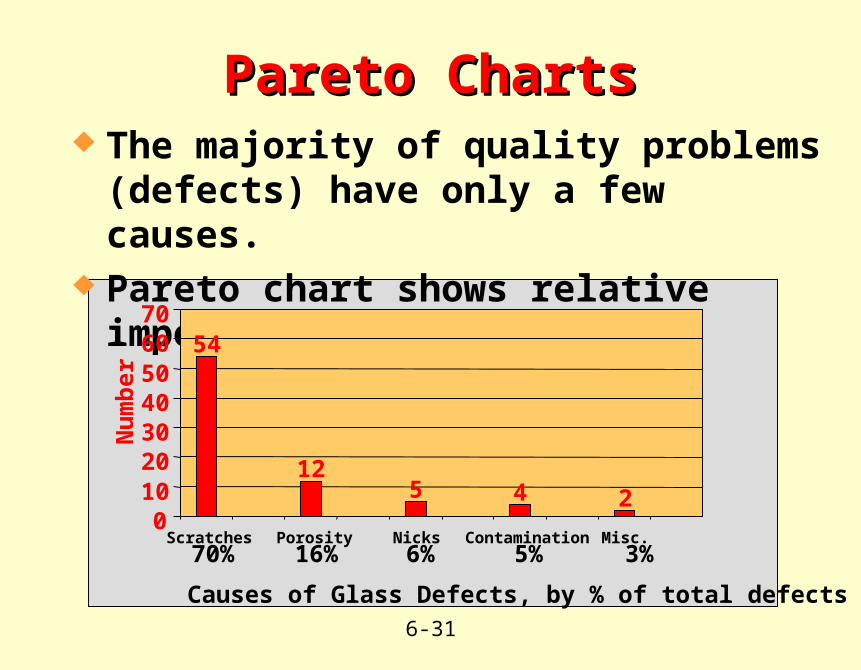
The majority of quality problems (defects) have only a few causes.
Pareto chart shows relative importance of causes.
Pareto ChartsPareto Charts
Scratches70%
54
125 4 2
010203040506070
Porosity Nicks Contamination Misc.
Causes of Glass Defects, by % of total defects
Num
ber
16% 6% 5% 3%
6-32
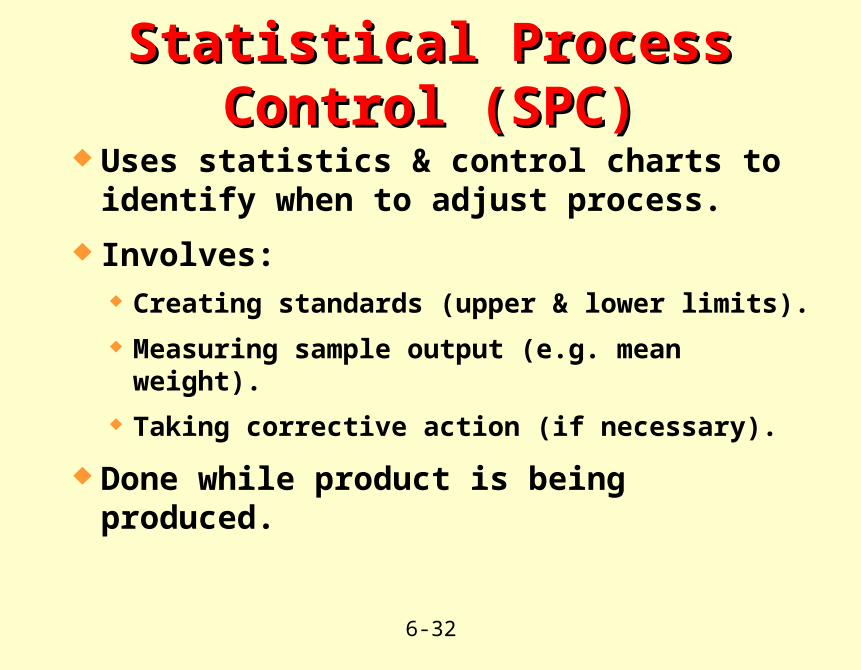
Uses statistics & control charts to identify when to adjust process.
Involves: Creating standards (upper & lower limits).
Measuring sample output (e.g. mean weight).
Taking corrective action (if necessary).
Done while product is being produced.
Statistical Process Control (SPC)Statistical Process Control (SPC)
6-33
Examine items to see if they are good or defective.
Detects defective products. Does not correct deficiencies in process or product.
Issues: What to inspect?
When & where to inspect?
InspectionInspection
6-34
When and Where to Inspect When and Where to Inspect ProductsProducts
At the supplier’s plant while the supplier is producing.
At your facility upon receipt of goods from the supplier.
Before costly or irreversible processes.
During the step-by-step production processes.
When production or service is complete.
Before delivery from your facility.
At the point of customer contact.
6-35
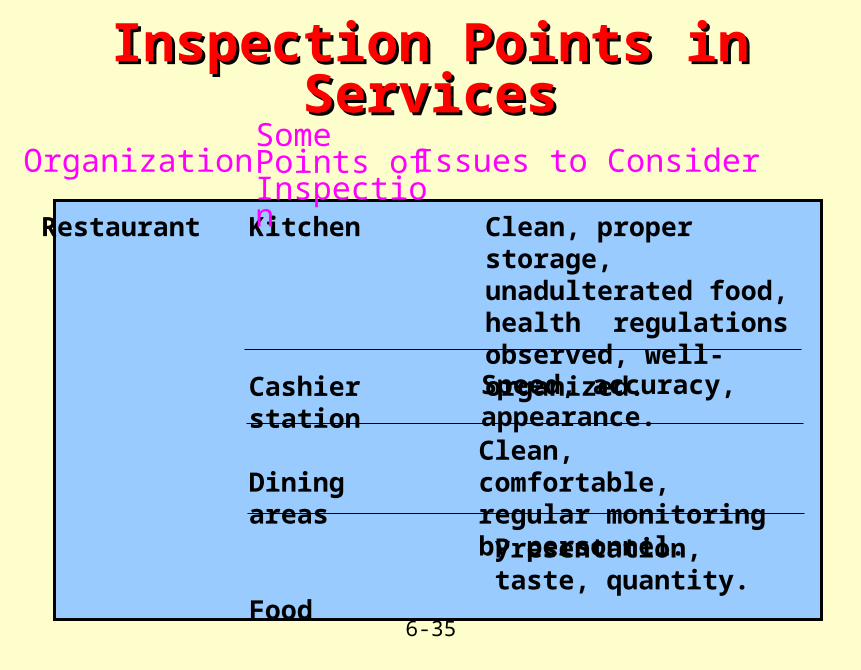
Inspection Points in ServicesInspection Points in Services
Restaurant Kitchen
Cashier station
Dining areas
Food
Clean, proper storage, unadulterated food, health regulations observed, well-organized.
Speed, accuracy, appearance.
Clean, comfortable, regular monitoring by personnel.
OrganizationSome Points of Inspection Issues to Consider
Presentation, taste, quantity.
6-36
Customer contact is important!
Service quality is more difficult to measure than for goods. Courtesy, competence, communication, etc.
Service quality perceptions depend on: Expectations versus reality.
Process and outcome.
Type of service (normal vs. exception).
TQM In ServicesTQM In Services