Embed Size (px)
Citation preview
6-3 Measures of Variation
Warm Warm Up
Lesson PresentationLesson Presentation
Problem of the DayProblem of the Day
Lesson QuizzesLesson Quizzes
6-3 Measures of Variation
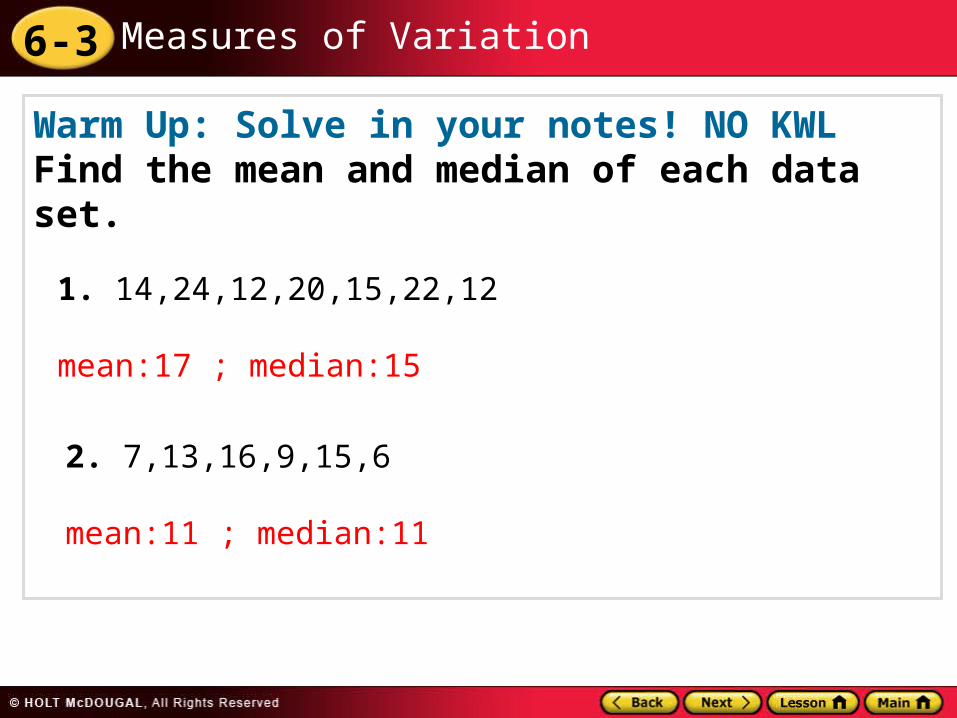
Warm Up: Solve in your notes! NO KWLFind the mean and median of each data set.
1. 14,24,12,20,15,22,12
mean:17 ; median:15
2. 7,13,16,9,15,6
mean:11 ; median:11
6-3 Measures of Variation
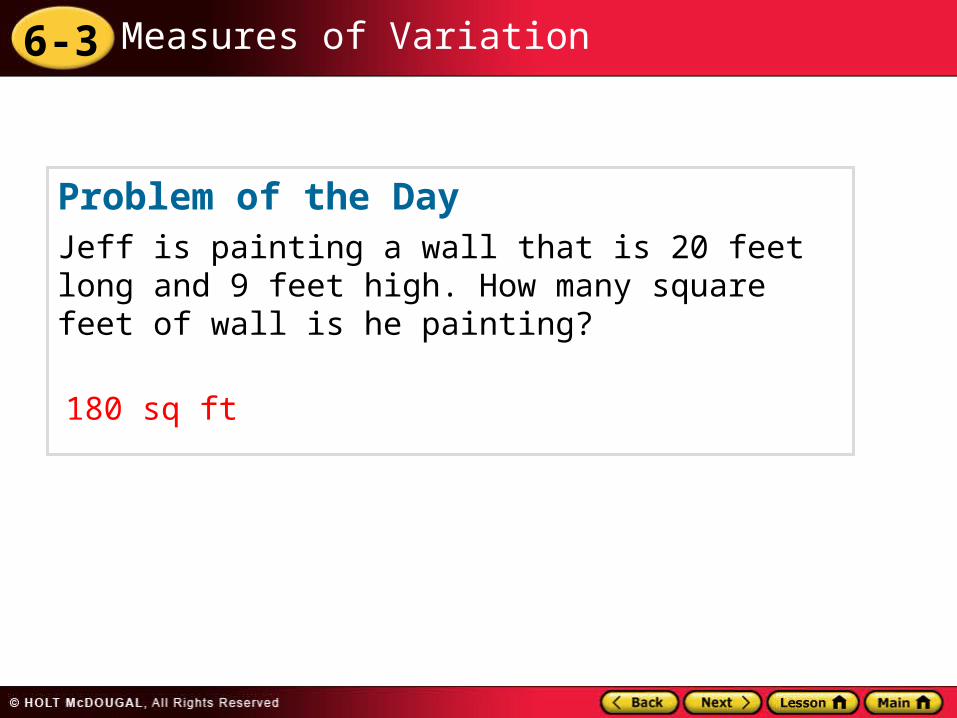
Problem of the DayJeff is painting a wall that is 20 feet long and 9 feet high. How many square feet of wall is he painting?
180 sq ft
6-3 Measures of Variation
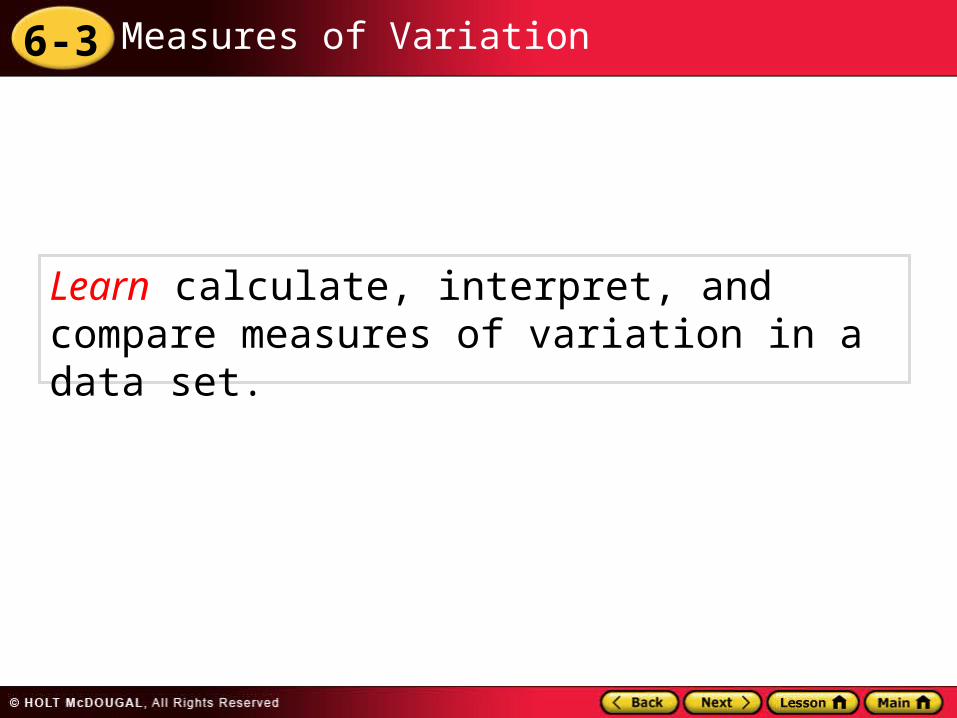
Learn calculate, interpret, and compare measures of variation in a data set.
6-3 Measures of Variation
Vocabulary
box-and-whisker plot
quartiles
variation
inter-quartile range (IQR)
6-3 Measures of Variation
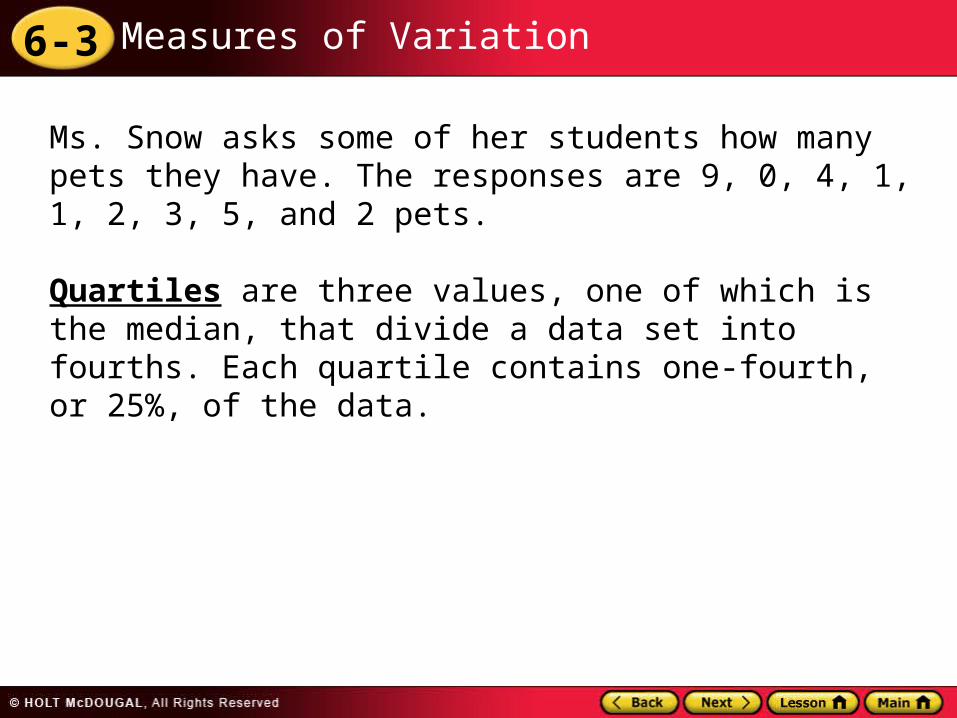
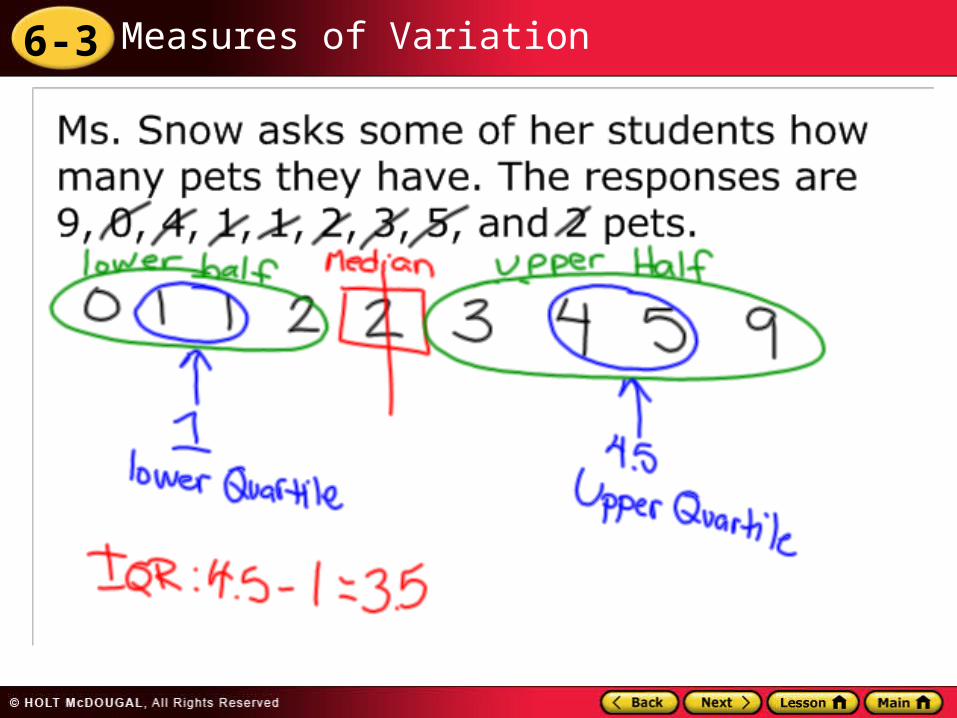
Ms. Snow asks some of her students how many pets they have. The responses are 9, 0, 4, 1, 1, 2, 3, 5, and 2 pets.
Quartiles are three values, one of which is the median, that divide a data set into fourths. Each quartile contains one-fourth, or 25%, of the data.
6-3 Measures of Variation
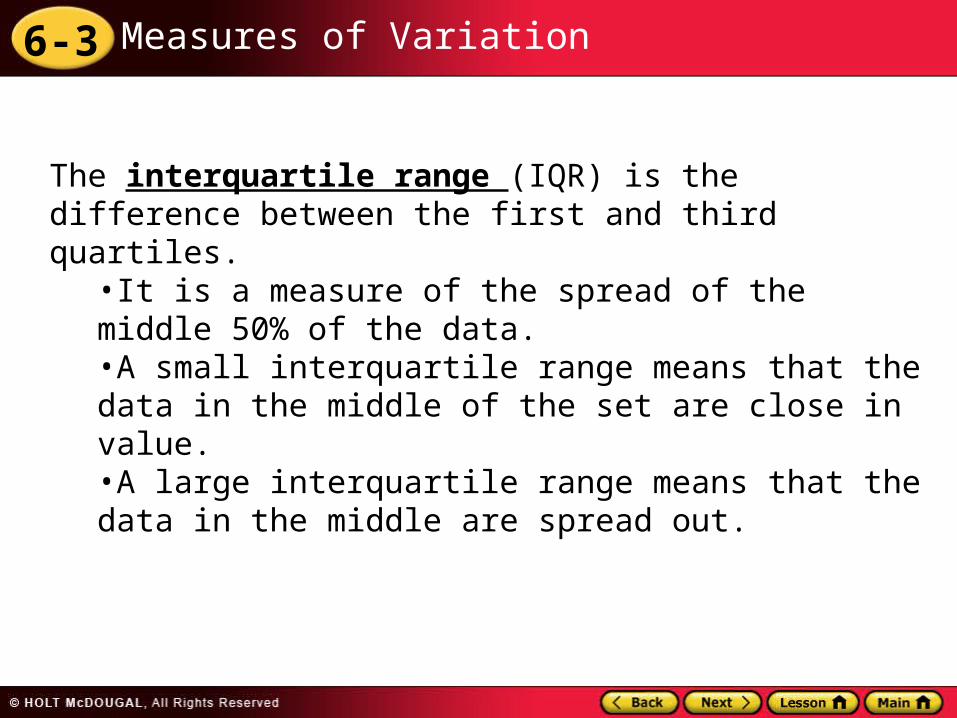
The interquartile range (IQR) is the difference between the first and third quartiles.
•It is a measure of the spread of the middle 50% of the data. •A small interquartile range means that the data in the middle of the set are close in value. •A large interquartile range means that the data in the middle are spread out.
6-3 Measures of Variation
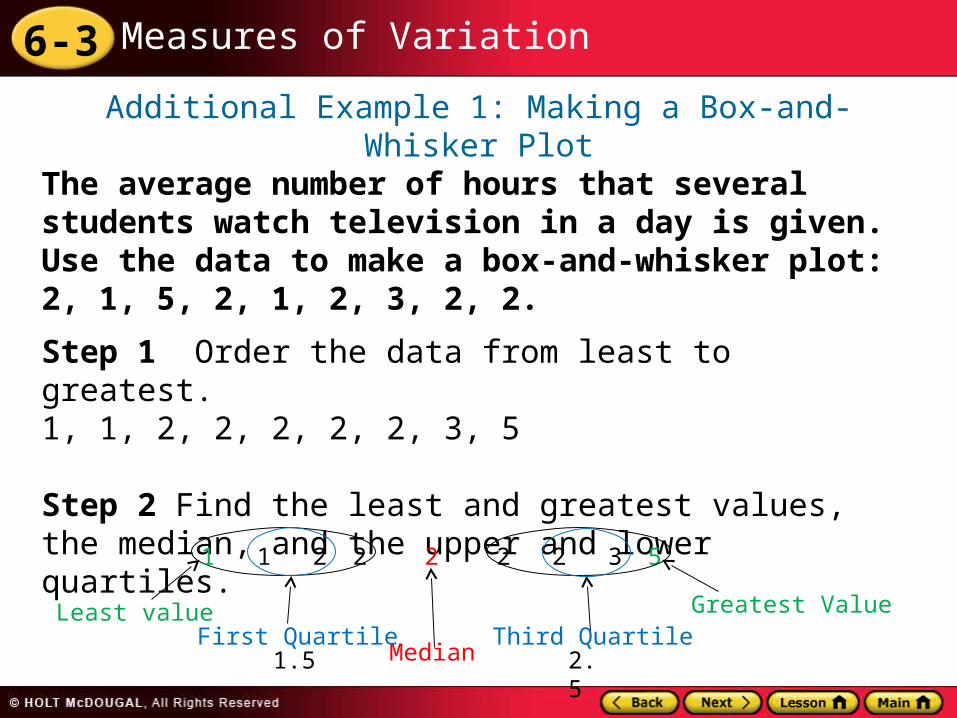
Additional Example 1: Making a Box-and-Whisker PlotThe average number of hours that several students watch television in a day is given. Use the data to make a box-and-whisker plot: 2, 1, 5, 2, 1, 2, 3, 2, 2.
Step 1 Order the data from least to greatest.1, 1, 2, 2, 2, 2, 2, 3, 5
Step 2 Find the least and greatest values, the median, and the upper and lower quartiles.
2 521 1 2 2 32
Least value Greatest ValueThird Quartile
Median First Quartile
1.5 2.5
6-3 Measures of Variation
6-3 Measures of Variation
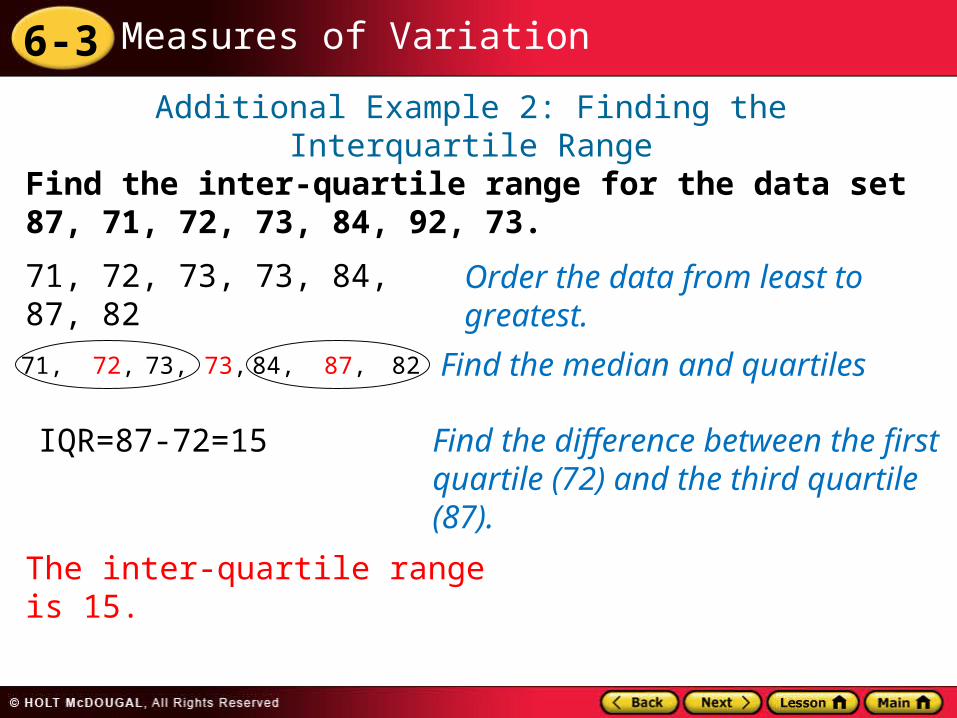
Additional Example 2: Finding the Interquartile RangeFind the inter-quartile range for the data set 87, 71, 72, 73, 84, 92, 73.
71, 72, 73, 73, 84, 87, 82
84,73,71, 72, 73, 8287, Find the median and quartiles
IQR=87-72=15 Find the difference between the first quartile (72) and the third quartile (87).
The inter-quartile range is 15.
Order the data from least to greatest.
6-3 Measures of Variation
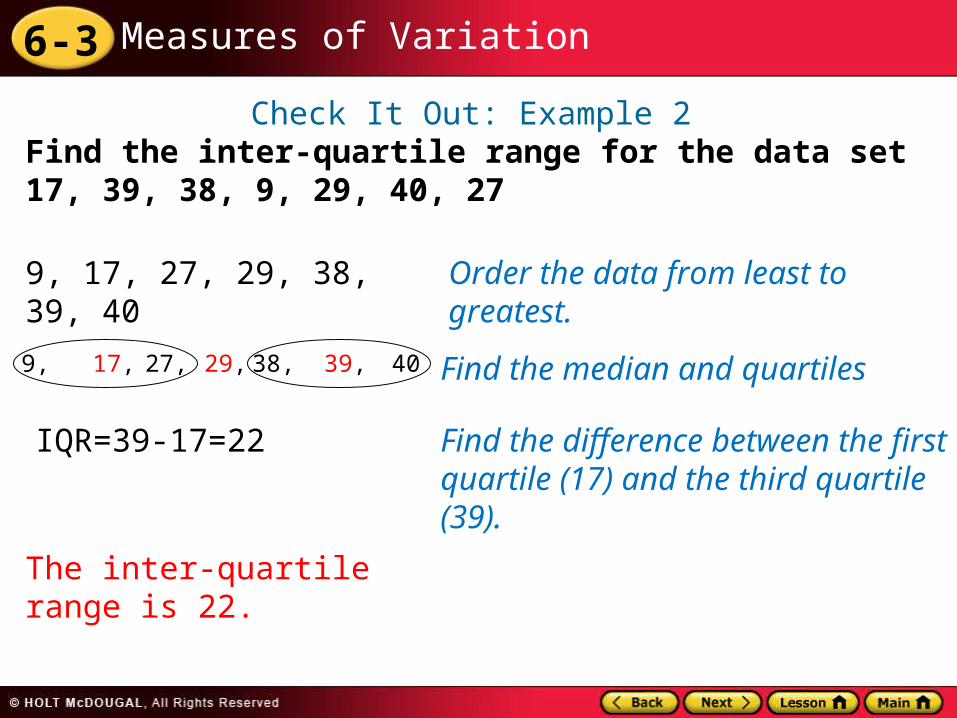
Check It Out: Example 2Find the inter-quartile range for the data set 17, 39, 38, 9, 29, 40, 27
9, 17, 27, 29, 38, 39, 40
38,29,9, 17, 27, 4039, Find the median and quartiles
IQR=39-17=22 Find the difference between the first quartile (17) and the third quartile (39).
The inter-quartile range is 22.
Order the data from least to greatest.
6-3 Measures of Variation
Standard Lesson Quiz
Lesson Quizzes
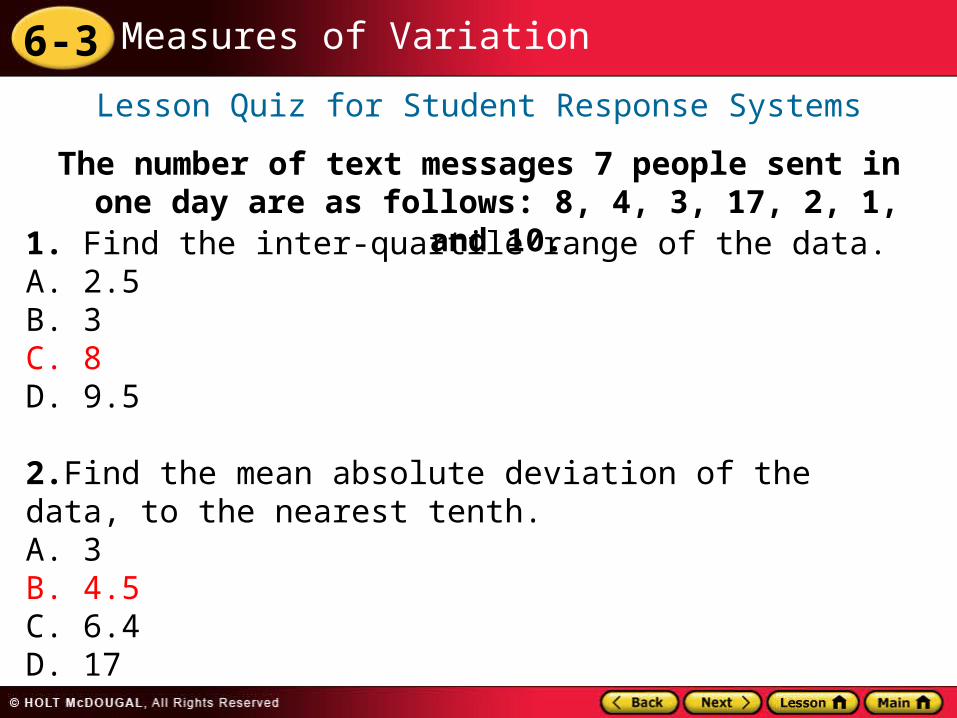
Lesson Quiz for Student Response Systems
6-3 Measures of Variation
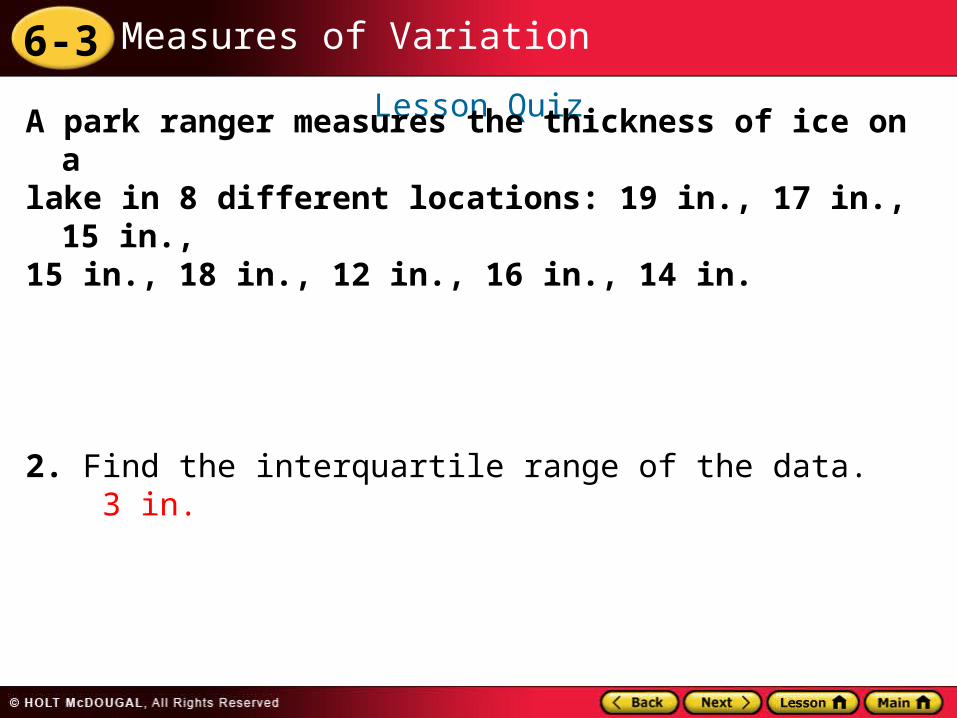
Lesson Quiz
A park ranger measures the thickness of ice on alake in 8 different locations: 19 in., 17 in., 15 in.,15 in., 18 in., 12 in., 16 in., 14 in.
2. Find the interquartile range of the data. 3 in.
6-3 Measures of Variation
1. Find the inter-quartile range of the data.A. 2.5B. 3C. 8D. 9.5
2.Find the mean absolute deviation of the data, to the nearest tenth.A. 3B. 4.5C. 6.4D. 17
Lesson Quiz for Student Response Systems
The number of text messages 7 people sent in one day are as follows: 8, 4, 3, 17, 2, 1, and 10.